Article

Surface Water Resource Accessibility Assessment of Rural Settlements in the Yellow River Basin

1
Key Laboratory of Urban Land Resources Monitoring and Simulation, Ministry of Natural Resources, Shenzhen 518040, China
2
College of Geography and Environmental Science, Henan University, Kaifeng 475004, China
3
Key Laboratory of Geospatial Technology for the Middle and Lower Yellow River Regions, Henan University, Ministry of Education, Kaifeng 475004, China
4
Henan Industrial Technology Academy of Spatio-Temporal Big Data, Henan University, Zhengzhou 450046, China
5
Henan Technology Innovation Center of Spatio-Temporal Big Data, Henan University, Zhengzhou 450046, China
6
Shenzhen Data Management Center of Planning and Nature Resource (Shenzhen Geospatial Information Center), Shenzhen 518040, China
*
Author to whom correspondence should be addressed.
Water 2024, 16(5), 708; https://doi.org/10.3390/w16050708
Submission received: 25 January 2024 / Revised: 22 February 2024 / Accepted: 26 February 2024 / Published: 28 February 2024

Abstract

:
Analyzing the spatial relationship between humans and water is crucial for regional development and water allocation schemes, particularly in the face of extreme water scarcity in the Yellow River Basin. A quantitative evaluation model of surface water resource accessibility (SWRA) has been developed, with rural settlements serving as the research unit. This model is built upon three key dimensions: topography, distance, and surface water resources within the Yellow River Basin. The results show that: (1) The SWRA range spans from 0.13 to 0.88, with an average value of 0.47 and a standard deviation of 0.05. Higher SWRA values are concentrated in the eastern and western regions, while lower values are predominantly found in the central area. (2) The gradient of SWRA across the 12 catchments, from low to high, is as follows: Sanmenxia station, Lanzhou station, Shizuishan station, Longmen station, Tongguan station, Toudaoguai station, Xiaolangdi station, Huayuankou station, Lijin station, Gaocun station, Ai Shan station, and Tangnaihai station. (3) At the city scale, the SWRA values are generally higher in the eastern areas of 10 cities, with one exception being higher in the west. Conversely, in the western areas of nine cities, the SWRA values are lower. The remaining cities exhibit SWRA values at a medium level. The correlation coefficient between primary industry gross domestic product (GDP) and SWRA is 0.271 (N = 56, Sig = 0.043, in 0.05 level, the correlation is significant), which confirms that SWRA serves as a factor influencing GDP and is appropriately designed for assessing water accessibility. Consequently, managers can utilize SWRA results to make informed decisions regarding regional development and water allocation.

1. Introduction

Rivers are closely related to the living environment. To facilitate production and life, such as agricultural irrigation, laundry, and cooking, most of the original settlements appear along the river. However, rivers not only block people’s activities but also connect people’s activities. Although it can provide water for human beings, it is also prone to floods, devouring people’s lives and property. Water resources are rich in China, and the total amount ranks at the forefront of the world. However, the per capita possession is low, and the spatial and temporal distributions are uneven in China. This imbalanced situation leads to a mismatch in spatial distribution between water resources and population. The Yellow River is the mother river of China. It feeds 12% of the population in China, among which the rural population accounts for about 75%. However, the Yellow River Basin is in an arid and semi-arid climate zone. Thus, it only accounts for 2% of the river runoff in China. Therefore, the water resources strongly restrict the existence and development of rural settlements. As an important economic region in China, the water resources in the Yellow River are an important support for the economic development of this region. However, the lack of water resources has become a key factor restricting the high-quality development of this region. With the continuous influence of human activities and climate change, the contradiction between the supply and demand of water resources in the Yellow River is prominent [1]. Article 3 of the Regulations of the People’s Republic of China on Water Dispatching of the Yellow River stipulates that the state implements unified dispatching of the Yellow River, following the principles of total amount control, cross-section flow control, hierarchical management, and hierarchical responsibility. In 2011, the State Council started the water allocation program in inter-provincial river basins in an all-around way, which gradually solved the problem of cut-off of the Yellow River [2]. In previous work, the water allocation scheme relied on statistical data, mostly neglecting the spatial distribution characteristics of rural settlements. Consequently, this approach led to inaccuracies in allocating water resources to individual rural residents, exacerbating the challenge of water scarcity in regions marked by intense competition for water resources. Moreover, water availability significantly influences the suitability of human settlements [3]. Therefore, amid the acute water scarcity in the Yellow River Basin, it becomes imperative to scrutinize the spatial relationship between rural settlements and water resources [4]. Such analysis is crucial for fostering the coordinated development of both human settlements and water resources within the basin. By doing so, the evaluation of surface water resource accessibility will not only enhance the rationality of water resource allocation programs but also facilitate regional development efforts [5].
Previous studies on water resource accessibility are mostly based on the grid-scale water resource accessibility evaluation model (SHRD) or improved on this model. The indicators of these studies mainly include runoff, slope, relative height difference, and distance [6]. Li et al. added land use resistance or water intake space resistance to evaluate water resource accessibility in southwest China [7]. Xu et al. added a location attribute factor to the SHRD model to evaluate water prices [8]. Besides the SHRD model, Li et al. constructed a grid-scale water resource accessibility evaluation model (LRV) to evaluate water resource accessibility based on the cumulative probability distribution of three variables, namely length, runoff, and sight of the water network [9]. Assefa et al. evaluated the water resource accessibility based on the accessibility distance of water resources [10]. Li and Gao put forward a water resource accessibility analysis method based on network and water intake cost, considering topography, land use, and road factors [11]. Therefore, topography, water resources, and distance are the key factors affecting the accessibility of water resources. Surface runoff is an important part of water resources and plays a vital role in the production and life of rural settlements. Although Zhao et al. found that the main influencing factor affecting the change of surface runoff is precipitation. The surface runoff in the SHRD model is calculated according to the precipitation and runoff coefficient of each basin [12]. However, the accuracy of choosing a runoff coefficient for a large area is fuzzy. The global land data simulation system (GLDAS) provides a long-term global distributed runoff, which is highly demanded in water cycle research and water resources management [13]. The correlation coefficient between the surface runoff provided by these data and the observed surface runoff data in the Liuxi River Basin reaches 0.81 [14]. Therefore, these data can roughly represent large-scale surface runoff.
Water resources play an important role in economic development. Usually, the lower reaches of rivers or deltas are densely populated and economically developed areas where water intake is convenient, with developed agriculture, water conservancy, shipping, and other comprehensive transportation. Therefore, there is a correlation between water resources and economic development. It is generally believed that the richer the water resources, the more developed the economy. Especially for agriculture, the higher the accessibility of water resources, the more developed the agriculture. Farmers in rural settlements depend on agriculture, and most of them in China are living near fields. Therefore, there is a certain correlation between the surface water resource accessibility of rural settlements and the GDP of the primary industry. Xie and Qin quantitatively analyzed the correlation between water resource accessibility and the economy based on the SHRD model [6,15]. The experimental results show that there is a significant positive correlation between water resource accessibility and regional GDP in China. The development of the regional economy is not only constrained by water resource accessibility in China but also in foreign countries, such as Bhutan [16]. Indeed, the interplay between water resources and rural settlements holds considerable sway over regional sustainable development.
Furthermore, previous research has often overlooked the assessment of surface water resource accessibility concerning the spatial distribution characteristics of rural settlements, particularly in regions like the Yellow River Basin, and using rural settlements as the research unit. This paper seeks to address this gap by introducing the SWRA model. The subsequent sections of this manuscript are structured as follows: Section 2 provides an overview of the study area, the dataset collected, and the methods employed in constructing the surface water resource accessibility model. Section 3 presents the assessment results across three different scales, which are further discussed in Section 4. Finally, we conclude our work in Section 5.

2. Materials and Methods

2.1. Study Area

The Yellow River originates from the Bayan Har Mountains in Qinghai Province, China, and extends to Dongying City, Shandong Province. From the source of the Yellow River to the estuary, it passes through 9 provinces and 56 cities in Qinghai Province, Sichuan Province, Gansu Province, Ningxia Hui Autonomous Region, Inner Mongolia Autonomous Region, Shaanxi Province, Shanxi Province, Henan Province, and Shandong Province. The total length of the Yellow River is about 5464 km. According to the Yellow River Conservancy Commission of the Ministry of Water Resources, the total area of the Yellow River Basin is 795,000 km2. As the birthplace of Chinese civilization, the Yellow River Basin has a total land area of 21,911.23 km2 in urban and rural areas, industrial and mining areas, and residential areas, accounting for 2.8% of the total area of the Yellow River Basin. Rural residential areas account for about 75% of the total land area. And most residential areas are distributed along rivers. The Yellow River sustains approximately 12% of China’s population. According to the Yellow River Water Resources Bulletin, agricultural water use accounts for an average of 67.3% of water usage in the basin [17]. The surface water development utilization rate in the Yellow River Basin stands at a staggering 86%, significantly surpassing the internationally recognized ecological warning line of 40% for water resource development [18]. Consequently, ensuring the rational utilization and allocation of water resources in the Yellow River Basin is imperative. The spatial correlation between rural settlements and water resources plays a pivotal role in water resource allocation. This paper aims to quantitatively evaluate this relationship.
There are many hydrological stations in the Yellow River Basin. This paper selected 12 important control hydrological stations in the mainstream of the Yellow River recorded in the Yellow River Sediment Bulletin [19]. They are Tangnaihai station, Lanzhou station, Shizuishan station, Toudaoguai station, Longmen station, Tongguan station, Sanmenxia station, Xiaolangdi station, Huayuankou station, Gaocun station, Ai Shan station, and Lijin station from upstream to downstream (Figure 1).
This paper utilized land use data from 2020 to extract spatial distribution vector data of rivers and residential areas within the Yellow River Basin. Subsequently, the area and number of rural settlement patches within river buffers at varying distances were quantified using the ArcGIS 10.3 spatial statistical analysis tool. This facilitated the qualitative and quantitative revelation of the spatial relationship between rural settlements and rivers. Additionally, by integrating surface water resources, topography, and distance, a surface water resource accessibility model (SWRA) was constructed using the Geographic In-formation System (GIS) platform. The SWRA model was then employed to analyze the spatial distribution characteristics of rural settlement surface water resource accessibility across the entire Yellow River Basin, as well as at catchment and city scales. Finally, the rationality of the SWRA model proposed in this paper was validated through Pearson correlation analysis between the primary industry output value of cities and SWRA at the city scale.
Based on the method of buffer zone analysis, this paper first reveals the overall spatial distribution characteristics of rural settlements and rivers in the Yellow River Basin by counting two landscape pattern indices, including the number and area of rural settlements. According to the previous calculation, the area of rural settlements in the Yellow River Basin increased slowly from 1980 to 2020, with little increase in the number of rural settlement areas [20]. Therefore, this paper uses rural settlement vector data and the river network map of 2020 in the study. Then, this paper takes 2 km, 4 km, 6 km, 8 km, and 10 km away from the rivers as buffer zones. Furthermore, the numbers and areas of rural settlements in each buffer zone are counted respectively, as shown in Table 1.
It can be seen from Table 1 that the proportion of rural settlement areas and numbers are 67.44% and 62.41% in the 10 km buffer distance away from the river. Furthermore, the proportion of rural settlement areas and numbers are 37.02% and 33.94% in the 4 km buffer distance away from the river. Compared with other residential areas and numbers in the buffer zone with the same distance, the rural residential areas and numbers in the buffer zone of 2 km away from the rivers account for the largest proportion. It can be seen that there is a certain correlation of the spatial distribution between rural settlements and rivers in the Yellow River Basin. Therefore, the spatial distribution relationship between rural settlements and surface water resources is further revealed by constructing the surface water resource accessibility model.

2.2. Materials

2.2.1. Data

The rural settlement data involved in this paper come from the land use data with 30 m resolution in the National Earth System Science Data Center (http://www.geodata.cn/, accessed on 1 May 2023) of 2020. The river network system was extracted by DEM data with a 30 m resolution in 2010. The origin control upstream catchment area of each hydrological station was derived from DEM data on the ArcGIS 10.3 platform. Then, it was corrected by the subbasin boundary in the Yellow River network system of the Atlas of the Yellow River Basin [21] (Figure 1).
Surface runoff data (Qs_acc) is derived from the Global Land Data Assimilation System (GLDAS) [22]. GLDAS is a global hydrological model developed and established by NASA’s Goddard Space Flight Center and the National Center for Ocean and Atmospheric Prediction. Its data include surface runoff (kg/m2), snow depth (m), soil moisture (kg/m2), snow depth water equivalent (kg/m2), and so on. According to Zheng et al. and Lv et al., the surface runoff data can reflect the change in surface runoff [13,14]. Therefore, this paper directly uses these data to represent surface runoff. We extracted and processed GLDAS-2.1 data (with a spatial solution of 0.25°, equal to 25 km, and a temporary solution of 24 h) in Google Earth Engine (GEE) in 2020 [23]. Then, the average value of surface runoff for 12 periods in 2020 was obtained by the grid calculator tool of ArcGIS 10.3.
The economic data select the output value of the primary industry, which comes from the provincial statistical yearbooks in 2020. According to the standards of the National Economical Industry Classification (GB/T4754-2011) [24] and the Regulations on the Division of Three Industries, the primary industry refers to agriculture, forestry, animal husbandry, and fishery (excluding agriculture services, forestry services, animal husbandry services, and fishery services). The gross output value of agriculture, forestry, animal husbandry, and fishery refers to the total value of all products of agriculture, forestry, animal husbandry, and fishery in monetary terms and various supporting service activities for agriculture, forestry, animal husbandry, and fishery production activities, which reflects the total scale and achievements of agriculture, forestry, animal husbandry, and fishery production in a certain period [25].

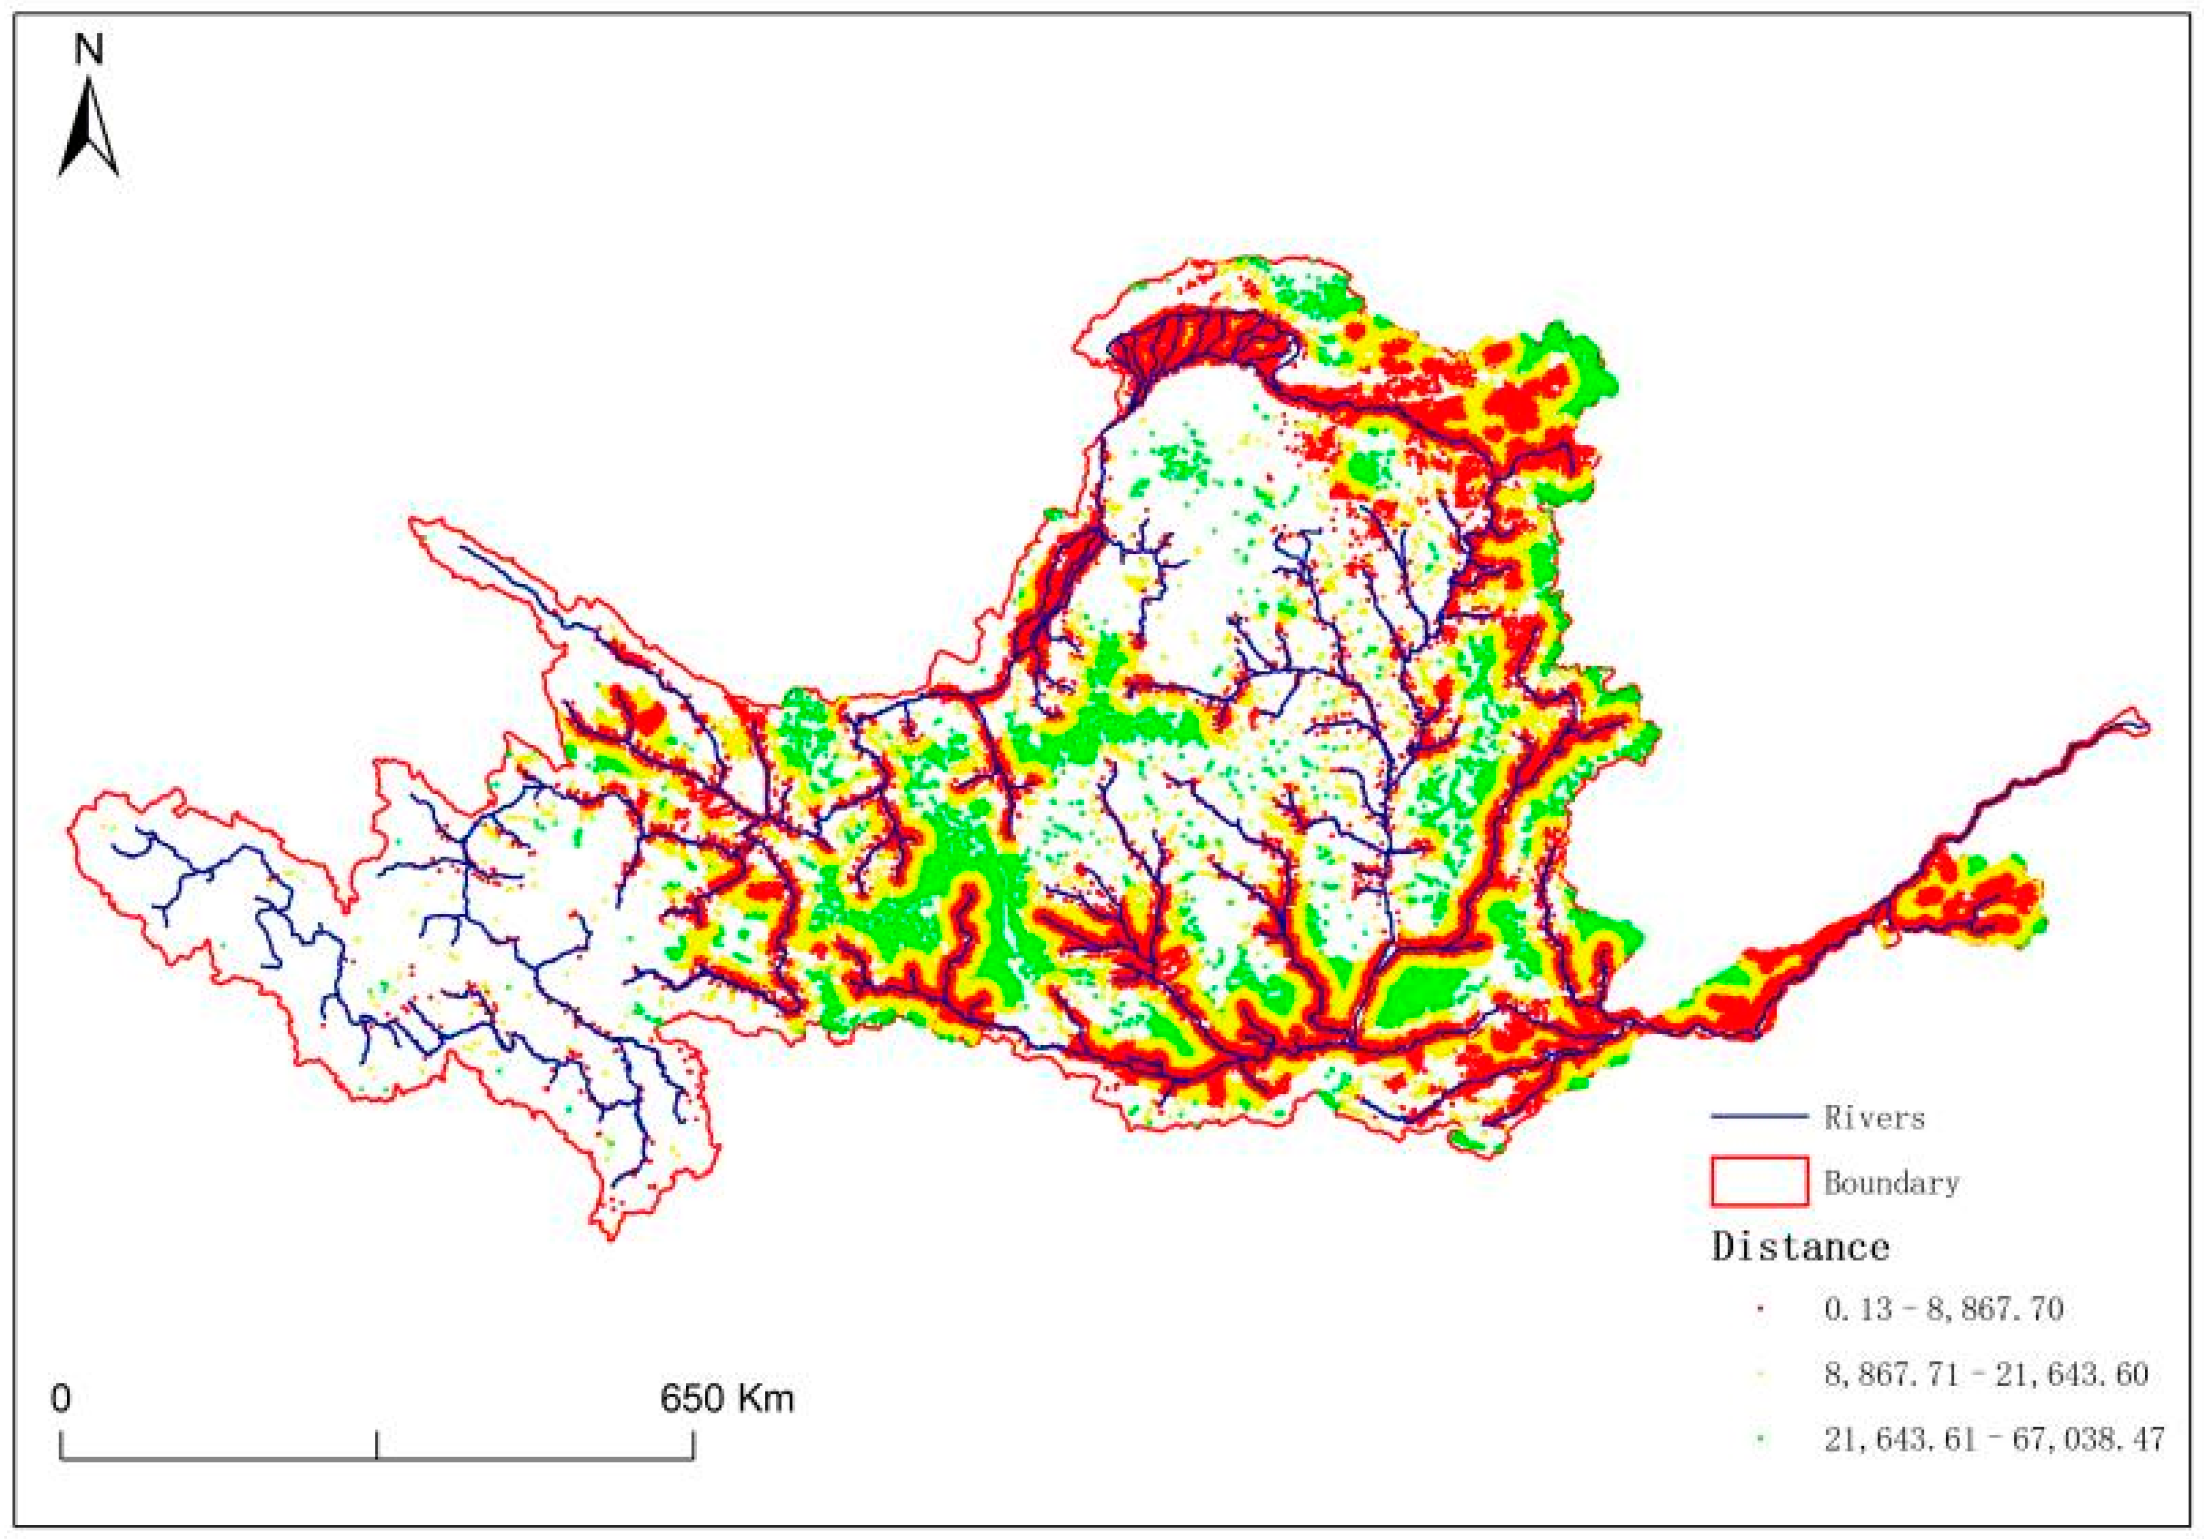
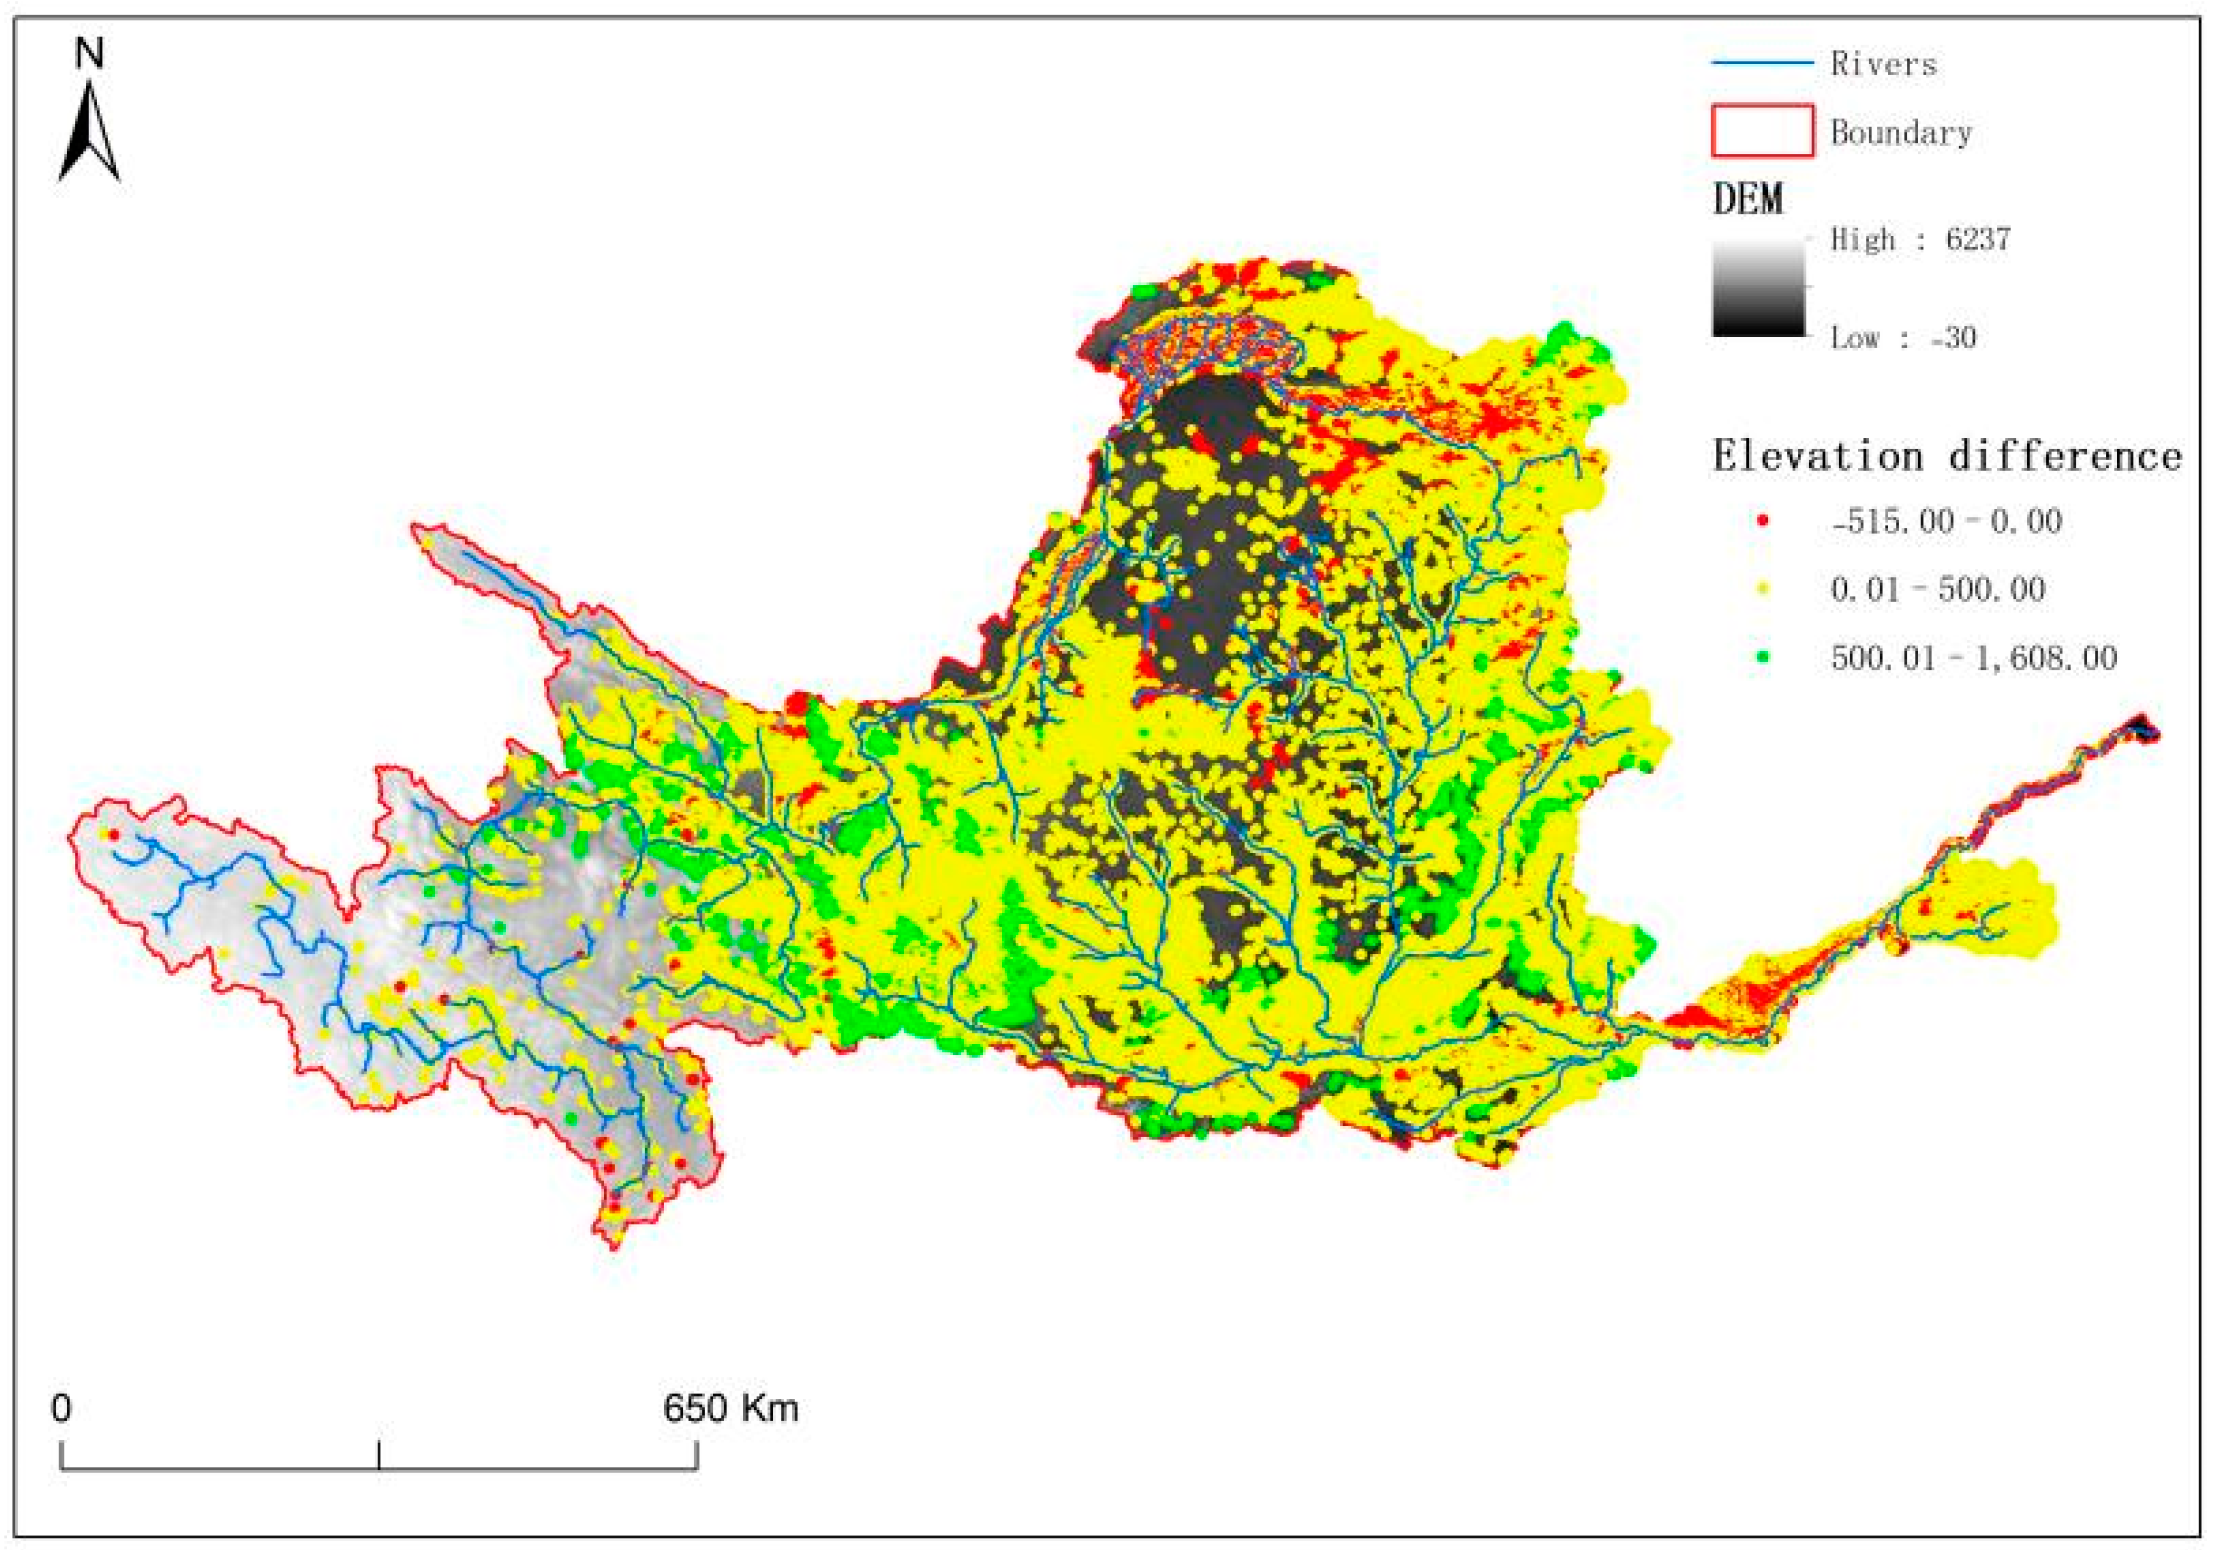
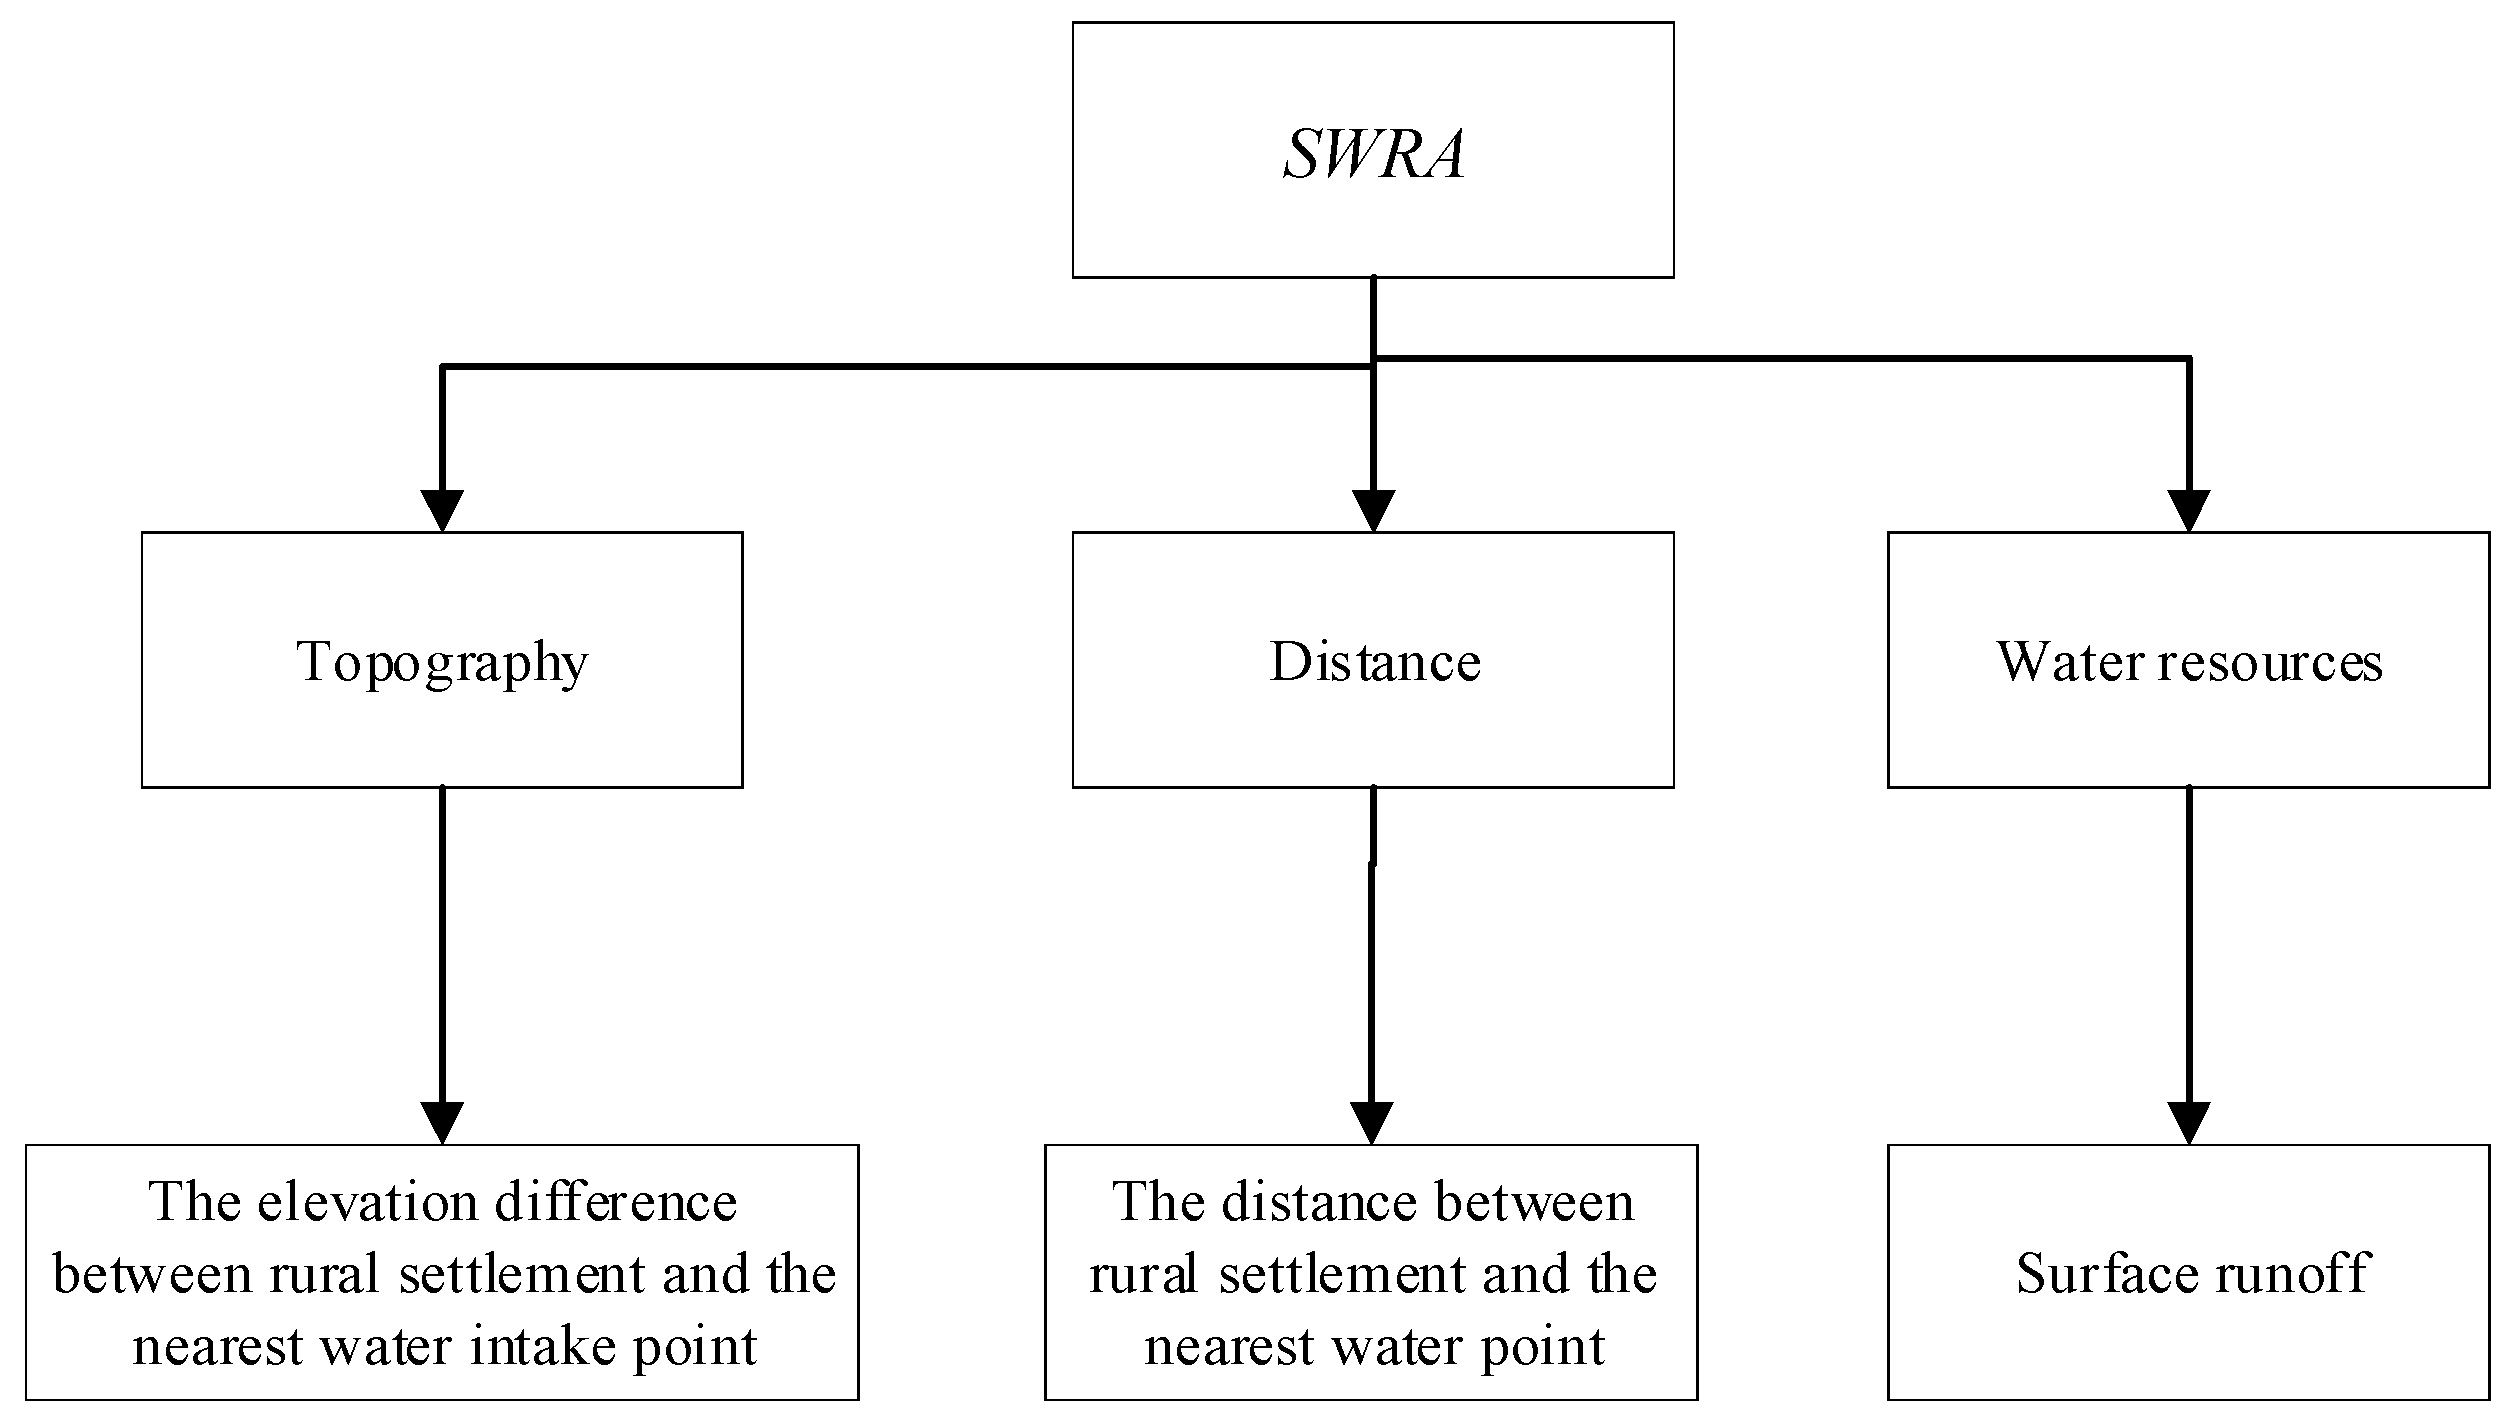
2.2.2. Construction of Surface Water Resource Accessibility Model

To quantitatively analyze the accessibility of rural settlements to surface water resources, this paper takes rural settlements as the research unit and constructs the surface water resource accessibility (SWRA) model to analyze the water resource accessibility of rural settlements in the Yellow River Basin. The specific indicators include the elevation difference between rural settlements and the nearest water intake point (E) reflecting the topographic characteristic, the distance between rural settlements and the nearest water intake point (D) reflecting the distance characteristic, and the surface runoff (Qs_acc) reflecting the characteristic of surface water resources (Figure 2).
The elevation difference between the rural settlement and nearest water intake point (E): the elevation difference between the rural residential area and the nearest water intake point was calculated by DEM data on ArcGIS 10.3 platform using a spatial statistical analysis tool.
The distance between rural settlement and the nearest water intake point (D): the distance between each centroid of rural settlement and the nearest water point was calculated by using the proximity analysis tool in ArcGIS 10.3 spatial analysis.
Surface runoff (Qs_acc): this paper assigns surface runoff value to the centroid of rural settlement by using the tool of “value extraction to point” in the ArcGIS 10.3 spatial analysis toolbox.
Generally speaking, the higher the Qs_acc, the higher the accessibility of water resources. The lower the E, the higher the accessibility of water resources. The smaller the D, the higher the accessibility of water resources. Based on the previous research achievements, the experts in water resource management achieved an agreement that Qs_acc and E had a higher impact on the accessibility of water resources in rural settlements. The weights of Qs_acc and E are relatively higher. Then, the weight of D is relatively lower. Finally, the weights of Qs_acc, E, and D are set to 0.4, 0.4, and 0.2, respectively, according to the Delphi method.
The water resource accessibility model of each rural settlement is constructed using the method of weighted summation, as shown in Formula (1).
S W R A = E × W E + D × W D + Q s _ a c c × W Q
In Equation (1), W E is the weight of E , W D is the weight of D , and W Q is the weight of Q s _ a c c .
Since the dimensions of each index in Formula (1) are different, the following standardization method is adopted [26].
X i * = X m a x X i X m a x X m i n
X i * = X i X m i n X m a x X m i n
In Formulas (2) and (3), X i * is the normalized variable value, X i is the original variable, and X m a x and X m i n are the maximum and minimum values of X i . For the inverse index, Formula (2) is used for standardization; for positive indicators, Formula (3) is used for standardization.

3. Results

The results of SWRA are examined in the whole basin, at catchment scale, and at the city scale. Because the catchments are important components of the basin, the characteristics of SWRA values at the catchment scale are delivered. In addition, the characteristics of SWRA values at the city scale are examined. Furthermore, in order to verify the rationality of SWRA, the correlation between SWRA and the GDP of the primary industry is explored.

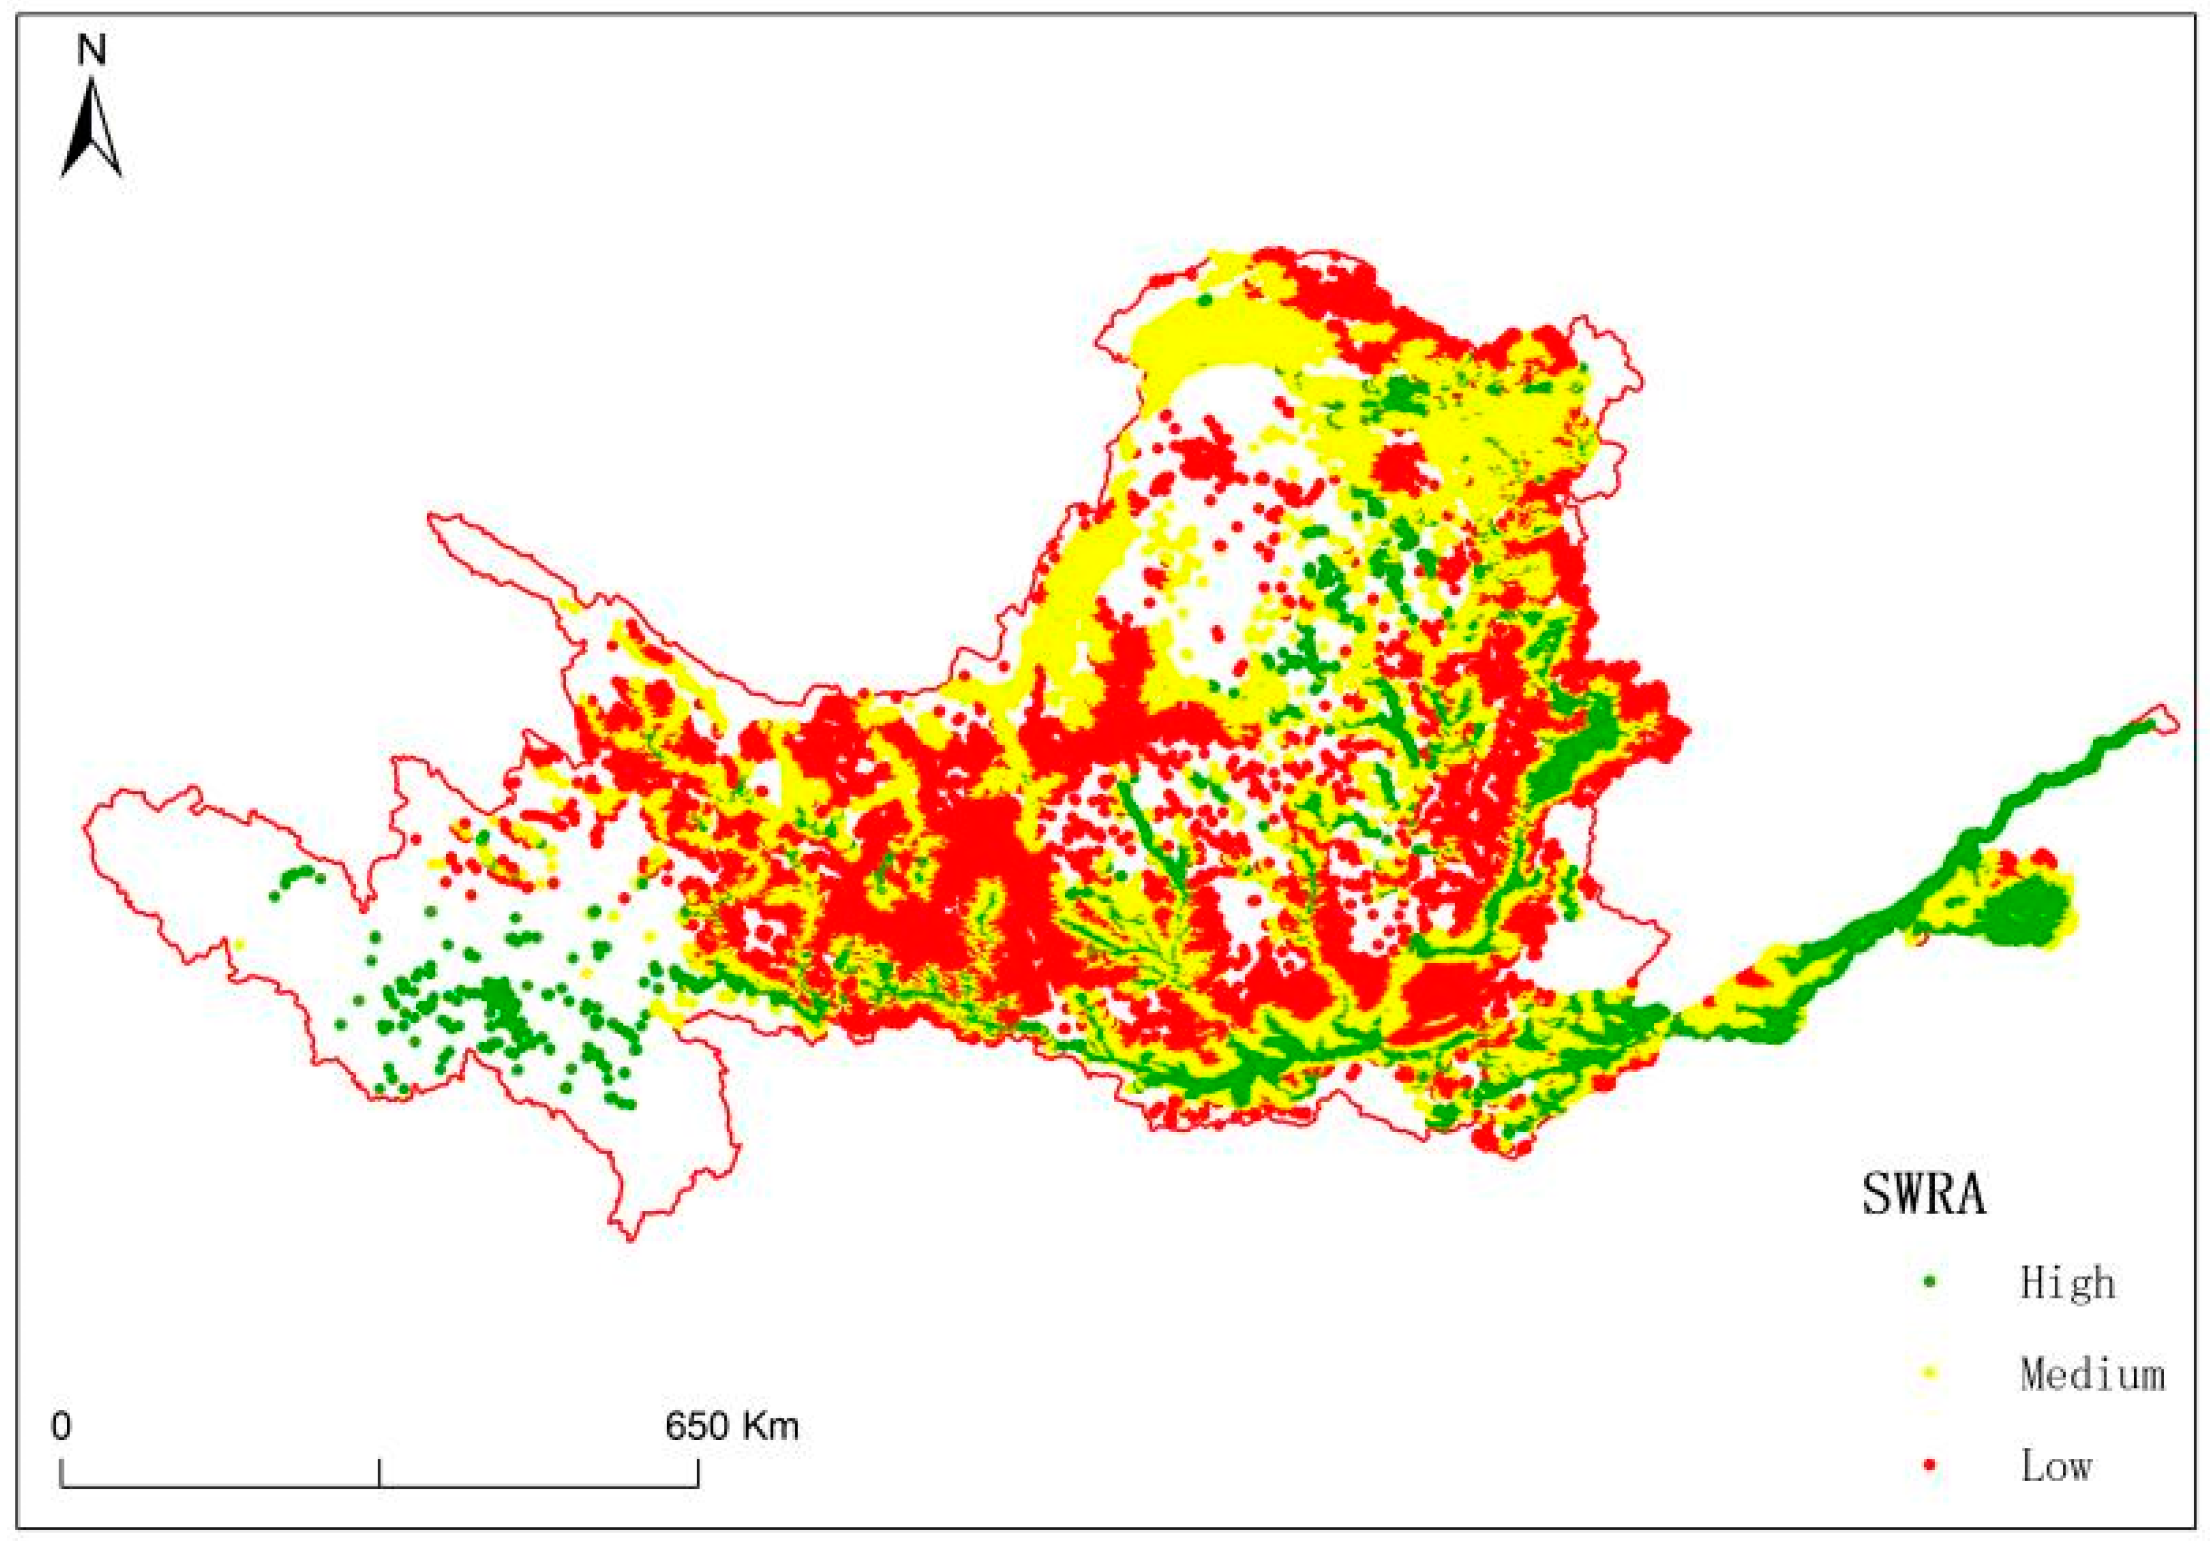
3.1. The Results of SWRA in the Yellow River Basin

After calculation, the range of surface water runoff in the Yellow River Basin is 0–3.10 kg/m2. At the same time, the surface runoff of rural settlements is extracted. The range of surface runoff values in rural settlements is 0–0.17 kg/m2 (Figure 3). Based on the nearest distance, the distance between the rural settlement and the nearest water intake point is calculated. Its value range is 0.13–67,038.47 m (Figure 4). Then, the elevation difference between the rural settlement and the nearest water intake point is calculated based on DEM data combined with the nearest neighbor point. The values range from −515 to 1608 m (Figure 5). It can be seen from Figure 3 that the surface runoff of rural settlements is mostly lower than 0.05 km/m2, reaching 99.83% by statistics. In other words, the Yellow River Basin is extremely short of water resources. The distribution characteristics of rural settlements are along rivers, which can be seen clearly in Figure 4. There are 10.93% of rural settlements whose elevation is lower than the nearest water intake point through attribute query statistics. There are 3.77% of rural settlements whose elevation is higher than the nearest water intake point by 500 m, reaching a maximum of 1608 m. The positive elevation difference greatly increases the difficulty of water intake.
The SWRAS values of each rural settlement were achieved by a weighted sum of the three standardized indicators by Equation (1). The SWRA values range from 0.13 to 0.88, with an average value of 0.47 and a standard deviation of 0.05 (Figure 6). The SWRA values are divided into three levels, namely high, middle, and low, by 0.45 and 0.51, according to the spatial distribution characteristics of D, E, and Qs_acc by the Delphi method. It can be seen from Figure 6 that the SWRA in the Yellow River Basin is higher in the east and west and lower in the middle.
The distribution characteristics of SWRA values are further analyzed at the catchment scale and the city scale.

3.2. Spatial Distribution Characteristics of SWRA at the Catchment Scale

The average value of SWRA in each catchment is counted based on the intersect analysis between SWRA and catchment boundaries. At the same time, the average values of the distance and elevation difference between rural settlements and the nearest water intake point are counted in Table 2. The results show that the SWRA values of the 12 catchments from low to high are Sanmenxia station, Lanzhou station, Shizuishan station, Longmen station, Tongguan station, Toudaoguai station, Xiaolangdi station, Huayuankou station, Lijin station, Gaocun station, Aishan station, and Tangnaihai station. According to the classification standard of Section 3.1, the catchment SWRA value in high grade only appears in the catchments of Aishan Station and Tangnaihai Station. The SWRA values in the other catchments are at a medium level. The difference in SWRA values is a minor among these catchments because the catchment SWRA value is the average value of all the SWRA values of these rural settlements in each catchment. It should be noted that the SWRA calculation results of this paper are only the relative level under the state of water shortage. Furthermore, the high-grade ratio of SWRA values in Tangnaihai station is 78.55%, while the high-grade ratio of SWRA values in Sanmenxia station is only 10.36%. It can be seen from Table 2 that D of Tangnaihai station reaches the smallest value, while D of Sanmenxia station gains the largest value. In other words, it is relatively difficult for rural settlements in the Sanmenxia catchment to obtain water resources, while it is relatively easy for the Tangnaihai catchment from the perspective of spatial distance. The highest value of elevation difference between rural settlement and the nearest water intake point appears in the Lanzhou catchment, with a value of 210.04 m, while the smallest elevation difference is in the Gaocun catchment, with a value of 0.95 m.

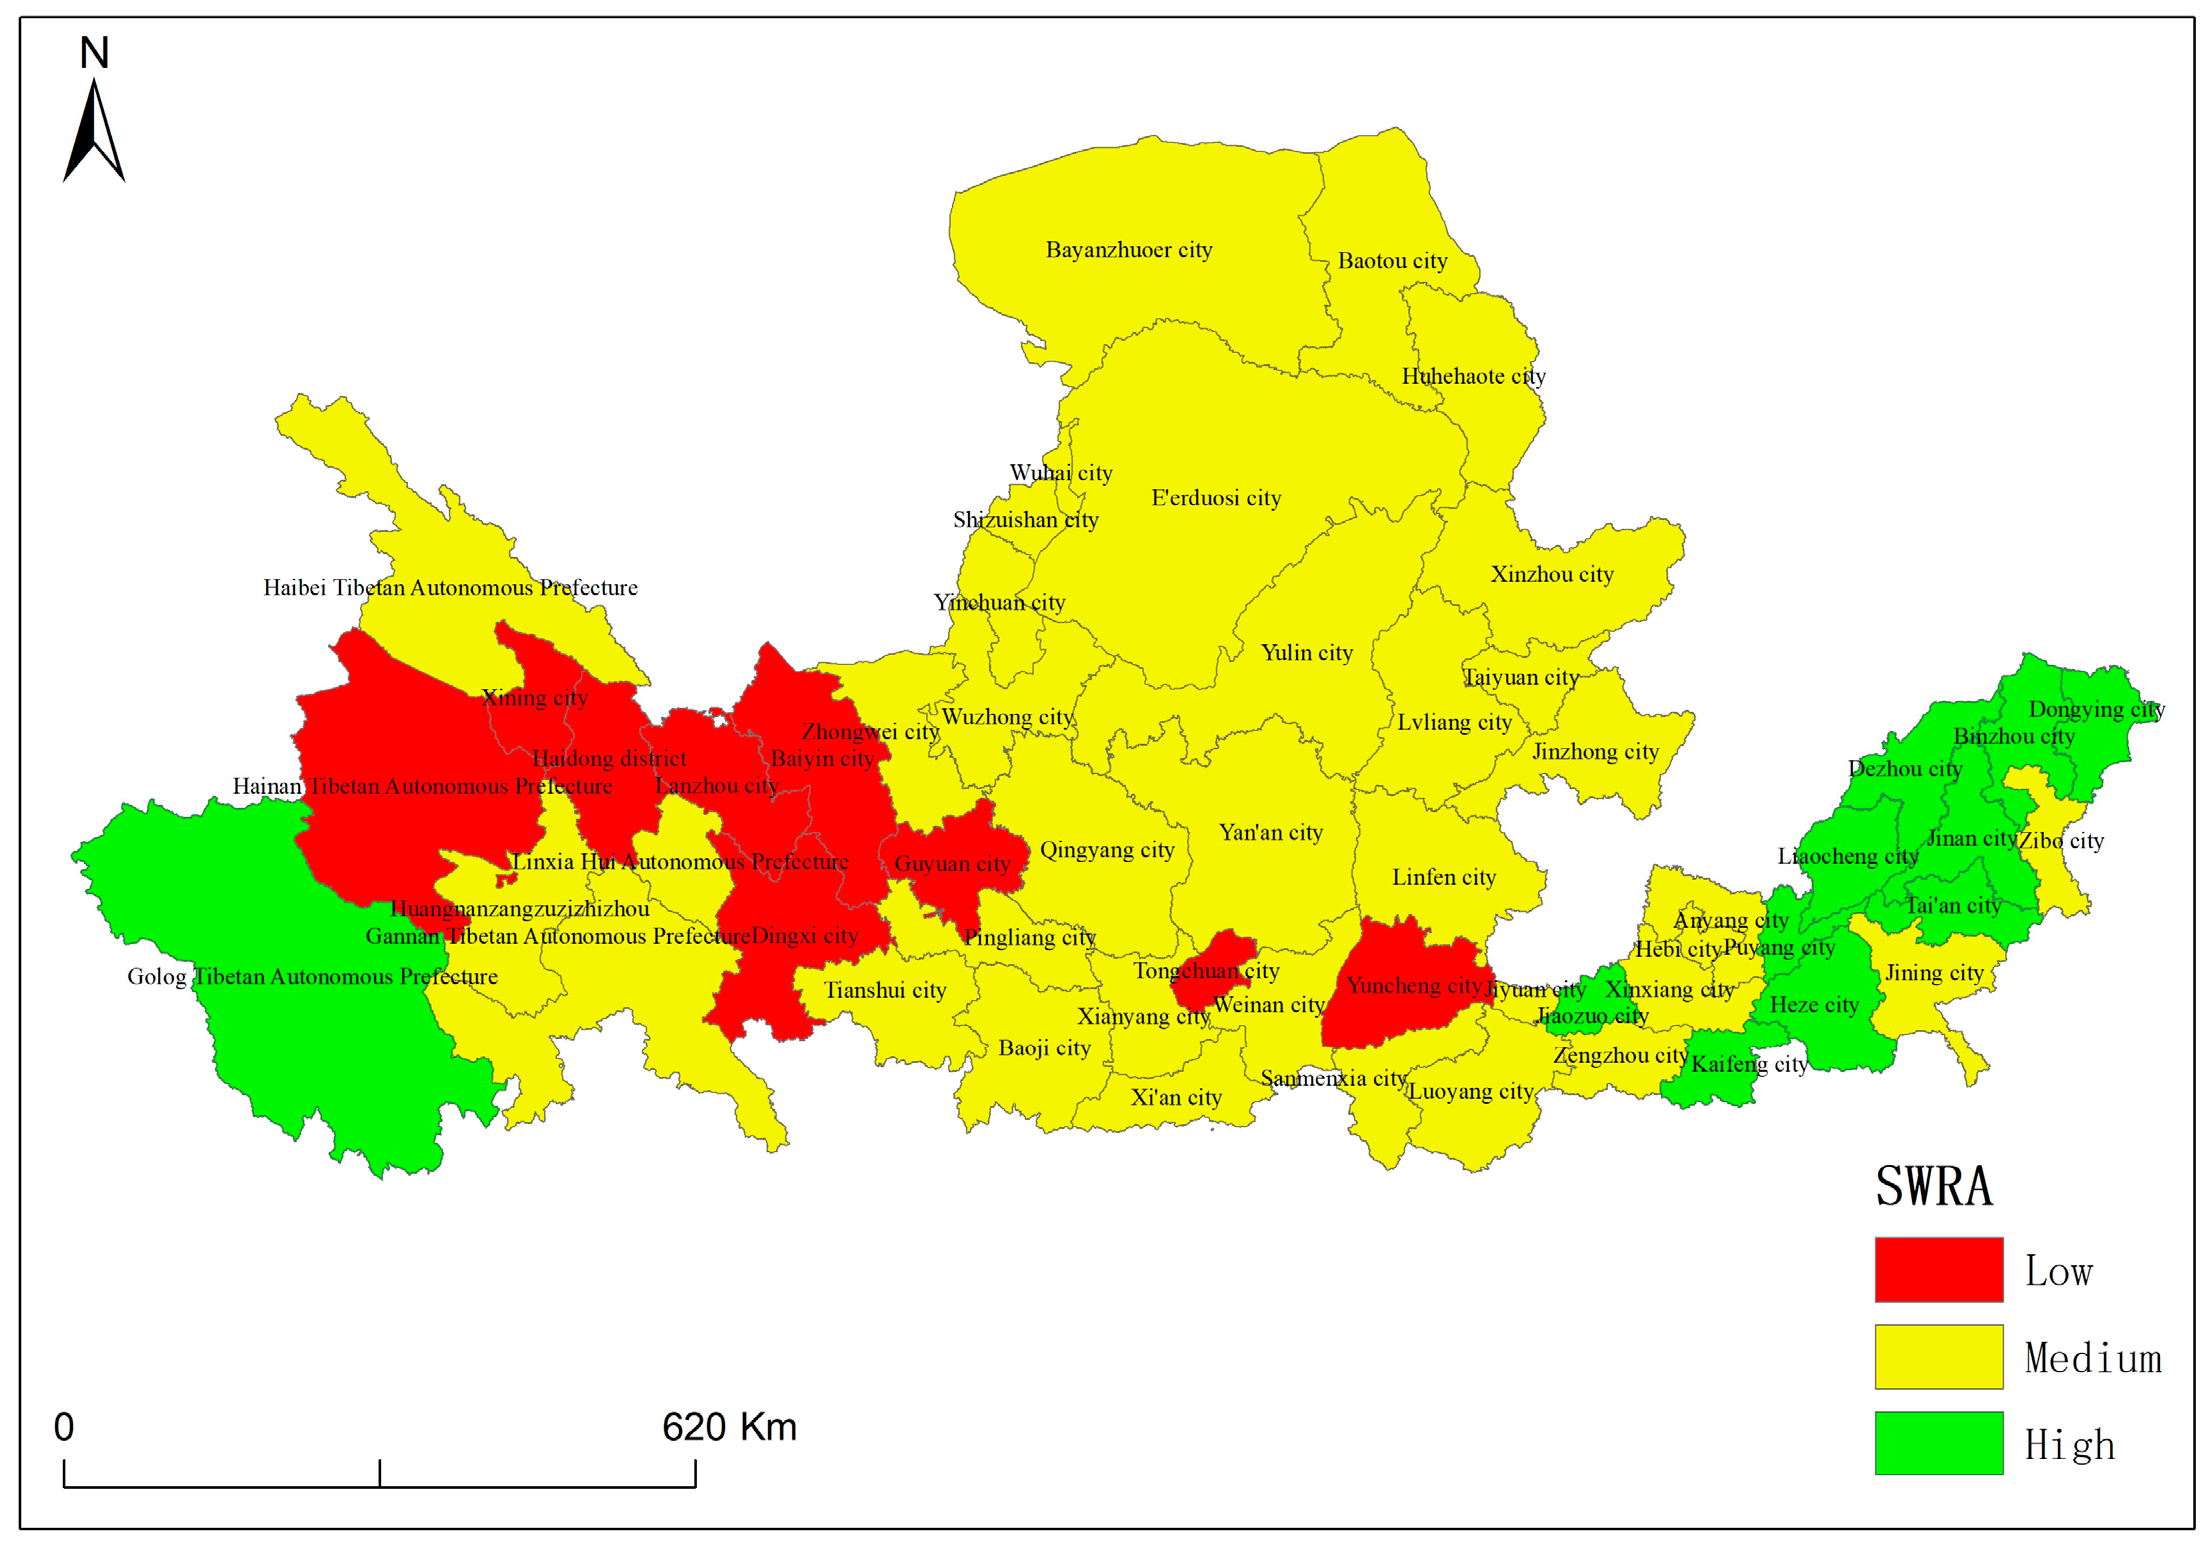
3.3. Spatial Distribution Characteristics of SWRA at the City Scale

The SWRA value of each city is equal to the mean value of all the SWRA values in the city. Firstly, it is calculated by the intersection of SWRA and the city boundary. Then, the values are summarized by the city boundary. The result shows that the SWRA values of the city range from 0.41 to 0.69, with an average value of 0.48 and a standard deviation of 0.04. The city SWRA values are divided into three levels according to the classification standard of 3.1.
It can be seen from Figure 7 that the SWRA values of nine cities are at a low level and are distributed in the western part of the Yellow River Basin, namely Tongchuan City, Guyuan City, Baiyin City, Xining City, Hainan Tibetan Autonomous Prefecture, Yuncheng City, Dingxi City, Lanzhou City, and Haidong District. The GDP of primary industries in these cities tends to be relatively lower. In the Hainan Tibetan Autonomous Prefecture, several rural settlements are situated at a considerable distance from rivers and with minimal surface runoff. Similarly, in cities like Dingxi, Guyuan, Tongchuan, and Yuncheng, there are few river sections, leading to lower SWRA values. Conversely, rural settlements in Xining, Haidong, Lanzhou, and Baiyin are located along rivers, with others scattered across the region. Despite some settlements being close to rivers, a larger number are situated farther away, resulting in a high average value of distance (D). Additionally, these rural settlements experience low levels of surface runoff. Therefore, the SWRA values of these cities are at a low level. The SWRA values of 11 cities mainly distributed in the east of the study area are in high grade. They are Dongying City, Binzhou City, Dezhou City, Kaifeng City, Liaocheng City, Tai’an City, Jiaozuo City, Heze City, Puyang City, and Jinan City. Besides these cities, the high-grade city distributed in the west is Golog Tibetan Autonomous Prefecture. The GDP of primary industries in the ten eastern cities tends to be relatively higher. This observation suggests a discernible correlation between SWRA and GDP. However, in Golog Tibetan Autonomous Prefecture, the SWRA value is notably high due to the region’s elevated surface runoff levels in the western area.
Furthermore, the correlation between the SWRA values of the city and the GDP of primary industry is revealed in SPSS 25. The results show that the correlation coefficient between city SWRA values and the GDP of primary industry is 0.271 (N = 56, Sig = 0.043, at 0.05 level (double tails), and the correlation is significant). It can be seen that there is a linear positive correlation between SWRA and the GDP of the primary industry, which indicates that SWRA serves as an influential indicator affecting the GDP of primary industries. Furthermore, it lends credence to the rationality of SWRA to some extent. However, the correlation coefficient is not high. The main reason is that the western region with abundant water resources is sparsely populated. For example, the rural settlement is less distributed in the area of the Tangnaihai catchment (e.g., Golog Tibetan Autonomous Prefecture) with a lower GDP of the primary industry, while the water resources there are abundant and with a relatively higher value of SWRA. The economic development of this region is affected by other factors such as climate, transportation, and population. In other words, SWRA is the secondary influencing factor of the economic development of this region.

4. Discussion

4.1. The Uncertainty of Indicators of SWRA

With the development of infrastructure and the improvement of the tap water supply network, some rural residents gradually give up the water in natural rivers [27]. Then, rivers gradually lose their original functions [28]. Moreover, with the development of the social economy, the water quality in the rivers is gradually polluted by domestic sewage and agricultural sewage [29,30]. After inheritance, interweaving, replacement, connection, and other ways to promote the development of settlements, a coordinated relationship between settlements and rivers is formed [31], and in a long-term evolution, the relationship gradually matures. Therefore, from the perspective of surface water resource accessibility to analyze the accessibility of rural residential water resources, the accuracy needs to be improved. Furthermore, human factors such as the tap water network and pumping stations should be considered in the construction of SWRA.
The surface runoff data provided by GLDAS serve as a relative measure of surface water resources. While previous studies have indicated its rough representation of surface runoff, its accuracy is not absolute. Nonetheless, this paper conducts a quantitative evaluation of water resource accessibility in rural residential areas across the Yellow River Ba-sin under conditions of water scarcity. The surface runoff data from GLDAS captures the surface water resources of the entire region under uniform conditions. Through standardization of each indicator during calculation, even if the data’s accuracy is not optimal, it remains viable as an indicator for assessing water resources within SWRA.

4.2. The Implications of SWRA

The findings underscore the significance of water resource accessibility for the regional development of rural communities. This accessibility serves as a guide for both the water allocation program of the Yellow River and broader regional sustainable development efforts. For instance, in regions with poor surface runoff, it is imperative for managers to allocate more water resources. Additionally, for scattered rural settlements characterized by low SWRA values, a strategic relocation to concentrated areas is recommended. This relocation would enable managers to efficiently provide water resources through the implementation of tap water networks and pumping stations.

4.3. The Implications of the Relationship of SWRA and GDP of Primary Industry

The correlation coefficient between city SWRA values and the GDP of the primary industry may appear low due to the multifaceted nature of economic development, influenced by both natural and social factors. Natural factors encompass climate, terrain, rivers, and water resources, while social factors include population, transportation, policies, location, and demographics. Particularly in regions with abundant water resources, such as the Yellow River source area, despite high surface runoff and water accessibility, the primary industry’s GDP tends to be relatively low. This discrepancy is primarily attributed to the challenging nature of water resource development in such regions, which impedes economic progress. Nonetheless, the significant correlation coefficient underscores the role of water resource accessibility as a factor influencing regional economies. Quantitative data derived from this correlation can offer valuable support for formulating regional economic policies and strategies. By leveraging the relationship between SWRA and economic development, regional development strategies can be tailored effectively. Water resources play a pivotal role in economic development, and exploring the connection between water resource accessibility and economic progress can provide crucial data for optimizing water resource allocation, enhancing utilization efficiency, and fostering equitable distribution in China [32]. This paper introduces the SWRA model for the first time to assess water resource accessibility in rural residential areas across the Yellow River Basin and its correlation with primary industry economic development. Building upon this foundation, future research will delve into the relationship between water resource accessibility and economic development at various scales (e.g., county scales and upstream, midstream, and downstream scales), contributing to the fair and rational allocation of water resources in the Yellow River Basin.

5. Conclusions

Based on the GIS platform, the spatial distribution characteristics of rural settlements and river networks in the Yellow River Basin are studied qualitatively at first. Then, a quantitative evaluation model of surface water resource accessibility is constructed by using the GIS network analysis method, taking rural settlements as the research unit, based on three dimensions of topography, distance, and surface water resources. The surface water resource accessibility of rural settlements in the Yellow River Basin is evaluated quantitatively. Finally, the rationality of SWRA is verified by the Pearson correlation analysis between surface water resource accessibility and the GDP of primary industry. The following conclusions are obtained: (1) The surface runoff of rural residential areas in the Yellow River Basin is mostly less than 0.05 km/m2, reaching 99.83%. In other words, the Yellow River Basin is extremely short of water resources. The grade of surface water resource accessibility is relatively high only at the source and estuary of the Yellow River, while it is relatively low in the central region of the Yellow River Basin. (2) The average value of surface water resource accessibility at the catchment scale has minor difference. However, from the ratio of high, middle, and low grades of SWRA in each catchment area, the high-grade ratio of Sanmenxia station is only 10.36%, while the high-grade ratio of Tangnaihai station is 78.55%. (3) The value of surface water resource accessibility at the city scale is higher in the east of ten cities and in the west of one city. However, it is lower in the west of nine cities, and the SWRA value of the other cities is at a medium level. (4) The water resource is the key factor that restricts the development of the rural economy. There is a correlation between SWRA and the primary industry economy in the Yellow River Basin. Indeed, while the correlation coefficient between SWRA and GDP may be low, its significance underscores the importance of SWRA as a factor influencing GDP. This suggests that SWRA is constructed reasonably to assess water accessibility. Consequently, managers can leverage SWRA results to make informed decisions regarding regional development and water allocation strategies.

Author Contributions

Conceptualization, H.L.; methodology, H.L. and J.Z.; software, H.M.; visualization, X.C.; formal analysis, X.H.; investigation, J.Z.; resources, H.L.; data curation, H.M.; writing—original draft preparation, H.L. and H.M.; writing—review and editing, J.Z. and H.M.; visualization, H.L.; supervision, J.Z.; project administration, X.C.; funding acquisition, H.L. All authors have read and agreed to the published version of the manuscript.

Funding

This research was funded by the Open Fund of Key Laboratory of Urban Land Resources Monitoring and Simulation, Ministry of Natural Resources (KF-2022-07-020), the National Natural Science Foundation of China (U21A2014), Natural Science Foundation of Henan (232300420436), Key Scientific Research Projects in Colleges and Universities of Henan Province (24B170002), and Henan Collaborative Innovation Center of Geo-Information Technology for Smart Central Plains (2023C001).

Data Availability Statement

Data are contained within the article.

Conflicts of Interest

The authors declare no conflicts of interest.

References

  1. Li, Y.; Huang, S.; Kong, X.; Han, M.; Wang, M.; Hui, H. Ecological Effects of Surface Water Evolution in the Yellow River Delta. Sustainability 2022, 14, 13544. [Google Scholar] [CrossRef]
  2. Li, X.Q. Study on measures to enhance integrated water resources management of Yellow River. China Water Resour. 2011, 7, 35–38. [Google Scholar] [CrossRef]
  3. Song, F.; Yang, X.; Wu, F. Suitable Pattern of the Natural Environment of Human Settlements in the Lower Reaches of the Yangtze River. Atmosphere 2019, 10, 200. [Google Scholar] [CrossRef]
  4. Zuo, Q.T.; Wu, B.B.; Zhang, W.; Ma, J.X. A method of water distribution in transboundary rivers and the new calculation scheme of the Yellow. Resour. Sci. 2020, 42, 37–45. [Google Scholar]
  5. Wang, Z.Y.; Huang, J.Y. Research on Spatial Distribution Characteristics of Rural Residential Areas Based on GIS: Taking Fuyu City as an Example. Mod. Agric. Sci. Technol. 2023, 21, 205–208. [Google Scholar]
  6. Qin, X. The Relationship between Water Accessibility and Economic Development in China. Master’s Thesis, Central China Normal University, Shanghai, China, 2017. [Google Scholar]
  7. Li, T.; Qiu, S.; Mao, S.; Bao, R.; Deng, H.B. Evaluating Water Resource Accessibility in Southwest China. Water 2019, 11, 1708. [Google Scholar] [CrossRef]
  8. Xu, L.L.; Tu, Z.F.; Yang, J.; Zhang, C.L.; Chen, X.X.; Gu, Y.X.; Yu, G.M. A water pricing model for urban areas based on water accessibility. J. Environ. Manag. 2023, 327, 116880. [Google Scholar] [CrossRef]
  9. Li, F.W.; Liu, H.F.; Chen, X.; Yu, D. Trivariate Copula Based Evaluation Model of Water Accessibility. Water Resour. Manag. 2019, 33, 3211–3225. [Google Scholar] [CrossRef]
  10. Assefa, T.; Jha, M.; Reyes, M.; Srinivasan, R.; Worqlul, A. Assessment of Suitable Areas for Home Gardens for Irrigation Potential, Water Availability, and Water-Lifting Technologies. Water 2018, 10, 495. [Google Scholar] [CrossRef]
  11. Li, F.W.; Gao, F. Accessibility evaluation of water networks based on network analysis. Water Resour. Hydropower Eng. 2023, 1–13. Available online: https://link.cnki.net/urlid/10.1746.TV.20230922.1452.002 (accessed on 15 June 2023).
  12. Zhao, L.; Zhang, Z.; Dong, F.; Fu, Y.C.; Hou, L.; Liu, J.Q.; Wang, Y.B. Research on the Features of Rainfall Regime and Its Influence on Surface Runoff and Soil Erosion in the Small Watershed, the Lower Yellow River. Water 2023, 15, 2651. [Google Scholar] [CrossRef]
  13. Lv, M.Z.; Lu, H.; Yang, K.; Xu, Z.F.; Lv, M.F.; Huang, X.M. Information of Runoff Components Simulated by GLDAS against UNH-GRDC Dataset at Global and Hemispheric Scales. Water 2018, 10, 969. [Google Scholar] [CrossRef]
  14. Zheng, J.H.; Wang, H.L.; Liu, B.J. Impact of the long-term prevention and land use changes on runoff variations in a humid subregional river base of China. J. Hydrol. Reg. Stud. 2022, 42, 101136. [Google Scholar] [CrossRef]
  15. Xie, X.Q. The Relationship between Water Accessibility and Economic Development in China. Master’s Thesis, Central China Normal University, Shanghai, China, 2019. [Google Scholar]
  16. Imiya, M.C.; Erandi, S.; Phub, Z.; Miyuru, B.G.; Denkar, D.; Nitin, M.; Amila, A.; Komali, K.; Upaka, R. Assessing the water quality and status of water resources in urban and rural areas of Bhutan. J. Hazard. Mater. Adv. 2023, 12, 100377. [Google Scholar]
  17. Yellow River Conservancy Commission of the Ministry of Water Resources. Yellow River Water Resources Bulletin. 2020. Available online: http://www.yrcc.gov.cn/other/hhgb/ (accessed on 22 May 2023).
  18. Sun, J.W.; Cui, Y.Q.; Zhang, H. Spatio-temporal pattern and mechanism analysis of coupling between ecological protection and economic development of urban agglomerations in the Yellow River Basin. J. Nat. Resour. 2022, 37, 1673–1690. [Google Scholar] [CrossRef]
  19. Yellow River Conservancy Commission of the Ministry of Water Resources. Yellow River Sediment Bulletin. 2020. Available online: http://www.yrcc.gov.cn/nishagonggao/2020/mobile/index.html#p=1 (accessed on 20 May 2023).
  20. Shan, Y.M.; Li, H.Y.; Zhang, J.C.; Tang, L.J.; Guo, J.Z.; Wang, G.X.; Wang, J.Y.; Zhang, H.W.; Zheng, H.H. Temporal and spatial evolution and driving force analysis of rural residential distribution pattern in the Yellow River Basin under the background of rural revitalization. Surv. Mapp. Bull. 2024, 1, 96–101. [Google Scholar] [CrossRef]
  21. Yellow River Conservancy Commission of the Ministry of Water Resources. Atlas of the Yellow River Basin; SinoMaps Press: Beijing, China, 1987; pp. 20–21.
  22. Wang, Q.Q.; Zheng, W.; Yin, W.J.; Kang, G.H.; Huang, Q.H.; Shen, Y.F. Improving the Resolution of GRACE/InSAR Groundwater Storage Estimations Using a New Subsidence Feature Weighted Combination Scheme. Water 2023, 15, 1017. [Google Scholar] [CrossRef]
  23. Rodell, M.; Houser, P.R.; Jambor, U.; Gottschalck, J.; Mitchell, K.; Meng, C.J.; Arsenault, K.; Cosgrove, B.; Radakovich, J.; Bosilovich, M.; et al. The global land data assimilation system. Bull. Am. Meteorol. Soc. 2004, 85, 381–394. [Google Scholar] [CrossRef]
  24. GB/T4754-2011; The National Economical Industry Classification. China, 2011. Available online: https://www.cas.cn/ggfw/tzgg_1/201201/P020120120521186361137.pdf (accessed on 15 June 2023).
  25. National Bureau of Statistics of the People’s Republic of China. 2021 China Statistical Yearbook; China Statistics Publishing: Beijing, China, 2021.
  26. Li, H.Y.; Fan, Y.B.; Gong, Z.N.; Zhou, D.M. Water accessibility assessment of freshwater wetlands in the Yellow River Delta National Nature Reserve, China. Ecohydrol. Hydrobiol. 2020, 20, 21–30. [Google Scholar] [CrossRef]
  27. Bao, R.; Wu, J.; Li, T.; Deng, H. Assessment and Influencing Factors of Water Supply Capacity and Water Resource Utilization Efficiency in Southwest China. Water 2023, 15, 144. [Google Scholar] [CrossRef]
  28. Wu, Y.Q.; Xu, Y.; Zhao, Y.; Luo, Y.Z.; Lu, J.Y.; Chen, Y.C. Evolution of river network due to urbanization in the Southeast Yinzhou Plain of Yongjiang River Basin, China. J. Clean. Prod. 2022, 379, 134718. [Google Scholar] [CrossRef]
  29. Anh, N.T.; Can, L.D.; Nhan, N.T.; Schmalz, B.; Luu, T.L. Influences of key factors on river water quality in urban and rural areas: A review. Case Stud. Chem. Environ. Eng. 2023, 8, 100424. [Google Scholar] [CrossRef]
  30. Liu, J.; Cheng, F.; Zhu, Y.; Zhang, Q.; Song, Q.; Cui, X. Urban Land-Use Type Influences Summertime Water Quality in Small- and Medium-Sized Urban Rivers: A Case Study in Shanghai, China. Land 2022, 11, 511. [Google Scholar] [CrossRef]
  31. Cao, W.F.; Liu, J.G.; Ceola, S.; Mao, G.Q.; Macklin, M.G.; Montanari, A.; Ciais, P.; Yao, Y.Z.; Tarolli, P. Landform-driven human reliance on rivers in imperial China. J. Hydrol. 2023, 620, 129353. [Google Scholar] [CrossRef]
  32. Espinoza, S.; Forni, L.; Lavado, A.; Olivera, M.; Tapia, C.; Vega, B.; Balderrama, M.; Escobar, M. Connecting Water Access with Multidimensional Poverty: The Case of Tupiza River Basin in Bolivia. Water 2022, 14, 2691. [Google Scholar] [CrossRef]
Figure 1. Overview map of the study area.
Water 16 00708 g001
Figure 2. Index system diagram of surface water resource accessibility.
Water 16 00708 g002
Figure 3. Surface runoff thematic map.
Water 16 00708 g003
Figure 4. Distance thematic map.
Water 16 00708 g004
Figure 5. The elevation difference thematic map.
Water 16 00708 g005
Figure 6. The surface water resource accessibility thematic map.
Water 16 00708 g006
Figure 7. Surface water resource accessibility on an urban scale.
Water 16 00708 g007
Table 1. The proportion of rural settlement areas and numbers in different buffer zones.
Buffer Distance
/km
Number of Rural SettlementsProportionRural Settlement Area/km2Proportion
221,44220.733388.4721.37
2–413,66013.212481.1815.65
4–611,58311.201966.2312.40
6–896219.301606.7110.13
8–1082357.961251.947.89
>1038,88137.595164.4732.56
Total103,422100.0015,858.99100.00
Table 2. Statistical characteristics of rural settlements and water resources at the catchment scale.
Station D /kmQs_acc/kg/m2E/m S W R A
Tangnaihai station6.150.06796.870.62
Lanzhou station7.870.010210.040.45
Shizuishan station10.680.003114.880.46
Toudaoguai station8.700.00454.150.48
Longmen station9.930.009146.870.46
Tongguan station10.780.013188.060.47
Sanmenxia station16.530.012160.520.45
Xiaolangdi station6.060.013155.740.49
Huayuankou station10.260.017149.630.49
Gaosun station9.140.0130.950.50
Aishan station6.740.02035.610.52
Lijin station7.990.02080.590.50
Disclaimer/Publisher’s Note: The statements, opinions and data contained in all publications are solely those of the individual author(s) and contributor(s) and not of MDPI and/or the editor(s). MDPI and/or the editor(s) disclaim responsibility for any injury to people or property resulting from any ideas, methods, instructions or products referred to in the content.

