Article

A Case Study for Stability Analysis of a Toppling Bank Slope with Fault Fracture Zones Developed under the Action of Bridge Loads and Reservoir Water

1
Earth Sciences and Engineering College, Hohai University, Nanjing 210098, China
2
China Communications Highway Planning and Design Institute Co., Ltd., Beijing 100010, China
*
Author to whom correspondence should be addressed.
Water 2024, 16(3), 494; https://doi.org/10.3390/w16030494
Submission received: 15 December 2023 / Revised: 24 January 2024 / Accepted: 26 January 2024 / Published: 2 February 2024

Abstract

:
The mountainous areas of Southwest China have the characteristics of valley deep-cutting, a large topographic gradient, complex geological structures, etc. With the development of infrastructure construction in the area, the construction of bridges across valleys has gradually increased, and the phenomenon of slope failure occurs more and more frequently. As the weak interlayer, the fault fracture zones have a significant influence on the geological structure and stability of slopes, while the complexity of the mechanism of the deformation and failure of slopes increases with the combination of the development of the fracture zones and toppling deformation. This paper took the toppling bank slope of bridge foundations developed with fault fracture zones in Lancang River as the research object. Through an on-site field survey and geological survey technologies, it identified the distribution range of the fracture zones on the bank slope and determined the characteristics of the rock mass in the fracture zones. A stability evaluation model for the bank slope of the bridge foundations was established using the limit equilibrium method and discrete element method. Based on the two-dimensional limit equilibrium analysis, the potential failure modes of the bank slope were explored, and the stability of the bank slope under bridge loads was calculated. Through the three-dimensional geological model of the bank slope, including the fracture zones and toppling bodies, the three-dimensional discrete element numerical simulation method was adopted to simulate and calculate the deformation and failure process of the bank slope under different bridge loads and working conditions. According to the calculation results, the influence of bridge loads and reservoir water on the stability of the bank slope was analyzed from the perspectives of displacement, plastic zone, stability coefficient, and other factors. The formation process of the plastic zone and the development of the sliding surface were revealed, the incentive mechanism of bridge loads and reservoir water on the deformation and failure of the bank slope was analyzed, and the influence of fault fracture zones on the stability of the bank slope and the development of toppling deformation was determined. The results indicate that the fault fracture zones are important geological structures that affect the deformation and failure of the bank slope as a weak interlayer. Under the influence of bridge loads and reservoir water, the stability of the bank slope is affected by the quality of the rock mass and the development of the fault fracture zones, resulting in the unmet need for safety requirements and maybe leading to instability. Based on the calculation results of the stability evaluation prediction model for the bridge foundation bank slope and the engineering geological conditions, the bridge scheme has been selected.

1. Introduction

The mountainous areas of Southwest China have the characteristics of valley deep-cutting, a large topographic gradient, and complex geological structures, where the numerous high and steep slopes are important potential factors that breed geological disasters and threaten the safety of engineering construction. With the development of infrastructure in mountainous areas in this region, the construction of bridges across valleys has gradually increased. Usually, the bridge foundations of a cross-river bridge are mostly in the form of pile foundations and are located on the high and steep slopes on both sides of the canyon, which brings the enormous engineering load and has a significant impact on the stability of the bridge foundation bank slope. Especially when the bank slopes are developed with fracture zones and toppling deformation development, the combined action of bridge loads and changes in reservoir water levels can cause complex failure modes occurring on slopes. At present, traditional slope stability analysis and evaluation methods find it difficult to meet the evaluation requirements for such bank slopes with complex geological structures and the influence of engineering loads, and there is no recognized and reasonably stable evaluation method.
In recent years, many scholars have conducted relevant research on the stability of the slopes of bridge foundations from different perspectives. Song, Fei, and Ye studied the deformation characteristics, evolution laws, failure mechanisms, potential instability ranges, etc., of different slopes affected by bridge foundations or bridge loads through different numerical simulation methods [1,2,3]. Through on-site geotechnical tests, bridge foundation model simulation tests and on-site monitoring data, the impact of bridge foundations on slope stability was characterized and relevant theories for analyzing the stability of bridge foundation slopes were proposed [4,5,6,7,8].
Also, the development of toppling deformation in many rock slopes causes instability cases, with related studies on the deformation modes and mechanisms of toppling rock masses. Haider and Ning analyzed the evolutionary process of the failure of the toppling slopes through numerical simulation [9,10]. Through centrifugal model tests and similarity tests, some scholars have studied the deformation processes, failure mechanisms, and evolution stages of different types of toppling slopes [11,12,13,14]. Differential settlement at the base of each rock column, a circular shear failure in the continuous mass and the relation of the blocks of the toppling rock mass and the slope geometry were considered to investigate and determine the mechanism of the sliding and toppling [15,16]. There are also related studies to conduct more convenient and high-speed stability analysis of toppling failure using the fictitious horizontal acceleration technique, simplified semi-distinct element algorithm, and step-by-step analytical solutions [17,18,19].
However, there is little research on the failure mechanism and stability analysis of rock bank slopes with toppling deformation development affected by bridge loads. Dai et al. revealed the deformation and failure mechanism and stability control elements of toppling layered rock slopes under bridge loads, evaluated the stability using the limit equilibrium method and vector sum method, and analyzed the expansion law of the plastic zone using the strength reduction method [20]. Huang et al. determined the degree of toppling deformation, explored the failure mode, summarized the stress–strain characteristics through numerical simulation results, and revealed the evolution process of the toppling deformation body [21].
Additionally, rock slopes with fault and fracture zones are widely distributed and there are many studies on related issues. Azarfar et al. used numerical simulation and laboratory measurements to analyze the sensitivity of the stability and faults of rock slopes at different scales [22]. Liu et al. studied the instability mechanism of composite strata slopes with faults and weak layers and analyzed the stress field and damage zone evolution using the finite element strength reduction method [23]. Mehdi provided an empirical relationship for rock slope stability assessment with numerous micro-faults and fracture development [24]. Kumar collected and tested undisturbed soil samples from landslide areas with fracture zones developed and used different methods to conduct dynamic and static analysis of the slope stability [25]. Due to the characteristic of the fracture zones, such as the low bearing capacity, poor deformation resistance, poor permeability, etc., serious treatments are urgently needed. The spatial structure inside the slopes is complex, and the existence of fractured zones can cause damage to the stability of the slope [26]. Some scholars selected different treatment methods for slopes with fault fracture zones to prevent slope instability from the perspectives of the occurrence, location, and geometric relationship with slopes [27,28,29,30].
Based on the content of the literature review, it can be concluded that some studies only simplified the geological structures of slope numerical analysis models or analyzed the results of two- or three-dimensional numerical simulations, leading to the uncertainty of the analysis results and errors between the analysis results and the true state. The stability of slopes in most studies is only influenced by a single factor, such as toppling rock masses, fault fracture zones, or changes in reservoir water levels, which makes it difficult to reflect the complex deformation and failure mechanisms of the slope with complex terrain and geological structures.
The object of this study is a high and steep bank slope of bridge foundations with a complex geological structure, which has the development of fault fracture zones and toppling deformation, while toppling deformation and fault fracture zones are common geological structures worldwide, and the special mechanical properties can accelerate the failure and deformation of slopes. The object is also influenced by the combined effects of bridge foundation loads and reservoir water fluctuations. This study is of great significance in exploring the effects of fault fracture zones on slope stability, evaluating the stability of toppling rock bank slopes, analyzing the deformation and failure mechanisms of slopes of bridge foundations, ensuring the safe construction and normal operation of bridge engineering in canyon areas and providing experiences of the selection of the layout of the bridge foundations in similar engineering geological conditions and environments. In addition, the research ideas can provide references for similar projects and an effective tool for the establishment of a stability evaluation model for the toppling bank slopes with fracture zones developed under engineering loads.
Therefore, based on the existing research and the complexity and particularity of the research object, the main objectives of the paper are as follows:
Based on the geological structure of the bank slope, establish a geological model that is consistent with the real geological conditions, select a reasonable method for applying bridge loads, and establish an effective numerical analysis model for the bank slope based on the limit equilibrium method and discrete element method.
Based on engineering geological analysis methods and the special properties of fault fracture zones, analyze the potential failure modes and deformation mechanisms of bank slopes under the influence of external factors.
Based on numerical analysis results and analysis of the deformation and failure mechanism of the bank slope, summarize the incentive mechanisms of bridge loads and reservoir water on the deformation and failure of the bank slope, and propose a comprehensive evaluation method for the stability of the toppling bank slope with the development of fault fracture zones under diverse influencing factors.

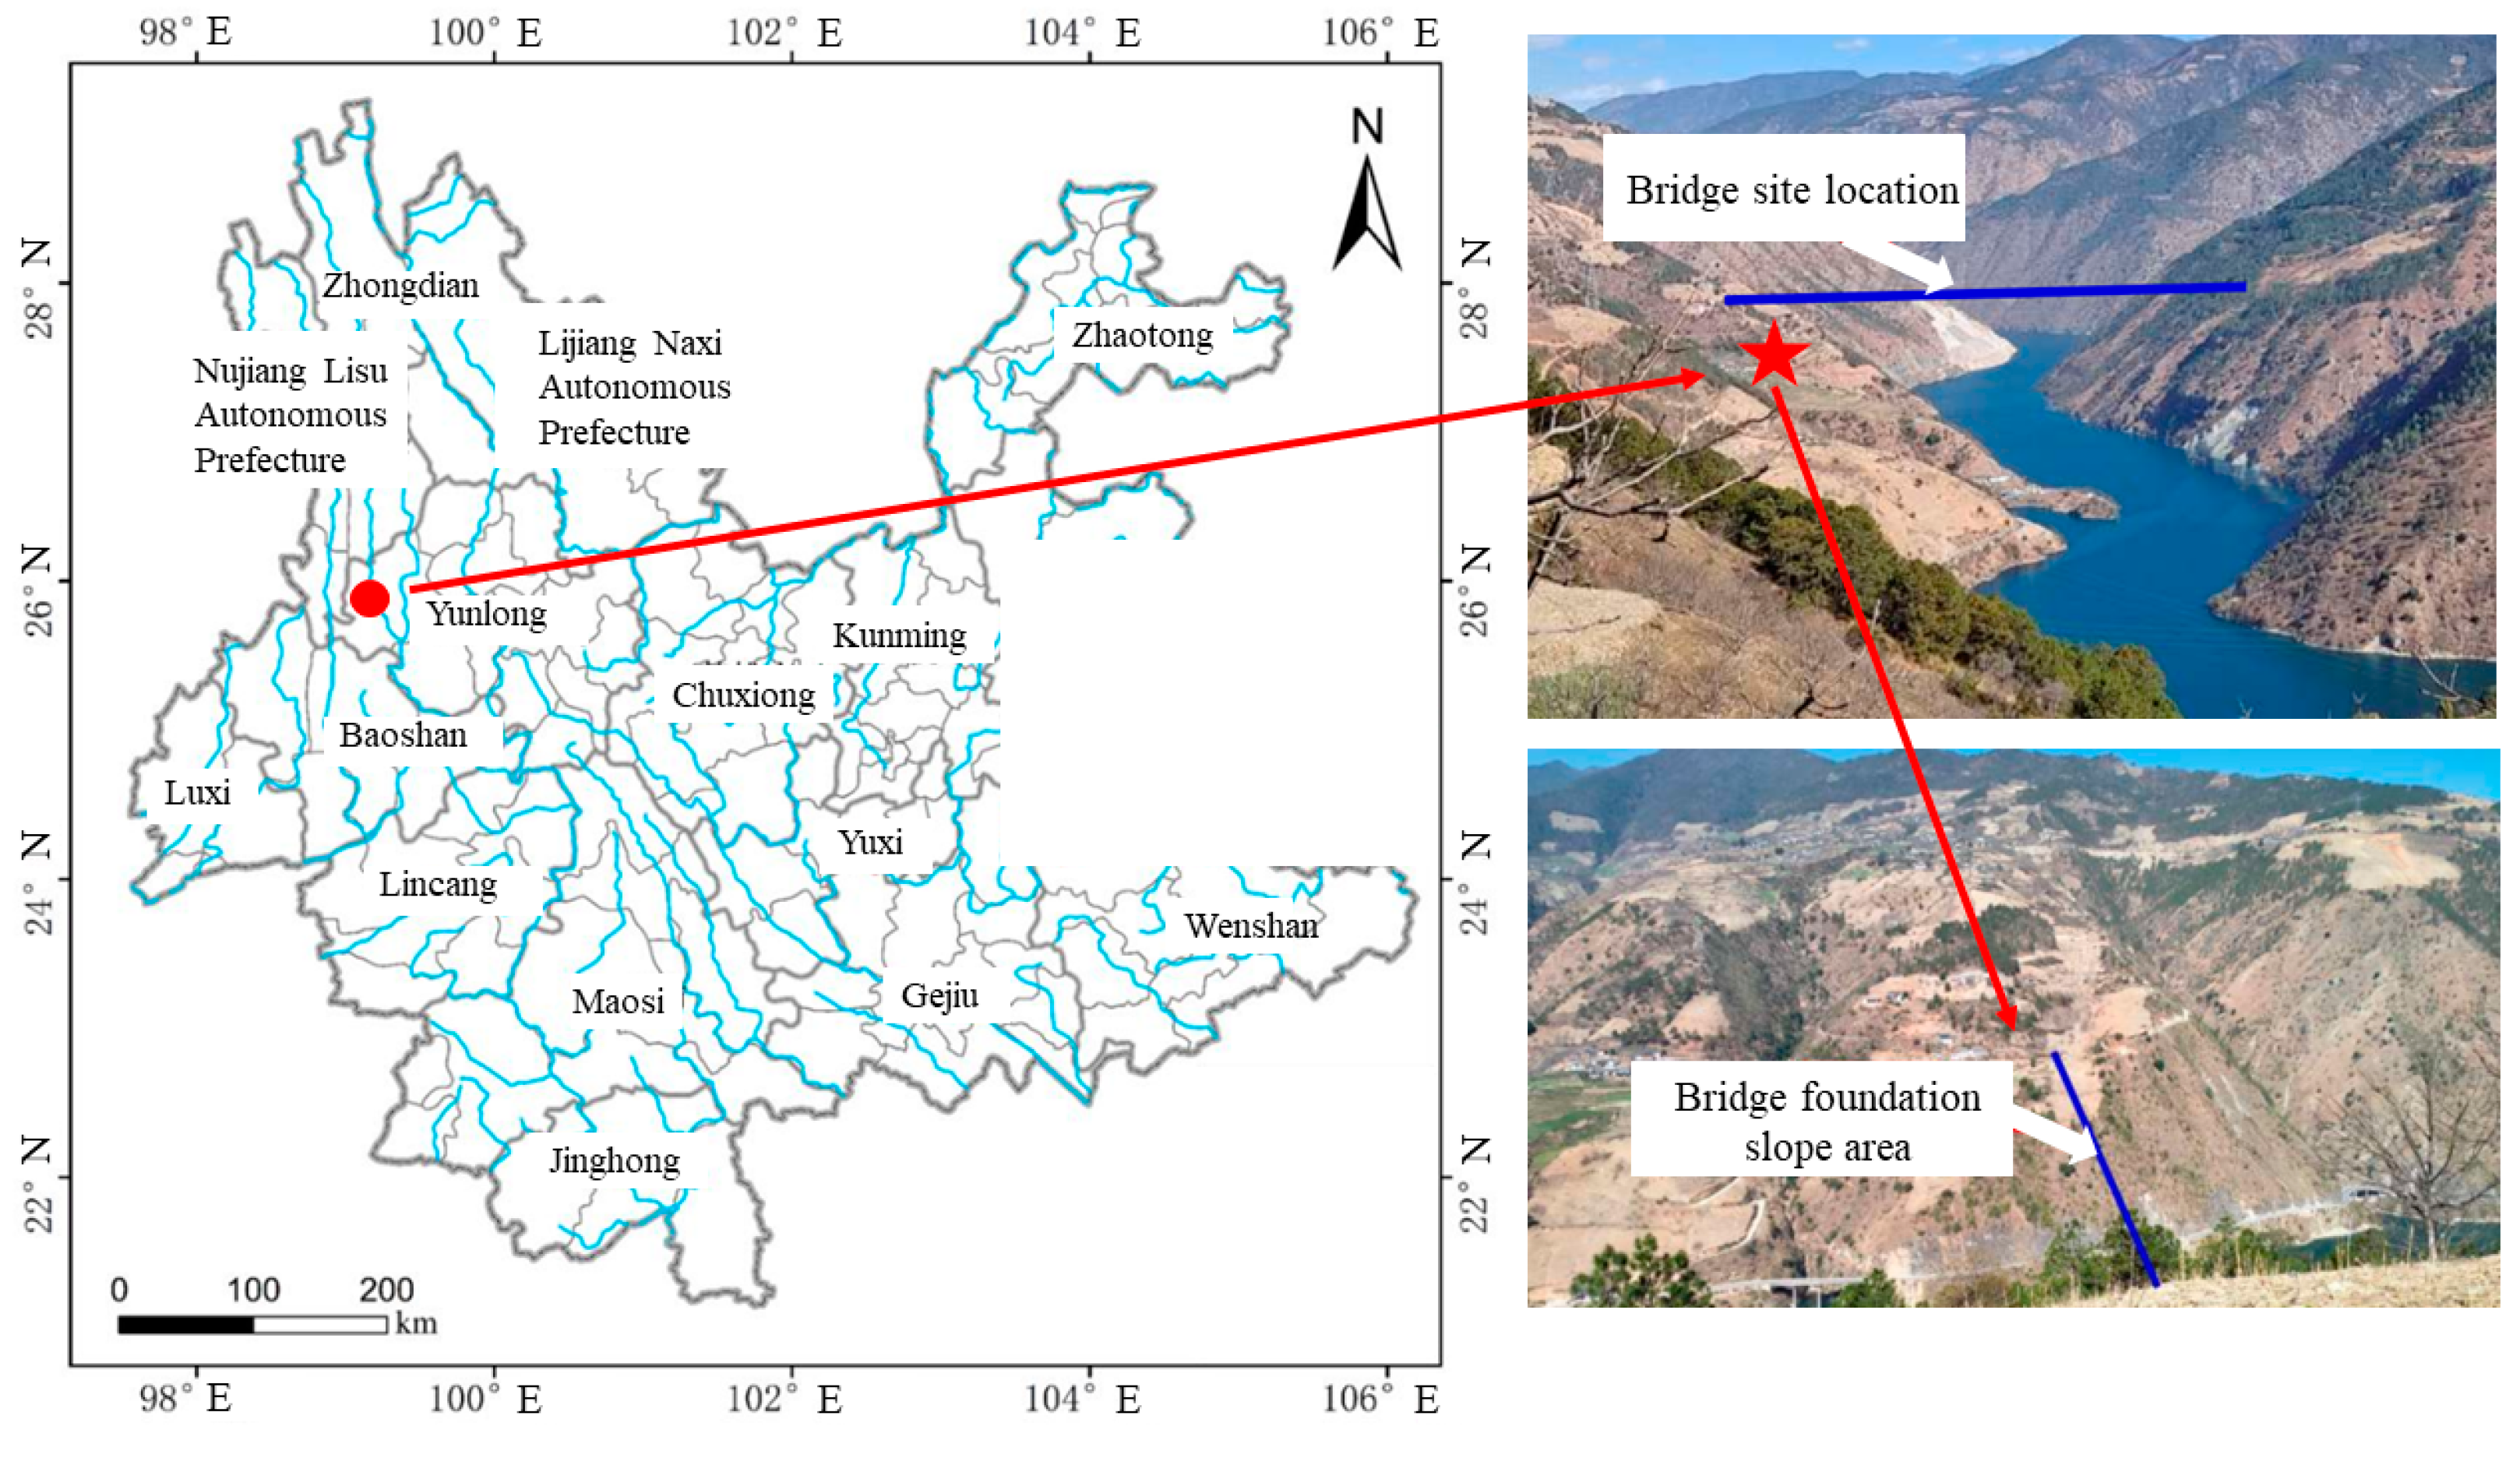
2. Overview of the Study Area

2.1. Topography

This paper takes the toppling bank slope of bridge foundations with fault fracture zones developed on the right bank on the Lancang River as the research object. The study area is located in Yunlong County, Yunnan Province, with high mountains and deep valleys, well-developed water systems, deep rivers, and steep terrain. The bank slope of the bridge foundations is located about 5 km upstream of the Miaowei Hydropower Station, where the mountains ranges are mostly oriented in a north–south direction (Figure 1). The Lancang River flows from north to south through the bridge site, with a normal reservoir water level of 1408 m and a dead water level of 1398 m, and the normal fluctuation range of the water level is 10 m. And the river surface is about 280 m wide.
The terrain of the bank slope is slightly steep in the front, steep and gentle in the middle, and steep in the rear, with a longitudinal slope of 37°. It presents a concave terrain, with a gully in the middle and high sides horizontally. The terrain is divided by the riverside highway and village road. The front part of the bank slope is located below the riverside road, mostly underwater, with a slope of 37–50°. The middle part of the bank slope is between the riverside road and the village road. The construction of the riverside highway forms a cut slope with a height of 28.1 m and a slope angle of about 73–75°, while the slope of the cut slope is 39–26° upwards. The village road is located at the rear of the bank slope, with a slope of 37° at the rear of the bank slope. The terrain changes in the bank slope are shown in Figure 2.

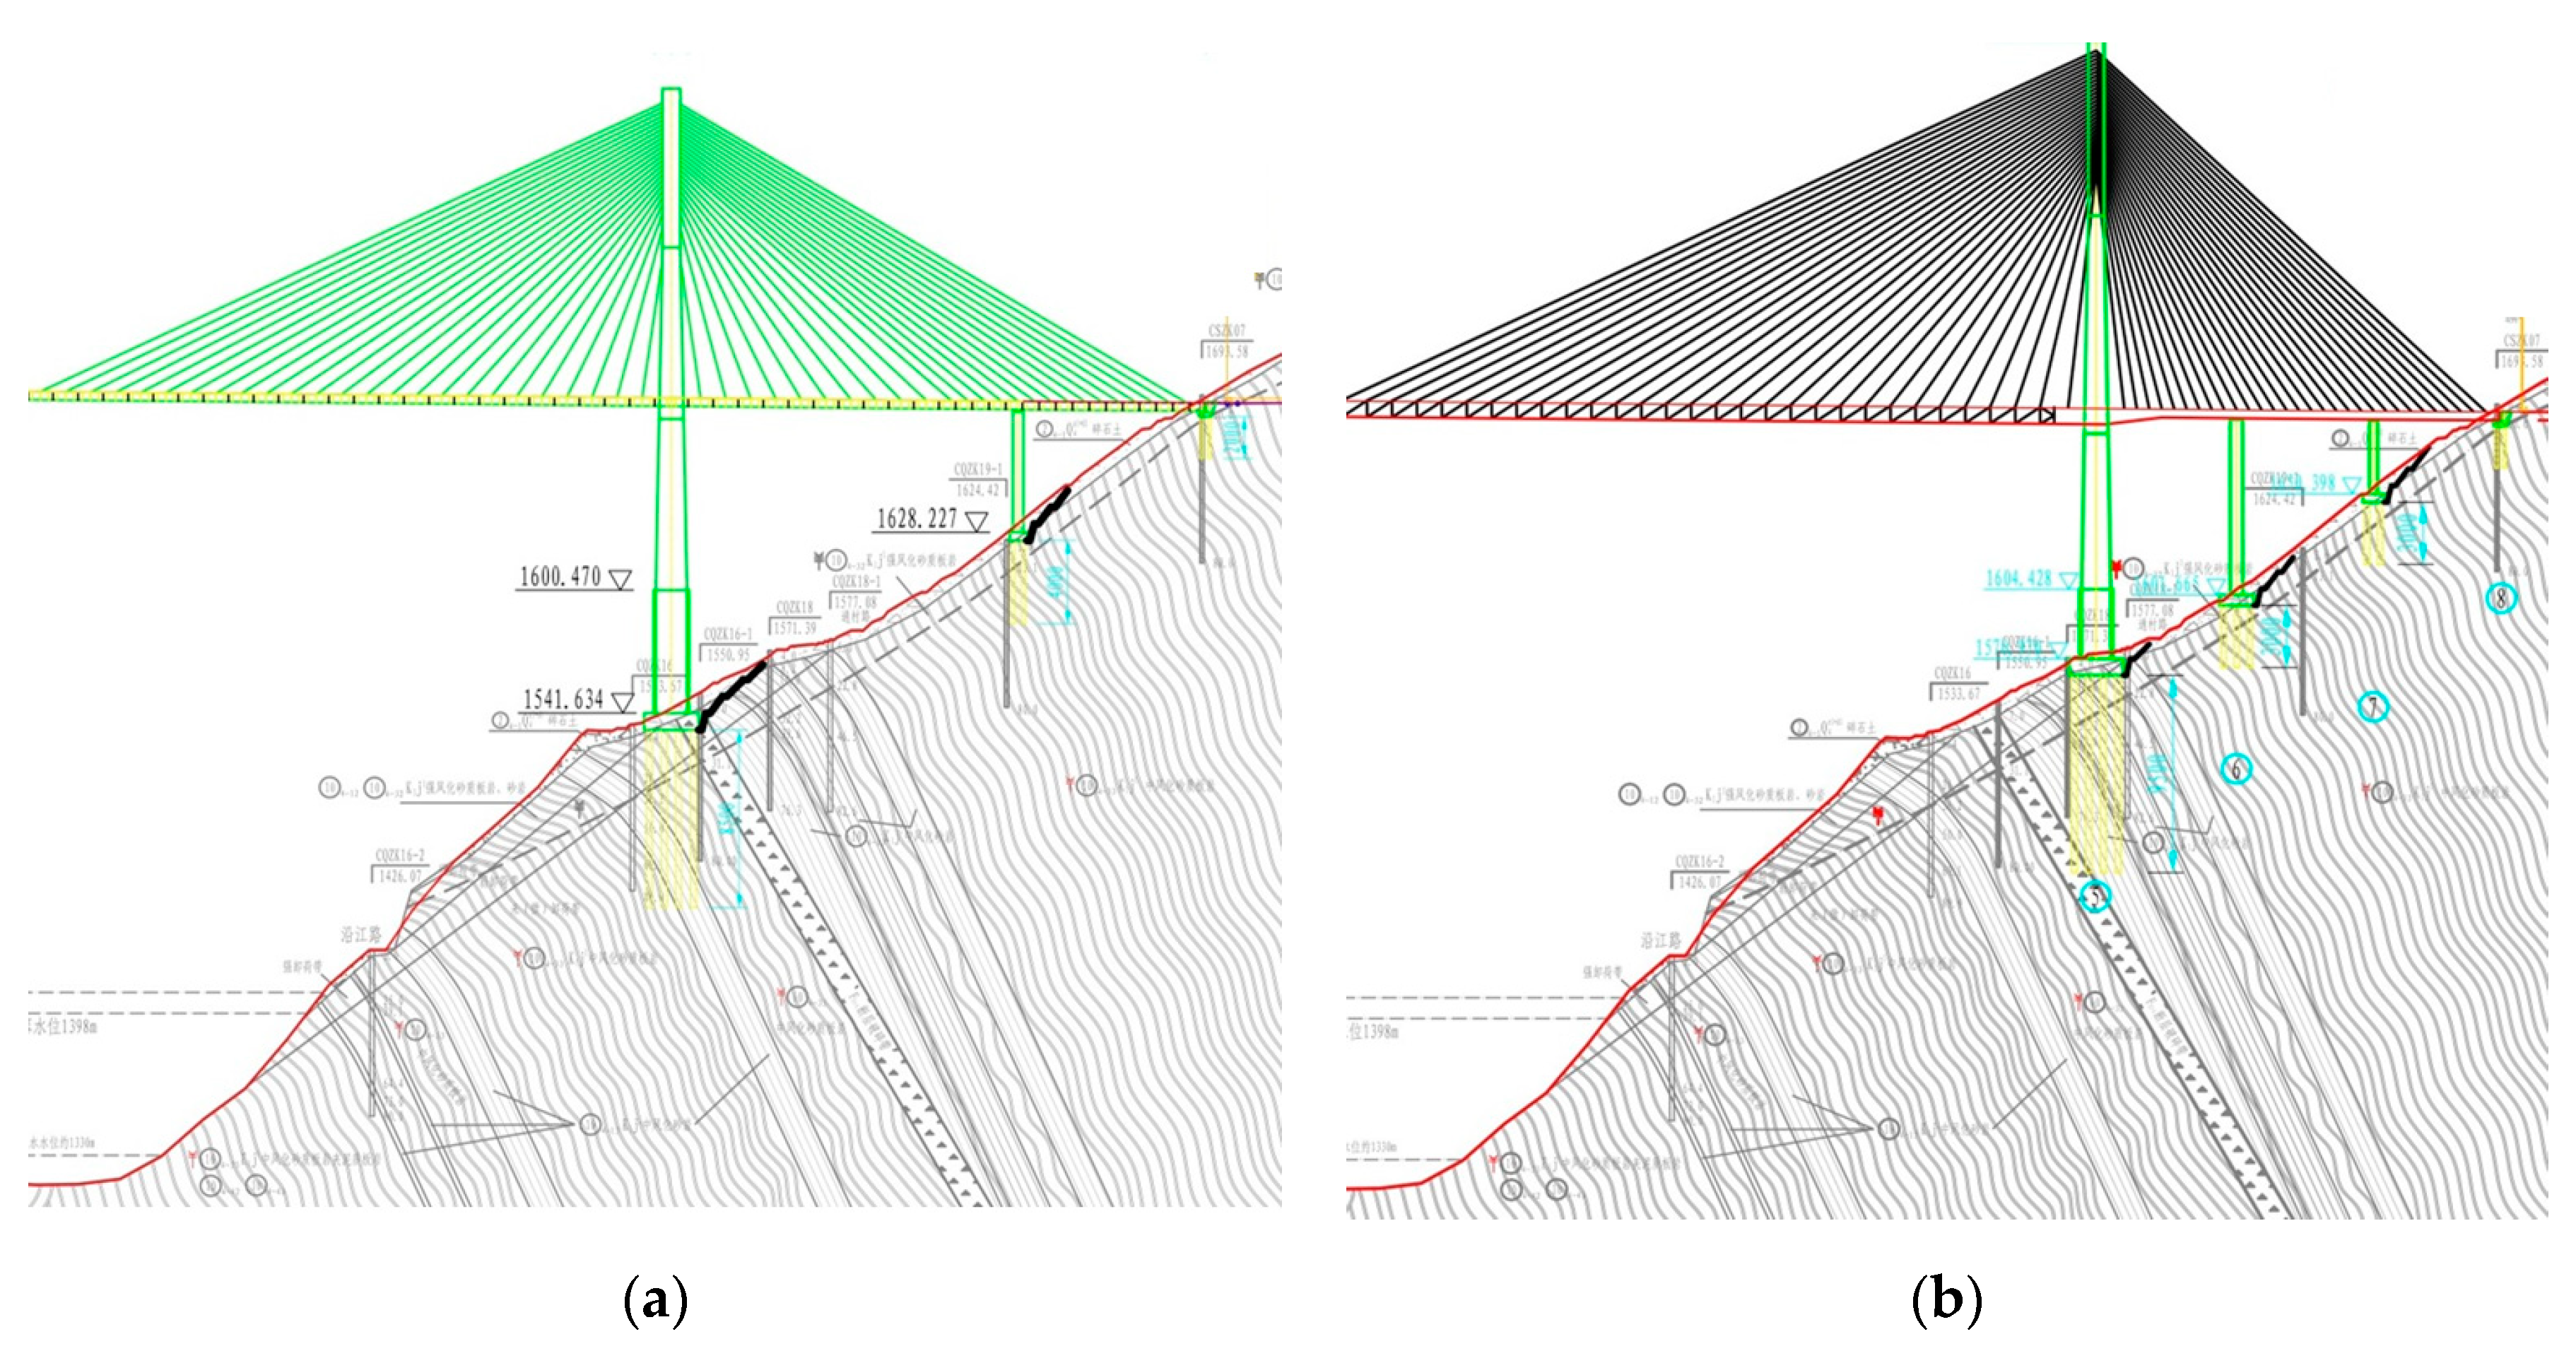
2.2. Bridge Construction Schemes for the Research Area

It is proposed to adopt the double-tower composite-girder cable-stayed bridge with the main span with the length of 495 m and to use the bored cast-in-place pile-group pile foundation with a diameter of 2.5 m. There are two schemes for the bridge foundations’ layout. The bridge spans are arranged as 90.0 + 166.0 + 628.0 + 166.0 + 90.0 = 1140.0 m and 61.5 + 66.0 + 67.5 + 750.0 + 67.5 + 66.0 + 61.5 m = 1140.0 m of each scheme. The bridge foundations are arranged in different toppling deformation areas, but different from the spatial location of the fault fracture zones on the bank slope, with the main piers located on the gentle part in the middle and the auxiliary piers and abutments at the rear of the slope. The foundation layouts and bridge loads of different bridge schemes are shown in Table 1. The layout of the bridge foundations under different bridge schemes is shown in Figure 3.

2.3. Geological Characteristics

2.3.1. Lithology

According to the geological data of the research area, the rock strata on the bank slope tend toward the inner slope, with an attitude of 270–280°∠36–65°, while there are significant changes in the tendency and dip angles due to the strong unloading and toppling deformation. Also, it can be concluded that the study area has fewer strata and a relatively single lithology based on the on-site investigation and the rock core. A schematic diagram of the rock core drilled on the bank slope is shown in Figure 4. Through the rock core, the inclination angle of the rock layer changes from gentle to steep with depth, with a layer thickness of 0.1–0.4 m. The exposed surface rock layer is partially open, with an openness of 3–5 mm and no filling. The bank slope is distributed from top to bottom, including Quaternary eluvial and diluvial silty clay, crushed stone soil, sandy slate interbedded with muddy slate, and metamorphic sandstone. The stratigraphic information and lithological characteristics of the bank slope are shown in Table 2. Based on the profile information of the bank slope shown in Figure 2, it can be seen that the bank slope is mainly composed of sandy slate interbedded with argillaceous slate and locally thick metamorphic sandstone, exhibiting strong to moderate weathering.

2.3.2. Fault Fracture Zones

According to the geological map of the bridge site area, on-site engineering geological survey, geophysical exploration, and drilling results of the bank slope, it is known that there is mainly an F11 fault developed on the bank slope as an active compressive reverse fault with the width of about 25 m. The lithology of the hanging wall of the F11 fault is composed of slate and schist belonging to J2h, while that of the footwall wall is composed of sandy mudstone slate and metamorphic sandstone belonging to K1j. The F11 fault has an attitude of 265°∠50°, while there are no obvious signs of surface exposure. At the same time, the drilling results indicate that there are small-scale secondary faults and joint zones developed in the footwall of the F11 fault and the lower part of the bank slope, which are consistent with the F11 attitude. The rock mass in the fault fracture zones exposed by the rock core drilling is fragmented, in the form of fault breccia and fault mud (Figure 5). The specific description of the rock mass in the fault fracture zones is shown in Table 3.

2.3.3. Hydrogeological Conditions

The study area has a subtropical climate. The average annual precipitation is 870.7 mm, with 72.3% rainfall concentrated from June to October each year. The groundwater on the bank slope is greatly affected by the water storage of the Miaowei Hydropower Station. Before the reservoir impoundment, the Lancang River was the lowest reference level for the bank slope in the research area, while groundwater was mainly supplied by atmospheric precipitation. After the reservoir impoundment, the water level of the Lancang River rose and was higher than the groundwater level on the bank slope, which led to the fact that the groundwater was mainly supplied by the reservoir water, followed by atmospheric precipitation.
The groundwater types are pore phreatic water and fissured phreatic water, according to the burial conditions and storage medium. Pore phreatic water exists in the loose layers of the Quaternary system and varies significantly with the seasons, while fissured phreatic water occurs in the cracks, fault structures, and structural planes of the rock mass on the bank slope. According to the monitoring deformation data, it can be seen that there is no obvious deformation phenomenon on the bank slope near the bridge site before the reservoir impoundment. The deformation mainly occurred after 2018 (Figure 6), indicating that the stability of the bank slopes in this area is significantly affected by the rise of the reservoir water.

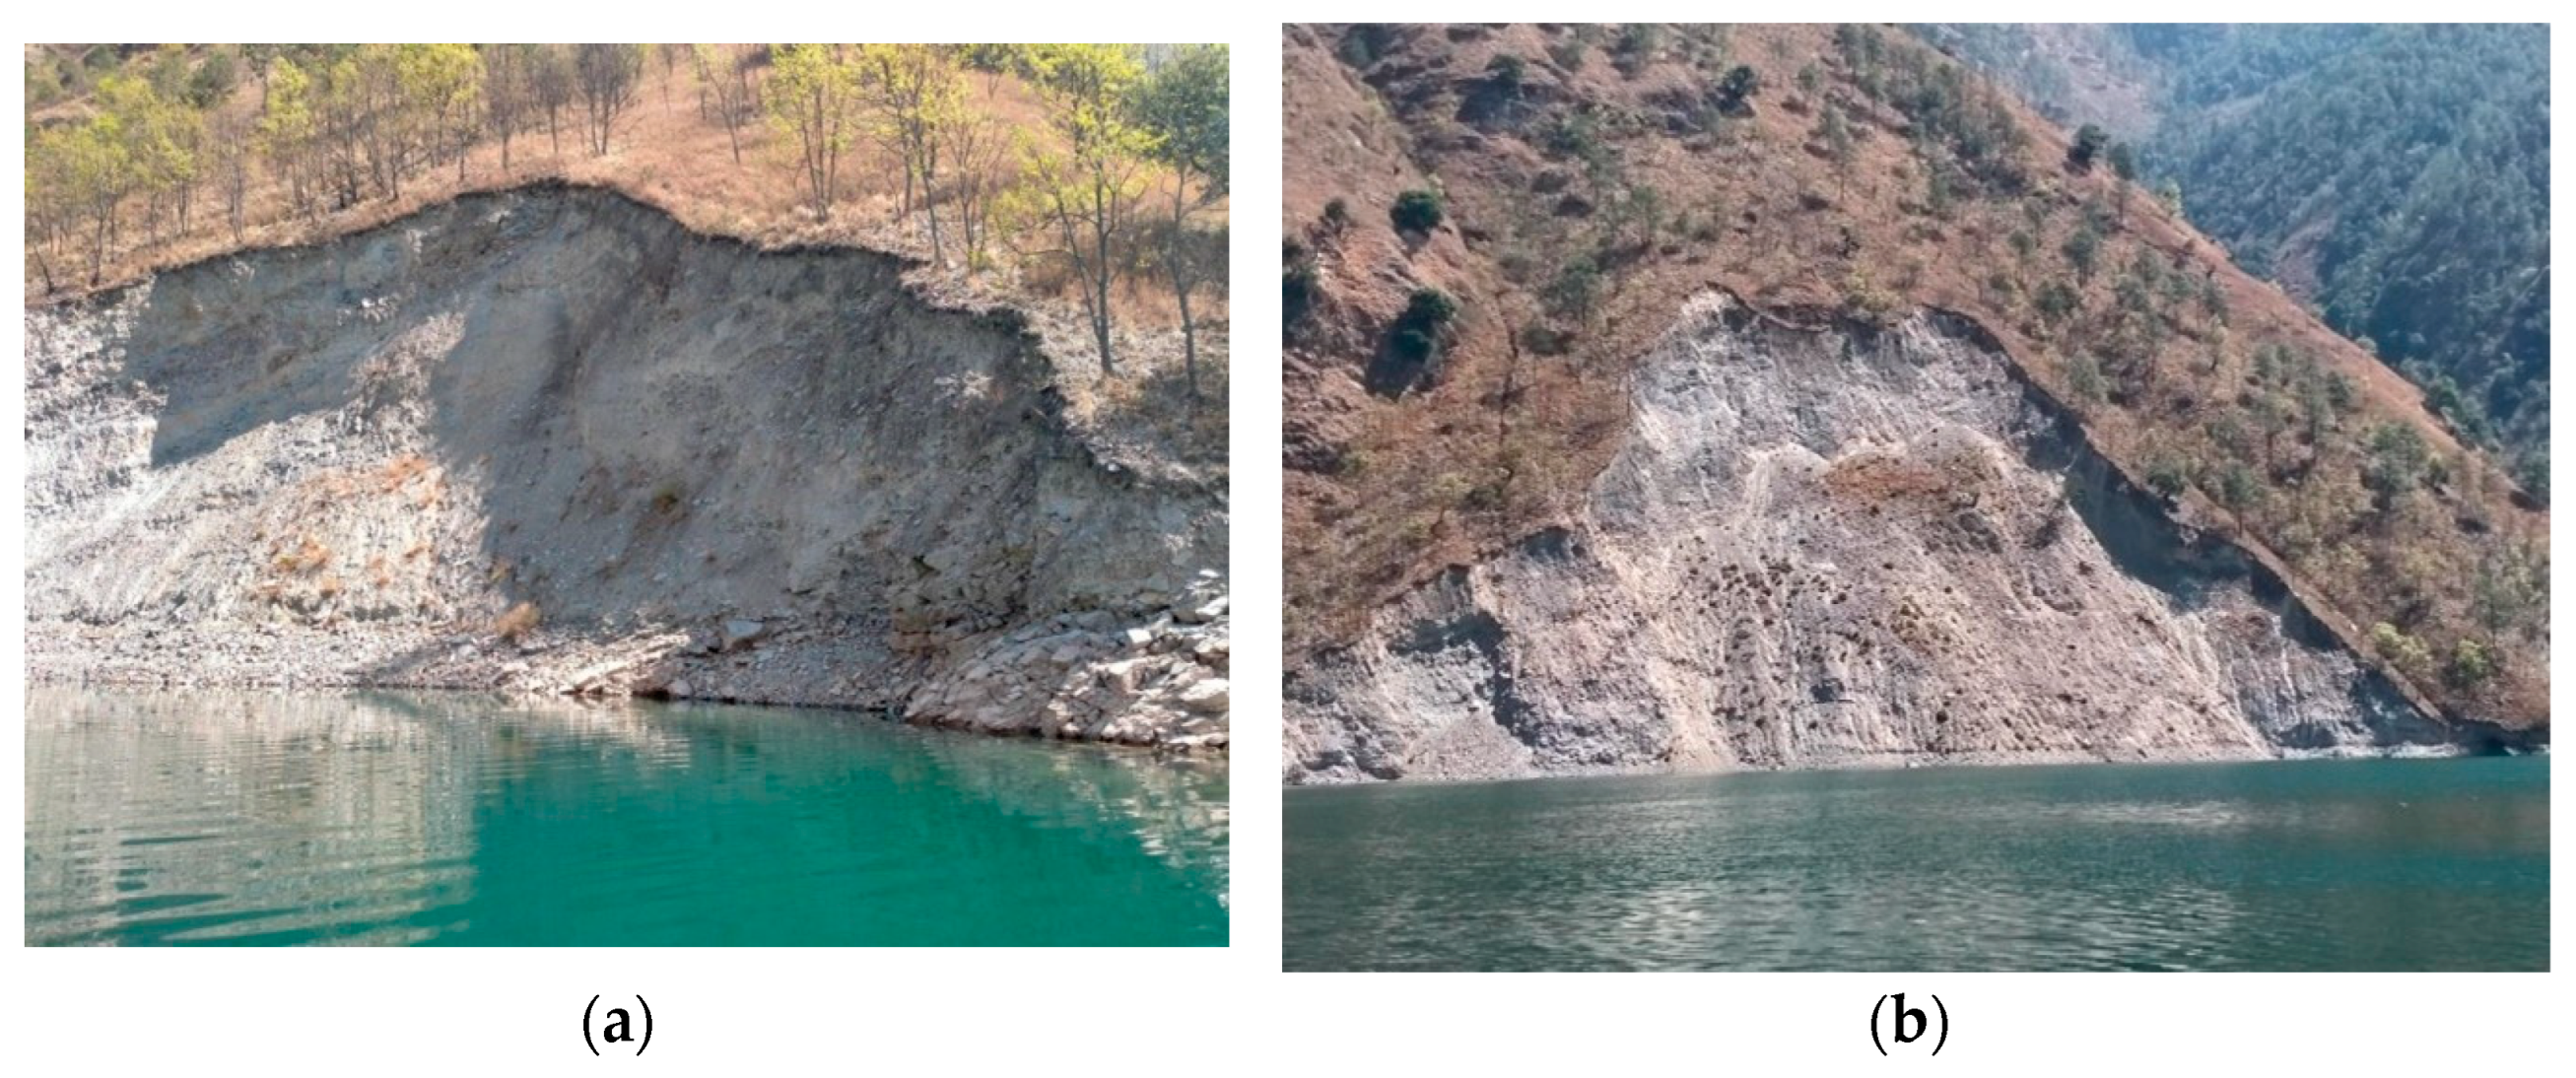
2.3.4. Geological Structure Characteristics of the Bank Slope

Based on the on-site investigation, the distribution range and characteristics of the weathering zones and unloading zones on the bank slope were identified. Meanwhile, according to the five indicators, including the dip angle difference, maximum tension, unit tension within the layer, unloading degree, and weathering degree proposed by Huang [11], the different toppling deformation zones of the slope were determined (Figure 7a).
Due to the influence of structural planes such as joints and bedding planes, the structure of the bank slope became relatively complex. The development of toppling rock mass further damaged the internal structure and integrity of the bank slope. Meanwhile, the unique characteristics of the fault fracture zones further complicated the spatial structure and geometric characteristics of the bank slope. Therefore, after determining the developing details and other information of the fault fracture zones, the particular geological structure of the bank slope is obtained (Figure 7b).

3. Methodology

3.1. Working Conditions

To analyze the stability, deformation, and failure process of the bank slope under different external conditions, three working conditions were set for the numerical simulation research as the follows:
  • Natural working conditions: the simulation and analysis of the natural bank slope with bridge operation.
  • Rainstorm conditions: The simulation and analysis of the bank slope under heavy rainfall with bridge operation;
  • Rainstorm + earthquake conditions: the simulation and analysis of the bank slope under seismic loads during heavy rainfall with bridge operation.

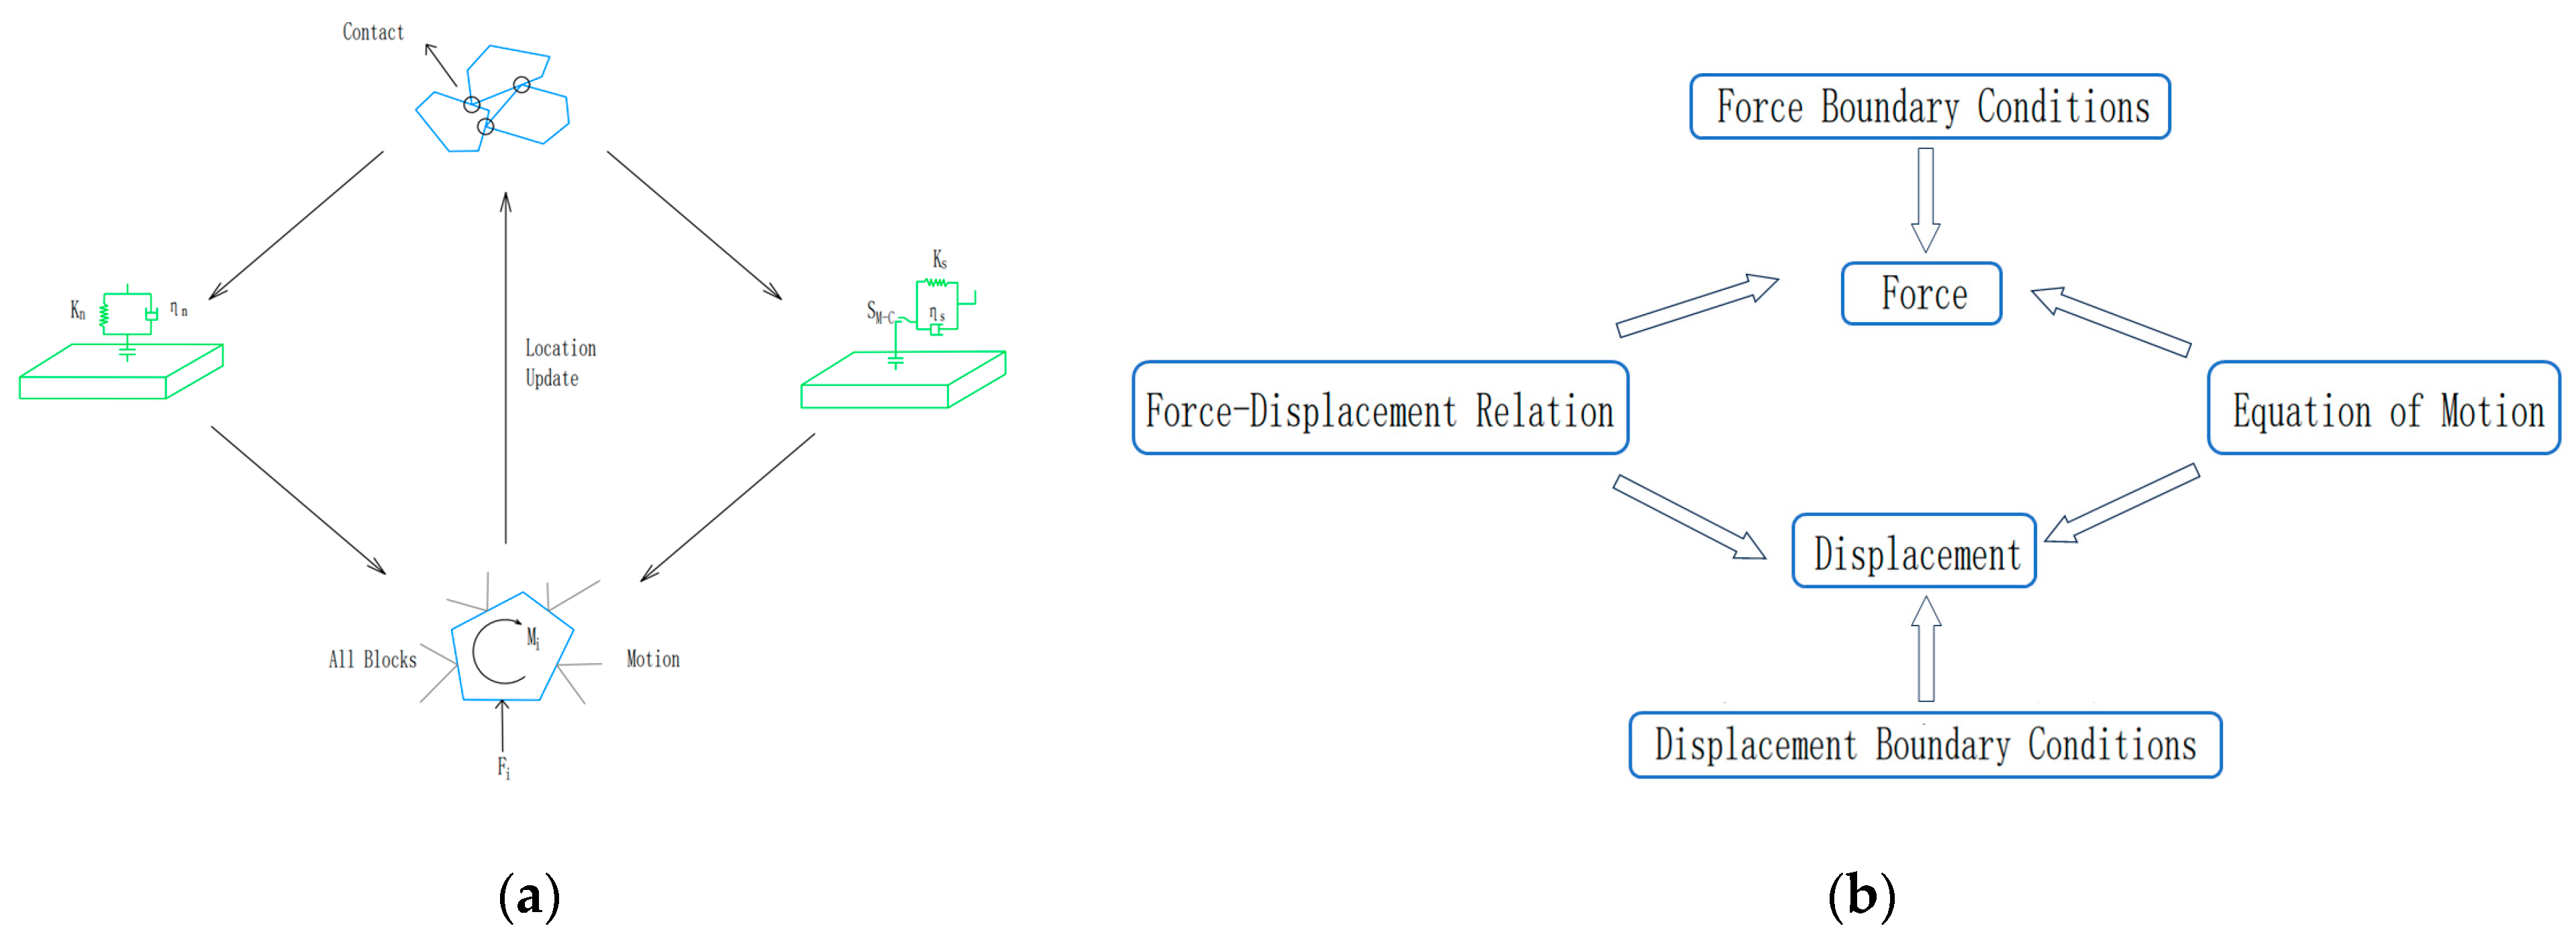
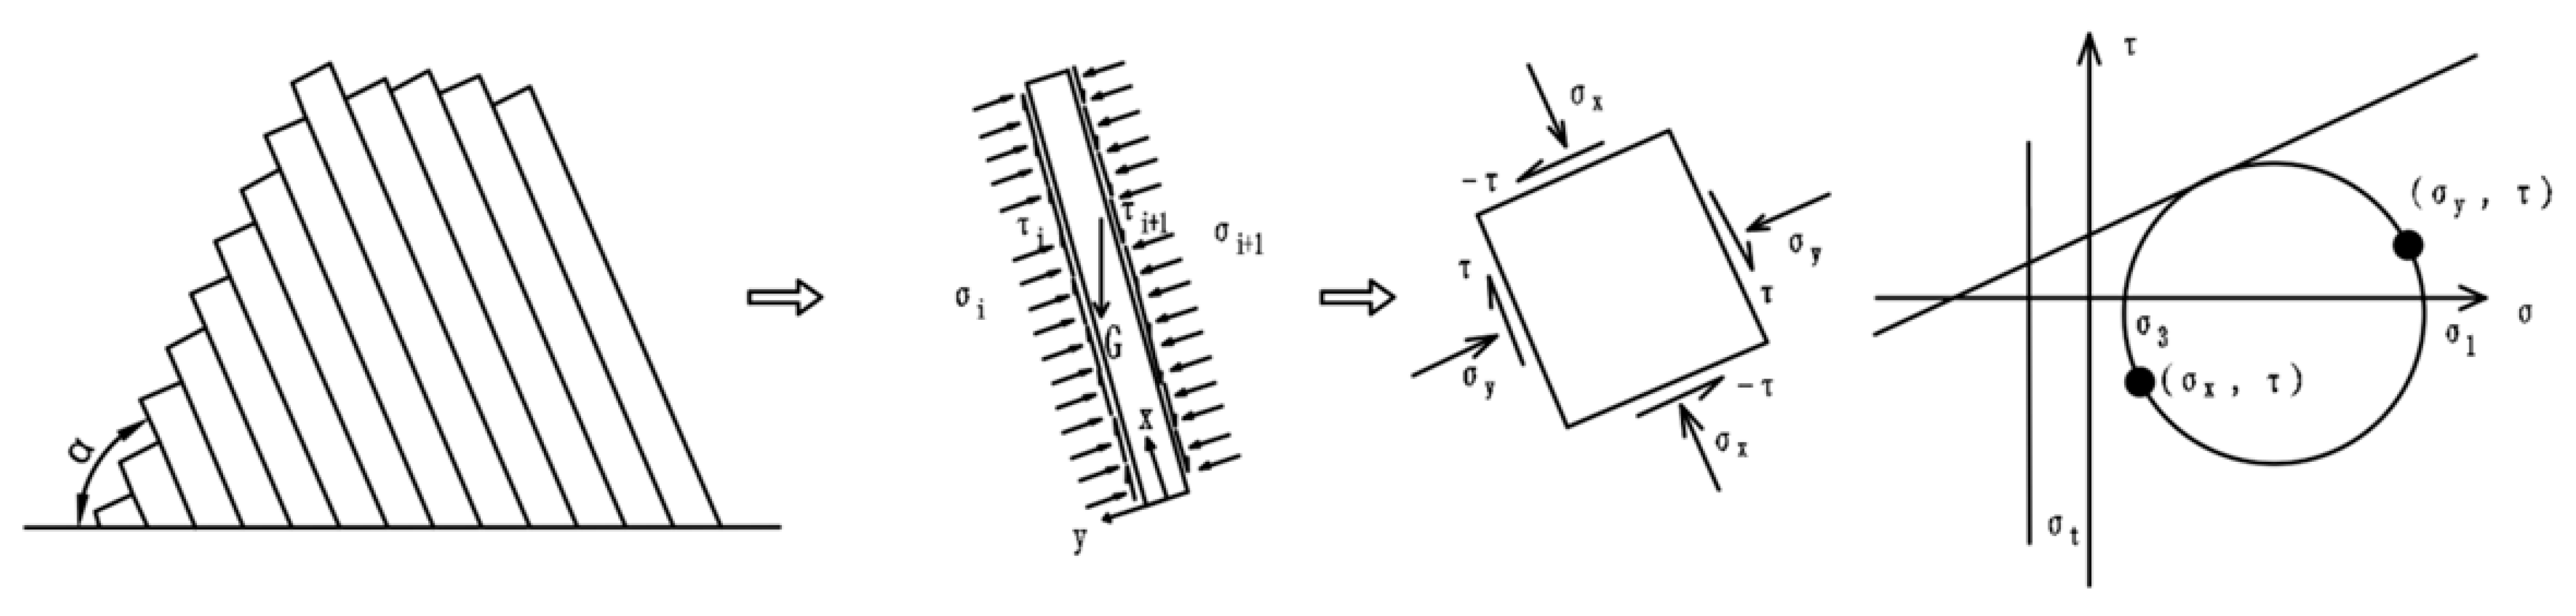
3.2. GeoStudio Theory and Two-Dimensional Model Establishment

The GeoStudio 2018 software can use the functions of different modules and solving methods to simulate various types or boundary conditions of slope geological models as a whole or locally. It combines the numerical analysis methods based on the finite element method with the limit equilibrium method using the Janbu, Bishop and Morgenstern methods and so on. The SLOPE/W module uses the limit equilibrium method to achieve slope stability analysis and calculation under different loading methods while analyzing the distribution of pore water pressure in the bank slope.
In order to calculate and evaluate the stability of the bank slope of the bridge foundation under different operating conditions, based on the SLOPE/W module in GeoStudio 2018, the Bishop method was adopted. Relevant calculation models were established with the size of 750 m in length and 300 m in height based on the different bridge schemes (Figure 8).

3.3. 3DEC Theory and Three-Dimensional Model Establishment

In this regard, 3DEC software (v7.0) is a three-dimensional numerical simulation software developed by ITASA based on the Lagrangian computational system, which adds the simulation of the discontinuous mechanical behavior of the contact faces in mechanics and has strong universal analysis capabilities in the field of continuum mechanics.
The rock mass becomes incomplete due to the existence of structural planes. When the displacement constraints or external forces change, the rock block will experience displacement and spatial position changes under gravity and external forces, resulting in adjacent rock blocks bearing pressure and overlapping. As time goes on, the position of more rock blocks will change, causing movement and rotation until destroyed. Therefore, 3DEC software is very suitable for calculating the displacement and deformation of the bank slope of the bridge foundation in this paper.
In the process of alternating cycles of discrete elements, displacement force-based physical equations are used for adjacent rock blocks, while Newton’s second law is used for other rock blocks. In physical models, the increment of the sub-contact displacement can be used to calculate the increment of the elastic force. The increment of the normal force vector and shear force vector between blocks can be expressed as Equations (1) and (2):
F n = u n K n
F s = u s K s
where u n is the normal displacement increment, K n is the normal stiffness coefficient, u s is the tangential displacement increment, and K s is the tangential stiffness coefficient.
By solving the resultant force and moment on the rock block, the acceleration and angular velocity of the rock block are calculated while the internal displacement and velocity are ultimately obtained. Set the acceleration in the x-direction, as shown in Equation (3), and integrate Equation (3) to obtain Equation (4):
u x = F x / m
u x t 1 = u x t 0 + u x Δ t
where F x is the resultant force in the x direction, m is the mass of the rock block, t 0 is the starting time, Δ t is the time step, and u x presents displacement.
The mathematical model for the cyclic calculation and contact, as well as the cyclic model for the force and displacement calculation, in 3DEC software are shown in Figure 9.
Therefore, 3DEC was used to simulate and calculate the stability of the bank slope. Based on the on-site geological survey results, we establish a three-dimensional geological model for specific calculations (Figure 10). The geological model is 418 m in width in the x-direction, 782 m in length in the y-direction and 500 m in height in the z-direction. Due to the complexity of the geological structure of the bank slope and the setting of the bridge foundations, the following assumptions are made before the simulation to ensure the true stress state of the bank slope as possible:
  • The calculation model is mainly composed of the bank slope rock mass and the relevant units of the bridge foundations. The loads of the bridge foundations are applied in the form of static loads on the bridge foundations units—the maximum vertical loads are applied on the surface of bridge piers, while the horizontal loads are applied on the side of the bridge piers along the bridge direction.
  • The infiltration forces generated by rainfall and the fluctuating water level are loaded for calculation after conversion. Especially, the range of the fluctuating water level is determined by setting the water level lines in the model.
  • The rock mass on the bank slope satisfies the ideal elastic–plastic constitutive relationship and the yield condition is the Mohr Coulomb condition, while Coulomb slip models are set for structural planes such as rock layers and faults.
  • The mechanical parameter properties are assigned to the rock mass and structural plane, while the boundaries for the displacement and stress boundaries are set around the model, and the in situ stress is set inside the model.

4. Research Results

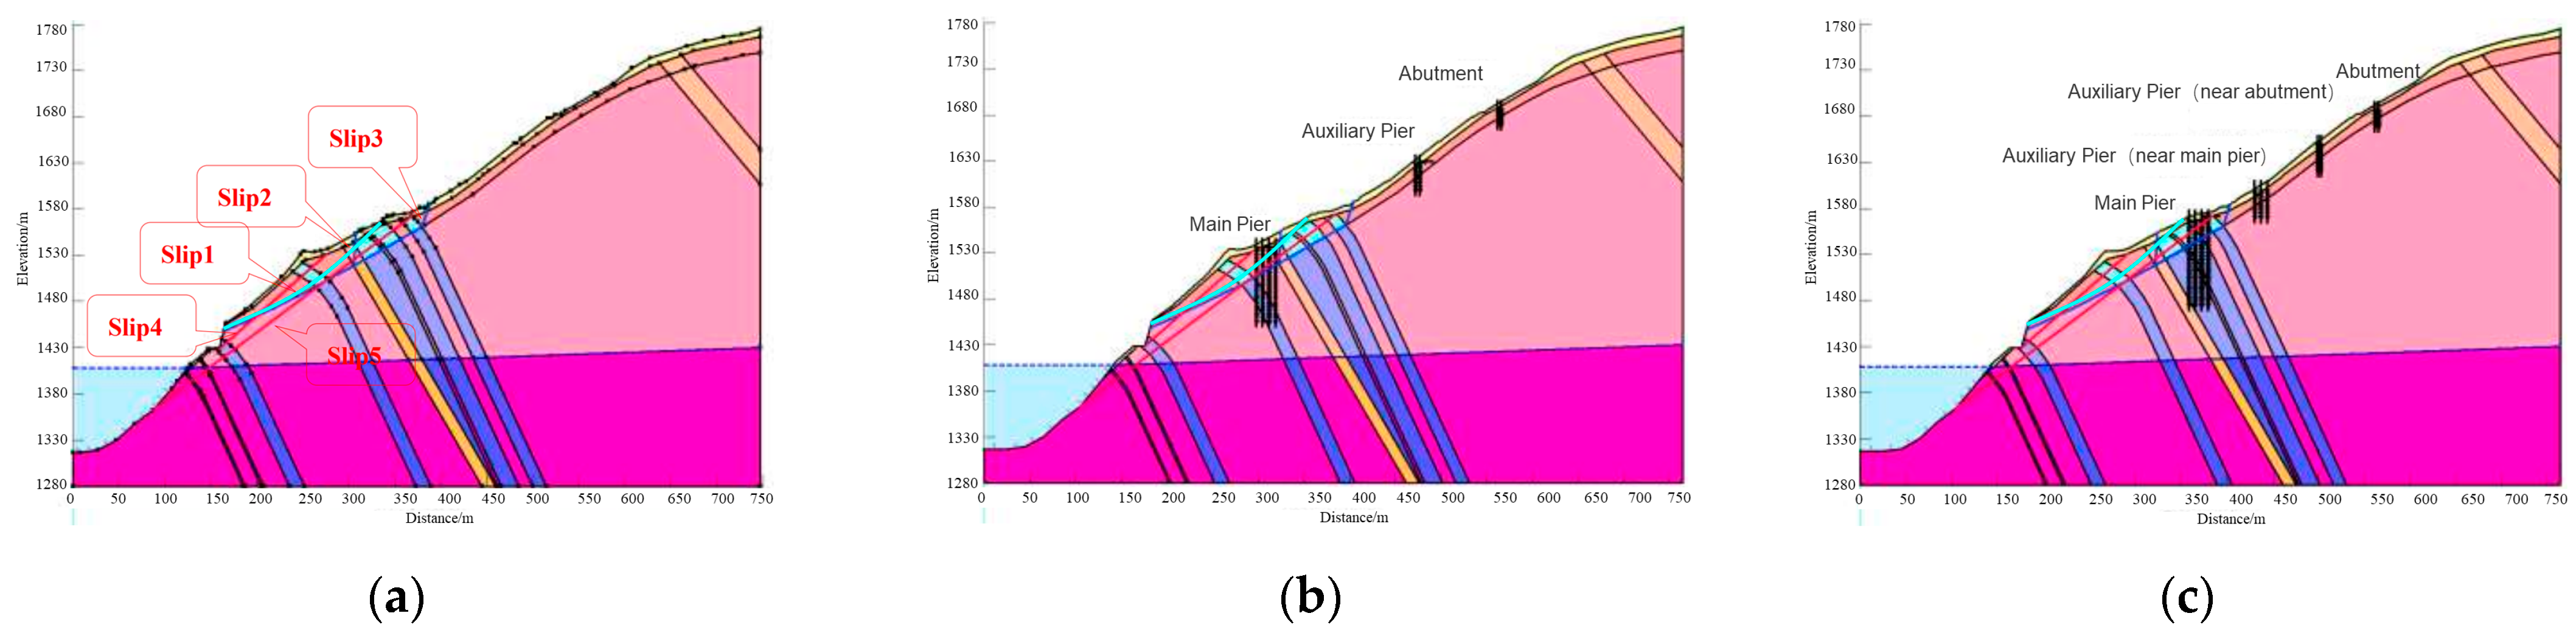
4.1. Two-Dimensional Limit Equilibrium Analysis of Toppling Bank Slope with Fault Fracture Zones Developed under Bridge Loads

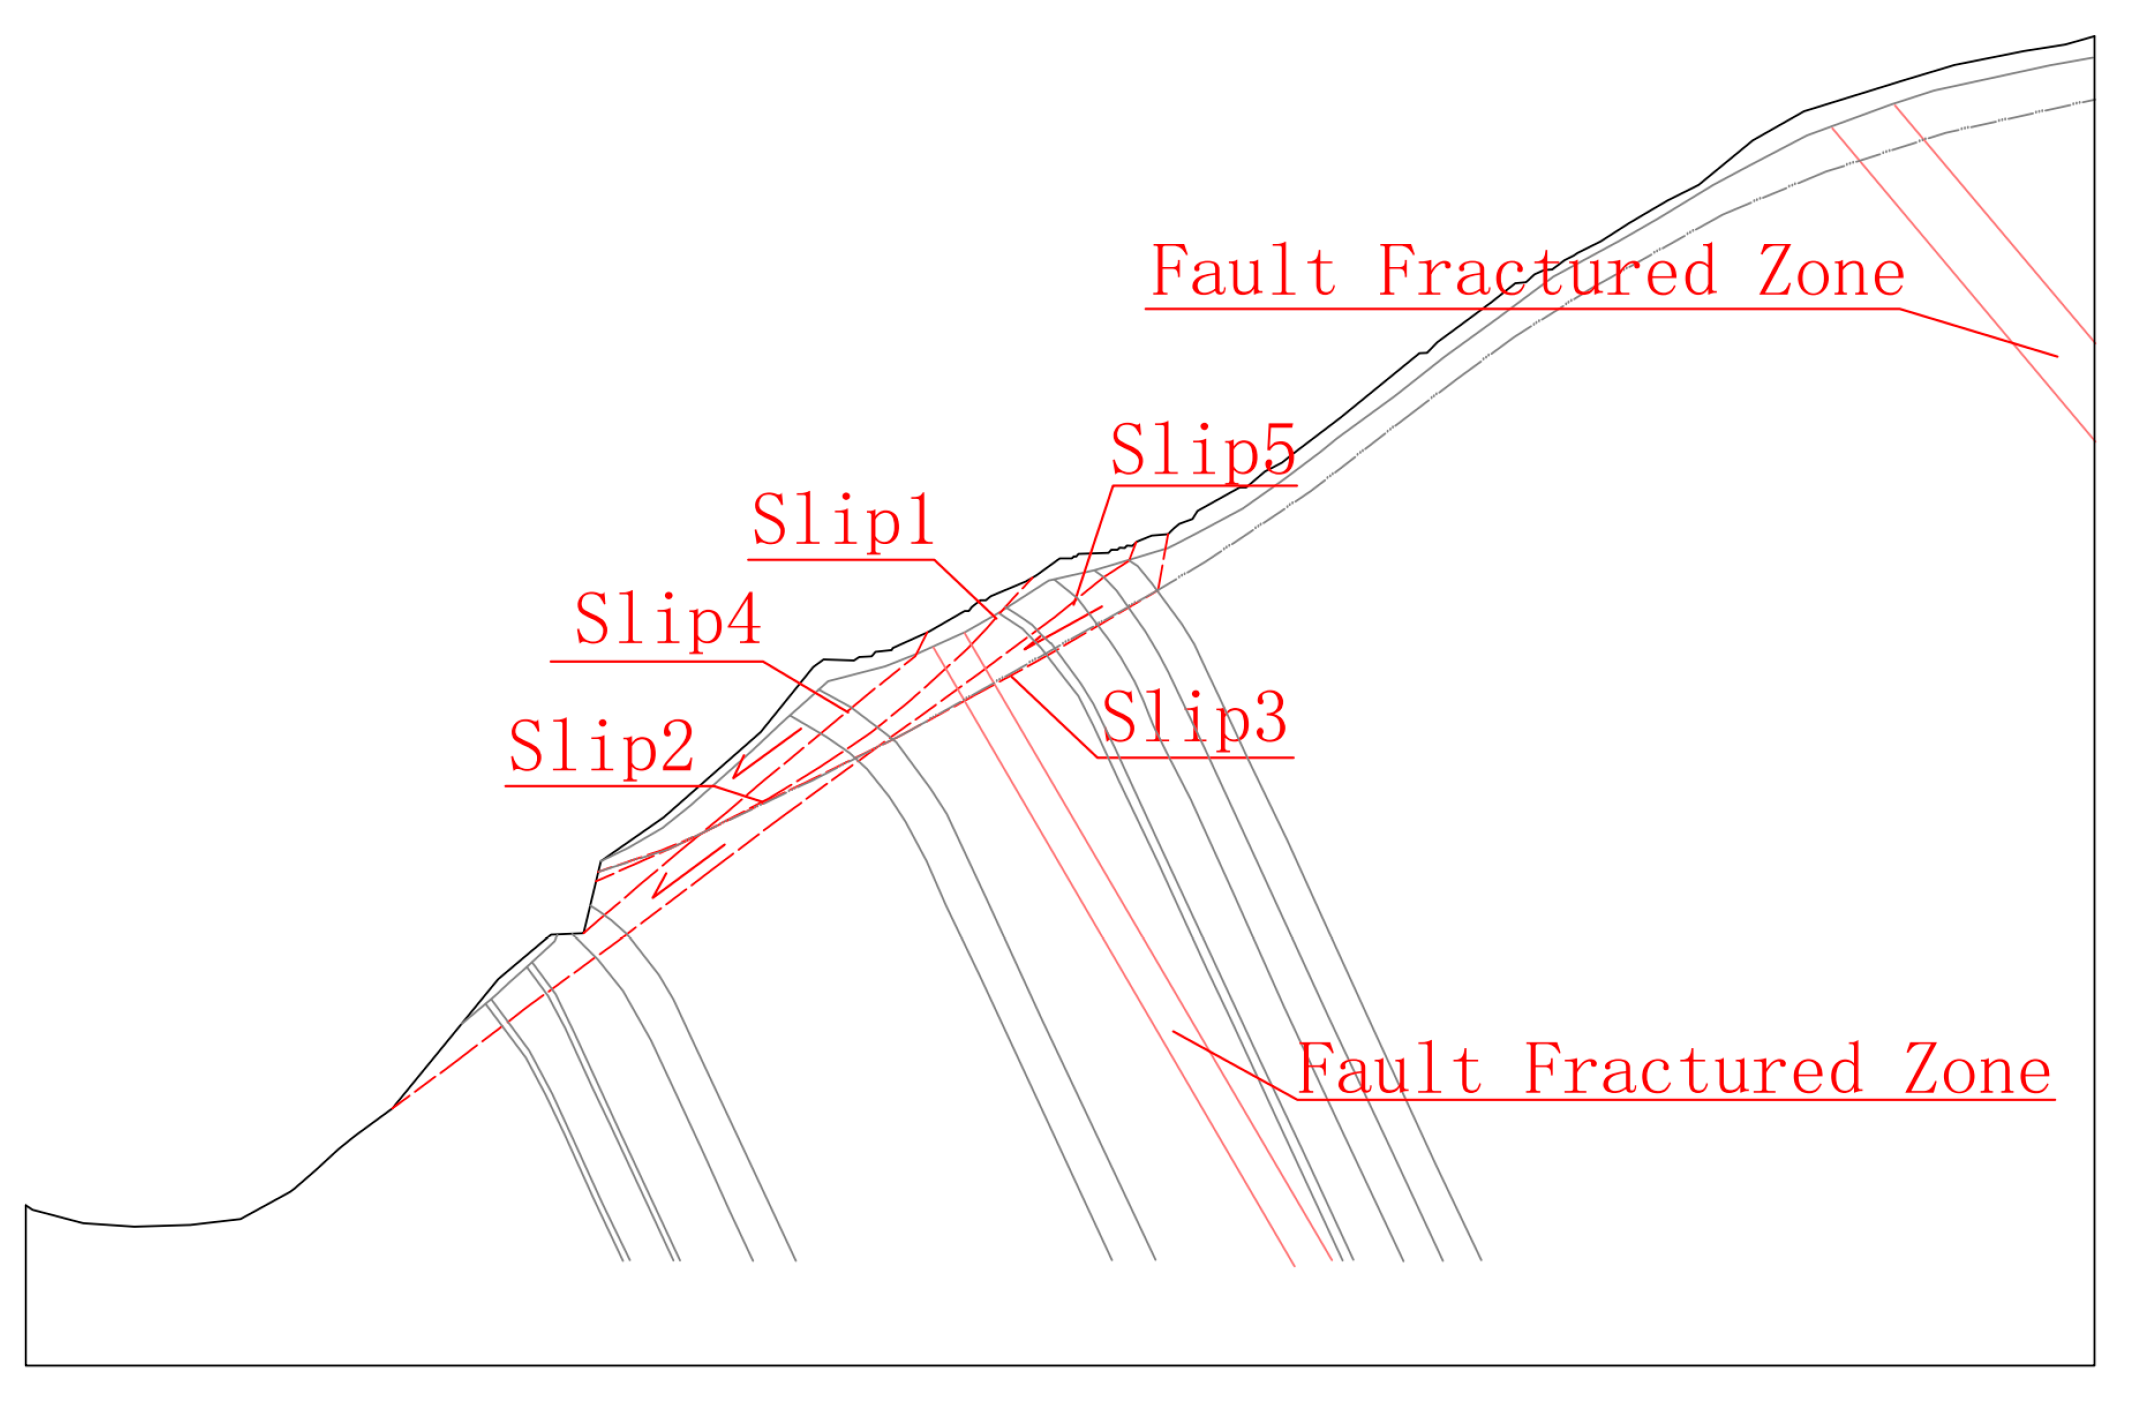
4.1.1. Potential Failure Mode of Bank Slope under Bridge Loads

Based the geological conditions, the fault fracture zones and the degree of toppling deformation of the rock mass on the bank slope, it can be concluded that the fault breccia and fault mud within the zones and the toppling rock mass are soft, with poor mechanical properties. Rainfall and reservoir water are prone to infiltrate and soften the rock mass of the bank slope, which has a significant impact on the stability of the bank slope. The integrity of the rock mass is poor, especially the broken shallow rock mass, which may lead to the high risk of circular slip. The integrity and quality of the rock mass that are in the moderately weathered zones and the weak toppling deformation zone are high, while the connectivity of the out-dip structural planes is poor, so that the possibility of deep-sliding deformation is weak.
Through comprehensive analysis and sliding surface retrieval, it is known that there are five potential failure surfaces on the bank slope, all of which are located in the shallow rock mass of the bank slope. Among them, Slip 1 is the circular sliding with the sliding face located in the weak quality rock mass at the front part of the bank slope, while the shape of the rest sliding faces is in a broken line. Slips 2–3 slide along the strong and medium weathering boundaries, while Slips 4–5 slide along the strong and medium unloading zones. The schematic diagram of the potential failure mode of the bank slope is shown in Figure 11.

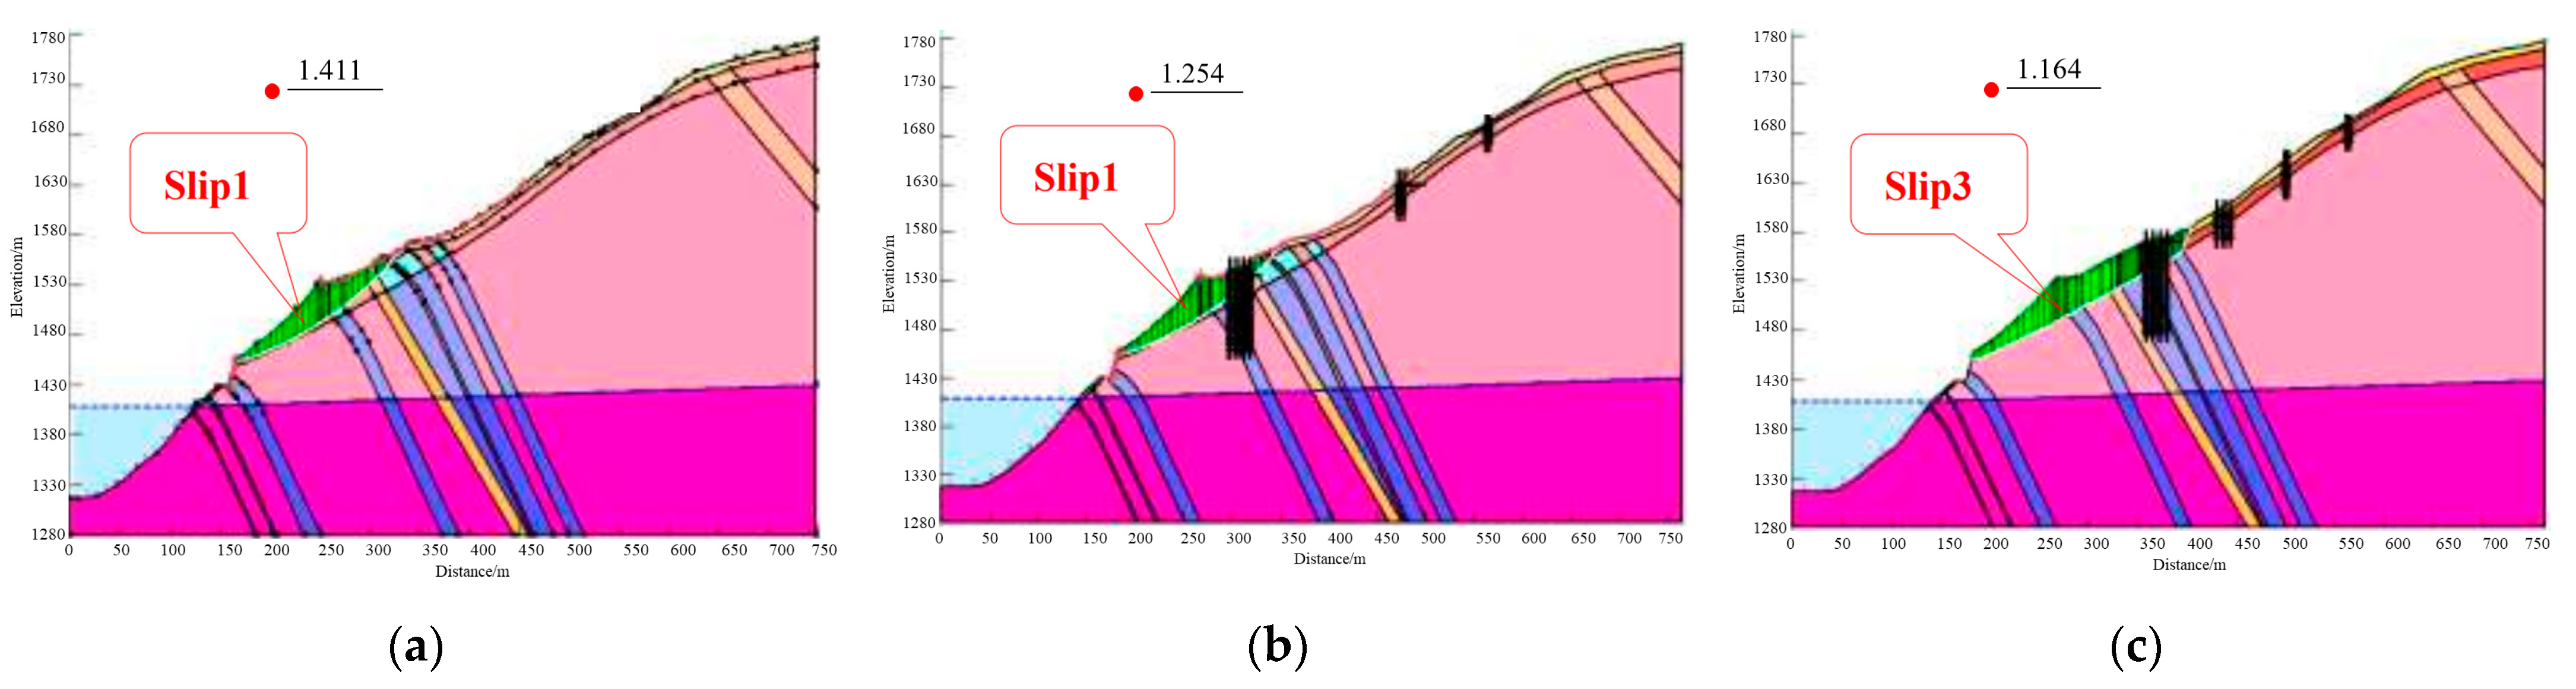
4.1.2. Analysis of Calculation Results of Two-Dimensional Numerical Simulation

Based on the potential failure mode analysis, stability calculations were conducted on the broken line and circular sliding surface under different working conditions in the bank slope using GeoStudio 2018 software. Due to the fact that the bank slope is relatively close to the Miaowei Hydropower Station, the required rock and soil parameters for GeoStudio 2018 on the bank slope are selected based on the recommended values in the relevant standards, Hoek–Brown empirical parameters, and the mechanical parameters and indoor experimental data of rock and soil on the bank slope of the Miaowei Hydropower Station, which aims to ensure the correctness. The specific calculation parameters used for the two-dimensional numerical simulation are shown in Table 4. The results for the stability of the bank slope under different conditions via two-dimensional limit equilibrium are shown in Table 5 and the part of stability calculation results are shown in Figure 12.
The results of the seepage analysis of the bank slope were considered. The distribution of the pressure water under the natural condition is shown in Figure 13 and the hydraulic parameters are shown in Table 6. It is assumed that the seepage in the bank slope is a stable flow under the natural condition, which is transient flow under a sudden drop in the water level and heavy rainfall conditions. In the natural condition, the pressure water in the bank slope increases with the decrease in elevation, and it gradually decreases from the inside to the outside of the slope, while the penetration gradually increases from inside to outside, reaching its maximum at the seepage outlet. After the sudden drop in the water level, the groundwater significantly decreases. When the water level drops to 1398 m, the groundwater slowly decreases, while the penetration increases and then decreases. With the continuous rainstorm, the groundwater level gradually increases, and the seepage force at the seepage outlet gradually increases.
The stability judgement criteria under different working conditions are comprehensively determined according to the relevant technical specifications and other bank slope projects near the study area, which is 1.35 under the natural condition, with that of 1.20 and 1.10 under the rainstorm condition and rainstorm + earthquake condition, respectively. Combining the results in Table 5, the following can be concluded:
  • Under the natural bank slope state, all the sliding surfaces are stable under the natural and rainstorm conditions, which is consistent with the qualitative results, indicating that the selection of rock and soil mass parameters is reasonable.
  • In Scheme 1, potential sliding surfaces 1 and 4 cannot meet the safety requirements in all the conditions, while only sliding surface 4 did not meet stability requirements in all the working conditions in Scheme 2. Therefore, Scheme 2 has the higher safety reserve and can provide sufficient assurance for the stability of the bank slope.
  • The potential sliding surfaces Slips 1–4 are located above the reservoir water and groundwater as non-wading landslides. The stability results are not affected by the periodic fluctuating water level, while the stability of Slip 5 is slightly affected by that.
  • The stability coefficient shows the law of the natural working condition > rainstorm working condition > rainstorm + earthquake working condition. Therefore, it is greatly affected by rainfall infiltration and seismic forces.

4.2. Three-Dimensional Discrete Element Analysis of Toppling Bank Slope with Fault Fracture Zones Developed under Bridge Loads

According to the analysis results of the two-dimensional numerical simulation, the stability of the bank slope is greatly affected by rainfall and seismic forces. Due to the inability of the two-dimensional simulation to reflect the irregular spatial distribution of the fault fracture zones reasonably, the three-dimensional model and 3DEC were used to demonstrate the influence of the existence of the fault fracture zones on the stability of the toppling bank slope under the impact of bridge loads and reservoir water. The calculation results for the displacement, stress-strain, plastic zone, and stability coefficient are serviced as the quantitative data for studying the influence of the fault fracture zones on the slope stability.
Based on the recommended values in relevant standards, Hoek–Brown empirical parameters, and the mechanical parameters and indoor experimental data of rock and soil on the bank slope of the Miaowei Hydropower Station, the required rock and soil parameters for the 3DEC software calculation are selected to ensure the correctness of the calculation results and the consistency of the on-site qualitative evaluation. The specific rock and soil calculation parameters used for calculation are shown in Table 7.

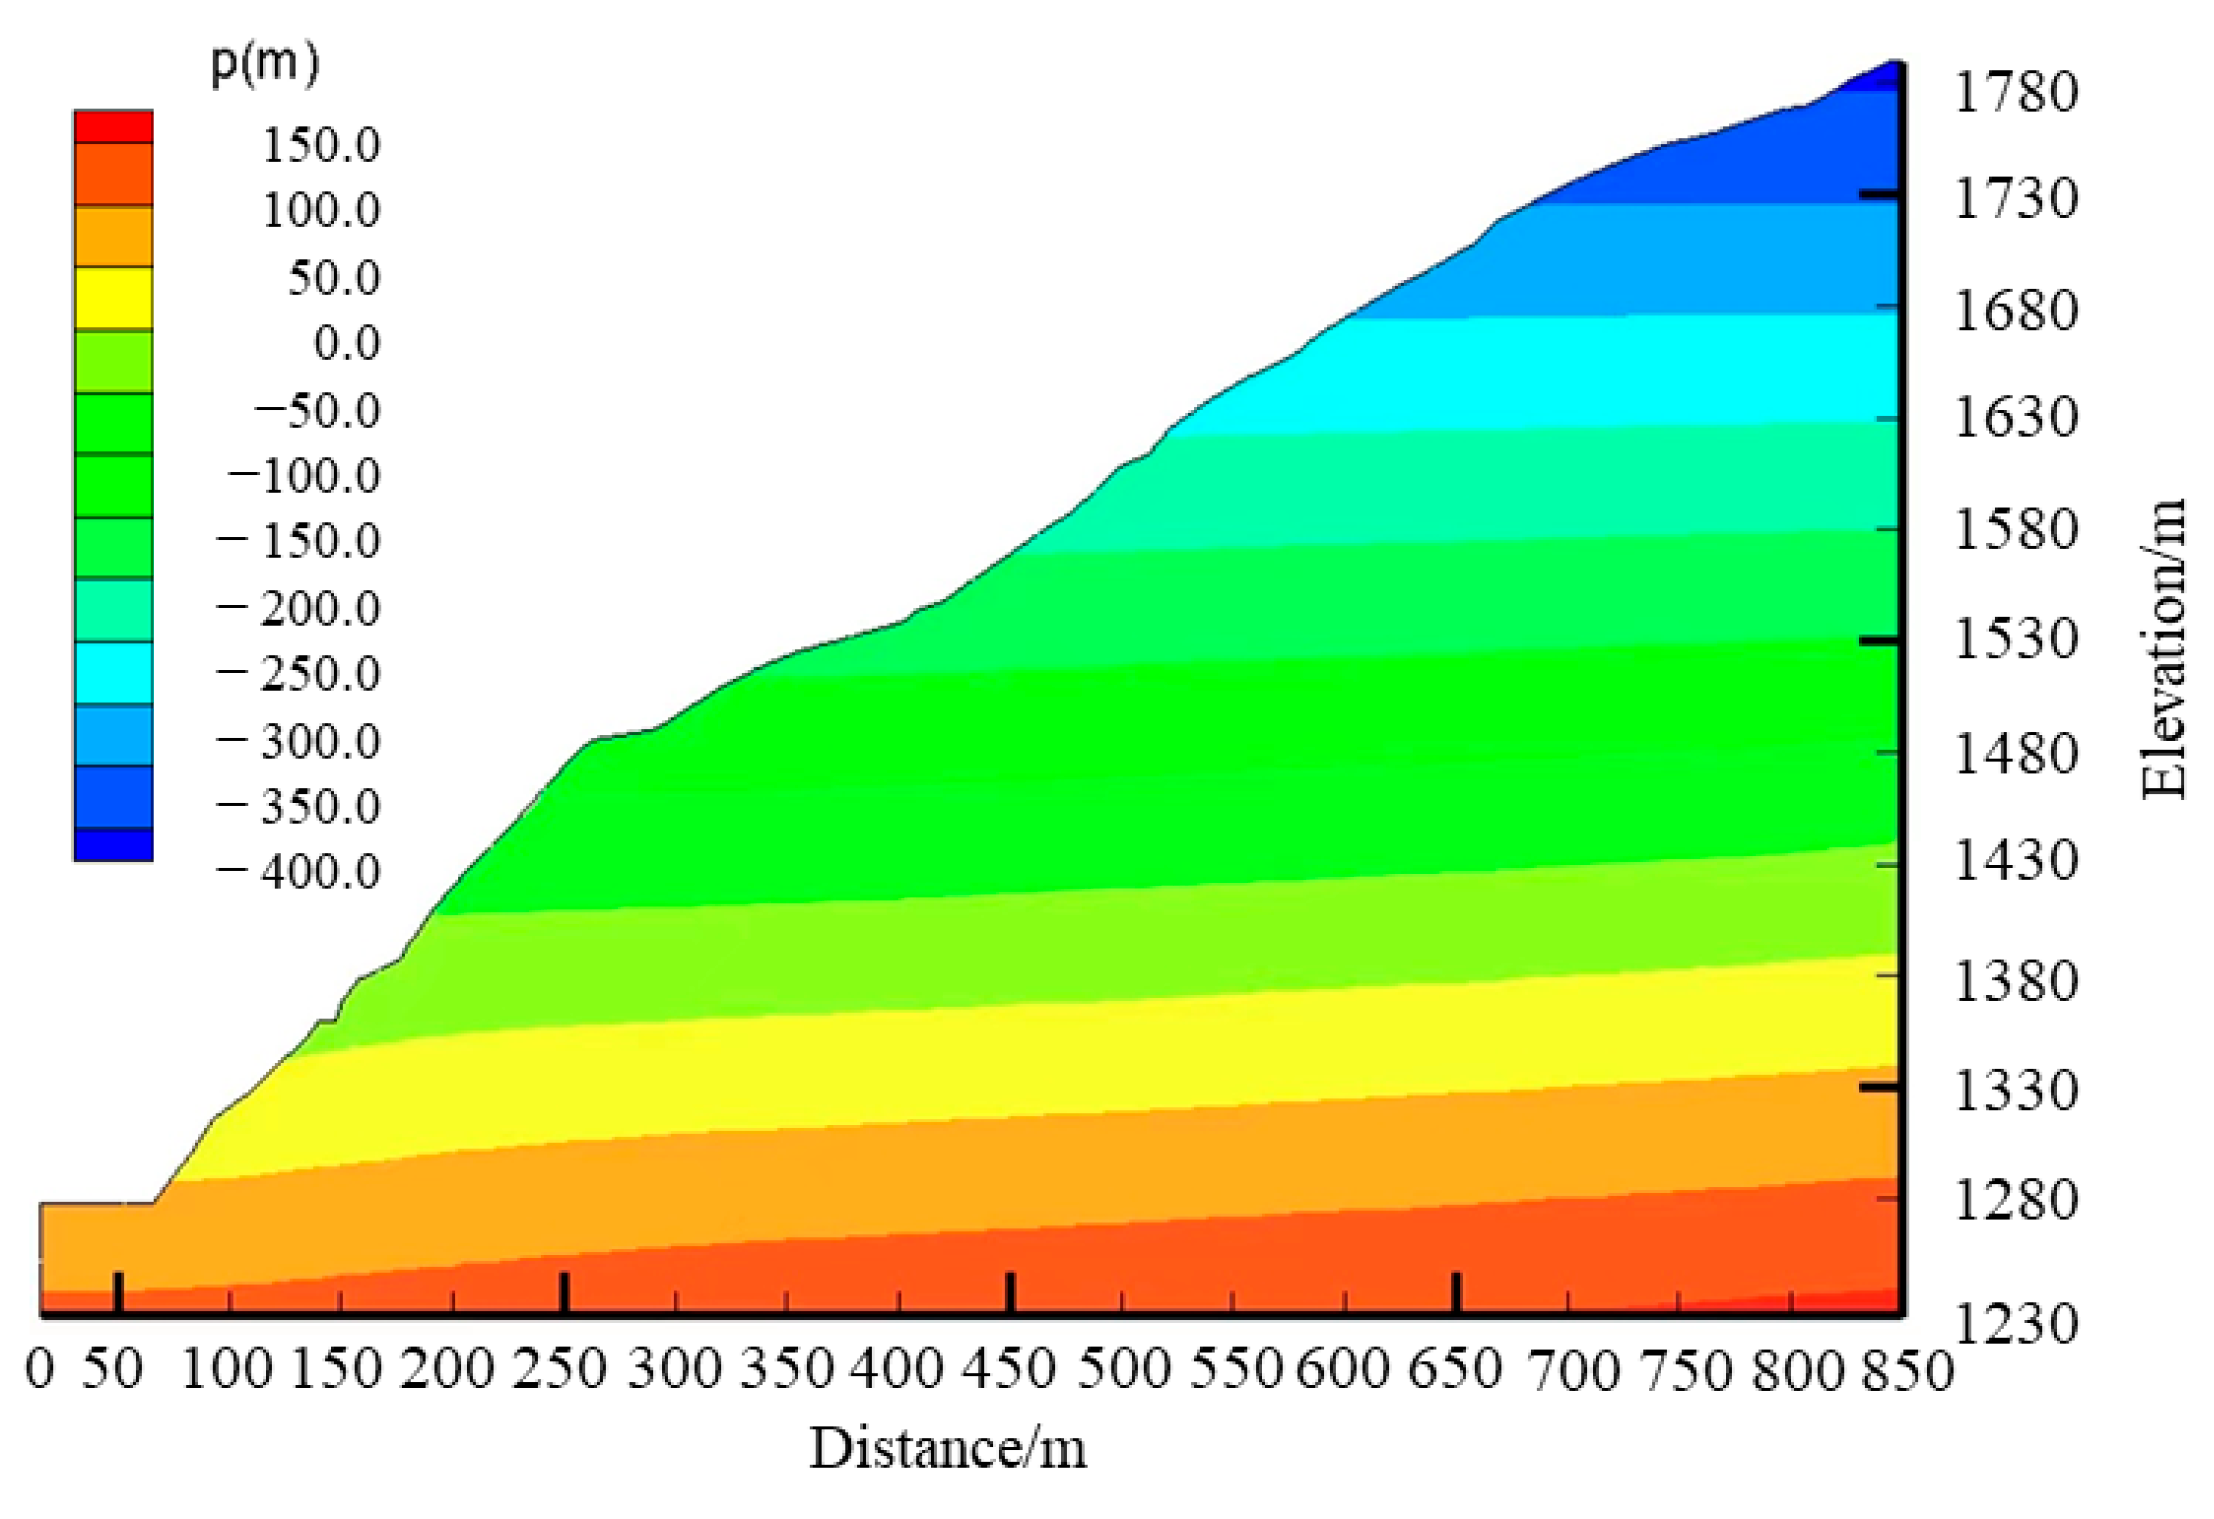
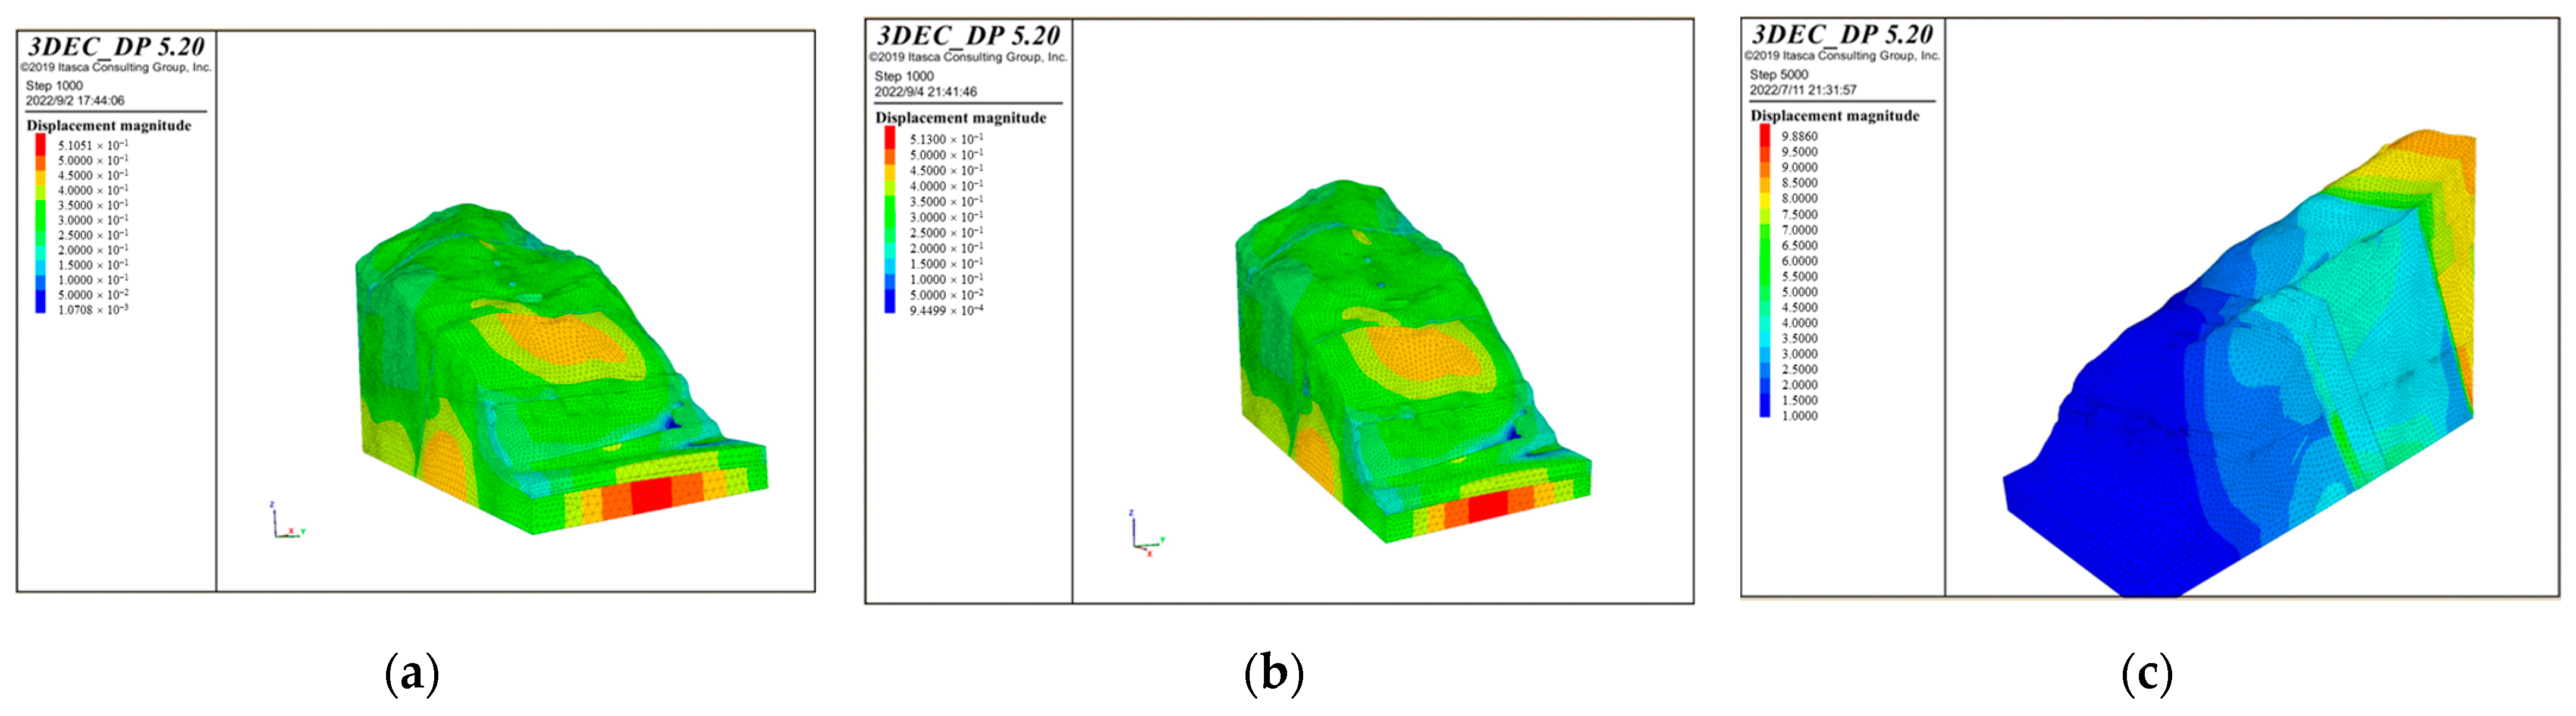
4.2.1. Displacement Analysis under Different Working Conditions

According to the different bridge schemes, apply the maximum vertical and horizontal loads of the bridge foundations, and then iteratively calculate. The stability calculation of the bank slope is based on the natural working condition and serves as the basis for the subsequent calculations. When the iterations of the calculation reach the convergence of the unbalanced forces, the calculation tends to stabilize. The cloud maps with displacement value under different bridge schemes and working conditions are shown in Figure 14.
According to Figure 14, it can be concluded that the bank slope mainly undergoes horizontal deformation toward the free face of the slope and the front edge of the unstable part is near the reservoir water level. The maximum displacement of the slope surface is concentrated at the position of the main bridge pier in the middle part of the bank slope, while the displacement at the auxiliary pier position is relatively small. In Scheme 1, the maximum displacements of the bank slope under working condition 1–3 are 0.510 m, 0.513 m, and 1.2 m, while in Scheme 2 they are 1.0 m, 1.1 m, and 2.4 m, respectively. Among them, the maximum displacement in working condition 1–2 is mainly generated by the self-weight of the slope and the bridge loads, while that in working condition 3 significantly increases under the influence of the fault fracture zones. This is because the strength of the fault fracture zone is poor and it can serve as a transport channel for rainfall and reservoir water, which increases the overall displacement of the bank slope and the fault fracture zones.

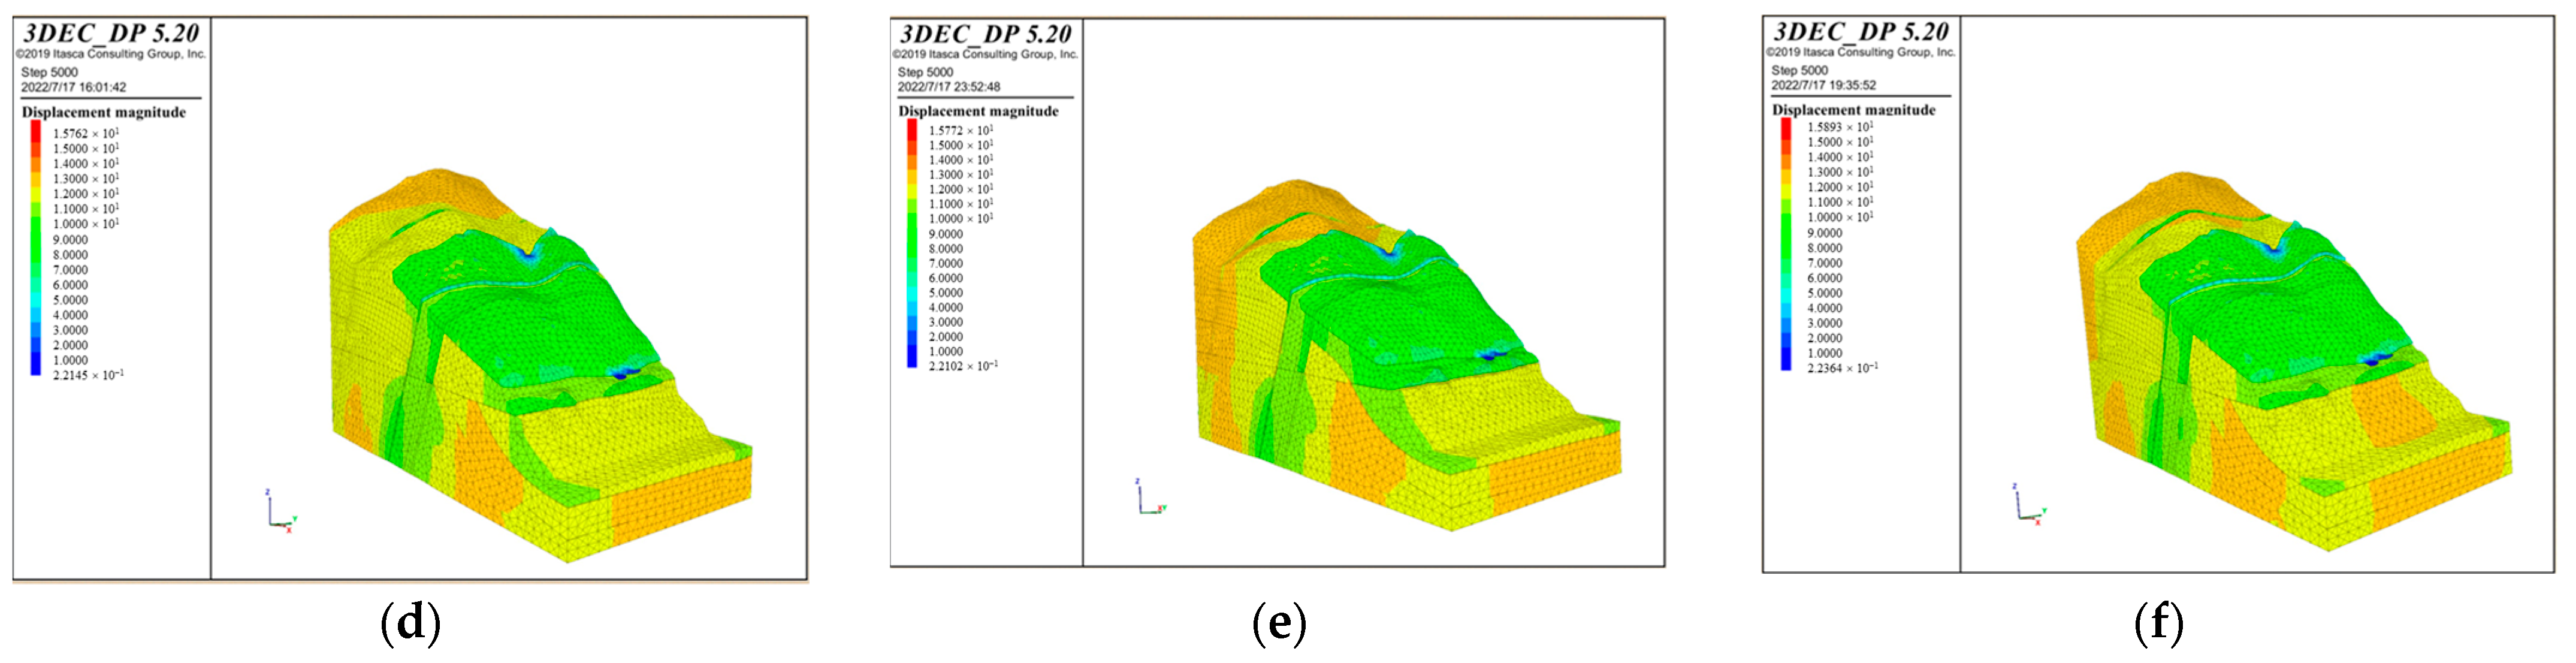
4.2.2. Stress and Strain Analysis under Different Working Conditions

The cloud maps of the maximum shear strain increment with the calculation values obtained through the calculation are shown in Figure 15. Based on the calculation results, it can be concluded that the maximum principal stress σ 1 is distributed uniformly on the bank slope and is at a minimum on the slope surface, while the minimum principal stress σ 3 on the slope surface is relatively large; Due to the influence of the bridge loads and reservoir water on the fault fracture zones, stress concentration occurs in the position of the bridge piers, fault fracture zones, and part of the bank slope above the water level.
According to Figure 15, it can be seen that the fault fracture zone below the main bridge pier and the shear strain increment at the bottom of the auxiliary pier are relatively large under working condition 1–2 in Scheme 1, while the shear strain increment of the bank slope between the bridge foundations and the front edge near the water level is significant with the limitation on the upper side caused by the fault fracture zones under working condition 3 in Scheme 1. Under each working condition in Scheme 2, the shear strain increment is relatively large at a depth of about 20 m on the upper side of the front edge of the bank slope near the water level, with the limitation on the upper and lower sides caused by the fault fracture zones, which is accompanied by the significant deformation in this area. This phenomenon indicates the influence of the fault fracture zones on the deformation under the combination of bridge loads and reservoir water.

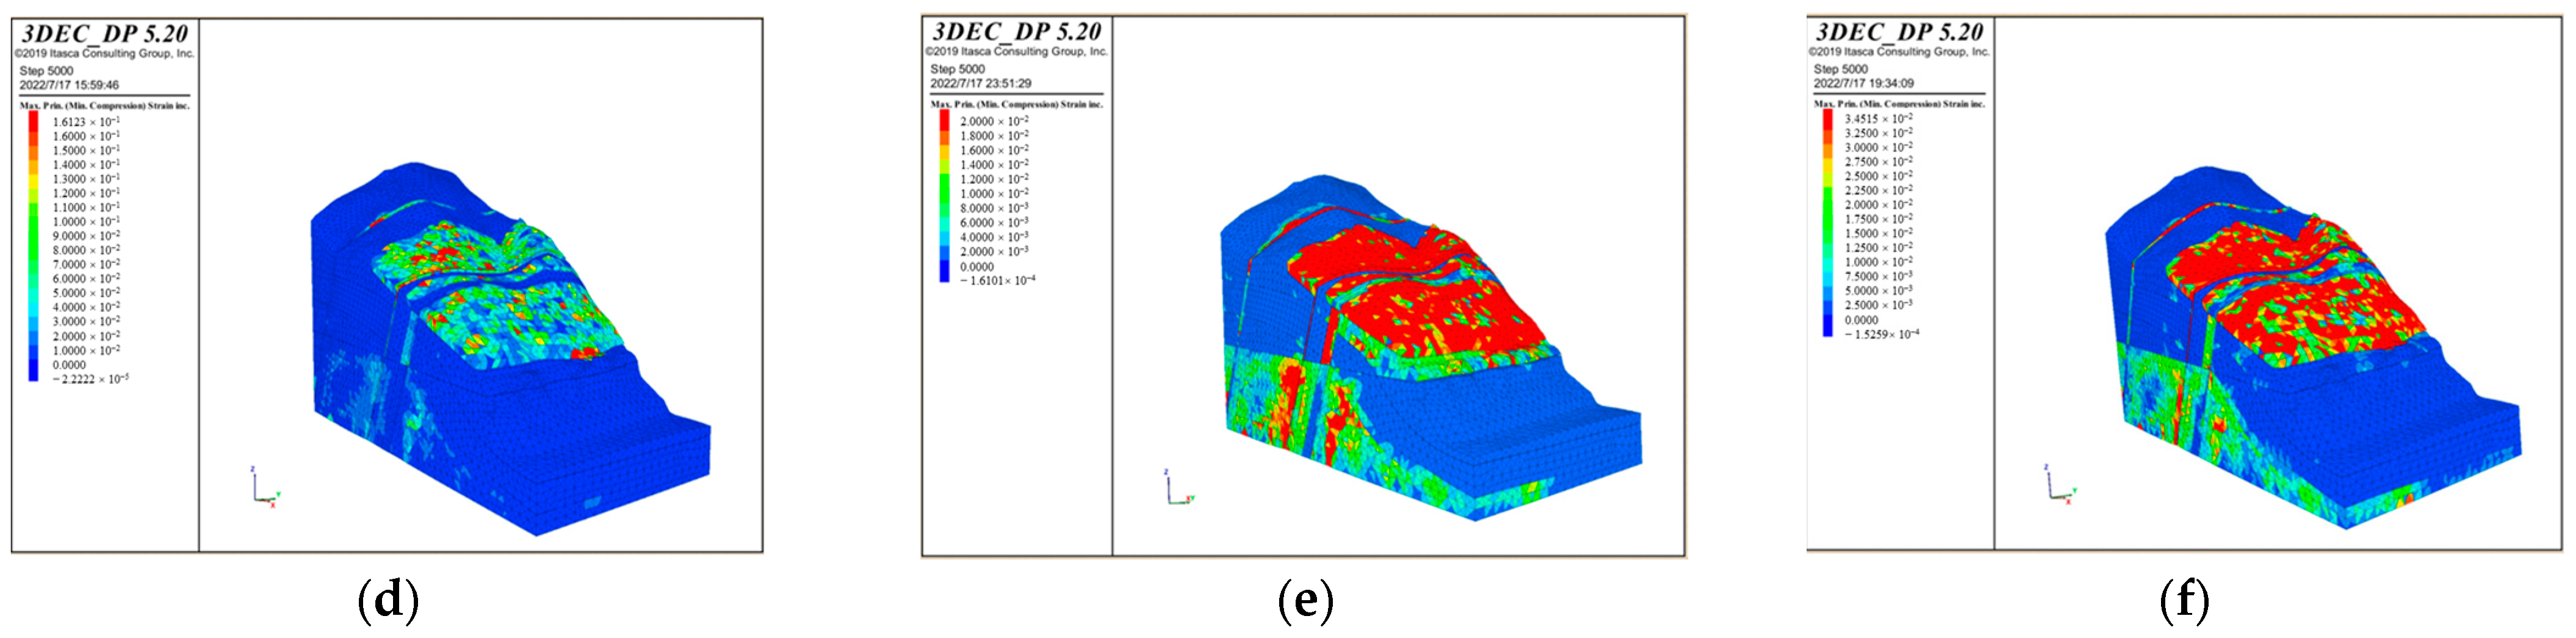
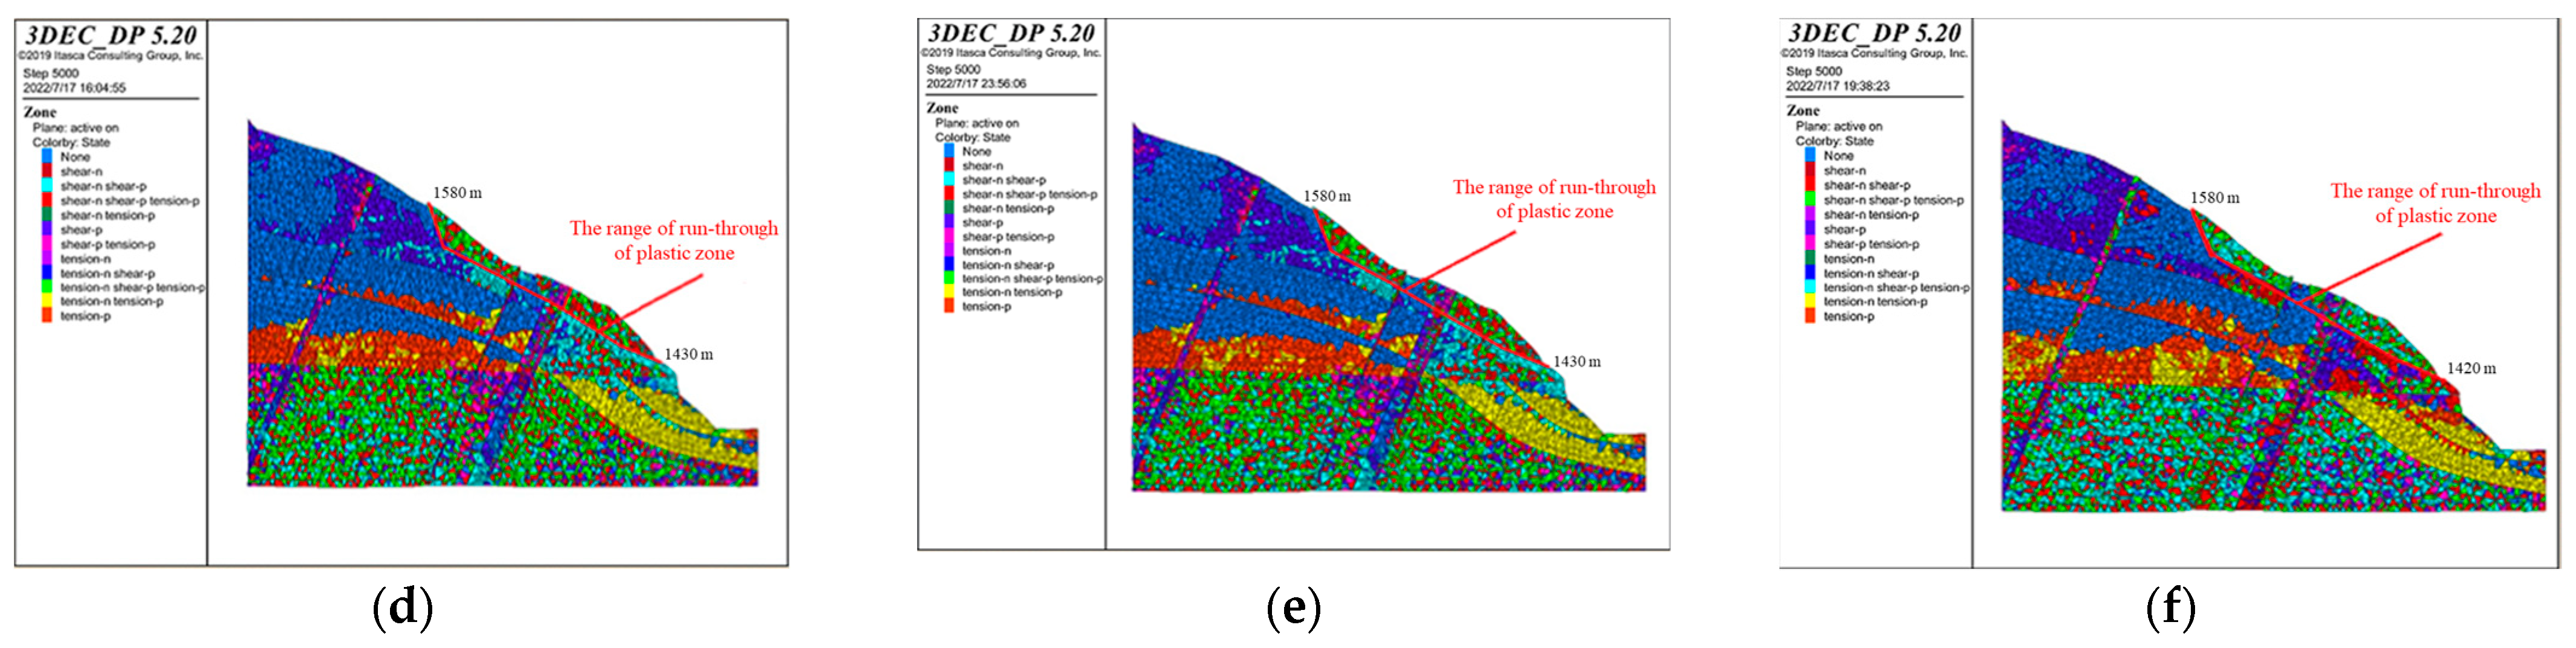
4.2.3. Plastic Zone and Stability Coefficient Analysis under DifferentWorking Conditions

The profiles of the plastic zone of the bank slope obtained via calculation are shown in Figure 16. Based on the locations of the plastic zones, it can be concluded that under the influence of bridge loads, the deformation of the surface of the bank slope is mainly shear deformation and tensile deformation, while the plastic zone is connected. Meanwhile, affected by the fault fracture zones, the deformation of the slope within the range of the fault fracture zones on the upper side of the bridge pile is mainly shear deformation, but the plastic zone is not fully penetrated. The results indicate that the distribution of plastic zones is greatly influenced by the development of fault fracture zones under the loads.
In addition, the elevation of the front and rear edges and the depth of the failure range of the slope can be obtained from the profiles of the plastic zones (Table 8). Based on the strength reduction method, the stability coefficients of the bank slope were calculated via three-dimensional discrete element simulation (Table 8). The results indicate that the bank slopes cannot meet the requirements and that reinforcements are needed.

5. Discussion

5.1. Mechanism of the Deformation and Failure of the Toppling Bank Slope with Fault Fracture Zones Developed under the Action of Bridge Loads and Reservoir Water

5.1.1. Incentive Mechanism of Bridge Loads and Reservoir Water on the Deformation and Failure of the Bank Slope

There are many weathering cracks and unloading cracks on the toppling bank slope. Such joints are special and their adverse distribution will affect the stability of the bank slope, leading to the deformation and failure of the bank slope. The horizontal and vertical loads of the bridge foundations are transmitted to the bedrock on the bank slope during the operation of the bridge, while stress is transferred to the rock mass through the joints. The continuously stress increase causes local damage to the rock mass under the bridge foundations where the plastic zones form. Also, as soon as the bridge loads are applied to the upper bank slope, the sliding force along the potential failure surfaces increases, which not only increases the compression of the rock mass at the lower slope but also further expands the tensile cracks formed via toppling deformation on the rock mass and promotes the cracks to the deeper part at the upper bank slope.
Due to the influence of the existence of the fault fracture zones and toppling deformation, the integrity of the rock mass on the surface of the bank slope is extremely loose and shows strong permeability, allowing reservoir water and rainfall to infiltrate into the rock and soil of the bank slope in a short period of time. After the reservoir impoundment, the groundwater level on the bank slope significantly increases, with the speed of lifting in the middle and upper parts of the bank slopes being lower than that in the lower parts. Under the influence of the penetration within the bank slope, the dynamic erosion of the river near and below the water level of the bank slope is accelerated. Also, due to the infiltration of water, the change in the pore water pressure and a decrease in the effective stress weakens the sliding-resistance capability of the bank slope with the change in the water content of the rock and soil mass on the bank slope, leading to decreased in the strength, physical and chemical properties. Local deformation and instability may occur under the effects of water pressure and seepage. Meanwhile, the increase in the pore water pressure causes deformation of the joints in the lower part of the bank slope, resulting in the change in the opening and closing states of the joints, which affects the seepage in joints and changes the stress state of the bank slope further.
Therefore, the lower bank slope undergoes deformation due to the changes in the seepage field caused by the water level variations of the Lancang River, leading to the formation of plastic zones at the foot of the bank slope and providing development potential and deformation space for the further bending, tension-fracture and toppling deformation of the loose toppling rock mass in the upper part. Meanwhile, the loose mass on the shallow part of the bank slope that undergoes deformation under the bridge loads and the infiltration force caused by rainfall can continue deforming to the free face. With the development of the plastic zones at the foot of the slope upwards, the stability of the bank slope reduces. As soon as the connection of the plastic zones under the bridge foundation and the bank slope foot is achieved, the instability of the bank slope forms, threatening the operation of the reservoir and the bridge.

5.1.2. Influence of Bridge Loads and Reservoir Water on the Deformation of Toppling Rock Mass

The further toppling deformation of the rock mass on the bank slope is influenced by the lower rock mass of the bank slope, which is closely related to the structure of the slope rock mass. The bank slope in this study is a reverse slope, with a steep slope and a rock dip angle greater than 40°. Under gravity, the rock mass undergoes bending deformation toward the free face. The tension cracks form on the tension side of the rock layer. When the tensile stress on the bending side of the rock mass is greater than its tensile strength, the rock mass fractures. When the sliding surface formed with the through fractures respectively caused by the action of reservoir water and bridge loads in the rock mass of the lower and upper part of the bank slope, the toppling failure occurs along the area with the highest shear stress. Therefore, bending tensile failure is the main failure mode of the toppling rock mass on the bank slopes. The tensile strength of the rock mass is much lower than the compressive strength, so that the occurrence of bending tensile fracture failure depends on whether the tensile fracture points are able to form on the tensile side of the rock mass under the action of the rock mass’s self-weight, which leads to the fact that the tensile strength of the rock mass can be used as the judgment standard for bending tensile fracture failure.
Under the gravity of the rock mass, the vertical force and bending moment can cause the formation of bending deformation and tensile stress in the rock layer. Due to the relatively tight fit of the rock layers in the toppling rock mass on the bank slope, the cantilever beam model can be used as the mechanical model to analyze the development and failure mode of the bank slope toppling deformation (Figure 17).
Assuming that a single rock layer can be treated as a single cantilever beam, the values of the shear strength (c, φ) of the interlayer are the same and the normal stress and shear stress are uniformly distributed, take a single unit point on the tensile side of the rock layer for the stress state analysis. In the natural state, the rock masses in the different toppling deformation zones remain stable, and the tensile fracture points of the rock layers in the medium or weak toppling deformation zones have not yet formed or are not clearly developed, failing to form a continuous failure surface. The reservoir impoundment reduces the overall anti-sliding ability of the bank slope, while the stress ( σ i ) of the compressive side reduces and the stress ( σ i + 1 ) of the tensile side increases in the cantilever beams in the lower bank slope under the action of seepage force, accelerating the formation of tension cracks and increasing the deflection of the cantilever beams. Similarly, under the influence of bridge loads and rainfall infiltration, the failure of the upper cantilever beam and the formation of tension cracks are also accelerated. Therefore, the action of bridge loads and reservoir water changes the stress state of the tensile fracture points, increases the bending moment on the tension side, accelerating the deformation and failure speed of the bending and tensile cracking and increasing the displacement of the slope between the bridge foundations and the water level and the connection of the plastic zones.

5.1.3. Influence of Fault Fracture Zones on the Stability of the Toppling Bank Slope

The fault fracture zones have the ability of hydraulic conductivity and serve as advantageous channels for rainwater infiltration, which increases the permeability of the bank slope. Rainfall infiltrates through the cracks on the slope surface and the fractured zones. The fractured rock mass near the slope surface is preferentially saturated, while accelerating the uplift of the underground water on the bank slope. The matric suction decreases with the increase in the water content as the state of the fractured rock mass near the slope surface turns into the saturated state. The connections between the particles are loose and the local connection mode changes, causing a rapid decrease in the mechanical properties of the fault mud along the direction of the fractures after being softened by hydration. Therefore, at the moment the deformation of the rock mass in the upper bank slope passes through the fault fracture zones, further dislocation occurs on the rock masses of the hanging wall and footwall of the fault fracture zones, making the displacement of the fault fracture zones more pronounced.
The phenomena of shear, tensile, and torsional deformation and the development of cracks happen on the rock masses of the hanging wall and footwall of the fault fracture zones. Meanwhile, the mechanical properties of the fault breccia and fault mud are poor. This causes the significant difference between the rock mass on the bank slope and the fault fracture zones, indicating that the fault fracture zones are weak interlayers of the bank slope. The deformation of the fault fracture zones is obvious, and the displacement of the rock mass on the bank slope exhibits inconsistency with that on fracture zones. The dip direction of the fault fracture zones is opposite to that of the bank slope, resulting in the complexity of the interaction between the weak interlayers and rock mass. When the rock mass on the bank slope breaks along the maximum bending points, stress concentration is generated in the upper part of the fault fracture zones, causing further deformation and strengthening of tensile stress in the fault fracture zones. The original cracks within the zones continue to expand and extend into the slope. When the sliding force caused by the weight of the rock mass and the bridge loads is greater than the shear resistance of the fault fracture zones, stress concentration occurs at the contact surface of the fractured rock mass and toppling rock mass. The sliding rock mass compresses the upper boundary of the fault fracture zones, causing displacement and further dislocation of the fractured rock mass. The increase in the deformation of the rock mass on the upper bank slope promotes the deformation of the fault fracture zones, leading to a deeper sliding body on the bank slope. When the ratio of the power caused by loads to that consumed by the compression and displacement of the sliding body along the sliding surface formed within the penetrating plastic zone is greater than 1, the bank slope will undergo deformation, instability and failure.

5.2. Determination of the Optimal Bridge Scheme

Based on the incentive mechanism of the bridge loads and reservoir water on the deformation and failure of the toppling bank slope with fault fracture zones developed, the layout of the bridge foundations is selected by combining the numerical simulation results and engineering geological conditions comprehensively.
  • Engineering Geological Conditions
The stability of the bank slope is influenced by the geological structure of the bank slope. The fracture zones, as the weak interlayers in the bank slope, have a significant impact on the stability due to its development position, width, attitude, and mechanics properties of the fractured rock mass. Therefore, the spatial relationship between the loading positions of the bridge and the fracture zones should be considered. In addition, the integrity of the rock mass is affected by toppling deformation, weathering, and unloading, with the development of joints and cracks in the rock mass (especially in the extremely strong toppling deformation zone A) leading the rock mass quality as another major factor affecting the burial depth of the bridge foundations. At the same time, the rock mass at the lower bank slope is also influenced by factors such as the dynamic erosion, seepage, and softening of the reservoir water, which is damaged first and provides space for the deformation of the upper bank slope. Therefore, the bridge foundations should be far away from the river and the main pier should been buried in extremely strong toppling areas as little as possible while meeting the foundation-bearing capacity and considering the limitations on the deformation of the upper rock mass.
2.
Calculation Results of the Stability Numerical Evaluation Model
According to the numerical simulation results of the evaluation model for the bank slope stability, it can be concluded that if the Slip 1 and Slip 4 are damaged, it will directly affect the main pier in Scheme 1. In contrast, although the stability of Slip 4 in Scheme 2 cannot meet the safety requirements, the fact that the distance between the rear edge and the main pier cap of 50 m poses a smaller threat to the main pier. Also, under all the working conditions of Scheme 2, the failure ranges are more concentrated, and the stability coefficients is greater than that of Scheme 1.
Therefore, the layout of the bridge foundations should follow Scheme 2.

5.3. Limitations of the Stability Numerical Evaluation Model

In order to study the stability of the bank slope, the two- and three-dimensional stability numerical evaluation model discrete element method was used to understand the mechanism of the deformation and failure. However, the limitations of the model also show as the following:
  • In the numerical simulation calculations, the bridge loads are applied by adding the static loads of the bridge structures in the position of the bridge foundations, but there is no comparison between the difference between the equivalent concentrated force or equivalent surface force and dynamic load on the simulation results.
  • Due to one of the research objectives being the stability of the bank slope under bridge loads, except for the selection of the bridge foundations layout based on the simulation result, we did not underscore its relevance to bridge safety and engineering design such as the bridge design, construction, and maintenance.
  • This study mainly discusses the effects of bridge loads and reservoir water on the fault fracture zones developed on the stability of the bank slope through the evaluation model, while there are other factors affecting the stability without consideration, which may cause differences between the results and actual conditions.
  • The geotechnical parameters in the paper refer to relevant engineering and simulation parameters in the region, and the rationality is verified by comparing the calculation results with qualitative analysis. However, it is inadequate in the analysis of parameters, which can be further addressed via indoor testing or simulation experiments.
Based on these limitations, the future research directions can be drawn as follows. Study the influence of the bridge load application methods on the bank slope stability; improve the simulation method and supplement the content of safety simulation for the upper bridge structures; conduct indoor tests or simulation experiments to further calibrate the key parameters required for numerical simulation; and change the position of the bottom surface of the foundations at different parts of the toppling deformation zones to study the effect on the development of toppling deformation.

6. Conclusions

This paper takes the bank slope of bridge foundations on the Lancang River as the research object. To investigate the influence of the bridge load and reservoir water on the stability of the toppling bank slope with fault fracture zones developed under different working conditions, numerical simulation was conducted to simulate the characteristics of deformation by GeoStudio and 3DEC software.
  • The geological structure of the bank slope is complex, with active fault fracture zones and small-scale secondary ones, while the bank slope developed with toppling deformation with the degree of deformation varies in depth. Therefore, factors such as the bridge loads, reservoir water, and rainfall can affect the stability of the bank slope, and they will have a significant impact on the operation of the reservoir area and the safety of bridge structure once the failure of slope occurs.
  • The simulation results show that the rock mass under the bridge foundations was compressed, while the foot of the slope was affected by water storage, both prone to deformation, forming stress concentration zones and plastic zones. The bridge loads accelerated the bending tensile deformation of the toppling rock mass on the bank slope; the groundwater level on the bank slope rose after the reservoir impoundment and rainfall, which reduced the strength of the rock and soil, accelerating the penetration of the plastic zone. Therefore, the combined effect of the bridge loads and reservoir water changed the original stress state of the bank slope, providing conditions for its deformation.
  • The fault fracture zones are important geological structures that affect the stability of the bank slope. The low impermeability of the fault fracture zones motivated the accelerated infiltration of rainfall and reservoir water, reduced the mechanical properties of the rock mass within and round the zones, accelerating the failure of the rock mass under the bridge foundations; the rock mass within the zones has the characteristics of low strength and variability, which led to the local stress in the upper part of the fault fracture zones and accelerated the expansion of the original cracks in the rock mass within the zones; the toppling deformation and bridge loads caused stress concentration in the upper part of the fault fracture zones, motivating the displacement of the rock mass inside the zones, accelerating the holing-through of the potential sliding surface and reducing the overall stability of the bank slope.
  • The results achieved in the study show that the numerical calculation model based on GeoStudio and 3DEC provides an effective tool for investigating the stability, deformation and failure mechanism of the bank slope in the study, and it offers references for the selection of the layout positions of the bridge foundations.

Author Contributions

Conceptualization, X.L. and X.Z.; methodology, F.Z.; software, F.Z.; validation, J.H., S.T. and Z.L.; investigation, J.H., S.T. and Z.L.; writing—review and editing, X.L. and X.Z. All authors have read and agreed to the published version of the manuscript.

Funding

This research was supported by the Science Foundation of China Huaneng Group Co., Ltd. [20158101216].

Data Availability Statement

The data presented in this study are available on request from the corresponding author.

Conflicts of Interest

Authors Jian Huang, Shixiong Tang and Zhiqing Liu were employed by the company China Communications Highway Planning and Design Institute Co., Ltd. The remaining authors declare that the research was conducted in the absence of any commercial or financial relationship that could be constructed as a potential conflict of interest.

References

  1. Song, Z.Q.; Huang, J.; Liu, X.L.; Zhang, L.J.; Wang, E.Z. Dynamic Response Analysis of Rock Bank Slope of a Bridge Across Jinsha River Under Earthquakes. Adv. Eng. Sci. 2021, 53, 45–53. (In Chinese) [Google Scholar] [CrossRef]
  2. Fei, L.; Guan, H.C.; Wang, S.; Huang, R.Y.; Sun, C.W. Analysis on bank slope stability of railway bridge foundation A double-line bridge of Guizhou-Chongqing railway in Yungui Plateau as a case study. Plateau Sci. Res. 2019, 3, 44–51,60. (In Chinese) [Google Scholar] [CrossRef]
  3. Ye, Z.Y.; Wang, M.; Mei, S.H.; Lin, M.Y.; Xiao, Y.J. Stability Analysis for Anchored Foundation Slope of Higher Bank Side of One Yangtze River Bridge. Min. Metall. Eng. 2021, 41, 11–15. (In Chinese) [Google Scholar] [CrossRef]
  4. Wang, Z.H.; Zhou, H.L. Shear strength characteristics of soils on bank slope of bridge foundation. Chin. J. Geotech. Eng. 2023, 45, 193–196. (In Chinese) [Google Scholar] [CrossRef]
  5. Peng, W.Z.; Zhao, M.H.; Yang, C.W. Study on Slope Stability under Loads Induced by Pile Foundations Based on Finite Element Limit Analysis. J. Hunan Univ. Nat. Sci. 2022, 49, 189–197. (In Chinese) [Google Scholar] [CrossRef]
  6. Deendayal, R.; Muthukkumaran, K.; Sitharam, T.G. Response of Laterally Loaded Pile in Soft Clay on Sloping Ground. Int. J. Geotech. Eng. 2016, 10, 580–588. [Google Scholar] [CrossRef]
  7. Deendayal, R.; Muthukkumaran, K.; Sitharam, T.G. Effect of Slope on p-y Curves for Laterally Loaded Piles in Soft Clay. Geotech. Geol. Eng. 2018, 36, 1509–1524. [Google Scholar] [CrossRef]
  8. Chen, C.C.; Shih, B.J.; Jeng, C.J. Case Study on Performance Monitoring and Stability Analysis of Baishihu Suspension Bridge and Side Slope. J. Civ. Eng. Manag. 2022, 28, 81–92. [Google Scholar] [CrossRef]
  9. Haider, M.; Yuan, S.F.; Li, T.L.; Liu, Y.P.; Lawrence, D.D.; Khan, R.K.M. Stability prediction of the toppling rock slope on the Heihe reservoir bank using discontinuous deformation analysis. Environ. Earth Sci. 2015, 82, 16. [Google Scholar] [CrossRef]
  10. Ning, Y.B.; Tang, H.M.; Zhang, G.C.; Smith, J.V.; Zhang, B.C.; Shen, P.W.; Chen, H.J. A complex rockslide developed from a deep-seated toppling failure in the upper Lancang River, Southwest China. Eng. Geol. 2021, 293, 106329. [Google Scholar] [CrossRef]
  11. Dong, M.L.; Zhang, F.M.; Lv, J.Q.; Hu, M.J.; Li, Z.N. Study on deformation and failure law of soft-hard rock interbedding toppling slope base on similar test. Bull. Eng. Geol. Environ. 2020, 79, 4625–4637. [Google Scholar] [CrossRef]
  12. Huang, D.; Ma, H.; Meng, Q.J.; Song, Y.X. Study on Toppling Mechanism and Affecting Factors of Anti-dip Rock Slopes with Soft-hard Interbedded structure. J. Eng. Geol. 2021, 29, 602–616. [Google Scholar] [CrossRef]
  13. Zhang, H.N.; Xu, X.Y.; Zheng, Y.; Li, H.; Guo, H.S. Experimental and numerical study of the mechanism of block-flexure toppling failure in rock slopes. Bull. Eng. Geol. Environ. 2022, 81, 63. [Google Scholar] [CrossRef]
  14. Yang, H.; Wei, Y.F.; Pei, X.J.; Zhang, Y.Y. Centrifugal test study of fracture evolution characteristics of anti-dip rock slope with steep and gently dipping structural plane. Rock Soil Mech. 2022, 43, 1215–1225. [Google Scholar] [CrossRef]
  15. Haghgouei, H.; Kargar, A.R.; Amini, M.; Esmaeili, K. An analytical solution for analysis of toppling-slumping failure in rock slopes. Eng. Geol. 2020, 265, 105396. [Google Scholar] [CrossRef]
  16. Kilic, R.; Ulamis, K. Toppling and sliding in volcanic bimrocks around Bayrakli (Izmir, Turkey). J. Mt. Sci. 2020, 17, 492–500. [Google Scholar] [CrossRef]
  17. Sarfaraz, H. An Analytical Solution for Analysis of Block Toppling Failure Using Approach of Fictitious Horizontal Acceleration. J. Min. Sci. 2021, 57, 202–209. [Google Scholar] [CrossRef]
  18. Azarafza, M.; Akgun, H.; Ghazifard, A.; Asghari-Kaljahi, E. Key-block based analytical stability method for discontinuous rock slope subjected to toppling failure. Comput. Geotech. 2020, 124, 103620. [Google Scholar] [CrossRef]
  19. Ardestani, A.; Amini, M.; Esmaeili, K. A two-dimensional limit equilibrium computer code for analysis of complex toppling slope failures. J. Rock Mech. Geotech. Eng. 2021, 13, 114–130. [Google Scholar] [CrossRef]
  20. Dai, Z.H.; Hu, Z.Q.; Yin, X.T.; Wu, Z.J. Deformation stability analysis of gentle reverse inclined layer-like rock slope under engineering load. Rock Soil Mech. 2018, 39, 412–418+424. [Google Scholar] [CrossRef]
  21. Huang, J.; Tang, S.; Liu, Z.; Zhang, F.; Dong, M.; Liu, C.; Li, Z. A Case Study for Stability Analysis of Toppling Slope under the Combined Action of Large Suspension Bridge Loads and Hydrodynamic Forces in a Large Reservoir Area. Water 2023, 15, 4037. [Google Scholar] [CrossRef]
  22. Azarfar, B.; Ahmadvand, S.; Sattarvand, J.; Abbasi, B. Stability Analysis of Rock Structure in Large Slopes and Open-Pit Mine: Numerical and Experimental Fault Modeling. Rock Mech. Rock Eng. 2019, 52, 4889–4905. [Google Scholar] [CrossRef]
  23. Liu, Y.; Yu, L.; Song, W.; Yang, T. Three-Dimensional Analysis of Complex Rock Slope Stability Affected by Fault and Weak Layer Based on FESRM. Adv. Civ. Eng. 2019, 2019, 6380815. [Google Scholar] [CrossRef]
  24. Mehdi, K.; Mohammad, A.; Reza, D. A Qslope-based empirical method to stability assessment of mountain rock slopes in multiple faults zone: A case for North of Tabriz. MethodsX 2022, 9, 101718. [Google Scholar] [CrossRef]
  25. Kumar, M.; Krishnaveni, V.; Muthukumar, S. Geotechnical Investigation and Numerical Analysis of Slope Failure: A Case Study of Landslide Vulnerability Zone in Kolli Hills, Tamil Nadu. J. Geol. Soc. India 2021, 97, 513–519. [Google Scholar] [CrossRef]
  26. Raghuvanshi, T.K. Plane failure in rock slopes—A review on stability analysis techniques. J. King Saud Univ. Sci. 2019, 31, 101–109. [Google Scholar] [CrossRef]
  27. Perea, H.; Gracia, E.; Martinez-Loriente, S.; Bartolome, R.; Gomez de la Pena, L.; de Mol, B.; Moreno, X.; Lo Iacono, C.; Diez, S.; Tello, O.; et al. Kinematic analysis of secondary faults within a distributed shear-zone reveals fault linkage and increased seismic hazard. Mar. Geol. 2018, 339, 23–33. [Google Scholar] [CrossRef]
  28. Claire, B.; Yves, G.; Isabelle, M.; Luca, M.; Didier, S. Pore network properties of sandstones in a fault damage zone. Mar. Geol. 2018, 110, 24–44. [Google Scholar] [CrossRef]
  29. Kincal, C. Fault-controlling safe slope design procedure in an open-pit mine case study: Tunçbilek-Kütahya (Turkey) coal field. Arab. J. Geosci. 2021, 14, 91. [Google Scholar] [CrossRef]
  30. Ren, S.L.; Tao, Z.G.; He, M.C.; Pang, S.H.; Li, M.N.; Xu, H.T. Stability analysis of open-pit gold mine slopes and optimization of mining scheme in Inner Mongolia, China. J. Mt. Sci. 2020, 17, 2997–3011. [Google Scholar] [CrossRef]
Figure 1. Schematic diagram of the location and topographic map of the bank slope.
Water 16 00494 g001
Figure 2. Schematic diagram of the bank slope profile in the bridge site area.
Water 16 00494 g002
Figure 3. Schematic diagram of the foundation layout under different bridge schemes: (a) bridge foundation layout of Scheme 1; and (b) bridge foundation layout of Scheme 2.
Water 16 00494 g003
Figure 4. Schematic diagram of the rock lithology exposed by drilling the core: (a) strongly weathered sandstone; and (b) moderately weathered sandstone.
Water 16 00494 g004
Figure 5. Schematic diagram of the bank slope profile in the bridge site area.
Water 16 00494 g005
Figure 6. Schematic diagram of the bank slope collapse in the adjacent areas of the bridge site area: (a) Position 1 of bank collapse; and (b) Position 2 of bank collapse.
Water 16 00494 g006
Figure 7. Schematic diagram of the geological structure of the bank slope: (a) schematic diagram of the toppling deformation zones of the bank slope; and (b) geological profile map of the location of the bridge foundations of the bank slope.
Water 16 00494 g007
Figure 8. Schematic diagram of the model for the limit equilibrium analysis of the bank slope: (a) natural bank slope; (b) calculation model for the bridge foundation slope in Scheme 1; and (c) calculation model for the bridge foundation slope in Scheme 2.
Water 16 00494 g008
Figure 9. Schematic diagram of the cycle calculation in 3DEC software: (a) mathematical model for the contact cycle calculation; and (b) force and displacement cyclic calculation model.
Water 16 00494 g009
Figure 10. Schematic diagram of the three-dimensional discrete element numerical simulation calculation model for the bank slope: (a) numerical simulation calculation model for the natural bank slope; and (b) numerical simulation calculation model for the bank slope of the bridge foundations (taking Scheme 1 as the example).
Water 16 00494 g010
Figure 11. Schematic diagram of the potential sliding surfaces on the bank slope.
Water 16 00494 g011
Figure 12. Calculation results for the bank slope stability: (a) natural condition: normal water level; (b) Scheme 1: normal water level; and (c) Scheme 2: natural working condition: normal water level + earthquake + heavy rainfall.
Water 16 00494 g012
Figure 13. Distribution of the pressure water under the natural condition on the bank slope.
Water 16 00494 g013
Figure 14. The cloud maps of the displacement of the bank slope under the different bridge schemes and working conditions: (a) Scheme 1 + working condition 1; (b) Scheme 1 + working condition 2; (c) Scheme 1 + working condition 3; (d) Scheme 2 + working condition 1; (e) Scheme 2 + working condition 2; and (f) Scheme 2 + working condition 3.
Water 16 00494 g014aWater 16 00494 g014b
Figure 15. The cloud maps of the maximum shear strain increment of the bank slope under the different bridge schemes and working conditions: (a) Scheme 1 + working condition 1; (b) Scheme 1 + working condition 2; (c) Scheme 1 + working condition 3; (d) Scheme 2 + working condition 1; (e) Scheme 2 + working condition 2; and (f) Scheme 2 + working condition 3.
Water 16 00494 g015aWater 16 00494 g015b
Figure 16. The profiles of the plastic zones of the bank slope under the different bridge schemes and working conditions: (a) Scheme 1 + working condition 1; (b) Scheme 1 + working condition 2; (c) Scheme 1 + working condition 3; (d) Scheme 2 + working condition 1; (e) Scheme 2 + working condition 2; and (f) Scheme 2 + working condition 3.
Water 16 00494 g016aWater 16 00494 g016b
Figure 17. Schematic diagram of the cantilever beam calculation model of the toppling rock mass.
Water 16 00494 g017
Table 1. Calculation of the bridge load for the bank slope stability (unit: kN).
Bridge Scheme and the Bridge SpanPier/Abutment NameTransverse Bridge Width/mPile Foundation Length/mAxial Force/kNAxial Compressive Bearing Capacity per Linear Meter of a Single Pile with a Single Width/kNHorizontal Force along the Bridge Direction/kNHorizontal Force along the Bridge Direction with Single Width/kN
Scheme 1 Main pier40.085.01,053,35121668,5841715
Auxiliary pier11.230.039,0271116233556
Abutment12.820.053,70217200
Scheme 2 Main pier40.095.01,679,1162167187180
Auxiliary pier (adjacent to the main pier)16.530.0127,24620500
Auxiliary pier (near abutment pier)16.530.062,10115000
Abutment11.820.074,44417200
Table 2. Stratigraphic information and lithological characteristics of the bank slope.
ErathemSystemStratum CodeStrata Thickness (m)Lithological Characteristics
Cenozoic ErathemQuaternary SystemQ4<50.0Silty clay and gravel soil
Mesozoic ErathemCretaceous SystemK1j1/Sandy slate, muddy sandstone and metamorphic sandstone
Table 3. Description of the rock mass in the fault fracture zones.
TypeDescription
Fault MudGray white, plastic hard plastic, interbedded with fault breccia, with a general particle size of 2.0–3.0 cm, content of about 30% gray white, thickness of about 5.30 m.
Fault BrecciaThe thickness of the fractured zone of the F11 fault is about 24.1 m. The characteristics of the rock mass in the fractured zone of the fault vary from top to bottom with the depth of the bank slope.At the depth of 7.0–15.0 m, it is strongly weathered slate, gray to light gray. The rock structures are damaged, the stratification is not visible, and the joint fissures are well developed. The rock core are mostly fragmented, and the fissure surfaces are filled with fault mud.
At the depth of 15.0–25.0 m, it is strongly weathered sandstone with invisible stratification. The rock cores are mostly fragmented with a diameter of 3.0–5.0 cm generally.
At a depth of 25.0–29.1 m, it is strongly weathered slate, gray to deep gray, with invisible stratification. The rock cores are mostly fragmented, while a small amount of them are short columns.
At a depth of 29.1–3.1 m, it is completely weathered slate, brownish yellow to grayish white. The rock cores are soil-like with a small amount of debris.
Table 4. Rock and soil calculation parameters of the two-dimensional limit equilibrium calculation.
LithologyWeight (kN/m3)C (kPa)Φ (°)Deformation Modulus/E
Gpa
Poisson’s Ratio/μ
NaturallySaturationNaturallySaturationNaturallySaturation
Quaternary cover layer20.020.530.028.024.022.00.0250.35
Fracture zone21.221.640.027.030.025.00.200.32
Strongly weathered sandy slate mixed with muddy slate23.023.415013526.024.00.500.30
Metamorphic sandstone in strongly weathered areas23.023.413011525.023.90.450.32
Moderately weathered sandy slate mixed with muddy slate26.227.057051037.033.30.600.29
Metamorphic sandstone in moderately weathered areas26.227.050045033.430.10.550.30
Structural planes in strongly weathered areas (combined with general)//80.070.025.023.0//
Structural planes in moderately weathered areas (well bonded)//22020035.031.5//
Table 5. Calculation results for the stability of the bank slope under different conditions via two-dimensional limit equilibrium.
Bridge SchemeWorking ConditionStability Coefficient Fs
Slip 1Slip 2Slip 3Slip 4Slip 5
Natural Bank SlopeNatural Working Conditions1.4111.6611.5101.2701.453
Rainstorm Conditions1.2691.4881.3591.1671.408
Rainstorm + Earthquake Conditions1.1351.2921.1911.0531.265
Scheme 1 Natural Working Conditions1.2541.4751.3991.2701.397
Rainstorm Conditions1.1221.3231.2601.1671.353
Rainstorm + Earthquake Conditions1.0181.1761.1231.0531.220
Scheme 2 Natural Working Conditions1.4111.6611.4621.2701.453
Rainstorm Conditions1.2691.4881.3181.1671.408
Rainstorm + Earthquake Conditions1.1351.2921.1641.0531.265
Table 6. Hydraulic parameters of different toppling areas of the bank slope.
LithologySaturated Permeability Coefficient (m/s)Saturated Volume Moisture Content
Quaternary cover layer6 × 10−50.42
Fault fracture zone4.2 × 10−60.40
Strongly weathered slate with metamorphic sandstone (Zone A)2.315 × 10−60.35
Strong weathered slate mixed with metamorphic sandstone (Zone B)1.157 × 10−60.29
Moderately weathered slate mixed with metamorphic sandstone (Zone C)3.45 × 10−80.18
Table 7. Rock and soil calculation parameters for the three-dimensional discrete element calculation.
LithologySevere (KN/m3)C (KPa)Φ (°)Deformation Modulus E
GPa
Poisson’s Ratio μ
NaturallySaturationNaturallySaturationNaturallySaturation
Fracture Zones22.523.540.027.030.025.00.200.32
Extremely Strong Toppling and Strong Weathered Slate in Zone A26.227.020018033.229.80.500.30
Strong toppling and Weathered of slate in Zone B26.227.040036035431.90.600.29
Moderately Weathered Slate in Zone C26.427.865058541.036.90.800.28
Structural Plane with General Combination and Poor Connectivity//12011031.029.0//
Table 8. Calculation results for the failure range of the bank slope in the discrete element simulation.
Bridge SchemeWorking ConditionStability Coefficient FsElevation of the Front EdgeElevation of the Rear EdgeDepth of the Sliding
Scheme 1 Natural Working Conditions1.2601410166520.0
Rainstorm Conditions1.2101410167020.0
Rainstorm + Earthquake Conditions1.1701480152020.0
Scheme 2 Natural Working Conditions1.3701430158020.0
Rainstorm Conditions1.2201430158020.0
Rainstorm + Earthquake Conditions1.1301420158020.0
Disclaimer/Publisher’s Note: The statements, opinions and data contained in all publications are solely those of the individual author(s) and contributor(s) and not of MDPI and/or the editor(s). MDPI and/or the editor(s) disclaim responsibility for any injury to people or property resulting from any ideas, methods, instructions or products referred to in the content.

