


Reuse of Treated Wastewater for Crop Irrigation: Water Suitability, Fertilization Potential, and Impact on Selected Soil Physicochemical Properties


Abstract
1. Introduction
2. Materials and Methods
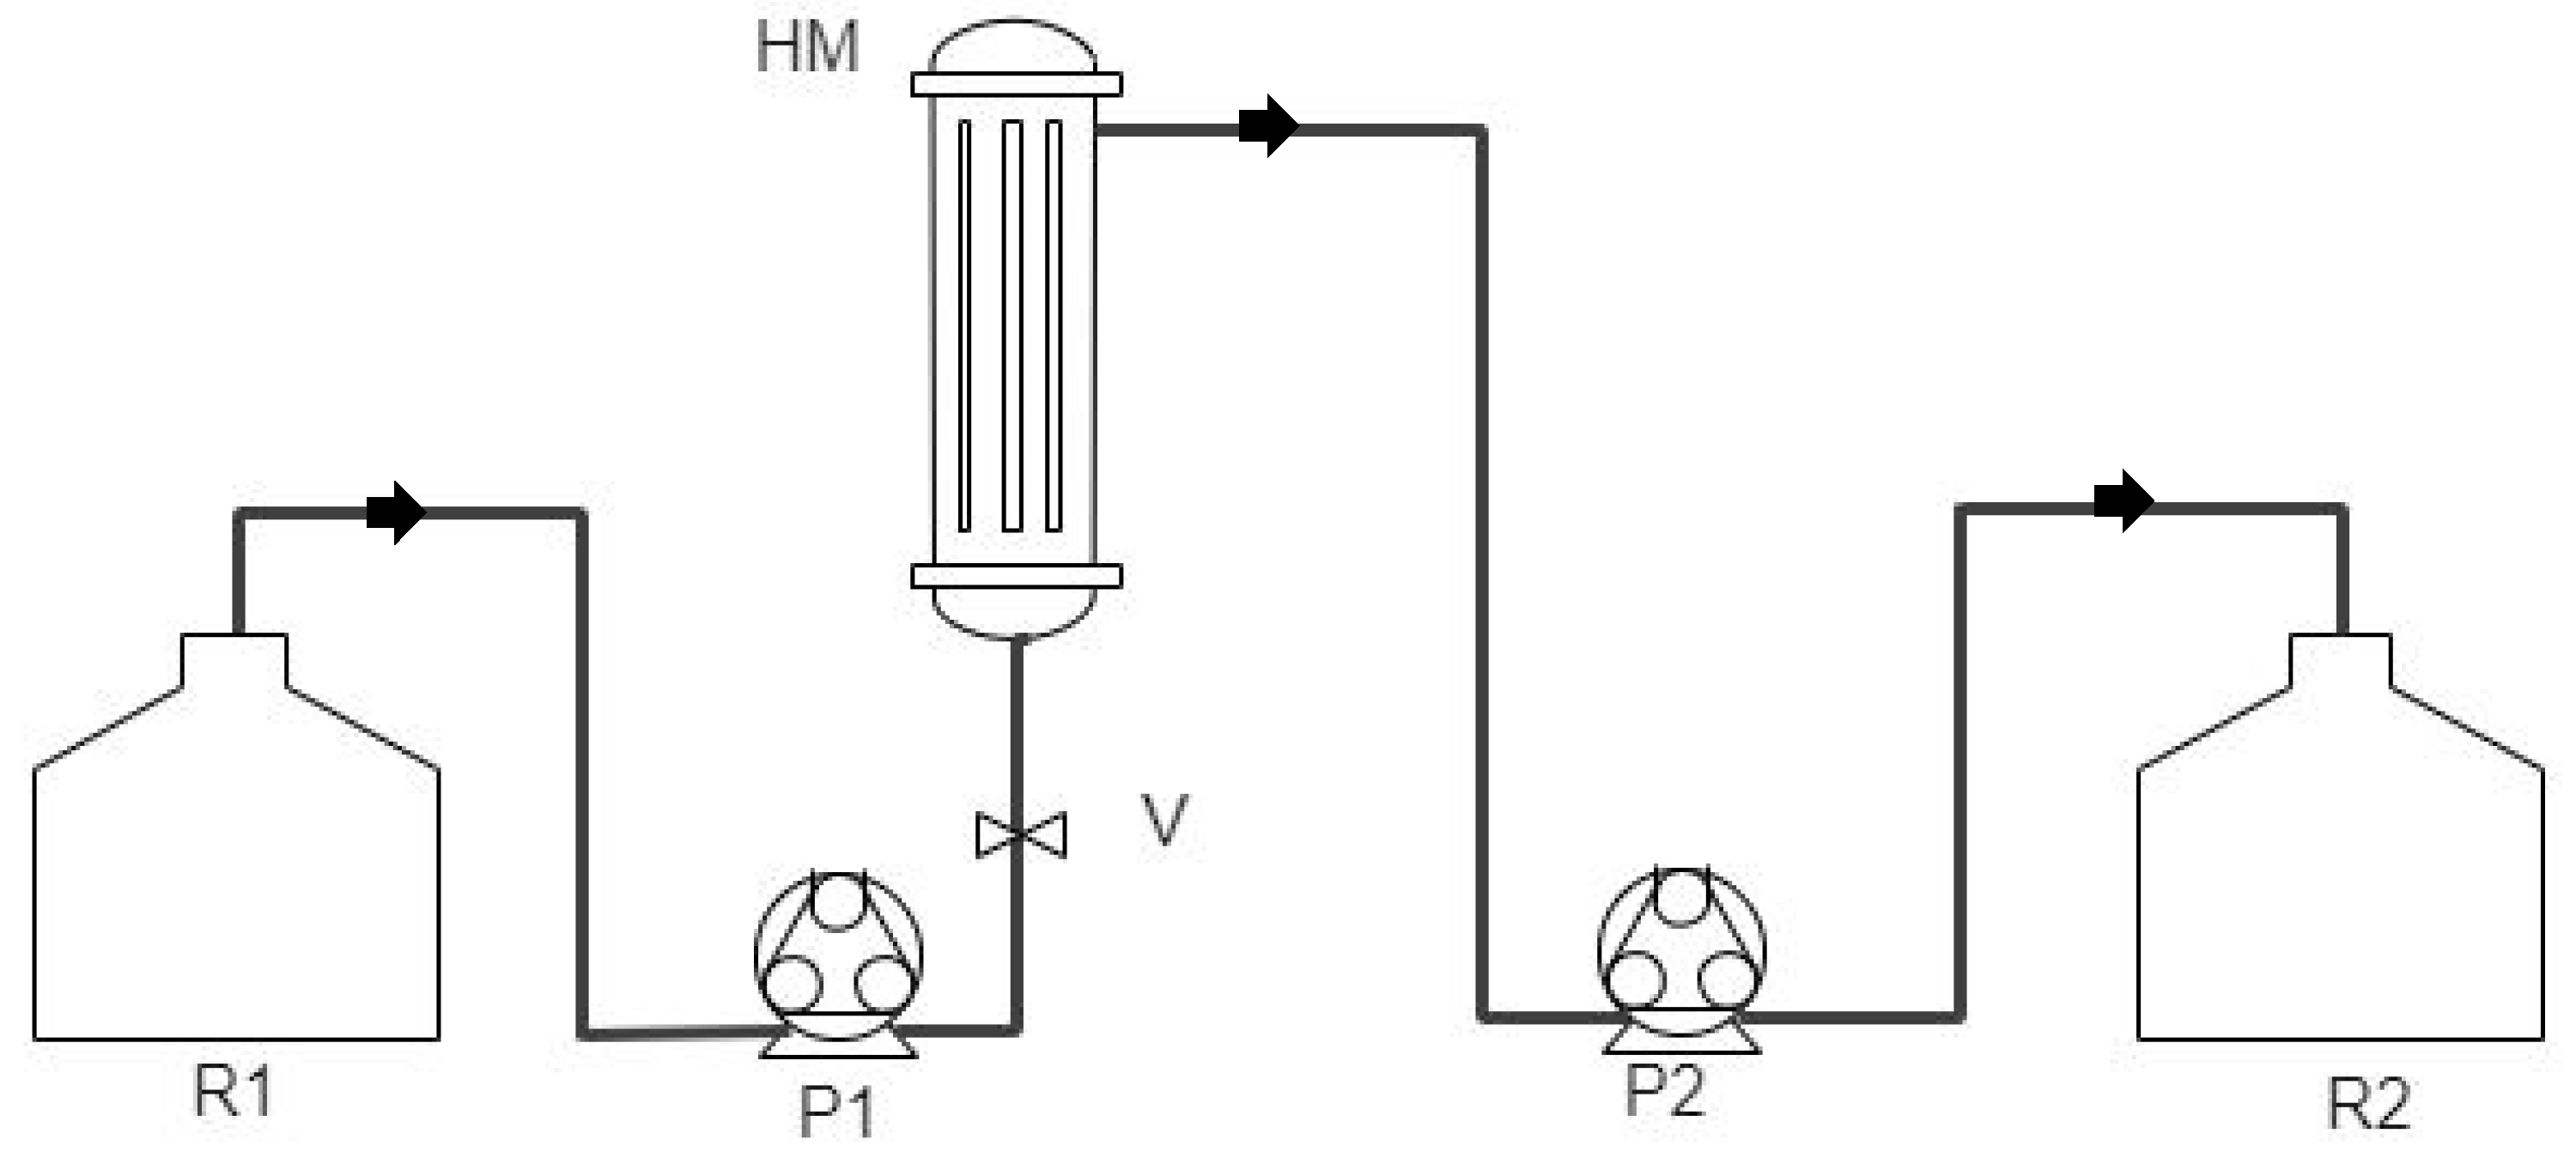
2.1. Experimental Design
2.2. Irrigation Water Streams
2.3. Determination of the Physicochemical Characteristics of the Different Irrigation Water Streams
2.4. Determination of the Irrigation Water Quality Characteristics according to Salt and Ion Toxicity
2.5. Determination of the Microbiological Quality of the Irrigation Water Streams

| Irrigation Water Quality Parameters | Tap Water | Secondary Effluent | Membrane Effluent | FAO Irrigation Water Quality Guidelines [28] |
|---|---|---|---|---|
| pH | 7.68 ± 0.69 | 7.90 ± 0.53 | 8.01± 0.43 | 6.5–8.4 |
| TSS (mg/L) | 0.14 ± 0.06 | 4.33 ± 0.67 | 0.29 ± 0.14 | ≤10.0 ** |
| Conductivity (dS/m) | 0.37 ± 0.14 | 0.74 ± 0.10 | 0.72 ± 0.13 | <0.7 |
| Alkalinity (mg/L CaCO3) | 77.84 ± 8.62 | 120.76 ± 24.44 | 118.12 ± 20.20 | n.p |
| Total Nitrogen (mg/L) | 4.12 ± 1.00 | 12.27 ± 0.50 | 12.57 ± 1.17 | n.p |
| CODcr (mg/L) | <20 | <20 | <20 | n.p |
| NO3-N (mg/L) | 3.36 ± 0.57 | 9.00 ± 2.01 | 8.96 ± 2.33 | <5.0 |
| PO4 (mg/L) | 0.08 ± 0.02 | 0.72 ± 0.12 | 0.77 ± 0.19 | n.p |
| B (mg/L) | 0.02 ± 0.003 | 0.07 ± 0.002 | 0.07 ± 0.001 | <0.7 |
| Ca (mg/L) | 58.92 ± 4.64 | 79.89 ± 12.25 | 79.41±10.37 | n.p |
| Mg (mg/L) | 7.56 ± 0.40 | 14.77 ± 2.85 | 14.99 ± 2.59 | n.p |
| Cl (meq/L) | 0.74 ± 0.05 | 3.23 ± 0.72 | 3.24 ± 0.74 | <4.0 |
| Pb (mg/L) | <0.05 | <0.05 | <0.05 | 5.0 |
| Zn (mg/L) | 0.04 ± 0.01 | 0.13 ± 0.04 | 0.12 ± 0.05 | 2.0 |
| Cd (mg/L) | <0.01 | <0.01 | <0.01 | 0.01 |
| K (mg/L) | 4.97 ± 0.34 | 26.76 ± 2.72 | 27.86 ± 6.01 | n.p |
| Na (meq/L) | 0.75 ± 0.01 | 3.77 ± 0.32 | 3.80 ± 0.17 | <3.0 |
2.6. Determination of the Physical and Chemical Properties of Soil
2.7. Measurement of Plant Height, Fresh Mass, and Dry Matter Content of Biomass
2.8. Statistical Analyses of Data
3. Results and Discussion
3.1. Evaluation of the Physicochemical Suitability of the Different Water Streams for Irrigation
| Quality Criteria | Tap Water | Secondary Effluent | Membrane Effluent |
|---|---|---|---|
| SAR Quality Classification | 0.57 Suitable | 2.34 Suitable | 2.36 Suitable |
| KI Quality Classification | 0.26 Acceptable | 0.92 Acceptable | 0.93 Acceptable |
| MH (%) Quality Classification | 11.37 Suitable | 15.6 Suitable | 15.88 Suitable |
3.2. Evaluation of the Bacteriological Suitability of the Different Irrigation Water Streams
| Indicator Microorganism | Tap Water | Secondary Effluent | Membrane Effluent | EU Water Reuse Guidelines [32] |
|---|---|---|---|---|
| Coliform [CFU/100 mL] | nd | 9.85 ± 6.52 × 10⁴ | 12.75 ± 7.93 | ≤1000 ** |
| Thermotolerant Coliform [CFU/100 mL] | nd | 5.80 ± 4.15 × 10⁴ | <10 | ≤10 * |
| Escherichia coli [CFU/100 mL] | nd | 2.76 ± 2.33 × 10⁴ | <10 | ≤10 |
| Clostridium perfringens [CFU/100 mL] | nd | 1.22 ± 0.87 × 10³ | nd | >4log |
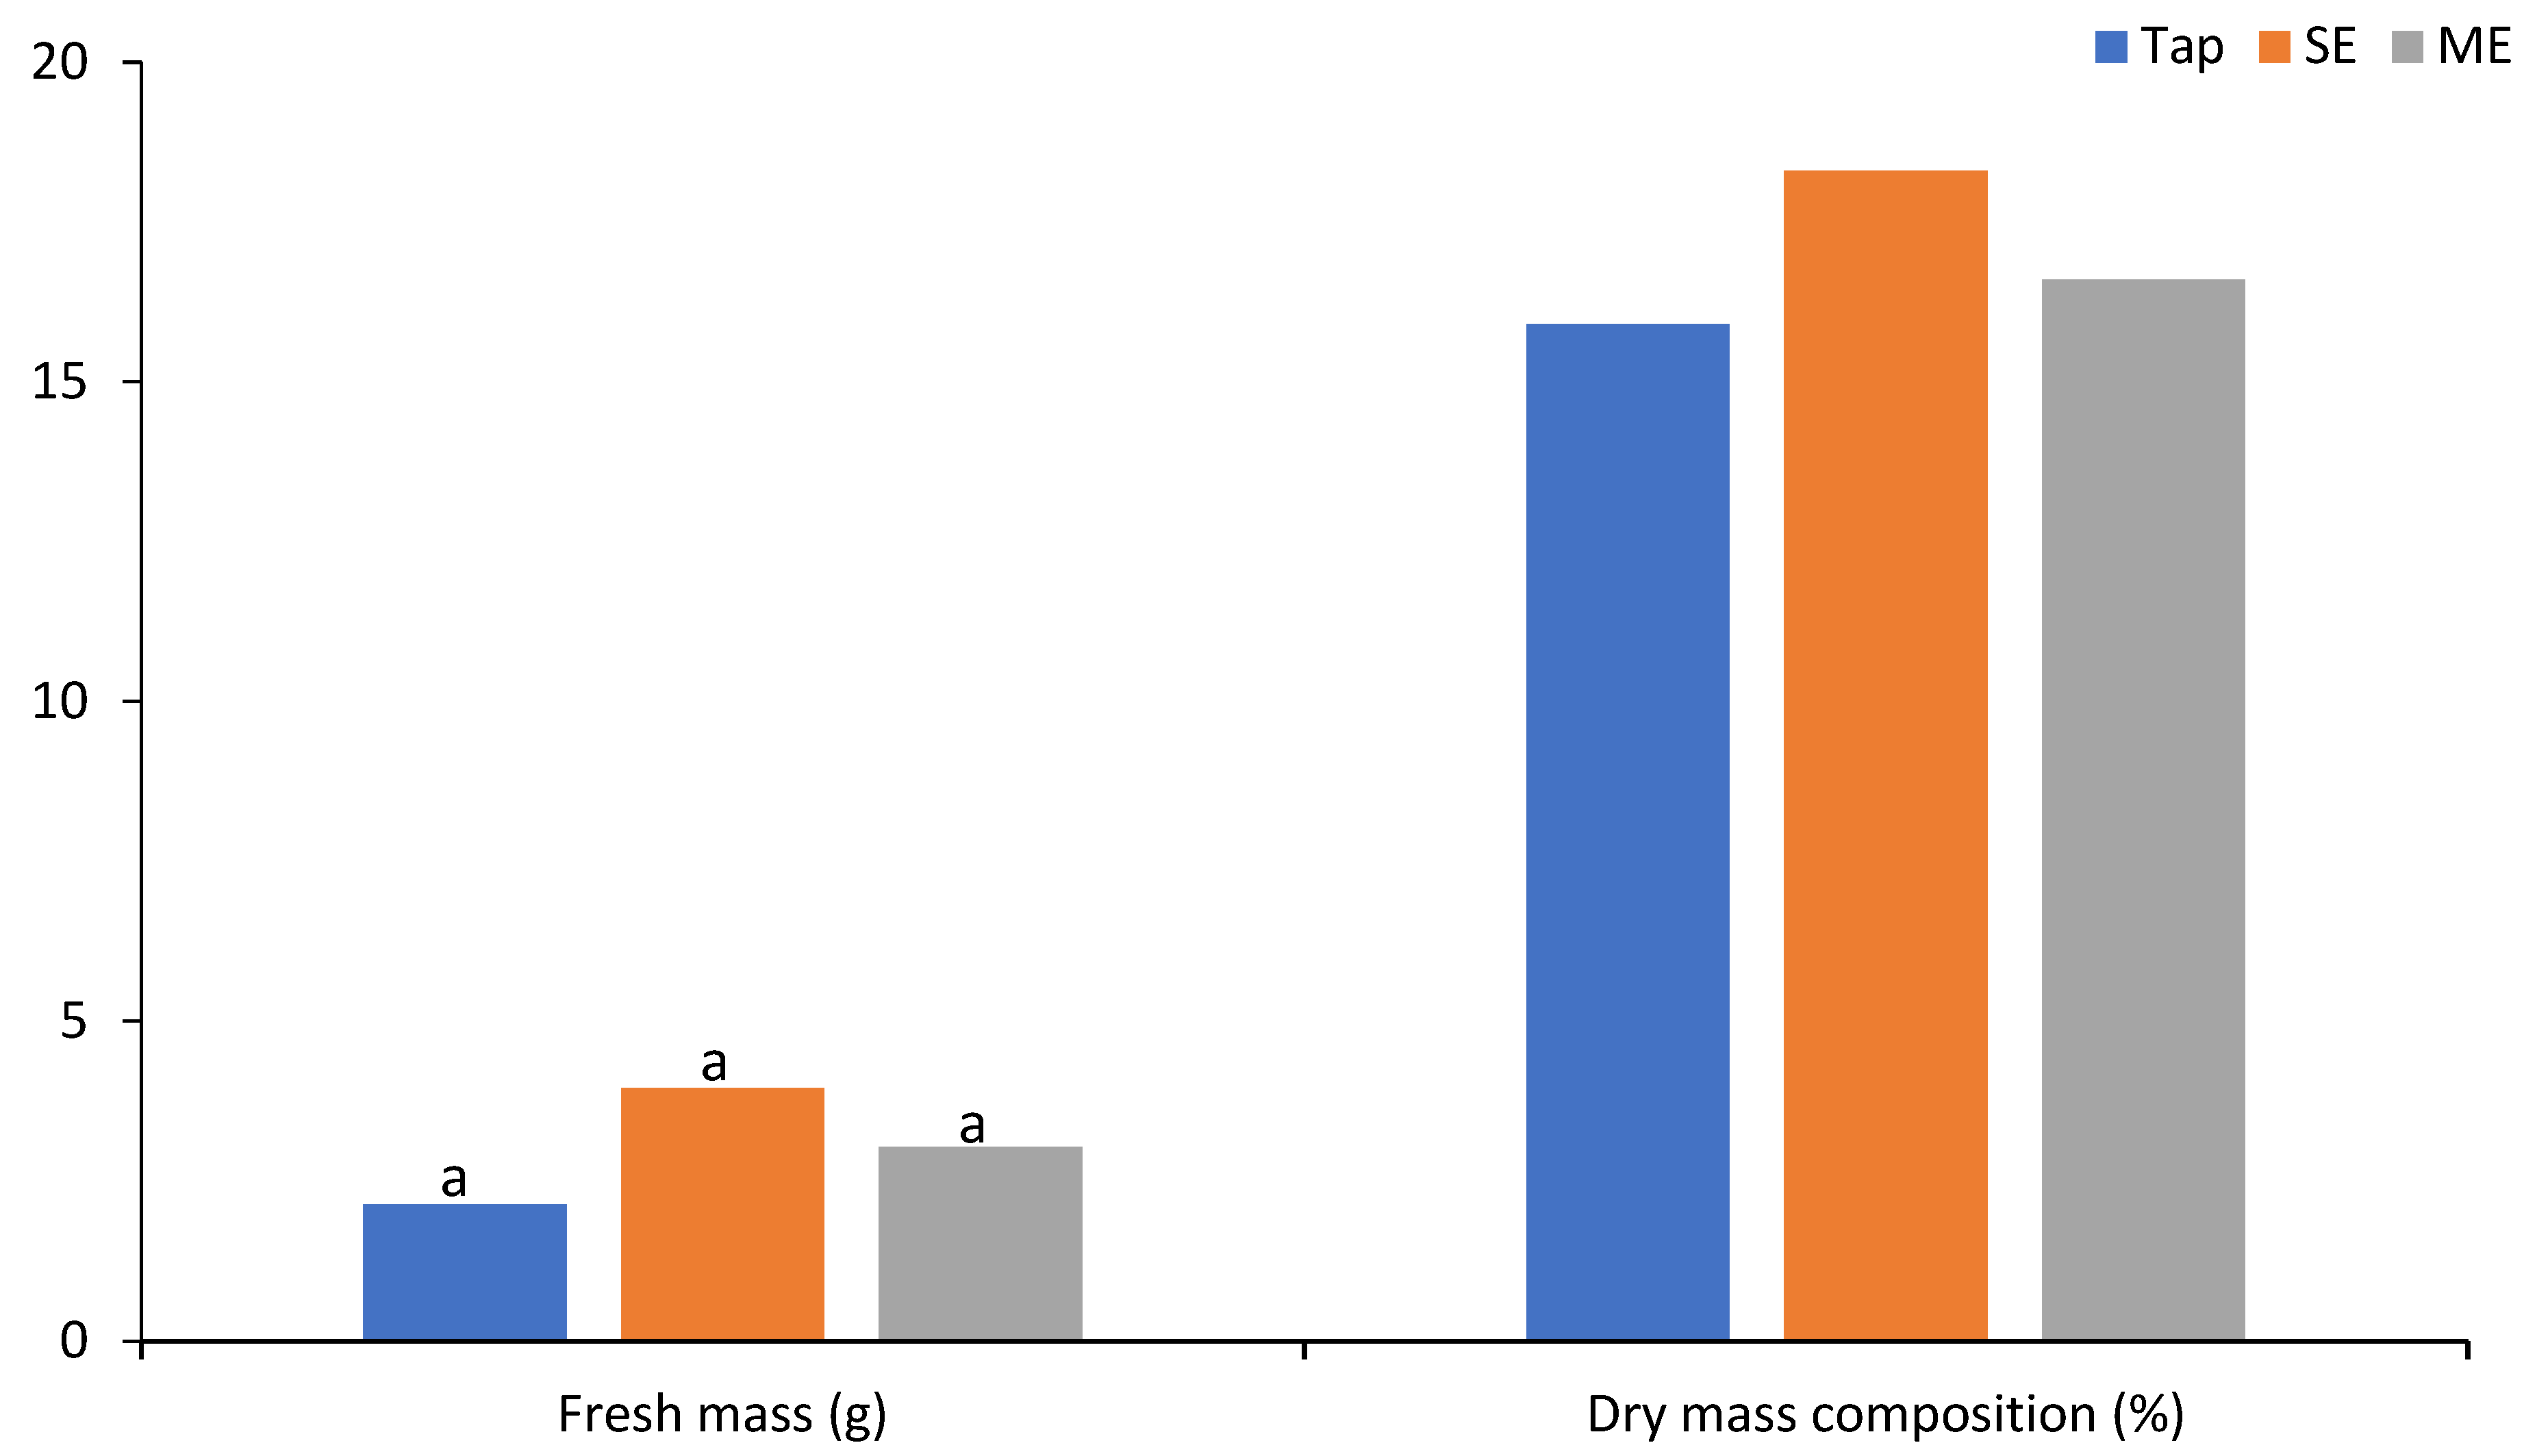
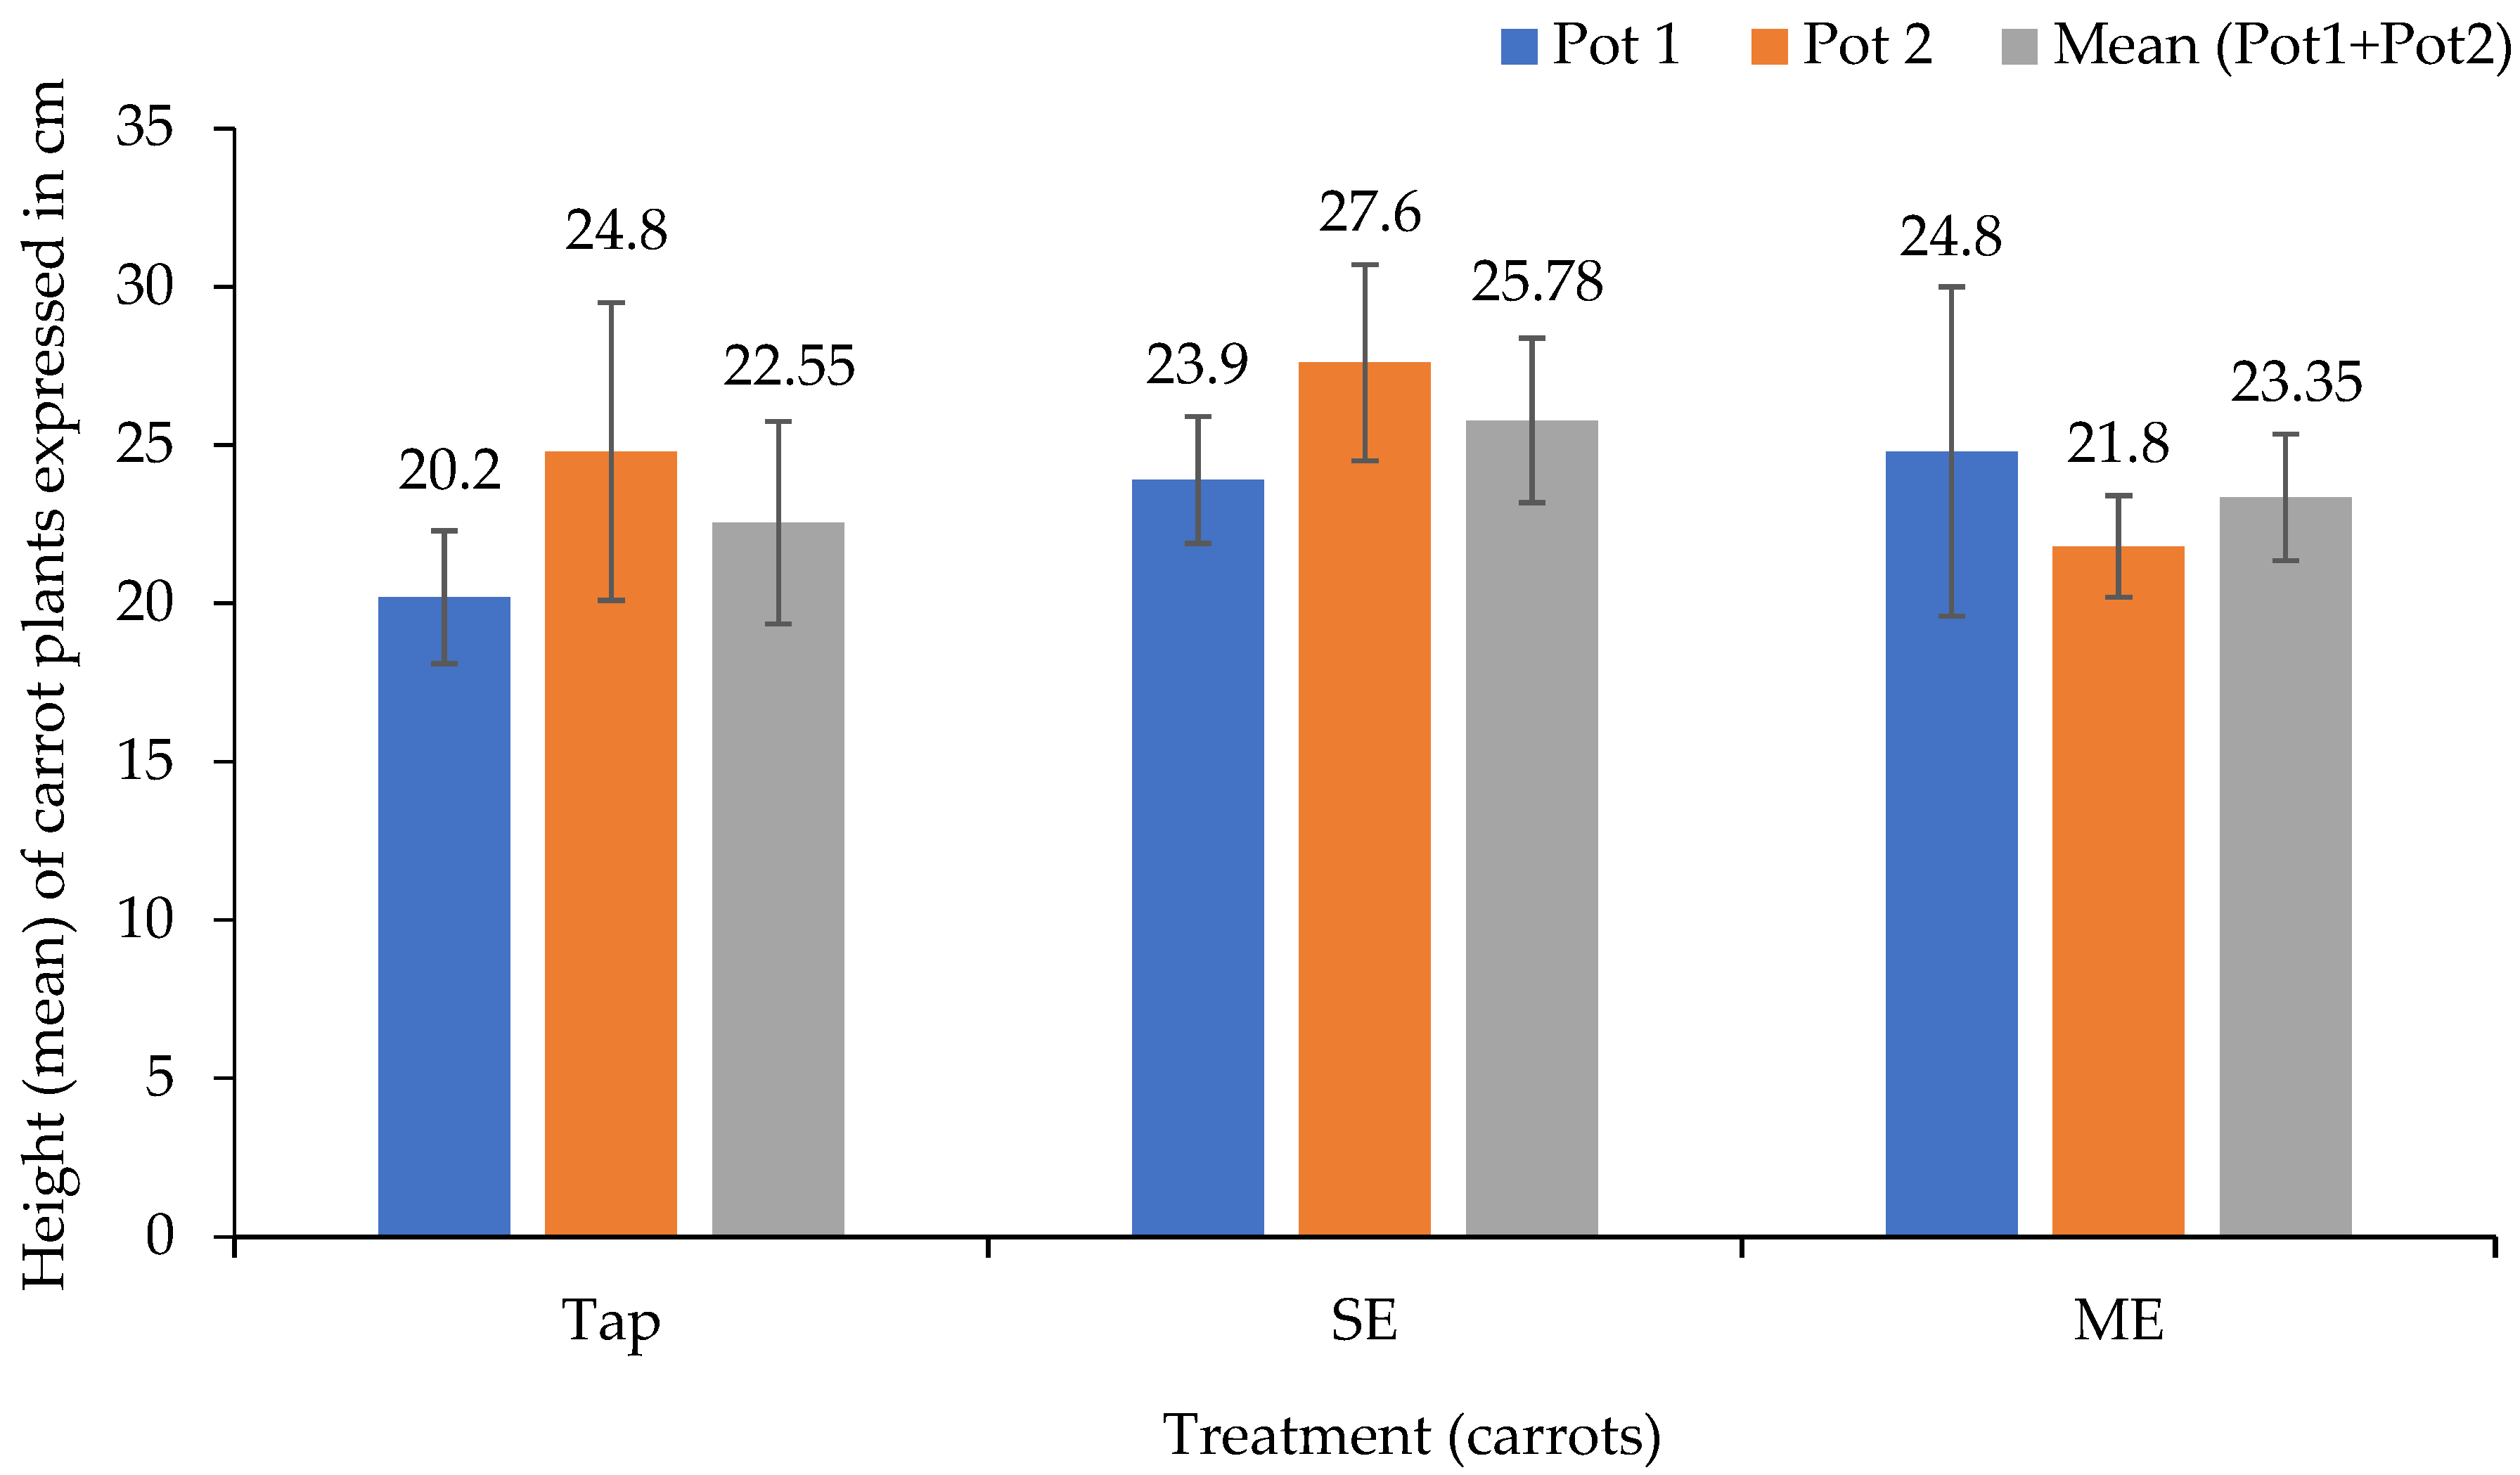
3.3. Impact on Plant Growth and Biomass Production
3.4. Impact of Irrigation Water on Selected Physical and Chemical Properties of Soil
3.4.1. pH
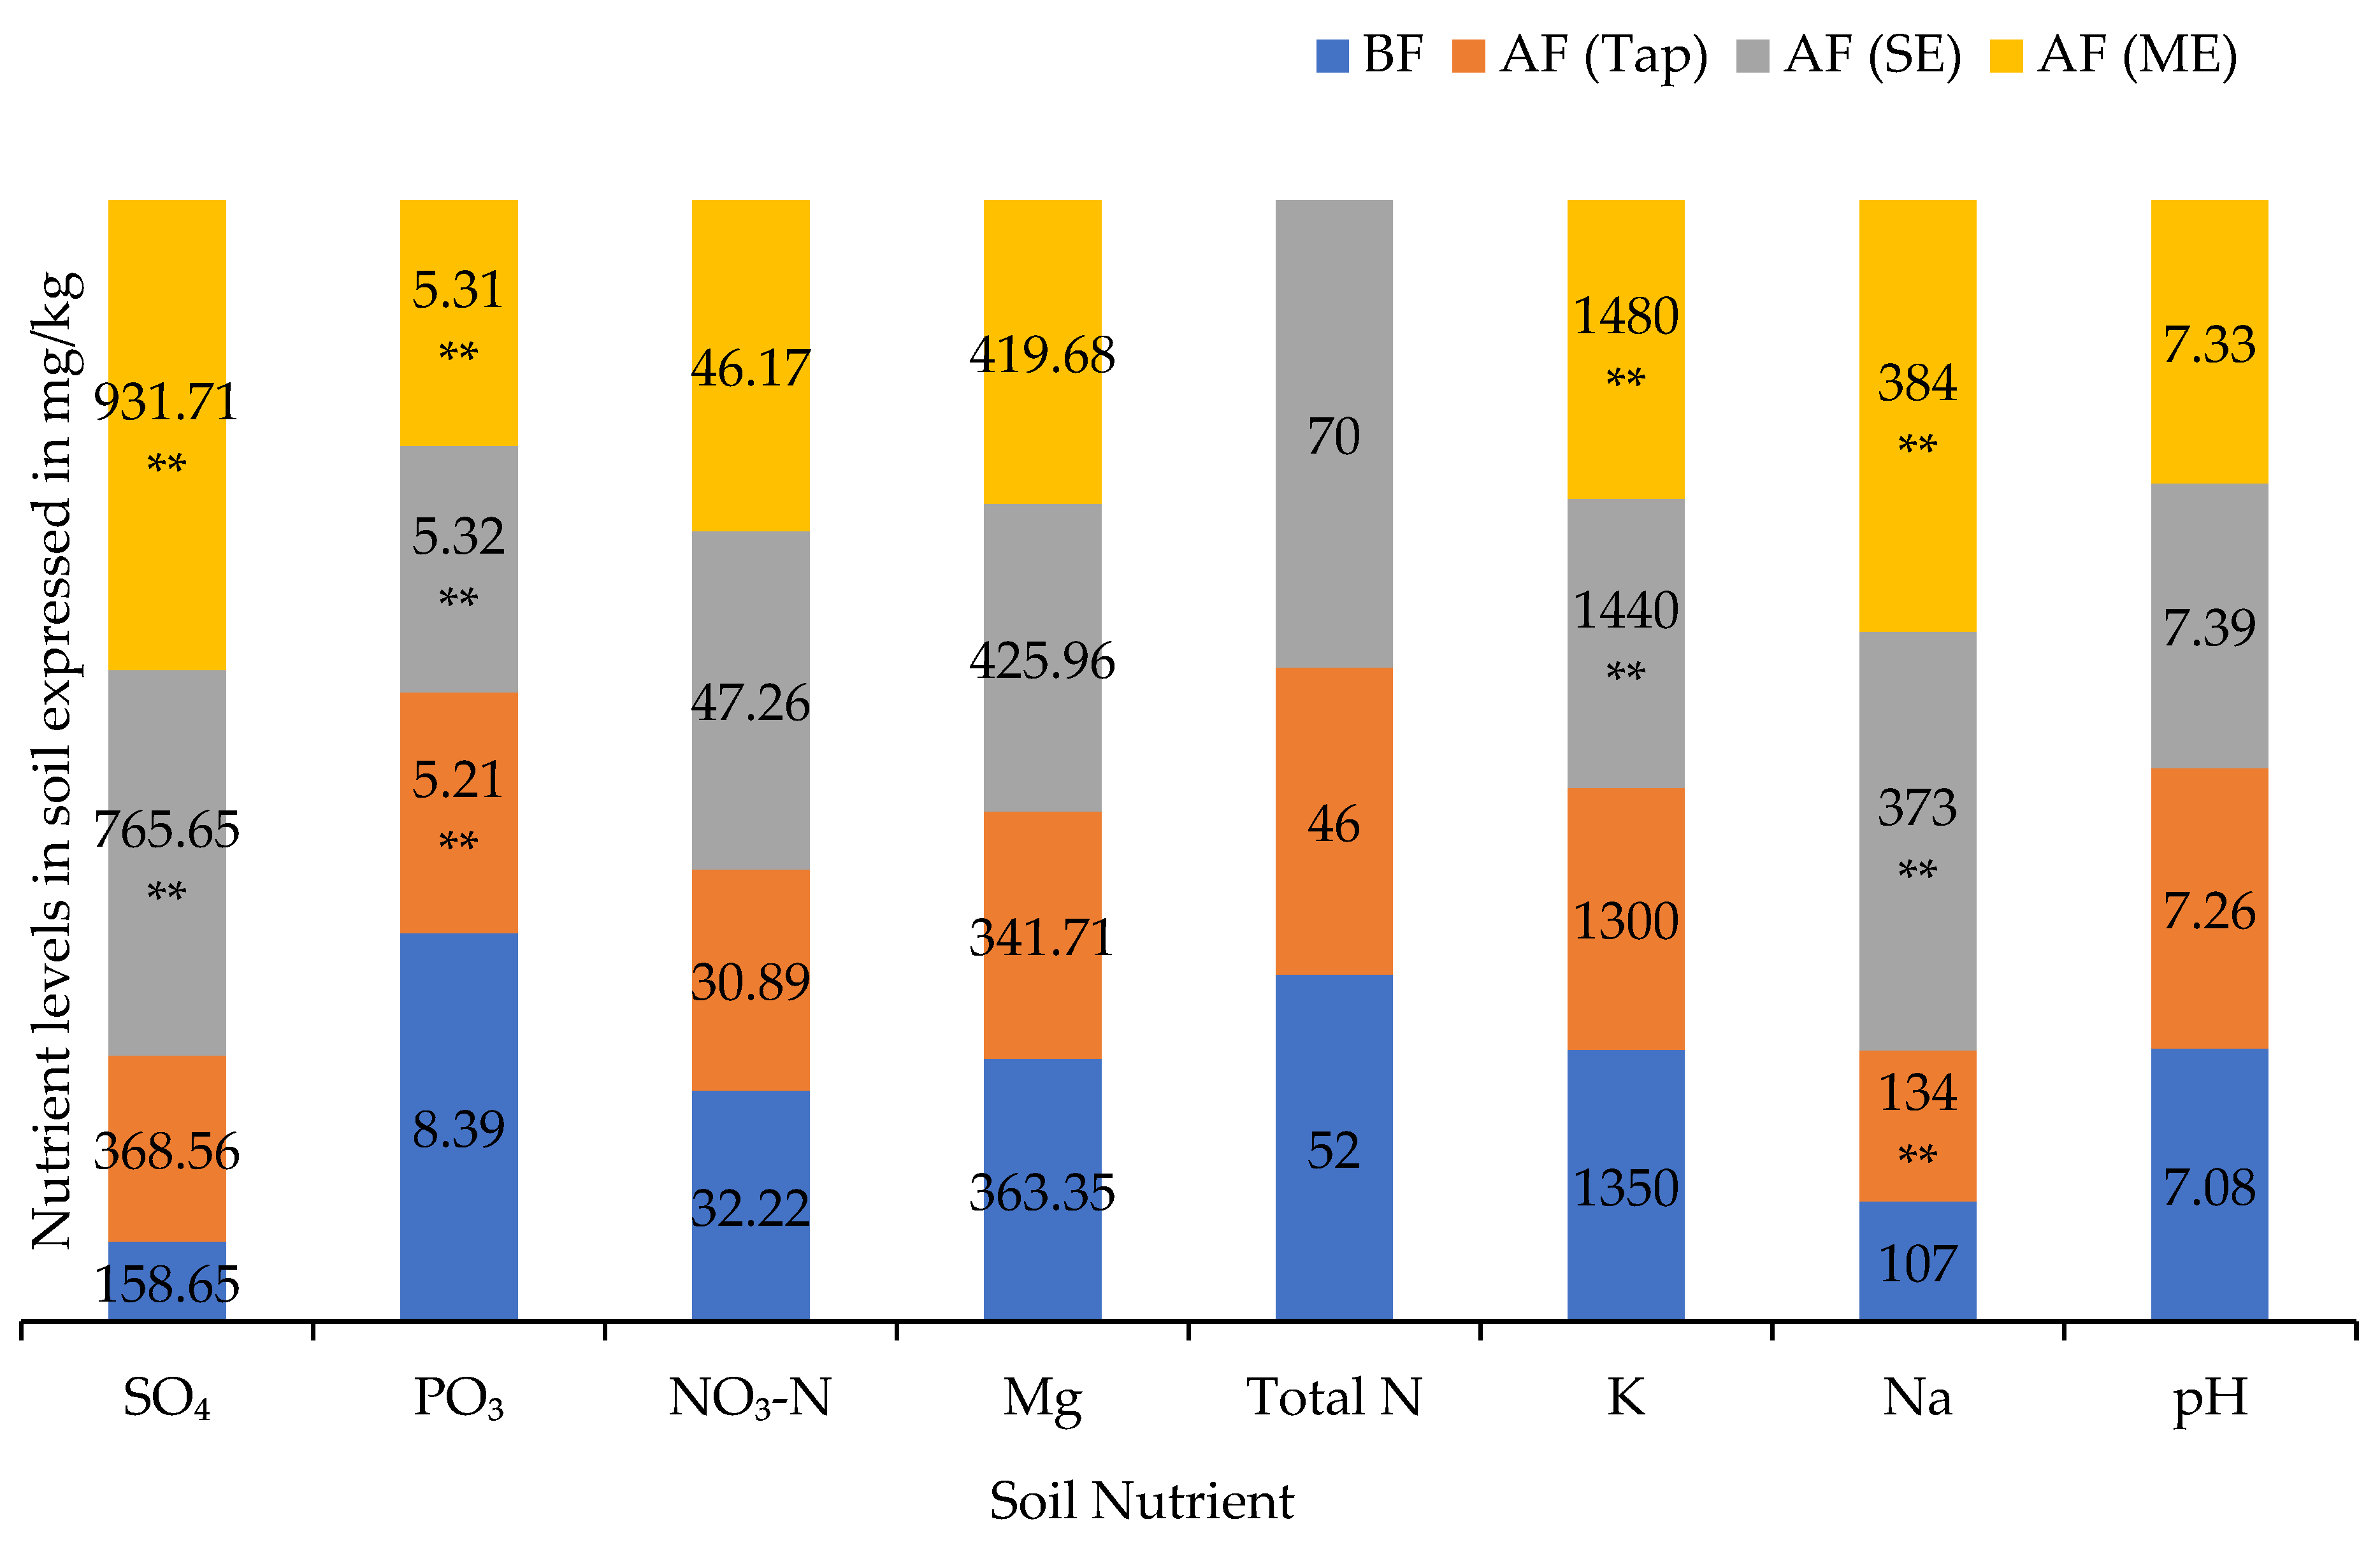
3.4.2. Nutrients
3.4.3. Sodium Accumulation in Irrigated Soil
3.4.4. Distribution of Potentially Toxic Elements (PTEs) in Irrigated Soil
4. Conclusions
Author Contributions
Funding
Data Availability Statement
Acknowledgments
Conflicts of Interest
References
- Martınez, S.; Suay, R.; Moreno, J.; Segura, M.L. Reuse of tertiary municipal wastewater effluent for irrigation of Cucumis melo L. Irrig. Sci. 2012, 31, 661–672. [Google Scholar] [CrossRef]
- Theerawitaya, C.; Pipatsitee, P.; Taota, K.; Praseartkul, P.; Tisarum, R.; Samphumphuang, T.; Pal Singh, H.; Cha-um, S. Impact of irrigation regime on morpho-physiological and biochemical attributes and centelloside content in Indian pennywort (Centella asiatica). Irrig. Sci. 2023, 41, 23–34. [Google Scholar] [CrossRef]
- Alkhamisi, S.A.; Ahmed, M.; Al-Wardy, M.; Prathapar, S.A.; Choudri, B.S. Effect of reclaimed water irrigation on yield attributes and chemical composition of wheat (Triticum aestivum), cowpea (Vigna sinensis), and maize (Zea mays) in rotation. Irrig. Sci. 2016, 35, 87–98. [Google Scholar] [CrossRef]
- Ahmadi, L.; Merkley, G.P. Wastewater reuse potential for irrigated agriculture. Irrig. Sci. 2017, 35, 275–285. [Google Scholar] [CrossRef]
- Gong, J.; He, L.; Liu, X.; Wang, S. Optimizing the allocation of irrigation water for multiple crops based on the crop water allocation priority. Irrig. Sci. 2022, 41, 49–68. [Google Scholar] [CrossRef]
- de Nicola, E.; Aburizaiza, O.; Siddique, A.; Khwaja, H.; Carpenter, D.O. Climate change and water scarcity: The case of Saudi Arabia. Ann. Glob. Health 2015, 81, 342–353. [Google Scholar] [CrossRef] [PubMed]
- Gosling, S.N.; Arnell, N.W. A global assessment of the impact of climate change on water scarcity. Clim. Chang. 2016, 134, 371–385. [Google Scholar] [CrossRef]
- Berríos, P.; Temnani, A.; Zapata, S.; Forcen-Munoz, M.; Franco, J.A.; Pastor, A.P. Sensitivity to water deficit of the second stage of fruit growth in late mandarin trees. Irrig. Sci. 2023, 41, 35–47. [Google Scholar] [CrossRef]
- United Nations Environment. Global Environment Outlook—GEO-6, Healthy Planet, Healthy People; Cambridge University Press: Cambridge, UK, 2019; pp. 34–37. [Google Scholar] [CrossRef]
- Mays, C.; Garza, G.L.; Waite-Cusic, J.; Radniecki, T.S.; Navab-Daneshmand, T. Impact of biosolids amendment and wastewater effluent irrigation on enteric antibiotic-resistant bacteria—A greenhouse study. Water Res. X 2021, 13, 100119. [Google Scholar] [CrossRef] [PubMed]
- Makhadmeh, I.M.; Gharaiebeh, S.F.; Albalasmeh, A.A. Impact of Irrigation with treated domestic wastewater on squash (Cucurbita pepo L.) fruit and seed under semi-arid conditions. Horticulturae 2021, 7, 226. [Google Scholar] [CrossRef]
- Reis, M.M.; da Silva, A.J.; Santos, L.D.T.; Lopes, E.M.G.; Barros, R.E.; Donato, L.M.S. Millet irrigation with treated wastewater: Gas exchange response and nutrient accumulation. Agric. Sci. 2019, 43. [Google Scholar] [CrossRef]
- Hashem, M.S.; Qi, X. Treated wastewater irrigation-a review. Water 2021, 13, 1527. [Google Scholar] [CrossRef]
- Singh, G.; Nagora, P.R.; Haksar, P.; Rani, A. Species influenced growth, biomass allocation and productivity in wastewater irrigated plants in sandy soils of Indian desert. Irrig. Sci. 2022, 40, 829–843. [Google Scholar] [CrossRef]
- Zavadil, J. The effect of municipal wastewater irrigation on the yield and quality of vegetables and crops. Soil Water Res. 2009, 4, 91–103. [Google Scholar] [CrossRef]
- Al-Lahham, O.; El Assib, N.M.; Fayyad, M. Impact of treated wastewater irrigation on quality attributes and contamination of tomato fruit. Agric. Water Manag. 2003, 61, 51–62. [Google Scholar] [CrossRef]
- Al-Nakshabandi, G.A.; Saqqar, M.M.; Shatanawi, M.R.; Fayyad, M.; Al-Horani, H. Some environmental problems associated with the use of treated wastewater for irrigation in Jordan. Agric. Water Manag. 1997, 34, 81–94. [Google Scholar] [CrossRef]
- Alkhamisi, S.A.; Abdelrahman, H.A.; Ahmed, M.; Goosen, M.F.A. Assessment of reclaimed water irrigation on growth, yield, and water-use efficiency of forage crops. Appl. Water Sci. J. 2011, 1, 57–65. [Google Scholar] [CrossRef]
- Alkhamisi, S.A. Maximizing the Use of Reclaimed Water for Crop Production in Arid Regions. Doctoral Thesis, Sultan Qaboos University, Muscat, Oman, 2013. [Google Scholar]
- El-Batal, A.I.; Ismail, M.A.; Amin, M.A.; El-Sayyad, G.S.; Osman, M.S. Selenium nanoparticles induce growth and physiological tolerance of wastewater-stressed carrot plants. Biologia 2023, 78, 2339–2355. [Google Scholar] [CrossRef]
- Malchi, T.; Maor, Y.; Tadmor, G.; Shenker, M.; Chefetz, B. Irrigation of root vegetables with treated wastewater: Evaluating uptake of pharmaceuticals and the associated human health risks. Environ. Sci. Technol. 2014, 48, 9325–9333. [Google Scholar] [CrossRef] [PubMed]
- Hussain, A.; Priyadarshi, M.; Dubey, S. Experimental study on accumulation of heavy metals in vegetables irrigated with treated wastewater. Appl. Water Sci. 2019, 9, 122. [Google Scholar] [CrossRef]
- Letshwenyo, M.W. Accumulation of heavy metals and bacteriological contaminations in carrots and okra irrigated with tertiary wastewater. Environ. Qual. Manag. 2021, 30, 47–59. [Google Scholar] [CrossRef]
- Naz, S.; Anjum, M.A.; Sadiq, B.; Ahmad, R.; Altaf, M.A.; El-Sheikh, M.A.; Shakoor, A. Purification of sewage wastewater through sand column filter for lessening of heavy metals accumulation in lettuce, carrot, and cauliflower. Water 2022, 14, 3770. [Google Scholar] [CrossRef]
- Jorge, M.F.; da Silva, L.D.B.; Hüther, C.M.; Cecchin, D.; de Melo, A.C.F.; Francisco, J.P.; Nascentes, A.L.; Alves, D.G.; Guerra, J.G.M. Potential use of treated wastewater from a cattle operation in the fertigation of organic carrots. Braz. J. Environ. Sci. 2022, 57, 542–554. [Google Scholar] [CrossRef]
- Mukherjee, I.; Singh, U.K.; Chakma, S. Evaluation of groundwater quality for irrigation water supply using multi-criteria decision-making techniques and GIS in an agroeconomic tract of Lower Ganga basin, India. J. Environ. Manag. 2022, 309, 114691. [Google Scholar] [CrossRef] [PubMed]
- Khalid, S.; Shahid, M.; Natasha Bibi, I.; Sarwar, T.; Shah, A.H.; Niazi, N.K. A review of environmental contamination and health risk assessment of wastewater use for crop irrigation with a focus on low and high–income countries. Int. J. Environ. Res. Public Health 2018, 15, 895. [Google Scholar] [CrossRef]
- Food and Agriculture Organisation (FAO). Irrigation and Drainage Paper 29. In Water Quality for Agriculture; Food and Agriculture Organization of the United Nations: Rome, Italy, 1985. [Google Scholar]
- World Health Organization (WHO). Volume 2: Wastewater use in agriculture. In Guidelines for the Safe Use of Wastewater, Excreta and Greywater; World Health Organization (WHO): Geneva, Switzerland, 2006; Volume 8. [Google Scholar]
- California Department of Public Health. Water Recycling Criteria; California Code of Regulations: Sacramento, CA, USA, 2009.
- United States Environmental Protection Agency. Guidelines for Water Reuse; United States Environmental Protection Agency: Washington, DC, USA, 2012.
- European Union (EU). Regulation (EU) 2020/741 of the European Parliament and the Council on Minimum Requirements for Water Reuse; Official Journal of the European Union: Brussels, Belgium, 2020.
- APHA/AWWA/WEF. Standard Methods for the Examination of Water and Wastewater, 22nd ed.; American Public Health Association: Washington, DC, USA; American Water Works Association: Washington, DC, USA; Water Environment Federation: Washington, DC, USA, 2012. [Google Scholar]
- Azhari, H.E.; Cherif, E.K.; Sarti, O.; Azzirgue, E.M.; Dakak, H.; Yachou, H.; Esteves da Silva, J.C.G.; Salmoun, F. Assessment of surface water quality using the water quality index (IWQ), multivariate statistical analysis (MSA) and geographic information system (GIS) in Oued Laou Mediterranean Watershed, Morocco. Water 2022, 15, 130. [Google Scholar] [CrossRef]
- Hwang, J.Y.; Park, S.; Kim, H.-K.; Kim, M.-S.; Jo, H.-J.; Kim, J.-I.; Lee, G.-M.; Shin, I.-K.; Kim, T.-S. Hydrochemistry for the Assessment of Groundwater Quality in Korea. J. Agric. Chem. Environ. 2017, 6, 73576. [Google Scholar] [CrossRef]
- ČSN 75 7837; Jakost Vod–Stanovení Koliformních Bakterií v Nedesinfikovaných Vodác (Water Quality–Detection and Enumeration of Coliform Bacteria in Non-Disinfected Waters). Office for Technical Standardization, Metrology and State Testing: Prague, Czech Republic. Available online: https://shop.normy.biz/detail/85345#zakladni-informace (accessed on 19 December 2023).
- Ambrožová, J.R.; Vejmelková, D.; Škopová, V.; N217019—Laboratoř Hydrobiologie a Mikrobiologie (Laboratory of Hydrobiology and Microbiology). Kultivační Stanovení: Stanovení Koliformních Bakterií (Cultivation Determination: Determination of Coliform Bacteria); Ústav Technologie Vody a Prostředí (Institute of Water and Environmental Technology, University of Chemistry and Technology): Prague, Czech Republic, 2015. [Google Scholar]
- Vyhláška č. 252/2004 Sb., Příloha č. 6. (Decree 252/2004, Annex Number 6). Available online: https://www.zakonyprolidi.cz/cs/2004-252 (accessed on 19 December 2023).
- Ambrožová, J.R.; Vejmelková, D.; Škopová, V.; N217019—Laboratoř Hydrobiologie a Mikrobiologie (Laboratory of Hydrobiology and Microbiology). Kultivační Stanovení: Stanovení Clostridium perfringens (Cultivation Determination: Determination of Clostridium perfringens); Ústav Technologie Vody a Prostředí (Institute of Water and Environmental Technology, University of Chemistry and Technology): Prague, Czech Republic, 2015. [Google Scholar]
- ČSN 75 7835; Jakost Vod–Stanovení Termotolerantních Koliformních Bakterií a Escherichia coli (Water Quality—Detection and Enumeration of Thermotolerant Coliform Bacteria and Escherichia coli). Office for Technical Standardization, Metrology and State Testing: Prague, Czech Republic. Available online: https://www.tzb-info.cz/normy/csn-75-7835-2009-03 (accessed on 19 December 2023).
- Ambrožová, J.R.; Vejmelková, D.; Škopová, V. N217019—Laboratoř Hydrobiologie a Mikrobiologie (Laboratory of Hydrobiology and Microbiology). Kultivační Stanovení: Stanovení Termotolerantních Koliformních Bakterií a Escherichia coli (Cultivation Determination: Determination of Thermotolerant Coliform Bacteria and Escherichia coli); Ústav Technologie Vody a Prostředí (Institute of Water and Environmental Technology, University of Chemistry and Technology): Prague, Czech Republic, 2015. [Google Scholar]
- Ofori, S.; Abebrese, D.K.; Klement, A.; Provazník, D.; Tomášková, I.; Růžičková, I.; Wanner, J. Impact of treated wastewater on plant growth: Leaf fluorescence, reflectance and biomass-based assessment (unpublished work). Water Sci. Technol. 2023; revised version to be submitted. [Google Scholar]
- Motsara, M.R.; Roy, R.N. Guide to laboratory establishment for plant nutrient analysis. In FAO Fertilizer and Plant Nutrition Bulletin 19; Food and Agriculture Organization of the United Nations: Rome, Italy, 2008. [Google Scholar]
- Houba, V.J.G.; Temminghoff, E.J.M.; Gaikhorst, G.A.; van Vark, W. Soil analysis procedures using 0.01 M calcium chloride as extraction reagent. Commun. Soil Sci. Plant Anal. 2000, 31, 1299–1396. [Google Scholar] [CrossRef]
- Blake, G.R.; Hartge, K.H. Particle Density. In Methods of Soil Analysis; Soil Science Society of America, Inc.: Wisconsin, DC, USA, 1986; pp. 377–382. [Google Scholar] [CrossRef]
- ČSN EN ISO 17892-4; Geotechnický Průzkum a Zkoušení–Laboratorní Zkoušky Zemin–Část 4: Stanovení Zrnitosti; Třídící Znak, 72 1007; Office for Technical Standardization, Metrology and State Testing: Prague, Czech Republic, 2017.
- Organization for Economic Co-Operation and Development (OECD). Fruit and Vegetables Scheme: Guidelines on Objective Tests to Determine Quality of Fruit and Vegetables, Dry and Dried Produce. 2018. Available online: http://www.oecd.org/agriculture/fruit-vegetables/ (accessed on 10 May 2022).
- Queensland Government. Soil Sodicity. 2014. Available online: https://www.qld.gov.au/environment/land/management/soil/soil-properties/sodicity (accessed on 26 August 2023).
- Kalavrouziotis, I.K.; Koukoulakis, P.; Kostakioti, E. Assessment of metal transfer factor under irrigation with treated municipal wastewater. Agric. Water Manag. 2012, 103, 114–119. [Google Scholar] [CrossRef]
- Bedbabis, S.; Rouina, B.B.; Boukhris, M.; Ferrara, G. Effect of irrigation with treated wastewater on soil chemical properties and infiltration rate. J. Environ. Manag. 2014, 133, 45–50. [Google Scholar] [CrossRef] [PubMed]
- Jahan, K.M.; Khatun, R.; Islam, M.Z. Effects of wastewater irrigation on soil physico-chemical properties, growth and yield of tomato. Prog. Agric. 2020, 30, 352–359. [Google Scholar] [CrossRef]
- Gorfie, B.N.; Tuhar, A.W.; Keraga, A.S.; Woldeyohannes, A.B. Effect of brewery wastewater irrigation on soil characteristics and lettuce (Lactuca sativa) crop in Ethiopia. Agric. Water Manag. 2022, 269, 107633. [Google Scholar] [CrossRef]
- Jiménez, B. Irrigation in developing countries using wastewater. Int. Rev. Environ. Strateg. 2006, 6, 229–250. [Google Scholar]
- Food and Agriculture Organisation. User Manual for Irrigation with Treated Wastewater; RNE 2003. TC/D/Y5009F/1/10.03/100; Food and Agriculture Organisation of the United Nations: Cairo, Egypt, 2003. [Google Scholar]
- Ofori, S.; Puškáčová, A.; Růžičková, I.; Wanner, J. Treated wastewater reuse for irrigation: Pros and cons. Sci. Total Environ. 2021, 760, 144026. [Google Scholar] [CrossRef] [PubMed]
- Foglia, A.; Gonzalez-Camejo j Radini, S.; Sgroi, M.; Li, K.; Eusebi, A.L.; Fatone, F. Transforming wastewater treatment plants into reclaimed water facilities in water-unbalanced regions. An overview of possibilities and recommendations focusing on the Italian case. J. Clean. Prod. 2023, 410, 137264. [Google Scholar] [CrossRef]
- Drechsel, P.; Marjani Zadeh, S.; Pedrero, F. (Eds.) Water Quality in Agriculture: Risks and Risk Mitigation; FAO & IWMI: Rome, Italy, 2023. [Google Scholar] [CrossRef]
- Pescod, M. Wastewater Treatment and Use in Agriculture; Irrigation and Drainage Paper 47; Food and Agriculture Organization of the United Nations (FAO): Rome, Italy, 1992. [Google Scholar]
- Woomer, P.L.; Martin, A.; Albrecht, A.; Reseck, D.V.S.; Scharpenseel, H.W. The importance and management of soil organic matter in the tropics. In The Biological Management of Tropical Soil Fertility; Woomer, P.L., Swift, M.J., Eds.; John Wiley and Sons: Chichester, UK, 1994; pp. 47–80. [Google Scholar]
- Tarchouna, L.G.H.; Merdy, P.; Raynaud, M.; Pfeifer, H.R.; Lucas, Y. Effects of long-term irrigation with treated wastewater. Part I: Evolution of soil-chemical properties. Appl. Geochem. 2010, 25, 1703–1710. [Google Scholar] [CrossRef]
- Mason, B. Soil Doctor. Bicarbonates: Is it a Problem in Your Soil? 2020. Available online: https://www.soildoctorconsulting.com/pro-tips/bicarbonate-soil (accessed on 15 August 2023).
- Kumar, A.; Christen, E. Developing a Systematic Approach to Winery Wastewater Management; Report CSL05/02; Final Report to Grape and Wine Research & Development Corporation (CSIRO Land and Water Science Report Adelaide); Grape and Wine Research & Development Corporation: Adelaide, Australia, 2009. [Google Scholar]
- Bedbabis, S.; Trigui, D.; Ahmeda, C.B.; Clodoveo, M.L.; Camposeo, S.; Vivaldi, G.A.; Rouina, B.B. Long-terms effects of irrigation with treated municipal wastewater on soil, yield and olive oil quality. Agric. Water Manag. 2015, 160, 14–21. [Google Scholar] [CrossRef]
- Tabatabai, M.A. Physicochemical fate of sulfate in soils. J. Air Pollut. Control Assoc. 1987, 37, 34–38. [Google Scholar] [CrossRef]
- Ayoub, S.; Al-Shdiefat, S.; Rawashdeh, H.; Bashabsheh, I. Utilization of reclaimed wastewater for olive irrigation: Effect on soil properties, tree growth, yield and oil content. Agric. Water Manag. 2016, 176, 163–169. [Google Scholar] [CrossRef]


| Tap 1 | SE 2 | Tap 3 | SE 4 | |
| Tap 1 | 1 | |||
| SE 2 | 0.478449 | 1 | ||
| Tap 3 | 0.814232 | 0.818247 | 1 | |
| SE 4 | 0.522865 | 0.972042 | 0.798666 | 1 |
| Potentially Toxic Elements | PTE Levels in Soil before Irrigation (mg/kg) | PTE Levels in Soil after Irrigation (mg/kg) | Maximum Tolerable Soil Concentration (mg/kg) [29] | ||
|---|---|---|---|---|---|
| Tap | SE | ME | |||
| Pb | <0.04 | <0.04 | <0.04 | <0.04 | 7.00 |
| Zn | 0.1 | 0.02 | 0.01 | 0.01 | n.p |
| Cd | <0.01 | <0.01 | <0.01 | <0.01 | 4.00 |
Disclaimer/Publisher’s Note: The statements, opinions and data contained in all publications are solely those of the individual author(s) and contributor(s) and not of MDPI and/or the editor(s). MDPI and/or the editor(s) disclaim responsibility for any injury to people or property resulting from any ideas, methods, instructions or products referred to in the content. |
© 2024 by the authors. Licensee MDPI, Basel, Switzerland. This article is an open access article distributed under the terms and conditions of the Creative Commons Attribution (CC BY) license (https://creativecommons.org/licenses/by/4.0/).
Share and Cite
Ofori, S.; Abebrese, D.K.; Růžičková, I.; Wanner, J. Reuse of Treated Wastewater for Crop Irrigation: Water Suitability, Fertilization Potential, and Impact on Selected Soil Physicochemical Properties. Water 2024, 16, 484. https://doi.org/10.3390/w16030484
Ofori S, Abebrese DK, Růžičková I, Wanner J. Reuse of Treated Wastewater for Crop Irrigation: Water Suitability, Fertilization Potential, and Impact on Selected Soil Physicochemical Properties. Water. 2024; 16(3):484. https://doi.org/10.3390/w16030484
Chicago/Turabian StyleOfori, Solomon, David Kwesi Abebrese, Iveta Růžičková, and Jiří Wanner. 2024. "Reuse of Treated Wastewater for Crop Irrigation: Water Suitability, Fertilization Potential, and Impact on Selected Soil Physicochemical Properties" Water 16, no. 3: 484. https://doi.org/10.3390/w16030484
APA StyleOfori, S., Abebrese, D. K., Růžičková, I., & Wanner, J. (2024). Reuse of Treated Wastewater for Crop Irrigation: Water Suitability, Fertilization Potential, and Impact on Selected Soil Physicochemical Properties. Water, 16(3), 484. https://doi.org/10.3390/w16030484