Article

Identification and Distribution Characteristics of Odorous Compounds in Sediments of a Shallow Water Reservoir

1
Henan Institute of Advanced Technology, Zhengzhou University, Zhengzhou 450003, China
2
Zhejiang Yiwu Municipal Water Affairs Bureau, Yiwu 322099, China
3
Research Center for Eco-Environmental Sciences, Chinese Academy of Sciences, Beijing 100085, China
4
College of Resources and Environment, University of Chinese Academy of Sciences, Beijing 100049, China
5
Yangtze River Delta Research Center for Eco-Environmental Sciences, Yiwu 322000, China
6
Eco-Environmental Science Research & Design Institute of Zhejiang Province, Hangzhou 310007, China
7
Institute of Tibetan Plateau Research, Chinese Academy of Sciences, Beijing 100101, China
*
Authors to whom correspondence should be addressed.
Water 2024, 16(3), 455; https://doi.org/10.3390/w16030455
Submission received: 18 December 2023 / Revised: 21 January 2024 / Accepted: 26 January 2024 / Published: 31 January 2024

Abstract

:
Odorous sediments containing volatile organic sulfur compounds (VOSCs) are a common issue in shallow water reservoirs globally. Volatile organic sulfur compounds are a typical class of malodorous substances that have attracted widespread attention due to their pungent odors and extremely low odor thresholds. The insufficient hydrodynamic conditions in the reservoir area lead to the accumulation of pollutants in the sediment, where biochemical reactions occur at the sediment–water interface, serving as a significant source of foul-smelling substances in the water body. This study analyzed sediment samples from 10 locations across a shallow water reservoir using flavor profile analysis, an electronic nose, and gas chromatography-mass spectrometry. The predominant odor types were earthy/musty and putrid/septic, with key odorants being VOSCs, 2-methylisoborneol, and geosmin. The results revealed VOSCs from organic matter account for up to 96.7% of odor activity. More importantly, concentrations and release fluxes of VOSCs consistently decrease along the water flow direction from dam regions to tail regions. This trend matches organic matter accumulation patterns in shallow reservoirs and highlights dam areas as hotspots for malodorous sediment. The generalized spatial distribution pattern and identification of key malodorous compounds establish a basis for understanding and managing odor issues in shallow freshwater reservoir sediments.

1. Introduction

The issue of odorous water has become a major concern in the aquatic ecology and water management industry globally. Surveys estimate approximately 80% of water sources in China have odor problems, with earthy and putrid odors being most prevalent [1]. Recent reports indicate putrid/foul odor detection rates of 29% in lake/reservoir source waters across China [2]. Various compounds can cause negative sensory reactions, including volatile organic sulfur compounds (VOSCs), aldehydes, aromatics, nitrogen-containing heterocycles, terpenoids, and more [3,4]. Among them, thioethers (dimethyl disulfide, dimethyl trisulfide, diethyl disulfide, etc.), thiols (methyl mercaptan, dimethyl sulfide, etc.), and compounds such as indole are typical odorous substances associated with septic/swampy odors [5,6], while 2-methylisoborneol and geosmin are considered to be the primary odoriferous compounds responsible for musty/earthy odors [1,2,3,4,5,6,7]. Previous studies have mainly focused on the discussion of musty/earthy odors. Compared to musty/earthy odors, putrid/foul odors are considered to be nauseating and irritating, bringing about a more intolerable sensory experience for residents, yet there have been relatively fewer reports regarding putrid/foul odors.
In healthy water bodies, the concentration of aerobic pollutants is low, and processes such as photosynthesis by plants and algae, as well as air dissolution, result in dissolved oxygen (DO) approaching saturation under normal conditions. However, in polluted urban river water bodies, the rapid consumption of oxygen by oxygen-consuming pollutants, coupled with insufficient oxygen supply from air reoxygenation and plant photosynthesis, leads to a continuous reduction in DO, even approaching zero. Research indicates that, when DO in water bodies is ≤2.0 mg/L, foul odors often occur. The lack of dissolved oxygen reduces the self-purification capacity of the water body, hindering the aerobic processes for pollutant decomposition and causing the water body environment to shift to hypoxic or anaerobic conditions. Under anaerobic conditions, the decomposition of organic pollutants becomes dominant, leading to the generation of foul-smelling substances, further deteriorating the water quality and creating a vicious cycle [8].
Nitrogen, phosphorus, and organic pollutants on the sediment surface are anaerobically decomposed by microorganisms, producing volatile organic sulfur compounds (VOSCs) such as methyl mercaptan, carbon disulfide, dimethyl sulfide, dimethyldisulfide, and dimethyltrisulfide [9]. These substances are released into the overlying water, becoming one of the sources of odor pollution in reservoir water. Additionally, the metabolic products (2-MIB and geosmin) secreted by planktonic and benthic organisms (cyanobacteria, actinomycetes, fungi) in eutrophic water bodies are also important sources of odorous substances [10]. There have been numerous studies on VOSCs in marine and swamp sediments, while shallow-water lakes and reservoirs have unique characteristics in terms of topographic conditions and hydrodynamic processes, leading to different transformation and formation processes of VOSCs in their sediments. Cheng et al. discussed the release patterns of odorous substances in sediments under different water pH, temperature, and hydraulic disturbances, and their research indicated that hydraulic disturbances have a significant impact on the release of foul-smelling substances in sediments, with continuous disturbance greatly enhancing the release of dimethyldisulfide and dimethyltrisulfide [11]. Due to the low water level, gases released from sediments in shallow-water lakes and reservoirs can spread to the water surface over a relatively short distance, thereby being detected by human olfaction [12]. For shallow lakes, there are natural disturbance processes (wind waves, tides, benthic activities, etc.) and anthropogenic disturbance processes (silt dredging and disposal, trawling, ship driving, etc.) at the sediment–water interface, which can lead to sediment resuspension when the external disturbance reaches a certain level, so it is necessary to study the types and contents of olfactory substances in sediments. Therefore, this study will focus on investigating the distribution of VOSCs in sediments of shallow-water reservoirs.
In the summer, the strong foul odor at the discharge outlet of the Shentang Reservoir, caused by the disturbance of sediments during water intake, results in the release of odorous substances into the water, leading to odor issues during discharge [13]. As a major source of production and irrigation water in the vicinity, this greatly affects the water quality and the perception of residents in the surrounding areas. In order to identify the source of odors in the reservoir, the specific compounds responsible for the odor should be clearly determined. In addition to the musty or earthy odors caused by 2-methylisoborneol and geosmin, swampy, chemical, medicinal odors, etc., are also considered to be irritating and nauseating, and people often associate them with toxicity, human contamination, chemical spills, or pharmaceuticals.
Head space solid phase microextraction (SPME) is an efficient extraction method that can better extract volatile substances. Gas chromatography-mass spectrometry (GC-MS) is the most commonly used detection technique in the analysis of odor substances and is often used in conjunction with head space solid phase microextraction. The electronic nose (E-nose), also known as an odor scanner, consists of a sensor array for rapid detection and analysis of specific odors in samples and can be used for the differentiation and identification of malodorous substances. While GC-MS can provide qualitative and quantitative results of the components in the sample, using this method alone may not effectively analyze the relationship between the components. Li Lu et al. used GC-MS combined with E-nose technology to study the differences in aroma of jasmine tea from different producing regions [14]. Combining GC-MS with E-nose technology allows for a comprehensive analysis of the sample’s odor from different perspectives.
This study aimed to analyze the odor characteristics and odorants of sediment in a shallow water reservoir using flavor profile analysis (FPA), an electronic nose, and gas chromatography-mass spectrometry (GC-MS) to (1) discriminate predominant odor types and key contributing compounds, (2) quantify target VOSCs concentrations and odor activity values (OAVs), and (3) elucidate spatial distribution patterns of these malodorous compounds across the reservoir.

2. Materials and Methods
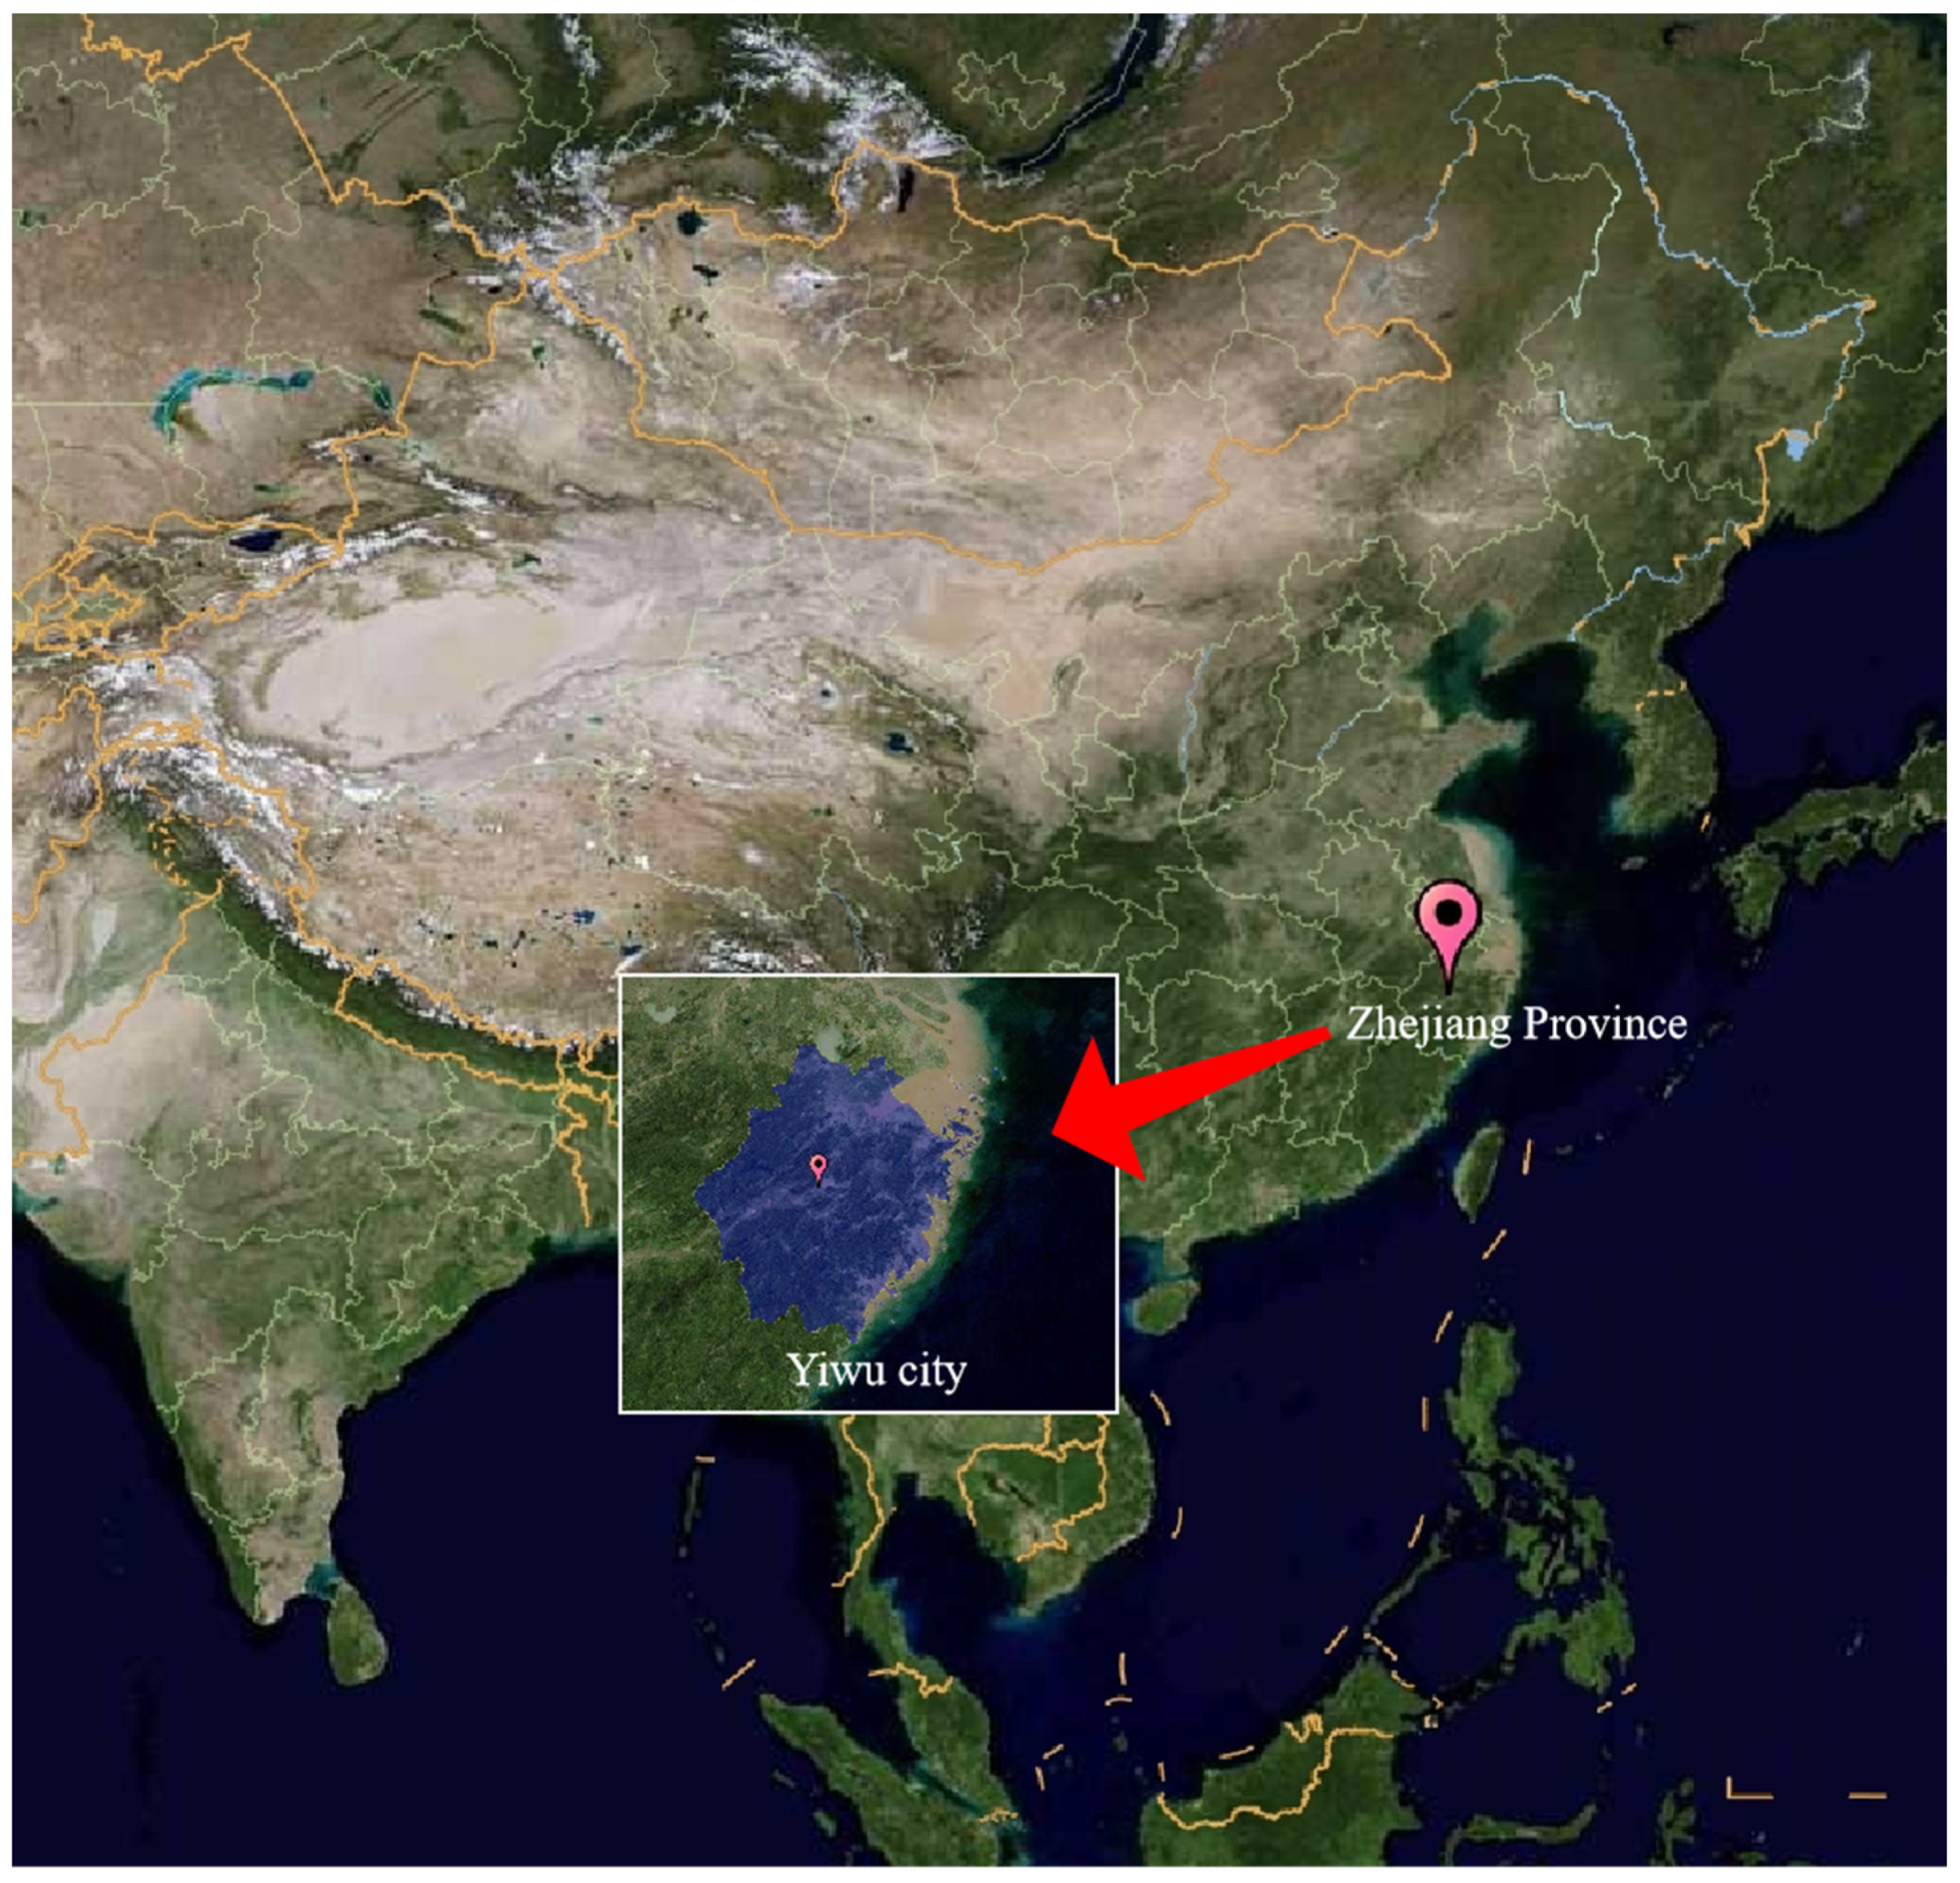
2.1. Study Area

Yiwu City is surrounded by mountains to the east, south, and north, with an opening to the west, and belongs to the eastern edge of the Jinhua Basin (Figure 1). The terrain is mainly hilly, with the northern part being the residual range of the Kuaiji Mountain, which runs in a northeast direction, and the southern part being the residual range of the Xianxia Ridge, which runs in a southwest direction. The entire terrain is characterized by a stepped distribution, sloping towards the Dongyang River and the Dachen River, forming a narrow and elongated corridor-like basin opening to the west, commonly known as the “Yiwu Basin”. In terms of landform composition, low to medium mountains account for 23.48%, hills account for 34.40%, plateaus account for 18.39%, and river valley plains account for 23.73% [15].
The Shentang Reservoir, with a capacity of 4.54 million cubic meters, is a shallow-water reservoir primarily used for agricultural irrigation, located in Yiwu City, Zhejiang Province, China. The reservoir is surrounded by point source pollution and receives pollution from both point and non-point sources, resulting in significant external pollution intensity. At the downstream of the reservoir, there are four eutrophic ponds and one domestic sewage discharge outlet. These external ponds are used for local residents’ productive activities, including lotus cultivation and fish farming. The topography of the Deep Pond Reservoir shows a gradual increase in elevation from the dam to the tail of the reservoir, with the deepest water level near the dam, averaging 8 m in depth, and an average depth of 5 m in the middle of the reservoir, while the water level is shallowest at the tail, with an average depth of around 1.5 m.

2.2. Sediment Sampling and Pre-Treatment

Sediment samples for odor assessment and analysis were collected from different locations in the Deep Pond Reservoir from April to October 2023. Ten sampling points were established from the dam to the tail of the reservoir based on the water depth, with three points at the dam (1, 2, 3), three points in the middle of the reservoir (5, 6, 7), and four nearshore points at the reservoir tail (4, 8, 9, 10), as shown in Figure 2. Sediment samples (0–20 cm) were collected from all sampling points, with a mass of 1 kg per sample, packed in self-sealing bags, grouped and sealed, and then stored in a laboratory refrigerator at −20 °C. Odor analysis, including electronic nose and GC-MS, was conducted within two days. Parallel analyses were performed for each batch of samples, and the average odor concentration was determined from repeated analyses.

2.3. Chemicals and Reagents

Methanethiol, dimethyl sulfide, allyl methyl sulfide, dimethyl disulfide, dimethyl trisulfide, 2-methylisoborneol, geosmin, indole, methylphenol, phenol, and 2-chlorophenol, a total of 11 standard substances, were purchased from TMRM Quality Inspection Standard Center. All standard substances have a purity of chromatographic grade, with a purity ≥99%. The standard stock solutions of all target compounds were prepared using methanol (chromatographic grade, purity ≥ 99.9%) and stored at −20 °C for later use. The odor characteristics and instrument detection limits of odorants are shown in Table 1 and Table A1.

2.4. Sensory Evaluation

The odor types and intensities of sediments were evaluated using the flavor profile analysis (FPA) method [16]. Five representative points were selected from three regions: the reservoir dam (Point 1 and 2), the middle of the reservoir (Point 5 and 7), and the reservoir tail (Point 9). The FPA evaluation panel consisted of five members who were selected through olfactory testing and underwent training for a minimum of 48 h following standard procedures. The panel members summarized and described the odor of the samples using appropriate wording. The consensus values for odor types and intensities (ranging from 0, 2, 4, 6, 8, 10, to 12, representing the strength from no odor to extremely strong) were derived by combining the results of individual odor assessors.

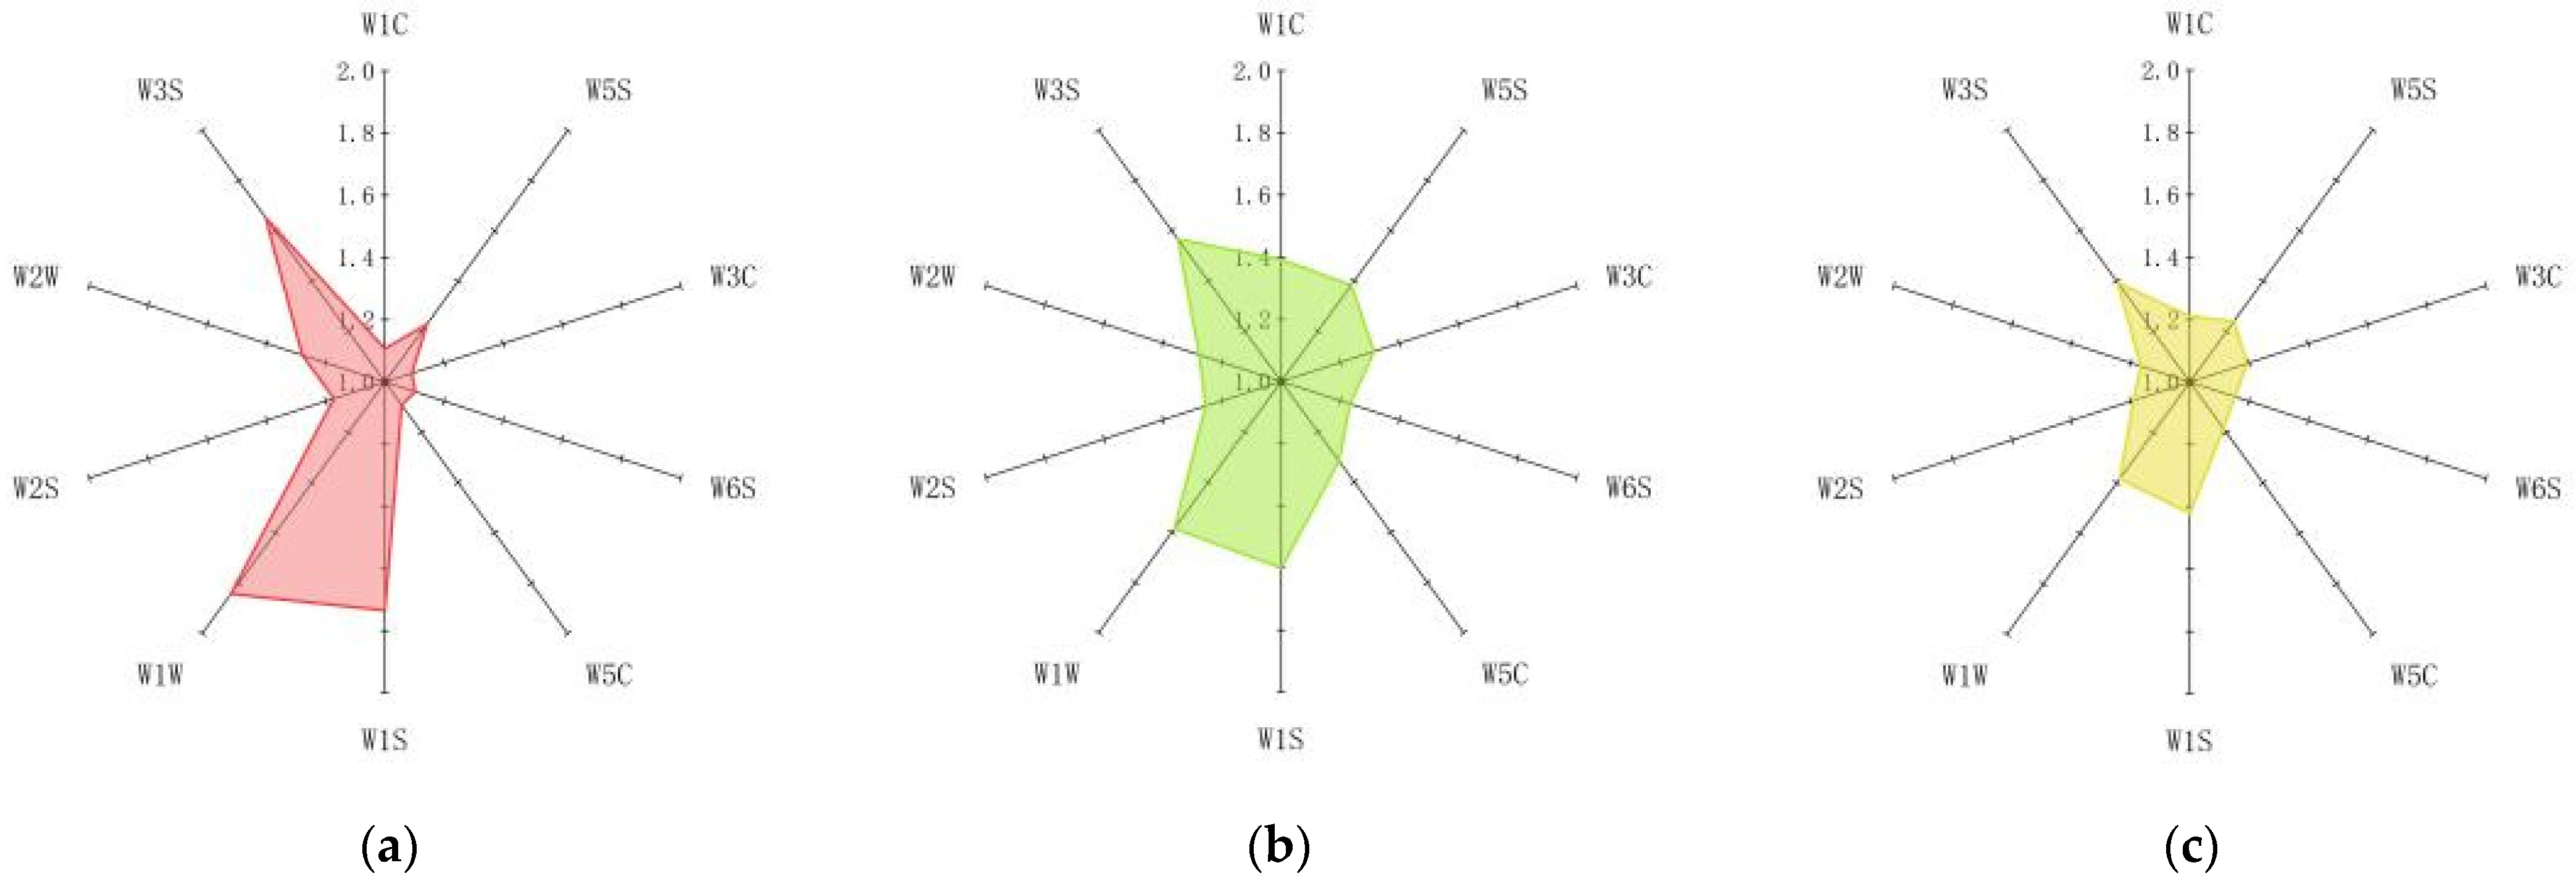
2.5. Electronic Nose

The intensity of volatile gases in the sediment samples was measured using a headspace injection method with an electronic nose sensor. The electronic nose device used was model PEN3 (Airsense Analytics GmbH, Schwerin, Germany) [16]. The specific operating parameters included a pre-sampling time of 5 s, a measurement time of 60 s, a flush time of 60 s, an automatic zero calibration time of 5 s, a chamber flow rate of 400 mL/min, an inlet flow rate of 400 mL/min, and a dilution factor of 0. A total of 5 g of sediment sample was weighed in a 20 mL headspace vial. All samples were analyzed at room temperature (20–25 °C) and repeated twice [17].

2.6. Odorant Identification

The odor compounds were analyzed using the combination of headspace solid-phase microextraction (HS-SPME) and gas chromatography-mass spectrometry (GC-MS) method. The capillary column used had a length of 60 m and an inner diameter of 0.25 m, and the model was InertCap Pure-WAX. For all sample analyses, headspace solid-phase microextraction was used as the pretreatment method. The solid-phase microextraction fiber was introduced into the headspace of a small vial and continuously stirred at a speed of 250 r/min for 30 min at 60 °C. Then, the fiber was desorbed in the injection port of the GC-MS instrument at 250 °C for 3 min. The temperature program of the chromatographic column was set as follows: a 2 min hold at 50 °C, followed by an increase at a rate of 15 °C/min up to 210 °C, and then an increase at a rate of 10 °C/min up to 250 °C, with a 15-min hold at the final temperature. The detection mode was set to selected ion monitoring (SIM) mode. The odor characteristics and instrument detection limits of odorants are shown in Table 1.

2.7. Analytical Method

The data processing and graphing software used in the analysis were Excel (2023 edition) and Origin Pro 2021 (OriginLab Corporation, Northampton, MA, USA). Using Origin Pro 2021, linear discriminant analysis (LDA) was performed for dimensionality reduction on the data. LDA was performed using the electronic nose data obtained from testing all sediment samples. The LDA scores of the training data were plotted on the first (LD1) and second (LD2) linear discriminants, effectively reducing the 10 electronic nose gas sensor signals to a two-dimensional space.

3. Results and Discussion

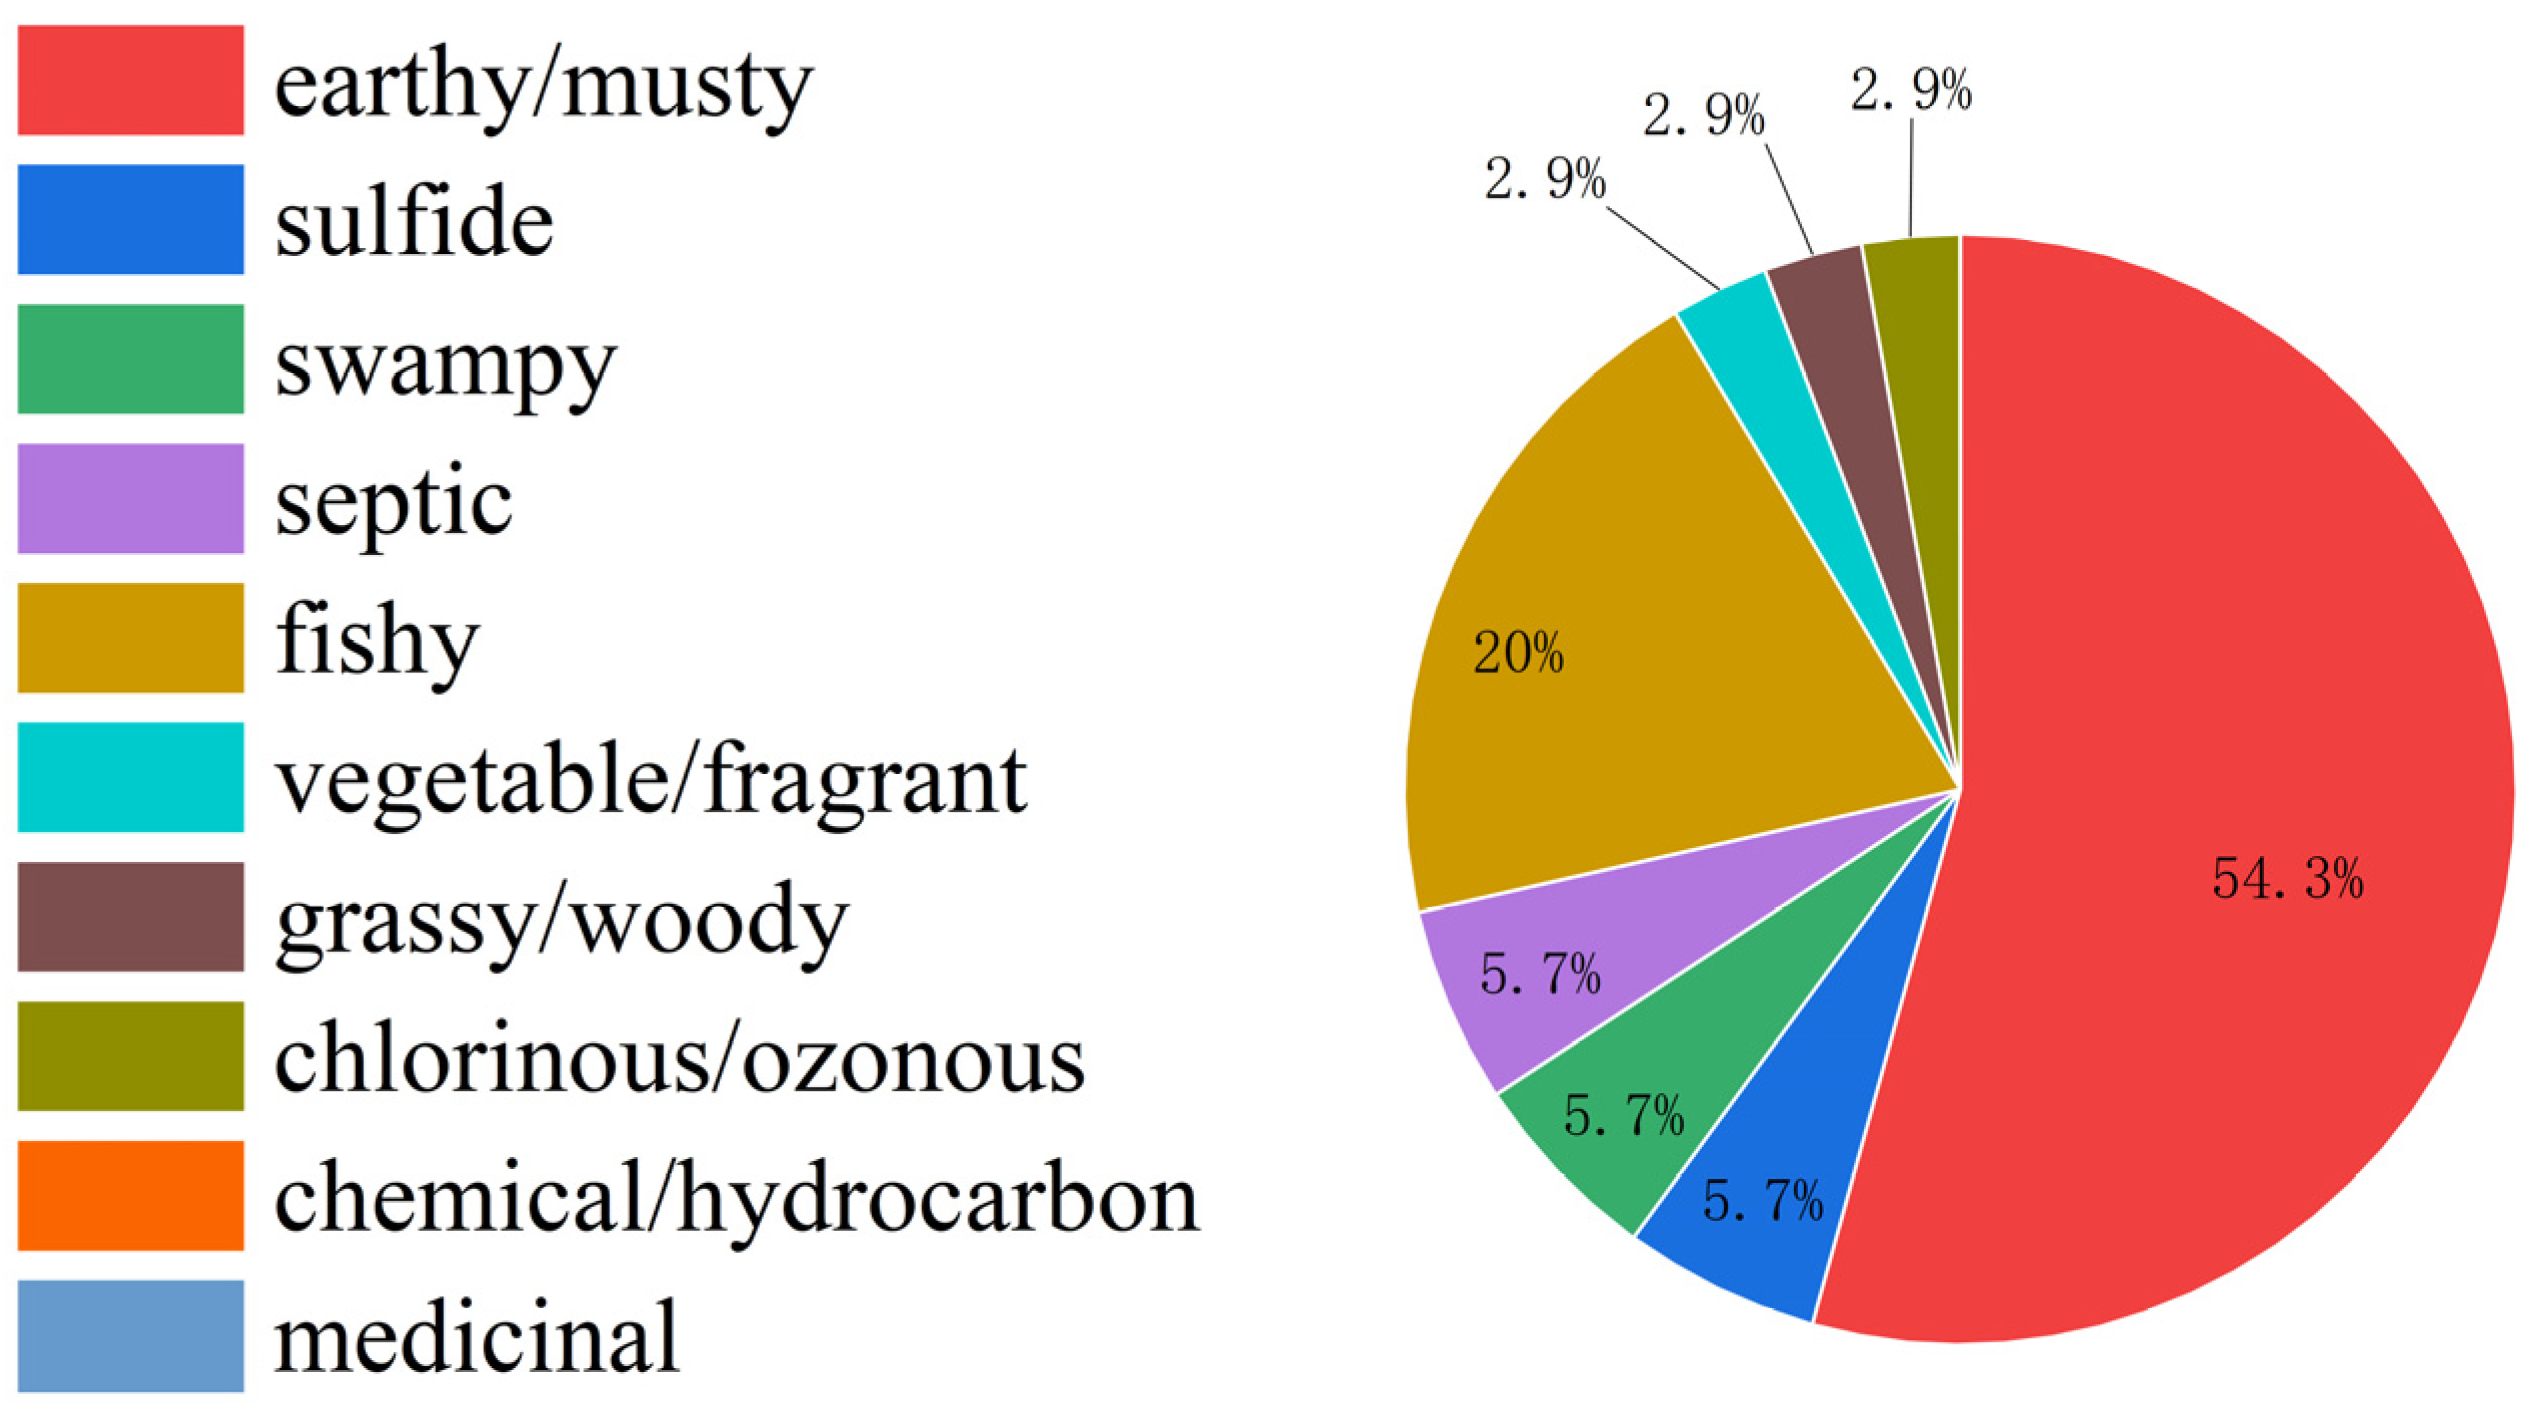
3.1. Odor Characteristics of Sediments

The distribution of odor characteristics released from the sediment samples classified by FPA is shown in Figure 3 and Figure A1. The FPA results indicated that the odor characteristics of the samples were mainly earthy-musty, ammonia-sulfur, fishy, fecal, and putrid odors, with an earthy-musty odor being the predominant type, accounting for 54.3%. The production of an earthy-musty odor was typically caused by the metabolic byproducts of cyanobacteria and actinomycetes. Substances related to earthy-musty odor, such as 2-MIB and GSM, have very low detection thresholds and are easily perceived by human sensory organs, but they do not pose obvious harm to human health [18].
Fishy odor, accounting for 20% in this study, is mainly attributed to the conversion of unsaturated fatty acids secreted by diatoms and other algae into unsaturated aldehydes, such as 2,4-heptadienal and 2,4-decadienal [19]. The putrid, fecal, and sulfuric odors are blended and hard to distinguish. They can be generally referred to as a putrid odor, representing 17.1% of the total odor. Substances related to these odors, such as MT, DMS, and DMDS, not only trigger strong sensory responses, but also pose severe threats to human health. They are common volatile organic compounds with odorous properties in sediments [20]. No chemical reagent odors were detected in the samples. Therefore, the earthy-musty odor is the dominant odor type in the sediment samples.
The analysis of sediments using an electronic nose is shown in Figure 3. The contribution rate of the first principal component was 93.95%, the contribution rate of the second principal component was 6.05%, and the total contribution rate was 100%, demonstrating that the electronic nose can capture the overall information of the sediment samples. The distance between samples can represent the differentiation of sample categories by the electronic nose. There is an overlap between the coordinates of the reservoir center and the reservoir tail, indicating that their odorant profiles are relatively similar. The coordinates of the reservoir dam are more distant from other samples, indicating that the odorant profiles of the reservoir dam sediment vary from those of other areas. This is in agreement with the results of the electronic nose intensity analysis (Figure A2).
The electronic nose sensors with the highest response values are W1S (sensitive to methyl compounds), W1W (sensitive to sulfides), and W3S (sensitive to long-chain alkanes) (Figure 4 and Table A1). Volatile organic compounds containing sulfur are common odorants in sediments, typically including methyl thiol, methyl sulfide, and other sulfur-containing methyl compounds [21,22]. Anaerobic methylation of hydrogen sulfide is the primary mechanism for the formation of volatile organic sulfurous compounds (VOSCs) in most freshwater systems [23,24]. This is consistent with the results of the electronic nose, indicating that sulfur-containing methyl compounds are the predominant odorant type in sediment samples.

3.2. Odorants in Reservoir Sediments

A total of 11 odorants were detected in the sediment samples, comprising 5 sulfur-containing volatile organic compounds (MT, DMS, AMS, DMDS, DMTS), 2 terpenes (2-MIB, GSM), 1 nitrogen-containing compound (indole), and 3 phenols (2-chlorophenol, phenol, m-cresol). Among the detected compounds, methyl thiol (MT) had the highest concentration in the sediments, with an average of 4.87 ug/L, followed by phenol, indole, and methyl sulfide, with concentrations of 1.22, 1.057, and 0.47 ug/L, respectively. Geosmin and 2-methylisoborneol (2-MIB) were detected at concentrations of 0.012 and 0.070 ug/L, respectively (Figure 5). As shown in Figure 5, the odor activity value (OAV) was calculated to assess the contribution of each detected odorant. MT and DMS contributed the most to the odor profile of the sediments. Both MT and DMS have putrid and sulfuric smells, with the MT having a maximum concentration of 36.56 ug/L, which is 1828 times higher than its odor threshold. 2-MIB and GSM, which have earthy-musty odor characteristics, also made significant contributions, with maximum concentrations of 0.78 and 0.15 ug/L, respectively, equivalent to 650 and 193 times their odor thresholds. The concentration range of indole was 0–16.078 ug/L, and the concentration range of phenolic compounds was 0–10.97 ug/L. Due to their higher thresholds, their OAV values were relatively low, indicating minor noticeable contributions to the overall odor. Therefore, the odorants released from reservoir sediments are mainly composed of putrid odor compounds (MT, DMS) and earthy-musty odor compounds (2-MIB, GSM), with a putrid odor playing a dominant role and a earthy-musty odor playing a secondary role, consistent with the results of FPA.

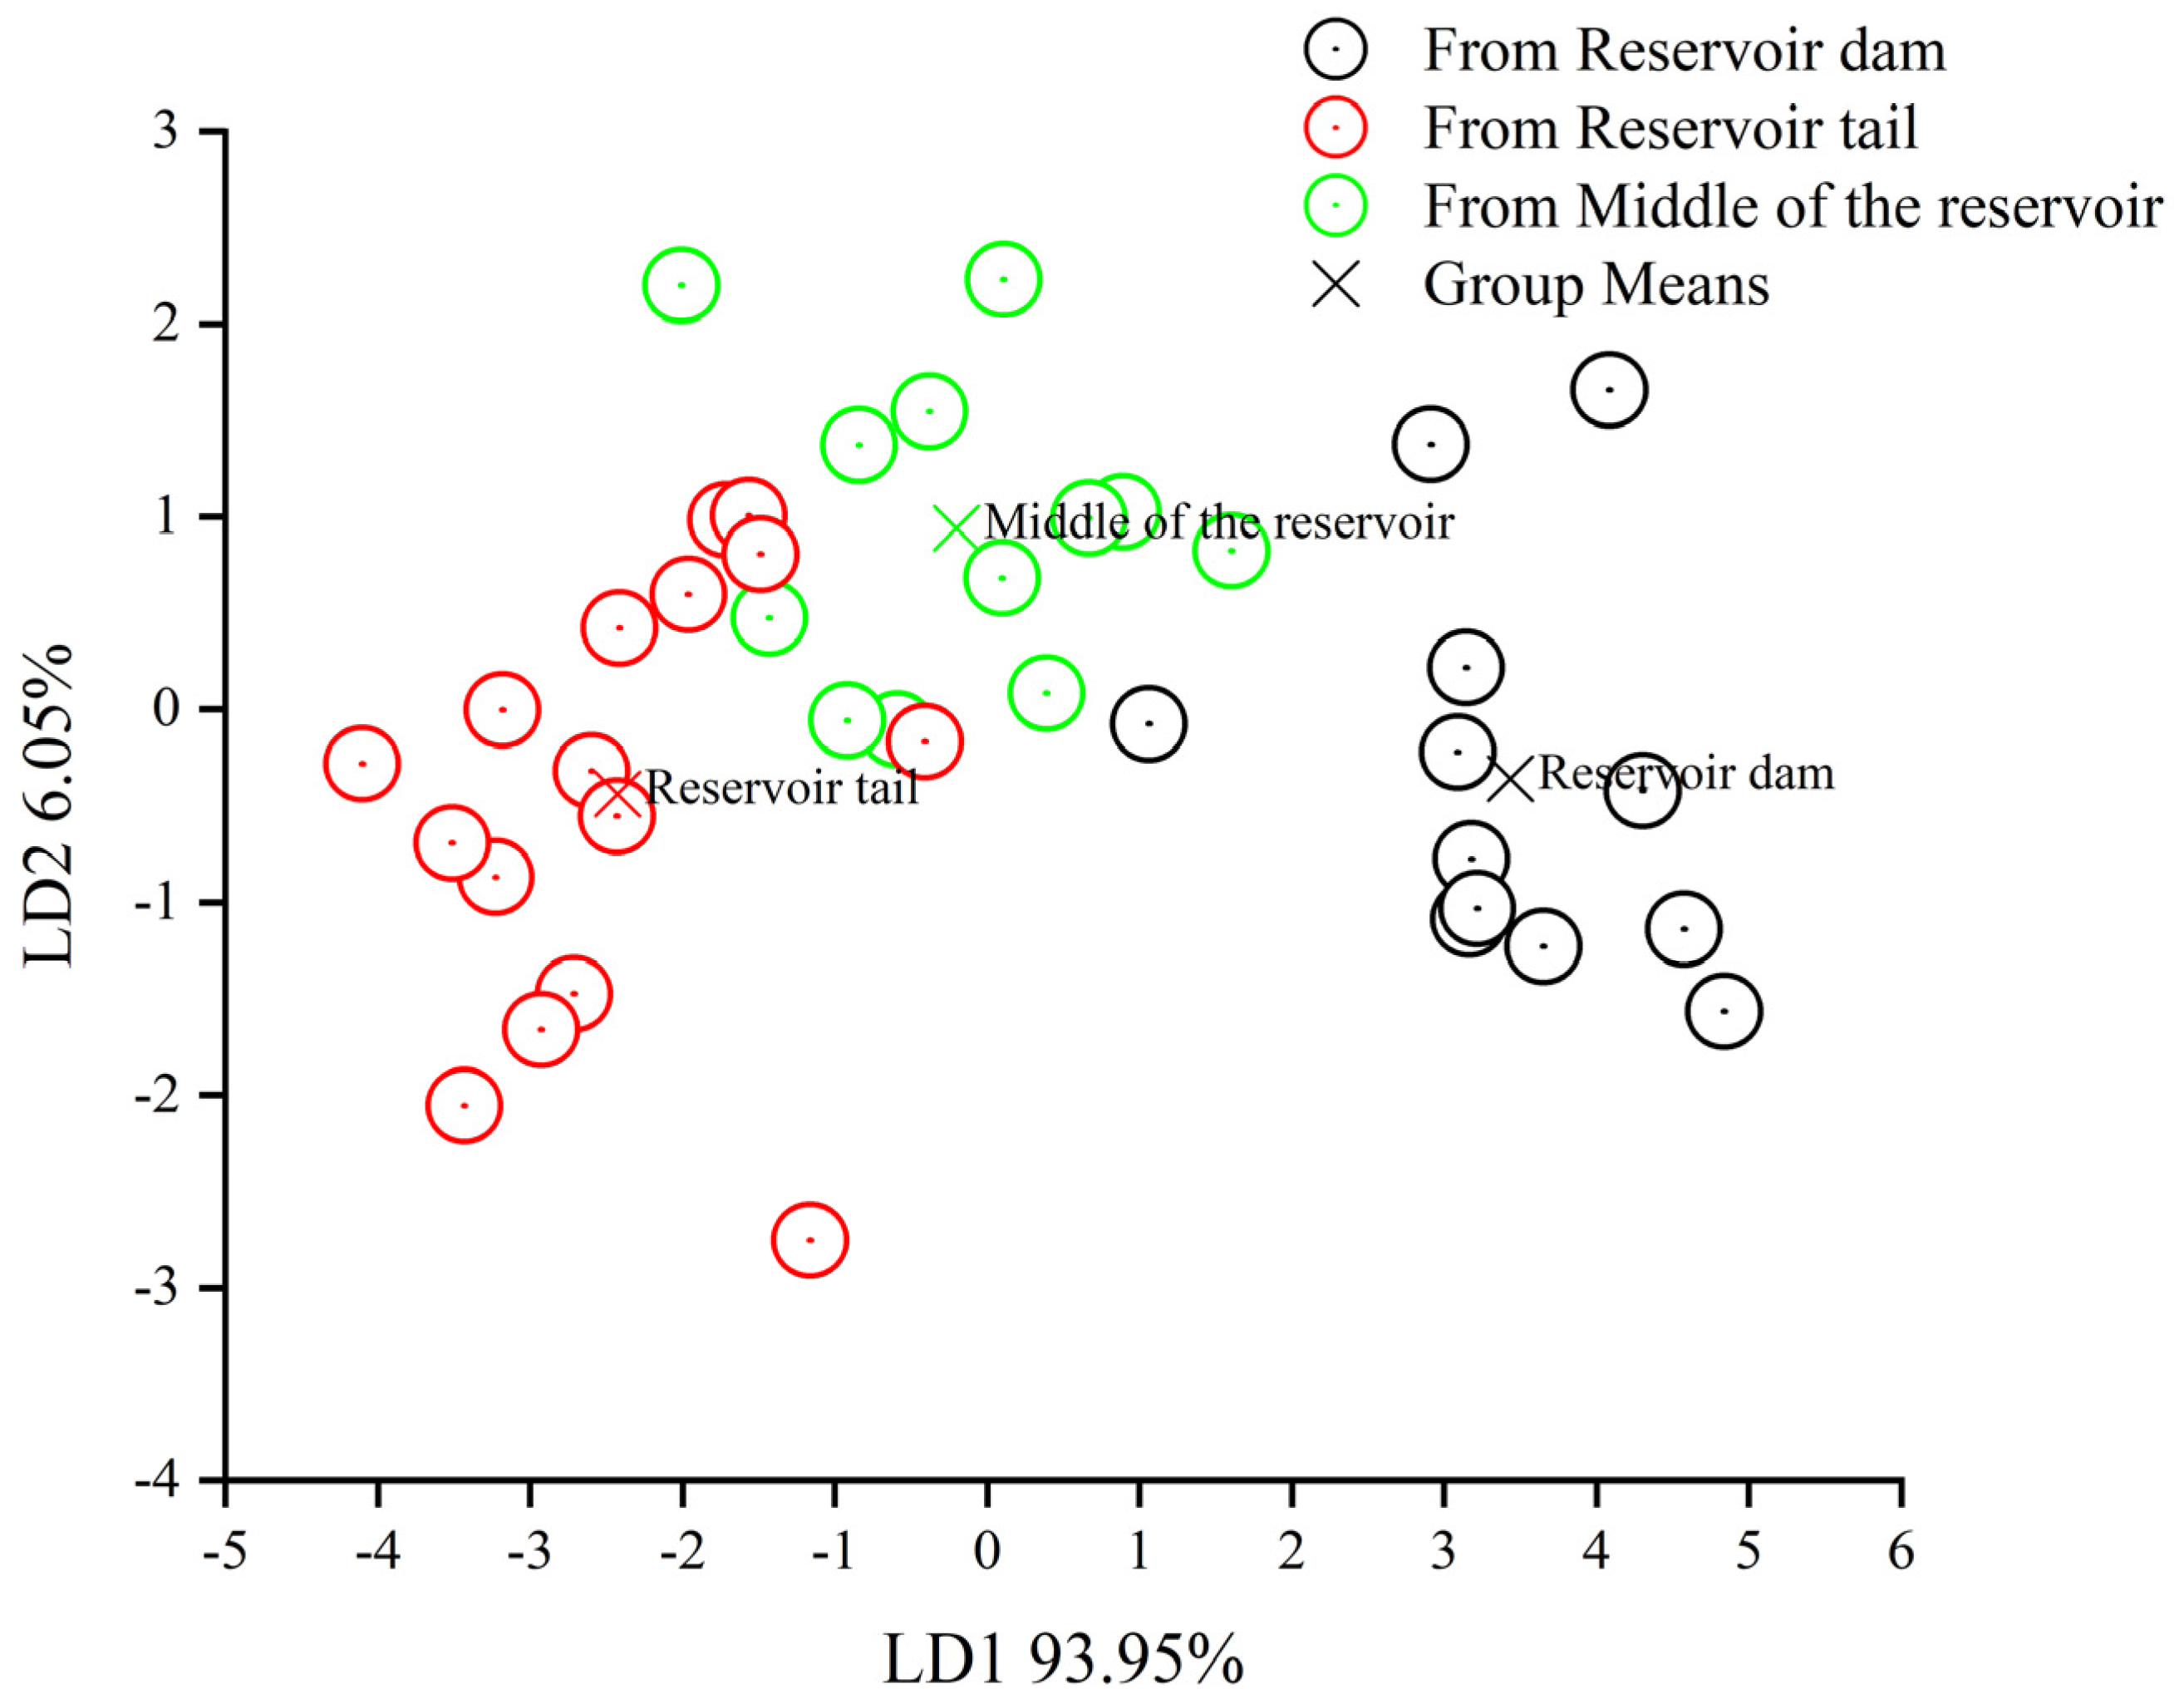
3.3. Spatial Distribution of Odorous Substances Released from Reservoir Sediments

Initial evidence of spatial trends was seen in the electronic nose intensity graphs (Figure A2), showing declining concentrations of sediment-derived sulfur-containing methyl compounds along the water flow direction from the dam to tail region. Linear discriminant analysis (LDA) provided further discrimination (Figure 5), clearly separating dam samples from mid-reservoir and tail areas based on their odorant profiles. This suggests the dam area has distinctly higher overall concentrations of malodorous compounds compared to other reservoir regions. These initial results were further explored through thermal mapping visualization (Figure 6). The maps clearly displayed decreasing fluxes of key malodorous volatile organic sulfur compounds (VOSCs)—especially methanethiol and dimethyl sulfide—from the sediments as the water flow path progresses downstream from the dam towards tail areas.
The consistency of the observed concentration gradients and spatial release patterns points to the dam area representing a “hotspot” zone of elevated VOSC production in the studied reservoir system. The likely driver is a greater accumulation of plankton, decaying algal blooms, and organic matter occurring near dams due to prevailing winds and wave hydrodynamics. These organic matter loads provide abundant precursors, like sulfur-containing amino acids and methoxylated aromatics, for the anaerobic microbial generation of VOSCs in the sediments [25,26,27,28,29]. By combining odor discrimination, multivariate analysis, and spatial mapping, this study derived multiple lines of mutually-reinforcing evidence to uncover the determinants governing distributions of malodorous compounds in shallow freshwater reservoir sediments.
Sediments are important internal sources of pollutants such as odorous compounds, as pollutants can accumulate in sediments through deposition, physicochemical processes, and biological adsorption. Temperature increases, water body disturbances, or changes in redox potential can cause pollutants to desorb from sediments and diffuse into the surrounding water bodies [30,31,32]. The main influencing factor is the dissolved oxygen content, and strongly reducing environments also have a certain promoting effect on the release of sulfides and thiols. Huang et al. applied the technique of water lifting and aeration to the Deep Canyon Reservoir, which resulted in a reduction of nitrogen and phosphorus concentrations in the water and a decrease in algal abundance [33]. Chen et al. investigated the structure and function of microbial communities during river restoration, demonstrating a close relationship between microorganisms and the release of odors from sediment [34]. Therefore, various strategies have been developed, including artificial aeration, water circulation, chemical oxidation, microbial enhancement, and artificial floating islands, to increase the dissolved oxygen content in water and reduce the concentration of pollutants [35,36,37,38,39,40,41,42,43]. However, single physical or chemical methods have limitations and cannot effectively solve the problem of odor pollution from sediments. Considering factors such as non-disturbance of water bodies, the precise oxygenation at the interface to control the release of pollutants from sediment has become a new approach. Combining the use of oxygenation technology and microorganisms will be an effective method for sediment interface restoration and odor control.

4. Conclusions

This study demonstrated the efficacy of combining flavor profile analysis (FPA), electronic nose data, and gas chromatography-mass spectrometry (GC-MS) for a comprehensive characterization of odorous sediment types and identification of key contributing compounds in a shallow water reservoir. The results indicated the predominant odor types of reservoir sediments were earthy/musty and putrid/septic. The main malodorous compounds were volatile organic sulfur compounds (VOSCs) including methanethiol, dimethyl sulfide, and disulfides, along with the terpenoids 2-methylisoborneol (2-MIB) and geosmin. On average, VOSCs accounted for up to 96.7% of the overall odor activity based on calculated odor activity values. Additionally, clear spatial trends were established, with concentrations and release fluxes of the most impactful VOSCs declining along the reservoir flow path from dams towards tail areas. This likely occurs due to a heightened accumulation of VOSC metabolic precursors from algal blooms and planktonic organisms near dams.
The combined odor profiling, identification, quantification, and spatial distribution mapping of key malodorous compounds enhances our current understanding of the specific drivers and processes governing putrid odor issues arising from sediments in shallow water reservoirs.
Given the diversity of lake characteristics, the use of a single lake may lack representativeness. In the future, increasing the number of lakes should be considered. Meanwhile, future work could consider exploring the olfactory sources of odor compounds. Subsequent research could investigate the impact mechanisms of algae and other microorganisms’ activities on the generation process of odor compounds on the sediment surface. On the other hand, in exploring the treatment of odor pollution in sediments, consideration could be given to achieving the reconstruction of a good ecological cycle function without causing side effects or damaging the original environment. These directions all hold certain potential and are of significant importance for maintaining the human living environment.
Moreover, as artificial intelligence is developing fast, its combination with an E-nose should be taken into consideration. Metal oxide semiconductor (MOS) gas sensors have been widely utilized in military, scientific research and various industries due to their unique advantages, such as a small size, low power consumption, high sensitivity, and compatibility with silicon chips [44]. Electronic nose systems employ sensor arrays with different surface chemical properties; increasing the number of sensor arrays can extract more “features” of volatile organic compound (VOC) molecules and provide a “many-to-one” or “many-to-many” method to differentiate VOC gas molecules through pattern recognition/machine learning algorithms [45,46,47,48]. Gonzalez combined electronic nose technology with machine learning to achieve artificial intelligence based on a low-cost sensor network [49]. Lee conducted experiments using an electronic nose system and various machine learning models to identify several types of collected coffee beans and developed a method to create specific aromatic digital fingerprints of the coffee beans for identification of their origin [50]. The combination of electronic nose and machine learning can be considered for tracing the source of odorous substances or the composition of odorous substances.

Author Contributions

Conceptualization, J.W. and H.Z.; methodology, J.W. and C.W.; software, L.Z. and R.Z.; validation, C.J. and C.W.; formal analysis, C.W. and J.W.; investigation, J.W., L.Z. and R.Z.; writing—original draft preparation, J.W.; writing—review and editing, L.W., S.X. and X.Z.; visualization, Y.T. and Y.H.; supervision, C.J. All authors have read and agreed to the published version of the manuscript.

Funding

This work was supported by the CAS International Partnership Program (grant number: 121311KYSB20200017), the Provincial science and technology innovative program for carbon peak and carbon neutrality of Jiangsu of China as well as the “Leading Goose” R&D Program of Zhejiang (No. 2023C03131 and No. 2023C03132), and the Key technology and equipment system of intelligent control of water supply network (No. 2022YFC3203800).

Data Availability Statement

The raw data supporting the conclusions of this article will be made available by the authors on request.

Conflicts of Interest

The authors declare no conflicts of interest.

Appendix A

Table A1. Detection Limit of Odorants by GC-MS.
CompoundLimit of Detection
Mg·kg−1
Methanethiol0.015
Dimethyl sulfide0.026
Allyl methyl sulfide0.028
Dimethyl disulfide0.0041
Dimethyl trisulfide0.0074
Indole0.65
2-methylisoborneol0.0080
Geosmin0.0038
Methylphenol0.094
Phenol0.023
2-chlorophenol0.022
Figure A1. The proportion of odor types detected from gas released by sediment.
Water 16 00455 g0a1
Table A2. Introduction to electronic nose sensors.
Name of the SensorPerformance Characterization
W1CAromatic components, benzene compounds
W5SNitrogen oxides
W3CSensitive to aromatic compounds, amines
W6SExhibiting selectivity towards hydrides
W5CAromatic components of short-chain alkanes
W1SHigh sensitivity towards methyl-based compounds
W1WHigh sensitivity towards sulfides
W2SHigh sensitivity towards alcohols and carbonyl compounds.
W2WExquisite sensitivity towards organic sulfides.
W3SRemarkable sensitivity towards long-chain hydrocarbons.
Figure A2. Determination results of electronic nose for sediment in the reservoir (Red, (a) reservoir dam; Green, (b) middle of the reservoir; Yellow, (c) reservoir tail).
Water 16 00455 g0a2

References

  1. Yu, J.W.; Zhao, Y.M.; Yang, M.; Lin, T.-F.; Guo, Z.H.; Gu, J.N.; Li, S.; Han, W. Occurrence of odour-causing compounds in different source waters of China. J. Water Supply Res. Technol. 2009, 58, 587–594. [Google Scholar] [CrossRef]
  2. Guo, Q.; Ding, C.; Xu, H.; Zhang, X.; Li, Z.; Li, X.; Yang, B.; Chen, T. Diagnosing complex odor problems occurring in micro-polluted source water: Primary approach and application. Environ. Pollut. 2021, 271, 116373. [Google Scholar] [CrossRef] [PubMed]
  3. Wang, C.; Yu, J.; Guo, Q.; Zhao, Y.; Cao, N.; Yu, Z.; Yang, M. Simultaneous quantification of fifty-one odor-causing compounds in drinking water using gas chromatography-triple quadrupole tandem mass spectrometry. J. Environ. Sci. 2019, 79, 100–110. [Google Scholar] [CrossRef] [PubMed]
  4. Sun, D.; Yu, J.; Yang, M.; An, W.; Zhao, Y.; Lu, N.; Yuan, S.; Zhang, D. Occurrence of odor problems in drinking water of major cities across China. Front. Environ. Sci. Eng. 2014, 8, 411–416. [Google Scholar] [CrossRef]
  5. Guo, Q.; Yu, J.; Yang, K.; Wen, X.; Zhang, H.; Yu, Z.; Li, H.; Zhang, D.; Yang, M. Identification of complex septic odorants in Huangpu River source water by combining the data from gas chromatography-olfactometry and comprehensive two-dimensional gas chromatography using retention indices. Sci. Total Environ. 2016, 556, 36–44. [Google Scholar] [CrossRef]
  6. Wang, C.; Yu, J.; Guo, Q.; Sun, D.; Su, M.; An, W.; Zhang, Y.; Yang, M. Occurrence of swampy/septic odor and possible odorants in source and finished drinking water of major cities across China. Environ. Pollut. 2019, 249, 305–310. [Google Scholar] [CrossRef]
  7. Abd El-Hack, M.E.; El-Saadony, M.T.; Elbestawy, A.R.; Ellakany, H.F.; Abaza, S.S.; Geneedy, A.M.; Salem, H.M.; Taha, A.E.; Swelum, A.A.; Omer, F. Undesirable odour substances (geosmin and 2-methylisoborneol) in water environment: Sources, impacts and removal strategies. Mar. Pollut. Bull. 2022, 178, 113579. [Google Scholar] [CrossRef]
  8. Zhang, H.; Chen, J.; Han, M.; An, W.; Yu, J. Anoxia remediation and internal loading modulation in eutrophic lakes using geoengineering method based on oxygen nanobubbles. Sci. Total. Environ. 2020, 714, 136766. [Google Scholar] [CrossRef]
  9. Lomans, B.P.; Smolders, A.; Intven, L.M.; Pol, A.; Op, D.; Van Der Drift, C. Formation of dimethyl sulfide and methanethiol in anoxic freshwater sediments. Appl. Environ. Microbiol. 1997, 63, 4741–4747. [Google Scholar] [CrossRef] [PubMed]
  10. Lee, J.; Rai, P.K.; Jeon, Y.J.; Kim, K.-H.; Kwon, E. The role of algae and cyanobacteria in the production and release of odorants in water. Environ. Pollut. 2017, 227, 252–262. [Google Scholar] [CrossRef] [PubMed]
  11. Peng, C.; Yan, X.; Wang, X.; Huang, Y.; Jiang, L.; Yuan, P.; Wu, X. Release of odorants from sediments of the largest drinking water reservoir in Shanghai: Influence of pH, temperature, and hydraulic disturbance. Chemosphere 2021, 265, 129068. [Google Scholar] [CrossRef] [PubMed]
  12. Huang, H.; Liu, X. Distribution characteristics of typical volatile sulfides in sediments in west nearshore zone of Taihu. Ecol. Sci. 2018, 37, 16–23. [Google Scholar]
  13. Duan, W.; Huang, G.; Hao, M.; Cui, J.; Wu, A.; Wang, W.; Li, D.; Li, T. Release characteristics of sulfur in black and odorous water in cities against the change of environmental factors. Sci. Technol. Eng. 2020, 20, 13072–13078. [Google Scholar]
  14. Rice, E.W.; Bridgewater, L.; Association, A.P.H. Standard Methods for the Examination of Water and Wastewater; American Public Health Association: Washington, DC, USA, 2012; Volume 10. [Google Scholar]
  15. Feng, J. Restructuring of Urban Form in the Developed Area in China Based on RS and GIS: A Case Study of Yiwu. Mod. Urban Res. 2011, 26, 25–32. [Google Scholar]
  16. Viciano-Tudela, S.; Sendra, S.; Parra, L.; Jimenez, J.M.; Lloret, J. Proposal of a Gas Sensor-Based Device for Detecting Adulteration in Essential Oil of Cistus ladanifer. Sustainability 2023, 15, 3357. [Google Scholar] [CrossRef]
  17. Wójcik, S.; Ciepiela, F.; Jakubowska, M. Computer vision analysis of sample colors versus quadruple-disk iridium-platinum voltammetric e-tongue for recognition of natural honey adulteration. Measurement 2023, 209, 112514. [Google Scholar] [CrossRef]
  18. Yuan, J.; Hofmann, R. Adsorption and biodegradation of 2-methylisoborneol and geosmin in drinking water granular activated carbon filters: A review and meta-analysis. J. Hazard. Mater. 2022, 440, 129838. [Google Scholar] [CrossRef]
  19. Liu, T.; Yu, J.; Su, M.; Jia, Z.; Wang, C.; Zhang, Y.; Dou, C.; Burch, M.; Yang, M. Production and fate of fishy odorants produced by two freshwater chrysophyte species under different temperature and light conditions. Water Res. 2019, 157, 529–534. [Google Scholar] [CrossRef]
  20. Guo, Q.; Yu, J.; Su, M.; Wang, C.; Yang, M.; Cao, N.; Zhao, Y.; Xia, P. Synergistic effect of musty odorants on septic odor: Verification in Huangpu River source water. Sci. Total. Environ. 2019, 653, 1186–1191. [Google Scholar] [CrossRef]
  21. Carrion, O.; Pratscher, J.; Richa, K.; Rostant, W.; Ul Haque, M.; Murrell, J.; Todd, J. Methanethiol and dimethylsulfide cycling in Stiffkey saltmarsh. Front. Microbiol. 2019, 10, 1040. [Google Scholar] [CrossRef]
  22. Lomans, B.; Pol, A.; Op den Camp, H. Microbial cycling of volatile organic sulfur compounds in anoxic environments. Water Sci. Technol. 2002, 45, 55–60. [Google Scholar] [CrossRef]
  23. Zhang, C.; Lu, Q.; Li, Y. A review on sulfur transformation during anaerobic digestion of organic solid waste: Mechanisms, influencing factors and resource recovery. Sci. Total. Environ. 2023, 865, 161193. [Google Scholar] [CrossRef]
  24. Watson, S.B.; Jüttner, F. Malodorous volatile organic sulfur compounds: Sources, sinks and significance in inland waters. Crit. Rev. Microbiol. 2017, 43, 210–237. [Google Scholar] [CrossRef]
  25. Schäfer, H.; Eyice, Ö. Microbial cycling of methanethiol. Curr. Issues Mol. Biol. 2019, 33, 173–182. [Google Scholar] [CrossRef]
  26. Hedges, J.I.; Keil, R.G.; Benner, R. What happens to terrestrial organic matter in the ocean? Org. Geochem. 1997, 27, 195–212. [Google Scholar] [CrossRef]
  27. Lomans, B.P.; Luderer, R.; Steenbakkers, P.; Pol, A.; van der Drift, C.; Vogels, G.D.; Op den Camp, H. Microbial populations involved in cycling of dimethyl sulfide and methanethiol in freshwater sediments. Appl. Environ. Microbiol. 2001, 67, 1044–1051. [Google Scholar] [CrossRef] [PubMed]
  28. Schmitz, R.A.; Mohammadi, S.S.; van Erven, T.; Berben, T.; Jetten, M.S.; Pol, A.; Op den Camp, H. Methanethiol consumption and hydrogen sulfide production by the thermoacidophilic methanotroph Methylacidiphilum fumariolicum SolV. Front. Microbiol. 2022, 13, 857442. [Google Scholar] [CrossRef] [PubMed]
  29. Stets, E.G.; Hines, M.E.; Kiene, R. Thiol methylation potential in anoxic, low-pH wetland sediments and its relationship with dimethylsulfide production and organic carbon cycling. FEMS Microbiol. Ecol. 2004, 47, 1–11. [Google Scholar] [CrossRef] [PubMed]
  30. Lomans, B.P.; Op den Camp, H.J.; Pol, A.; Vogels, G. Anaerobic versus aerobic degradation of dimethyl sulfide and methanethiol in anoxic freshwater sediments. Appl. Environ. Microbiol. 1999, 65, 438–443. [Google Scholar] [CrossRef] [PubMed]
  31. Yin, H.; Wu, Y. Factors affecting the production of volatile organic sulfur compounds (VOSCs) from algal-induced black water blooms in eutrophic freshwater lakes. Water Air Soil Pollut. 2016, 227, 356. [Google Scholar] [CrossRef]
  32. Eggleton, J.; Thomas, K. A review of factors affecting the release and bioavailability of contaminants during sediment disturbance events. Environ. Int. 2004, 30, 973–980. [Google Scholar] [CrossRef]
  33. Huang, T.; Ma, Y.; Cong, H.; Tan, P. Application of the technology of water lifting and aeration on improving water quality in a Deep Canyon Reservoir–a case study from northern China. Desalination Water Treat. 2014, 52, 1636–1646. [Google Scholar] [CrossRef]
  34. Chen, C.; Yang, X.; Luo, H.; Zeng, D.; Sima, M.; Huang, S. Linking microbial community and biological functions to redox potential during black-odor river sediment remediation. Environ. Sci. Pollut. Res. 2020, 27, 40392–40404. [Google Scholar] [CrossRef]
  35. Chang, Z.; Huang, T. Analysis of Water-Lifting Aerator Performance Based on the Volume of Fluid Method. Water 2023, 15, 991. [Google Scholar] [CrossRef]
  36. Zhou, Z.; Huang, T.; Gong, W.; Li, Y.; Liu, Y.; Zhou, S. Field research on mixing aeration in a drinking water reservoir: Performance and microbial community structure. Int. J. Environ. Res. Public Health 2019, 16, 4221. [Google Scholar] [CrossRef]
  37. Costa, R.A.; Ferragut, C. Epipelon biomass responses to different restoration techniques in a eutrophic environment. Environ. Manag. 2023, 72, 505–518. [Google Scholar] [CrossRef]
  38. Amaral, L.M.; de Almeida Castilho, M.C.; Henry, R.; Ferragut, C. Epipelon, phytoplankton and zooplankton responses to the experimental oligotrophication in a eutrophic shallow reservoir. Environ. Pollut. 2020, 263, 114603. [Google Scholar] [CrossRef] [PubMed]
  39. Łopata, M.; Grochowska, J.K.; Augustyniak-Tunowska, R.; Tandyrak, R. Possibilities of Improving Water Quality of Degraded Lake Affected by Nutrient Overloading from Agricultural Sources by the Multi-Point Aeration Technique. Appl. Sci. 2023, 13, 2861. [Google Scholar] [CrossRef]
  40. Kowalczewska-Madura, K.; Dondajewska, R.; Gołdyn, R.; Rosińska, J.; Podsiadłowski, S. Internal phosphorus loading as the response to complete and then limited sustainable restoration of a shallow lake. In Annales De Limnologie-International Journal of Limnology; EDP Sciences: Les Ulis, France, 2019; Volume 55, p. 4. [Google Scholar]
  41. Zhang, X.; Ren, Y.; Zhu, X.; Pan, H.; Yao, H.; Wang, J.; Liu, M.; He, M. Driving Factors for Black-Odor-Related Microorganisms and Potential Self-Remediation Strategies. Sustainability 2022, 15, 521. [Google Scholar] [CrossRef]
  42. Xu, R.; Wang, S.; Chen, L.; Wang, H.; Dai, B.; Zou, P.; Yang, C.; Wang, J.; Bi, X. Effect of different microbial methods on purifying black-odor water based on three-dimensional fluorescence spectroscopy. Chin. J. Environ. Eng. 2020, 14, 123–132. [Google Scholar]
  43. Chengyang, H.; Ying, T.; He, X. Application Research on Deodorization Effect of Domestic Waste by One Microbial Deodorizer. In IOP Conference Series: Earth and Environmental Science; IOP Publishing: Bristol, UK, 2020; Volume 446, p. 032019. [Google Scholar]
  44. Liu, H.; Meng, G.; Deng, Z.; Li, M.; Chang, J.; Dai, T.; Fang, X. Progress in research on VOC molecule recognition by semiconductor sensors. Acta Phys.-Chim. Sin. 2020, 38, 2008018. [Google Scholar] [CrossRef]
  45. Murali-Baskaran, R.K.; Mooventhan, P.; Das, D.; Dixit, A.; Sharma, K.C.; Senthil-Nathan, S.; Kaushal, P.; Ghosh, P.K. The future of plant volatile organic compounds (pVOCs) research: Advances and applications for sustainable agriculture. Environ. Exp. Bot. 2022, 200, 104912. [Google Scholar] [CrossRef]
  46. Talens, J.B.; Pelegri-Sebastia, J.; Sogorb, T.; Ruiz, J.L. Prostate cancer detection using e-nose and AI for high probability assessment. BMC Med. Inform. Decis. Mak. 2023, 23, 205. [Google Scholar] [CrossRef] [PubMed]
  47. Patil, A.B.; Bachute, M.R.; Kotecha, K. Artificial Perception of the Beverages: An in-depth Review of the Tea sample. IEEE Access 2021, 9, 82761–82785. [Google Scholar] [CrossRef]
  48. Li, Z.; Sie, S.H.; Lee, J.L.; Chen, Y.R.; Chou, T.I.; Wu, P.C.; Chuang, Y.-T.; Lin, Y.-T.; Chen, I.-C.; Lu, C.-C.; et al. A miniature electronic nose for breath analysis. In Proceedings of the 2021 IEEE International Electron Devices Meeting (IEDM), San Francisco, CA, USA, 11–16 December 2021; IEEE: New York, NY, USA, 2021; pp. 35.2.1–35.2.4. [Google Scholar]
  49. Gonzalez Viejo, C.; Fuentes, S.; Hernandez-Brenes, C. Smart detection of faults in beers using near-infrared spectroscopy, a low-cost electronic nose and artificial intelligence. Fermentation 2021, 7, 117. [Google Scholar] [CrossRef]
  50. Lee, C.H.; Chen, I.T.; Yang, H.C.; Chen, Y.J. An AI-powered Electronic Nose System with Fingerprint Extraction for Aroma Recognition of Coffee Beans. Micromachines 2022, 13, 1313. [Google Scholar] [CrossRef]
Figure 1. The geographical location of the study area.
Water 16 00455 g001
Figure 2. Sampling point diagram.
Water 16 00455 g002
Figure 3. FPA evaluation of odor characteristic classification of sediment-released gases.
Water 16 00455 g003
Figure 4. Composition of odorants and evaluation of Odor Activity Value (OAV) for odorants in sediments; blue represents odorant concentration, while red represents the Odor Activity Value.
Water 16 00455 g004
Figure 5. LDA analysis of sediment in different regions of the reservoir.
Water 16 00455 g005
Figure 6. Thermal map of spatial distribution of odorants released from sediments.
Water 16 00455 g006
Table 1. Fundamental information on odorants.
Odorant TypeCompoundM/Z1 aM/Z2 aOTC b
mg·kg−1
Septic/swampyMethanethiol47480.0016
Dimethyl sulfide62470.0084
Allyl methyl sulfide88730.0018
Dimethyl disulfide94790.029
Dimethyl trisulfide126450.014
Indole13013111
Earthy/musty2-methylisoborneol951070.00070
Geosmin112410.0010
Chemical/phenolicMethylphenol128640.12
Phenol946621
2-chlorophenol128640.12
Notes: a The two target ions are the quantitative ion and the qualitative ion. b OTC: Odor Threshold Concentration.
Disclaimer/Publisher’s Note: The statements, opinions and data contained in all publications are solely those of the individual author(s) and contributor(s) and not of MDPI and/or the editor(s). MDPI and/or the editor(s) disclaim responsibility for any injury to people or property resulting from any ideas, methods, instructions or products referred to in the content.

