Article

Temporal and Spatial Characteristics of Agricultural Drought Based on the TVDI in Henan Province, China

1
School of Water Conservancy, North China University of Water Resources and Electric Power, Zhengzhou 450046, China
2
School of Water Conservancy and Transportation, Zhengzhou University, Zhengzhou 450001, China
*
Author to whom correspondence should be addressed.
Water 2024, 16(7), 1010; https://doi.org/10.3390/w16071010
Submission received: 7 March 2024 / Revised: 26 March 2024 / Accepted: 28 March 2024 / Published: 30 March 2024
(This article belongs to the Special Issue Drought Monitoring and Risk Assessment)

Abstract

:
As a major grain-producing province in China’s Central Plains, Henan Province is severely impacted by drought, making the study of agricultural drought characteristics in the region crucial. Theil–Sen (Sen) trend analysis, the Mann–Kendall (M-K) test and the Hurst index method were used to systematically analyze the spatial variation characteristics of agricultural drought based on the Temperature Vegetation Dryness Index (TVDI). The results show that: (1) The drought occurs in central, northwestern and southern Henan on an annual scale. The drought situation will continue to increase in northern, eastern northeastern and central Henan. (2) The drought in spring, summer and winter showed an increasing trend, but the opposite trend was observed in autumn. The increasing trend of drought in each season is mainly distributed in northern, central and eastern Henan. (3) The drought in January, February, April, July, September and December showed an increasing trend, while the drought in the other 6 months showed a decreasing trend. The increase in drought during July and August was not pronounced, while the drought situation in September remained largely unchanged. The distribution of drought across the other months exhibited varying patterns across different regions. Overall, the drought trend in Henan Province is on the rise, displaying distinct seasonal and regional patterns in its temporal and spatial distribution. The results can provide a reference for Henan Province to formulate effective measures of drought resistance and disaster reduction to ensure grain production.

1. Introduction

The negative impacts of drought have been reported affecting water resources, energy, food security, wildfires, livestock grazing, dust storms, desertification, forest growth and human health [1,2]. The World Meteorological Organization (WMO) classifies droughts into meteorological, agricultural, hydrological and socio-economic categories based on the domain affected [3]. In the context of global climate and environmental change, China, as a large agricultural country, is particularly affected by drought in agriculture [4]—in particular, drought has an important impact on the yield of rain-fed crops and plays a decisive role. Drought area, severity, duration and frequency of drought have shown a significant upward trend [5,6,7]. In the North China Plain, rainfall tends to decrease [8], and drought often occurs in successive seasons or years [9]. According to statistics from the National Bureau of Statistics, Henan Province stands as the primary planting area for both corn and wheat in China [10], and the grain output has maintained a leading position in the country for many consecutive years [11,12]. It occupies a crucial position in China’s food security strategy. The study of agricultural drought change holds significant practical and demonstrative implications. The process of drought disaster in Henan has obvious seasonality, and the disaster can occur in any time period, with May to September the disaster-prone season [13]. In Henan, drought was considered one of the most severe natural disasters affecting agricultural production, and it may also have an impact on the political and social environment [14]. Grain production and security are often threatened by drought, and frequent drought will restrict the agricultural development of Henan Province. For example, in the summer of 2014, Henan Province suffered a major drought disaster, resulting in crop losses of 1.809 million hectares, which not only brought huge losses to farmers, but also led to an economic loss of 11.06 billion yuan in Henan Province [15]. As Henan Province experiences rapid economic development and people’s living standards continue to improve, the demand for water is escalating daily. Simultaneously, the likelihood and frequency of agricultural drought are escalating due to the impact of abnormal global climate change [16]. In the context of climate change, China and Henan will face severe drought situation if drought occurs frequently. Conducting further research on agricultural drought in Henan holds significant practical importance, offering a model and a reference for other regions as well.
The growth and survival of crops cannot be separated from water, and the change in soil moisture in the growing environment of crops will seriously affect the physiological activities and growth of crops. Soil moisture (SM) is an important parameter of land-atmosphere interaction and an important indicator to measure agricultural drought [17], which has an important impact on surface water and agricultural production [18]. In recent years, SM has attracted extensive attention and scientific research. Monitoring its variation holds immense significance for agricultural drought surveillance and crop yield forecasting. However, numerous factors, including soil type and land cover, influence its variation, rendering extensive and continuous measurement a challenging task. Therefore, it is difficult to assess changes in SM from ground-based observations at specific locations. Sandholt et al. [19] developed a new index based on vegetation index and surface temperature, and proposed a simple water stress index, the Temperature Vegetation Drought Index (TVDI), through the empirical interpretation of VI-LST space. It is also introduced that the index can indirectly monitor soil moisture content to determine whether the degree of dry and wet can meet the normal growth of crops. On the basis of remote sensing observation, the TVDI can evaluate SM on a large spatial scale [20], and we can determine the SM status [21]. Yu et al. [22] and Liu et al. [23] all believed that the TVDI was more accurate and sensitive in indicating the change in surface soil moisture compared with other vegetation indexes. It has been adopted in many places in China and has achieved good research results in agricultural drought research. Wang et al. [24] delved into the temporal and spatial variation characteristics of drought in Inner Mongolia utilizing the TVDI. Fan et al. [25] estimated the TVDI based on MODIS data to characterize drought conditions in the Loess Plateau and proved that this index has indicative significance for soil and plant water content. Xia et al. [26] studied the spatial–temporal variation in agricultural drought during the grain growing season in Guizhou Province from 2006 to 2015, based on MODIS Vegetation Index (NDVI) and land surface temperature (LST) data. Liu et al. [27] used trend analysis, stability analysis, the H index and other techniques to calculate and study the spatio-temporal evolution of agricultural drought in Shanxi Province obtained by the TVDI. Liu [28] and Zhang et al. [29], based on the TVDI, studied the changes in the drought range in Henan Province over time and space, and concluded that the TVDI was more suitable for the study of drought in Henan Province. In summary, the TVDI, derived from remote sensing data, stands as a reliable and effective indicator for monitoring and evaluating agricultural drought. The use of the TVDI can more accurately monitor the agricultural drought in the study area, which is representative of the remote sensing drought index.
In recent years, with the continuous development of remote sensing technology, real-time and continuous remote sensing image acquisition and extraction of surface characteristic parameters make it possible to monitor drought dynamics in large scale and time. Drought monitoring utilizing remote sensing technology is currently a prevalent method, which is based on different soil texture, water change, vegetation change, etc., so as to analyze the impact of drought [30]. To investigate the temporal and spatial variation characteristics of agricultural drought in Henan Province from 2000 to 2020, the NDVI and LST data from MODIS were employed to establish a TVDI model. Compared with traditional drought monitoring methods, the TVDI can obtain a wide range of drought information by using remote sensing technology, which has the characteristics of spatial continuity and real-time. This makes the TVDI have a unique advantage in the macroscopic analysis and spatial distribution of drought characteristics. Sen slope, M-K significance analysis and the Hurst index method were used to explore the temporal and spatial variation characteristics, dynamics and trends of the TVDI in the region, and a comprehensive and multi-dimensional analysis method for drought characteristics was formed. This innovative and comprehensive approach not only considers the spatial distribution and intensity of drought but also provides a thorough analysis of drought trends, significance, and future persistence, thereby offering a more comprehensive and in-depth examination of drought characteristics. The application of this comprehensive analytical method offers a novel perspective and tool for investigating drought characteristics, thereby facilitating a deeper understanding of the evolutionary patterns and distinctive features associated with drought phenomena.

2. Materials and Methods
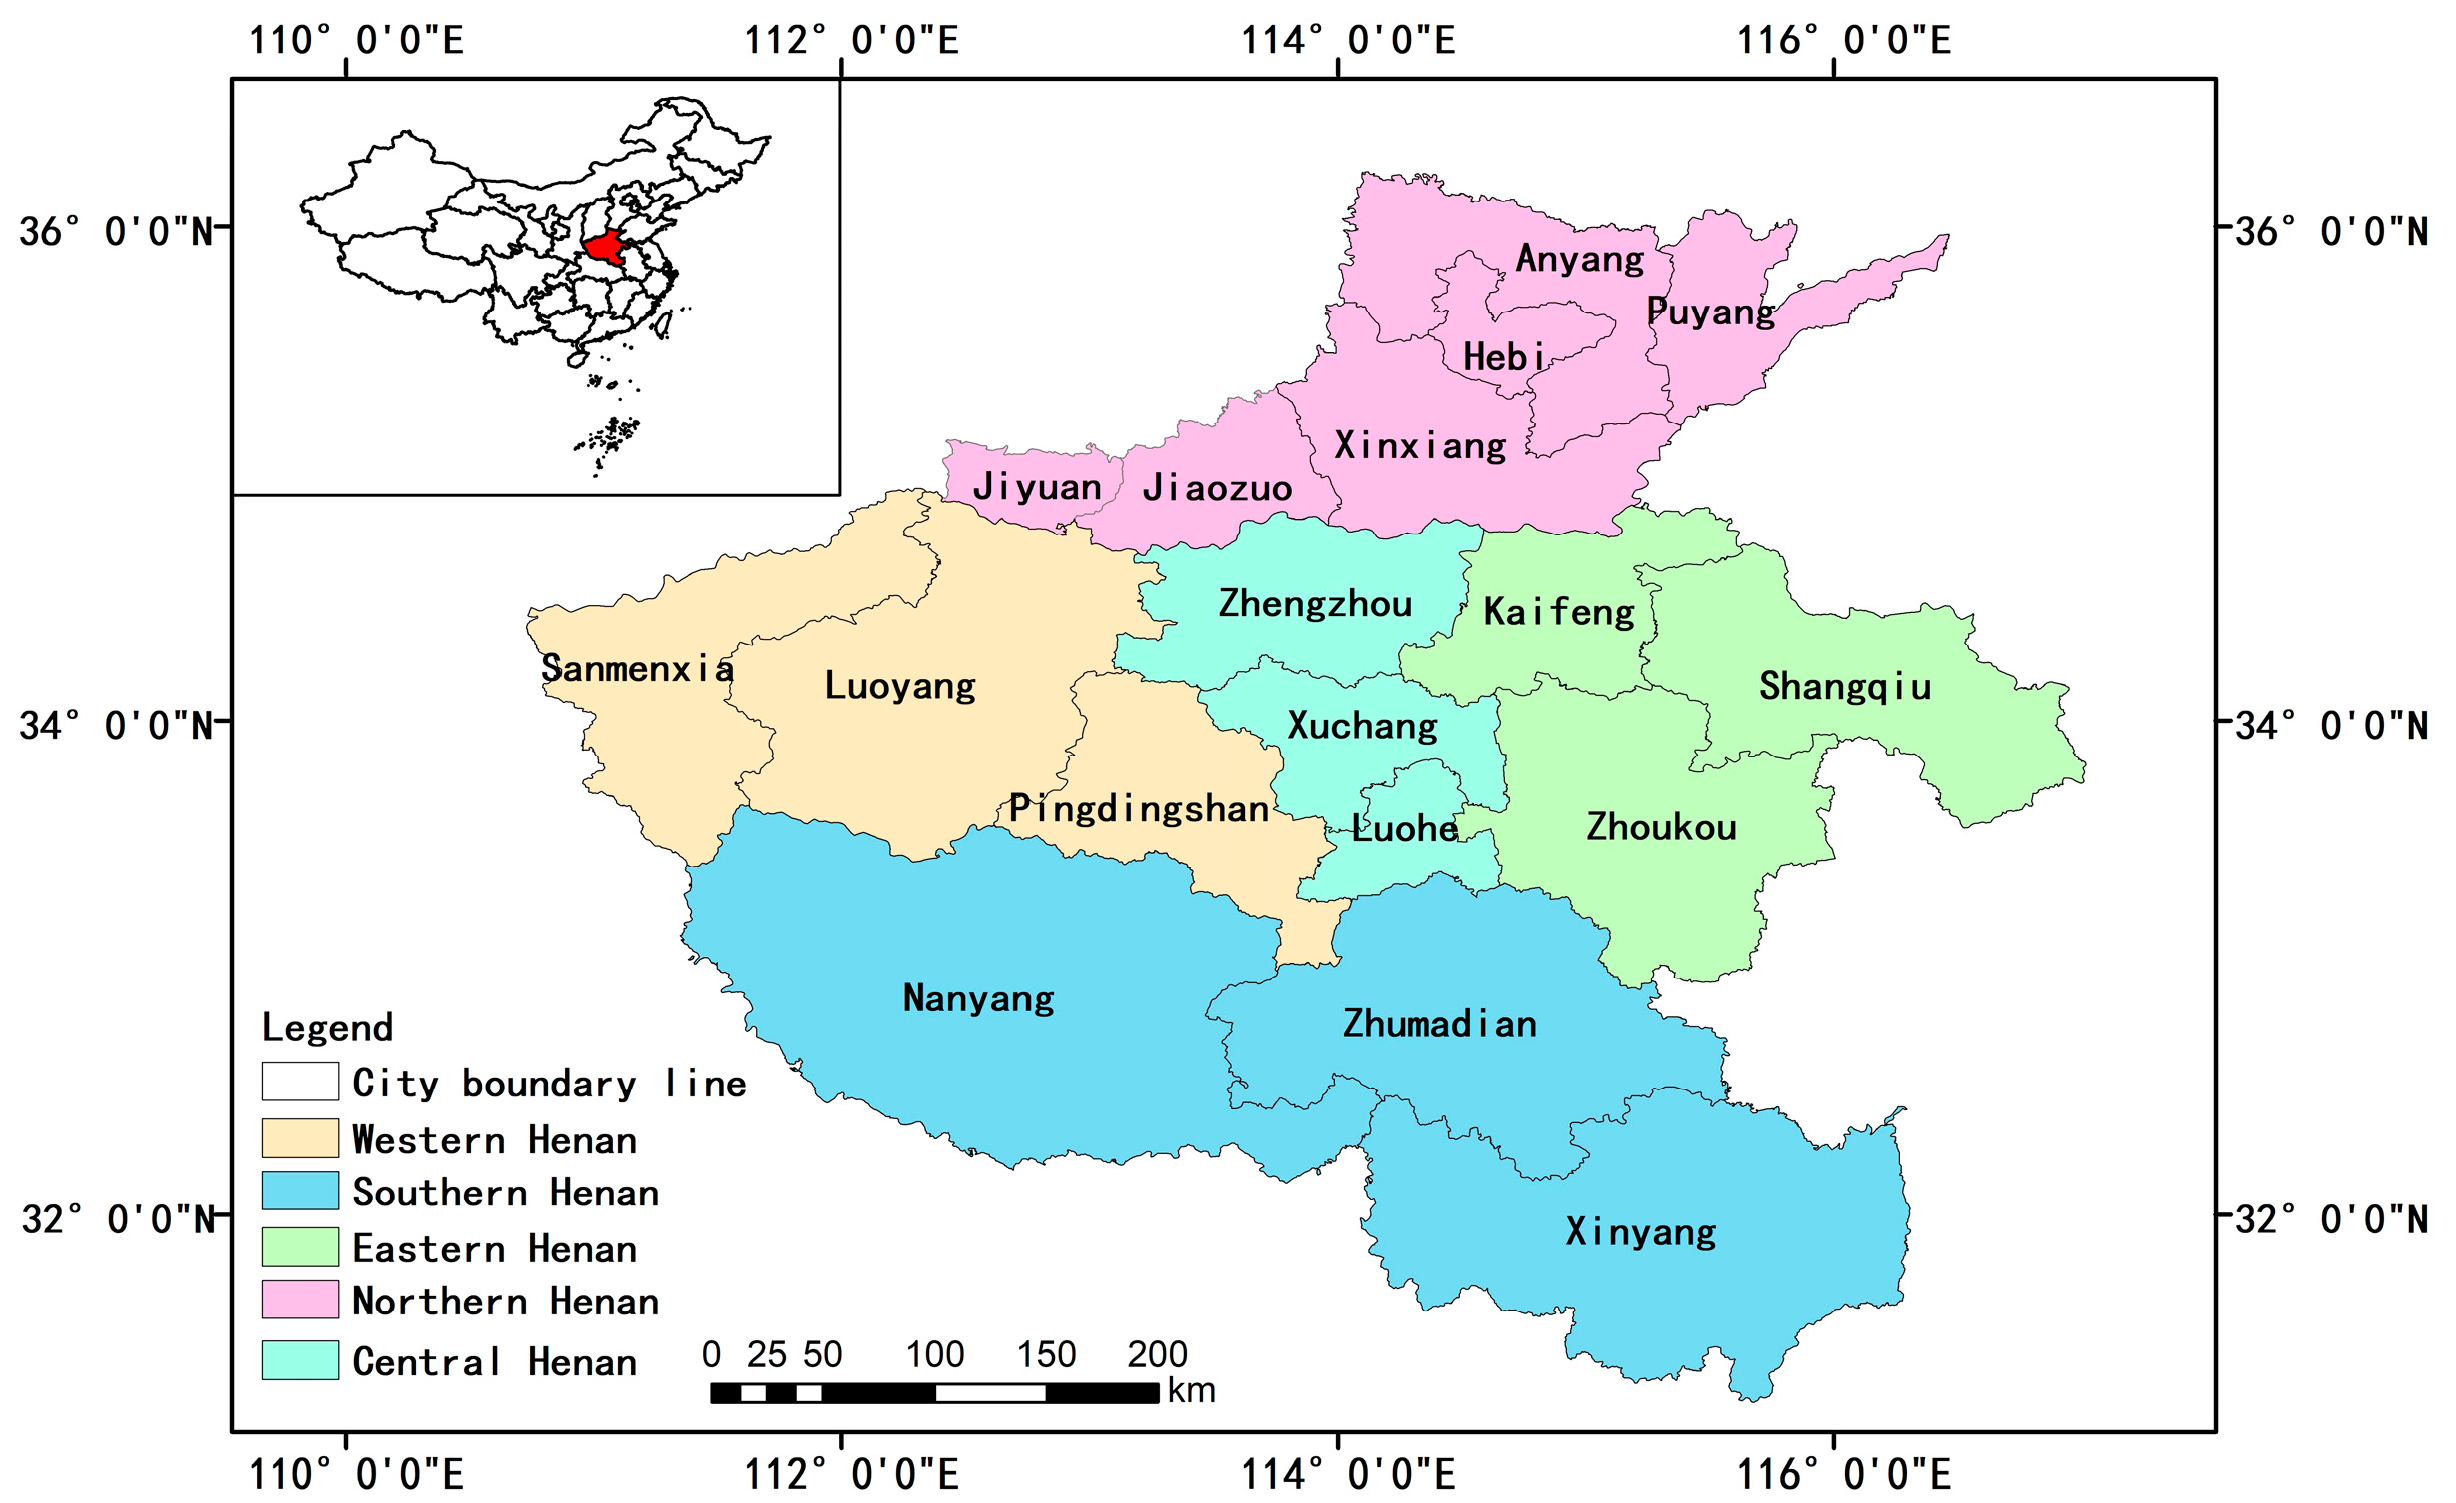
2.1. Study Region

Henan Province is in the eastern middle of China, between 110°21′ E and 116°38′ E, 31°23′ N and 36°22′ N, the terrain reduces gradually from west to east. As shown in Figure 1.
The plain area accounts for 53.1% of the total area of the Henan. The climate belongs to the transitional climate of subtropical humid and warm temperate semi-humid monsoon climate, with annual precipitation of approximately 500–900 mm. Owing to the influence of the monsoon, the distribution of precipitation is highly uneven. The annual precipitation is mainly concentrated in summer, accounting for approximately 70% of the total annual precipitation, and is often accompanied by high temperature. Henan Province, blessed with synchronized rainfall and heat, along with rich soil and favorable natural conditions, has emerged as a key grain-producing area and the foremost agricultural Province in China. The probability of drought in Henan Province is significant, and even in years of flooding, local drought conditions can occur, in the flood season (June to September), it is the vigorous growth stage of crops, crops need more water, while the temperature is high, evaporation is large, if there is no rain for 10 days or half a month, there will be drought, and even bring disaster. Henan Province can be divided into five geographical regions: East, West, South, North and central Henan, which is helpful to better understand the local geographical characteristics and development situation. According to meteorological standards, which spring from March to May, summer from June to August, autumn from September to November, and winter from December to February of the following year.

2.2. The Dataset

The moderate-resolution imaging spectroradiometer (MODIS) vegetation index product MOD13A2 and Surface temperature product MOD11A2 were used as the main data sources for this study, which can be downloaded free of charge from the NASA website (http://search.earthdata.nasa.gov/search, accessed on 6 December 2022). These data have the advantages of moderate spatial resolution, multi-band and good data quality. Within these datasets, MOD13A2 primarily relies on the Normalized Vegetation Index (NDVI), while MOD11A2 is a product that focuses on land surface temperature (LST). Both of these data are widely used in current drought studies, and have a spatial resolution of 1 km [31]. The research selects data from 2000 to 2020 for research, ENVI 5.3 and ArcGIS 10.5 software were used for collaborative processing, the data were converted to Tiff format, the projection was converted to WGS-1984 coordinate system, and the spatial resolution was uniformly chosen as 1 km.
The SRTM-DEM data product provided by geospatial data cloud is used as the digital elevation model in this study (https://www.gscloud.cn/sources/, accessed on 6 December 2022). The spatial resolution of the data product is 90 m. After a series of pre-processing work, such as image stitching, outlier removal and mask clipping in the study area, it is resampling to a spatial resolution of 1 km. The vector boundary data for Henan Province were obtained from the Resources and Environmental Science and Data Center (https://www.resdc.cn/, accessed on 6 December 2022).

2.3. Methods

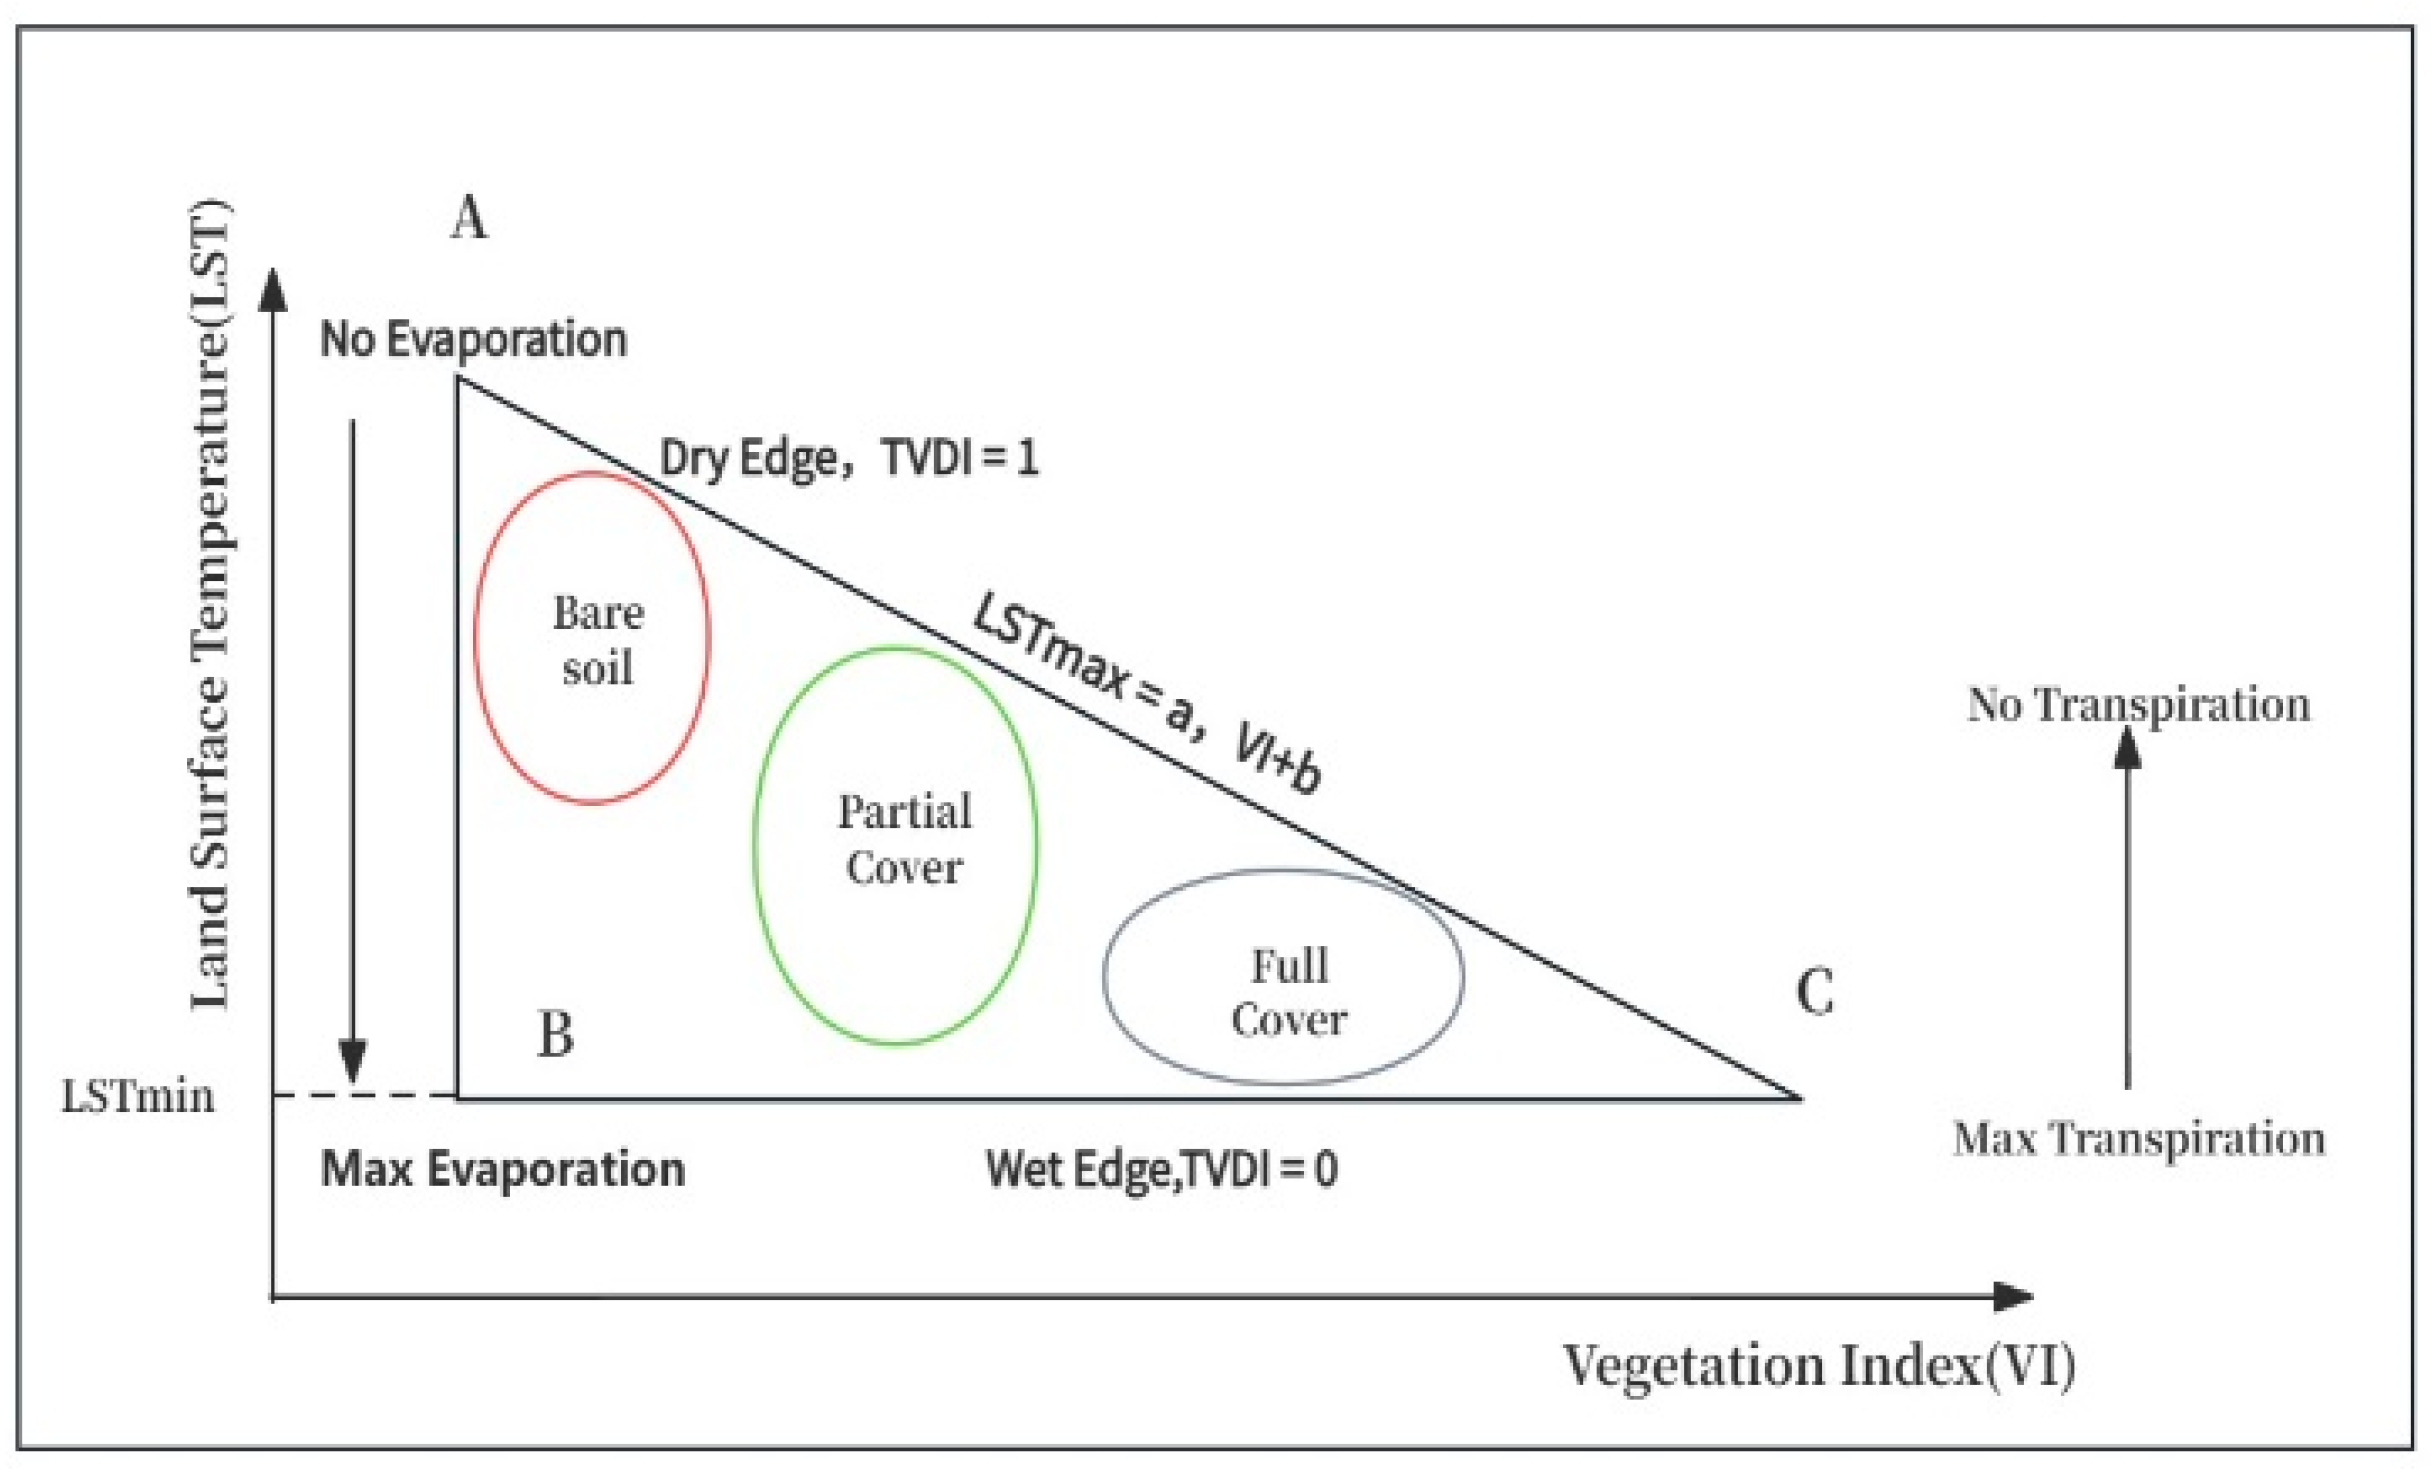
2.3.1. The Temperature Vegetation Dryness Index (TVDI)

Du et al. [32] founded in their practice that the scatterplot between NDVI and LST show a trend of trapezoidal distribution, and thus proposed the trapezoidal feature space of NDVI-LST. Subsequently, some researchers found that the scatter plot of this feature space presents a triangular distribution trend when the vegetation coverage of the study area is large [33], the principle of which is shown in Figure 2.
The region represented by point A in the figure has lower NDVI value and higher surface temperature, indicating that this region is dry bare soil. Point B shows that NDVI value is low and surface temperature is relatively low, indicating that the area is moist bare soil. On the other hand, point C shows a very high NDVI value and relatively low surface temperature, indicating that this region has rich vegetation cover and moist soil conditions. By connecting two points A and C, a line segment with a negative slope (falling) is obtained, representing the “dry edge” of the soil. The two points connecting B and C form a line segment with a positive slope (rising), representing the “wet edge” of the soil. On the basis of the above studies, Sandholt et al. [19] further observed the existence of a series of soil moisture contours in the characteristic space, which approximately intersects the intersection of the dry edge and the wet edge.
First, the digital elevation model (DEM) was used to correct the LST data, and the correction method was as follows:
T s 2 = T s 1 + C h
where T s 2 is the land surface temperature corrected by DEM, T s 1 is the original MODIS land surface temperature, h is the elevation, C is the correction factor, and is 0.006.
The TVDI formula is as follows:
TVDI = T S - T S m i n T S m a x - T S m i n
T S m i n = a + b × NDVI
T S m a x = c + d × NDVI
where T S is the surface temperature of a certain pixel, T S max and T S min is the highest and lowest surface temperature corresponding to a certain NDVI. a and b are dry edge fitting parameters, c and d are wet edge fitting parameters. There was a negative correlation between the TVDI and soil moisture in the characteristic space region, and the higher the value, the lower the soil moisture, indicating that the soil drought was heavier. On the contrary, a smaller TVDI indicates wetter soil moisture, less drought or no drought, and the value of the TVDI ranges from 0 to 1.
In this study, pixels with NDVI less than 0.2 (the range is basically water, town and water and land mixed pixels) are ignored. Referring to the classification criteria of drought in previous studies [34,35], the TVDI was divided into five levels in this study, as shown in Table 1:

2.3.2. Theil–Sen Median Trend Analysis and the Mann–Kendall Test

Theil–Sen Median (Sen) trend analysis method was used to analyze the annual, monthly and quarterly average TVDI trend changes, and the Mann–Kendall non-parametric (M-K) test method was used to analyze the significance of the resulting change trends. Long time series data can be analyzed based on Theil–Sen Median trend analysis combined with the Mann–Kendall trend test method. This method has incomparable advantages compared with the traditional unitary linear regression analysis method [36]. The formula is as follows:
β = Median TVDI j TVDI i j i , 2020 > j > i > 2000
where Median is the median function; T V D I i and T V D I j are the data of the pixel in year i and year j, respectively. β > 0, the TVDI is increasing. β = 0, the TVDI is stable. β < 0, the TVDI is declining.
M-K is a non-parametric mutation test method, which can determine the significance of the trend when n > 10; the standard normal system variable is calculated by the following formula [31]:
Z = S 1 / V a r S 0 S + 1 / V a r S S > 0 S = 0 S < 0
S = k = 1 n 1 j = 1 n S g n ( TVDI j - T V D I k )
V a r S = n n 1 2 n + 5 18
where Z as the standardized statistic of M-K test, follows the standard normal distribution. Under a certain significance level α, if |Z| ≥ Z1-α/2, the change trend can be regarded as significant; otherwise, it is not significant. When |Z| is greater than 1.96, the trend can be considered to pass the 95% significance test.
Sen trend analysis combined with M-K significance test was used to analyze TVDI trends in Henan Province. Sen slope ≤ −0.0005 was reclassified as −1, slope between −0.0005 and 0.0005, reclassified as 0, slope ≥ 0.0005 was reclassified as 1. For the M-K significance test, the confidence level is 0.005, and the Z-value between −1.96 and 1.96 is assigned to the non-significant reclassification as 1, and the Z-absolute value greater than 1.96 is assigned to the significant reclassification as 2. The final trend analysis results are divided into five categories, and the specific drought change trend and significance division are shown in Table 2.

2.3.3. The Hurst Index

The Hurst index is used to characterize the evolution trend of long time series variables in the future, and this method has been widely used in hydrology, vegetation, meteorology and other fields. At present, the Hurst index is often calculated using the re-scaled range (R/S) method to determine the future regional drought change. Some studies have found that [37], the Hurst index obtained by R/S analysis is more realistic, and the calculation formula is as follows:
TVDI ¯ ( τ ) = 1 τ i = 1 τ TVDI ( τ ) ,   τ = 1 , 2 ,   n
X ( i , t ) = i = 1 t TVDI ( i ) - TVDI ¯ ( t ) ,   1 i τ
R τ = max 1 i τ x ( i , τ ) min 1 i τ x i , τ ,   τ = 1 , 2 , , n
S t = 1 t i = 1 t TVDI ( i ) TVDI ( t ) 2 ,   τ = 1 , 2 ,   n
To calculate the Hurst index:
R τ S τ = c τ H
where H is the Hurst index, the logarithm of both sides of the formula can be obtained. The persistence of TVDI time series can be determined according to the value of the Hurst index. The Hurst index is divided into three main categories: When 0.5 < H ≤ 1, it is a persistent sequence, and the larger the H value, the stronger the persistence. When H = 0.5, it is a random sequence with no continuity. When 0 ≤ H < 0.5, it is an anti-persistence sequence, and the smaller the H value, the stronger the anti-persistence performance.

3. Results

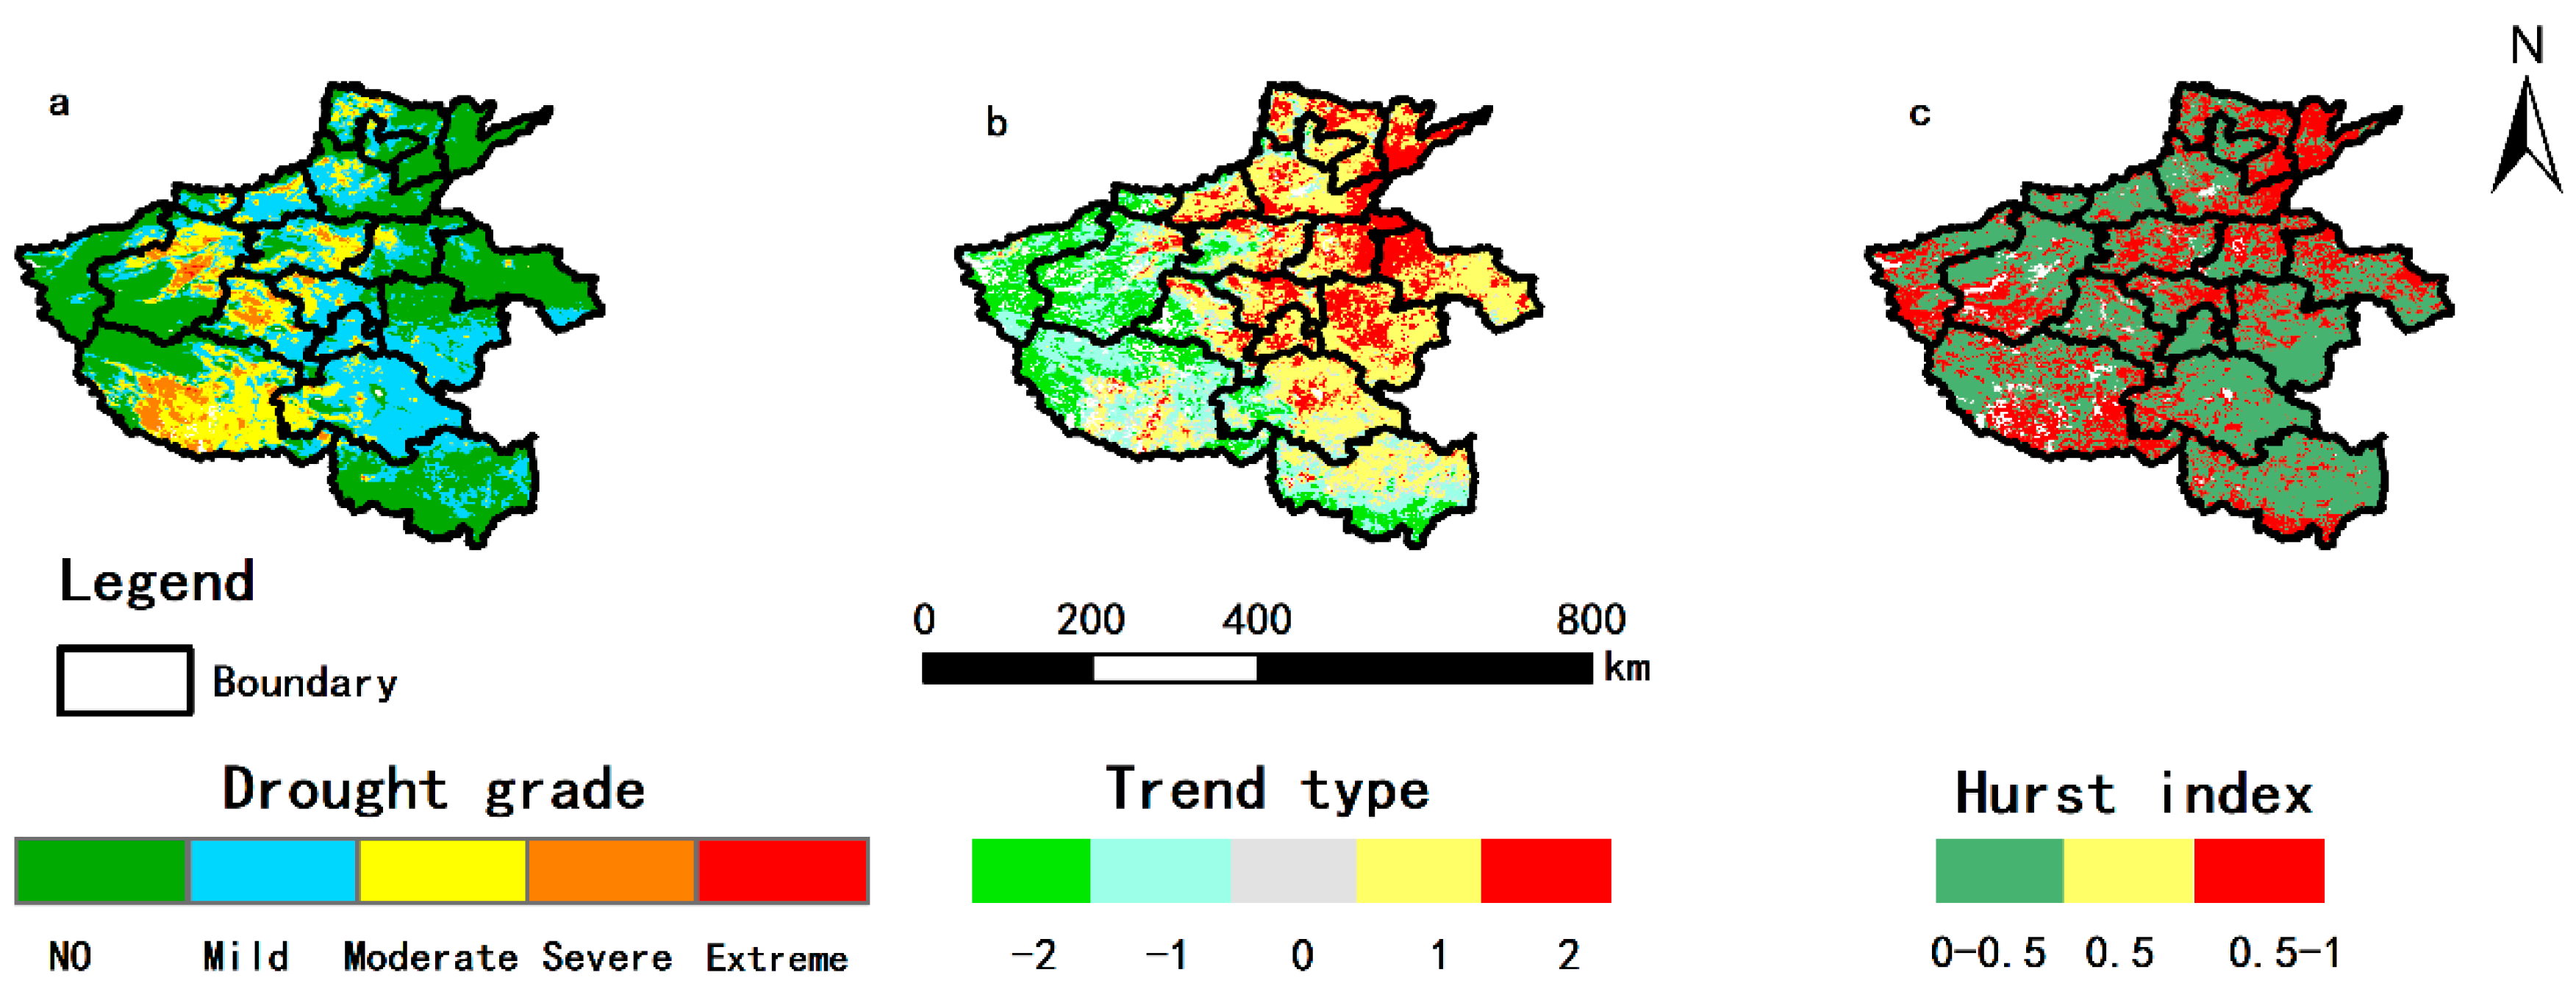
3.1. Annual Change Characteristics

The spatial distribution of the multi-year TVDI is shown in Figure 3a. The annual average TVDI value of Henan Province from 2000 to 2020 is 0.592, indicating that the overall level of agricultural drought is No drought and close to light drought, but the annual maximum average is 0.951, indicating that there is an extreme drought. The figure shows that the distribution of agricultural drought in Henan Province has obvious spatial differences. Although agricultural drought has occurred in eastern, western, southern, northern and central Henan Province, over the years, agricultural drought has mainly distributed in central, northwestern, northeastern and southern Henan Province.
Sen trend analysis combined with the MK significance test was used to analyze the annual average TVDI trend in Henan Province. The statistical results are shown in Table 3, and the trend distribution is shown in Figure 3b. As can be seen, there is a significant difference in the variation trend of the annual TVDI in Henan Province, among which the northeastern region of Henan Province has an increasing trend, while the southwestern region has a decreasing trend, accounting for 43.58% and 50.03%, respectively, in Table 3. In general, the increasing trend is greater than the decreasing trend, and the regions without significant changes account for only 6.39%. Among them, the significant increase is more obvious in the northern, eastern and central Henan regions. The agricultural drought in the northeast of western Henan has a significant slowing down trend, and the drought in northern Henan and central Henan has a worsening trend.
From Figure 3c. According to the Hurst index, the northern, eastern and central regions, as well as the southern of Henan Province will maintain the current trend of drought change and will have a trend of worsening drought. As can be seen from Table 3, in Henan Province, in 35.03% of the regions, the Hurst or the TVDI were greater than 0.5, 64.96% of the regions had a Hurst index of less than 0.5, and almost zero regions had a Hurst index of 0.5. The comprehensive analysis shows that 5.15% of the whole area of Henan Province will keep the trend of the continuous increase in drought, mainly distributed in the north, northeast of eastern and the central Henan Province.

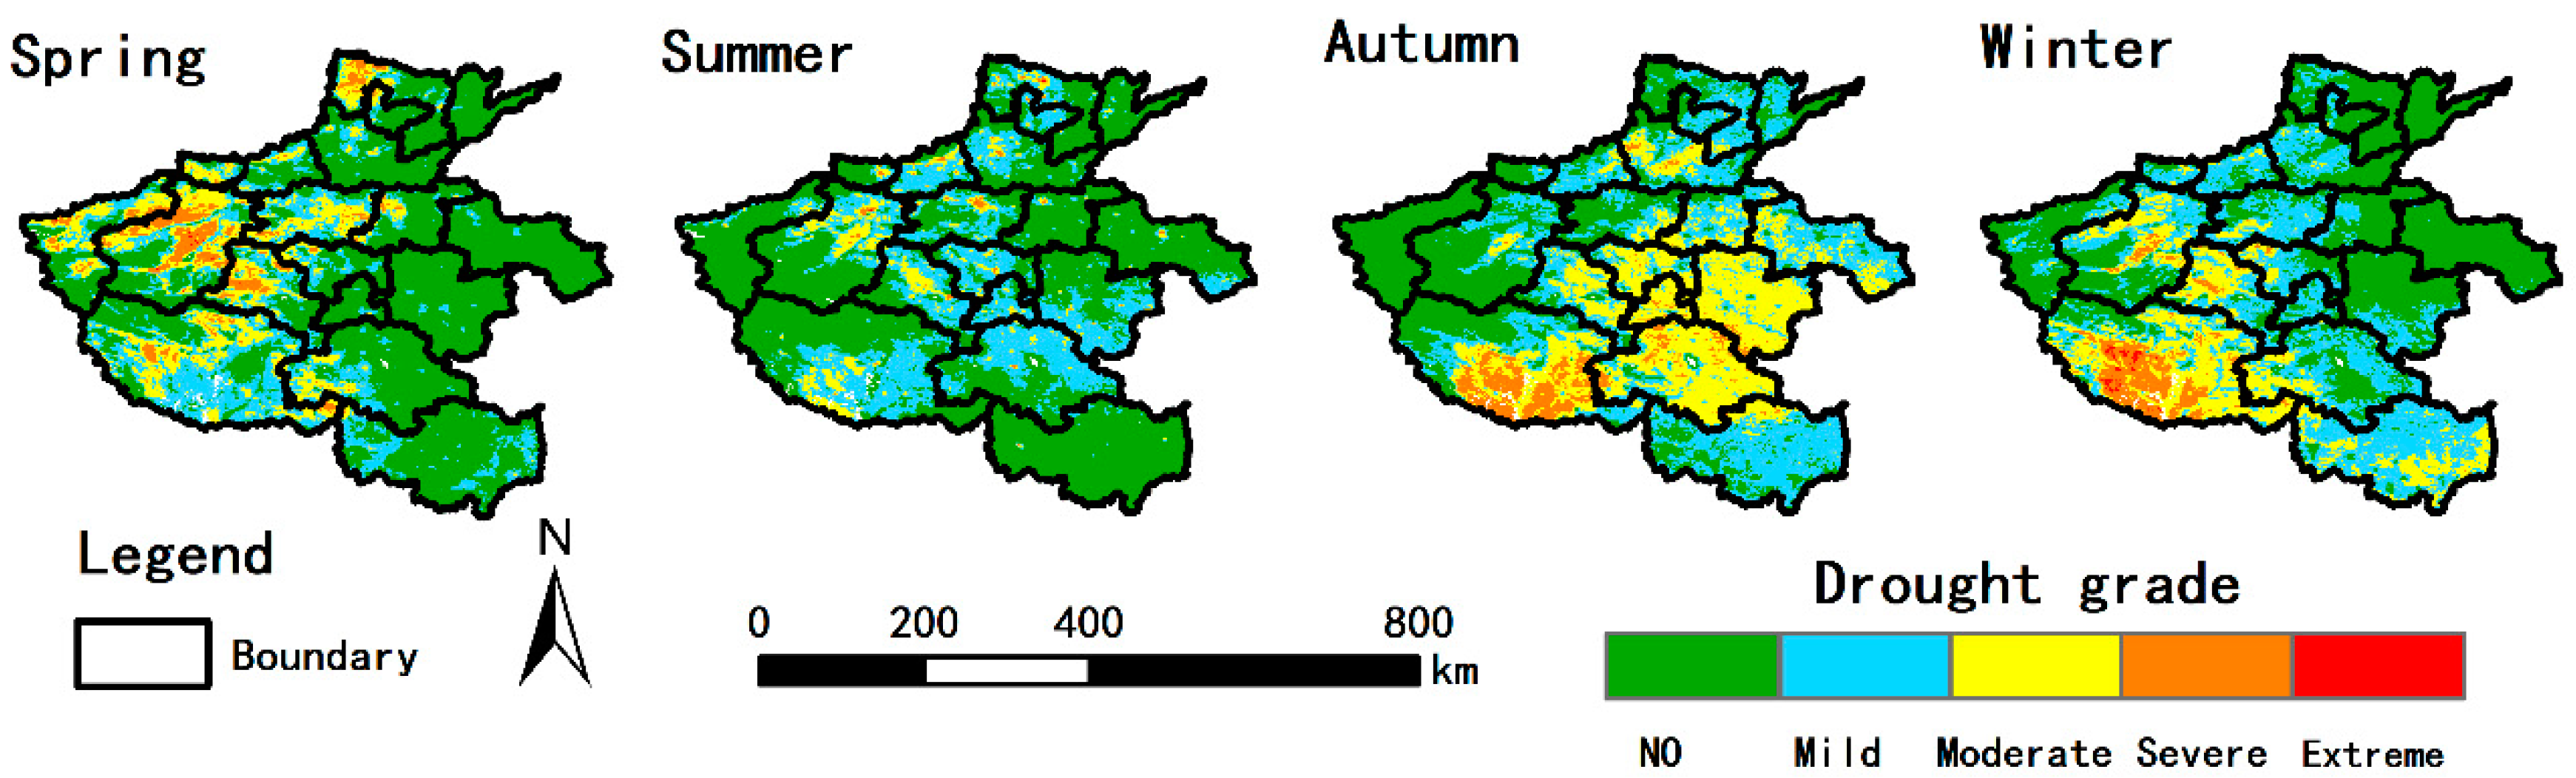
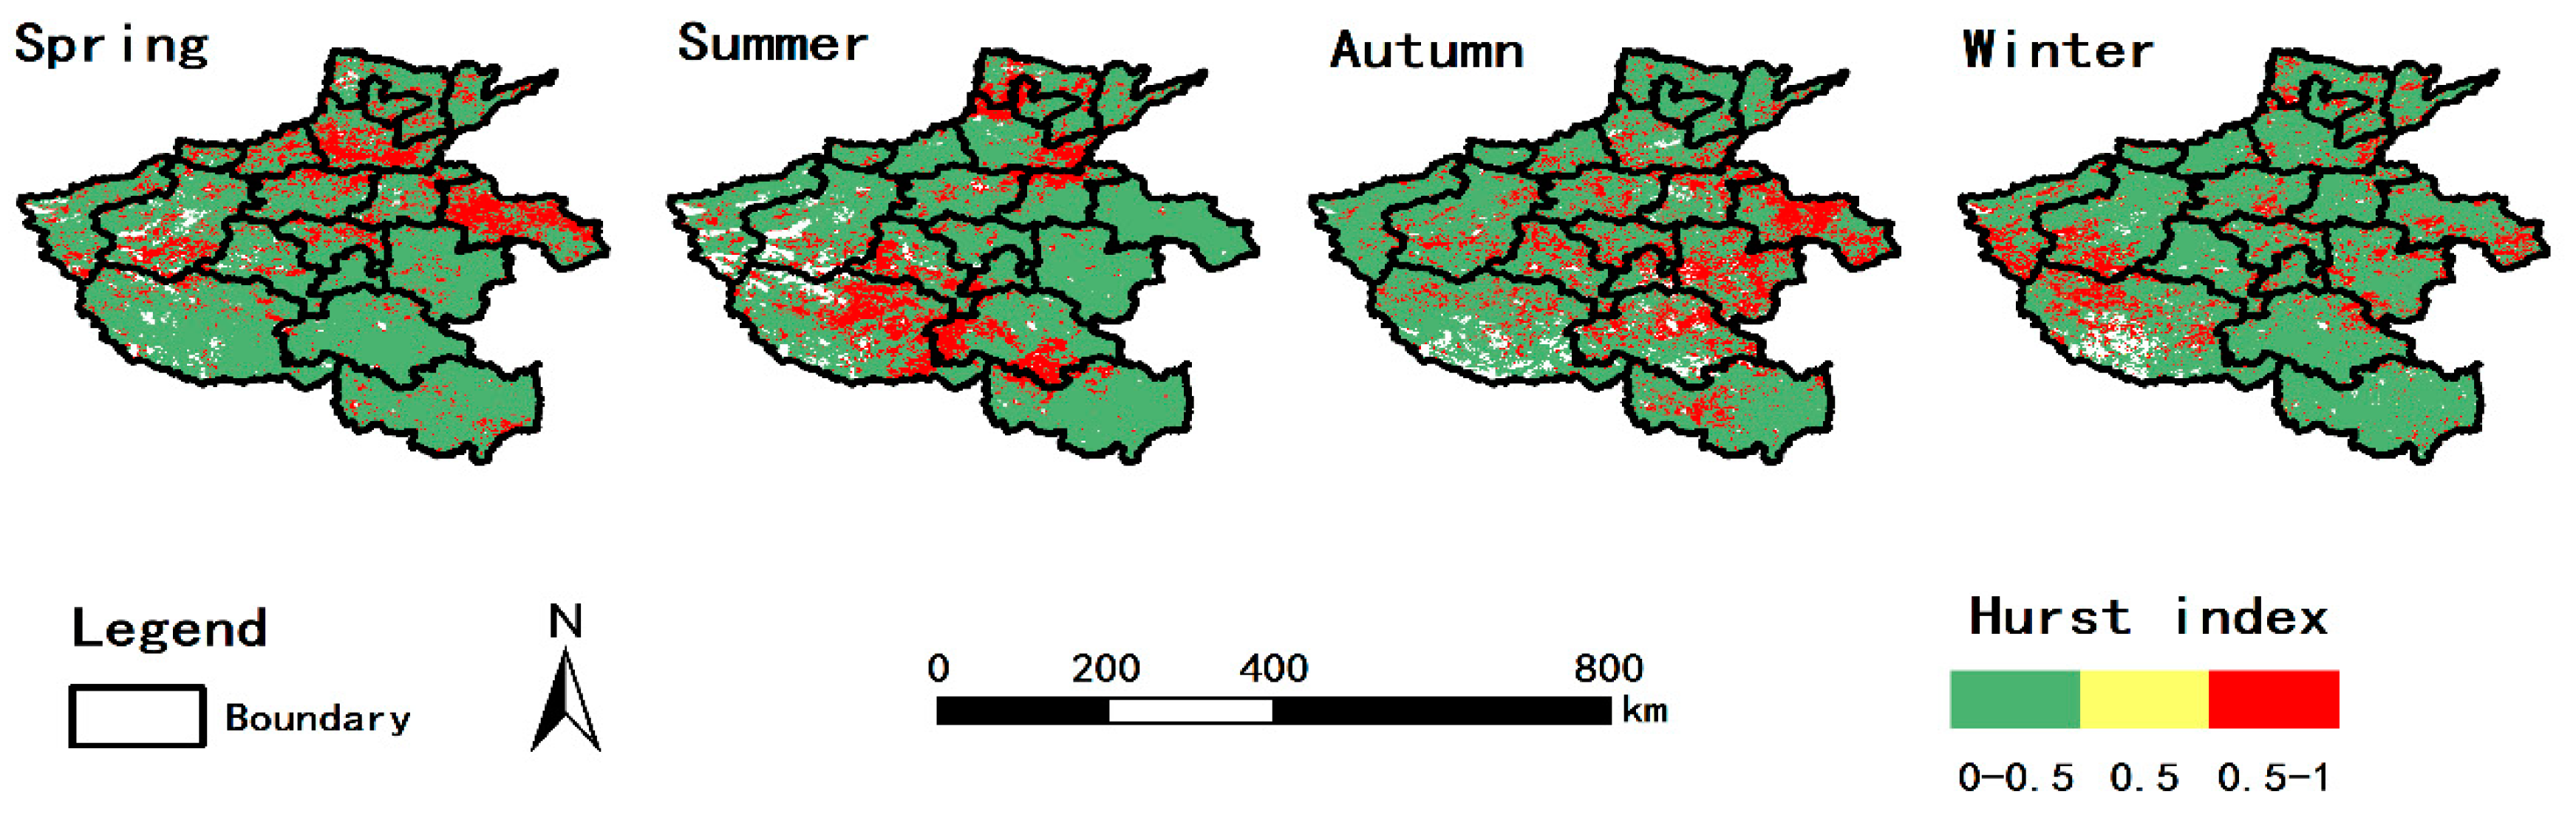
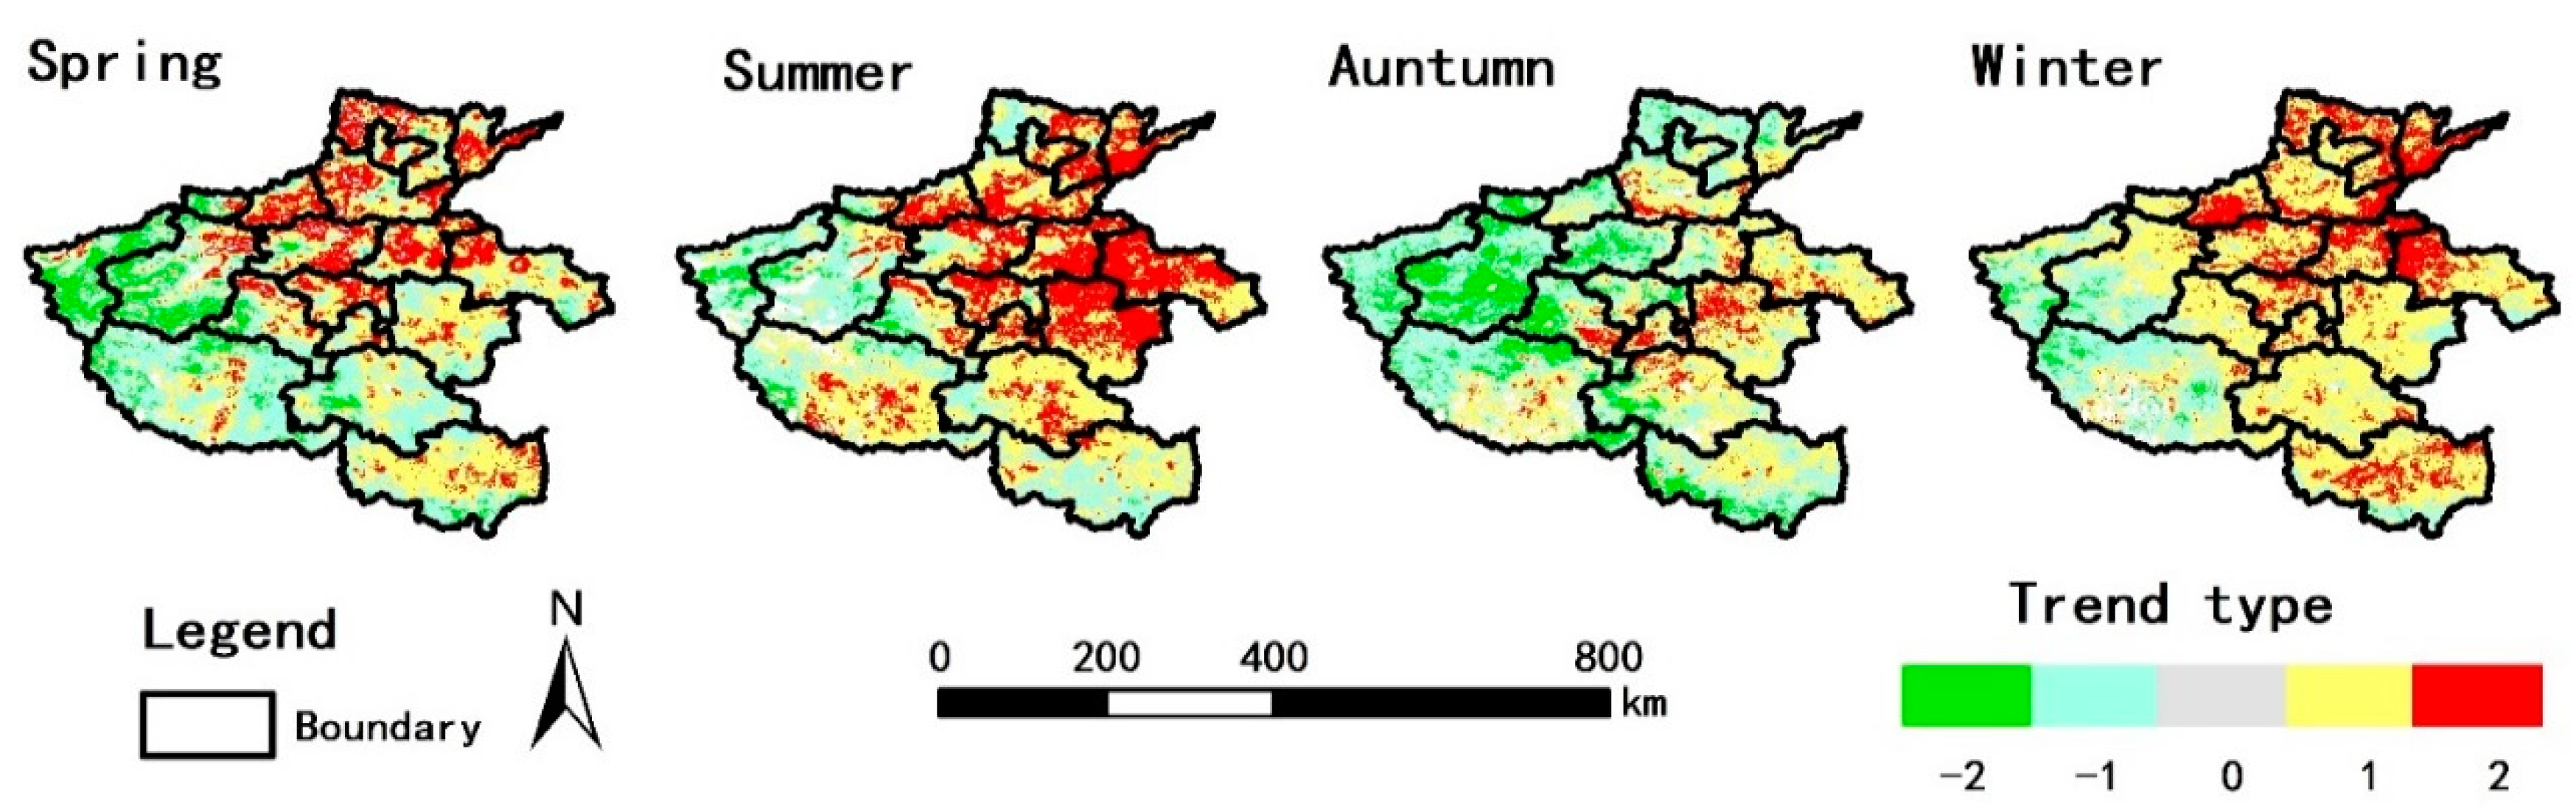
3.2. Quarterly Change Characteristics

The change characteristics of the TVDI in four seasons of Henan Province from 2000 to 2020 are shown in Figure 4. It can be seen from the figure that agricultural drought will occur in every season of the year. The average annual TVDI values of spring, summer, autumn and winter are 0.570, 0.512, 0.624 and 0.607, respectively. Spring and summer belong to no drought, autumn and winter belong to light drought. However, the annual maximum values reached 0.941, 0.929, 0.917, 0.945, respectively, and extreme drought occurred in all seasons. Overall, the agricultural drought in Henan showed autumn > winter > spring > summer. The spring agricultural drought mainly occurs in the northern, western, central of Henan Province and the NanYang part of Henan Province. Extreme drought is mainly distributed in western, northern, northern of central and southwestern Henan. Summer agricultural drought is mainly distributed in the northeast of western, central, southeastern of Henan and a small part of NanYang region. Extreme drought mainly distributed in central and some parts of northern Henan. Autumn agricultural drought mainly occurred in the NanYang area of southern Henan, the intersection area of western and central of Henan. Extreme drought is mainly distributed in the NanYang Basin of southern Henan Province, and the middle drought is mainly in eastern and central Henan. Winter agricultural drought mainly occurs in the NanYang area of southern, the western part of central Henan and the eastern part of western Henan. Compared with autumn, the main trend shifted to the west, showing that the drought in the western part of the study area was more severe than that in the eastern part. Extreme drought is mainly distributed in the NanYang basin of southern and a small part of the confluence of western and central Henan.
Sen trend analysis combined with the MK significance test was used to analyze the variation trend of the TVDI in four seasons in Henan Province. The statistical outcomes are presented in Table 4, and the trend distribution is shown in Figure 5. The drought in spring, summer and winter showed an increasing trend. In autumn, on the contrary, the drought was generally moderating. The increasing trend of spring drought occurred mainly in central, northern, and northeast of Henan. The increasing trend of summer drought was mainly distributed in northern, central, eastern and southern Henan regions. The increasing trend of autumn drought is mainly distributed in the eastern of western, northern of southern, northern is near the central part of Henan. The increasing trend of drought in winter showed an increasing trend in the whole Province except the western region, which showed a decreasing trend of drought in the four seasons. The comprehensive analysis shows that drought intensifies significantly in northern Henan in spring, central Henan in summer, eastern and southern Henan in autumn, and central and southern Henan in winter.
The statistical results are shown in Table 4. In Henan Province, the proportion of areas with an increasing trend of drought in spring, summer, autumn and winter was 50.03%, 68.27%, 38.72% and 74.75%, respectively, while the proportion of areas with a decreasing trend was 43.58%, 26.35%, 54.58% and 19.69%, respectively.
According to the Hurst index, the trend distribution is shown in Table 4 and Figure 6. In spring, the drought in northern, northeast of eastern and central Henan will keep increasing, accounting for 18.22%. In summer, the drought in northern, southern and southwestern of central Henan will maintain the trend of increasing, accounting for 19.31%. In autumn, the intersection area of central, northern and eastern, and eastern Henan will keep the trend of the continuous increase in drought, accounting for 20.77%. In winter, the drought situation in some parts of northern Henan, central Henan and eastern Henan will keep increasing, accounting for 15.83%.

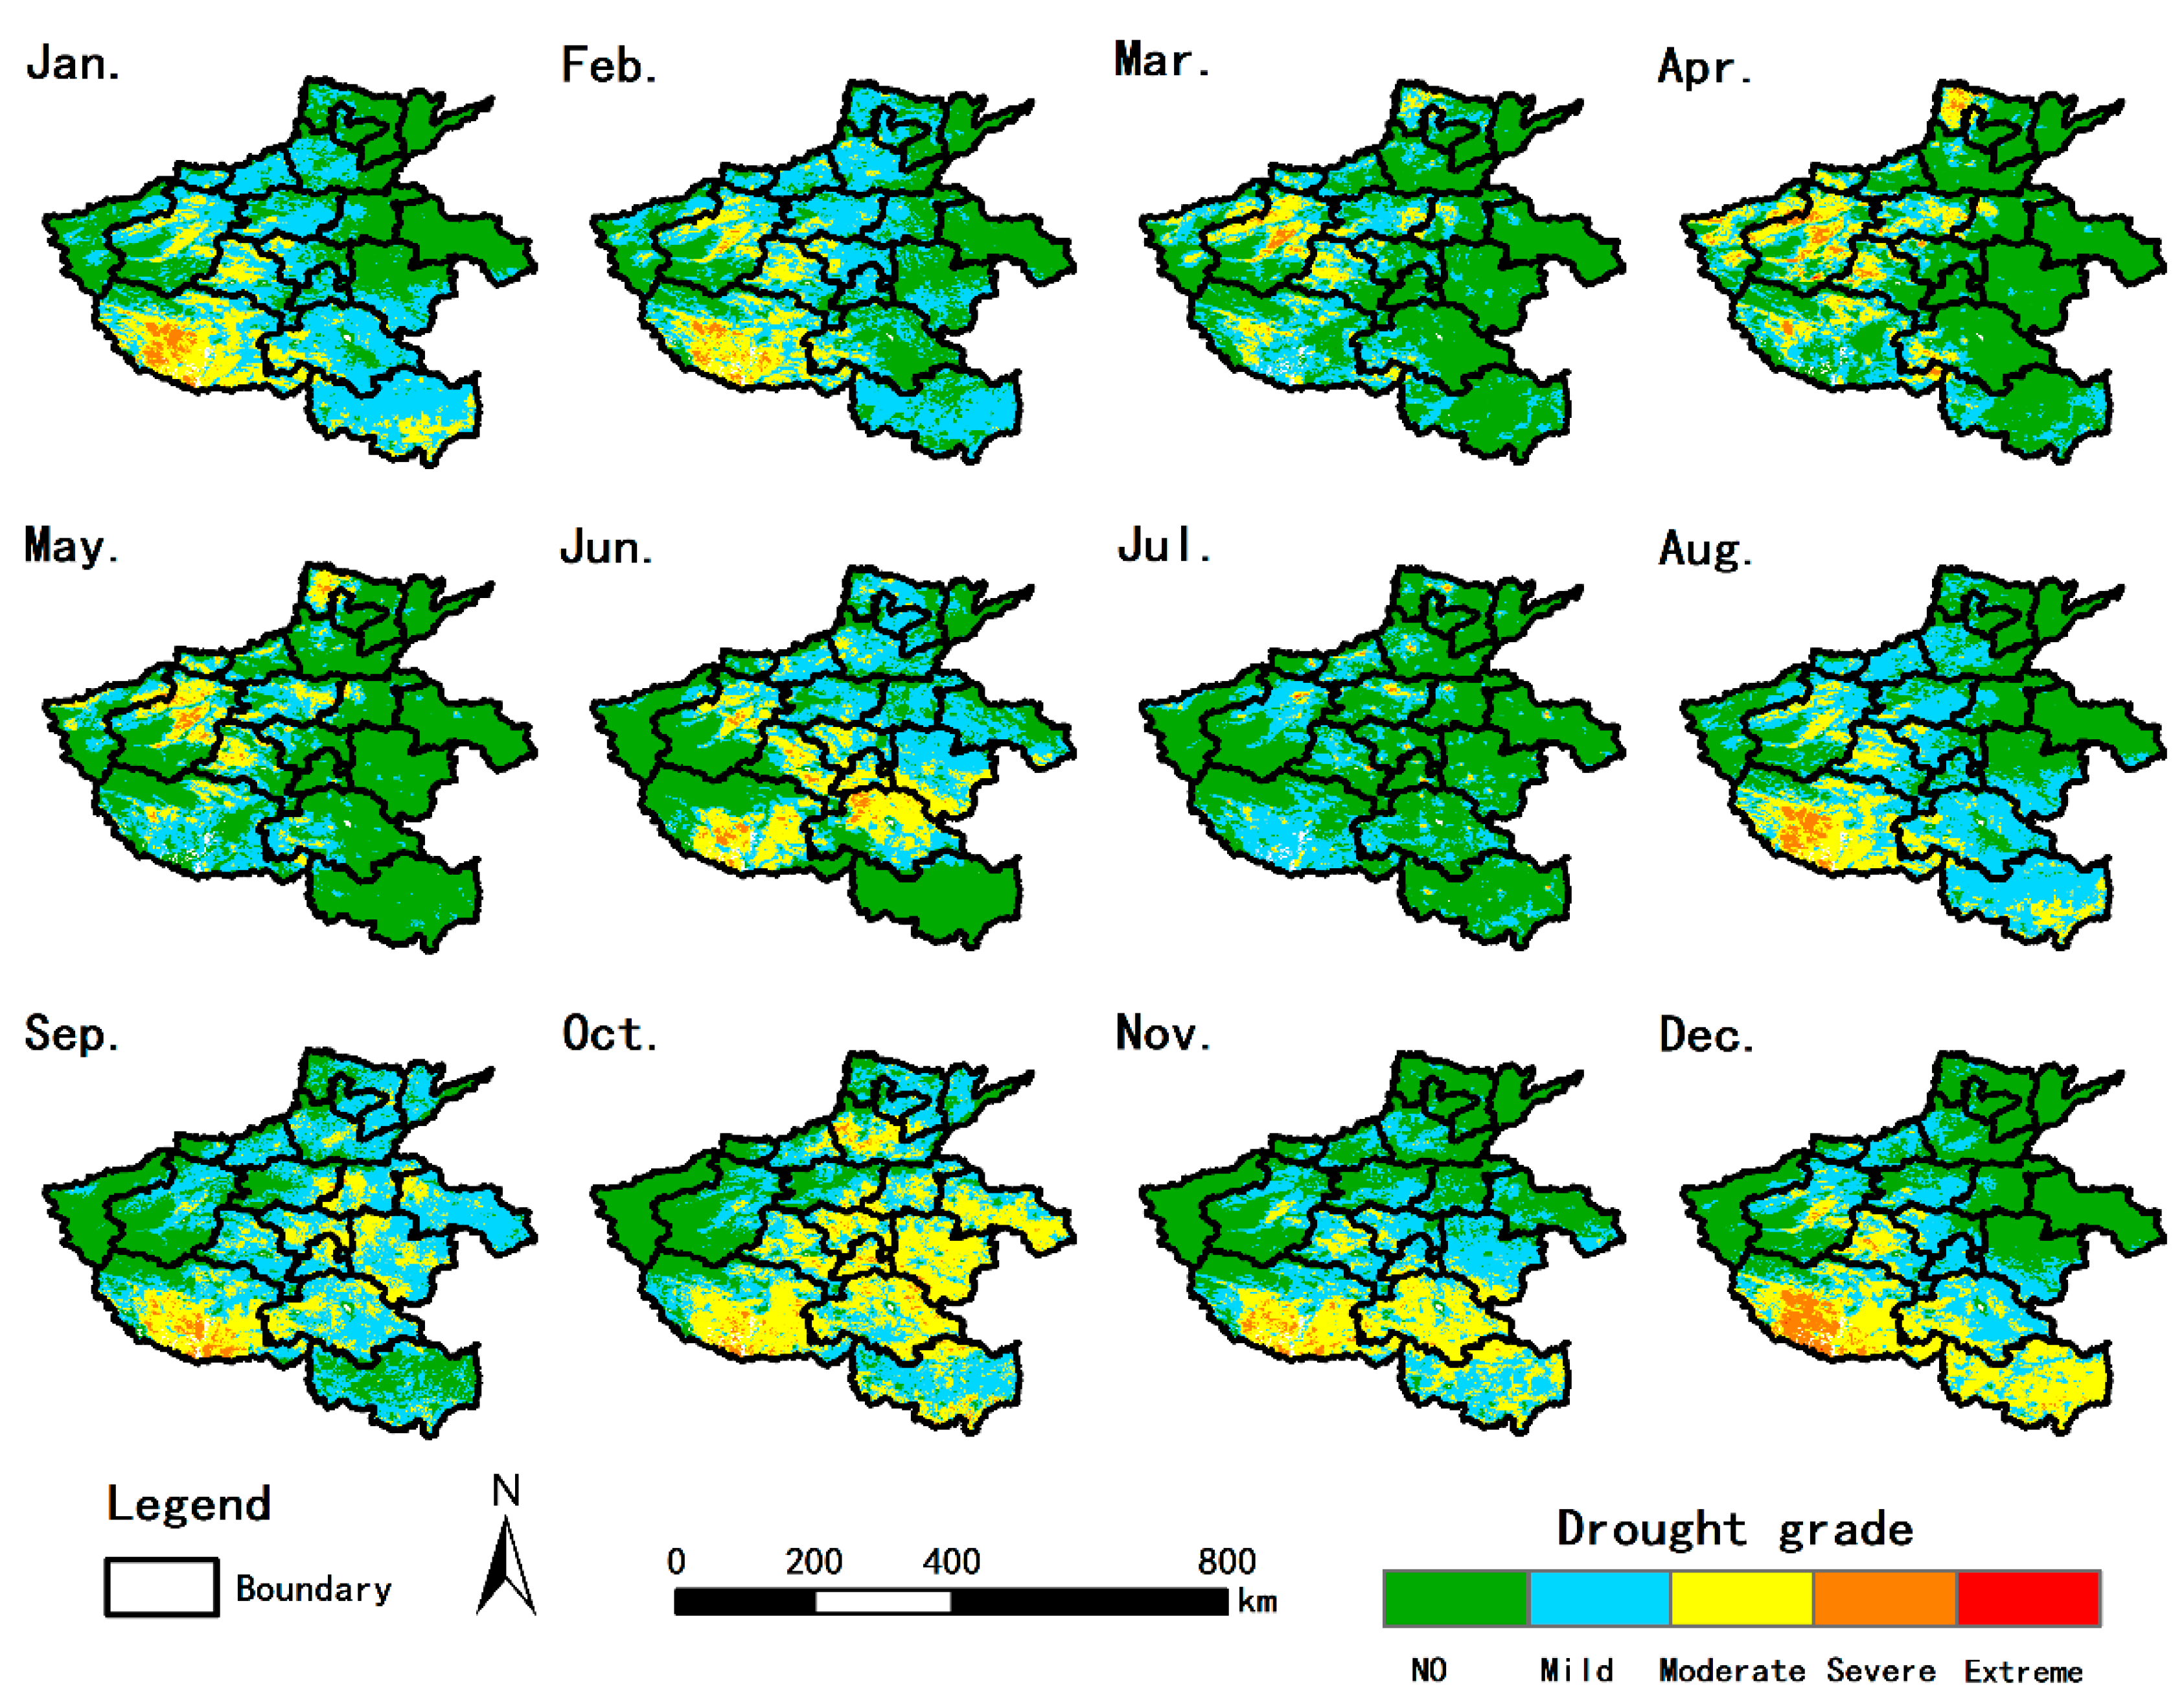
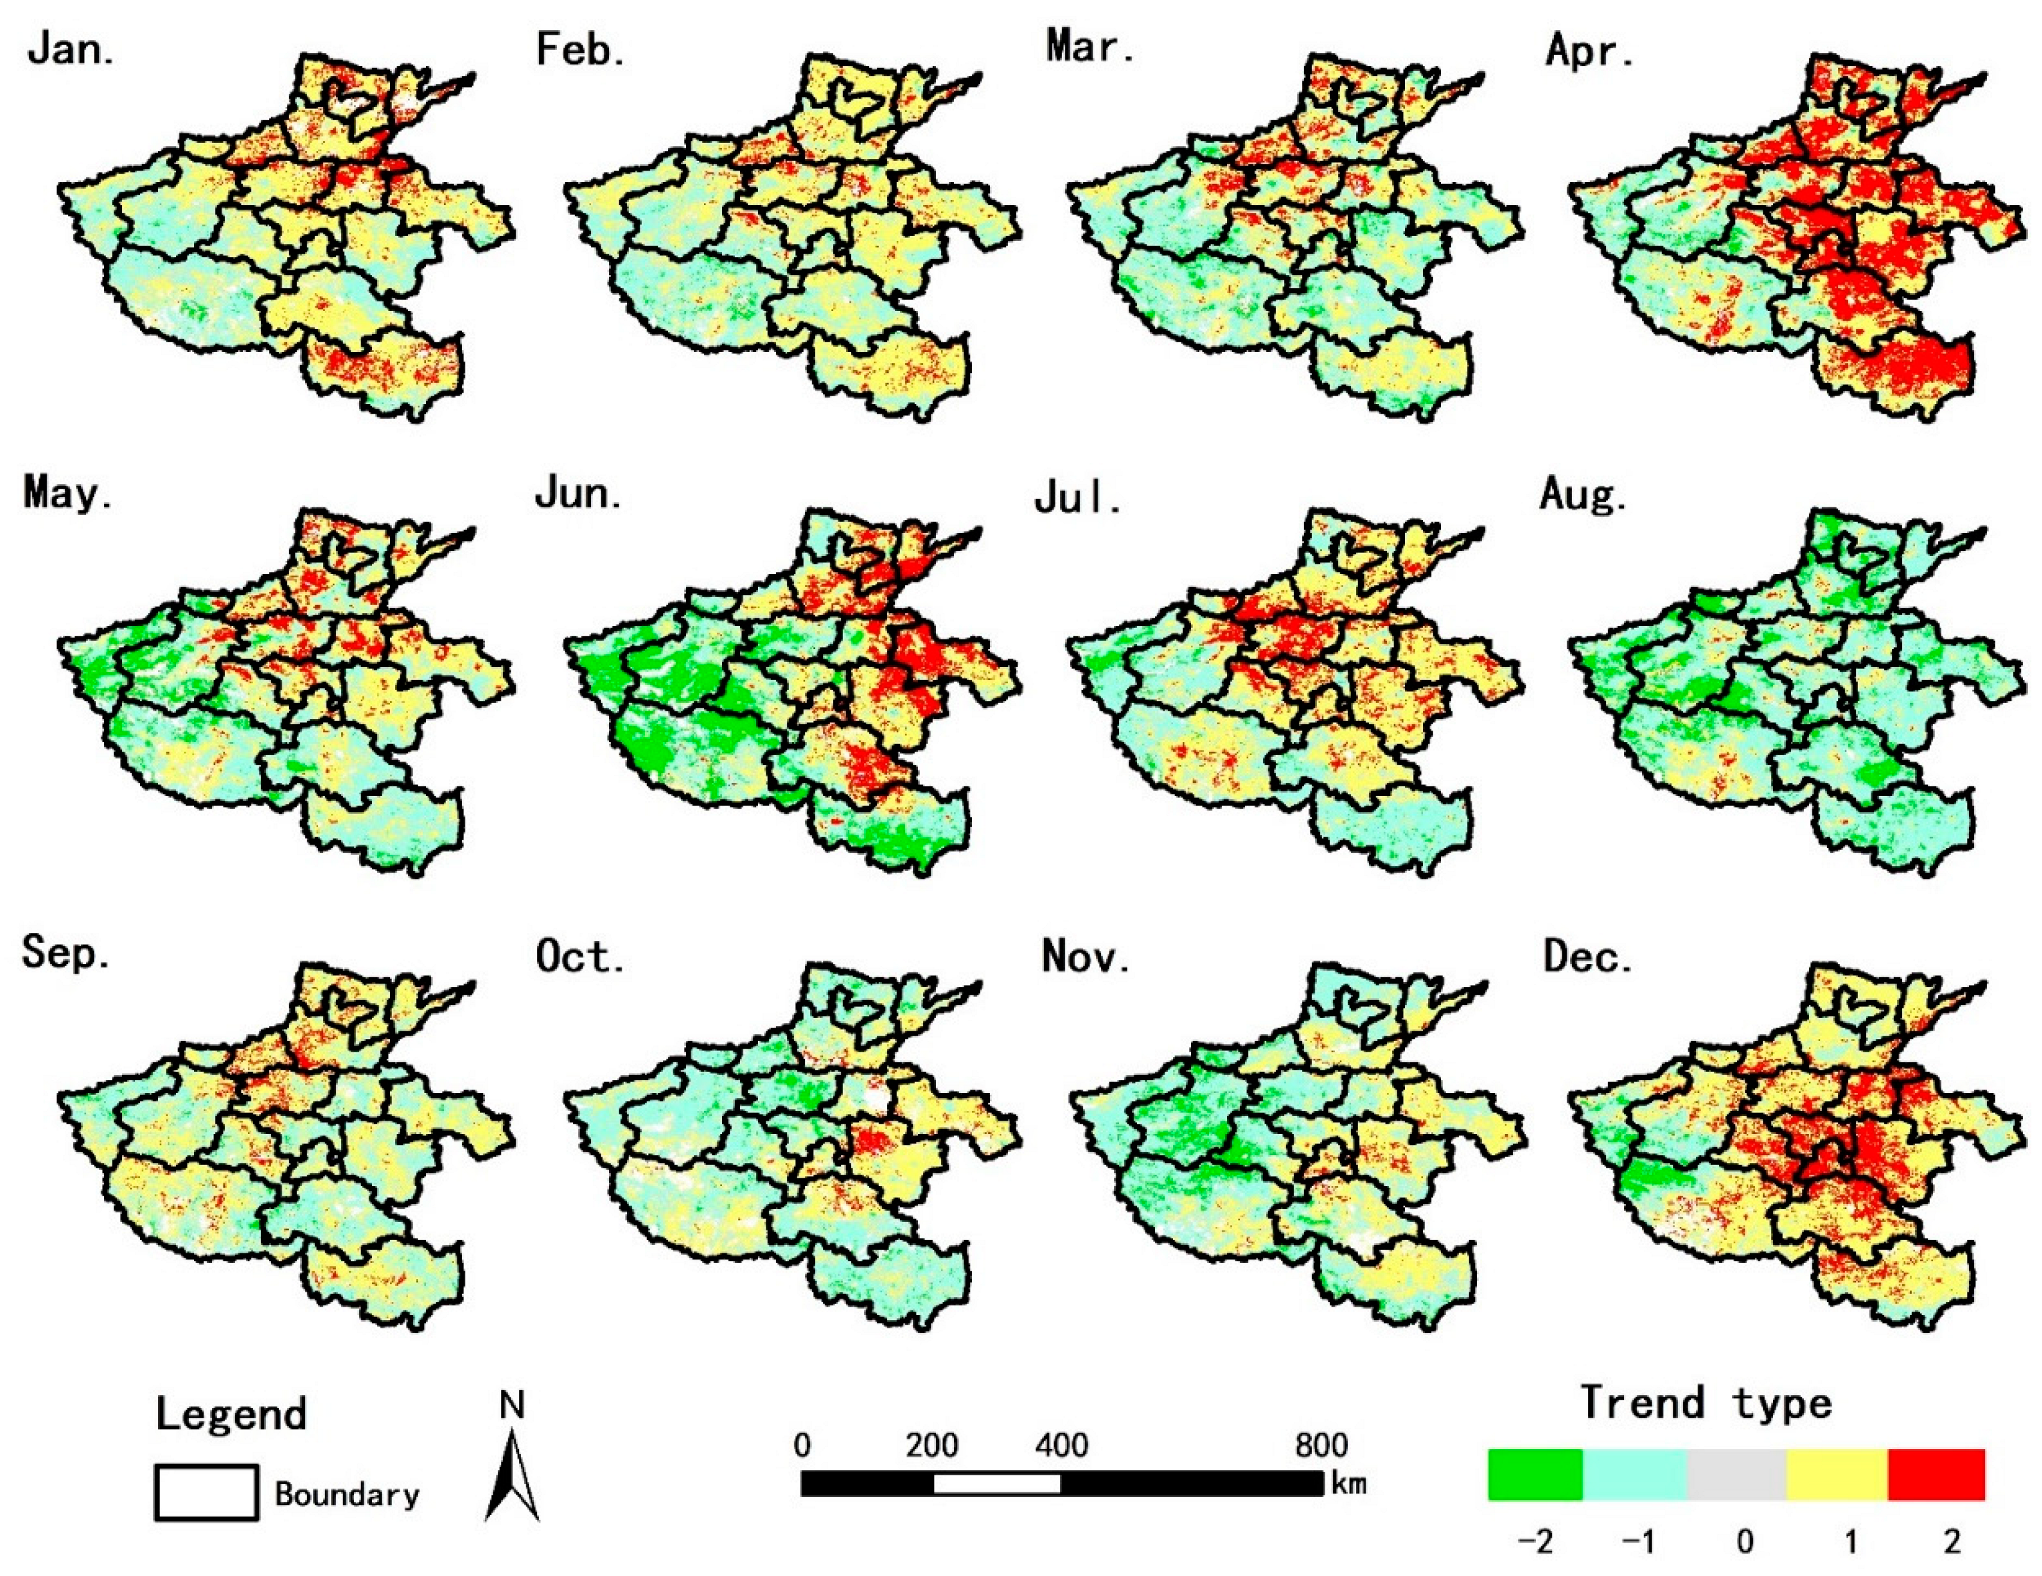
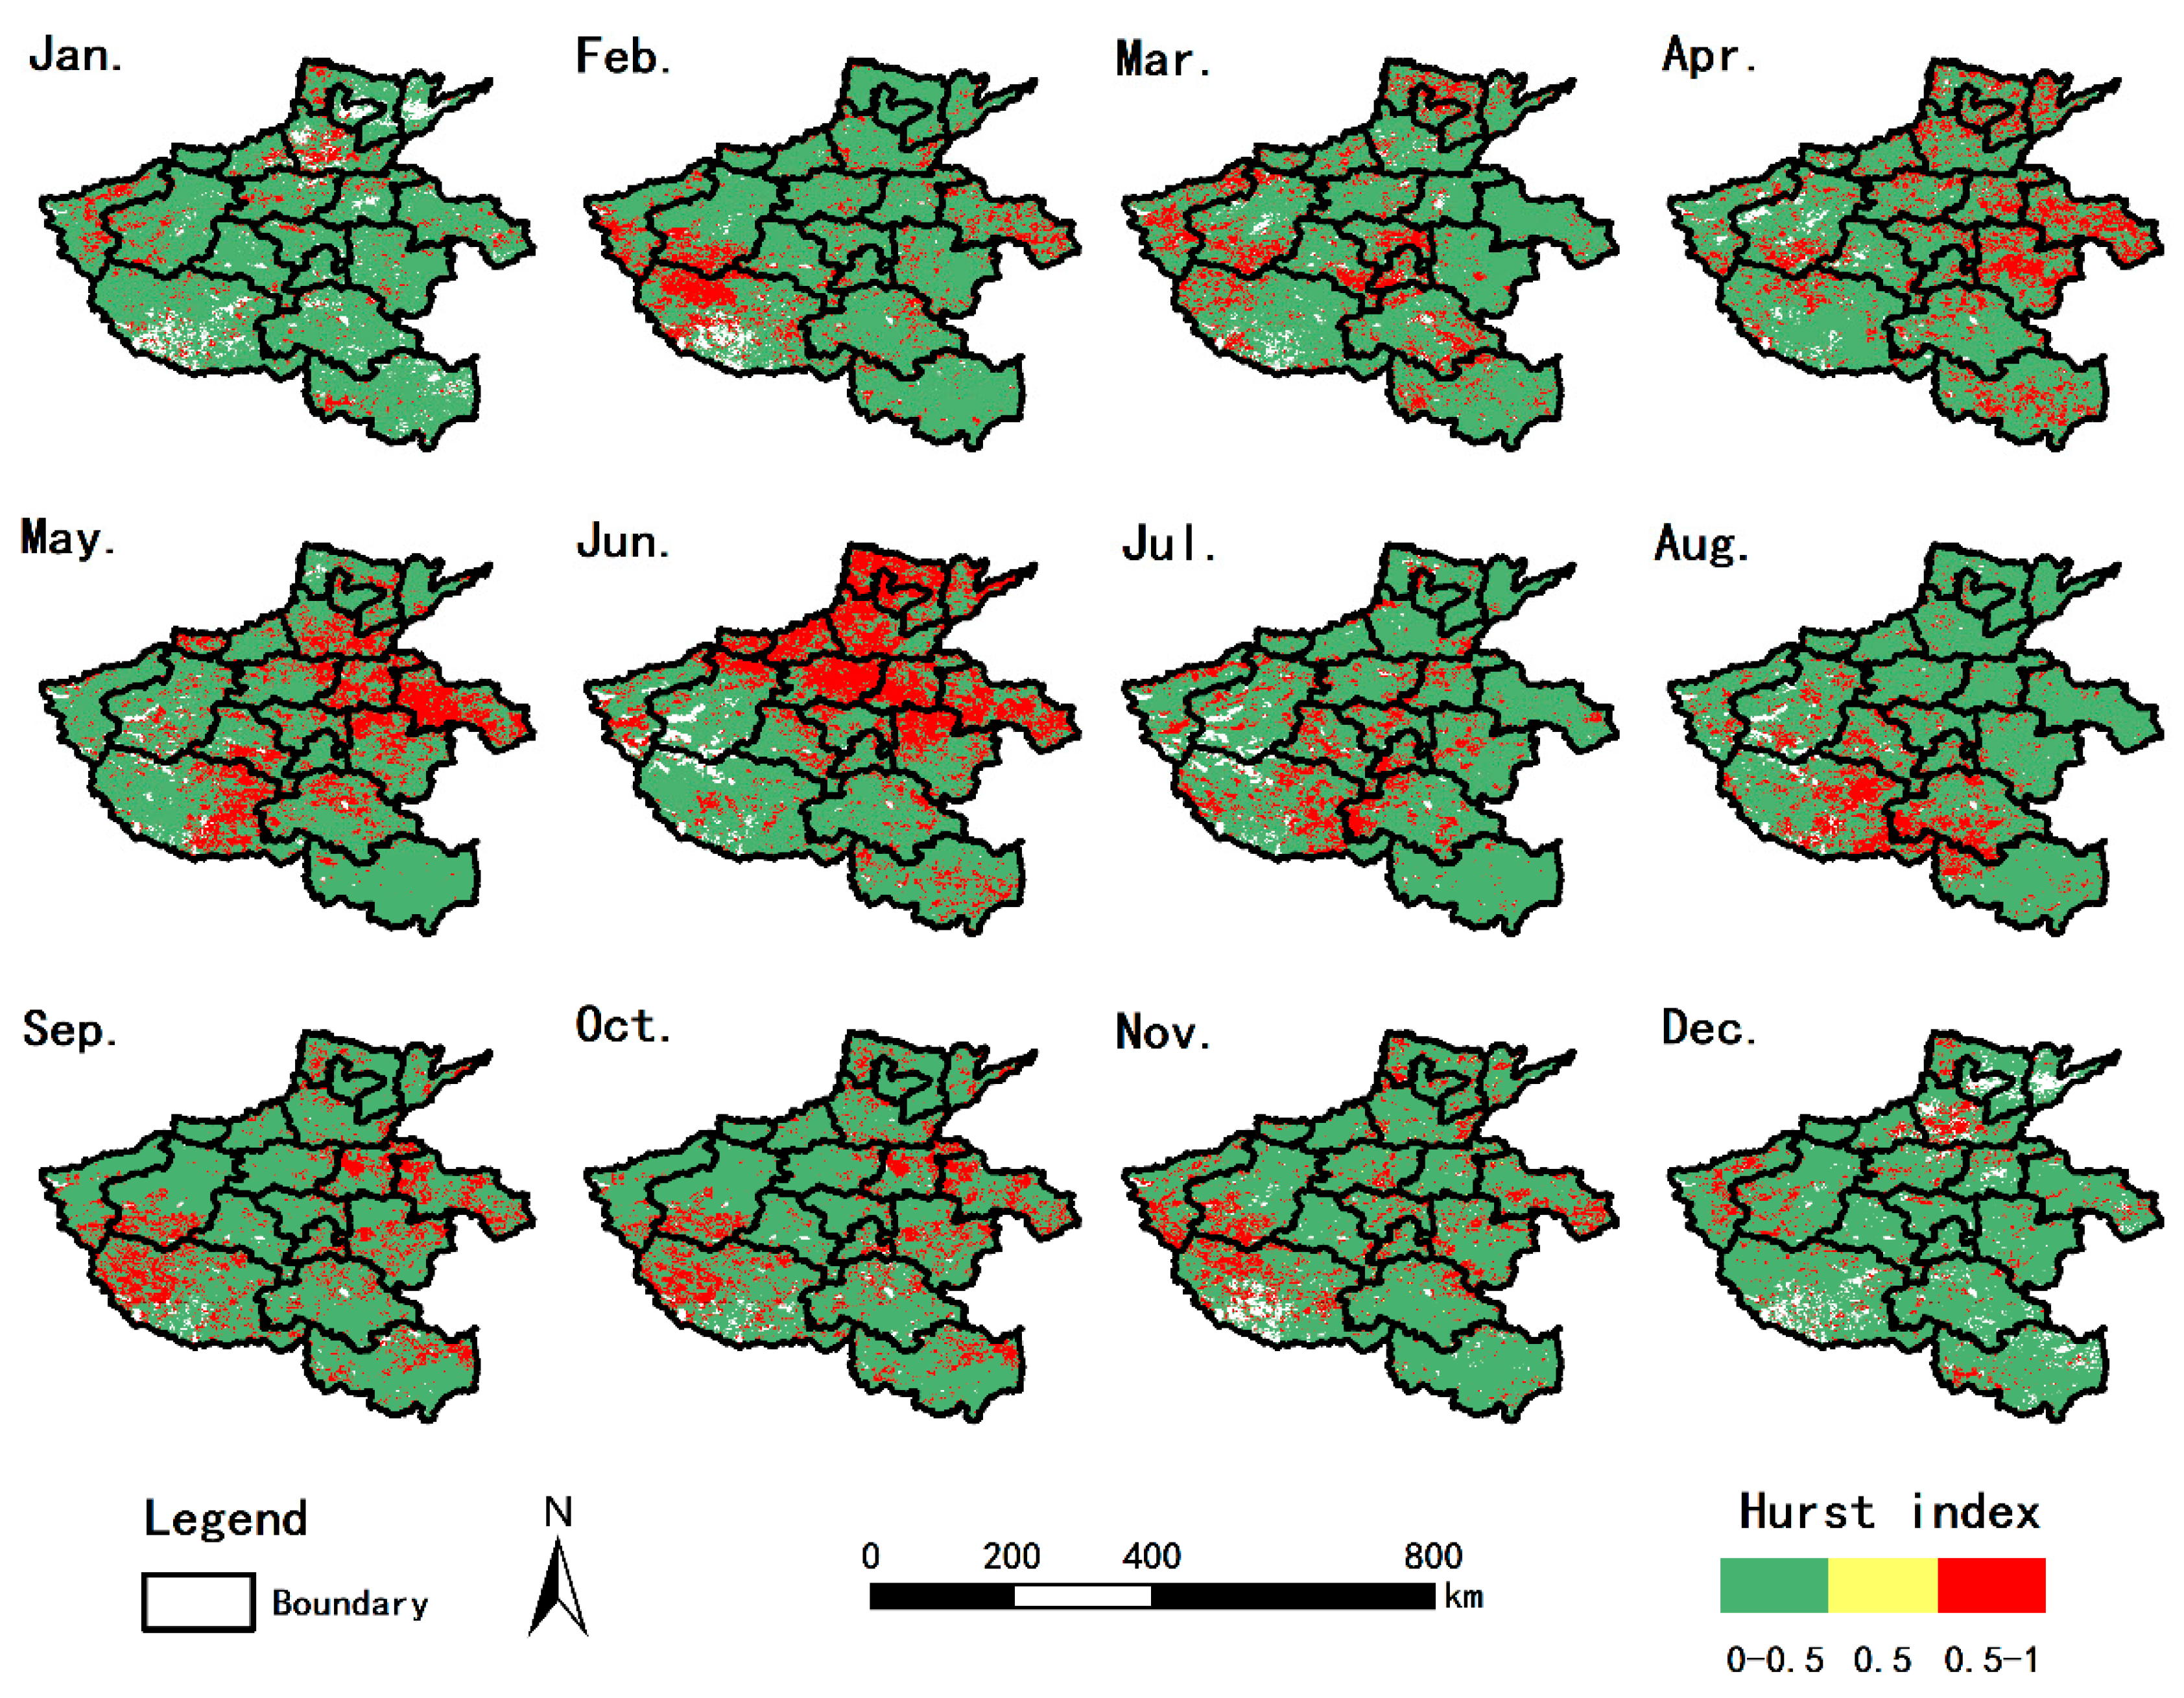
3.3. Monthly Change Characteristics

The variation characteristics of the monthly mean TVDI in Henan Province in recent 21 years are shown in Figure 7. It can be seen from the figure that agricultural drought occurs in Henan Province every month. The average value, maximum value and drought grade of the TVDI for each month are shown in Table 5. As can be seen from the figure and table, the whole region in January, February, September, October, November and December as a whole belongs to the state of light drought, while the other months belong to the state of no drought. However, there will be severe agricultural drought or more every month, and the regional distribution is different. The severe drought in January and February mainly distributed in the southwest of southern Henan, the severe drought in March to May mainly distributed in the north and northeast of western Henan, the drought in June mainly distributed in the southwest and north of Southern and the northeast of western Henan, the severe drought in July and August sporadically distributed in the north, west and central Henan, and the severe drought in September to December mainly distributed in the southwest of Southern Henan. In October and December, the drought is more serious, and the areas with moderate drought and above occupy a large proportion.
Sen trend analysis combined with the MK significance test was used to analyze the monthly TVDI trend in Henan Province. The statistical results are shown in Table 6, and the trend distribution is shown in Figure 8. The areas with increasing drought from January to December in Henan were 65.30%, 61.19%, 42.53%, 70.94%, 43.78%, 44.18%, 58.03%, 11.26%, 53.39%, 38.34%, 37.30% and 77.33%, respectively. The areas showing a slowing trend accounted for 26.96%, 30.16%, 49.82%, 24.68%, 49.38%, 52.13%, 35.85%, 85.15%, 36.74%, 53.59%, 55.86% and 17.83%, respectively. The drought in January, February, April, July, September and December showed an increasing trend, while the drought in the remaining 6 months showed a decreasing trend.
The detailed situation is shown in Figure 8. Combined with the drought distribution Figure 7, it can be seen that drought increased significantly in the southwest of northern, the central and the southern of southern Henan in January and February. In March, April and May, that drought increased significantly the northwest of northern and the border area between central and western Henan. The increasing drought in June mainly distributed in northern, eastern and northern parts of southern Henan. In July and August, drought increased sporadically in northern and central Henan. In September, drought increased significantly in northwestern of central, southwestern of northern and northern of western Henan. In October, drought increased significantly in the areas bordering the eastern and southern parts of Henan and the northeastern parts of northern Henan. In November, there were few areas of a significant increase in drought in Henan, mainly distributed in central, eastern and southern Henan bordering areas. In December, drought increased significantly in many areas, mainly in central and southern Henan.
The trend distribution of the monthly Hurst index in Henan is shown in Figure 9. Based on the previous analysis, it can be seen that the drought in the northern part of northern and the intersection area of northern and central Henan maintained the trend of increasing drought in January. In February, the central region of central Henan maintained a trend of increasing drought. In March, there was a trend of worsening drought in the northern part of northern, the northern part of western and the central part of Henan. In April, the northern part of northern Henan, the northwestern part of Henan, the central part of Henan and the western part of eastern Henan maintained the trend of increasing drought. In May, the northern part of northern Henan, northwestern Henan and central Henan maintained the trend of increasing drought. In June, the northern part of southern Henan, the eastern part of Henan and the northern part of northern Henan maintained the trend of increasing drought. In July, the drought continued to increase in the region was not obvious, and In August, the southwest of Henan Province maintained the trend of increasing drought. In September, the drought situation in some areas of eastern Henan kept increasing. In October, the western region of eastern Henan maintained the trend of increasing drought. In November, the northern part of southern Henan will maintain the trend of increasing drought. In December, the southeast of southern Henan and the intersection of western and central Henan will maintain an increasing trend of drought.

4. Discussion

This study employed the time analysis method and the TVDI to conduct a comprehensive quantitative analysis of agricultural drought in Henan Province. The analysis covered multiple temporal scales, including yearly, seasonal, and monthly variations, while also providing an extensive examination of the spatio-temporal evolution characteristics and trends of global agricultural drought in Henan Province. In comparison to previous studies, this research offers a more thorough and comprehensive investigation. The previous applied studies based on the TVDI primarily focused on monitoring typical years, vegetation growing seasons, or specific drought events [29,38]. However, they lacked long-term series and multi-time-scale analysis of regional agricultural drought characteristics, which prevented a comprehensive reflection of the actual soil moisture changes in the region. In this study, it was found that agricultural drought in Henan Province showed an increasing trend on the whole, and drought was more serious in northern Henan Province and lighter in eastern southern Henan Province, which was consistent with the analysis results of Henan drought by Lu et al. [39] based on SPEI and Shang et al. [40] based on SPI. Comprehensive analysis shows that regional agricultural drought in Henan Province mainly occurs in northern Henan, central Henan and eastern Henan, which is basically consistent with the analysis results of drought characteristics in Henan Province by Wang et al. [41], Li et al. [42] and Wang et al. [43]. In terms of seasonal scale, spring and autumn are two seasons characterized by frequent droughts, which is in line with the findings of Liu et al. [38]. However, the conclusion of this paper that winter drought occurs more frequently is inconsistent with the conclusion of Wu et al. [44] Chen et al. [45], who obtained the lowest frequency of winter drought based on the standard precipitation index. Different drought classification [46] may lead to different drought statistics and lead to different conclusions. The TVDI drought classification in different regions exhibits varying levels, thus necessitating further standardization and harmonization of the classification based on the TVDI.
Soil moisture has a direct impact on crop growth and agricultural production [47]. The TVDI is a soil moisture inversion model established by comprehensively considering two remote sensing data products, namely surface temperature (LST) and normalized Vegetation index (NDVI). It has the advantages of simple calculation and high adaptability, and can well reflect regional soil moisture changes on a large scale. But the occurrence of agricultural drought is affected by many factors [48]. When calculating the agricultural drought index, we only consider the soil moisture content, but do not consider the influence of other on drought. In fact, climatic condition and human activities [49,50] all can lead to changes in land types and also affect the division of dry areas. In the future research, the influence of other factors on agricultural drought should be considered, and the improved TVDI should be coupled with other factors affecting agricultural drought to realize the coupling of multi-source data to comprehensively understand the spatio-temporal dynamic law of agricultural drought, so as to formulate corresponding drought mitigation programs. In the process of analyzing the trend of agricultural drought in Henan Province, although we have adopted the trend analysis method, its limitations are still significant due to the short data years. Considering the close relationship between trend characteristics and research timescales, in the future, with the increasing richness of MODIS data archives, or by integrating multiple data sources to expand time series, we will be able to conduct longer remote sensing drought analysis. This will help us to more deeply reveal the changing regularity of drought, and provide more accurate guidance for drought warning and prevention work. In this way, it can improve the early warning and prevention of drought, promote disaster prevention and reduction, ensure food production and promote sustainable agricultural development, and provide strong support for China’s social stability and economic development.

5. Conclusions

The main findings of this study are summarized as follows:
(1) On the annual scale, the agricultural drought characteristics in Henan Province showed a slight upward trend, and the spatial distribution difference was obvious, showing the distribution characteristics of drought in the western part of the study area and lighter in the eastern part. The comprehensive analysis shows that the areas that will keep the trend of the continuous increase in drought in Henan Province are mainly distributed in northern, northeastern and central Henan.
(2) On the seasonal scale, the overall agricultural drought situation in Henan Province showed that Autumn > Winter > Spring > Summer. The comprehensive analysis shows that the agricultural drought situation in north, East and central Henan will keep increasing, and the drought situation in southern Henan also shows an increasing trend in summer.
(3) On the monthly scale, drought occurs every month. The comprehensive analysis shows that agricultural drought mainly aggravates northern, central and Eastern Henan. In northern Henan, it mainly occurs in January, February, March, April, June and July, in eastern Henan in September, October and November, and in central Henan in May and December.

Author Contributions

Conceptualization, Y.L. and X.W.; data interpretation and methodology, X.W. and F.W.; validation, K.F., H.L. and F.W.; software, X.W., S.C. and Y.H., original draft preparation, X.W. All authors have read and agreed to the published version of the manuscript.

Funding

This research was funded by the National Key R&D Program of China (Grant No. 2023YFC3006603), Natural Science Foundation of Henan Province (Grant No. 222300420317), Henan Province Science and Technology Research Projects (Grant No. 242102321005), Key Scientific Research Projects in Higher Education Institutions in Henan Province (Grant No. 24A570005), and Key Technologies R&D and Promotion Program of Henan Province (Grant No. 212102110031).

Data Availability Statement

Data can be requested from the corresponding author upon request.

Conflicts of Interest

The authors declare no conflict of interest.

References

  1. Stefanos, S.; Dimitra, R.; Nikolaos, P. Drought Severity and Trends in a Mediterranean Oak Forest. Hydrology 2023, 10, 167. [Google Scholar] [CrossRef]
  2. Wei, W.; Liu, T.; Zhou, L.; Wang, J.P.; Yan, P.; Xie, B.B.; Zhou, J.J. Drought-Related Spatiotemporal Cumulative and Time-Lag Effects on Terrestrial Vegetation across China. Remote Sens. 2023, 15, 4362. [Google Scholar] [CrossRef]
  3. World Meteorological Organization (WMO). Drought Monitoring and Early Warning: Concepts, Progress and Future Challenges; WMO No.1006; World Meteorological Organization (WMO): Geneva, Switzerland, 2006. Available online: http://www.wamis.org/agm/pubs/brochures/WMO1006e.pdf (accessed on 25 October 2022).
  4. Geng, S.M.; Yan, D.H.; Yang, Z.Y.; Zhang, Z.B.; Yang, M.J.; Kan, G.Y. Characteristics Analysis of Summer Maize Yield Loss Caused by Drought Stress in the Northern Huaihe Plain, China. Irrig. Drain. 2018, 67, 251–268. [Google Scholar] [CrossRef]
  5. Shao, D.G.; Chen, S.; Tan, X.Z.; Gu, W.Q. Drought characteristics over China during 1980–2015. Int. J. Climatol. 2018, 38, 3532–3545. [Google Scholar] [CrossRef]
  6. Wang, P.C.; Huang, M.T.; Zhai, P.M. New progress and enlightenment on different types of drought changes from IPCC Sixth Assessment Report. Acta Meteorol. Sin. 2022, 80, 168–175. [Google Scholar]
  7. Mo, X.G.; Hu, S.; Lu, H.J.; Lin, Z.H.; Liu, S.X. Drought Trends over the Terrestrial China in the 21st Century in Climate Change Scenarios with Ensemble GCM Projections. J. Nat. Resour. 2018, 33, 1244–1256. [Google Scholar]
  8. Zhao, S.; Cong, D.; He, K.; Yang, H.; Qin, Z. Spatial-Temporal Variation of Drought in China from 1982 to 2010 Based on a modified Temperature Vegetation Drought Index (mTVDI). Sci. Rep. 2017, 7, 17473. [Google Scholar] [CrossRef]
  9. Wang, Q.; Liu, Y.Y.; Zhang, Y.Z.; Tong, L.J.; Li, X.Y.; Li, J.L.; Sun, Z.G. Assessment of Spatial Agglomeration of Agricultural Drought Disaster in China from 1978 to 2016. Sci. Rep. 2019, 9, 14393. [Google Scholar] [CrossRef]
  10. Wen, Y.L.; Zhou, L.W.; Kang, L.; Chen, H.; Guo, J.L. Drought risk analysis based on multivariate copula function in Henan Province, China. Geomat. Nat. Hazards Risk 2023, 14, 2223344. [Google Scholar] [CrossRef]
  11. Zhang, Q.; Zhang, J.Q.; Wang, C.Y. Risk assessment of drought disaster in typical area of corn cultivation in China. Theor. Appl. Climatol. 2017, 128, 533–540. [Google Scholar] [CrossRef]
  12. Zhao, H.Y.; Gao, G.; Yan, X.D.; Zhang, Q.; Hou, M.T.; Zhu, Y.Y.; Tian, Z. Risk assessment of agricultural drought using the CERES-Wheat model: A case study of Henan Plain, China. Clim. Res. 2011, 50, 247–256. [Google Scholar] [CrossRef]
  13. Wang, Y.Y.; Xu, C.Y.; Yu, Z.; Sun, X.L.; Li, X.M.; Wang, Y.J. Evolutionary Analysis of Drought in Henan Province Based on Temperature Vegetation Dryness Index. Geospat. Inf. 2017, 15, 98–101+11. [Google Scholar]
  14. Touma, D.; Ashfaq, M.; Nayak, M.A.; Kao, S.C.; Diffenbaugh, N.S. A multi-model and multi-index evaluation of drought characteristics in the 21st century. J. Hydrol. 2015, 526, 196–207. [Google Scholar] [CrossRef]
  15. Xu, X. China Meteorological Disasters Yearbook; China Meteorological Press: Beijing, China, 2014; p. 243. [Google Scholar]
  16. Su, B.; Huang, J.; Fischer, T.; Wang, Y.; Kundzewicz, Z.W.; Zhai, J.; Sun, H.; Wang, A.; Zeng, X.; Wang, G.; et al. Drought losses in China might double between the 1.5 °C and 2.0 °C warming. Proc. Natl. Acad. Sci. USA 2018, 115, 10600–10605. [Google Scholar] [CrossRef]
  17. Chatterjee, S.; Desai, A.R.; Zhu, J.; Townsend, P.A.; Huang, J.Y. Soil moisture as an essential component for delineating and forecasting agricultural rather than meteorological drought. Remote Sens. Environ. 2022, 269, 112833. [Google Scholar] [CrossRef]
  18. Krishnan, S.; Indu, J. Assessing the Potential of Temperature/Vegetation Index Space to infer Soil Moisture over Ganga Basin. J. Hydrol. 2023, 621, 129611. [Google Scholar] [CrossRef]
  19. Sandholt, I.; Rasmussen, K.; Andersen, J. A simple interpretation of the surface temperature/vegetation index space for assessment of surface moisture status. Remote Sens. Environ. 2002, 79, 213–224. [Google Scholar] [CrossRef]
  20. Liang, S.Z.; Wang, M.; Han, D.Y.; Wang, F.; Wang, G.L.; Sui, X.Y. Analysis of Relationship Between Temperature Vegetation Dryness Index and Soil Moisture at Multiple Temporal Scales and Drought Monitoring. Res. Soil Water Conserv. 2024, 31, 149–157. [Google Scholar]
  21. Shan, Y.; Gong, A.; Su, Y.G.; Liu, W.Y.; Li, J.; Chen, Y.H.; Jiang, W.G. Improvement of soil moisture monitoring using EVI as a key parameter based on TVDI in the north China plain. In Proceedings of the 2013 IEEE International Geoscience and Remote Sensing Symposium—IGARSS, Melbourne, Australia, 21–26 July 2013; pp. 3738–3741. [Google Scholar]
  22. Yu, M.; Wang, C.L. Satellite Remote Sensing Drought Monitoring Methods Based on Different Biophysical Indicators. J. Appl. Meteorol. Sci. 2011, 22, 221–231. [Google Scholar]
  23. Liu, H.M.; Ma, X.Q.; Sun, X.B. Research on MODIS Drought Monitoring Technology in Anhui Province. Meteorology 2010, 36, 111–115. [Google Scholar]
  24. Wang, S.W. Spatial and Temporal Dynamics of Drought in inner Mongolia in Recent 20 Years and its Response to Seasonal Climate and Evapotranspiration. Res. Soil Water Conserv. 2022, 29, 231–239. [Google Scholar]
  25. Fan, L.; Geng, B.; Wang, J.; Chen, J. Temporal and Spatial Dynamics of Drought and its Response to Climate Change in the Loess Plateau from 2001 to 2020. Res. Soil Water Conserv. 2022, 29, 183–191. [Google Scholar]
  26. Xia, C.H.; He, Z.H.; Liang, H.; Ren, R.Y. Spatial and Temporal Changes of Agricultural Drought in Grain Growing Season of Guizhou Province from 2006 to 2015. China Rural Water Hydropower 2021, 5, 25–30. [Google Scholar]
  27. Liu, L.W.; Duan, Y.H.; Xu, L.S.; Liu, Z.C.; Jiang, X. Spatiotemporal Variation Characteristics of Agricultural Drought in Shanxi Province. J. Irrig. Drain. 2020, 39, 114–121. [Google Scholar]
  28. Liu, X. Study on Drought Characteristics and Model Prediction in Henan Province Based on Multi-Source Heterogeneous Data. Master’s Thesis, Southwest University, Chongqing, China, 2019. [Google Scholar]
  29. Zhang, W.G.; Liu, H.; Yin, H.J. Monitoring of Henan Province Drought Using the Improved TVDI Index. Yellow River 2016, 38, 50–53+144. [Google Scholar]
  30. Yao, Y.; Chen, X.; Qian, J. Research Progress on the Application of Remote Sensing Data in Agricultural Drought Monitoring. Spectrosc. Spectr. Anal. 2019, 39, 1005–1012. [Google Scholar]
  31. Chen, Y.; Fan, J.Y.; Guo, F.F.; Liu, H.H. Application of Vegetation Temperature Condition Index in Drought Monitoring in Yunnan. Trans. Chin. Soc. Agric. Eng. 2011, 27, 231–236. [Google Scholar]
  32. Du, L.T.; Song, N.P.; Liu, K.; Hou, J.; Hu, Y.; Zhu, Y.G.; Wang, X.Y.; Wang, L.; Guo, Y.G. Comparison of Two Simulation Methods of the Temperature Vegetation Dryness Index (TVDI) for Drought Monitoring in Semi-Arid Regions of China. Remote Sens. 2017, 9, 177. [Google Scholar] [CrossRef]
  33. Kustas, W.P.; Norman, J.M.; Anderson, M.C.; French, A.N. Estimating subpixel surface temperatures and energy fluxes from the vegetation index-radiometric temperature relationship. Remote Sens. Environ. 2003, 85, 429–440. [Google Scholar] [CrossRef]
  34. Qi, S.H.; Wang, C.Y.; Niu, Z. Research on National Drought Monitoring Using Temperature Vegetation Dryness Index. J. Remote Sens. 2003, 7, 420–427. [Google Scholar]
  35. Wu, T.X.; Li, B.F.; Guo, H.; Wang, Y.Q.; Zhu, Y.B.; Lian, L.Z. Spatiotemporal Characteristics Analysis of Drought in the North China Plain Based on Selected Remote Sensing Drought Indices. Acta Ecol. Sin. 2023, 43, 1621–1634. [Google Scholar]
  36. Kang, Y.; Guo, E.L.; Wang, Y.F.; Bao, Y.L.; Bao, Y.H.; Naren, M.D. Application of Temperature Vegetation Dryness Index in Drought Monitoring on the Mongolian Plateau. Chin. J. Appl. Ecol. 2021, 32, 2534–2544. [Google Scholar]
  37. Deng, X.Y.; Liu, Y.; Liu, Z.H.; Yao, J.Q. Temporal-spatial dynamic change characteristics of evapotranspiration in arid region of Northwest China. Acta Ecol. Sin. 2017, 37, 2994–3008. [Google Scholar]
  38. Liu, X.L.; Zhou, T.G.; Wen, L.; Wu, L.; Zhang, L. Study on Drought Characteristics in Henan Province from 2000 to 2016 Based on VSWI and SPI. Arid Land Geogr. 2018, 41, 984–991. [Google Scholar]
  39. Lu, J.Q.; Gan, R.; Yang, F.; Zuo, Q.T. Drought Characteristics and its Correlation with Circulation Index in Henan Province Based on SPEI index. China Rural Water Hydropower 2022, 4, 17–24. [Google Scholar]
  40. Shang, D.Y.; Zhang, Z.H.; Yue, Y.; Hu, C.D.; Wang, Q. Drought characteristics analysis of Henan Province based on standardized precipitation index in recent 45 years. Agric. Res. Arid Areas 2021, 4, 162–170. [Google Scholar]
  41. Wang, B.; Shu, D.D.; Yang, F.; Duan, H. Prediction of Drought-Prone Areas in Henan Province Based on Relative Humidity Index. Water Resour. Power 2017, 35, 10–13. [Google Scholar]
  42. Li, X.H.; Zhang, C.; Yao, J.L. Spatial-temporal Distribution Patterns and Trend Analysis of Drought in Henan Province. J. Northwest Norm. Univ. (Nat. Sci.) 2015, 51, 85–91+104. [Google Scholar]
  43. Wang, F.Q.; Sun, M.Q.; Zhou, Z.H. Analysis of spatial-temporal evolution of agricultural drought based on regional agricultural drought index. Desalination Water Treat. 2018, 112, 351–356. [Google Scholar] [CrossRef]
  44. Wu, L.; Tian, J.F.; Jiang, Z.F. Drought evolution characteristics of Henan Province based on standardized precipitation index. J. Liaoning Tech. Univ. (Nat. Sci.) 2022, 41, 421–430. [Google Scholar]
  45. Chen, Z.L.; Huang, W.L.; Ye, S.L.; Qi, X.H. Analysis of differences in agricultural drought monitoring based on different TVDI indices in Fujian Province in 2018. J. Nat. Disasters 2021, 30, 233–243. [Google Scholar]
  46. Wang, D.Y.; Yang, Y.C.; Wang, T.; Li, Q.H. Spatiotemporal Variation of Soil Moisture and Its Influencing Factors in Henan Province Based on TVDI. China Rural. Water Hydropower 2022, 6, 138–146+153. [Google Scholar]
  47. Cao, M.; Chen, M.; Liu, J.; Liu, Y.L. Assessing the performance of satellite soil moisture on agricultural drought monitoring in the North China Plain. Agric. Water Manag. 2022, 263, 107450. [Google Scholar] [CrossRef]
  48. Cheng, X.; Xu, Y.Y.; Chen, J.L.; Liu, Q. The Impact of Climatic Conditions, Human Activities, and Catchment Characteristics on the Propagation from Meteorological to Agricultural and Hydrological Droughts in China. J. Geophys. Res. Atmos. 2023, 128, e2023JD039735. [Google Scholar] [CrossRef]
  49. Luo, D.; Li, L.S. Spatiotemporal evolution analysis and prediction of drought in Henan Province based on standardized precipitation evapotranspiration index. Water Supply 2023, 23, 410–427. [Google Scholar] [CrossRef]
  50. Houmma, I.H.; Gadal, S.; El Mansouri, L.; Garba, M.; Gbetkom, P.G.; Barkawi, M.B.M.; Hadria, R. A new multivariate agricultural drought composite index based on random forest algorithm and remote sensing data developed for Sahelian agrosystems. Geomat. Nat. Hazards Risk 2023, 14, 2223384. [Google Scholar] [CrossRef]
Figure 1. Location map and zoning map of the study area.
Water 16 01010 g001
Figure 2. NDVI-LST feature space.
Water 16 01010 g002
Figure 3. (ac) Annual drought spatial and trend distribution of the TVDI from 2000 to 2020.
Water 16 01010 g003
Figure 4. Seasonal drought spatial distribution of the TVDI from 2000 to 2020.
Water 16 01010 g004
Figure 5. Seasonal change trend of the TVDI from 2000 to 2020.
Water 16 01010 g005
Figure 6. Seasonal distribution of Hurst from 2000 to 2020.
Water 16 01010 g006
Figure 7. Monthly distribution of the TVDI from 2000 to 2020.
Water 16 01010 g007
Figure 8. Monthly change trend of the TVDI from 2000 to 2020.
Water 16 01010 g008
Figure 9. Monthly distribution of Hurst from 2000 to 2020.
Water 16 01010 g009
Table 1. TVDI level division.
LevelTVDIDrought GradeLevelTVDIDrought Grade
1(0 ≤ TVDI < 0.6)No Drought 4(0.8 ≤ TVDI < 0.9)Severe Drought
2(0.6 ≤ TVDI < 0.7)Mild Drought5(0.9 ≤ TVD ≤ 1.0)Extreme Drought
3(0.7 ≤ TVDI < 0.8)Moderate Drought
Table 2. Table of change trends.
ItemMeaning of NumbersItemMeaning of Numbers
−2Significant decline1Slight increase
−1Slight decline2Significant increase
0No change
Table 3. Statistical table of the year change trend of the TVDI and Hurst from 2000 to 2020.
TendencyPercent
(%)
TendencyPercent
(%)
HurstPercent
(%)
Significant decline12.42Slight increase32.480–0.564.96
light decline31.16Significant increase17.550.50.01
No change6.39--0.5–135.03
Table 4. Statistical table of the quarterly average change trend and Hurst of the TVDI from 2000 to 2020.
TendencyPercent (%)
SpringSummerAutumnWinter
Significant decline12.423.4717.442.25
Slight decline31.1622.8837.1417.44
No change6.395.386.705.56
Slight increase32.4840.1532.2454.21
Significant increase17.5528.126.4820.54
HurstSpringSummerAutumnWinder
0–0.581.7880.6879.2383.63
0.500.0100.53
0.5–1.018.2219.3120.7715.83
Table 5. Average, maximum and drought grade of the TVDI for each month.
MonthMeanDrought GradeMaxDrought GradeMonthMeanDrought GradeMaxDrought Grade
January0.615Mild0.896SevereJuly0.507No0.849Severe
February0.611Mild0.871SevereAugust0.544No0.921Extreme
March0.567No0.877SevereSeptember0.621Mild0.897Severe
April0.559No0.940ExtremeOctober0.637Mild0.874Severe
May0.541No0.895SevereNovember0.606Mild0.871Severe
June0.556No0.895SevereDecember0.607Mild0.915Extreme
Note: No means no drought, Mild means mild drought, Severe means severe drought, Extreme means extreme drought.
Table 6. Statistical table of monthly average change trend of the TVDI from 2000 to 2020.
TendencyPercent (%)
JanuaryFebruaryMarchAprilMayJuneJulyAugustSeptemberOctoberNovemberDecember
Significant decline0.991.026.573.1210.6023.202.3822.771.774.4310.743.72
Slight decline25.9829.1443.2521.5638.7833.4733.4762.3834.9749.1745.1314.12
No change7.748.657.654.386.836.126.123.599.888.076.844.84
Slight increase52.9057.0835.3636.0836.2046.0216.0210.4848.1235.0935.3055.11
Significant increase12.404.117.1734.867.5812.0212.020.785.273.252.0122.21
HurstPercent(%)
0–0.592.0384.5783.5978.5477.0767.3085.4885.1271.1883.2883.2881.96
0.5000.0100000.010.0100.010
0.5–17.9715.4316.4021.4622.9332.7014.5214.8728.8116.7216.7118.04
Disclaimer/Publisher’s Note: The statements, opinions and data contained in all publications are solely those of the individual author(s) and contributor(s) and not of MDPI and/or the editor(s). MDPI and/or the editor(s) disclaim responsibility for any injury to people or property resulting from any ideas, methods, instructions or products referred to in the content.

