Article

Scour Pit Characteristics and Safety Operation Index of Riprap Spur Dikes under Runoff and Tidal Current

1
Nanjing Hydraulic Research Institute, Nanjing 210029, China
2
The National Key Laboratory of Water Disaster Prevention, Nanjing 210029, China
3
Key Laboratory of Port, Waterway & Sedimentation Engineering Ministry of Communications, People’s Republic of China, Nanjing 210029, China
*
Author to whom correspondence should be addressed.
Water 2024, 16(3), 438; https://doi.org/10.3390/w16030438
Submission received: 7 December 2023 / Revised: 19 January 2024 / Accepted: 24 January 2024 / Published: 29 January 2024

Abstract

:
The flow dynamics adjacent to spur dikes exhibit turbulence and complexity, often resulting in the formation of scouring pits in the riverbed nearby. In regions downstream characterized by robust riverbed mobility, the vulnerability of riprap spur dikes stems from the instability of the upper riprap induced by these scour pits. Current research on scour pits primarily focuses on singular runoff conditions, with a limited exploration into the formation and traits of these scour pits under the combined influence of runoff and tidal currents. This study delves into the formation process and features of scour pits adjacent to submerged riprap spur dikes shielded by flexible mattresses, considering the impact of both runoff and tidal forces, using flume model tests in the tidal zone of the lower Yangtze River as a reference. Our findings reveal that the scour pits at the forefront and rear of riprap spur dikes undergo cyclic scouring and silting influenced by the runoff and tide current’s duration and intensity. The maximum scour depth observed ranges from 60% to 90% of that during runoff alone, contingent upon the ratio of maximum flow velocity at flood tide and ebb tide (denoted as e). This law can be quantitatively elucidated through the concept of the average effect of flow on the riverbed scouring and silting in a unit time (denoted as E). A formula to calculate the maximum scour depth of riprap spur dikes under both runoff and tidal current scenarios, along with a slope formula describing the maximum scour depth relative to the spur dike toe are proposed in this study. These formulations offer versatility across varying flow conditions. Subsequently, we establish an evaluation index pertinent to the safety operation of spur dikes based on the latter formula. This research contributes to a more comprehensive understanding of scour pit dynamics adjacent to spur dikes, especially under combined runoff and tidal influences. The proposed formulae and evaluation index hold promise in enhancing the assessment and maintenance practices for these critical riverbank structures.

1. Introduction

The riprap spur dike stands as a ubiquitous structure in river engineering, playing a pivotal role in flood control and facilitating navigation [1,2,3]. In downstream tidal reaches, the riverbed exhibits fine sediment composition and substantial mobility. Damage to riprap spur dikes primarily arises from the instability of the upper riprap caused by the adjacent riverbed’s scouring due to water flow, rather than direct damage from the water flow impacting the dike [4,5]. The elevation relationship between the spur dike crest and water level categorizes these structures into submerged and non-submerged spur dikes [6], with submerged spur dikes primarily employed in the tidal zones of the lower Yangtze River [7,8]. The intricate formation and traits of scour pits near spur dikes in tidal reaches are influenced by bidirectional runoff and tidal currents, making them notably more complex compared to single runoff scenarios [9,10]. Consequently, investigating the characteristics of scour pits adjacent to submerged riprap spur dikes under the combined influences of runoff and tide, along with developing research and assessment indices for their safety operation, holds immense significance. Such efforts are pivotal in preventing and mending damage to riprap spur dikes within downstream tidal reaches.
Presently, research on local scour pits around spur dikes primarily concentrates on spur dike scour pits under unidirectional runoff. Zhang et al. [11], through flume testing, suggested that flood-induced damage to spur dikes reflects adaptive responses of surrounding riverbed deformation and increased flow during the flood season. Huang et al. [12] derived a formula for calculating the local scour depth of spur dikes in clear water scour conditions using dimensional analysis and multiple linear regression. Pandey et al. [13] employed machine learning techniques to evaluate scour depth changes around vertical spur dikes in cohesive sediment mixtures based on existing data from 26 studies. Zhang et al. [14] observed a fixed proportionality between the planar extent of the scour pit and the product of its maximum depth and volume, suggesting geometric similarity. Independently, She et al. [15] and Huang et al. [16] developed formulas to calculate the local maximum scour depth at the submerged spur dike head with bottom protection using movable bed flume tests. Li et al. [17] studied the influence of different spur dike angles (the alignment angle between the axis of a dike and the stream-wise direction of water flow) on the local scour under ice cover. They found that the maximum scour depth was directly proportional to Froude number and ice cover roughness, and inversely proportional to the angle and submergence depth. Zhang et al. [10] formulated a three-dimensional turbulent sediment mathematical model for local scour at spur dikes under unidirectional and reciprocating flow. Their findings indicated slightly less scour depth under reciprocating flow compared to unidirectional flow, with the former exhibiting periodic incremental growth in scour depth in response to varying durations and intensities of tidal fluctuations, demonstrating significantly distinct overall scour and siltation patterns.
Regarding the evaluation indices for the safety operation of spur dikes, Fei et al. [18] and Han et al. [19] established failure indices for riprap spur dikes, based on the volume or mass percentage of dike bodies damaged by water. Yu et al. [20] formulated a risk evaluation formula for spur dikes considering maximum flow rate as the primary hazard source, using the Graham evaluation method. Zhang et al. [21] proposed that exceeding a certain limit in the back-slope slope of the scour pit at the spur dike’s toe could lead to rapid scouring, employing the critical back-slope slope value as a safety index against scour damage. Following a similar notion, Ma et al. [22] assessed the overall stability of spur dikes by relating the maximum scour pit depth to the distance from the spur dike toe, portraying the overall stability of underwater regulation structures.
Currently, research on scour pits near riprap spur dikes predominantly concentrates on single runoff scenarios, with a limited exploration into the characteristics of these pits and corresponding safety operation indices under bidirectional hydrodynamic influences of runoff and tide. This paper addresses this gap by investigating the formation process and traits of scour pits near submerged riprap spur dikes protected by flexible mattresses under the combined action of runoff and tide, employing physical model tests in the tidal reach of the lower Yangtze River. Drawing from the scale and water sediment dynamics typical of submerged spur dikes with common bottom protection in waterway regulation projects below Nanjing, this study aims to derive an index pertinent to the safety operation of spur dikes, adaptable to both runoff and runoff–tide interactions.

2. Materials and Methods

2.1. Flow and Sediment Characteristics of Tidal Reach in the Lower Reaches of the Yangtze River

The tidal stretch of the lower reaches of the Yangtze River extends from Datong to the downstream entrance, covering a total length of over 600 km, characterized by low altitude and flat terrain (refer to Figure 1). Conventionally, the tidal limit in this stretch is considered to be situated between Datong and Wuhu, while the tidal current limit is observed between Zhenjiang and Jiangyin. The positioning of these limits is notably influenced by variations in runoff and tide [23]. The Yangtze River is described as a partially mixed and metabolic estuary, with a mean tidal range of 2.66 m and a maximum tidal range of 4.62 m recorded at the Zhongjun tide station in the South passage [24]. Ebb tides, on average, persist for about 8 h, while flood tides last approximately 4 h. Near the estuary, the maximum ebb flow velocity typically reaches about 2.5 m/s, and the maximum flood flow velocity is around 2 m/s. Due to the influence of runoff and riverbed boundary conditions, the tidal wave experiences noticeable deformation, resulting in asymmetric durations of flood and ebb tides, with a decrease in tidal range upstream. The suspended sediment in the studied river section predominantly consists of silty fine sand (0.005–0.100 mm), while the bed sand is primarily fine sand (0.100–0.250 mm), exhibiting robust activity [25]. Consequently, riprap spur dikes in this stretch are predominantly safeguarded by flexible mattresses, a characteristic that will also be evident in subsequent physical models and empirical formulas.

2.2. Model Similarity Scale

The test involves the flow and local scour near the spur dike. The three-dimensional flow characteristics near the spur dike are complex, so the normal model is used for design. According to the similarity theory of the river sediment model, the following similarity conditions shall be met.
Geometric similarity:  λ L = λ h ;
Gravity similarity:  λ u = λ h 1 2 ;
Resistance similarity:  λ n = λ h 7 6 λ u λ L 1 2 ;
Continuity similarity:  λ Q = λ L λ h λ u ;
Flow movement time similarity:  λ t 1 = λ L λ u ;
Incipient motion similarity:  λ u c = λ u ;
River bed transfiguration similarity:  λ t 2 = λ γ 0 λ L λ h λ Q s ;
Weight similarity:  λ W = λ L 2 λ h λ γ s .
According to the flow and sediment characteristics of the studied river section and the purpose of the experiment, combined with the laboratory conditions, the normal model scale is determined to be 1:40. Deeper scour holes can be caused by a scale effect inherent in laboratory flume experiments, and this limitation necessitates the use of sediment that is the same size as or no smaller than 0.1 of the size of natural channel bed sediment in the field for flume studies [26]. Thus, the plastic sand with D50 = 0.20 mm is selected as the model sand, which can meet the requirements of sediment incipient motion similarity, underwater repose angle similarity and scale effect limitation [27]. See Table 1 for the model similarity scale.

2.3. Apparatuses for Measurements

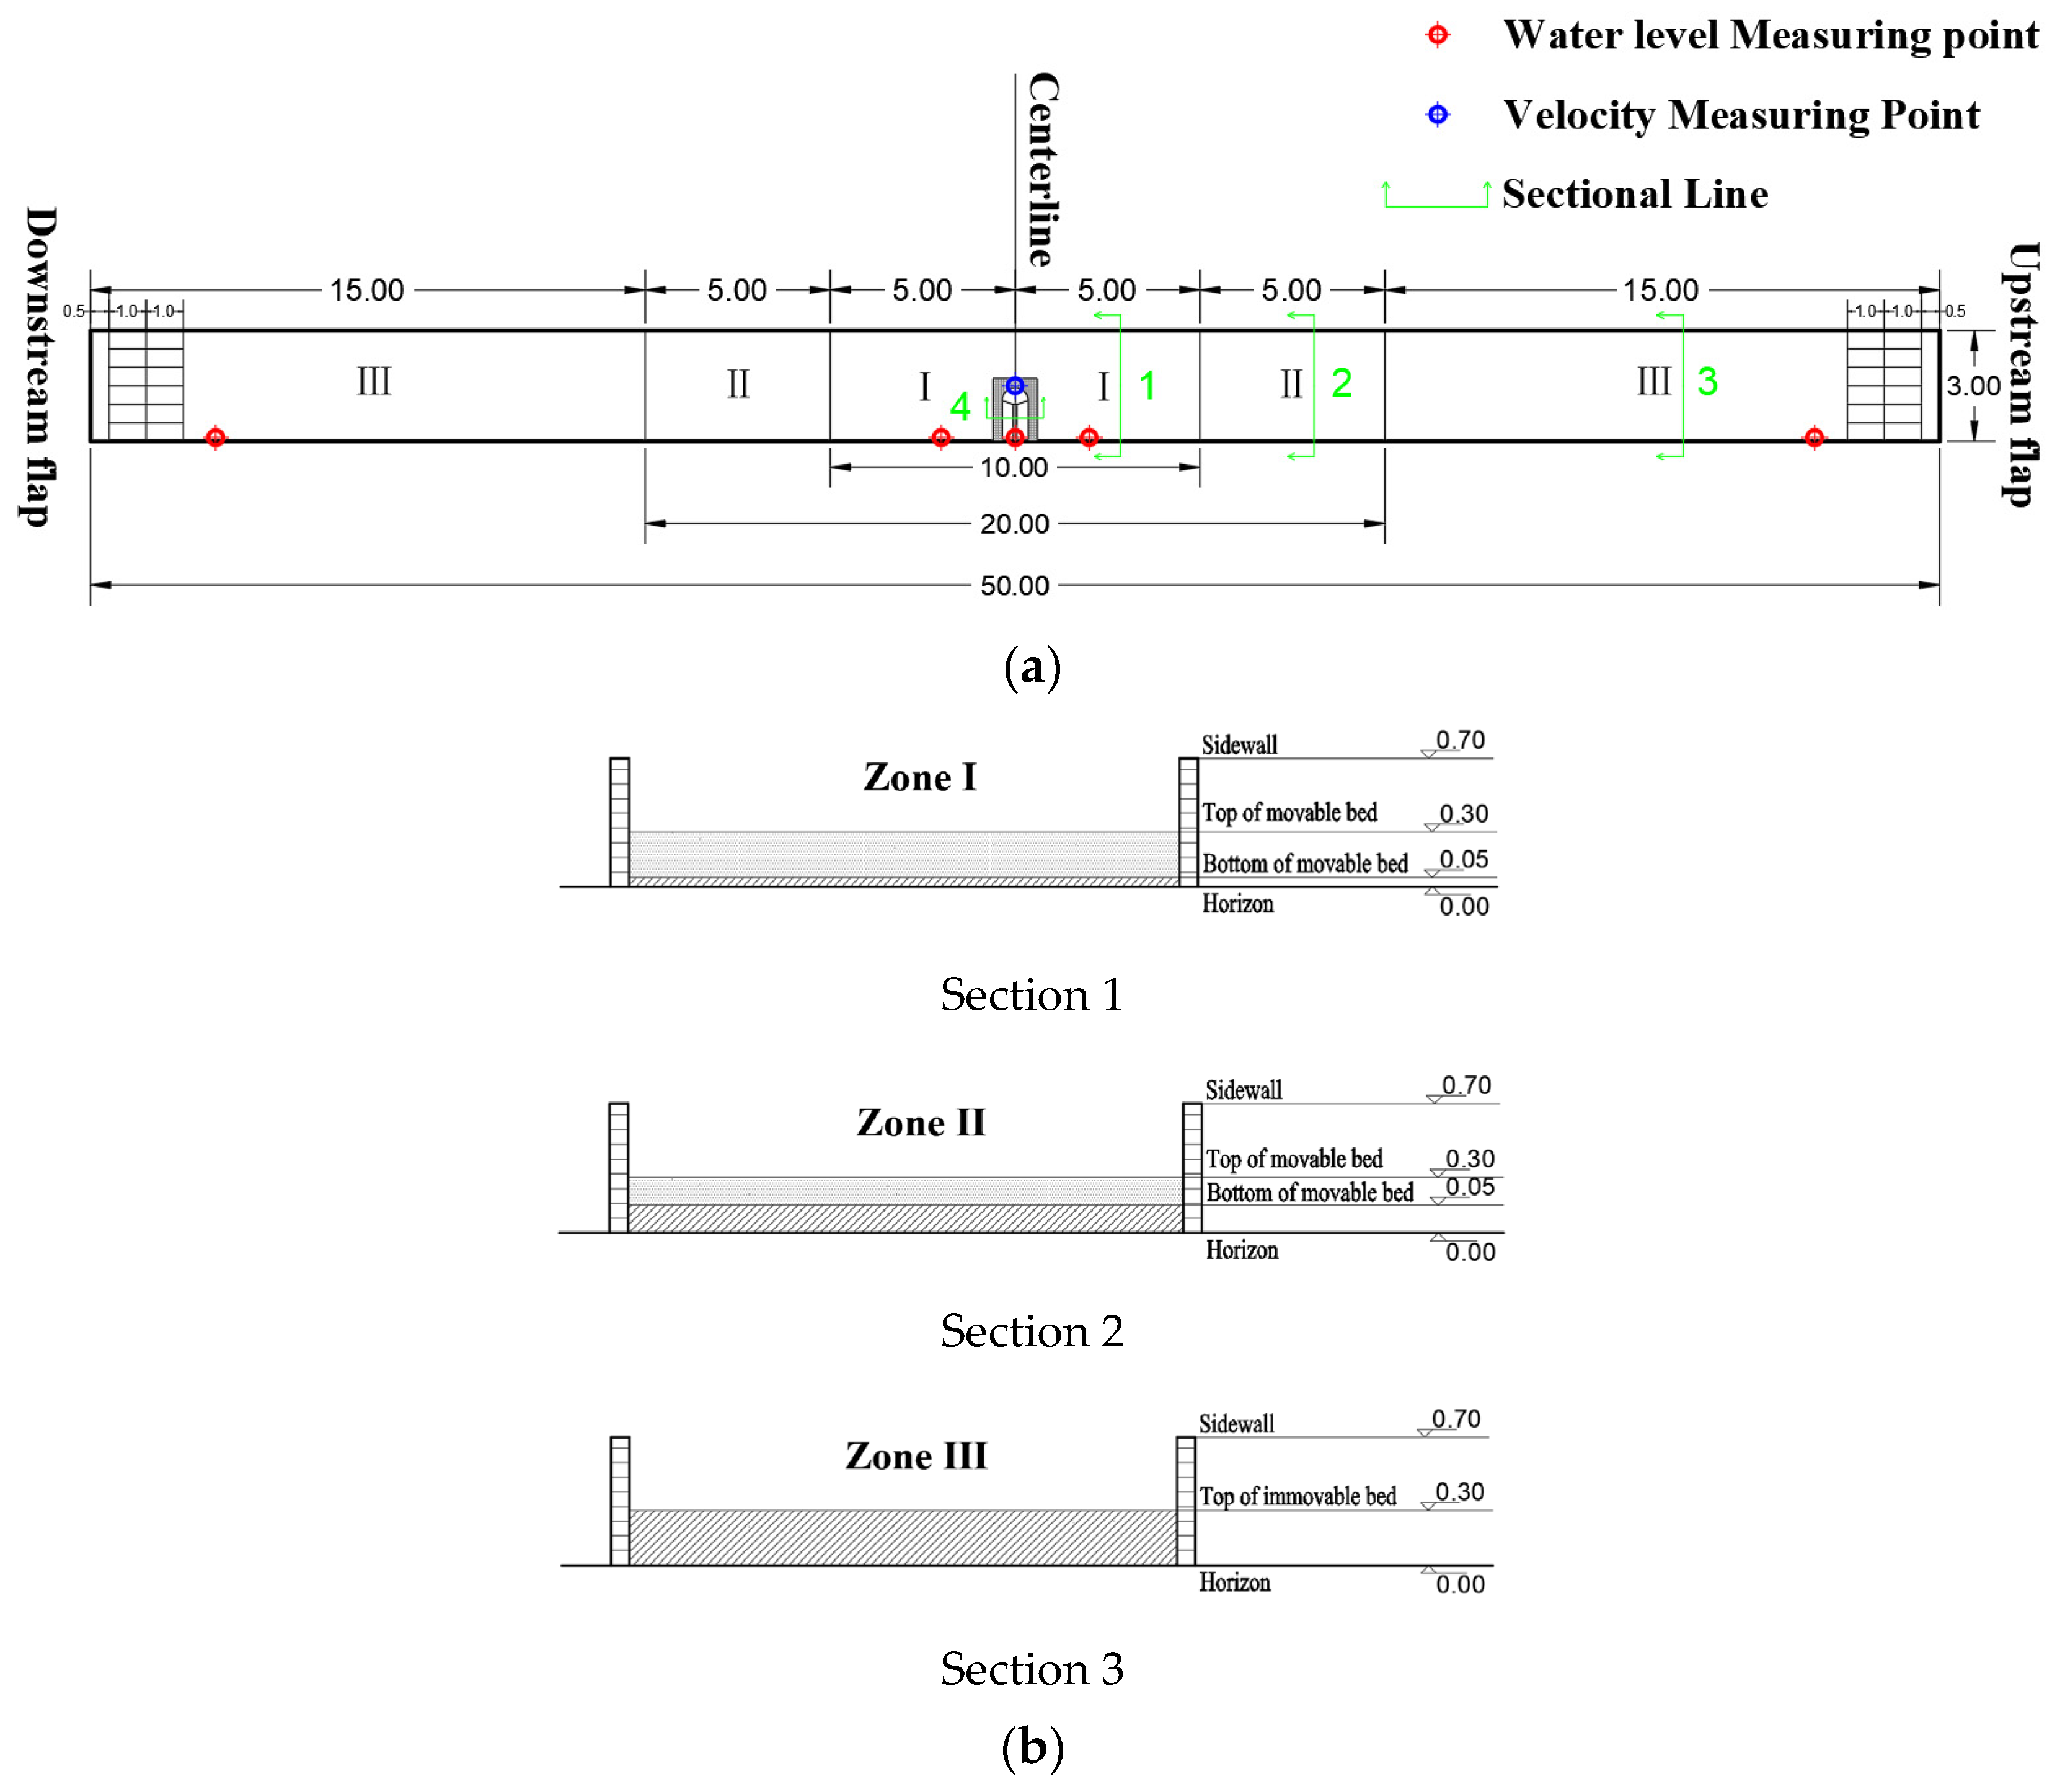
The measurement apparatuses used in the model mainly include 5 water level meters, 1 flow velocity meter, and 1 terrain measurement system.
NKY08-2 detection type water level meter developed by NHRI (Nanjing Hydraulic Research Institute) is used as the water level meter, with an accuracy of 0.01 cm and a measurement range of 0.01–40.00 cm. Five water level meters are set along the way. Three of them are arranged in zone I, which is mainly used to monitor the water level changes at the spur dike crest and near the upstream and downstream of the dike, so as to ensure that the tide level change simulation requirements are met here. Two water level meters are arranged near the upstream and downstream flap in zone III, which are mainly used to continuously adjust the flap according to the measured water level (based on the water level calculated by the previous mathematical model, which is automatically controlled and adjusted by the computer). The upstream and downstream water levels are controlled by turning the flap to ensure that the requirements of the model tide level and hydrodynamic simulation are met. See Section 2.5 for specific requirements.
The flow velocity meter is a photoelectric propeller flow velocity meter developed by NHRI, with a measurement range of 1–200 cm/s. One is set at the position where the spur dike axis is 5 cm away from the dike toe and 0.6 times the water depth vertically to monitor the vertical average velocity of the spur dike head.
The terrain measurement system is ABF2–3 two-dimensional terrain measurement system developed by Wuhan University. It is arranged along the dike axis, and a section is measured at an interval of 20 cm along the way. The interval of sections near the spur dike is densified to 10 cm. The interval between two measuring points in each section is 10 cm. It is used to monitor the change of the deepest point elevation of the scour pit at the dike head with time and to measure the terrain when the scour and siltation balance after the test.

2.4. Model Layout

The test flume is 3 m wide, 50 m long and 0.7 m high. The spur dike is 1 m long. The dike head is 1 m from the side wall and 2 m from the opposite bank. Considering that the secondary flow generated by the side wall effect generally has an impact only within the range of 2.5 times the water depth from the side wall (for this paper, that is, within the range of 0.5–0.75 m) [28,29]. In this paper, the location of the scour pit is generally more than 1 m away from the side wall. Therefore, the side wall effect of the flume in the test basically does not affect the simulation of the local scour of the spur dike.
Zones I and II are movable bed sections, in which the thickness of the movable bed in zone I is 0.25 m and that in zone II is 0.15 m. Zone III is the fixed bed section. See Figure 2 for the layout and section of the flume.
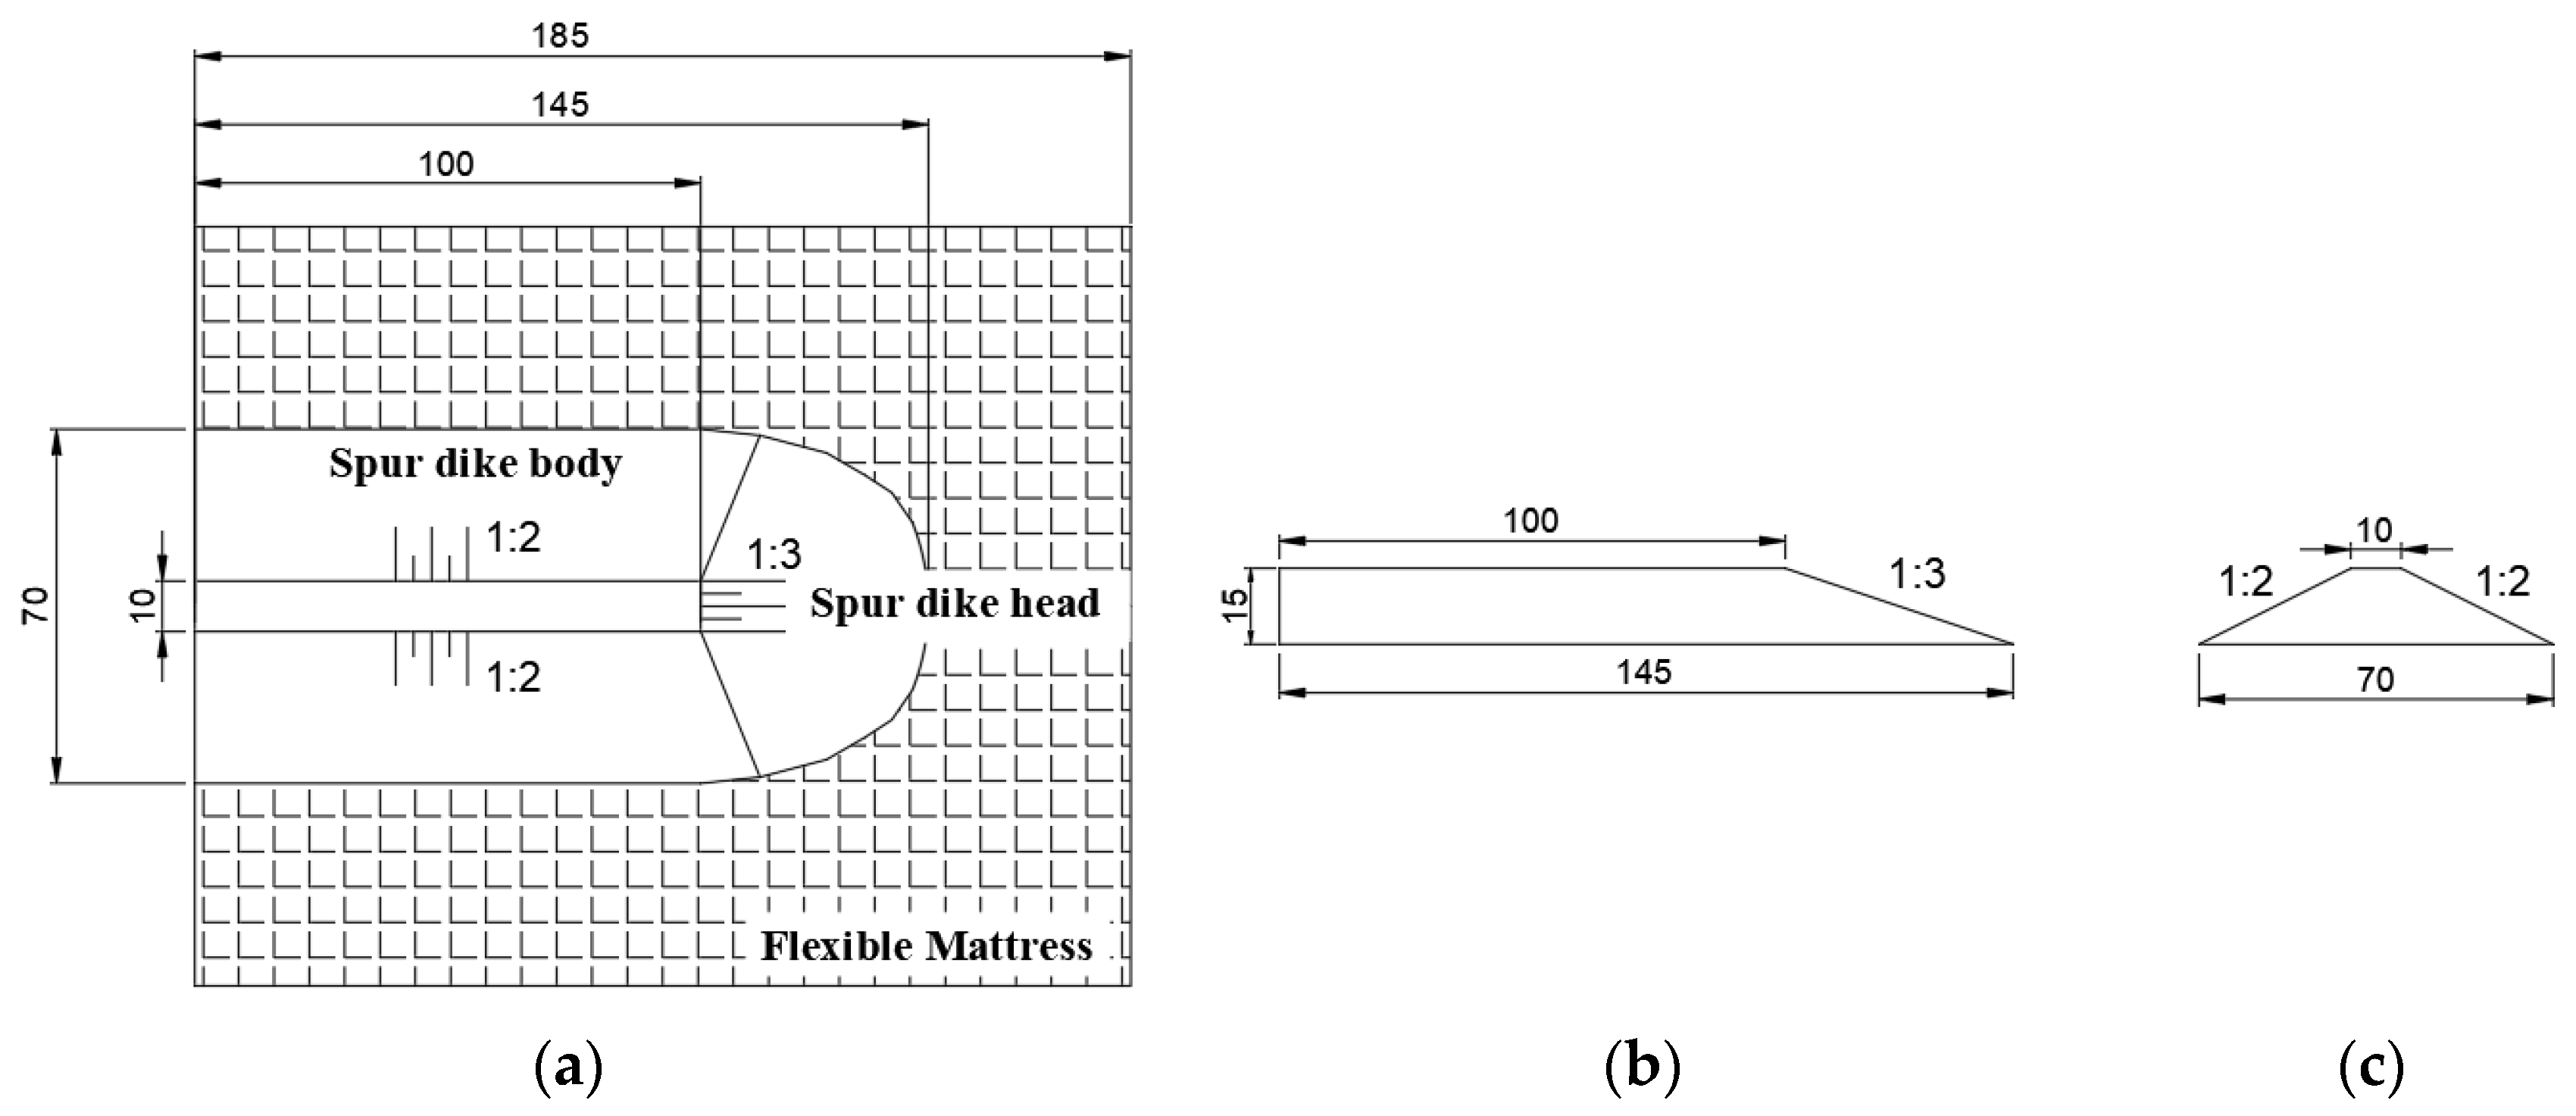
According to the common riprap spur dikes with flexible mattress bottom protection in the tidal reach of the lower reaches of the Yangtze River [7], the size of the spur dike model is determined as the dike crest is 100 cm long, 1 cm wide and 15 cm high. The gradient of the upstream slope and the downstream slope is 1:2, and the gradient of the dike head is 1:3. The dike body is composed of 1–1.5 cm of uniformly graded gravel. The flexible mattress extends 40 cm outward. The design of a flexible mattress refers to the test of Huang et al. [16] and uses cotton cloth to simulate the mattress. The density is 2700 kg/m3 and the size is an 8 mm × 8 mm × 2.4 mm (long × wide × thick) aluminum sheet to simulate the concrete pressure carrier, each with a weight of 0.41 g, which is basically similar to the prototype block in shape and weight.

2.5. Test Protocol

In line with the flow and sediment characteristics outlined in Section 2.1 of our river section study, a specific test protocol has been selected. Adhering to the similarity scale, the model’s maximum runoff velocity is set at 0.4 m/s, while the maximum flood tide velocity is varied between 0 m/s, 0.16 m/s and 0.32 m/s. The water level at the model spur dike fluctuates between 0.2–0.3 m, contingent on different tidal ranges. Ebb tide duration is established at 1.26 h, and flood tide duration is set at 0.63 h.
It is important to note that in the Yangtze Estuary, the intrusion of a saline wedge causes stratification of vertical velocity and density, adding complexity to the tidal current structure. However, as our focus lies upstream of Chongming Island, approximately 270 km from Xuliujing to Nanjing [30], and considering the influence of the saline wedge primarily affects the downstream of Chongming Island [31], which is over 100 km away, we can exclude the impact of the saline wedge. At Xuliujing, the vertical average salinity does not exceed 0.2, and within our study range, salt and fresh water are fully mixed [32].
Therefore, under the most unfavorable test conditions, clean water scouring is employed for the test. The test duration concludes when the change in scouring pit depth within half an hour does not exceed 5% of the total scouring depth [33,34], indicating that the bed topography has reached an equilibrium state of scouring and silting. Typically, the runoff lasts approximately 3.5 h, while the overall runoff and tidal current endure for about 6 h, encompassing three ebb and flow cycles. Three groups of test conditions are defined, with each set of conditions subjected to two repetitions, as detailed in Table 2.

3. Results

The instability process of riprap spur dikes under the bidirectional action of runoff and tide is similar to that under the condition of single runoff. The fundamental reason is also the instability of riprap in the upper part of the spur dike caused by the scouring of the spur dike foundation by water flow. The difference is that the shape and depth of scouring pits under the action of runoff and tidal current are different from those of single runoff. The reason is mainly reflected in the difference between runoff and tide hydrodynamic forces.

3.1. Scouring Pit Shape

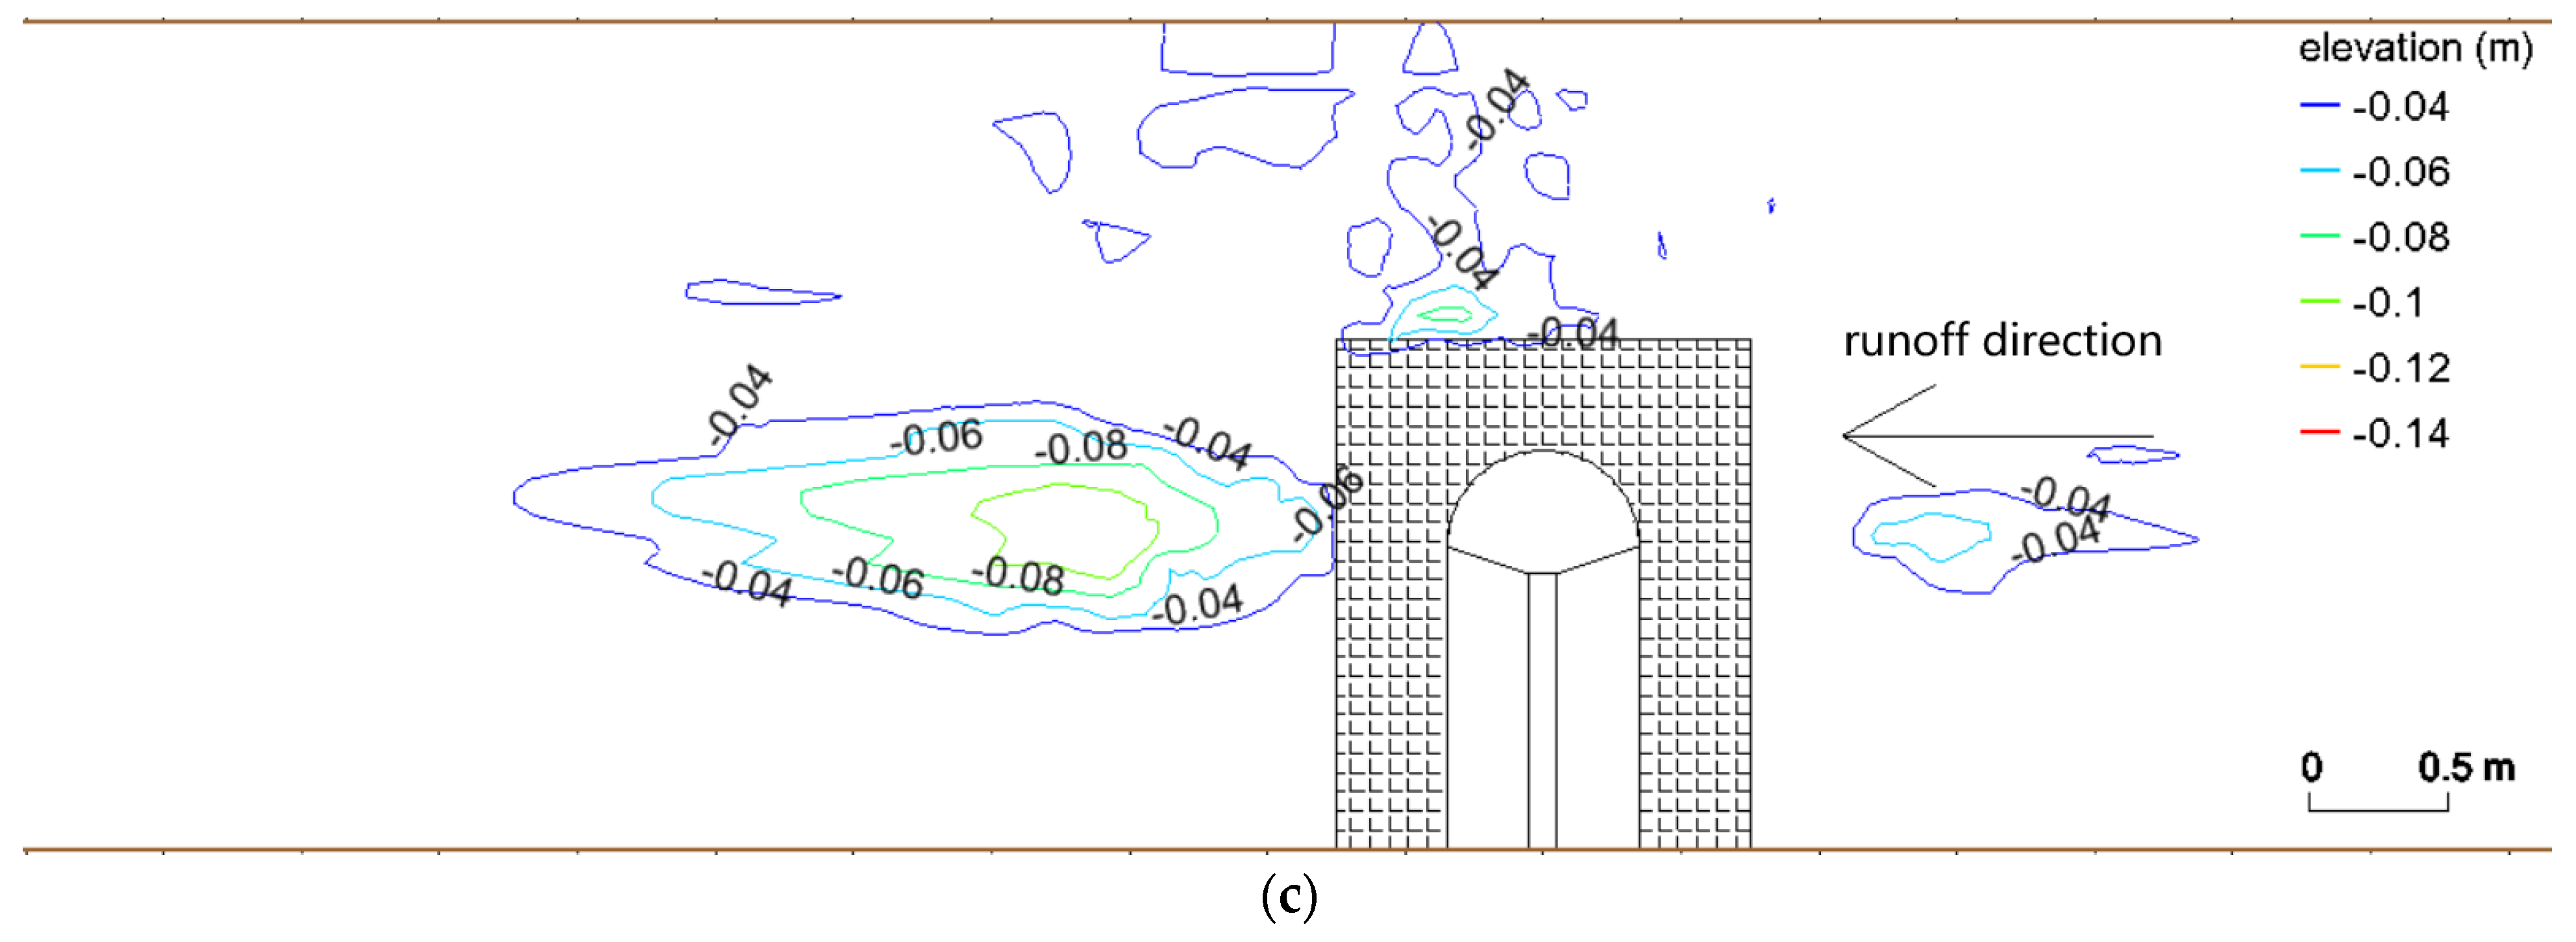
The scour pit shapes caused by different runoff and tidal current intensities are different. The test results show that scour pits occur at the dike head and downstream side under various conditions. Runoff conditions are more obvious than runoff and tidal current conditions. Under the condition of maximum tidal current (Condition 3), obvious scouring also occurred at the upstream side of the dike. This is related to the hydrodynamic effect under different runoff and tidal current conditions. Although the maximum ebb flow velocity under each working condition is 2.5 m/s, it is 2.5 m/s in the whole period under a single runoff condition, while under runoff and tidal current conditions, the maximum ebb flow velocity reaches 2.5 m/s only at the moment, and the duration of hydrodynamic action is significantly different (Figure 4).
On the whole, the scour pit depth at the dike head and the distance from the spur dike is less than the scour pit behind the dike under various working conditions. From the perspective of different runoff and tidal current conditions, no matter at the dike head or its downstream side, the scour pit depth generated by runoff conditions is the largest, and the distance from the spur dike is also the nearest. At this time, the threat to the dike is the greatest. With the increase in tidal current velocity, the scour depth gradually decreases and gradually moves away from the dike (Figure 5).
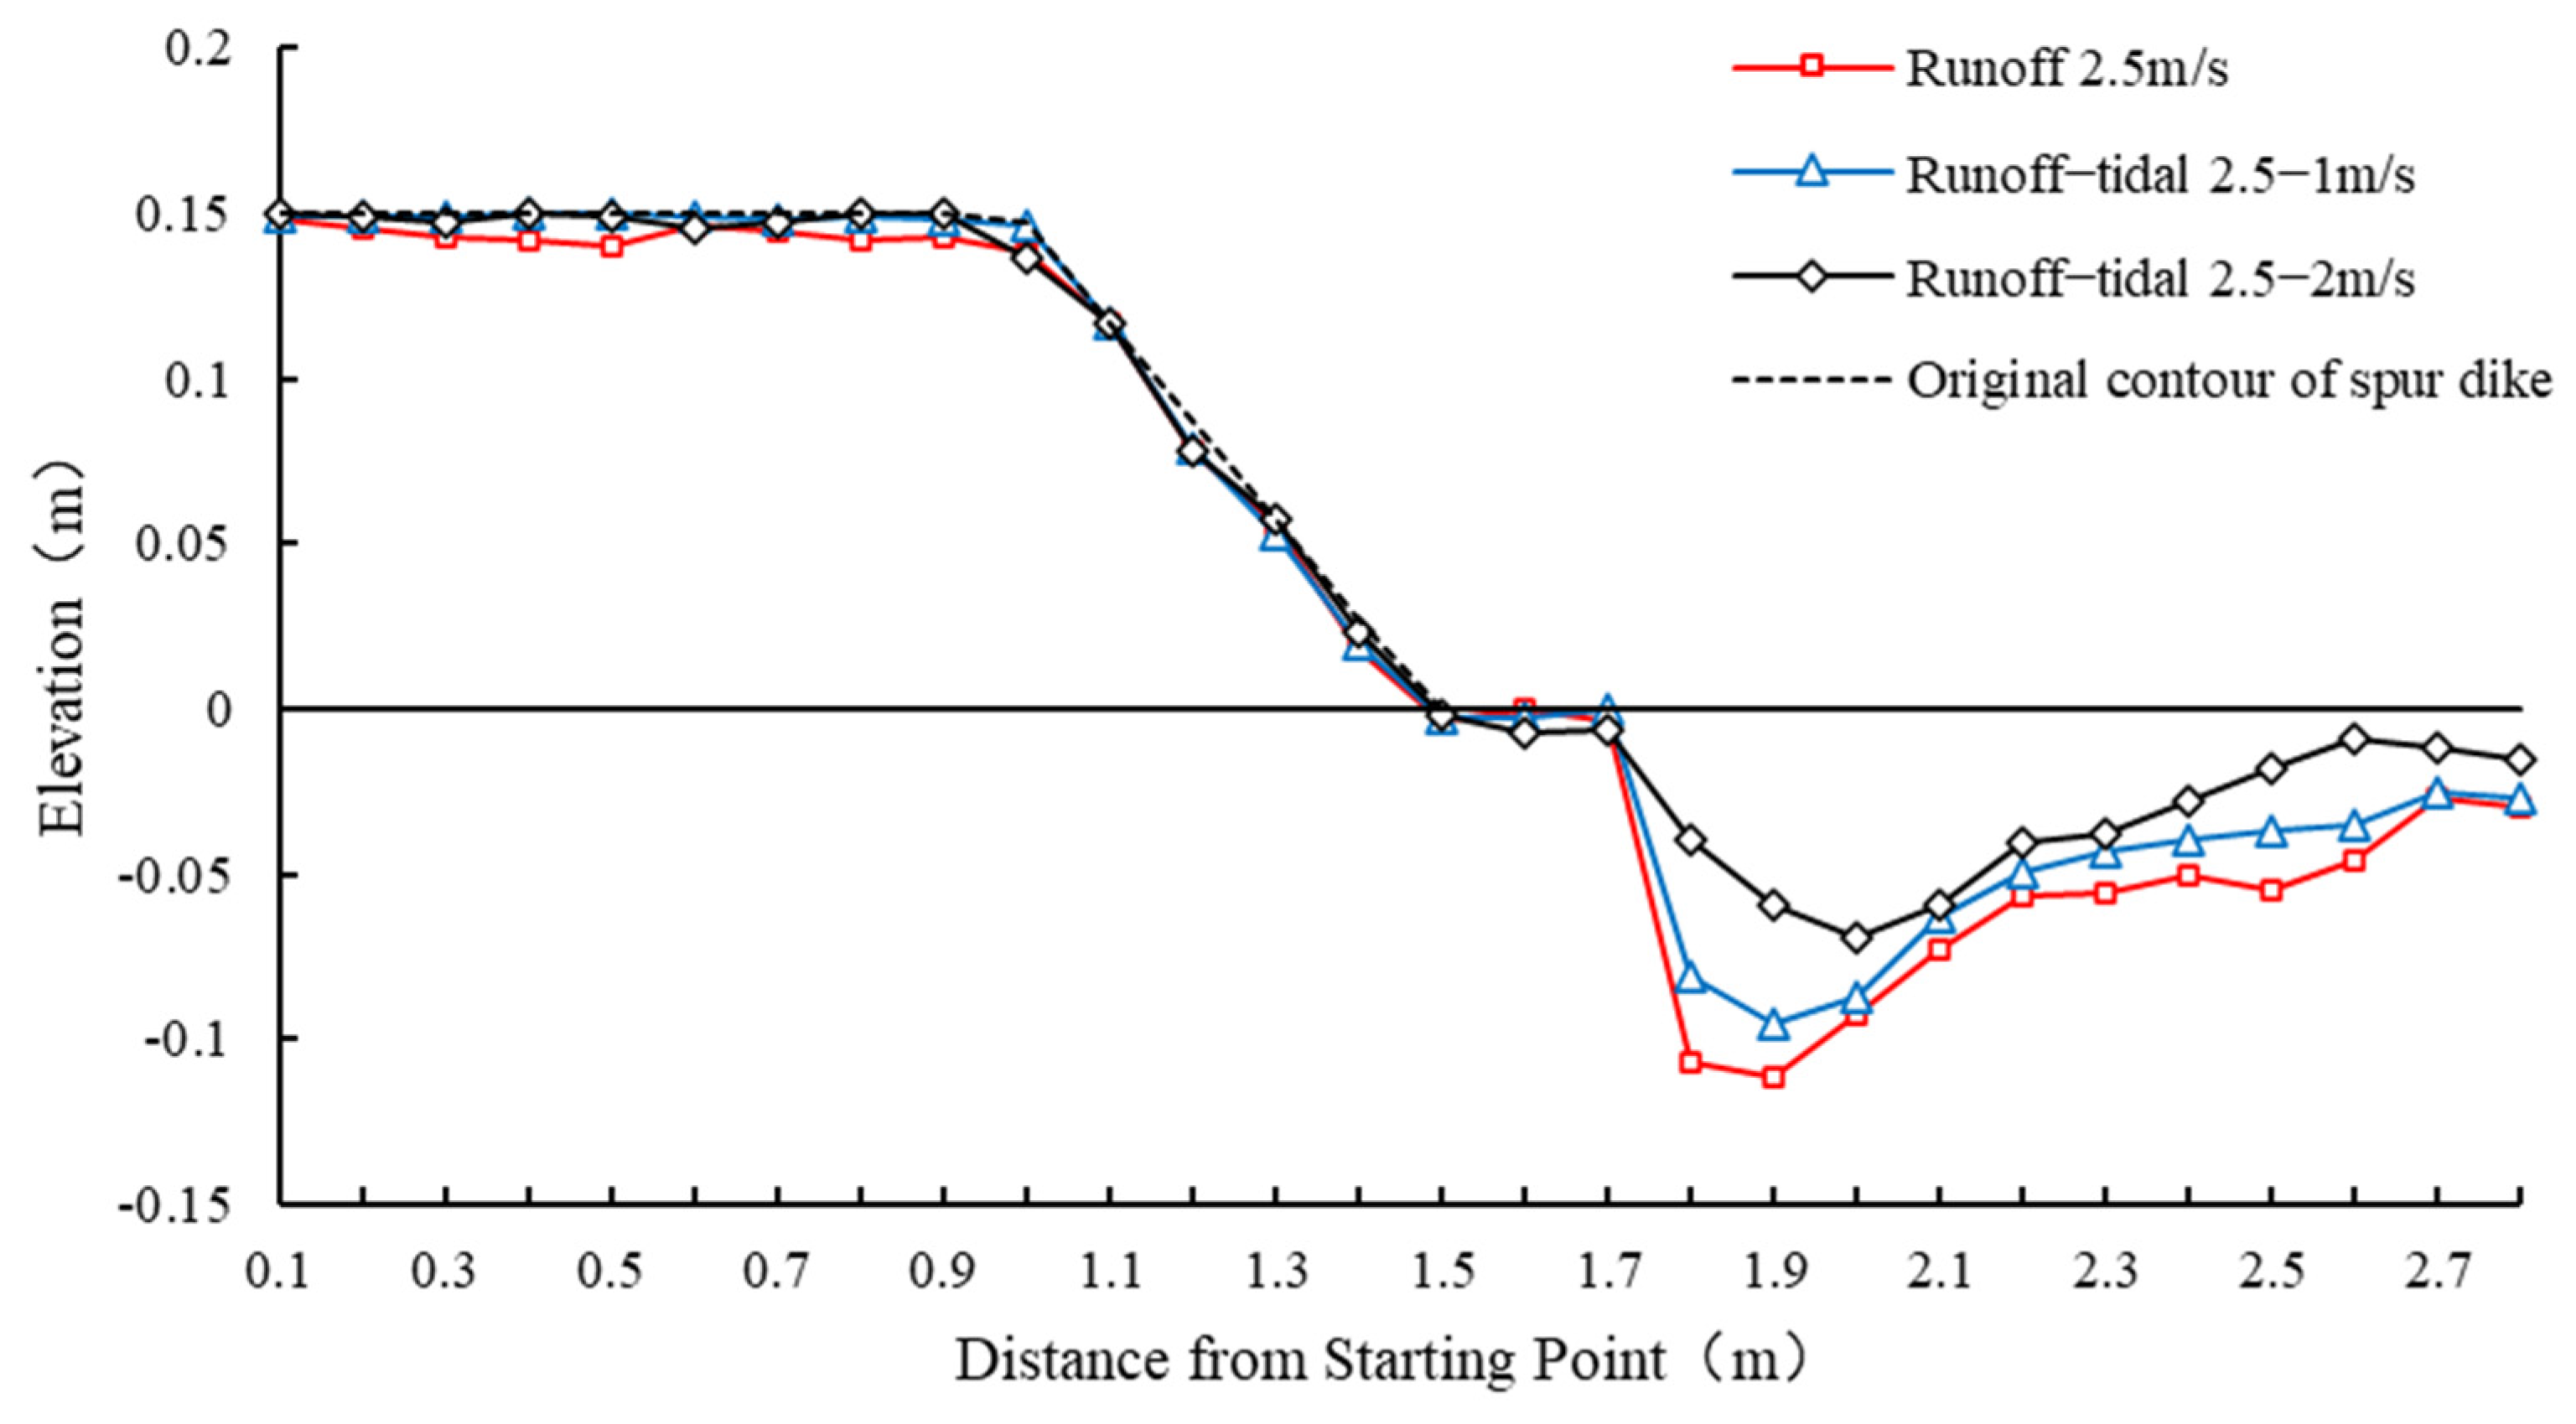
From the topography of the dike axis section at the end of the test, it can be seen that under the condition of single runoff (condition 1), the scouring depth at the front of the dike head is the deepest, reaching 0.112 m (prototype 4.48 m). With the increase in tidal current, the scour depth at the dike head gradually decreases, and the maximum scour depth point is also gradually away from the dike body (Figure 6).

3.2. Scouring Pit Depth

The scouring pit depth caused by different runoff and tidal current intensities is different. Under the condition of a single runoff (condition 1), the elevation of the deepest point of the scour pit at the dike head gradually decreases, and the decline rate gradually slows down, basically reaching the equilibrium state of scouring and silting. Under the condition of runoff and tidal current, with the increase in tidal current, the elevation of the deepest point of the scour pit at the dike head shows periodic scouring and silting. When the vertical average velocity (blue line) at the front of the dike head is the rising tide (i.e., the velocity in the figure is negative), the deepest point of the scour pit at the dike head of condition 2 and condition 3 has a certain degree of back siltation, and condition 3 is more obvious. The change process of scour pit depth has a strong correlation with the duration and strength of the fluctuation tide (Figure 7).
The reason for this rule is that under the action of tidal current, the water flow moves back and forth, and the sediment also has the trend of bidirectional transport. Due to the influence of the fluctuation of the tidal current movement and the rotating and diverting currents, the effective action time of the reciprocating flow on the scouring pit is also shorter than that of the unidirectional flow [10]. In order to quantify the effect of this flow action, the velocity vector at the dike head (considering the magnitude and direction of the velocity) and the action time are used to quantify the effect of the flow on the scouring and silting of the riverbed, and the formula is established, as follows:
E = 0 T v d t T
where  T  is the duration of flow action,  E  is the average effect of flow on scouring and silting of riverbed near the spur dike in a unit time,  v  is the vertical average velocity vector at the dike head (ebb tide velocity is positive, flood tide velocity is negative), and  t  is the differential of time.
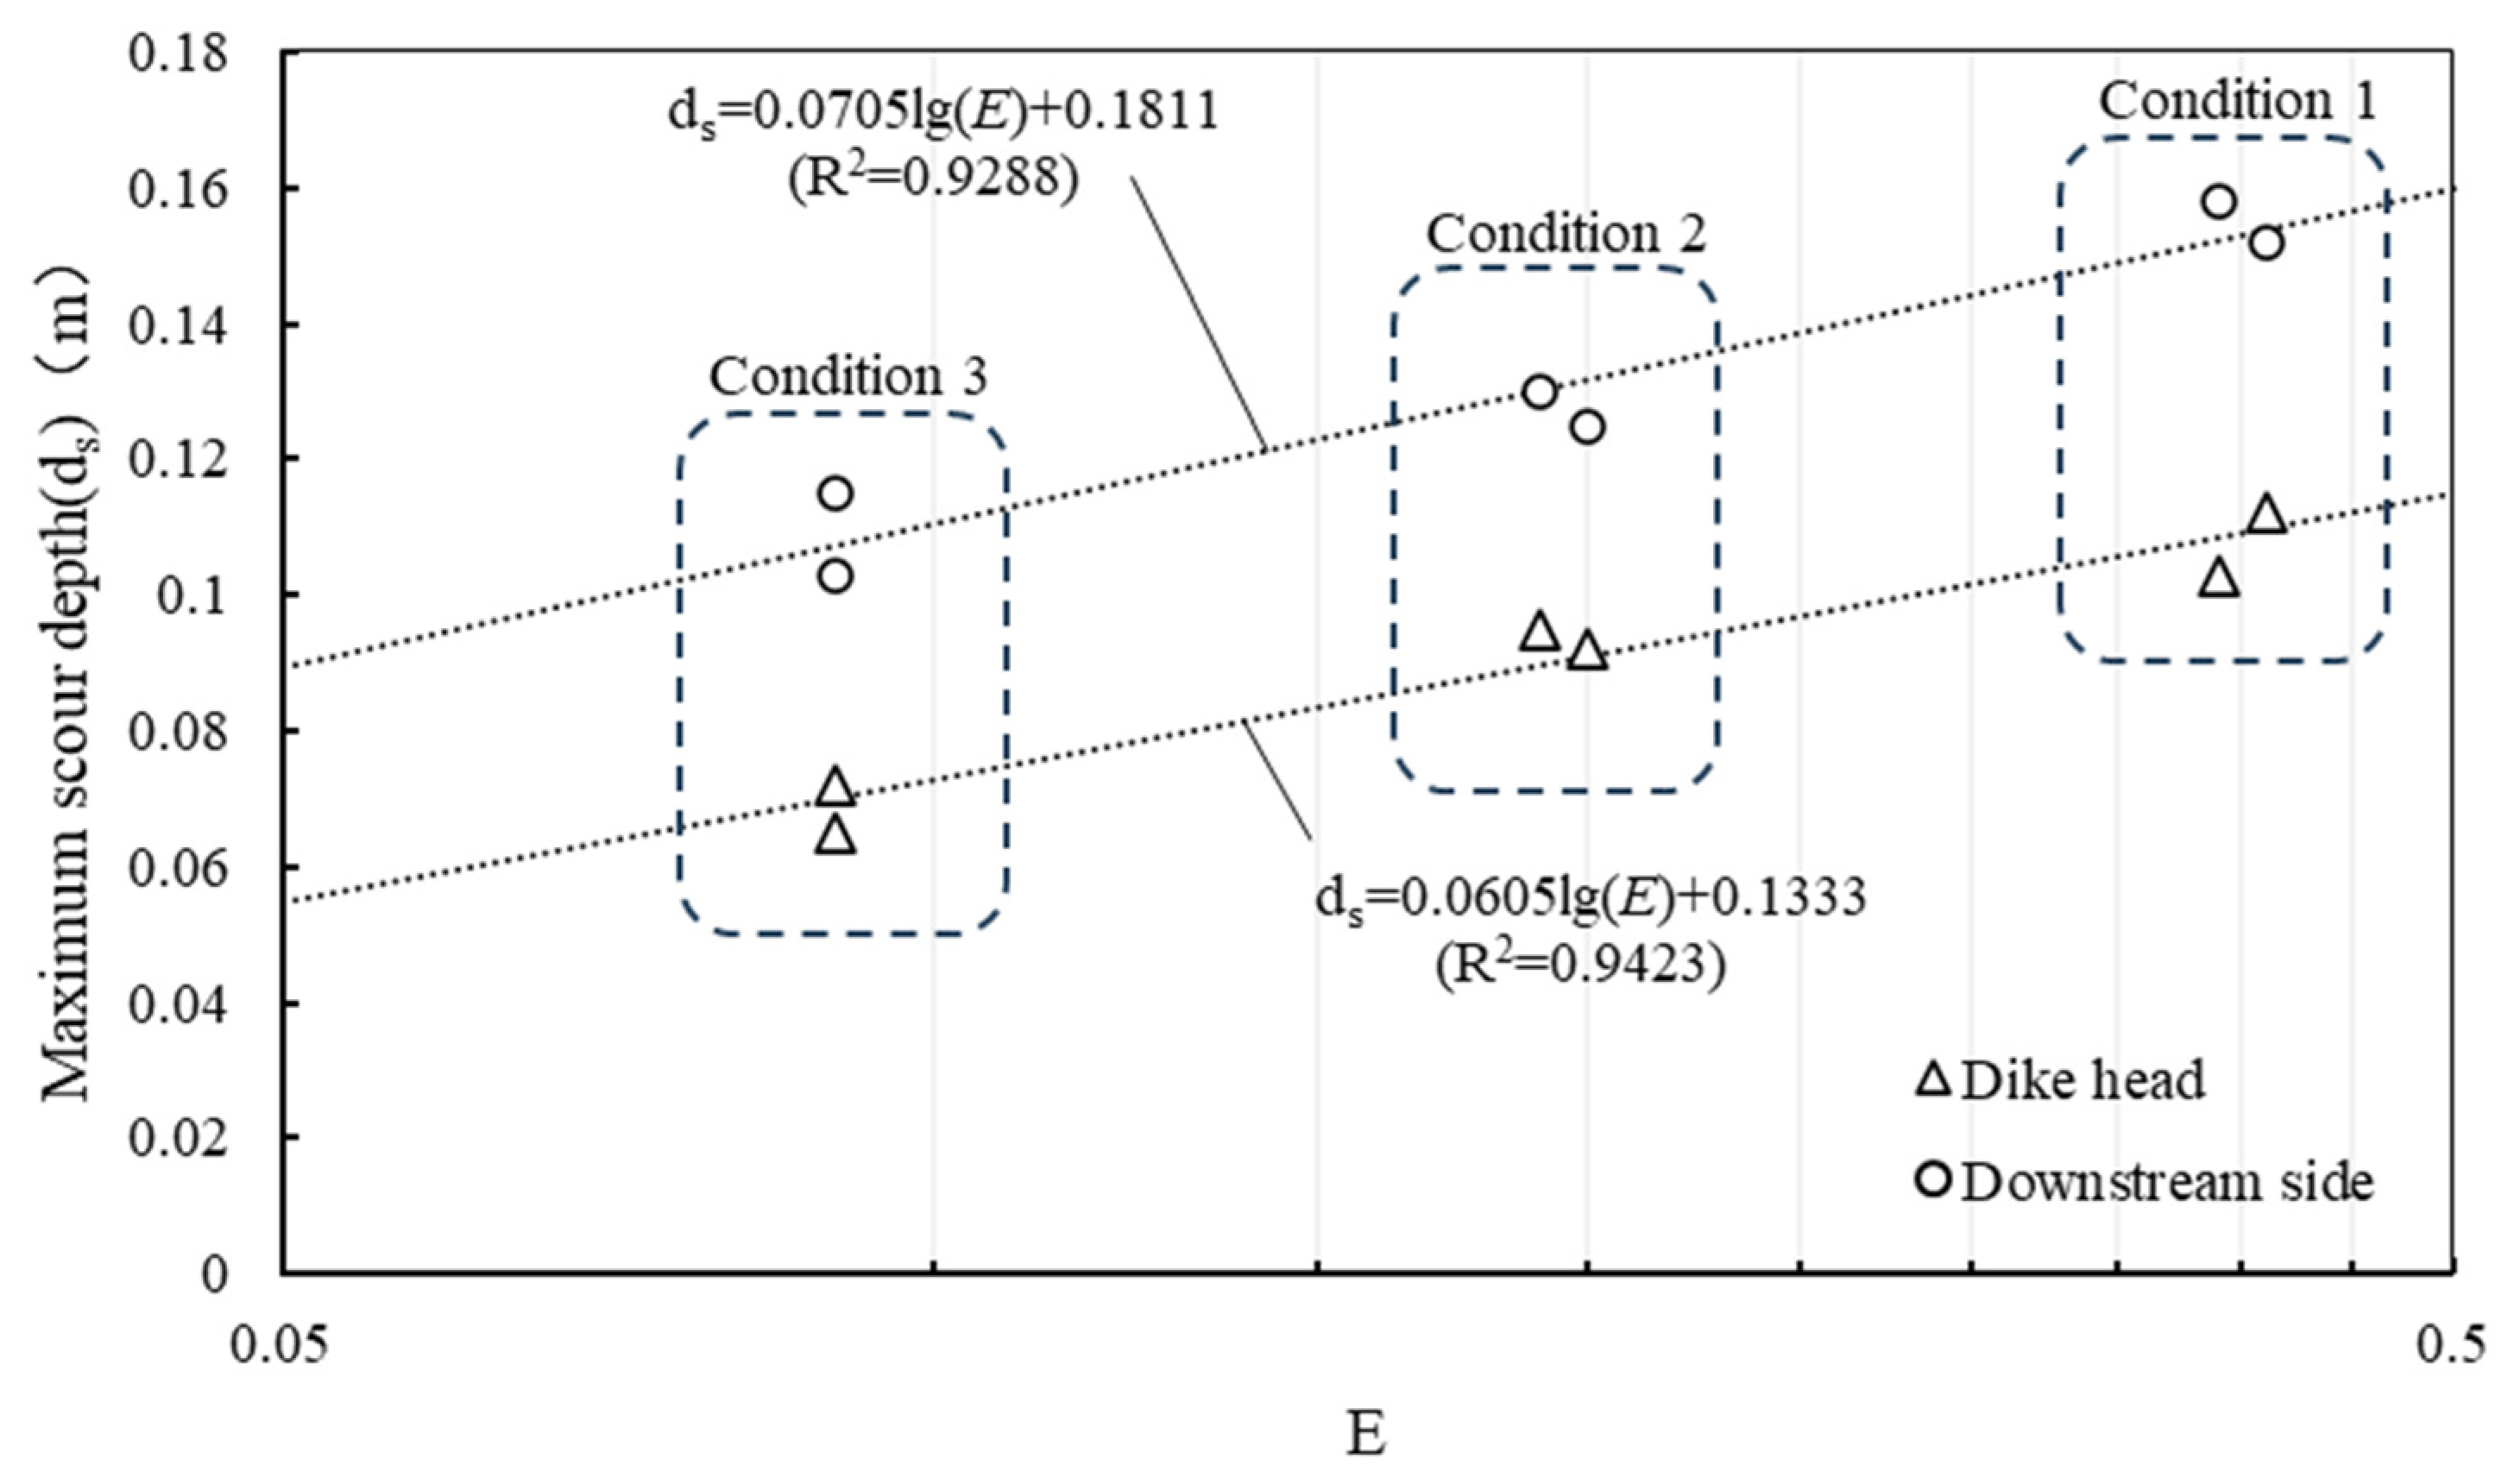
In accordance with Formula (1), the findings presented in Figure 8 and Table 3 reveal a noticeable trend. As we progress from condition 1 to condition 3, there is a consistent decrease in the maximum scour depth (ds) at both the dike head and its downstream side, correlating with a reduction in the parameter E. The abscissa in Figure 8 adopts a common logarithmic coordinate system, wherein the common logarithm of E is proportionally related to ds (0.05 ≤ E ≤ 0.5). Analysis of the results indicates that the reduction in E signifies a diminished average impact of water flow on riverbed scouring and silting, resulting in a decrease in both the volume and spatial extent of the scouring pit [14]. While ds represents only one facet of these changes, it serves as a direct indicator of the influence of water flow and is particularly relevant to the ongoing discussion on the stability calculation of spur dikes. Thus, using ds as an illustrative example underscores a robust correlation between E and the characteristics of scour pits, thereby affirming the feasibility of utilizing E for quantitative description in this context.
Table 3 presents the values of the parameter E and the corresponding maximum scour depth (ds) at the dike head and its downstream side across various conditions. It is evident that the impact of reciprocating flow on the scour pit is relatively modest. Specifically, in condition 2 and condition 3, the values of E account for only approximately 50% and 22% of that observed in condition 1, respectively. Notably, the maximum scour depth at the dike head and its downstream side, influenced by both runoff and tidal current, ranges from 60% to 90% of the values recorded under the influence of runoff alone.

4. Discussion

4.1. Scouring Pit Calculation Formula

Huang et al. and Ma et al. [16,22] investigated the damage mechanism of submerged riprap spur dikes protected by flexible mattresses in the lower reach of the Yangtze River below Nanjing, focusing on the influence of runoff. They suggested that the scouring pit depth (ds) primarily depended on factors such as flow conditions, dike body dimensions, residual discharge width and bed sediment. Employing dimensional analysis and regression analysis principles, they derived a formula for the maximum scour depth of the riprap spur dike head and its downstream side, taking into account bottom protection.
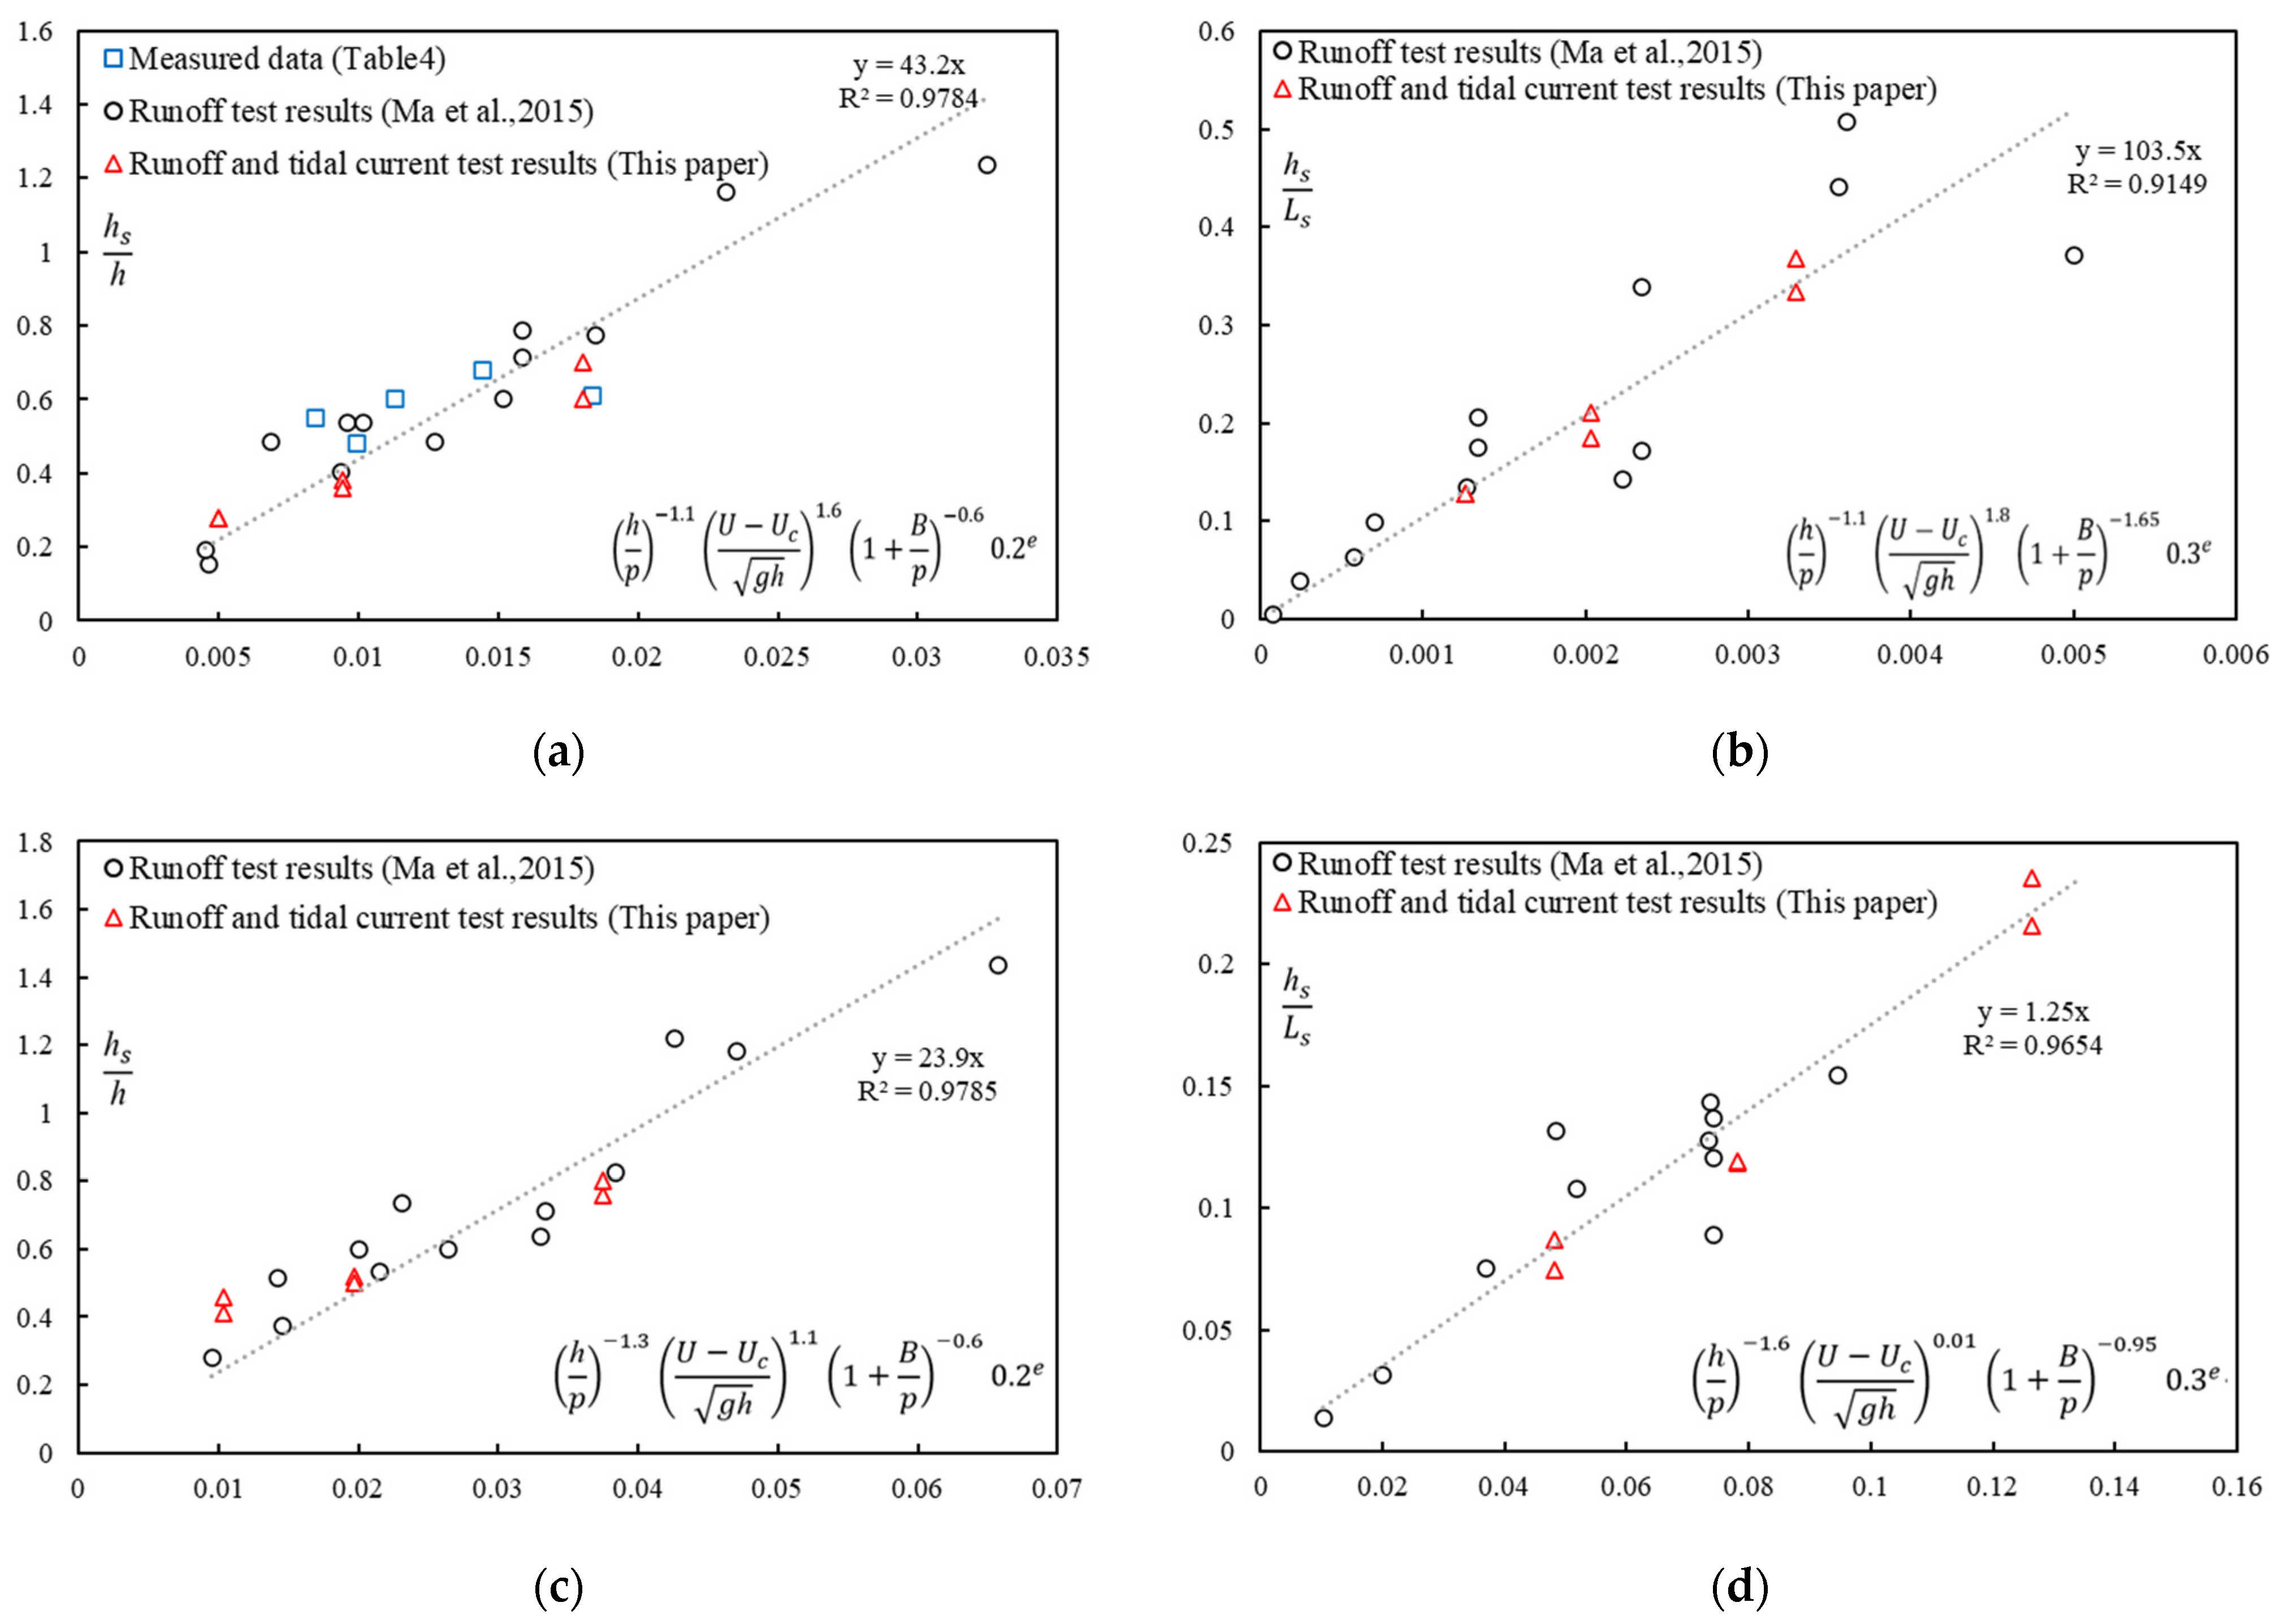
The study area, as well as the flow and sediment conditions considered in the aforementioned formula, align closely with those in this paper. Consequently, we introduce a modification to the formula by incorporating the impact of tidal current, introducing the runoff tidal current ratio (e). Through fitting experimental data with existing outcomes and conducting regression analysis (see Figure 9), we present optimized formulas for the maximum scour depth of the riprap spur dike head and its downstream side (Formulas (2) and (4)), as well as the slope formula describing the maximum scour depth relative to the spur dike toe (Formulas (3) and (5)) under the combined effects of runoff and tide.
(1)
Dike head:
d s h = 43.2 h p 1.1 U U c g h 1.6 1 + B p 0.6 0.2 e     ( R 2 = 0.9784 )
i = d s L s = 103.5 h p 1.1 U U c g h 1.8 1 + B p 1.65 0.3 e     ( R 2 = 0.9149 )
(2)
Dike downstream side:
d s h = 23.9 h p 1.3 U U c g h 1.1 1 + B p 0.6 0.2 e     ( R 2 = 0.9784 )
i = d s L s = 1.25 h p 1.6 U U c g h 0.01 1 + B p 0.95 0.3 e     ( R 2 = 0.9149 )
where  d s  is the scour pit depth near the dike head or its downstream side,  h  is the water depth at the front of the dike head,  p  is the height of the dike body,  U  is the vertical average velocity at the front of the dike head,  U c  is the incipient velocity of sediment,  g  is the gravity acceleration,  B  is the width of the flexible mattress,  i  is the slope of the maximum scouring depth point relative to the dike toe, and  L s  is the horizontal distance between the maximum scouring depth point and the dike toe. e = maximum flow rate at flood tide/maximum flow rate at ebb tide. When there is only runoff,  e = 0 .
The formula is verified by the measured data of five spur dikes in the Dongliu waterway regulation project in the lower reaches of the Yangtze River. Dongliu waterway is located in Anqing City, Anhui Province, and is only affected by runoff. At this time, e is 0. When the measured data is brought into Formula (2), it can be seen that the calculated and actual scour pit depths are close and well fitted (Figure 9a and Table 4).

4.2. Safety Operation Index

Drawing upon the research approach of Huang, Zhang, et al. [16,20], the overall stability critical slope of the spur dike head or its downstream side  i 0 , is considered a research and judgment index of spur dike safety operation. Figure 10 shows the value selection method of the overall stability critical slope  i 0 , which takes the larger value of  i c r  and  m i c r  is the critical slope outside the dike toe, which is related to the dike slope. The smaller the slope, the larger the  i c r m  is the stable slope of riverbed sediment, which is related to the riverbed composition and bonding degree of the project area. The more stable the riverbed, the greater the stable slope  m . Both can be calculated by the arc stability method.
When the slope  i  (calculated by Formula (5)) of the maximum scour depth relative to the dike toe is greater than the above  i 0 ; that is, when  i  obtained by calculation exceeds  i c r  and  m  at the same time, it is considered that the dike is unstable [16,21,22]. Taking the Figure 10 as an example,  h s 1  is the safe scouring pit depth, and the slope  i 1 = h s 1 / L s 1 < i 0  is safe at this time. However,  h s 2  has large scour depth,  i 2 = h s 2 / L s 2 > i 0 , large slope, and is prone to instability, which needs to be repaired in advance.

5. Conclusions

Taking the tidal reach of the lower reaches of the Yangtze River as an example, this paper focuses on the characteristics of scour pits near submerged riprap spur dike with flexible mattress bottom protection and the corresponding safety operation index, which are common in the deep-water navigation channel project in the Yangtze River below Nanjing under the action of runoff and tide current, by using the movable bed flume model test. The main conclusions are as follows.
The scour pits at the spur dike head and its downstream side, under the influence of both runoff and tidal currents, exhibit reduced dimensions compared to those formed solely under runoff conditions. These pits undergo cyclic scouring and silting, varying in response to the duration and intensity of flood and ebb tides. Furthermore, under the combined influence of runoff and tidal currents, the scour pits manifest at an increased distance from the dike structure. The maximum scour depth attains only 60% to 90% of that observed solely under runoff conditions, contingent upon the ratio of maximum flow velocity during flood tide and ebb tide (denoted as e), a phenomenon quantitatively explicable through the concept of the average effect of flow on riverbed scouring and silting in a unit time (denoted as E).
Based on the test data, the maximum scour depth formula of riprap spur dike and the slope formula of maximum scour depth relative to spur dike toe are established. These formulae, specifically tailored to the context of fine sand riverbeds protected by flexible mattress bottom coverings, serve as practical tools for evaluating scour potential.
The overall stability critical slope  i 0  is determined as the evaluation index for the safety operation of the riprap spur dike. When the calculated slope of the maximum scour depth  i  exceeds  i 0  relative to the dike toe, it indicates the imperative need for timely repair and maintenance of the dike body and its foundation to uphold structural integrity and operational safety.

Author Contributions

Conceptualization, A.M., Y.D. and M.C.; methodology, Y.W., A.M. and Y.D.; software, Y.W. and M.L.; validation, Y.W. and M.L.; formal analysis, Y.W. and A.M.; investigation, Y.W., A.M. and M.L.; resources, M.C. and A.M.; data curation, Y.W. and M.L.; writing—original draft preparation, Y.W.; writing—review and editing, A.M., Y.D., Y.H. and M.C.; visualization, Y.W. and Y.H.; supervision, A.M. and M.C.; project administration, A.M.; funding acquisition, A.M., M.C., Y.D. and Y.H. All authors have read and agreed to the published version of the manuscript.

Funding

This research was funded by the National Key R&D Program of China (Grant No. 2021YFC3200403), Water conservancy youth talent development funding project (Grant No. Qs222014), the Research Funding of Central-level Public Welfare Scientific Research Institutes (Grant No. Y220010 and Y220011).

Data Availability Statement

The data presented in this study are available on request from the corresponding author.

Acknowledgments

We especially thank Hanyu Li, Wenliang Wu, Zhaoyi Cheng and Jiahang Li for their help in the flume test. The constructive comments and suggestions of the anonymous reviewers and the editors are gratefully acknowledged.

Conflicts of Interest

The authors declare no conflicts of interest.

References

  1. Yang, Y.; Zheng, J.; Zhang, W.; Zhu, Y.; Chai, Y.; Wang, J.; Wen, Y. Quantitative relationship between channels and bars in a tidal reach of the lower Yangtze River: Implications for river management. J. Geogr. Sci. 2021, 31, 1837–1851. [Google Scholar] [CrossRef]
  2. Przedwojski, B. Bed topography and local scour in rivers with banks protected by groynes. J. Hydraul. Res. 1995, 33, 257–273. [Google Scholar] [CrossRef]
  3. Yu, T.; Duan, Q.; Wang, P.; Han, L. Experimental research of turbulence kinetic and water force acting on spur dike. Desalination Water Treat. 2022, 267, 89–97. [Google Scholar] [CrossRef]
  4. Zhang, W.; Qu, L.; Xu, J. Stability Analysis of Enrockment Dams in Mountain Streams. Port Waterw. Eng. 2003, 351, 10–12. (In Chinese) [Google Scholar] [CrossRef]
  5. Xia, Y.; Cai, Z.; Xu, H.; Yan, J. Interaction between new submerged spur dike and water flow in deepwater channel regulation. Port Waterw. Eng. 2018, 137–142. (In Chinese) [Google Scholar] [CrossRef]
  6. Elawady, E.; Michiue, M.; Hinokidani, O. Experimental Study of Flow Behavior around Submerged Spur-Dike on Rigid Bed. Proc. Hydraul. Eng. 2000, 44, 539–544. [Google Scholar] [CrossRef]
  7. Cao, M.; Ying, H.; Qian, M. Main technical problems and research achievement of 12.5 m deep-water channel construction phase Ⅰ of the Yangtze River below Nanjing city. Port Waterw. Eng. 2015, 2, 26–35. (In Chinese) [Google Scholar] [CrossRef]
  8. Cao, M.; Ying, H.; Shen, X. Evolution features and regulation thinking about four reaches of deep-water channel phase Ⅱ project in the Yangtze River below Nanjing. Port Waterw. Eng. 2018, 1–12. (In Chinese) [Google Scholar] [CrossRef]
  9. Dou, X.; Wang, X.; Lou, B. General scouring model test of dike’s head under tidal currents and waves. Hydro-Sci. Eng. 2005, 28–33. (In Chinese) [Google Scholar] [CrossRef]
  10. Zhang, X.; Dou, X.; Wang, X.; Wang, H.; Zhao, X.; Xu, X. 3D numerical modeling of local scour processes around spur dikes in tidal rivers. Adv. Water Sci. 2012, 23, 222–228. (In Chinese) [Google Scholar] [CrossRef]
  11. Zhang, X. Experimental Study on the Failures of Spur Dike under Unsteady Flow. Ph.D. Thesis, Chongqing Jiaotong University, Chongqing, China, 2012. (In Chinese). [Google Scholar]
  12. Huang, Z.; Wu, G.; Cheng, Z. Formula of Local Scour Depth around Spur Dikes. J. Water Resour. Archit. Eng. 2004, 13–15+23. (In Chinese) [Google Scholar]
  13. Pandey, M.; Jamei, M.; Ahmadianfar, I.; Karbasi, M.; Lodhi, A.S.; Chu, X. Assessment of scouring around spur dike in cohesive sediment mixtures: A comparative study on three rigorous machine learning models. J. Hydrol. 2022, 606, 127330. [Google Scholar] [CrossRef]
  14. Zhang, L.; Wang, P.; Yang, W.; Zuo, W.; Gu, X.; Yang, X. Geometric Characteristics of Spur Dike Scour under Clear-Water Scour Conditions. Water 2018, 10, 680. [Google Scholar] [CrossRef]
  15. She, J.; Xia, Y.; Xu, H.; Du, D.; Hao, S. Experimental study on local scouring of submerged spur dike head under bottom protection condition. Adv. Water Sci. 2016, 27, 579–585. (In Chinese) [Google Scholar] [CrossRef]
  16. Huang, W.; Creed, M.; Chen, F.; Liu, H.; Ma, A. Scour around Submerged Spur Dikes with Flexible Mattress Protection. J. Waterw. Port Coast. Ocean Eng. 2018, 144, 04018013. [Google Scholar] [CrossRef]
  17. Li, G.; Sui, J.; Sediqi, S.; Dziedzic, M. Local scour around submerged angled spur dikes under ice cover. Int. J. Sediment Res. 2023, 38, 781–793. [Google Scholar] [CrossRef]
  18. Fei, X.; Zhang, X.; Ying, Q.; Niu, C.; Chen, C. Experimental study on flow characteristics and damage of rock riprap used in river bend. Port Waterw. Eng. 2017, 7. (In Chinese) [Google Scholar] [CrossRef]
  19. Han, L.; Wang, P.; Liu, H.; He, Q. Discriminatory analysis of rockfill groin’s safety based on water-destruction volumetric ratio. Eng. J. Wuhan Univ. 2014, 47, 201–206. (In Chinese) [Google Scholar]
  20. Yu, T.; Shi, H.; Wang, P.; Kong, D. Value-at-risk analysis of spur dikes based on range analysis. Eng. J. Wuhan Univ. 2020, 53, 7. (In Chinese) [Google Scholar] [CrossRef]
  21. Zhang, W.; Fang, Z.; Cai, Y. Safety reliability analysis for groyne erosion. Ocean Eng. 2005, 23, 8. (In Chinese) [Google Scholar] [CrossRef]
  22. Ma, A.; Wang, X.; Cai, G. Experimental Study on Structural Stability and Width Calculation of Flexible Mattress for Bottom Protection in Tidal Reach; Nanjing Hydraulic Research Institute: Nanjing, China, 2015. (In Chinese) [Google Scholar]
  23. Wang, W.; Li, Y.; Du, W.; Zeng, W.; Xu, Y. Tidal variation features of tidal reach of Changjiang River. Water Resour. Prot. 2017, 33, 121–124+132. (In Chinese) [Google Scholar]
  24. Shi, J.Z. Tidal resuspension and transport processes of fine sediment within the river plume in the partially-mixed Changjiang River estuary, China: A personal perspective. Geomorphology 2010, 121, 133–151. [Google Scholar] [CrossRef]
  25. USDA, Soil Survey Manual, USDA Agricultural Handbook No.18; U.S. Government Printing Office: Washington, WA, USA, 2017.
  26. Ettema, R.; Melville, B.W.; Barkdoll, B. Scale Effect in Pier-Scour Experiments. J. Hydraul. Eng. 1998, 124, 639–642. [Google Scholar] [CrossRef]
  27. Li, C.; Jin, D. River Model Test; China Communication Press: Beijing, China, 1981. (In Chinese) [Google Scholar]
  28. Dey, S. Turbulence in Open-Channel Flows. In Fluvial Hydrodynamics: Hydrodynamic and Sediment Transport Phenomena; Dey, S., Ed.; Springer: Berlin/Heidelberg, Germany, 2014; pp. 95–187. [Google Scholar]
  29. Tominaga, A.; Nezu, I.; Ezaki, K.; Nakagawa, H. Three-dimensional turbulent structure in straight open channel flows. J. Hydraul. Res. 1989, 27, 149–173. [Google Scholar] [CrossRef]
  30. Cao, M.; Wang, L.; Shen, X.; Ying, H.; Zhang, L. Analysis on features and difficulties during the construction process of deep water navigation channel project in the Yangtze River below Nanjing. Port Waterw. Eng. 2019, 1–8. (In Chinese) [Google Scholar] [CrossRef]
  31. Zhang, L.; Yang, Z.; Zhang, F.; Li, Z.; Wang, Y.; Gao, S. Longitudinal residual circulation in the South Passage of Yangtze Estuary: Combined influences from runoff, tide and bathymetry. Sci. China Earth Sci. 2021, 64, 2129–2143. [Google Scholar] [CrossRef]
  32. Kong, Y.; He, S.; Ding, P.; Hu, K. Characteristics of temporal and spatial variation of salinity and their indicating significance in the Changjiang Estuary. Acta Oceanol. Sin. 2004, 9–18. (In Chinese) [Google Scholar]
  33. Zhao, M.; Zhu, X.; Cheng, L.; Teng, B. Experimental study of local scour around subsea caissons in steady currents. Coast. Eng. 2012, 60, 30–40. [Google Scholar] [CrossRef]
  34. Valela, C.; Rennie, C.D.; Nistor, I. Improved bridge pier collar for reducing scour. Int. J. Sediment Res. 2022, 37, 37–46. [Google Scholar] [CrossRef]
Figure 1. Geographical location of tidal reach in the lower reaches of the Yangtze River. The numbers in brackets are distance downward to Datong.
Water 16 00438 g001
Figure 2. (a) Layout plan of flume (m), the grey area is the flexible mattress, the red symbol is the water level measuring point, and the blue symbol is the velocity measuring point; (b) cross-sectional view of flume (m), showing the elevation of movable bed and fixed bed in different zones. The green line indicates the location of each section: sections 1–3 are shown in the above figure, and section 4 is shown in Figure 3c.
Water 16 00438 g002
Figure 3. Structural model diagram of riprap spur dikes with flexible mattress bottom protection (cm). (a) Vertical view; (b) profile view; (c) cross-sectional view (section 4).
Water 16 00438 g003
Figure 4. Local scour around the submerged riprap spur dike with bottom protection (taking the first test as an example). (a) Condition 1: runoff 2.5 m/s; (b) condition 2: runoff−tidal current 2.5−1 m/s; (c) condition 3: runoff−tidal current 2.5−2 m/s.
Water 16 00438 g004aWater 16 00438 g004b
Figure 5. The relationship between the maximum scour depth elevation at dike head and its downstream side and their distances from the spur dike.
Water 16 00438 g005
Figure 6. Topography of dike axis section at the end of the test under various conditions (taking the first test as an example).
Water 16 00438 g006
Figure 7. Variation diagram of the elevation of the deepest point of the scour pit at the dike head and the vertical average velocity at the front of the dike head with the action time of water flow under different runoff and tide intensities (taking test 1 as an example).
Water 16 00438 g007
Figure 8. Variation of maximum scour depth (ds) at spur dike head and its downstream side with E under different conditions (abscissa axis is a common logarithmic coordinate).
Water 16 00438 g008
Figure 9. (a) Formula fitting of maximum scour depth at spur dike head; (b) formula fitting of maximum scour depth at spur dike head relative to spur dike toe slope. (c) Formula fitting of maximum scour depth at spur dike downstream side; (d) formula fitting of maximum scour depth at spur dike downstream side relative to spur dike toe slope [22].
Water 16 00438 g009
Figure 10. Schematic diagram of spur dike instability and damage.
Water 16 00438 g010
Table 1. Model scale.
Scale NameSymbolValueScale NameSymbolValue
Horizontal scale   λ L 40Flow movement time scale   λ t 1 6.325
Vertical scale   λ h 40Weight scale   λ W 64,000
Velocity scale   λ u 6.325Incipient velocity scale   λ u c 6.28
Flow scale   λ Q 10,119Sediment transport rate scale   λ Q s 11.08
Roughness scale   λ n 1.849Scouring and silting time scale   λ t 2 335
Table 2. Test conditions.
ConditionsMaximum
Ebb Velocity
(m/s)
Maximum
Flood Tide Velocity
(m/s)
Highest
Tide Level
(m)
Lowest
Tidal Level
(m)
Duration of
Flood Tide
(h)
Duration of
Ebb Tide
(h)
Test
Duration
(h)
P 1MPMPMPMPMPM
12.50.400100.25100.25////3.5
22.50.410.16110.27590.22540.6381.266
32.50.420.32120.380.240.6381.266
Note(s): 1 “P” means prototype, and “M” means model.
Table 3. E and maximum scour depth ds at dike head and its downstream side.
ConditionsEMaximum Scour Depth ds (m)
Test1Test2Proportion in
Condition 1
Spur Dike HeadDownstream SideProportion in
Condition 1
Test1Test2Test1Test2
Condition 10.410.39/0.1120.1030.1520.158/
Condition 20.190.246–51%0.0950.0920.1300.12579–89%
Condition 30.090.0922–23%0.0720.0650.1150.10363–76%
Table 4. Measured results of five spur dikes in the Dongliu waterway regulation project in the lower reaches of the Yangtze River.
ProjectSpur Dike D2#Spur Dike D3#Spur Dike F1#Spur Dike F2#Spur Dike F3#
Spur dike head water depth (m)99101010
Spur dike head height (m)7.598.795.895.356.37
Spur dike head velocity (m/s)2.52.5333
Median grain size of bed sediment (mm)0.140.140.140.140.14
Design width of flexible mattress (m)8080100100100
Actual scour pit depth (m)6.15.54.85.56
Calculated scour pit depth (m)5.617.154.33.664.9
Disclaimer/Publisher’s Note: The statements, opinions and data contained in all publications are solely those of the individual author(s) and contributor(s) and not of MDPI and/or the editor(s). MDPI and/or the editor(s) disclaim responsibility for any injury to people or property resulting from any ideas, methods, instructions or products referred to in the content.