Article

Numerical Simulation of the Marine Environmental Capacity of Jinpu Bay

1
National Marine Environmental Monitoring Center, Dalian 116023, China
2
State Key Laboratory of Coastal and Offshore Engineering, Dalian University of Technology, Dalian 116023, China
3
Key Laboratory of Marine Spatial Resource Management Technology, Ministry of Natural Resources, Hangzhou 310012, China
*
Authors to whom correspondence should be addressed.
These authors contributed equally to this work.
Water 2024, 16(3), 404; https://doi.org/10.3390/w16030404
Submission received: 27 November 2023 / Revised: 22 January 2024 / Accepted: 23 January 2024 / Published: 25 January 2024
(This article belongs to the Special Issue Emerging Challenges in Ocean Engineering and Environmental Effects)

Abstract

:
Based on the study of the marine environmental capacity, a water quality model and a response field-based linear programming method are adopted here. Water quality control objectives are taken as the constraint conditions, according to the requirements of Jinpu Bay’s functional zoning. The pollutant response coefficient and water quality background value are combined with the values of the water concentration quality control points set in each functional area and the target value of the functional area wherein they are located. The maximum allowable emission intensity of inorganic nitrogen, phosphate and chemical oxygen demand (COD) can be calculated using the linear programming method of the maximum allowable emission of pollutants at estuaries or sewage outfall points on Jinpu Bay. The research results reveal the diffusion of marine pollutants and the marine environmental capacity of Jinpu Bay. Some rivers need to reduce the discharge intensity and some other outlets still have a certain residual capacity. Based on this, the environmental capacity of Jinpu Bay was evaluated, and a technical reference is provided for the economic development of the region and the formulation of pollutant emission control policies.

1. Introduction

According to the definition of GESAMP (Joint Group of Experts on the Scientific Aspects of Marine Environmental Protection) and taking into account the objective natural and subjective man-made attributes of environmental capacity, marine environmental capacity is defined as follows: Marine environmental capacity refers to the maximum amount of pollutants that can be contained in a specific sea area within a certain time range under the conditions of maintaining the national seawater quality standards required by the specific oceanographic and ecological functions of the target area [1].
In recent years, due to the rapid growth of urban populations, along with the rapid development of coastal and harbor industries and coastal mariculture, the loading of pollutants such as nitrogen, phosphorus and chemical oxygen demand (COD) into the sea has increased continuously, and marine ecological disasters, such as red tides, have occasionally occurred. In view of the important role played by coastal zones in the world’s social and economic development, especially with their rapid social and economic development, the globalization of marine ecological environment problems in offshore waters has gradually become prominent, and countries that depend on their coastlines have carried out studies on the marine environmental capacities of pollutants [2,3,4,5,6,7,8,9,10]. A specific method to study the environmental capacity of Kastela Bay in Yugoslavia has been proposed [11]. The environmental capacity of Osaka Bay in Japan has also been studied [12]. The mechanism and influencing factors of photochemical oxidation activation products on the free radical self-purification process in natural water has been discussed [13]. The environmental capacity of mercury in the seawater of Haifa Bay has been calculated [14]. Simulation exercises have been used to estimate the self-purification capacity of organic matter in natural water bodies [15]. Research on China’s marine environmental capacity began in the 1980s, when the State Oceanic Administration organized and carried out research projects on the environmental capacity of pollutants in offshore waters, such as Dalian Bay, Jiaozhou Bay and the Pearl River estuary [16,17,18,19,20,21,22,23]. In recent years, research has focused on some integrated models [24,25,26,27,28,29]. An integrated system of semi-enclosed bays has been built, and SECAMECC includes a database of seven data sets and four models: 3D fluid dynamics, ecology, residence time estimation and MECC calculation [30]. The marine environmental capacity of the northern sea area of Jiangsu Province has been numerically simulated based on the three-dimensional water quality model of FVCOM [31].
Located in Liaoning Province, China, Jinpu Bay is a semi-enclosed bay within the Bohai Sea. The urban function of Jinpu Bay positions it as a new type of comprehensive urban area, a shipping center, a manufacturing and high-tech industrial base, a regional financial center and a commercial center. In order to further study the marine environmental capacity of Jinpu Bay, this study adopts the water quality model and the linear programming method based on the response field. According to the requirements related to the functional zoning of Jinpu Bay, the maximum allowable discharge of the main estuaries or sewage outfalls along the coast of the bay have been calculated numerically, taking the water quality control objectives as the constraint conditions. Based on this, the environmental capacity of the marine area of Jinpu Bay can be evaluated, and a technical reference can be provided for the economic development of the region and the formulation of pollutant emission-control policies [32].

2. Materials and Methods

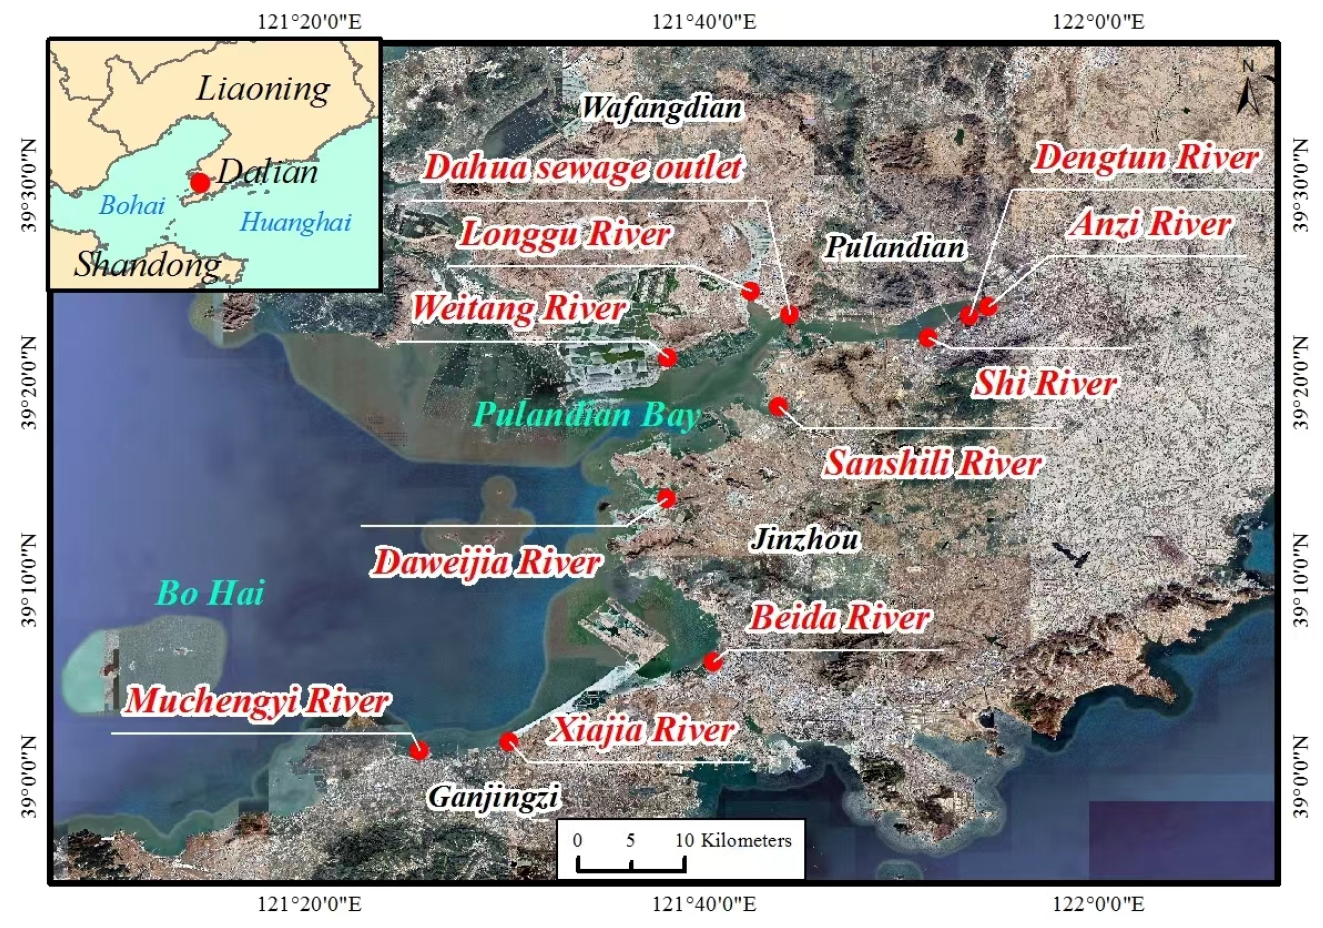
2.1. Overview of the Study Area

Dalian Jinpu Bay is located in the south of Liaoning Province, China. It is a semi-enclosed bay within the Bohai Sea. It is composed of Jinzhou Bay and Pulandian Bay, and covers an area of about 1300 km2 [33]. There are many islands in the bay; the coastline is very dangerous for human activity, and the water depth is predominantly less than 20 m. The trend of the isobath line is basically the same as that of the coastline, except that the terrain slope within the bay is small on both sides of the mouth.
The water body volume of Jinpu Bay is relatively large; the bay comprises Jinzhou Bay and Pulandian Bay, which each have a distinct dilution capacity. However, the environmental capacity of the water body can only be utilized when pollutants are transported and diffused. Regarding Pulandian Bay, the topography is narrow and long, the landform is complex and pollutants are, thus, relatively difficult to transport. Regarding Jinzhou Bay, which is adjacent to the outer sea-facing side of Liaodong Bay, the water area is also relatively open and the seawater flow is relatively good, meaning that the water capacity of the bay still has scope for utilization.

2.2. Research Methods

The marine environmental capacity of the bay refers to the amount of pollutants that the water body can hold under a specified environmental target. In this study, the two-dimensional numerical model MIKE21FM developed by the Danish Institute of Hydraulics is adopted. The water quality model and response field-based linear programming method were used to calculate the maximum allowable discharge of the main estuaries or sewage outfalls along the coast of Jinpu Bay, according to the requirements of the functional zoning of Jinpu Bay and the water quality control objective taken as the constraint condition.
In a certain hydrodynamic environment, the pollutant diffusion equation can be regarded as linear and the superposition principle can be satisfied under given boundary conditions. The concentration field formed by pollutants imported from outside the bay is taken as the background field, denoted as Cb(x, y). There are n point sources in the bay; the source strength of the i point source is Si, and the equilibrium concentration field formed by diffusion is denoted as Ci(x, y). As such, the concentration field in the bay can be expressed as
C x , y = C b x , y + i = 1 n   C i x , y .  
The equilibrium concentration field formed by the i-th point source is recorded in the form of a linear response relationship between Ci(x, y) and the source intensity, which gives
  C i x , y = P i x , y S i .  
In the above formula, Pi(x, y) is the response coefficient, which is related to dynamic conditions, terrain, etc. The response coefficient Pi is equal to the equilibrium concentration field formed by the unit source strength.
C0 is set as the concentration value of a certain pollutant under the condition of meeting the water quality control target (that is, the water quality target). In the case of n point sources, if the water quality concentration is to adhere to the control standard, it should be
C b ( x , y ) + i = 1 n   P i ( x , y ) S i C 0
Regarding the background concentration field, its distribution is generally relatively uniform, and non-point sources are difficult to control. The control of pollutant emissions generally involves the control of point-source emissions. The characteristics of pollutant diffusion indicate that, when the water in the pollutant discharge point meets the water quality requirements, these requirements can be met in the whole water area. Given that the response coefficient of the unit emission intensity of the j-th pollutant at the i-th pollution source is Pij, the calculation of the maximum allowable emission of the point source in the bay can be expressed as a linear programming problem as follows:
Objective   function   i = 1 n S i m a x ;
Constraint   C b j + i = 1 n P i j ( x , y ) S i   C 0 i .  
Here, Si ≥ 0, i = 1, 2, …, and Cbi and C0 represent the background concentration value and the water quality target value at the i-th point source, respectively.

3. Results

3.1. Division of Marine Functional Zones and Water Quality Control Objectives in Jinpu Bay

3.1.1. Determination of Pollution Factors

In the estimation of marine environmental capacity, the key pollutants stipulated by the state and local governments, the characteristic pollutants that may be produced in the planned area and the pollutants to which the receiving sea area is most sensitive should be considered. The urban function of Jinpu Bay in Dalian positions it as a comprehensive new urban area, shipping center, manufacturing and high-tech industrial base, regional financial center and business center. The main pollutants that enter the sea area are in the discharge from the sewage treatment plant, so the pollution factors considered in the environmental capacity analysis of seawater are mainly inorganic nitrogen, phosphate and chemical oxygen demand (COD). Jinpu Bay, the calculation domain in this numerical study, comprises a total of 11 major rivers and sewage outlets from Dahua. According to the actual distribution status of the current topography of the coastline of Jinpu Bay, the specific locations of estuaries and sewage outfalls are shown in Figure 1, and the current emission concentration values of pollutants monitored in 2013 at each estuary and sewage outfall are shown in Table 1. It should be noted that, due to data limitations, the emission concentration values of inorganic nitrogen, phosphate and COD at the Wushili estuary have not been obtained, nor have the emission concentration values of COD at the Xiajia and Muchengyi estuaries been obtained. We refer to the emission concentration values of COD at the other 10 estuaries and the Dahua sewage discharge outlets in this study. The COD emission concentration values of the Xiajia estuary and the Muchengyi estuary are both 65 mg/L.

3.1.2. Setting the Location of Monitoring Points for Measuring Water Quality in Zones

According to the Marine Function Zoning of Liaoning Province (2011–2020) and the Dalian Coastal Sea Function Zoning Map that was adjusted in 2006, 13 water quality control points were set at the water quality dividing lines of different functional zones near estuaries and sewage outlets to ensure the control of the standard. Water quality is divided into four levels of standard, which are I, II, III and IV. Specifically, points 1 and 2 were allocated in the middle of Pulandian Bay. In the boundary area between the inner bay and outer bay of Pulandian Bay, where the Dahua sewage outlet is located, point 3 was set in the middle waters of the outer bay of Puwan, that is, in the waters near Qidingshan; point 4 and point 5 were located in the waters where the mouth of Pulandian Bay meets Jinzhou Bay; point 6 and point 7 were located in the eastern waters of Jinzhou Bay; point 8, point 9 and point 10 were set in the southeastern and southern waters of Jinzhou Bay; and point 11 was set in the central waters of Jinzhou Bay. Point 12 was located in the northern sea area of Jinzhou Bay, and point 4, point 6, point 7, point 10 and point 11 were distributed within the sea area of the harbor seal reserve and have high water quality requirements. The division of functional zones and the positions of each water quality control point are shown in Figure 2. The water quality statistics of the functional areas to which each water quality control point belongs are shown in Table 2.

3.2. Calculation of the Marine Environmental Capacity of Jinpu Bay

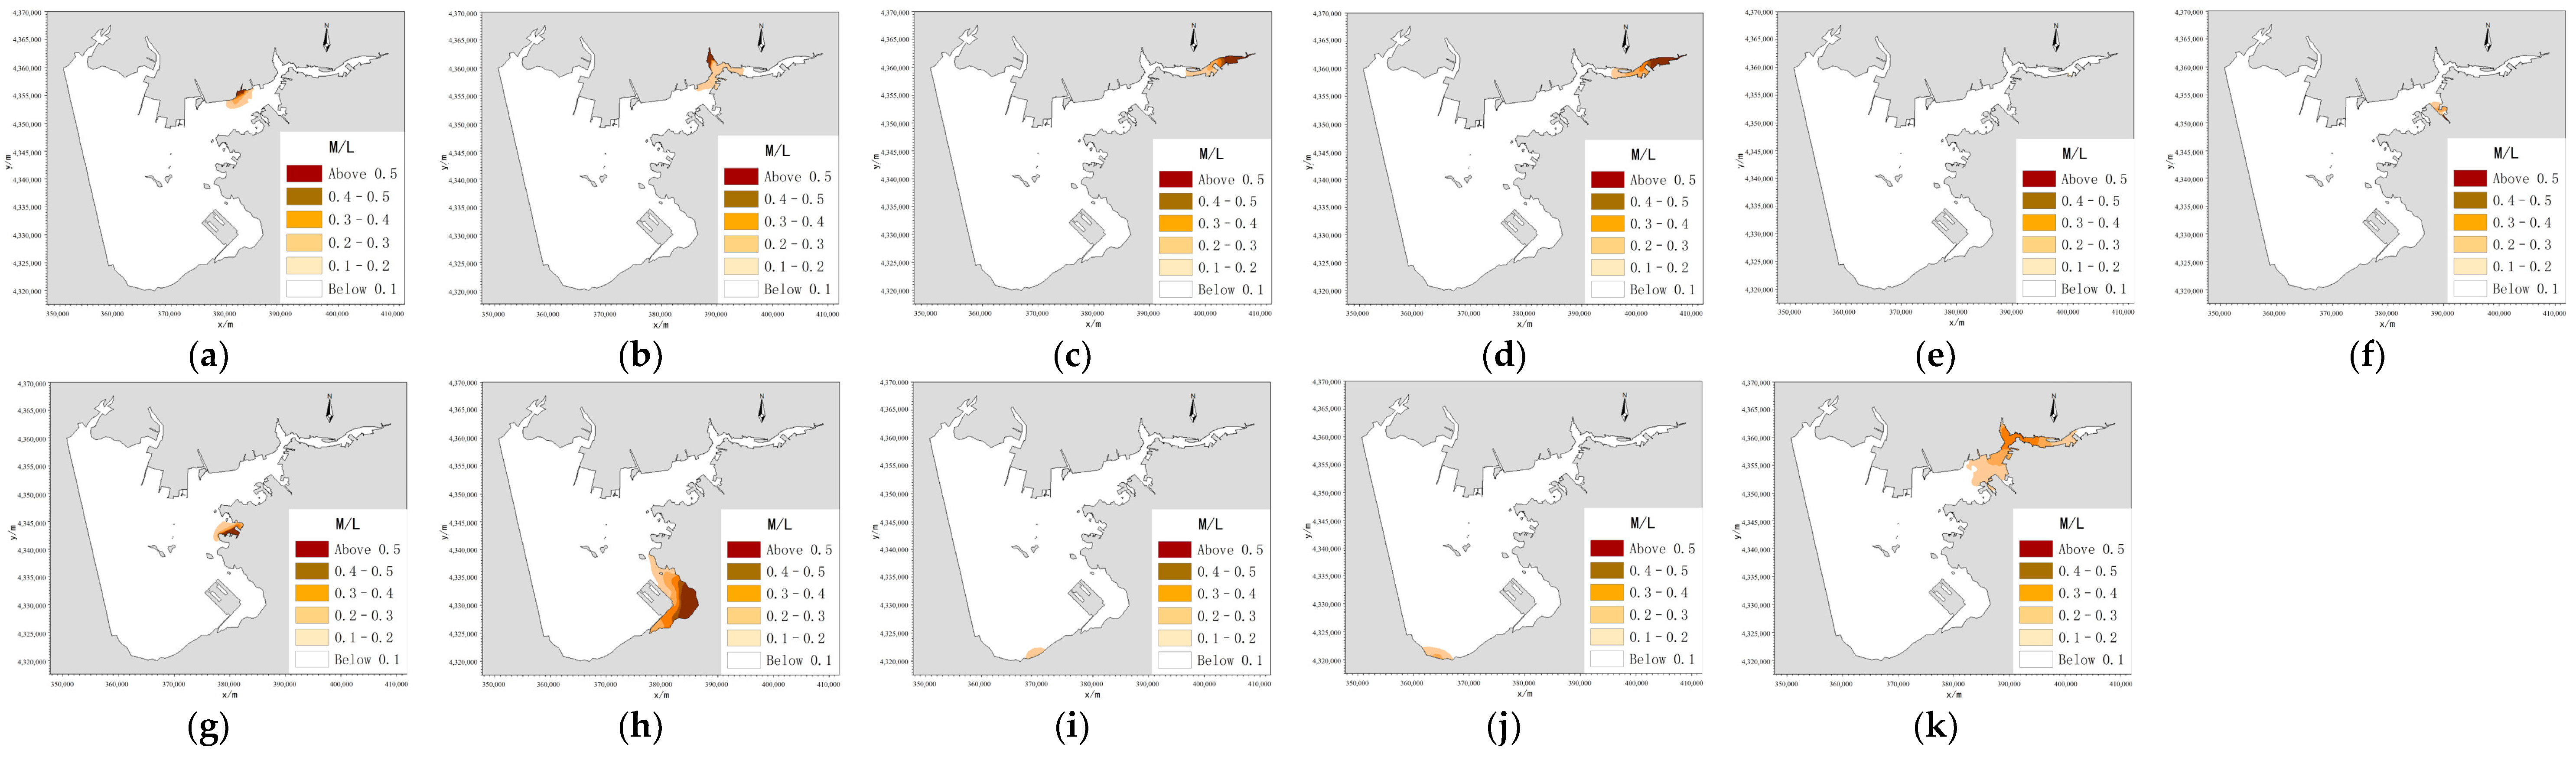
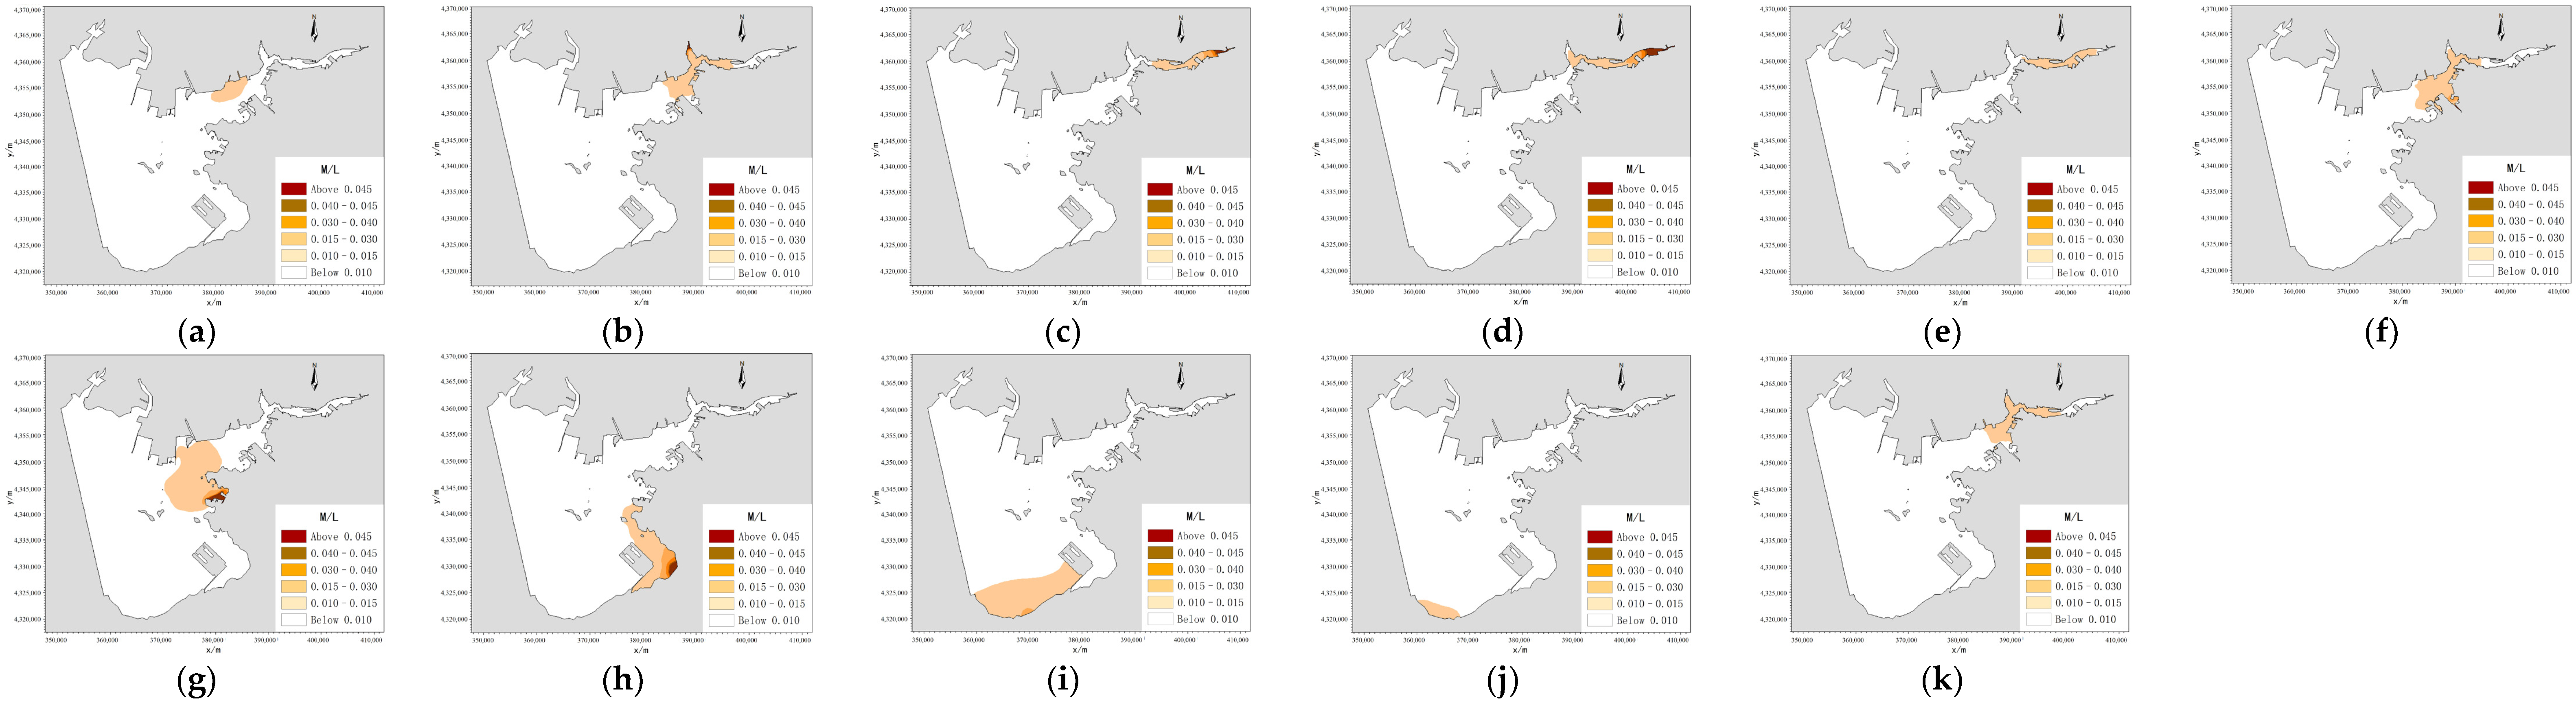
3.2.1. Calculation of Pollution Response Coefficient

Based on the hydrodynamic status of Jinpu Bay, the background values of pollutants in Jinpu Bay and the discharge flux of pollutants in the estuary and the discharge outlet, the stable concentration field of pollutants in Jinpu Bay is obtained using numerical simulation. The response coefficients of the divided sea area to the pollution coming from each estuary or discharge outlet can be obtained by dividing the concentration value by the emission intensity of pollutants at each estuary or discharge outlet. The response coefficient can be used to reflect the contribution of the discharge status of estuaries or sewage outlets to the marine environment to a certain extent.
Figure 3 and Figure 4, respectively, show the annual mean concentration fields of total nitrogen emissions in the sea area of Jinpu Bay and the independent annual mean concentration fields of total nitrogen emissions from estuaries or sewage outlets. Figure 5 and Figure 6, respectively, show the results of the numerical simulation of the annual average concentration field of total phosphorus emissions in the Jinpu Bay sea area and the independent annual average concentration field of total phosphorus emissions in each estuary or sewage outlet. Figure 7 and Figure 8, respectively, show the annual mean concentration fields of total nitrogen emissions in the sea area of Jinpu Bay and the independent annual mean concentration fields of total nitrogen emissions in each estuary or sewage outlet. According to the numerical results of the annual average concentration field of each pollutant, combined with the discharge flux of each pollutant at each estuary or sewage outlet, the response coefficients of each pollutant can be obtained. The response coefficients of various pollutants in this numerical simulation are shown in Table 3, Table 4 and Table 5.

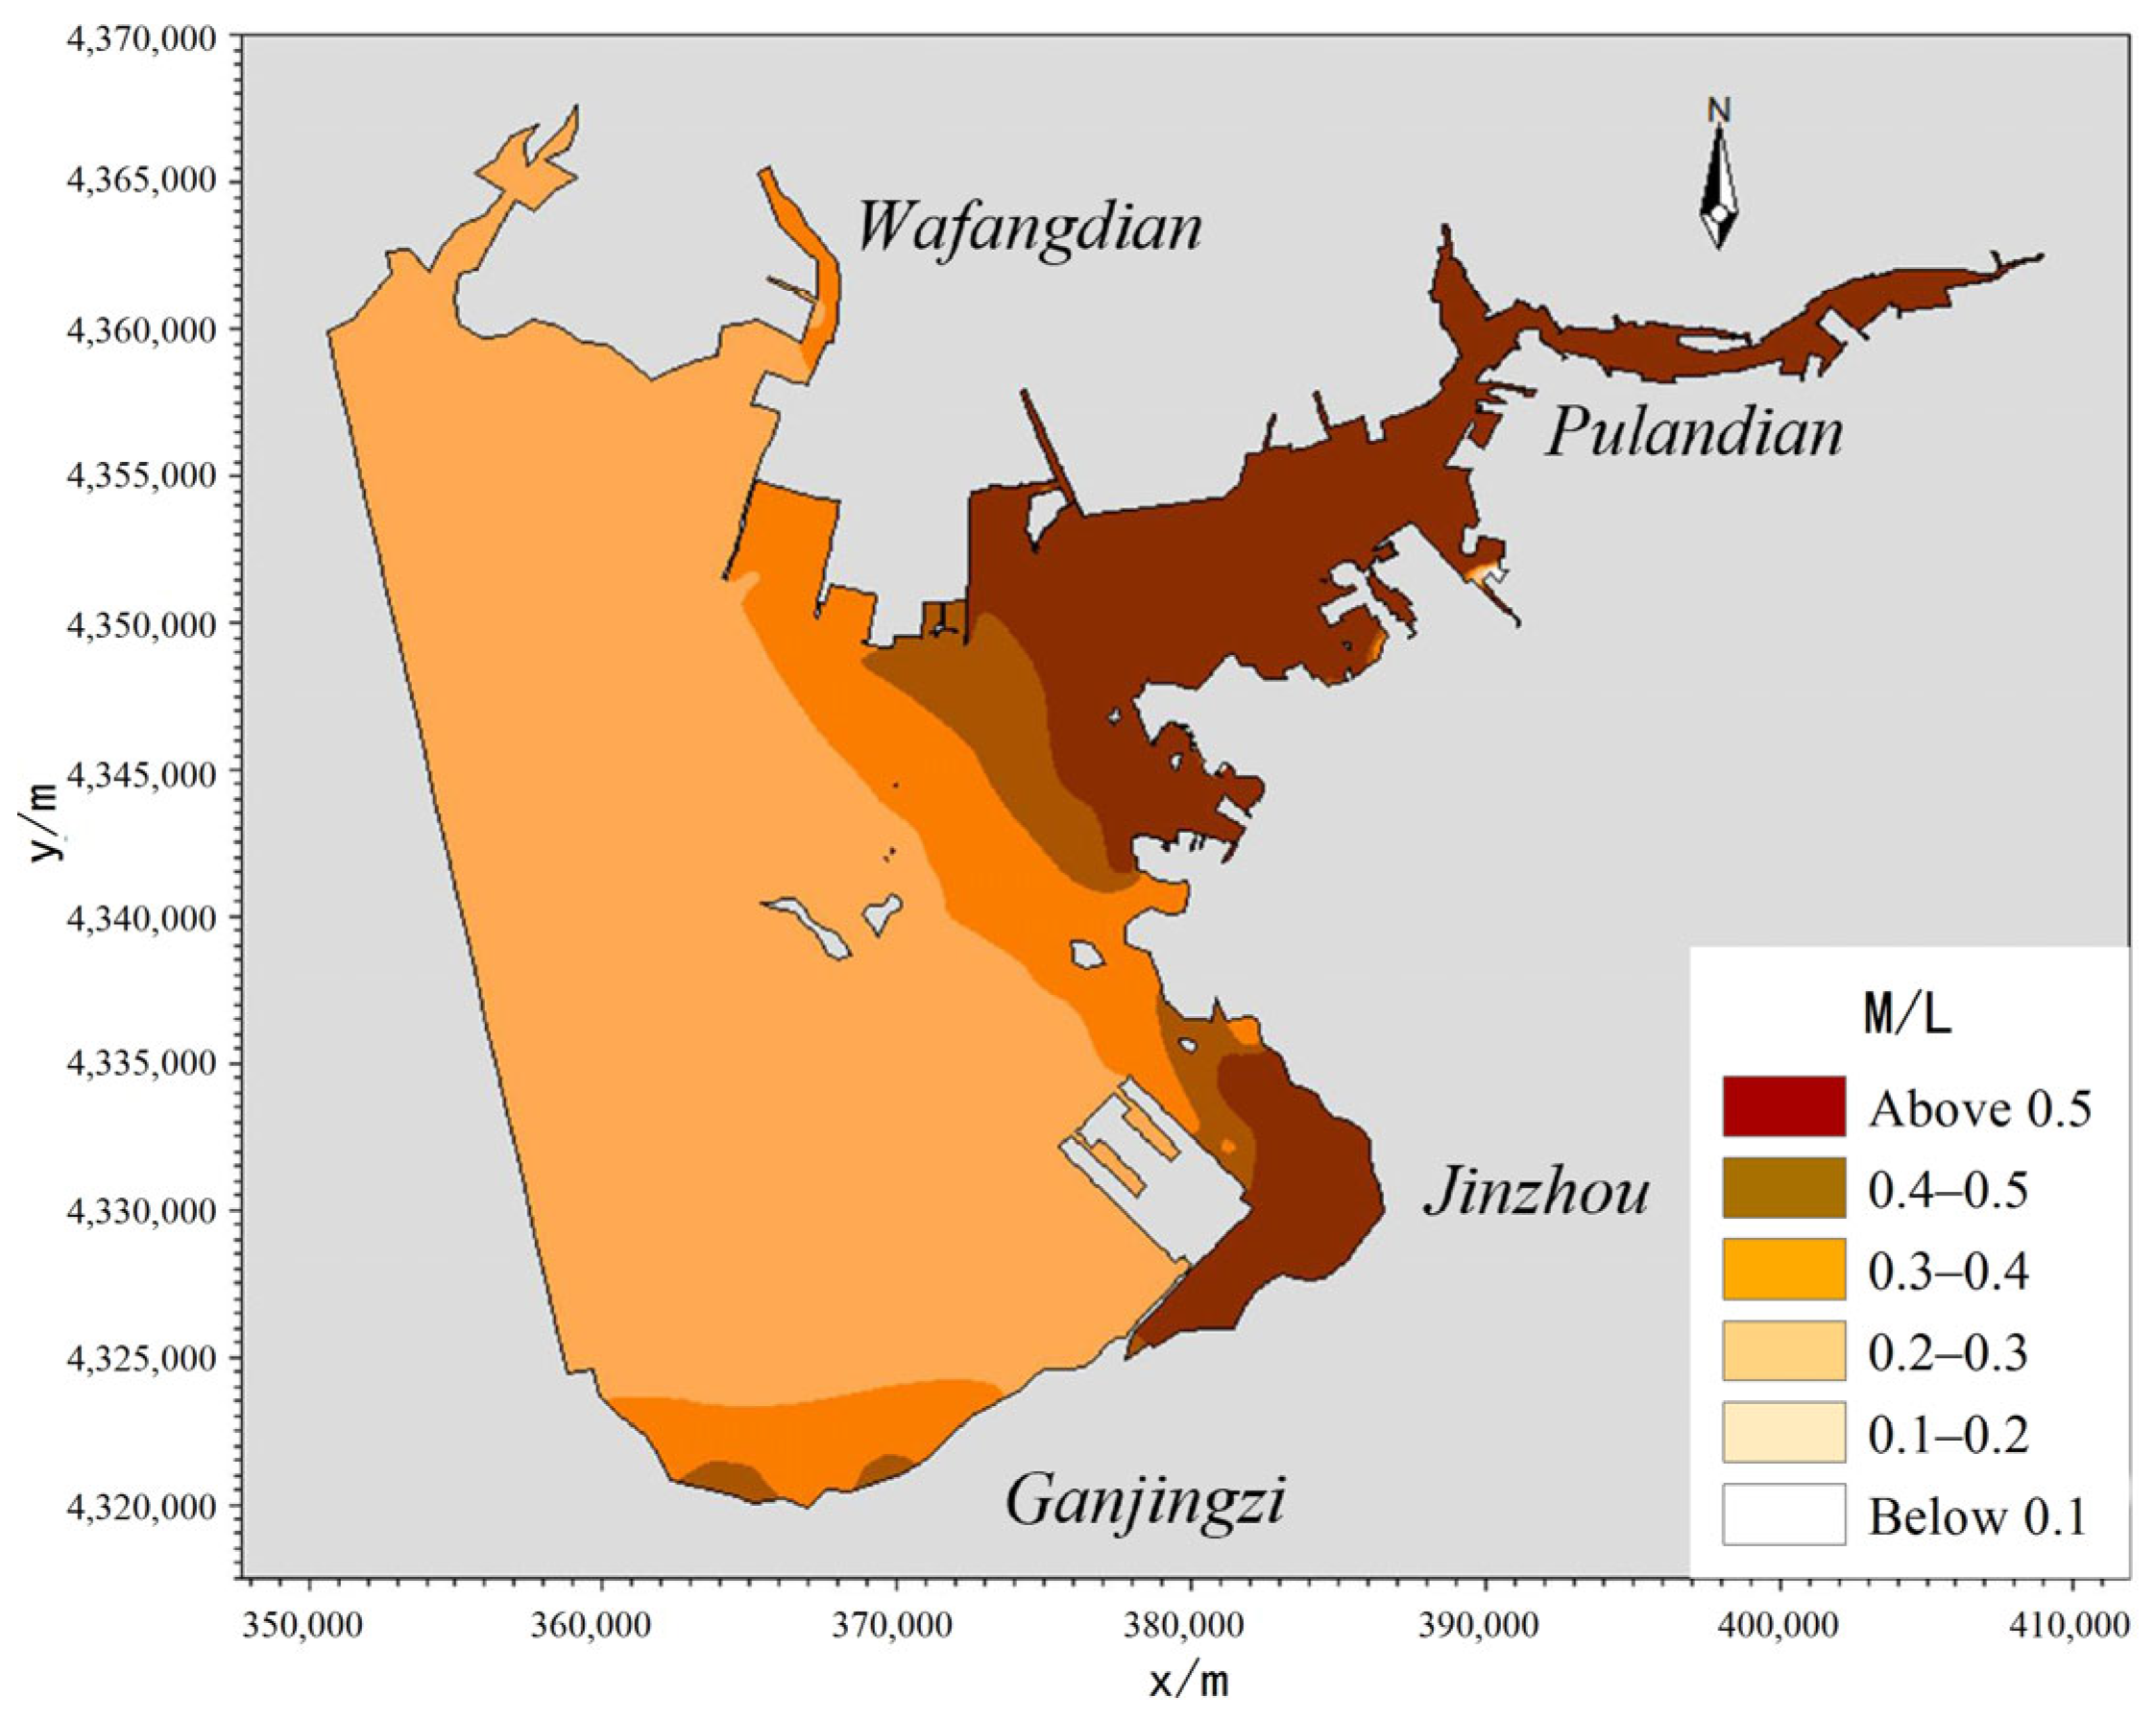
3.2.2. Calculation Results of Marine Environmental Capacity

According to the pollutant response coefficient and the water quality background value, further combined with the concentration values of the water quality control points obtained from each functional area and their target values, the maximum allowable emission intensities of inorganic nitrogen, phosphate and COD at each estuary or sewage outlet can be calculated using the linear programming method.
Table 6 outlines the current emission intensity of estuaries and sewage outfalls in Jinpu Bay based on existing data, and Table 7 shows the allowable emission intensity of estuaries and sewage outfalls obtained via numerical simulation. As shown in the table, under the current situation, the total nitrogen emission intensity of Jinpu Bay is about 11.5 t/d, the total phosphorus emission intensity is about 0.4 t/d and the COD emission intensity is about 90.3 t/d. Under standard discharge, the allowable emission intensities of total nitrogen, total phosphorus and COD in Jinpu Bay are about 9.3 t/d, 0.5 t/d and 138.8 t/d. The numerical results show that the total nitrogen emissions in Jinpu Bay exceed the standard, and its emission intensity should be reduced by 2.2t/d. Regarding the total phosphorus and COD emissions in Jinpu Bay, the remaining capacity means the total phosphorus emission intensity can be increased by about 0.1 t/d, and the COD emission intensity can be increased by about 48.5 t/d.

4. Discussion

Figure 9, Figure 10 and Figure 11, respectively, show a contrast histogram between the current emission intensity and the allowable emission intensity of total nitrogen, total phosphorus and COD at the estuaries and sewage outlets of Jinpu Bay. Blue depicts the current emission intensity of the estuary or sewage outlet, red depicts the emission intensity at the estuary or sewage outlet that needs to be reduced under standard discharge and green depicts the emission intensity at the estuary or sewage outlet that can be increased under standard discharge. As shown in the figure, in terms of total nitrogen emissions, the Weitang River, Laogu River, Dengtun River, Anzi River, Shihe River, Sanshili River and the Dahua outlet need to reduce their emission intensities, while the Daweijia River, Beida River, Xiajia River and Muchengyi River still have some residual capacity. In terms of total phosphorus discharge, the Laogu River, Dengtun River, Anzi River, Shihe River, Sanshili River and the Dahua outlet need to reduce their discharge intensities, while the Weitang River, Daweijia River, Beida River, Xiajia River and Muchengyi River still have some residual capacity. In terms of COD discharge, aside from the need to reduce the discharge intensity at Shihe River, the other rivers and the Dahua sewage discharge outlet still have a certain residual capacity. The specific allowable emission intensity of each estuary or outlet can be seen in Table 7.
The industrial and marine aquaculture industries in Jinpu Bay are relatively concentrated, causing significant pressure on the capacity of the marine environment. The two-dimensional numerical model MIKE21FM is adopted. The numerical model predicted pollutant concentration and revealed the diffusion of pollutants. The model has shown good performance in the evaluation of sediment transport in the Naiband Gulf Area and the diffusion source of the Bai River [34,35].
The pollution factors are inorganic nitrogen, phosphate and chemical oxygen demand (COD), which reflect the pollution situation of Jinpu Bay. Some other pollution factors such as petroleum hydrocarbons can be considered [31], which can provide a more comprehensive display of the pollution situation. Due to limited measured data, we only verified the tide level. In future work, we will improve the accuracy of the model’s calculation of environmental capacity by obtaining more measured data for the validation of pollution factors.
The research results reveal the diffusion of marine pollutants and the marine environmental capacity of Jinpu Bay. Some rivers need to reduce the discharge intensity and some other outlets still have a certain residual capacity. According to the calculation of the pollution response coefficient and the marine environmental capacity, the emission amount of the sewage outlet can be controlled. A technical reference is provided for the economic development of the region and the formulation of pollutant emission control policies. In the subsequent work, the layout of the sewage outlets can be optimized, and a total discharge control plan can be proposed [32].

5. Conclusions

(1)
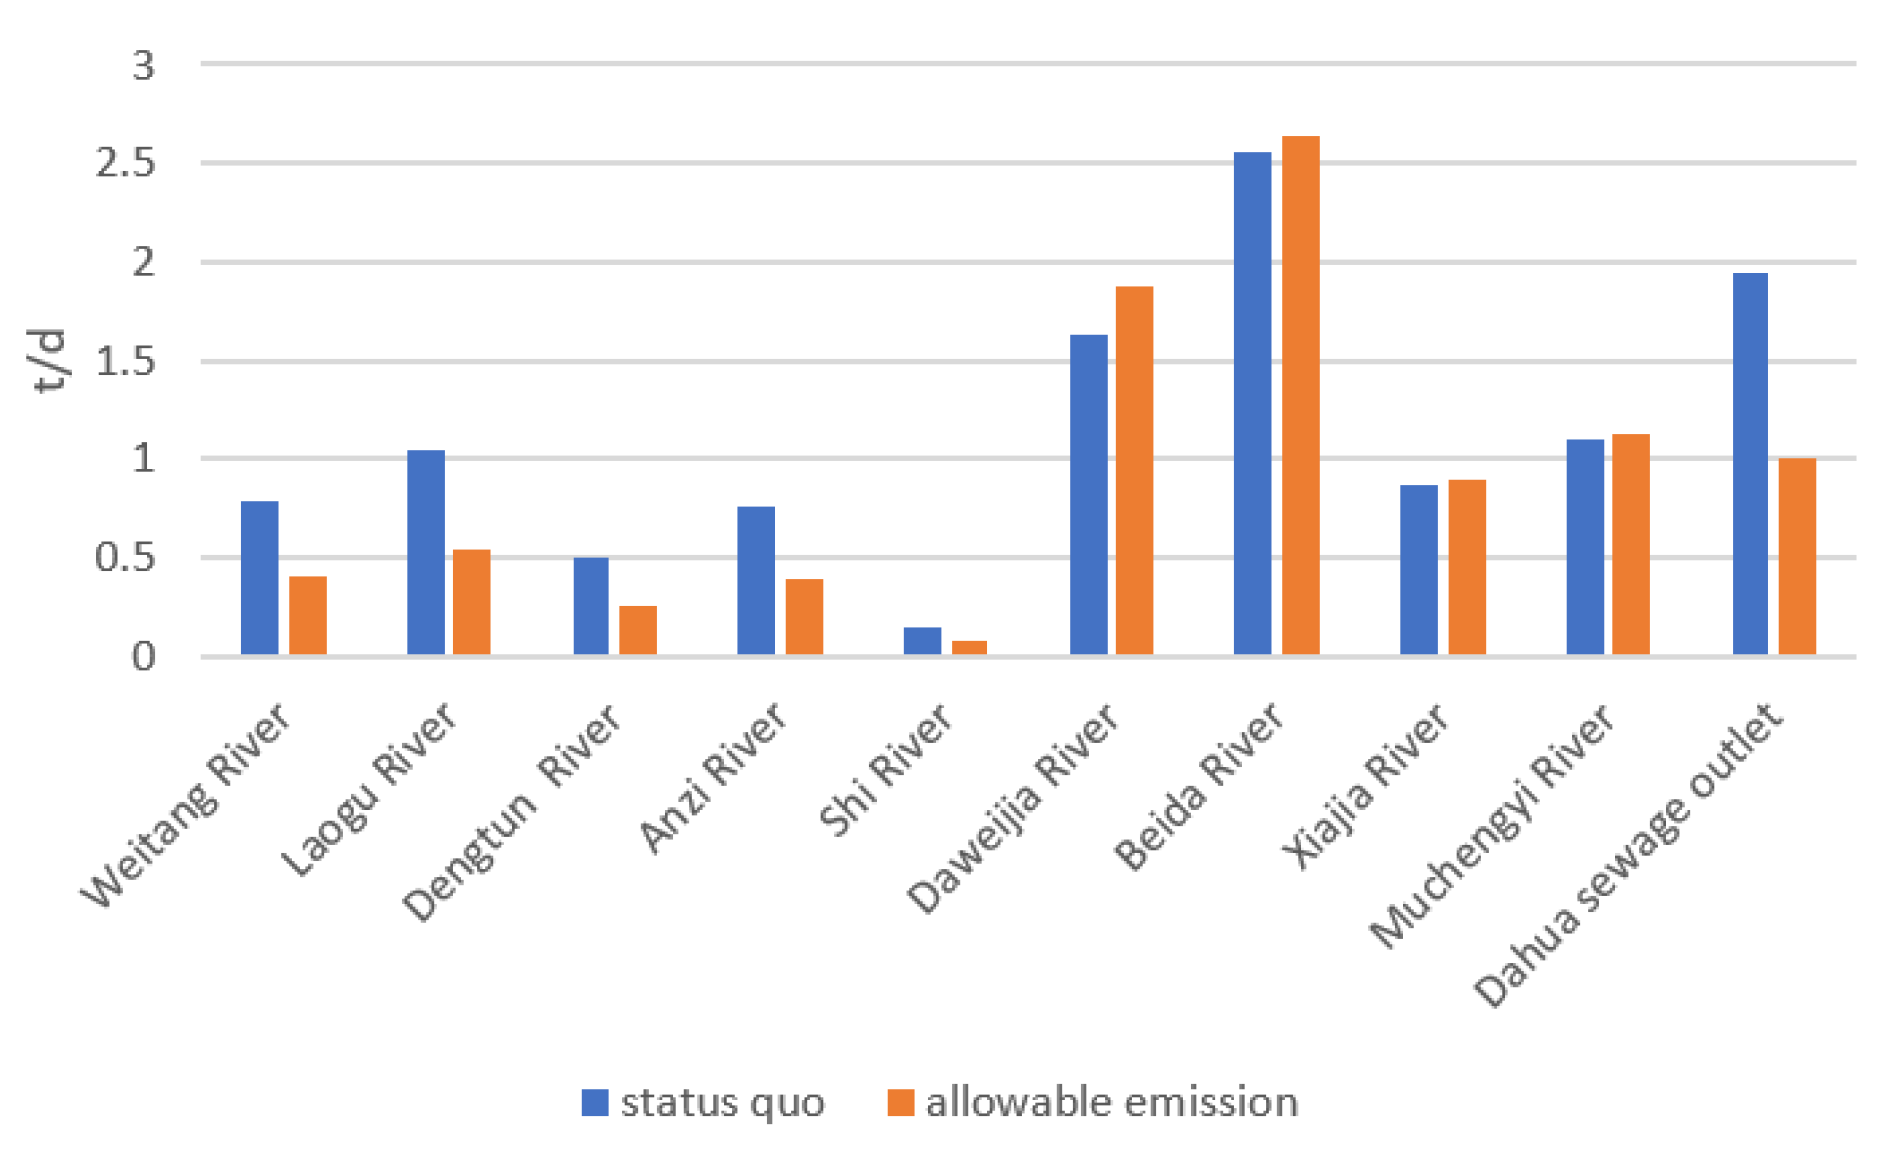
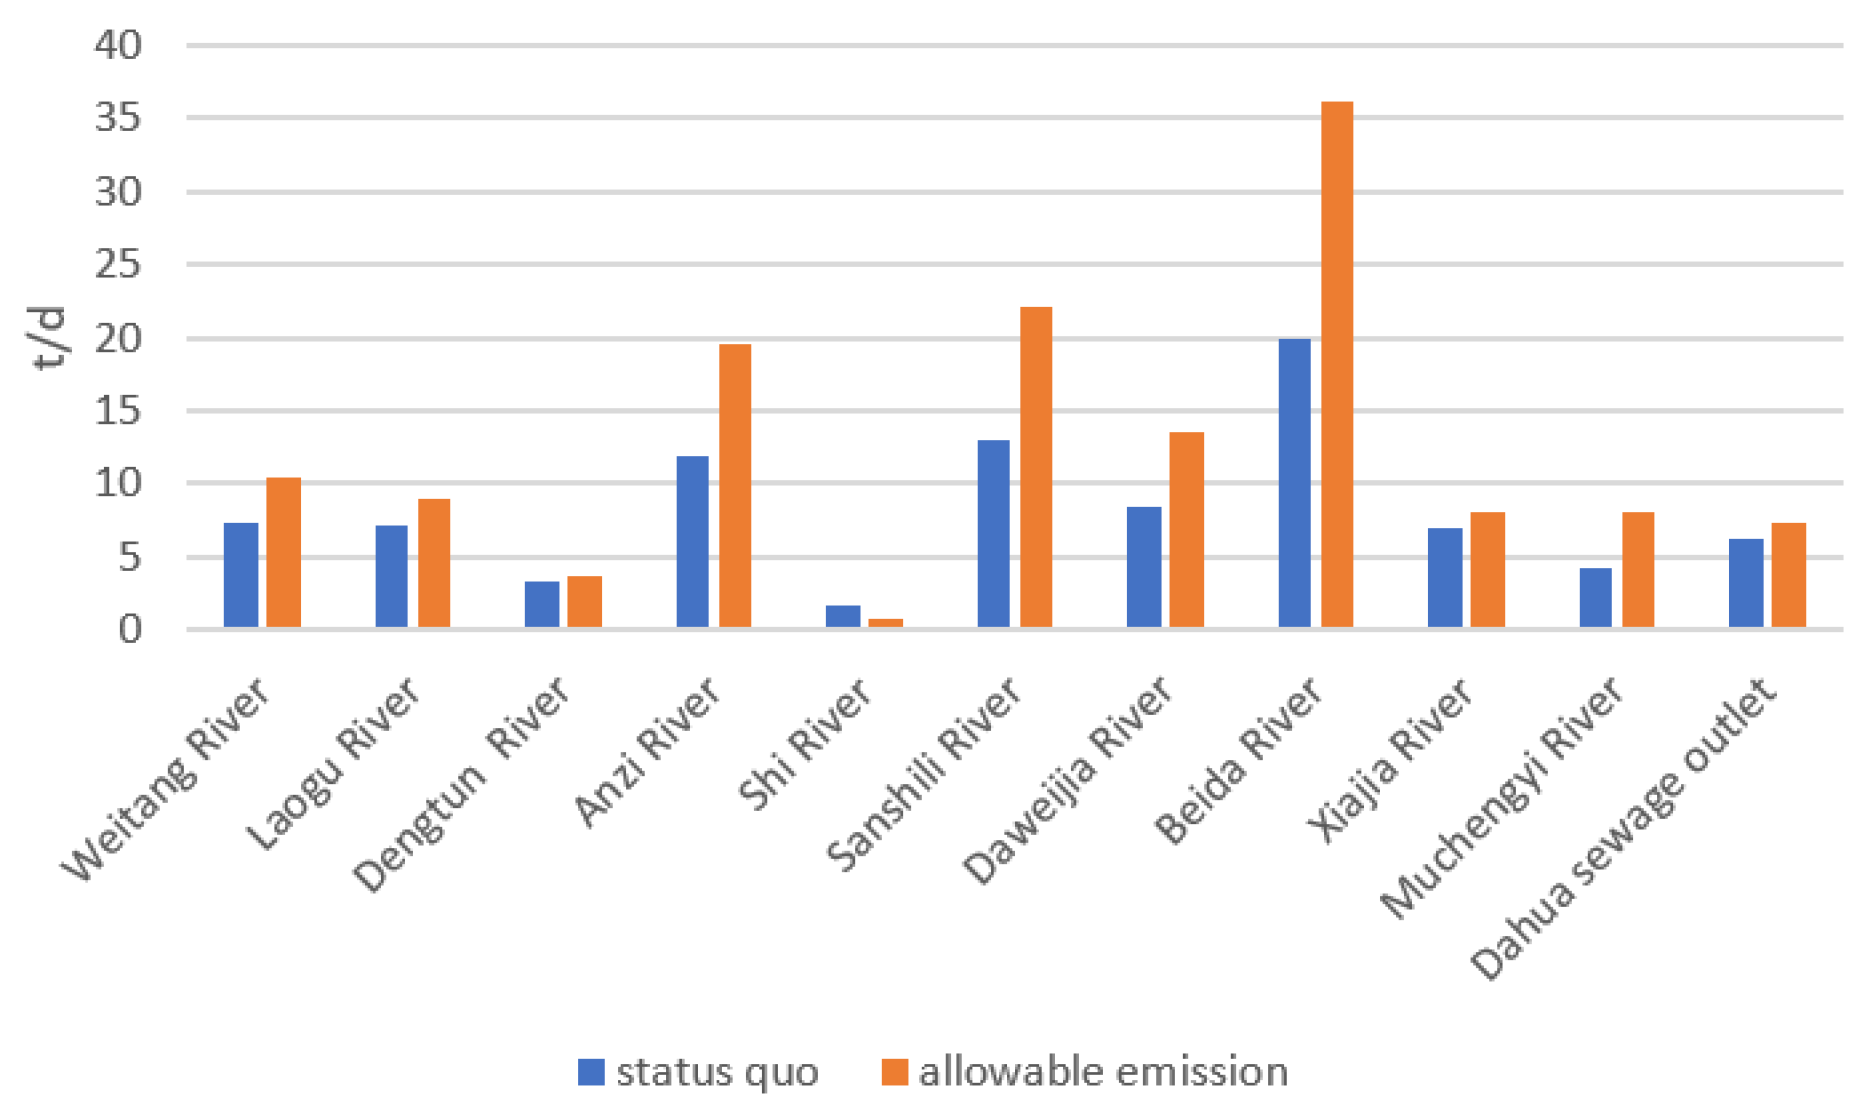
In the current context, the total nitrogen emission intensity of Jinpu Bay is about 11.5 t/d, the total phosphorus emission intensity is about 0.4 t/d and the COD emission intensity is about 90.3 t/d. Under standard discharge, the allowable emission intensity values of total nitrogen, total phosphorus and COD in Jinpu Bay are about 9.3 t/d, 0.5 t/d and 138.8 t/d. The numerical results show that the total nitrogen emissions in Jinpu Bay exceed the standard, and its emission intensity should be reduced by 2.2 t/d. Regarding the total phosphorus and COD emissions in Jinpu Bay, the remaining capacity demonstrates that the total phosphorus emission intensity can be increased by about 0.1 t/d, and the COD emission intensity can be increased by about 48.5 t/d;
(2)
In terms of total nitrogen emissions, the Weitang River, Laogu River, Dengtun River, Anzi River, Shihe River, Sanshili River and the Dahua sewage outlet need to reduce their emission intensities, while the Daweijia River, Beida River, Xiajia River and Muchengyi River still have some residual capacity. In terms of total phosphorus discharge, the Laogu River, Dengtun River, Anzi River, Shihe River, Sanshili River and the Dahua outlet need to reduce their discharge intensities, while the Weitang River, Daweijia River, Beida River, Xiajia River and Muchengyi River still have some residual capacity. In terms of COD discharge, aside from the need to reduce the discharge intensity at Shihe River, the other rivers and the Dahua sewage discharge outlet still have a certain residual capacity;
(3)
The research results can not only reveal the diffusion of marine pollutants and the marine environmental capacity of Jinpu Bay, but also a technical reference is provided for the economic development of the region and the formulation of pollutant emission control policies.

Author Contributions

Conceptualization, Y.H. and L.C.; methodology, L.C.; software, Y.H. and H.J.; validation, L.C., H.J. and Y.H.; formal analysis, J.Y.; investigation, P.Z. and J.H.; data curation, Y.H.; writing—original draft preparation, Y.H. and L.C.; writing—review and editing, L.C., H.J. and Y.H.; visualization, J.Y.; supervision, H.J.; project administration, Y.H. and L.C.; funding acquisition, J.Y. and H.J. All authors have read and agreed to the published version of the manuscript.

Funding

This work was supported by the National Nature Science Foundation of China (51879028; U21A20155), the State Environmental Protection Key Laboratory of Marine Ecosystem Restoration Fund Project (Grant No. 2023-07) and the Ministry of Natural Resources Key Laboratory of Marine Spatial Resource Management Technology Fund Project (No. KF2021101).

Data Availability Statement

Data are contained within the article.

Acknowledgments

Thanks to the hard work of the experimental researchers, we obtained detailed model verification data. Thanks to the great support and cooperation of the writing and research checkers, the numerical simulation results in the article could be displayed. The authors would also like to thank all the editors and anonymous reviewers for their helpful comments that greatly improved the quality of the manuscript.

Conflicts of Interest

The authors declare no conflicts of interest.

References

  1. Sun, L.; Wang, J.; Zhang, H.; Xu, M. Characteristics and Mechanism of the Environmental Capacity Changes in Haizhou Bay, Northern Jiangsu, China from 2006 to 2016. Water 2020, 12, 2990. [Google Scholar] [CrossRef]
  2. Halpern, B.S.; Walbridge, S.; Selkoe, K.A.; Kappel, C.V.; Micheli, F.; D’Agrosa, C.; Bruno, J.F.; Casey, K.S.; Ebert, C.; Fox, H.E.; et al. A global map of human impact on marine ecosystems. Science 2008, 319, 948–952. [Google Scholar] [CrossRef]
  3. Syvitski, J.P.M.; Vörösmarty, C.J.; Kettner, A.J.; Green, P. Impact of Humans on the Flux of Terrestrial Sediment to the Global Coastal Ocean. Science 2005, 308, 376–380. [Google Scholar] [CrossRef]
  4. Zhang, Y.; Zhang, D. Coastal zones—Key areas for global change research. Ocean. Bull. 1993, 16, 69–80. [Google Scholar]
  5. Wang, Z. Ocean Action Plan for the 21st Century. Ocean. Dev. Manag. 1995, 12, 15. [Google Scholar]
  6. Linker, L.C.; Batiuk, R.A.; Shenk, G.W.; Cerco, C.F. Development of the Chesapeake Bay Watershed Total Maximum Daily Load Allocation. JAWRA J. Am. Water Resour. Assoc. 2013, 49, 986–1006. [Google Scholar] [CrossRef]
  7. Wu, Y. The profound significance of coastal zone research. Earth Inf. Sci. 1997, 2, 55–56. [Google Scholar]
  8. Barberi, S.; Sambito, M.; Neduzha, L.; Severino, A. Pollutant Emissions in Ports: A Comprehensive Review. Infrastructures 2021, 6, 114. [Google Scholar] [CrossRef]
  9. Merico, E.; Dinoi, A.; Contini, D. Development of an Integrated Modelling-Measurement System for Near-Real-Time Estimates of Harbor Activity Impact to the Atmospheric Pollution in Coastal Cities. Transp. Res. Part. D 2019, 73, 108–119. [Google Scholar] [CrossRef]
  10. Trela, J.; Płaza, E. Innovative technologies in municipal wastewater treatment plants in Sweden to improve Baltic Sea water quality. Proc. E3S Web Conf. 2018, 45, 113. [Google Scholar] [CrossRef]
  11. Margeta, J.; Baric, A.; Gacic, M. Environmental capacity of the Kastela Bay. In Proceedings of the Eighth International Ocean Disposal Symposium, Dubrovnik, Yugoslavia, 9–13 October 1989; pp. 9–13. [Google Scholar]
  12. Horiya, K.; Hirano, T.; Hosoda, M.; Hirano, T. Evaluating Method of the Marine Environmental Capacity for Coastal Fisheries and Its Application to Osaka Bay. Mar. Pollut. Bull. 1991, 23, 253–257. [Google Scholar] [CrossRef]
  13. Ernestova, L.S. The Effect of Photochemical Oxygen Activation Products on the Self-purification Capacity of Natural Waters. Water Resour. 1994, 21, 334–338. [Google Scholar]
  14. Krom, M.D.; Hornung, H.; Cohen, Y. Determination of the environmental capacity of Haifa Bay with respect to the input of mercury. Mar. Pollut. Bull. 1990, 21, 349–354. [Google Scholar] [CrossRef]
  15. Duka, G.G.; Goryacheva, N.V.; Romanchuk, L.S. Investigation of natural water self-purification capacity under simulated conditions. Water Resour. 1996, 23, 619–622. [Google Scholar]
  16. Zhang, C.; Xia, J. Research on the total amount control of pollution emissions in Dalian Bay: A calculation model for the bay’s pollution carrying capacity. Mar. Environ. Sci. 1998, 17, 1–5. [Google Scholar]
  17. Zhang, Y.; Sun, Y. Application of estuarine, continental shelf, and oceanic models in Jiaozhou Bay. Mar. Environ. Sci. 2000, 19, 13–17. [Google Scholar]
  18. Zhao, L.; Wei, H.; Zhao, J. Numerical study of water exchange in Jiaozhou Bay. Ocean. Limnol. 2002, 33, 23–29. [Google Scholar]
  19. Jiang, F. Study on the Exchange Rate and Flux of Nutrients at the Sediment Seawater Interface in Jiaozhou Bay. Master’s Thesis, Qingdao Ocean University, Qingdao, China, 2002. [Google Scholar]
  20. Ge, M.; Wang, X.; Yan, J.; Shi, X.; Zhu, C.; Jiang, F. Calculation of Nutrient Environmental Capacity in Jiaozhou Bay. Ocean. Sci. 2003, 27, 36–42. [Google Scholar]
  21. Change, D.; Jitang, L.; Jikun, L.; Haibin, L.; Huijuan, T. Water quality investigation research in guan river sea area. Environ. Sci. Manag. 2007, 32, 29–32. [Google Scholar]
  22. Cui, C.; Hua, W.; Yuan, G.; Jiao, X.; Fang, N.; Lu, Y.; Zhang, X.; Mao, C. Survey and evaluation on water quality of coastal area in guanhe estuary. China Resour. Compr. Util. 2013, 31, 41–44. [Google Scholar]
  23. Liu, H.; Dai, M.X.; Peng, S.T.; Xu, W.S. Estimation of the environment capacity of the major pollutants in the bohai bay. Mar. Sci. Bull. 2011, 30, 451–455. [Google Scholar]
  24. Rlfer, L.; Liconti, A.; Prinz, N.; Klcker, C.A. Integrated research for integrated ocean management. Front. Mar. Sci. 2021, 8, 1094. [Google Scholar] [CrossRef]
  25. Sangha, K.K.; Stoeckl, N.; Crossman, N.; Costanza, R. A state-wide economic assessment of coastal and marine ecosystem services to inform sustainable development policies in the Northern Territory, Australia. Mar. Policy 2019, 107, 103595. [Google Scholar] [CrossRef]
  26. Shao, Q.; Liu, X.; Zhao, W. An alternative method for analyzing dimensional interactions of urban carrying capacity: Case study of Guangdong-Hong Kong-Macao Greater Bay Area. J. Environ. Manag. 2020, 273, 111064. [Google Scholar] [CrossRef]
  27. Culhane, F.E.; Frid, C.L.; Gelabert, E.R.; Piet, G.; White, L.; Robinson, L.A. Assessing the capacity of European regional seas to supply ecosystem services using marine status assessments. Ocean Coast. Manag. 2020, 190, 105154. [Google Scholar] [CrossRef]
  28. Song, M.; Pan, X.; Pan, X. Assessment of China’s marine ecological carrying capacity. In Sustainable Marine Resource Utilization in China; Elsevier: Amsterdam, The Netherlands, 2020; pp. 29–62. [Google Scholar]
  29. Yao, Y.; Zhu, J.; Li, L.; Wang, J.; Yuan, J. Marine Environmental Capacity in Sanmen Bay, China. Water 2022, 14, 2083. [Google Scholar] [CrossRef]
  30. Bui, L.T.; Tran, D.L.T. Assessing marine environmental carrying capacity in semi-enclosed coastal areas—Models and related databases. Sci. Total. Environ. 2022, 838 Pt 1, 156043. [Google Scholar] [CrossRef] [PubMed]
  31. Luo, F.; Gou, H.; Li, R.; Wang, H.; Chen, Z.; Lin, W.; Li, K. Numerical simulation on marine environmental capacity in the open sea area of Northern Jiangsu Province using a three-dimensional water quality model based on FVCOM. Reg. Stud. Mar. Sci. 2021, 45, 101856. [Google Scholar] [CrossRef]
  32. Ma, R.; Ji, S.; Ma, J.; Shao, Z.; Zhu, B.; Ren, L.; Li, J.; Liu, L. Exploring resource and environmental carrying capacity and suitability for use in marine spatial planning: A case study of Wenzhou, China. Ocean Coast. Manag. 2022, 226, 106258. [Google Scholar] [CrossRef]
  33. Yin, G.; Hou, L.; Zong, H.; Ding, P.; Liu, M.; Zhang, S.; Cheng, X.; Zhou, J. The spatiotemporal distribution characteristics and eutrophication status of surface seawater N and P content in Jinpu Bay, Dalian. Mar. Environ. Sci. 2013, 32, 4. [Google Scholar]
  34. Soltani, P.; Askar, M.B.; Bahrami, H.; Pour, S.H. Evaluation of Sediment Transport in the Naiband Gulf Area Using Mike21. Open J. Geol. 2017, 7, 182–192. [Google Scholar] [CrossRef]
  35. Zhang, X.; Wu, X.; Zhu, G.; Wang, T.; Chen, H. Simulation of diffuse source polluted water environment based on MIKE21: A case study of the urban section of the Bai river. Water Pr. Technol. 2022, 17, 1893–1913. [Google Scholar] [CrossRef]
Figure 1. Distribution of main estuaries and sewage outlets in Jinpu Bay.
Water 16 00404 g001
Figure 2. Marine functional areas and location of water quality monitoring stations in Jinpu Bay.
Water 16 00404 g002
Figure 3. Average annual concentration field of total nitrogen emissions in Jinpu Bay.
Water 16 00404 g003
Figure 4. Average annual concentration field of total nitrogen emissions from estuaries and sewage outfalls in Jinpu Bay. (a) Weitang River; (b) Laogu River; (c) Dengtun River; (d) Anzi River; (e) Shi River; (f) Sanshili River; (g) Daweijia River; (h) Beida River; (i) Xiajia River; (j) Muchengyi River; (k) Dahua Sewage Outlet.
Water 16 00404 g004
Figure 5. Average annual concentration field of total phosphorus emissions in Jinpu Bay.
Water 16 00404 g005
Figure 6. Average annual concentration field of total phosphorus emissions from estuaries and sewage outlets in Jinpu Bay. (a) Weitang River; (b) Laogu River; (c) Dengtun River; (d) Anzi River; (e) Shi River; (f) Sanshili River; (g) Daweijia River; (h) Beida River; (i) Xiajia River; (j) Muchengyi River; (k) Dahua Sewage Outlet.
Water 16 00404 g006
Figure 7. Average annual concentration field of chemical oxygen demand emissions in Jinpu Bay.
Water 16 00404 g007
Figure 8. Average annual concentration field of chemical oxygen demand emissions at estuaries and sewage outlets in Jinpu Bay. (a) Weitang River; (b) Laogu River; (c) Dengtun River; (d) Anzi River; (e) Shi River; (f) Sanshili River; (g) Daweijia River; (h) Beida River; (i) Xiajia River; (j) Muchengyi River; (k) Dahua Sewage Outlet.
Water 16 00404 g008
Figure 9. Histogram comparing the status quo of total nitrogen and the allowable emission intensity. Note: t/d refers to tons per day.
Water 16 00404 g009
Figure 10. Histogram comparing the status quo of total phosphorus and the allowable emission intensity. Note: t/d refers to tons per day.
Water 16 00404 g010
Figure 11. Column chart comparing the COD status and the allowable emission intensity. Note: t/d refers to tons per day.
Water 16 00404 g011
Table 1. Current emission concentrations of pollutants in estuaries and sewage outlets.
Administration
Regionalization
Monitoring PointPollutant Monitoring Results (unit: mg/L)
Chemical Oxygen DemandTotal NitrogenTotal Phosphorus
Q1Q2Q3Q4Q1Q2Q3Q4Q1Q2Q3Q4
Jinpu New DistrictShi River-29.0-40.0-1.0-4.9-0.1-0.0
Daweijia River42.0137.040.044.016.822.04.987.00.83.20.50.9
Wushili River------------
Dengtun River46.036.047.029.05.07.24.37.10.10.20.10.4
Weitang River115.049.030.0-4.88.47.7-0.10.20.0-
Laogu River116.030.046.030.05.88.210.77.60.10.10.10.2
Sanshili River---43.0---0.6---0.1
Dahua Outlet44.032.029.938.011.611.214.67.70.10.10.40.1
Beida River39.045.0248.043.010.114.810.013.00.10.10.90.3
Hongqi River 34.035.028.122.54.92.33.12.3
PulandianAnzi River83.295.486.436.93.62.69.14.00.20.30.50.1
Table 2. Basic information of water quality control points in Jinpu Bay.
Serial NumberLocal Sea AreaWater QualityInorganic Nitrogen (mg/L)COD (mg/L)Active Phosphate
(in P) (mg/L)
1Pulandian BayIV≤0.5≤5≤0.045
2IV≤0.5≤5≤0.045
3II≤0.3≤3≤0.030
4I≤0.2≤2≤0.015
5II≤0.3≤3≤0.030
6I≤0.2≤2≤0.015
13IV≤0.5≤5≤0.045
7Jinzhou BayI≤0.2≤2≤0.015
8II≤0.3≤3≤0.030
9III≤0.4≤4≤0.030
10I≤0.2≤2≤0.015
11I≤0.2≤2≤0.015
12II≤0.3≤3≤0.030
Note: COD—chemical oxygen demand; water quality is divided into four levels of standard, which are I, II, III and IV.
Table 3. Corresponding coefficient values of total nitrogen in the waters near estuaries and sewage outlets.
Monitoring Point12345678910111213
Sewage Outlet
Weitang River0.0510.0550.0800.0190.0270.0060.0010.0000.0000.0000.0000.0010.010
Laogu River0.1250.0990.0440.0050.0100.0010.0000.0000.0000.0000.0000.0000.032
Dengtun River0.0280.0180.0050.0000.0010.0000.0000.0000.0000.0000.0000.0000.405
Anzi River0.0270.0170.0050.0000.0010.0000.0000.0000.0000.0000.0000.0000.394
Shi River0.0790.0570.0200.0020.0040.0010.0000.0000.0000.0000.0000.0000.483
Sanshili River0.0960.0140.0070.0010.0020.0000.0000.0000.0000.0000.0000.0000.002
Daweijia River0.0020.0020.0070.0130.0250.0130.0160.0010.0010.0000.0000.0020.000
Beida River0.0010.0010.0030.0060.0090.0070.0260.1070.1080.0020.0000.0010.000
Xiajia River0.0000.0000.0000.0010.0010.0020.0050.0060.0050.0150.0150.0030.000
Muchengyi River0.0000.0000.0010.0020.0020.0060.0100.0100.0080.0140.0340.0070.000
Dahua Sewage Outlet0.1800.1310.0530.0060.0130.0020.0000.0000.0000.0000.0000.0000.065
Table 4. Corresponding coefficient values of total phosphorus in the waters near estuaries and sewage outlets.
Monitoring Point12345678910111213
Sewage Outlet
Weitang River0.0510.0550.0800.0190.0270.0060.0010.0000.0000.0000.0000.0010.010
Laogu River0.1250.0990.0440.0050.0100.0010.0000.0000.0000.0000.0000.0000.032
Dengtun River0.0280.0180.0050.0000.0010.0000.0000.0000.0000.0000.0000.0000.405
Anzi River0.0270.0170.0050.0000.0010.0000.0000.0000.0000.0000.0000.0000.394
Shi River0.0790.0570.0200.0020.0040.0010.0000.0000.0000.0000.0000.0000.483
Sanshili River0.1000.1460.0730.0110.0210.0040.0010.0000.0000.0000.0000.0000.023
Daweijia River0.0020.0020.0070.0130.0250.0130.0160.0010.0010.0000.0000.0020.000
Beida River0.0010.0010.0030.0060.0090.0070.0260.1070.1080.0020.0000.0010.000
Xiajia River0.0000.0000.0000.0010.0010.0020.0050.0060.0050.0150.0150.0030.000
Muchengyi River0.0000.0000.0010.0020.0020.0060.0100.0100.0080.0140.0340.0070.000
Dahua Sewage Outlet0.1800.1310.0530.0060.0130.0020.0000.0000.0000.0000.0000.0000.065
Table 5. Corresponding coefficient values of COD in the waters near estuaries and sewage outlets.
Monitoring Point12345678910111213
Sewage Outlet
Weitang River0.7720.7600.4790.2860.3400.2680.3210.5200.5210.2450.2490.2301.327
Laogu River0.7070.7240.5210.3030.3620.2750.3250.5250.5260.2470.2520.2331.318
Dengtun River1.7691.7611.2150.6650.8020.5970.7021.1361.1370.5340.5440.5052.512
Anzi River0.4770.4810.3370.1860.2240.1670.1970.3180.3190.1500.1530.1410.424
Shi River3.3793.3672.3291.2791.5411.1491.3522.1862.1881.0271.0480.9715.131
Sanshili River0.3550.3050.2360.1580.1830.1480.1780.2890.2890.1360.1390.1280.719
Daweijia River0.7090.7020.4760.2500.2930.2240.2610.4490.4490.2110.2150.1981.154
Beida River0.2980.2950.2000.1050.1250.0930.0900.0820.0810.0870.0900.0830.485
Xiajia River0.8580.8500.5830.3170.3820.2830.3300.5360.5380.2400.2450.2391.394
Muchengyi River1.4011.3870.9510.5170.6240.4600.5380.8750.8780.4020.3910.3872.274
Dahua Sewage Outlet0.7810.8210.6000.3500.4170.3180.3760.6080.6080.2860.2910.2701.497
Note: COD—chemical oxygen demand.
Table 6. Estimation of current discharge intensity at the sewage outlet (t/d).
PollutantSewage Outlet
Weitang RiverLaogu RiverDengtun RiverAnzi RiverShi RiverSanshili RiverDaweijia RiverBeida RiverXiajia RiverMuchengyi RiverDahuaGross Amount
Total Nitrogen0.7841.0470.4970.7610.1460.1951.6252.5530.8641.0931.95011.515
Total Phosphorus0.0120.0170.0170.0420.0030.0150.1730.0710.0530.0080.0250.435
COD7.2637.1933.32711.8681.72913.0788.40820.0076.9644.2686.21690.321
Note: t/d refers to tons per day; COD—chemical oxygen demand.
Table 7. Estimation of allowable discharge intensity at sewage outlet (t/d).
PollutantSewage Outlet
Weitang RiverLaogu RiverDengtun RiverAnzi RiverShi RiverSanshili RiverDaweijia RiverBeida RiverXiajia RiverMuchengyi RiverDahuaGross Amount
Total Nitrogen0.4020.5360.2550.3900.0750.1591.8762.6350.8911.1270.9999.346
Total Phosphorus0.0140.0170.0170.0410.0030.0150.2080.0850.0640.0090.0250.497
COD10.4659.0383.80019.5320.73722.18413.61636.0487.9957.9997.414138.828
Note: t/d refers to tons per day; COD—chemical oxygen demand.
Disclaimer/Publisher’s Note: The statements, opinions and data contained in all publications are solely those of the individual author(s) and contributor(s) and not of MDPI and/or the editor(s). MDPI and/or the editor(s) disclaim responsibility for any injury to people or property resulting from any ideas, methods, instructions or products referred to in the content.

