Article

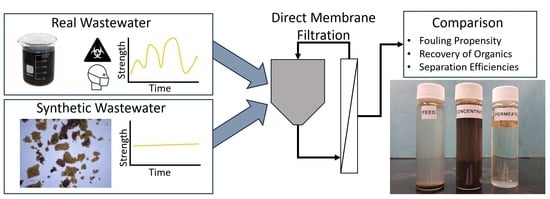
Direct Membrane Filtration of Wastewater: A Comparison between Real and Synthetic Wastewater

1
Department of Civil and Environmental Engineering, University of South Florida, Tampa, FL 33617, USA
2
Bioengineering Department, Istanbul Medeniyet University, Istanbul 34865, Turkey
*
Author to whom correspondence should be addressed.
Water 2024, 16(3), 405; https://doi.org/10.3390/w16030405
Submission received: 30 November 2023 / Revised: 15 January 2024 / Accepted: 24 January 2024 / Published: 26 January 2024

Abstract

:
In this study, a lab scale direct membrane filtration (DMF) system using ultrafiltration membranes was operated to compare synthetic and real wastewater to evaluate their membrane fouling propensity and the partitioning of organics and nutrients during concentration. For fouling prevention, cyclic operation was used which consisted of 90 s of filtration followed by 15 s of relaxation and backwashing conducted every 15 min. The system was tested at a high initial flux of 80 LMH (L/m2·h), and the trials were run until a 90% volume reduction was achieved for each batch. Both the synthetic and real wastewater showed similar fouling propensities and organic and nutrient partitioning. The synthetic and real wastewater had an average flux of 46.3 LMH and 28.5 LMH and an average total chemical oxygen demand rejection of 90.3% and 83.1% after 30 h of operation, respectively. The recovery of organics was similar in both influents, resulting in 65.5% and 64.0% of the total chemical oxygen demand concentrations in the concentrate stream for synthetic and real wastewaters, respectively. The total phosphorous and nitrogen concentrations were also similar in terms of rejection rates resulting in 85% and 78% for the synthetic and 89% and 65% for the fresh WWs, respectively. The comparison revealed that synthetic wastewater, though not identical to real wastewater, can serve as a surrogate in DMF studies. This will help to remove one of the key sources of variability in current DMF studies and will allow for more rapid development of DMF technology.

Graphical Abstract

1. Introduction

The conventional activated sludge (CAS) process has become the global standard for centralized treatment of municipal wastewaters. When properly implemented, CAS can transform polluted wastewater into water that can be recycled or safely discharged into the environment. While CAS has been vital in reducing the environmental impact of urban areas, it comes at the cost of high energy requirements [1] and large volumes of biosolids that are challenging to manage [2]. Anaerobic digestion (AD) of wastewater has been proposed as a more sustainable alternative to CAS, as the organics in wastewater can be converted into biogas, a form or renewable energy [3]. AD also has a lower energy requirement than CAS as it does not require aeration. While AD is often used for industrial wastewater treatment and sludge stabilization, domestic wastewater is too dilute and cold to be effectively treated by AD. For this reason, it is suggested that only high-strength wastewater (those containing a chemical oxygen demand (COD) concentration greater than 1500–2000 mg/L) be treated using AD [4]. The low strength of domestic wastewater has been one of the primary barriers to using AD for municipal wastewater treatment.
Low pressure filtration can be used to concentrate domestic wastewater through a process called direct membrane filtration (DMF). The goal of DMF is to produce two streams including a high-strength, low-volume concentrate stream and a low-strength, large-volume permeate that can undergo lighter treatment before being recycled or discharged. Studies have indicated that microfiltration (MF) and ultrafiltration (UF) can concentrate between 70 and 90% of the organics in domestic wastewater [5,6]. DMF is appealing as it is easy to control and monitor, has low capital costs, and can handle discontinuous operation better than biological systems [5,7].
Despite the appeal of the process, the main drawback of DMF remains membrane fouling [8,9,10]. Fouling causes an increase in resistance to filtration over time, which can lead to both lower operating fluxes and higher transmembrane pressures (TMPs). Depending on the unique characteristics of the wastewater undergoing treatment, a variety of different compounds can be responsible for membrane fouling. These include small colloidal and large suspended particles, inert and adsorptive macromolecules, low molecular weight organics, biological substances, and cations which can contribute to inorganic scaling [11]. Depending on the wastewater characteristics, operational conditions, and membrane properties, different fouling mechanisms can determine the fouling that is ultimately observed.
As fouling is the primary limitation of DMF, research has focused on fouling mitigation strategies. The most common noninvasive fouling control methods tested include backflushing with air at different intensities, combination of hydraulic and mechanical cleaning, backwashing (BW) with permeate or DI water, relaxation (RX, pausing the filtration for short periods of time), using scouring agents such as granular activated carbon to break down the dynamic membrane layer and for removing soluble organics [12,13]. These physical/mechanical cleaning methods are often applied during the filtration process to decrease cake layer formation and prevent pore clogging. While the results of DMF studies are promising, often their results cannot be universally applied. In most cases, the fouling mitigation strategies are tested with unique reactor configurations, membrane types and materials, operational parameters, and perhaps most importantly wastewater compositions. From the extensive body of membrane bioreactor literature, which has parallels to the DMF literature, it is known that each of these testing parameters have profound effects on the membrane fouling rates observed in the corresponding trials [5,6,14,15]. Even for studies using the same experimental conditions, the natural variability of wastewater can obfuscate experimental results [6,16,17]. Domestic wastewater is also known to have large hourly, seasonal, and regional variability that can limit the universal applicability of the fouling mitigation strategies employed in individual studies [3].
Although testing with real wastewater is necessary for technology demonstration and validation, DMF is still a nascent technology that can benefit from further development using a stable synthetic wastewater. By using the same synthetic wastewater, differences in process configuration, fouling mitigation strategies, and operational differences between studies can be accurately assessed. Surrogate wastes are often used to elucidate fundamental mechanisms at play within treatment processes [15]. Synthetic wastewater is reproduceable, safer to handle, and exhibits less variability compared to real wastewater. Synthetic wastewater has been extensively used in wastewater treatment research and been thoroughly vetted [18,19]; however, DMF research has not leveraged the benefits of using synthetic wastewater. This research investigated the use of a synthetic wastewater for batch DMF trials. The surrogate was compared to real wastewater to assess the similarities and differences between the two in terms of fouling propensity and the separation and concentration of organics and nutrients. The strengths and limitations of using synthetic wastewater for DMF trails were evaluated. If synthetic wastewater can mimic key properties of real wastewater, it would allow for more rapid development of DMF process configurations, fouling mitigation strategies, and operational optimization.

2. Materials and Methods

2.1. Experimental Setup and Feedwater

A laboratory-scale DMF skid was constructed consisting of a 56 L conical square tank used as a concentrate tank (CT) which was connected to a custom-built membrane module. The module contained polyvinylidene fluoride X-Flow ultrafiltration (UF) tubular membranes with a diameter of 5.2 mm (Pentair, Minneapolis, MN, USA) and was operated in an external cross-flow configuration (Figure 1 and Figure A1) (60 °C maximum temperature, 500 kPa maximum TMP). The membranes had a nominal pore size of 0.03 µm and 0.25 m2 of active filtration area. The system used four pumps: one centrifuge pump for the membrane feed (Magnus VSG-6000, Sunpole, Naka-Ku Hiroshima, Japan) and three peristaltic pumps for CT feed, permeation, and backwashing (Cole Parmer, Vernon Hills, IL, USA). The membrane was also equipped with three pressure transducers for monitoring the transmembrane pressure (TMP) (Cole-Parmer, EW-68075-32, Vernon Hills, IL, USA). The transducers were placed at the feed, concentrate, and permeate sides of the membrane. Pressure was constantly recorded (1 s sampling, 1 min logging intervals) using HOBOware software version 3.7.19 (ONSET, U30, Bourne, MA, USA).
Three different influents were tested, the first being primary effluent from a local wastewater (WW) treatment plant (City of Largo WW Treatment Plant, Tampa, FL, USA) that was manually collected and transported in carboys. Prior to collection, the primary effluent was well mixed to ensure a representative sample was collected. As the primary effluent was stronger than typical domestic wastewater, the second influent tested was a diluted primary effluent, subsequently referred to as diluted WW, while the primary effluent was referred to as undiluted WW. The WW was diluted eight times using tap water to reduce the solids content to conventional domestic wastewater levels.
The third influent tested was synthetic wastewater, called complex organic particulate artificial sewage (COPAS) as described by Prieto et al. [20]. This synthetic sewage was selected due to the close approximation to the chemical and compositional characteristics of real domestic wastewater [21]. The feed solution was prepared using 417.7 g of finely ground and sieved (1.7 mm maximum particle diameter) COPAS per liter of tap water. The fresh wastewater was sieved through the same particle size diameter sieve to remove any debris that might clog the membrane before being introduced into the process. Continuous mixing of the feed solution was provided in the feed preparation tank using an overhead mixer. Characteristics of the three influents are summarized in Table 1. COPAS is composed of 92% volatile solids and 8% ash. Proteins, carbohydrates, and lipids composition are 40%, 43%, and 17%, while the elemental composition of carbon, nitrogen, and phosphorous were 48.1%, 6.35%, and 1.57%, respectively (CODt/wt ratio, γ = 1.17).

2.2. System Operation

The DMF skid was operated in batch mode and was used to compare the fouling propensities and removal efficiencies of the three influents. For each trial, the CT was filled with wastewater (Vfeed) and subsequently filtered to generate a high-strength concentrate. When the concentrate reached a predetermined volume (Vconcentrate), filtration was stopped. The final concentrate volume was dictated by the desired concentration factor (CF), defined as the initial feed volume divided by the concentrate volume (CF = Vfeed/Vconcentrate). In each batch trial, the aim was to achieve a 90% volume reduction, referred to as a CF10 run. To observe the particulate settleability of COPAS, two lower CF runs of CF2 and CF5 were conducted prior to the CF10 runs. When the desired CF was reached, the concentrate was drained from the CT. After draining, a substantial amount of solids was observed to adhere to the CT sidewalls. To recover the adhered material, 0.25–0.5 L of tap water was used to rinse the sidewalls, and this water was combined with the concentrate. A small fraction of the material was not recovered due to strong adhesion onto tank walls. The CF10 DMF trials were repeated four times for both COPAS and diluted WW. The undiluted WW was only run once.
Filtration was set with an initial instantaneous flux of 80 LMH and cross flow velocity of 1.43 m/s. Frequent RX and BW were used for fouling mitigation, as developed in a previous study [12]. The filtration cycles consisted of 90 s of filtration followed by 15 s of RX. Every 9 cycles of filtration and RX, a BW of 20 s was conducted at 32 LMH. Combined, RX and BW corresponded to 16.1% of total filtration time (155 s of off time and 810 s of filtration time), thereby reducing the effective flux by 16.1% of the instantaneous flux. The batches were repeated until the membrane TMP reached 1 bar, which took four consecutive CF10 runs for both diluted WW and COPAS. The batches were often conducted the following day, or up to 40 h apart, with the exception of the second CF10 COPAS batch which was operated after a one-week hiatus.

2.3. Membrane Cleaning Procedure

The membrane module was chemically cleaned between the COPAS and the real WW trials. For cleaning, the module was decoupled from the CT using valving and was rinsed with tap water to remove any accumulated material. Rinsing was followed by chemical cleaning consisting of a 500 ppm NaClO solution prepared in tap water. The cleaning solution was simultaneously added to the module through the feed and backwash lines for 30 min, with a BW flux of 32 LMH. After 30 min of NaClO exposure, the module was drained, and the membrane was rinsed with tap water for 30 min at 32 LMH to remove any remaining NaClO. Following the initial process, the same cleaning procedure was repeated with a 500 ppm citric acid solution. All chemical cleaning was completed in 1 h. Finally, the membrane permeability was characterized based on the specific flux (L/ m2·h·bar). If the cleaned membrane had a permeability greater than 90% of the virgin membrane’s permeability, it was returned to service. If the permeability was less, the cleaning procedure was conducted again.

2.4. Monitoring Parameters and Analytical Methods

Permeate and concentrate samples were analyzed for total solids (TS), volatile solids (VS), total suspended solids (TSS), volatile suspended solids (VSS), total chemical oxygen demand (tCOD), soluble chemical oxygen demand (sCOD), total nitrogen (TN), ammonia (NH3-N), total phosphorous (TP), and turbidity. All CODs, TN, NH3-N, TP, for collected samples were measured weekly using Hach HR digestion vials and Hach Testin TubeTM vials (Hach company, Loveland, CO, USA). Samples were centrifuged at 3000 RPM for 20 min and the supernatant was used to represent the soluble sample fraction.

3. Results

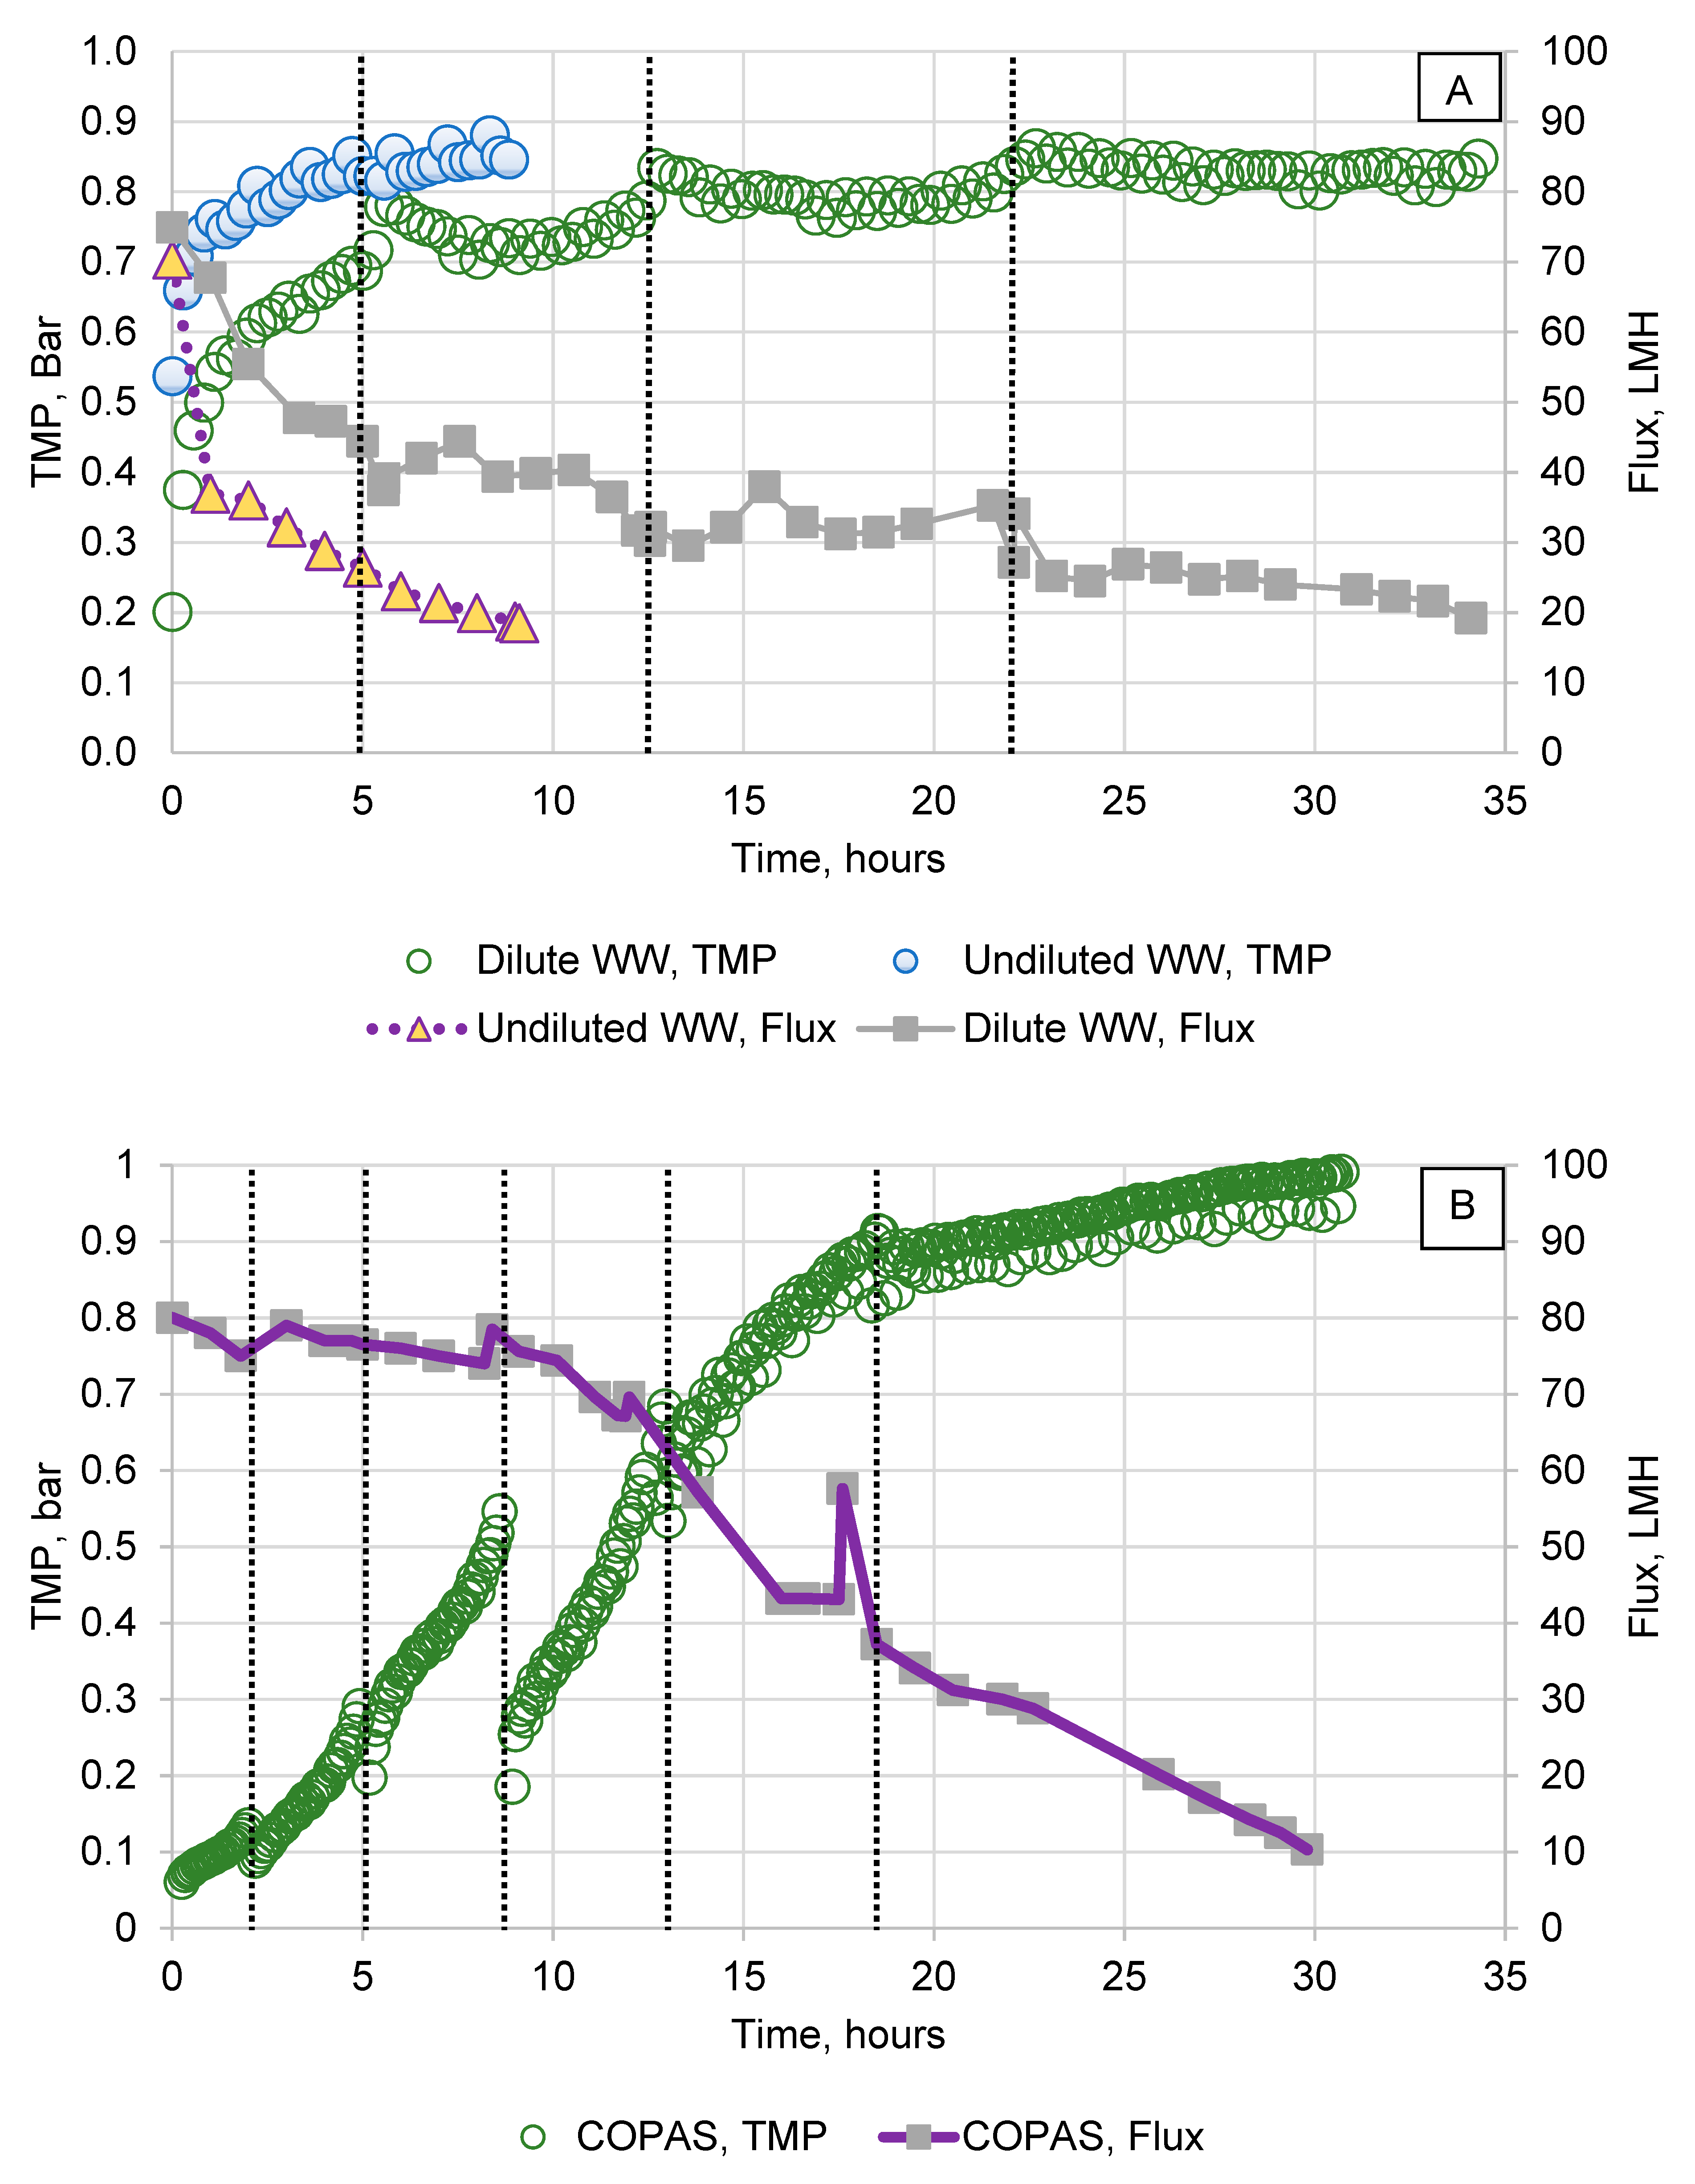
3.1. Membrane Performance and Flux Decline

When filtering both synthetic and real WW, the membrane experienced significant fouling and clogging during batch operations (Figure A2 and Figure A3). For diluted WW, the initial instantaneous flux of 77 LMH quickly decreased to below 50 LMH in 5 h (Figure 2). A similar trend was observed with the membrane’s TMP, with the TMP reaching 0.7 bar within 5 h. After 5 h of operation, the flux decline became more gradual with the average flux decreasing to 35.6 LMH. The TMP also stabilized around 0.8 bar during the last 15 h of operation. The rapid initial decline was likely due to cake layer formation, as can be expected at high operating fluxes. During the initial stages of filtration, intermediate pore blocking and cake layer formation are often the dominant fouling mechanisms [22]. This occurs when filtering real WW due to the high solid content, as the solids are larger than the membrane pores and thus accumulate on the membrane surface [23,24]. The undiluted WW had the worst performance with a drop in flux to 35 LMH and a rise in TMP to 0.7 bar in 1 h. As the undiluted WW was significantly stronger than COPAS, it was not considered for subsequent comparisons. When filtering COPAS, the initial flux decline was not as severe as the diluted WW batches. The instantaneous flux was set at 80 LMH, and an average flux of 75 LMH was observed in the first 10 h.
At the beginning of each CF10 operation, a small flux recovery was observed for both the diluted WW and COPAS. As the operations were conducted with long dormancy periods between each CF10 batch run, the pauses likely served as prolonged RX events, leading to the decompression of the cake layer. It should be noted that the COPAS CF10 batches were started after one CF2 and one CF5 operation. This was carried out to investigate the particle settleability and recovery before starting the CF10 operations. As the membrane was not cleaned after these two batches, the initial TMP for the first COPAS CF10 operation was around 0.2 bar, whereas the diluted WW operation had an initial TMP of 0.1 bar. The duration for both of the CF2 and CF5 batches was approximately 5 h which was equivalent to one CF10 run.
The COPAS batches had better initial TMP performance, achieving a slightly lower increase compared to the diluted WW trials. A TMP increase of 0.7 bar, corresponding to an average fouling rate of 34.2 mbar·h−1, was observed after 12 h. The diluted WW fouling rate was higher at 86.6 mbar·h−1 during the initial 12 h of operation (Figure 3). When filtering COPAS, a rapid flux decline started after 10 h and continued until the process terminated. Even though the flux dropped, the rate was not as severe as with diluted WW. Temporary flux recovery from the periods between batches was also observed with COPAS, similar to those observed with diluted WW. Although the initial flux decline and TMP increase were lower than with diluted WW, neither parameter stabilized during the COPAS batches (Figure 2). COPAS had a slightly higher adhesive property compared to real WW and was difficult to remove from the membrane and plumbing, as was observed during the CF2 and CF5 batches (Figure A2 and Figure A3). This property likely prevented the cake layer from decompressing during relaxation, which explains why the flux and TMP never stabilized during the COPAS trials (Figure 2).
The initial TMP profiles for both COPAS and diluted WW had distinct patterns. This was likely due to the slow solubilization rate of COPAS compared to the more stable diluted WW. As COPAS was prepared 30 min prior to the beginning of each batch, it did not have time to fully solubilize. Evidence for this can be found when comparing the tCOD concentrations in the permeate and concentrate streams for COPAS between batches (Table 2 and Table 3). The concentrate tCOD and loss to the permeate for the first CF10 batches were 3956 mg·L−1 and 8.3% for COPAS and 2014 mg·L−1 and 31.5% for diluted WW, respectively. This indicated that during the first CF10 run, COPAS had a higher fraction of particulates than the diluted WW, and these particles were effectively rejected. However, in later batches, when the flux decline resulted in longer processing times (going from 3–4 h to 12 h), solubilization increased, and the percentage of tCOD lost to the permeate increased to 27.3%. This increase in solubility was not observed in the diluted WW batches. While the initial percentage of tCOD lost to the permeate for the diluted WW was 31.5%, subsequent batches had progressively decreasing fractions of 22%, 15.7%, and 14.4%, respectively. This indicates that the solubilization of particulates was minimal within the diluted WW batches. The initial formation of a dense cake layer also likely improved the retention of colloidal and soluble organics, resulting in lower losses of tCOD in the permeate in the later batches of the diluted WW.
Both COPAS and diluted WW had similar final fouling behaviors even though different patterns were initially observed. Both influents fouled the membrane after 4 or 5 CF10 batches, corresponding to 32 and 34 h for COPAS and diluted WW, respectively. However, it must be noted that even though COPAS had slightly better flux performance, the TMP and flux never stabilized and continued to deteriorate. In contrast, the TMP for the diluted WW stabilized after 6 h and likely could have continued further with minimal flux reduction. The final fluxes before the trials were terminated and were 20 and 10 LMH for diluted WW and COPAS, respectively. Average flow rates for the entire operations were 11.4 and 6.5 L/h for COPAS and diluted WW, processing a total of 287 L (228 L of four CF10 and 59 L of one CF2 and CF5 batches) and 225 L of permeate, respectively (Table 2 and Table 3). As a result of the initial cake formation, the diluted WW had a higher filtration resistance and fouling rate. However, this was not the case with COPAS due to a lower solubilization rate leading to delayed cake formation and lower filtration resistance during the early stages of operation (Figure 3). Even though different resistance patterns and fouling rates occurred for both influents, the total resistances for the entire duration were similar, reaching 322 × 1012 m−1 and 358 × 1012 m−1 for COPAS and diluted WW, respectively.
The initial fouling rates likely would have been similar if additional time was provided for COPAS stabilization. In a study using a synthetic wastewater derived from dry dog food, Kargol et al. soaked their solution for 24 h prior to use [19]. This longer stabilization time helped fully solubilize the dry dog food. A longer soaking time for COPAS is recommended for future studies. After multiple hours of operation, COPAS exhibited a stronger fouling propensity than the diluted WW. This may have been due to the higher COD and TSS concentrations found in the COPAS mixture compared to the diluted WW. This does indicate that successful fouling mitigation strategies developed when using COPAS will likely work when applied to real wastewater of similar strengths. Future studies investigating the exact nature and composition of the fouling that occurs when using COPAS can provide greater insight into the key differences between real and artificial sewage.

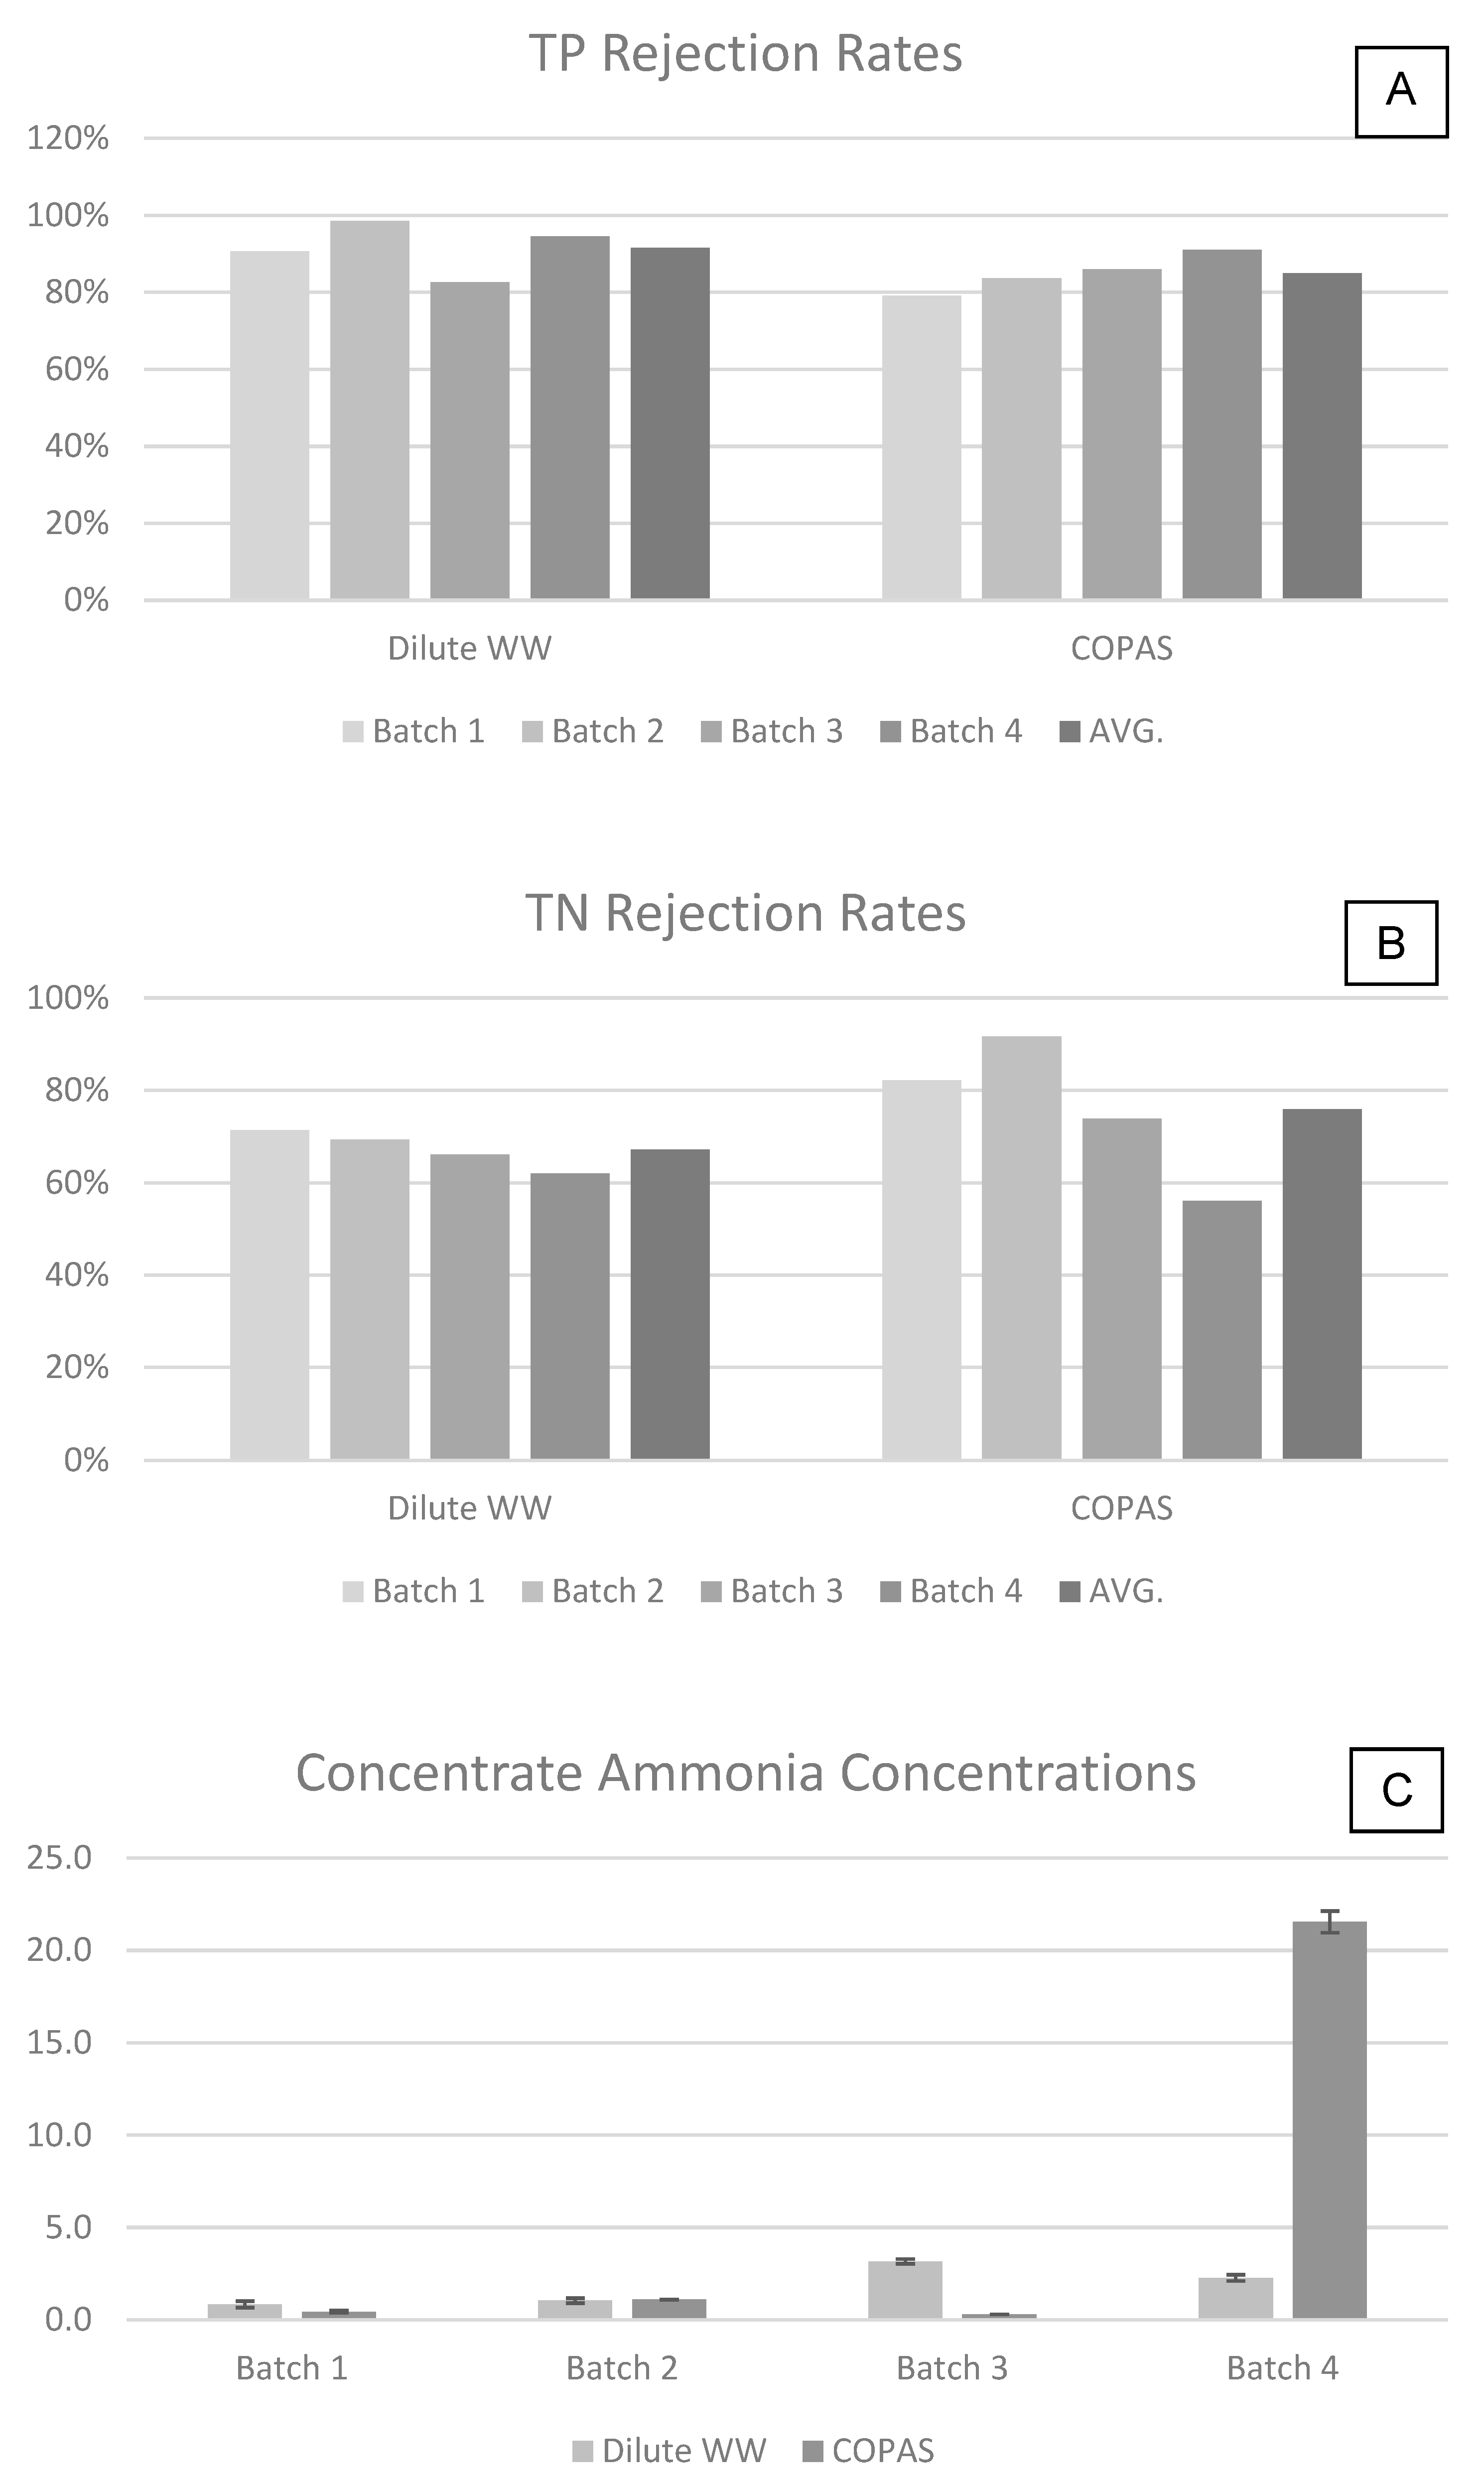
3.2. Removal and Recovery

Both COPAS and diluted WW showed similar rejection efficiencies in terms of COD, TN, and TP (Table 2, Table 3 and Table 4). The final average volume CF and COD increase in the concentrate stream for the four CF10 operations were 11.8, 7.4 and 11.7, 7.5 for COPAS and diluted WW, respectively. This means that for an approximately 90% volume reduction, the COD concentration increased 7.4 and 7.5 times in the final concentrate for COPAS and diluted WW, respectively. Even though slightly different concentration factors and fouling patterns were observed for both influents, the average organic recovery was similar, achieving 65.5% and 64.0% for COPAS and diluted WW, respectively. This compares to a recovery rate of 54% by Nascimento and Miranda (2021), 50% by Sugiyama et al. (2022), 45–75% by Lateef et al. (2013), and 45% by the control study presented in Yang et al. (2023) [4,17,25]. Some DMF studies indicate higher organic recovery rates; however, these studies employ pretreatment strategies, such as flocculation, to aid in the recovery of sCOD [25,26]. The recovery rate of organics is dictated by the sCOD/tCOD ratio, CF, and extent to which organics pass unimpeded through the membrane, which is best described by the tCOD rejection rate.
The average tCOD rejection by the membrane was 90.3% for COPAS and 83.1% for diluted WW. Both values closely align with the literature values of 89–94% observed by Men et al. (2023), 81–97.9% by Nascimento and Miranda (2021), and between 60 and 80% for Jin et al. (2016) [7,17,27]. On average, the COPAS tCOD rejection rates were slightly higher than for the diluted WW batches, which increased the final tCOD concentrations in the concentrate. Higher COD values towards the end of each batch increased the COD losses to the permeate. COD losses to the permeate were driven by sCOD concentrations, with COPAS having 16% of tCOD, while diluted WW had 23%. This compares well to the sCOD/tCOD fractions observed by Men et al. of 12% (2023) and 18% in Nascimento and Miranda (2021) [7,17]. The slower solubilization rate of COPAS also influenced the permeate and concentrate qualities. This effect was not observed in the diluted WW batches. In fact, the longer the process duration, the less tCOD was present in the permeate with the real WW. This can be partially explained by the rapid cake layer formation, which reduced the flux but also likely served as a barrier to sCOD [28]. As a result of the initial cake layer formation, more soluble products were captured over time by this barrier, which resulted in the lower permeate tCOD concentrations in the latter operations.
The overall recovery rates for tCOD were 65.5% and 64.0% in COPAS and diluted WW, respectively. The missing organic fraction was either lost to the permeate or was unrecovered from the CT and membrane module. The average %tCOD lost to the permeate and deposited on the DMF hardware were 9.7% and 24.8% for the COPAS and 16.9% and 19.4% for the diluted WW, respectively. The deposition of solids in a CT is a common occurrence and issue with DMF [4,29,30]. If not removed, solids can adhere to plumbing and hardware, reducing the final organic recovery rate. Aeration, a fouling mitigation strategy used with submersible membranes, can also reduce recovery rates by promoting bacterial growth and degradation of organics [4,26,27,30,31]. External membranes are better suited for the recovery of organics as they can rely on fouling mitigation strategies such as RX and BW that do not promote bacterial growth.
The average TP and TN rejection rates were 85%, 78% and 92%, 67% for COPAS and diluted WW, respectively. This compares to TN rejection rates between 20 and 24% observed in Men et al. (2023) and 36% in Yang et al. (2023) and TP rejection rates of 21–42% in Men et al. (2023) and 44% in Sugiyama et al. (2022) [6,7,25]. The TN and TP rejection rates of this study were significantly higher than those presented in the literature, likely reflecting a compositional difference between COPAS and real WW. TN and TP rejection rates for both diluted WW and COPAS fluctuated, and trends between individual batches were not apparent. However, TP rejection rates for COPAS gradually increased, while TN rejection rates gradually decreased as the number of batches progressed (Figure A4). This trend was likely caused by the slow solubilization rate of COPAS and the development of a cake layer formation which prevented phosphorous from bleeding into the permeate. The declining retention of TN was also likely due to the conversion of organic nitrogen into ammonia. In the final CF10 COPAS batch, ammonia concentrations increased approximately 20 times in the concentrate compared to the previous CF10 operations (Figure A4), even though no ammonia was present in the synthetic feed solution. This was not observed in the shorter duration operations.
Overall, COPAS had a very similar average organic recovery rate to that of the diluted WW and was slightly above the average values presented in the DMF literature. The tCOD rejection rates for COPAS were close to those observed with dilute wastewater and well within the ranges presented in other studies. However, both TN and TP rejection rates for COPAS were substantially higher than those observed in other studies, likely due to the nitrogen and phosphorus being bound in organic forms and being easily filtered. This indicates that COPAS can serve as an adequate artificial WW for studies primarily focused on mimicking COD and organic partitioning; however, for studies desiring an accurate partitioning of nutrients, COPAS would have to be further modified.

4. Conclusions

The batch DMF operations of COPAS and diluted WW showed similar results in terms of fouling behaviors after prolonged operation. The total resistances for the entire duration were 322 × 1012 m−1 and 358 × 1012 m−1 for COPAS and diluted WW, respectively. The predominant fouling mechanism for both influents was cake layer formation and resulted in approximately 30 h operations before the TMP reached 1 bar. Despite these similarities, COPAS was less stable compared to diluted WW and the progressive solubilization of COPAS resulted in better fouling behavior in early batches while worse fouling behavior in longer duration batches. Ensuring sufficient maturation of COPAS prior to trials will likely improve the stability of the feed material and its similarity to real WW.
Both influents had high organic recovery rates and stable permeate qualities. Overall COD, TN, and TP rejection rates were 90.3%, 78.3%, 85% for COPAS and 83.1%, 91.6%, 67.2% for diluted WW, respectively. COD recovery and rejection rates for COPAS fell within the range of values presented in the literature and closely mirrored the values of the diluted WW used in this study. However, TN and TP values for COPAS were significantly higher than values reported in the literature. The fouled membranes were effectively restored with chemical cleaning. The 1 h cleaning procedure completely removed irreversible fouling. Permeability tests revealed that chemically cleaned membranes achieved similar specific flux values as new membranes (1050 LMH/bar). While COPAS is not a perfect analog for the real domestic wastewater tested, as exhibited by the initial differences in fouling rates, it does exhibit similar removal rates for key constituents. COPAS once stabilized also exhibits similar fouling mechanisms (cake layer formation) and has stronger adhesion compared to the WW tested. Taken as a whole, COPAS can serve as an adequate surrogate for DMF system modification, optimization, and lab-scale testing.

Author Contributions

Conceptualization, A.E.U. and R.A.B.; methodology, A.E.U. and R.A.B.; software, A.E.U. and R.A.B.; validation, A.E.U., R.A.B. and D.H.Y.; formal analysis, A.E.U.; investigation, A.E.U.; resources, D.H.Y.; data curation, A.E.U.; writing—original draft preparation, A.E.U.; writing—review and editing, A.E.U., R.A.B. and D.H.Y.; visualization, A.E.U.; supervision, D.H.Y.; project administration, D.H.Y.; funding acquisition, D.H.Y. All authors have read and agreed to the published version of the manuscript.

Funding

This research was funded by the Bill & Melinda Gates Foundation, grant number INV-006612.

Data Availability Statement

The datasets presented in this article are not readily available because the data are part of an ongoing study. Requests to access the datasets should be directed to the corresponding author.

Acknowledgments

A.E.U. acknowledges support from the Ministry of National Education, Turkey. We thank Pentair X-Flow for supplying the membranes and Howard F. Curren AWTP for providing the seed for our reactor. We also thank Manuel Delgado-Navarro and Talon Bullard for their assistance with reactor operation and maintenance.

Conflicts of Interest

The authors declare no conflicts of interest.

Appendix A

Figure A1. The DMF testing skid (A) a detail on the custom-built membrane modules, (B) shows the CT.
Water 16 00405 g0a1

Appendix B

Figure A2. The membrane modules at the end of one of the COPAS CF10 batches.
Water 16 00405 g0a2
Figure A3. The membrane modules at the end of diluted WW CF10 batches.
Water 16 00405 g0a3

Appendix C

Figure A4. TP (A), TN (B) rejection rate comparisons and NH3-N (C) concentrations in concentrate.
Water 16 00405 g0a4

Appendix D

Table A1. Standard deviations for Table 2, Table 3 and Table 4.
COPAS1st CF102nd CF103rd CF104th CF10
tCOD in the permeate, mg/L19.935.624.420.7
tCOD in the concentrate, mg/L219137326.368.2
Diluted WW1st CF102nd CF103rd CF104th CF10Undiluted CF10
Concentrate TS, mg/L5.922.111.313.231.1
Feed TSS, mg/L554514
Concentrate TSS, mg/L26.549.542.47.170.7
total TS in the feed, mg/L13.212.916.011.010.8
tCOD in the feed, mg/L17.128.211.818.538.5
tCOD in the permeate, mg/L6713830.6
tCOD in the concentrate, mg/L88653259130
COPAS1st CF102nd CF103rd CF104th CF10
TP influent, mg/L1.01.01.01.0
TP permeate, mg/L0.21.00.50.9
TP concentrate, mg/L7.61.33.96.7
TN influent, mg/L2222
TN permeate, mg/L0.50.41.91.7
TN concentrate, mg/L6.02.71.40.8
NH3 influent, mg/LNA 1NANANA
NH3 permeate, mg/L0.070.050.050.05
NH3 concentrate, mg/L0.050.000.000.58
Diluted WW1st CF102nd CF103rd CF104th CF10Undiluted CF10
TP influent, mg/L1.10.40.60.43.1
TP permeate, mg/L0.10.00.20.30.3
TP concentrate, mg/L3.83.02.03.015.0
TN influent, mg/L0.71.11.01.31.0
TN permeate, mg/L0.70.71.21.51.1
TN concentrate, mg/L21.83.110.73.524.0
NH3 influent, mg/L0.170.100.130.080.11
NH3 permeate, mg/L0.170.310.130.120.57
NH3 concentrate, mg/L0.170.130.120.172.51
Note: 1: Not applicable.

References

  1. Mizuta, K.; Shimada, M. Benchmarking Energy Consumption in Municipal Wastewater Treatment Plants in Japan. Water Sci. Technol. 2010, 62, 2256–2262. [Google Scholar] [CrossRef]
  2. Zhang, Q.; Wu, Y.; Luo, J.; Cao, J.; Kang, C.; Wang, S.; Li, K.; Zhao, J.; Aleem, M.; Wang, D. Enhanced Volatile Fatty Acids Production from Waste Activated Sludge with Synchronous Phosphorus Fixation and Pathogens Inactivation by Calcium Hypochlorite Stimulation. Sci. Total Environ. 2020, 712, 136500. [Google Scholar] [CrossRef]
  3. Uman, A.E.; Usack, J.G.; Lozano, J.L.; Angenent, L.T. Controlled Experiment Contradicts the Apparent Benefits of the Fenton Reaction during Anaerobic Digestion at a Municipal Wastewater Treatment Plant. Water Sci. Technol. 2018, 78, 1861–1870. [Google Scholar] [CrossRef]
  4. Lateef, S.K.; Soh, B.Z.; Kimura, K. Direct Membrane Filtration of Municipal Wastewater with Chemically Enhanced Backwash for Recovery of Organic Matter. Bioresour. Technol. 2013, 150, 149–155. [Google Scholar] [CrossRef] [PubMed]
  5. Hube, S.; Eskafi, M.; Hrafnkelsdóttir, K.F.; Bjarnadóttir, B.; Bjarnadóttir, M.Á.; Axelsdóttir, S.; Wu, B. Direct Membrane Filtration for Wastewater Treatment and Resource Recovery: A Review. Sci. Total Environ. 2020, 710, 136375. [Google Scholar] [CrossRef] [PubMed]
  6. Sugiyama, T.; Ito, Y.; Hafuka, A.; Kimura, K. Efficient Direct Membrane Filtration (DMF) of Municipal Wastewater for Carbon Recovery: Application of a Simple Pretreatment and Selection of an Appropriate Membrane Pore Size. Water Res. 2022, 221, 118810. [Google Scholar] [CrossRef] [PubMed]
  7. Men, Y.; Li, Z.; Zhu, L.; Wang, X.; Cheng, S.; Lyu, Y. New Insights into Membrane Fouling during Direct Membrane Filtration of Municipal Wastewater and Fouling Control with Mechanical Strategies. Sci. Total Environ. 2023, 869, 161775. [Google Scholar] [CrossRef]
  8. Ruigómez, I.; González, E.; Galán, P.; Rodríguez-Sevilla, J.; Vera, L. A Rotating Hollow Fiber Module for Fouling Control in Direct Membrane Filtration of Primary Settled Wastewater. Ind. Eng. Chem. Res. 2019, 58, 16901–16910. [Google Scholar] [CrossRef]
  9. Horstmeyer, N.; Thies, C.; Lippert, T.; Drewes, J.E. A Hydraulically Optimized Fluidized Bed UF Membrane Reactor (FB-UF-MR) for Direct Treatment of Raw Municipal Wastewater to Enable Water Reclamation with Integrated Energy Recovery. Sep. Purif. Technol. 2020, 235, 116165. [Google Scholar] [CrossRef]
  10. Gao, Y.; Fang, Z.; Liang, P.; Huang, X. Direct Concentration of Municipal Sewage by Forward Osmosis and Membrane Fouling Behavior. Bioresour. Technol. 2018, 247, 730–735. [Google Scholar] [CrossRef] [PubMed]
  11. Shi, X.; Tal, G.; Hankins, N.P.; Gitis, V. Fouling and Cleaning of Ultrafiltration Membranes: A Review. J. Water Process Eng. 2014, 1, 121–138. [Google Scholar] [CrossRef]
  12. Uman, A.E.; Bair, R.A.; Yeh, D.H. Assessment of an Anaerobic Membrane Bioreactor (AnMBR) Treating Medium-Strength Synthetic Wastewater under Cyclical Membrane Operation. Membranes 2021, 11, 415. [Google Scholar] [CrossRef] [PubMed]
  13. Azis, K.; Ntougias, S.; Melidis, P. Fouling Control, Using Various Operating Cleaning Methods, Applied on an MBR System through Continuous TMP Monitoring. Desalin. Water Treat. 2019, 167, 343–350. [Google Scholar] [CrossRef]
  14. Ezugbe, E.O.; Tetteh, E.K.; Rathilal, S.; Armah, E.K.; Amo-Duodu, G. Dennis Asante-Sackey Direct Membrane Filtration for Wastewater Treatment. Adv. Mater. Wastewater Treat. Desalin. 2022, 167–193. [Google Scholar] [CrossRef]
  15. Azis, K.; Ntougias, S.; Melidis, P. Evaluation of Fouling Prevention Methods in a Submerged Membrane Bioreactor Treating Domestic Wastewater. Desalin. Water Treat. 2019, 170, 415–424. [Google Scholar] [CrossRef]
  16. Kimura, K.; Honoki, D.; Sato, T. Effective Physical Cleaning and Adequate Membrane Flux for Direct Membrane Filtration (DMF) of Municipal Wastewater: Up-Concentration of Organic Matter for Efficient Energy Recovery. Sep. Purif. Technol. 2017, 181, 37–43. [Google Scholar] [CrossRef]
  17. Nascimento, T.A.; Miranda, M.P. Continuous Municipal Wastewater Up-Concentration by Direct Membrane Filtration, Considering the Effect of Intermittent Gas Scouring and Threshold Flux Determination. J. Water Process Eng. 2021, 39, 101733. [Google Scholar] [CrossRef]
  18. Penn, R.; Ward, B.J.; Strande, L.; Maurer, M. Review of Synthetic Human Faeces and Faecal Sludge for Sanitation and Wastewater Research. Water Res. 2018, 132, 222–240. [Google Scholar] [CrossRef]
  19. Kargol, A.K.; Burrell, S.R.; Chakraborty, I.; Gough, H.L. Synthetic Wastewater Prepared from Readily Available Materials: Characteristics and Economics. PLoS Water 2023, 2, e0000178. [Google Scholar] [CrossRef]
  20. Prieto, A.L.; Criddle, C.S.; Yeh, D.H. Complex Organic Particulate Artificial Sewage (COPAS) as Surrogate Wastewater in Anaerobic Assays. Environ. Sci. 2019, 5, 1661–1671. [Google Scholar] [CrossRef]
  21. Prieto, A.L.; Futselaar, H.; Lens, P.N.L.; Bair, R.; Yeh, D.H. Development and Start up of a Gas-Lift Anaerobic Membrane Bioreactor (Gl-AnMBR) for Conversion of Sewage to Energy, Water and Nutrients. J. Memb. Sci. 2013, 441, 158–167. [Google Scholar] [CrossRef]
  22. Hube, S.; Wang, J.; Sim, L.N.; Chong, T.H.; Wu, B. Direct Membrane Filtration of Municipal Wastewater: Linking Periodical Physical Cleaning with Fouling Mechanisms. Sep. Purif. Technol. 2021, 259, 118125. [Google Scholar] [CrossRef]
  23. Rahman, T.U.; Roy, H.; Islam, M.R.; Tahmid, M.; Fariha, A.; Mazumder, A.; Tasnim, N.; Pervez, M.N.; Cai, Y.; Naddeo, V.; et al. The Advancement in Membrane Bioreactor (MBR) Technology toward Sustainable Industrial Wastewater Management. Membranes 2023, 13, 181. [Google Scholar] [CrossRef]
  24. Ravazzini, A.M.; van Nieuwenhuijzen, A.F.; van der Graaf, J.H.M.J. Direct Ultrafiltration of Municipal Wastewater: Comparison between Filtration of Raw Sewage and Primary Clarifier Effluent. Desalination 2005, 178, 51–62. [Google Scholar] [CrossRef]
  25. Yang, Y.; Deng, W.; Zha, L.; Qiu, J.; Hu, Y.; Liu, Y.; Chen, R. Integrated Electroflocculation-Membrane Process for Pre-Concentration of Domestic Wastewater: Filtration Performance, Organics Recovery and Membrane Fouling Characteristics. Resour. Conserv. Recycl. 2023, 199, 107247. [Google Scholar] [CrossRef]
  26. Jin, Z.; Meng, F.; Gong, H.; Wang, C.; Wang, K. Improved Low-Carbon-Consuming Fouling Control in Long-Term Membrane-Based Sewage Pre-Concentration: The Role of Enhanced Coagulation Process and Air Backflushing in Sustainable Sewage Treatment. J. Memb. Sci. 2017, 529, 252–262. [Google Scholar] [CrossRef]
  27. Jin, Z.; Gong, H.; Temmink, H.; Nie, H.; Wu, J.; Zuo, J.; Wang, K. Efficient Sewage Pre-Concentration with Combined Coagulation Microfiltration for Organic Matter Recovery. Chem. Eng. J. 2016, 292, 130–138. [Google Scholar] [CrossRef]
  28. Diamantis, V.I.; Antoniou, I.; Athanasoulia, E.; Melidis, P.; Aivasidis, A. Recovery of Reusable Water from Sewage Using Aerated Flat-Sheet Membranes. Water Sci. Technol. 2010, 62, 2769–2775. [Google Scholar] [CrossRef]
  29. Jin, Z.; Gong, H.; Wang, K. Application of Hybrid Coagulation Microfiltration with Air Backflushing to Direct Sewage Concentration for Organic Matter Recovery. J. Hazard Mater. 2015, 283, 824–831. [Google Scholar] [CrossRef]
  30. Gong, H.; Jin, Z.; Wang, X.; Wang, K. Membrane Fouling Controlled by Coagulation/Adsorption during Direct Sewage Membrane Filtration (DSMF) for Organic Matter Concentration. J. Environ. Sci. 2015, 32, 1–7. [Google Scholar] [CrossRef] [PubMed]
  31. Nascimento, T.A.; Mejía, F.R.; Fdz-Polanco, F.; Peña Miranda, M. Improvement of Municipal Wastewater Pretreatment by Direct Membrane Filtration. Environ. Technol. 2017, 38, 2562–2572. [Google Scholar] [CrossRef] [PubMed]
Figure 1. Process flow diagram for the DMF skid.
Water 16 00405 g001
Figure 2. Temporal profiles for membrane flux and TMP: (A) four CF10 runs in sequence with diluted WW and one CF10 run with undiluted WW; (B) one CF2, one CF5, and four CF10 runs in sequence with COPAS. The vertical dotted lines represent each batch run.
Water 16 00405 g002
Figure 3. Total filtration resistance profile for both COPAS and diluted WW (A); fouling rate (B).
Water 16 00405 g003
Table 1. Feed characteristics for COPAS, diluted WW, and undiluted WW.
ParametersCOPASDiluted WWUndiluted WW
Conc., mg/LSTDevConc., mg/LSTDevConc., mg/LSTDev
Total Solids (TS)417.715.3705.994.62067.110.8
Volatile Solids (VS)307.310.2277.757.21363.844.6
Total Suspended Solids (TSS)198.412.5165.025.71101.714.1
Volatile Suspended Solids (VSS)168.19.7141.320.4961.77.1
Total Chemical Oxygen Demand (tCOD)500.043.0329.418.91797.838.5
Soluble Chemical Oxygen Demand (sCOD)83.04.076.19.4529.214.7
Total Phosphorous (TP)30.70.910.30.649.53.1
Soluble Phosphorous (sTP)7.40.82.00.511.80.3
Total Nitrogen (TN)14.01.510.92.852.94.8
Soluble Nitrogen (sTN)3.00.44.21.025.71.0
Ammonia (NH3)ND 1NA 24.20.125.60.1
Note: 1: Not detected. 2: Not applicable.
Table 2. Water quality for the COPAS CF10 batches (STDEVs were given in Appendix D).
Parameters1st
CF10
2nd
CF10
3rd
CF10
4th
CF10
Final concentrate volume, L5.55.45.343.7
Total filtration time, min212220335740
Total permeate volume, L56.656.456.658.7
Average effective flux, LMH64.161.540.519.0
CF after rinsing, by volume10.410.711.115.0
CF after rinsing, by COD7.98.28.25.5
Volume reduction after rinsing. %90.490.791.093.3
tCOD in the influent, mg/L500500500500
tCOD in the permeate, mg/L3850.748.773.6
tCOD in the concentrate, mg/L3956408040902744
% tCOD rejection93.1%90.8%91.1%86.3%
% tCOD in the concentrate 75.9%76.1%73.5%36.7%
% tCOD retained in the CT and membranes17.3%14.7%17.6%49.6%
% tCOD lost to perm (with deposits in the system)6.9%9.2%8.9%13.7%
% tCOD lost to perm (without deposits in the system)8.3%10.8%10.8%27.3%
% solids in the concentrate 75.9%76.1%73.5%36.7%
Table 3. Water quality for the dilute and undiluted WW CF10 (STDEVs were given in Appendix D).
Diluted WWUndiluted WW
Parameters1st
CF10
2nd
CF10
3rd
CF10
4th
CF10
CF10
Final concentrate volume, L4.74.84.75.14.9
Feed TS, mg/L6346167678062067
Concentrate TS, mg/L22491787278623088517
Feed TSS, mg/L1731371541971102
Concentrate TSS, mg/L16131207158616377833
Total filtration time, min335425575727550
Total permeate production volume, L56.953.957.056.856.8
Average flux, LMH40.830.423.818.824.8
CF after rinsing, by volume11.911.612.610.811.3
CF after rinsing, by COD6.67.38.67.57.3
Volume reduction after rinsing. %91.6%91.4%92.1%90.7%91.2%
tCOD in the influent, mg/L3032943553661798
tCOD in the permeate, mg/L85574947310
tCOD in the concentrate, mg/L201421373057273813,073
% tCOD rejection74.0%81.0%86.2%87.2%%83
% tCOD in the concentrate 56%63%68%69%64%
% TSS retained in the CT and membranes20.8%23.3%18.3%22.0%36.6%
% tCOD retained in the CT and membranes18.5%19.5%19.1%19.0%20.1%
% tCOD lost to perm (with deposits in the system)25.7%17.7%12.7%11.7%15.7%
% tCOD lost to perm (without deposits in the system)31.5%22.0%15.7%14.4%19.7%
% solids in the concentrate 30.0%25.2%28.8%26.8%36.7%
% suspended solids in the concentrate 79.2%76.7%81.7%78.0%63.4%
Table 4. Nitrogen and phosphorous concentrations for all CF10 batches (STDEVs were given in Appendix D).
COPAS 1st
CF10
2nd
CF10
3rd
CF10
4th
CF10
TP influent, mg/L31313131
TP permeate, mg/L6.45.04.32.8
TP concentrate, mg/L54.849.260.547.0
TN influent, mg/L14141414
TN permeate, mg/L2.51.23.74.8
TN concentrate, mg/L138142148130
NH3 influent, mg/LND 1NDNDND
NH3 permeate, mg/L1.30.80.90.8
NH3 concentrate, mg/L0.51.10.321.5
TP CF by concentration1.81.62.01.5
TN CF by concentration 9.810.110.59.2
TP rejection, %79%84%86%91%
TN rejection, %82%92%74%66%
Diluted WW1st
CF10
2nd
CF10
3rd
CF10
4th
CF10
Undiluted WW
CF10
TP influent, mg/L10.07.110.513.549.5
TP permeate, mg/L0.90.11.80.79.0
TP concentrate, mg/L48.893.9114.486.2398.4
TN influent, mg/L3.01.17.35.325.7
TN permeate, mg/L12.49.417.815.460.0
TN concentrate, mg/L100.072.4110.694.2415.6
NH3 influent, mg/L2.03.76.15.125.6
NH3 permeate, mg/L0.82.24.34.517.8
NH3 concentrate, mg/L0.81.03.22.318.9
TP CF by concentration4.913.210.96.48.1
TN CF by concentration 11.78.78.27.07.9
TP rejection, %91%99%83%94%82%
TN rejection, %71%69%66%62%63%
Note: 1: Not detected.
Disclaimer/Publisher’s Note: The statements, opinions and data contained in all publications are solely those of the individual author(s) and contributor(s) and not of MDPI and/or the editor(s). MDPI and/or the editor(s) disclaim responsibility for any injury to people or property resulting from any ideas, methods, instructions or products referred to in the content.

