Article

Decision Support Framework for Water Quality Management in Reservoirs Integrating Artificial Intelligence and Statistical Approaches

by
Syeda Zehan Farzana
1,2,*,
Dev Raj Paudyal
1,*,
Sreeni Chadalavada
2 and
Md Jahangir Alam
2,3
1
School of Surveying and Built Environment, University of Southern Queensland (UniSQ), Toowoomba, QLD 4350, Australia
2
School of Engineering, University of Southern Queensland (UniSQ), Springfield Lakes, QLD 4300, Australia
3
Murray-Darling Basin Authority (MDBA), Canberra, ACT 2601, Australia
*
Authors to whom correspondence should be addressed.
Water 2024, 16(20), 2944; https://doi.org/10.3390/w16202944
Submission received: 7 September 2024 / Revised: 9 October 2024 / Accepted: 15 October 2024 / Published: 16 October 2024

Abstract

:
Planning, managing and optimising surface water quality is a complex and multifaceted process, influenced by the effects of both climate uncertainties and anthropogenic activities. Developing an innovative and robust decision support framework (DSF) is essential for effective and efficient water quality management, so it can provide essential information on water quality and assist policy makers and water resource managers to identify potential causes of water quality deterioration. This framework is crucial for implementing actions such as infrastructure development, legislative compliance and environmental initiatives. Recent advancements in computational domains have created opportunities for employing artificial intelligence (AI), advanced statistics and mathematical methods for use in improved water quality management. This study proposed a comprehensive conceptual DSF to minimise the adverse effects of extreme weather events and climate change on water quality. The framework utilises machine learning (ML), deep learning (DL), geographical information system (GIS) and advanced statistical and mathematical techniques for water quality management. The foundation of this framework is the outcomes from our three studies, where we examined the application of ML and DL models for predicting water quality index (WQI) in reservoirs, utilising statistical and mathematical methods to find the seasonal trend of rainfall and water quality, exploring the potential connection between streamflow, rainfall and water quality, and employing GIS to show the spatial and temporal variability of hydrological parameters and WQI. Three potable water supply reservoirs in the Toowoomba region of Australia were taken as the study area for practical implementation of the proposed DSF. This framework can serve as a comprehensive mechanism to identify distinct seasonal characteristics and understand correlations between rainfall, streamflow and water quality. This will enable policy makers and water resource managers to enhance their decision making processes by selecting the management priorities to safeguard water quality in the face of future climate variability, including prolonged droughts and flooding.

1. Introduction

Water quality illustrates the physical, chemical and biological condition of water bodies, aiming to identify and address concerns through a comprehensive approach tailored to specific uses [1]. The United States Environmental Protection Agency (USEPA) has developed a detailed set of water quality criteria for the various uses of water, such as aquatic life, recreational, human health, wild life, wetlands and agricultural and industrial designated uses [2]. Human health water quality criteria protect any designed uses related to the ingestion of water, the ingestion of aquatic organisms, or other waterborne exposure from surface water [3]. As water quality is affected by both local and global processes [4,5], the regulation and management of water quality is regarded as a worldwide challenge [6,7]. According to a report by the World Economic Forum (WEF), the water crisis, which incorporates water quality issues, is considered to be one of the top ten global crises [8].
Variations in precipitation and temperature are significant consequences of climate change, which, in turn, impact water quality by modifying processes such as dilution, migration [9] and contaminant degradation in aquatic systems [10]. Changes in precipitation patterns predominantly affect the nutrient level and dissolved organic matter in surface water sources such as reservoirs, streams and rivers. A comprehensive review of literature carried out by Delpla et al. [11] related to climate change impacts on surface water quality revealed that dissolved organic matter tends to increase with increases in temperature and precipitation, whereas nutrient loading increases during extreme events such as droughts and heavy rainfall. Concerning global environmental performance, Australia is one of the world’s highest-ranked countries, but in recent decades, it has experienced the ruinous effects of climate perturbations, such as rising temperatures, changing rainfall patterns, and intensified flooding [12]. These short-term and long-term effects of extreme events have compromised the capacity to supply high-quality potable water to consumers. Moreover, the magnitude and frequency of such extreme events are projected to increase over the century [13], and uncertainties regarding the timing and nature of specific future events further intensify the challenges for water quality management [14]. The transformation of extreme weather events introduces a non-stationary problem [15], which is making forecasting future compliance difficult because climatic factors are closely linked to the degradation of source water quality [11,16,17]. Additionally, the design, operation and maintenance of drinking water treatment processes may be affected by physical, chemical and biological factors impacting source waters, which consequently impact the water treatment regulations, dosages of disinfectants and the formation of disinfectant by products [18].
Time series analyses of environmental data in aquatic ecosystems are important, as these data often exhibit seasonal trends and the accuracy of such analyses depends significantly on the selection of driving factors that impact water quality [19,20]. Pollutants from various sources, such as atmospheric deposition and runoff, are also affected by seasonal variations [21]. Previous studies applied regression analysis to identify environmental factors affecting water quality; however, the assumption of normal distribution, multicollinearity issues, and linear relationships can sometimes distort conclusions regarding these effects [22,23]. Recently, machine learning (ML) has emerged as an innovative approach to address the limitations of traditional statistical methods used to explore complex environmental circumstances and predict water quality [24,25,26]. Among these methods, Artificial Neural Networks (ANNs) are widely used for water quality prediction due to their simple structure, strong linear capability and capacity for continuous function approximation [27]. Other ML methods such as Decision Tree (DT), K-Nearest Neighbour (KNN), Support Vector Regressor (SVR), and Random Forest (RF), have demonstrated good predictive accuracy with a minimal number of input parameters [28]. Additionally, deep learning (DL) methods such as Long Short-Term Memory (LSTM), Bidirectional Long Short-Term Memory (BiLSTM) and Gated Recurrent Unit (GRU) have shown superior predictive performance in comparison to conventional models [29].
A sustainable water management system consists of planning, design, application and control stages, which rigorously consider the relationship among the various phases of a water quality management plan [30]. Effective environmental management and planning depend significantly on the proper management of water resources, including their allocation and utilisation to assess environmental impacts [31,32]. Climate change, population growth and urbanisation are driving increased water demand, necessitating the application of modern technology for effective management of water resources [33]. Conventional water governance often relies on established technical approaches [34]; however, AI methods offer dynamic capacity for flexibility, modelling and predicting the water quality and demand [35]. Hence, the development of an intelligent decision support framework that incorporates AI for water quality monitoring and modelling is particularly significant. An interactive computer-based intelligent decision support framework can guide users in a transparent and systematic way, facilitating decision making, maintaining detailed records of the decision steps. Recordkeeping serves to ensure transparency and accountability, allowing those involved in the decision making process to understand the rationale behind the decisions and allowing others not directly involved to acknowledge the logic behind those decisions [30].
An intelligent decision support system (IDSS) must be designed carefully and communicate efficiently across processes; consider cause–effect relationships, decision problem phenomena and other relevant indicators. The system should be capable of facilitating interactions between the end-users and domain experts for implementation [36,37]. The potential of ML and DL in water quality management, especially in decision making criteria, has been well demonstrated [38]. Accurate predictions of hydrological variables and water quality through AI can enable more efficient monitoring and utilisation of water resources. Moreover, planners and water management bodies can adapt long-term maintenance and operation plans, develop effective response strategies for extreme events, and enhance water quality monitoring efforts. In meeting the need for adaptability due to climate fluctuations, a standardised technical guideline can ensure the best solution. To deal with these challenges, we propose a decision support framework (DSF) that uniquely integrates ML and DL models with statistical and mathematical analysis, along with GIS. This framework is designed to assist policymakers in selecting the most appropriate actions to meet their requirements. This framework is based upon the outcomes of three studies: the first focuses on source water quality monitoring followed by the prediction of water quality index (WQI) using ML and DL models, with five water quality parameters affected due to extreme rainfall events as input parameters [39]; the second study examines the seasonal correlation between rainfall and water quality using trend analysis and a wavelet transform coherence (WTC) approach and the third study explores the correlation between discharge and water quality, applying ensemble machine learning models to predict WQI using discharge as the input variable [40]. The specific aims of this study are as follows:
  • To develop a conceptual DSF integrating ML models, DL models, mathematical methods and statistical approaches for water quality management in reservoirs.
  • To explore and present the main components of DSF system architecture.
  • To explain the applicability and implementation steps of the DSF in the Toowoomba region of Australia.

2. Literature Review

2.1. Related Works

Tiyasha et al. [41] performed a comprehensive review of various AI models implemented for river WQ modelling, covering research conducted over the past two decades spanning from 2000 to 2020. The review primarily examined ML models, considering various types of input and output as WQ parameters. The reviewed models were artificial neural network (ANN), adaptive neuro fuzzy inference system (ANFIS), and support vector machine (SVM) along with their hybridised forms. Another review related to this study [42] re-examined both standalone and hybrid models in the context of WQ modelling for river waters. This review also introduced a more technical approach to data preprocessing that included data splitting and normalisation.
Chang et al. [43] developed a machine learning model called a hydroinformatics integration platform (IHIP) for online flood forecasting and inundation depth in regional areas. The model comprises five components, including data access, data integration, service management, functional sub-system and end-user applications. Google Maps were incorporated into the platform to enhance advanced flood prediction and alert systems.
Modgil et al. [44] initiated the Cascade modelling approach (CMA) for long-term sustainability of water resources under climate change. The analysis highlighted the present management scenarios of irrigated agriculture concerning the system’s future feasibility. The results demonstrated that the current water resource management strategies should be reviewed to take account of climate change and its impacts.
Deep learning methods such as long short-term memory (LSTM) and convolutional neural network (CNN) were adopted to simulate water quality and water depths in the Nakdong River Basin in South Korea. The CNN method was used to simulate the water depth, while the LSTM was applied to model water quality. In this study, organic carbon, phosphorus and nitrogen contents were considered as the water quality parameters. Both CNN and LSTM showed performances in a ‘very good’ range with a Nash–Sutcliff efficiency (NSE) value of more than 0.75 [45].
Jadhav and Pingle [46] developed an automatic water quality prediction model using temperature, pH and turbidity as key water quality parameters. The framework of the model consisted of a base station, sensors, a monitoring server system and a PIC micro controller. Data were collected from the base station using a global system for mobile communications (GSM) monitoring system. When the water quality deviated from the expected level, the GSM system triggered alerts via a short message service (SMS). However, the developed model was designed specifically for water quality measurement, and other significant issues, such as causes of water quality deterioration and water leakage, were not considered as part of this study.
A study carried out by Sayari et al. [47] used five standard AI models, namely artificial neural network (ANN), adaptive neuro fuzzy inference system (ANFIS), support vector regression (SVR), multivariate linear regression (MLR) and group method of data handling (GMDH) and their integration with nature-inspired Firefly algorithm (FA) to forecast the infiltrated water in the furrow irrigation system. Five accuracy metrics, such as root mean square (RMSE), mean absolute error (MAE), correlation coefficient (R2), Nash-Sutcliff efficiency (NSE) and index of agreement (IA), were used to evaluate the model performances. The model’s performance revealed that the models integrated with FA provided the best accuracy in prediction and can be used as a power tool to enhance the complicated modelling process.
Saraiva et al. [47] proposed an integrated automatic detection model integrating U-Net and CNN. This proposed system offers a rapid and precise solution for mapping centre pivot irrigation systems with high spatial and temporal resolution. The proposed model achieved 99% precision and 88% recall in detecting and mapping in the case study area. It also has the potential to be applied to larger areas for monitoring agricultural water use.
Figueiredo et al. [48] proposed the Water Wise system (W2S) for urban water management utilising ML and DL techniques and integrating with EPANET, GIS and supervisory control and data acquisition (SCADA) systems. The system architecture consisted of three main components, such as data source, data storage and processing, and presentation. Internet of Things (IoT) technologies were used for data transmission, while data integration was facilitated by the Kafka technology stack and the Mulesoft Enterprise Service Bus. Apache Flink was applied for complex event data processing and real-time event detection. PostgreSQL and Cassagranda database systems were used to store the data. Additionally, multiple machine learning models were trained to provide valuable insights for enhancing water network management.
Yuan et al. [49] developed a climate-water quality assessment framework (CWQAF) to estimate the impact of climate change and human activities on water quality changes in the Minijang river basin of China. The relationship between climate change and water quality was interpreted by climate-water quality response coefficients (RCs). The changes in RCs with different climatic factors were examined across a period of ten years. The study provided a framework for quantitative analysis of factors affecting water quality to enhance effective water quality management.
Adaptive Intelligent Dynamic Water Resource Planning (AIDWRP) was proposed by Xiang et al. [35] for enhancing sustainable urban water resource management. This framework leverages an adaptive intelligent approach, which is a specialised subset of artificial intelligence (AI) and capable of addressing the complexities and uncertainties involved in water resource management. The Markov Decision Process (MDP) was used to optimise environmental planning and management methods. The findings of this study indicated that the AI-based modelling system with the proposed AIDWRP can enhance decision making processes in urban water resource management. Specifically, the model contributes to the development of sustainable water management strategies that effectively balance water supply and demand while minimising environmental impacts.
Lee et al. [20] established a framework to prioritise total phosphorus (TP) management strategies based on four ML models for Euiam lake, Korea. The TP concentration was predicted by the LSTM model, and a gradient boost analysis was performed to identify the most influential factors. The proposed framework was suggested to enhance the feasibility of prioritising TP management and achieve the targeted TP concentration.

2.2. Research Gaps in Water Quality Management Influenced by Climate Change

The 2023 Sustainable Development Goals (SDGs), developed by the United Nations (UN), aim to ensure rescue plans for people and planet by 2030. Among the seventeen selected SDGs, SDG six focuses on “Clean water and sanitation”, while SDG thirteen emphasises “Climate action” [50]. To ensure equitable access to safe drinking water for all, a synergistic approach that integrates these two goals is required. A rigorous analysis and validation of the effect of climate variables, such as rainfall and temperature, on water quality are essential for understanding the potential impacts of future climate change [51].
A solid and thorough understanding of the impacts of climate change on water and nutrient transport is essential for effective water quality management [52]. For example, St. Croix River basin in the USA, a basin of high resource value, is experiencing deteriorating water quality due to nutrient transport from land to rivers [53]. Current nutrient management practices are based on existing perceptions of nutrient cycling and water quality. However, the magnitude and spatial and temporal variability of water and nutrients might be impacted by future climate change, which may potentially impair catchment management efforts. Nutrient mineralisation, immobilisation and atmospheric emissions are significantly influenced by changes in temperature and rainfall [54,55]. Therefore, it is important to evaluate how evolving climate factors will influence catchment hydrology and biogeochemistry [53].
J-Nkanga [56] examined the combined effects of rainfall and associated hazards on piped water quality in Benin, Nigeria. Similarly, in the city of Antananarivo in Madagascar, urban piped water quality was examined over a 32 year period to assess the cumulative impacts of weekly and monthly rainfall [57]. A laboratory study was carried out by Nogueira [58] to evaluate the microbiological water quality of treated and untreated water in the region of Maringá, in the Paraná state of Brazil. It was found that the concentration of faecal coliforms increased with monthly rainfall. However, these studies were primarily based on laboratory analysis, and no statistical or analytical measures were considered to show the correlations and future impacts.
Soil erosion is an expository process influencing sediment transport in rivers and streams, and it is affected by climate change [59]. During intense and prolonged precipitation events, rainfall supplies the energy needed to dislodge fine soil particles from erosion sites. Runoff then carries these mobilised soil particles, directly influencing the quantity of sediment and consequently increasing turbidity and dissolved solids, leaching chemicals and contaminants into water bodies [60,61,62]. Additionally, increased streamflow under future climate change scenarios may contribute to enhanced sediment transport [63]. Therefore, future impact analysis and the implementation of related conservation practices are necessary.
Precipitation and streamflow are critical indicators of physical water quality metrics, such as total suspended solids (TSS), which are directly related to streamflow fluctuations [64,65]. Besides these, eutrophication is caused by high nutrient loads such as phosphorus (P) and nitrogen (N), which have a direct relationship with streamflow, while phosphorus is a primary cause of eutrophication in freshwater ecosystems [66]. Water quality management practices are mainly focused on controlling P and N loads. Integrating the climate and land use changes into hydrological modelling should be a prevalent research focus, particularly for addressing the combined and individual impacts of water pollutants [64].
Several studies have been conducted to examine water quality dynamics during flood events, such as MIKE [67,68], CE-QUAL-W2 [69], Eco-Lake [70], coupled SWAT, and HEC-RAS [71]. To examine the long-term effects of climate change on water quality, current water quality models often incorporate hydrological variables obtained from General Circulation Models (GCM). For example, the INCA model uses GCM-derived inputs to simulate the concentration of nutrients during floods and droughts under climate change scenarios in the Mekong river basin in China [72]. However, traditional and numerical models, while capable of identifying causal links between water quality parameters and climate variables, often failed to deal with a large number of non-linear datasets [66].
The synthesis of survey reports conducted by the Water Research Foundation on major water utilities in Australia and the United States highlighted concerns about the impacts of extreme climatic events on drinking water quality [18]. There is a slight difference between the surveys of the two countries because of the difference in disinfections by product regulations. Long-term climate trends such as rises in temperatures and sea levels, plus prolonged hot seasons, are of lesser concern for both countries. However, during extreme events such as drought, rainfall and flooding, utilities become the primary focus of concern [18].
Some important points should be noted in water quality management in response to climate change. There is a requirement for sustained monitoring programmes that will provide long-term data to improve understanding and prediction of climate impacts on water quality. Prediction models should be capable of detecting the non-linear response and feedback mechanisms in water systems. Furthermore, comprehensive studies incorporating new technological innovations are essential to evaluate the effectiveness of various strategies under different climate scenarios as well as to understand how extreme events affect pollutant loads, sediment transport and nutrient cycling.

3. Materials and Methods

3.1. Data

The proposed framework was developed based on the findings from our three studies [39,40,73]. These studies utilised rainfall, discharge and water quality data to conduct comprehensive analyses, which have informed the framework’s design and structure. We received weekly water quality data of the three dam reservoirs from the Toowoomba Regional Council (TRC). Five water quality parameters, such as pH, Turbidity, Total Dissolved Solids, Ammonia Nitrogen (NH3-N) and Phosphate (PO4), were considered in order to calculate the WQI. TRC is the local authority responsible for the water supply in the Toowoomba region. Rainfall data were obtained from the Bureau of Meteorology (http://www.bom.gov.au/, accessed on 7 March 2024), and streamflow data were obtained from the Queensland water monitoring information portal (https://water-monitoring.information.qld.gov.au/, accessed on 7 March 2024). The related studies used temporal data over a period of twenty-two years, spanning from 2000 to 2022.

3.2. Software

In our analysis, a range of software tools was employed to ensure precise data processing, modelling, and visualisation. These tools were selected for their capabilities in handling large datasets and performing complex statistical and machine learning tasks. The list of software and their applications are listed in Table 1.

3.3. Design Considerations of the Proposed Framework

The proposed framework (Figure 1) aims to address the complex interactions between rainfall, streamflow, and water quality. The framework is built using data-driven approaches that involve the integration of long-term historical data on rainfall, streamflow, and key water quality parameters. The framework will be able to provide a model-based information system with the aid of images and ML and DL models for water quality forecasting for decision making. Spatial and temporal analysis will help the users easily understand the correlation pattern and fluctuations. This will guide policy makers in responding to events and achieving the desired water quality in accordance with Australian and New Zealand Guidelines for Fresh and Marine Water Quality (ANZEC 2000) [74].
The methodological steps that are followed in proposing the framework based on our previous three studies [39,40,73] are as follows:
Step 1: Selection of climate change impact. Among the various climate change impacts such as temperature rise, sea level rise, drought and extreme rainfall, the extreme rainfall impact on surface water quality was considered.
Step 2: Exploring suitable parameters that serve as indicators. In this step, we focused on identifying and selecting the key water quality parameters that serve as critical indicators of water quality [39]. In the selection, the Queensland Water Quality Guidelines (QWQG) within the context of ANZEC 2000 are followed. The selected parameters are pH, Turbidity, Total Dissolved Solids (TDS), Ammonia Nitrogen (NH3-N) and Phosphate (PO43−). These parameters were chosen based on their relevance to the impacts of extreme rainfall events and the significance of these events in the overall assessment of water quality. By carefully determining these indicators, we aim to enhance the accuracy and reliability of our water quality predictions and assessments.
Step 3: Computation of water quality index (WQI). The WQI is calculated by applying the weighted arithmetic mean method. The five selected water quality parameters are assigned weight based on different authorised standards and their potential for surface water pollution [75,76]. Weightage is allocated on a scale of 1 to 5. The maximum weight is allocated to the parameter with the most restricted range and most significant influence. The minimum weight of 3 is assigned to Turbidity, with weight 4 assigned to pH and TDS and 5 assigned to NH3-N and PO43− [39].
Step 4: Prediction of WQI. Using four ML and two DL models, predictive algorithms are developed that predict WQI by using selected parameters as inputs [39]. The ML algorithms employed were SVR, RFR, AdaBoost and XGBoost and DL algorithms were BiLSTM and GRU. In the model development phase, 30% of the data were used as testing data. The predictive accuracy was evaluated based on seven accuracy metrices, such as coefficient of determination (R2), root mean squared error (RMSE), mean absolute error (MAE), mean absolute percentage error (MAPE), coefficient of efficiency (CE), Willmott index (d), and mean squared relative error (MSRE).
Step 5: Trend and correlation analysis of rainfall and water quality. Two types of trend analysis methods were applied to observe the trends of rainfall and water quality: the Modified Mann–Kendall (MMK) test and the Innovative Trend Analysis (ITA) [73]. The former is a statistical method that examines the trend with statistical significance and is an adaptation of the traditional Mann–Kendall test. The modification accounts for the presence of autocorrelation in the data, which can lead to misleading results in the original test [77]. The monotonic trend in a time series can be assessed using the Z value. A positive Z value signifies an upward trend, while a negative Z value indicates a downward trend. The statistical significance of this trend is evaluated through the p value, where a p value of less than 0.05 denotes that the trend is statistically significant [78]. However, conventional methods like MMK may overlook subtle variations in data, whereas graphical and visual representation of trends aids in identifying extreme events like intense rainfall leading to flooding or low rainfall causing drought [79]. To bridge this gap, the second method, ITA, is employed within this submodule to visualise and interpret the trends and shifts in the time series. ITA is a mathematical and non-parametric graphical method and is capable of handling autocorrelation and outliers within the time series data [80,81]. ITA is capable of detecting both monotonic and sub-trends and also can identify combinations of trends across different periods [81]. In cases where there is a necessity to examine and view the trend quickly, ITA can provide the end-users with the patterns and transitions in data. Both MMK and ITA methods were applied to observe the trends of rainfall and each water quality parameter and their associated WQI. The impact of increasing and decreasing trends on the WQI was also examined [73].
In addition to the trend analysis, to explore the relationship between rainfall and WQI in both time and frequency domains, Wavelet Transform Coherence (WTC) was applied. WTC was introduced for the purpose of estimating the temporal evolution of hydrological signal complexity [82]. In wavelet coherence plots, the thick black contours mark the 5% significance level. The lighter shading on the plot is the cone of influence (COI), where the edge impacts the wavelet power. The phase relationships are specified by arrows. Arrows pointing to the right indicate that the time series are in phase, whereas arrows pointing to the left reveal an anti-phase relationship. Arrows pointing upwards signify that the first time series leads the second by 90°, and arrows pointing downwards indicate the opposite. The red and yellow colours in the plots displayed the stronger correlation, while a weak correlation is specified by a blue colour [83,84,85]. There are four seasons in Australia: Autumn (March–May), Winter (June–August), Spring (September–November) and Summer (December–February) [86]. Over the span of 22 years from 2001 to 2022, the variation in WQI with seasonal rainfall volume was observed.
Step 6: Correlation analysis of rainfall, streamflow and water quality. The correlation analysis of rainfall, streamflow and water quality focuses on the Generalised Additive Model (GAM) methodology. This approach examines the influence of rainfall and streamflow on the water quality variations using raw data. The GAM applies an additive link function to interpret the relationship between the predictor and the response variable [87]. In our study, a cubic spline smooth function is applied, which is a smooth curve consisting of sections of cubic polynomials [88], and the water quality is used as response variable, while rainfall and streamflow are used as non-parametric predictor variables. The water quality is forecasted and modelled using weekly, monthly and seasonal time series. Weekly analysis can resemble the variations caused by acute events such as storms, while monthly analysis can point out the persistence of certain water quality issues, and seasonal analysis can reveal the impact of different climatic conditions [40]. The model smoothness is evaluated by a p value, and a generalised cross validation (GCV) score is then considered to check the data overfitting. The correlation is measured using the effective degrees of freedom (edf) value. The edf value ranges from 1 to 2, where 1 signifies a linear relationship and greater than 2 corresponds to a highly non-linear relationship, while an EDF value greater than 1 but less than or equal to 2 represents a weakly linear relationship.
Secondly, the WQI is predicted using an ensemble ML model XGBoost-BO using streamflow as the input variable across three temporal scales: weekly, monthly and seasonally. Extreme Gradient Boosting (XGBoost) is a widely used and robust machine learning model that utilises a scalable, end-to-end tree boosting system, enabling it to capture complex linear relationships between a set of input variables and target variables [89]. To enhance the model’s accuracy, a systematic optimisation process using Bayesian optimisation is applied to fine-tune the hyperparameters. Bayesian optimisation offers an efficient way for solving computationally intensive functions by picking out the optimal points. It combines prior knowledge of the objective function with sampled points to update the understanding of the function’s distribution using a Bayesian approach. This updated information is then used to estimate the optimal values [90]. The accuracy of the model is evaluated by three accuracy metrices R2, RMSE and MAE values.
Step 7: Development of the proposed decision support framework. A conceptual decision support framework (DSF) is designed to provide real-time forecasting capabilities, allowing for the continuous monitoring and prediction of water quality under varying hydrological conditions and ultimately serving as a robust platform for informed decision making in the face of environmental challenges. Following the previous studies [91,92] and the water quality management framework of the Australian Government Initiative [93], four basic components are considered in designing the framework, such as Identifying and Understanding, Analysis, Planning and Management and Database.

4. Results

4.1. Components of the Proposed Decision Support Framework

The components of the proposed DSF are designed to address specific aspects of the process, ensuring a comprehensive approach to manage and improve water quality. The proposed DSF can enhance water quality management through a comprehensive, data-driven approach to understanding the subtle correlation of water quality and hydrological variables and forecasting water quality. It enables proactive decision making, improves forecasting accuracy, and supports adaptive management strategies in response to extreme rainfall events. The following sections detail how each module of the framework will function to achieve the objectives.

4.1.1. Identifying and Understanding Module

This module is based on the first work related to this study [39], primarily for information management, which comprises water quality information and the assessment and evaluation of water quality, which provide input to the analysis module. This module will enable the users to retrieve the relevant information about the status of water. Based on the computed WQI, the water quality of the Cooby Reservoir was poor (WQI 25–50), and that of the Cressbrook Reservoir and Perseverance Reservoir was in a very poor range (WQI 0–25) during 2000–2022.
By examining the status of the selected water quality parameters during extreme rainfall events, the status of WQI can be evaluated. The temporal charts can provide the user with the status of the variation in the water quality parameters and associated WQI. In our first study, by examining the temporal charts, it was observed that the lowest WQI values were seen in the end of 2010 and the beginning of 2011 in all three reservoirs when severe flood events occurred in the Toowoomba region [39].

4.1.2. Analysis Module

The Analysis module offers the end-user an interface to build a prediction model; perform the correlation and trend analysis of rainfall, streamflow and water quality; analyse the results; interpret the predicted model outputs; inform the user and propose action plans. To accomplish these tasks, the analysis module includes three submodules. The WQI prediction model can forecast the WQI by using the selected water quality parameters as input for three reservoirs, while the second sub module can examine the trends of both rainfall and water quality parameters and establish their correlation, and then the third one can perform the correlation of rainfall, streamflow and water quality, while the WQI prediction model can predict the WQI by using streamflow as the input parameter. The prediction models are developed by artificial intelligence. The main functions of the aforementioned submodules are explained in the following sections.
(i)
Prediction of WQI by AI
This module is focused on the development of AI-driven models specifically to support decision makers in responding to the impacts of runoff due to the impact of extreme rainfall on water quality. By integrating state-of-the-art artificial intelligence techniques, we aimed to create a predictive model to forecast the WQI value to provide actionable insights for timely interventions [39].
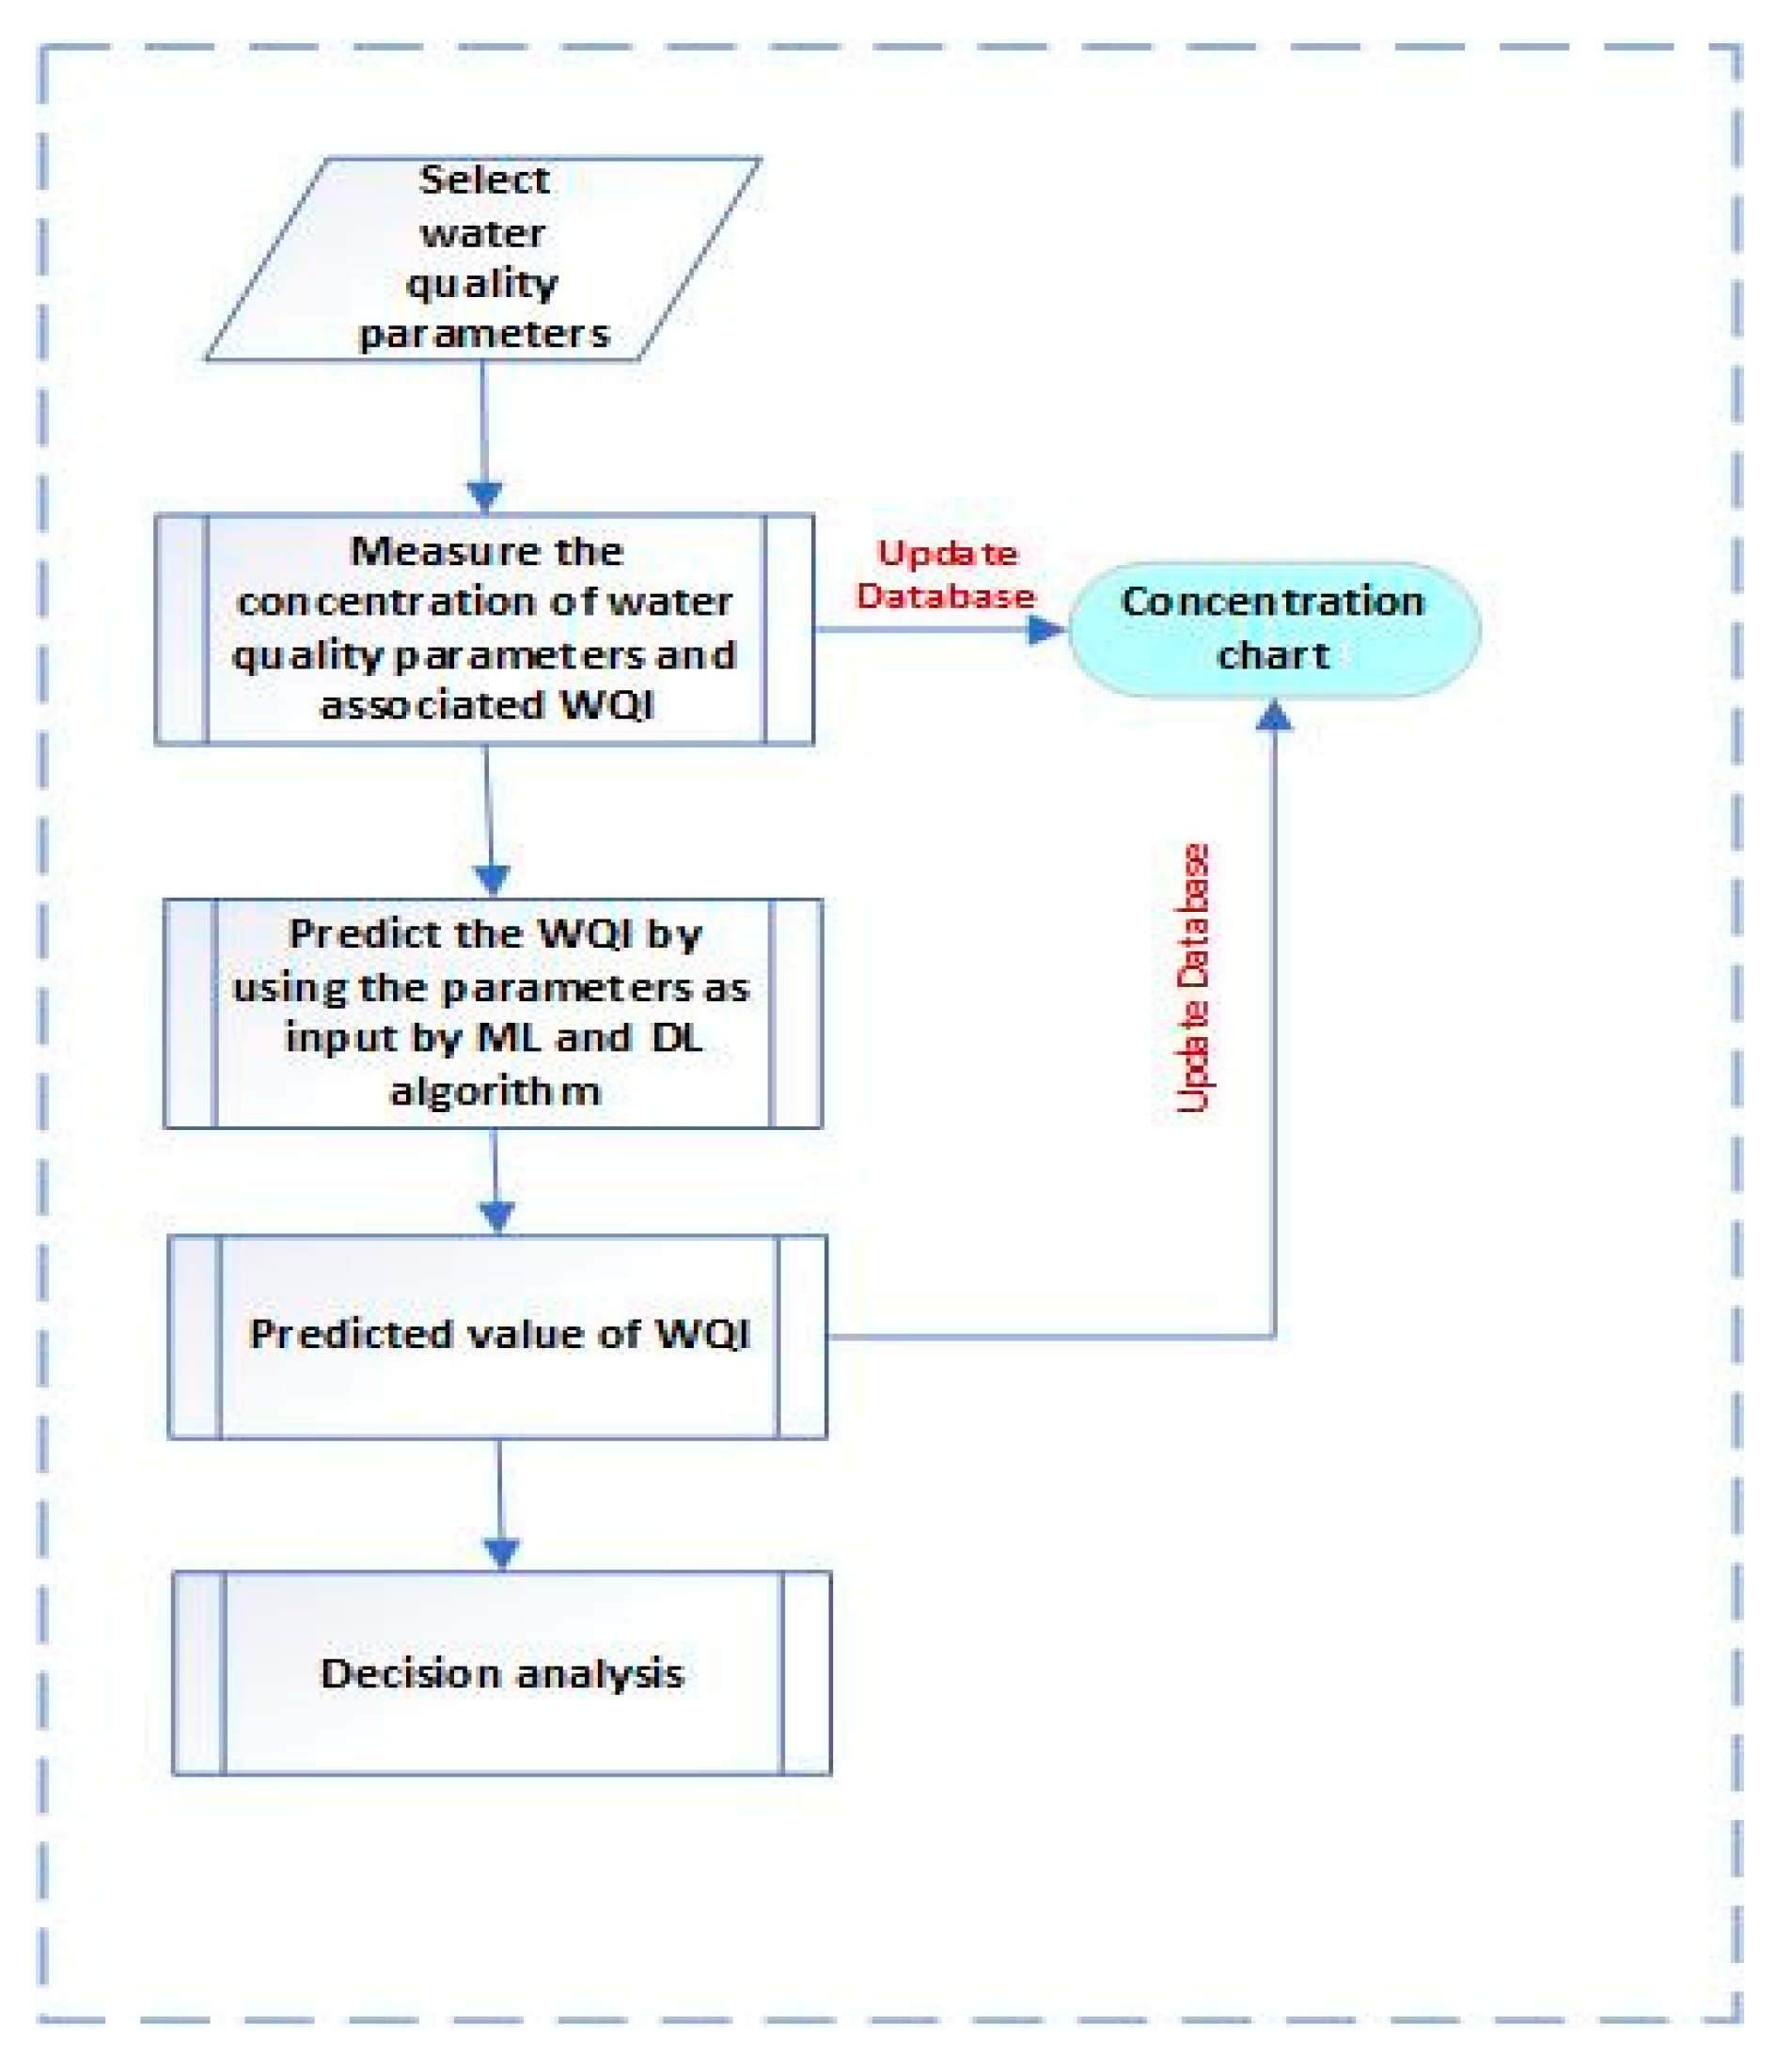
The ML and DL model-based WQI prediction model is designed to forecast the WQI, particularly in response to changes caused during extreme rainfall events. This process begins with the careful selection of key water quality parameters, which are critical indicators of the overall water quality, and involves measuring the concentrations through in situ measurements and archived sampling records, providing both real-time and historical data as illustrated in Figure 2. These data are continuously updated in the database to ensure the model is working with the most current and comprehensive dataset. The data are then fed into four ML models (SVR, RFR, AdaBoost, XGBoost) and two DL models (BiLSTM, GRU) to predict the WQI for the future. This prediction provides a quantifiable measure of water quality allowing for the anticipation of potential changes and is vital for understanding the immediate risks and potential impacts. The evaluated and predicted WQI may help to determine the necessary actions, such as adjusting water treatment options, issuing public advisories and relocating resources to mitigate the predicted impacts.
(ii)
Trend and Correlation analysis of Rainfall and Water Quality
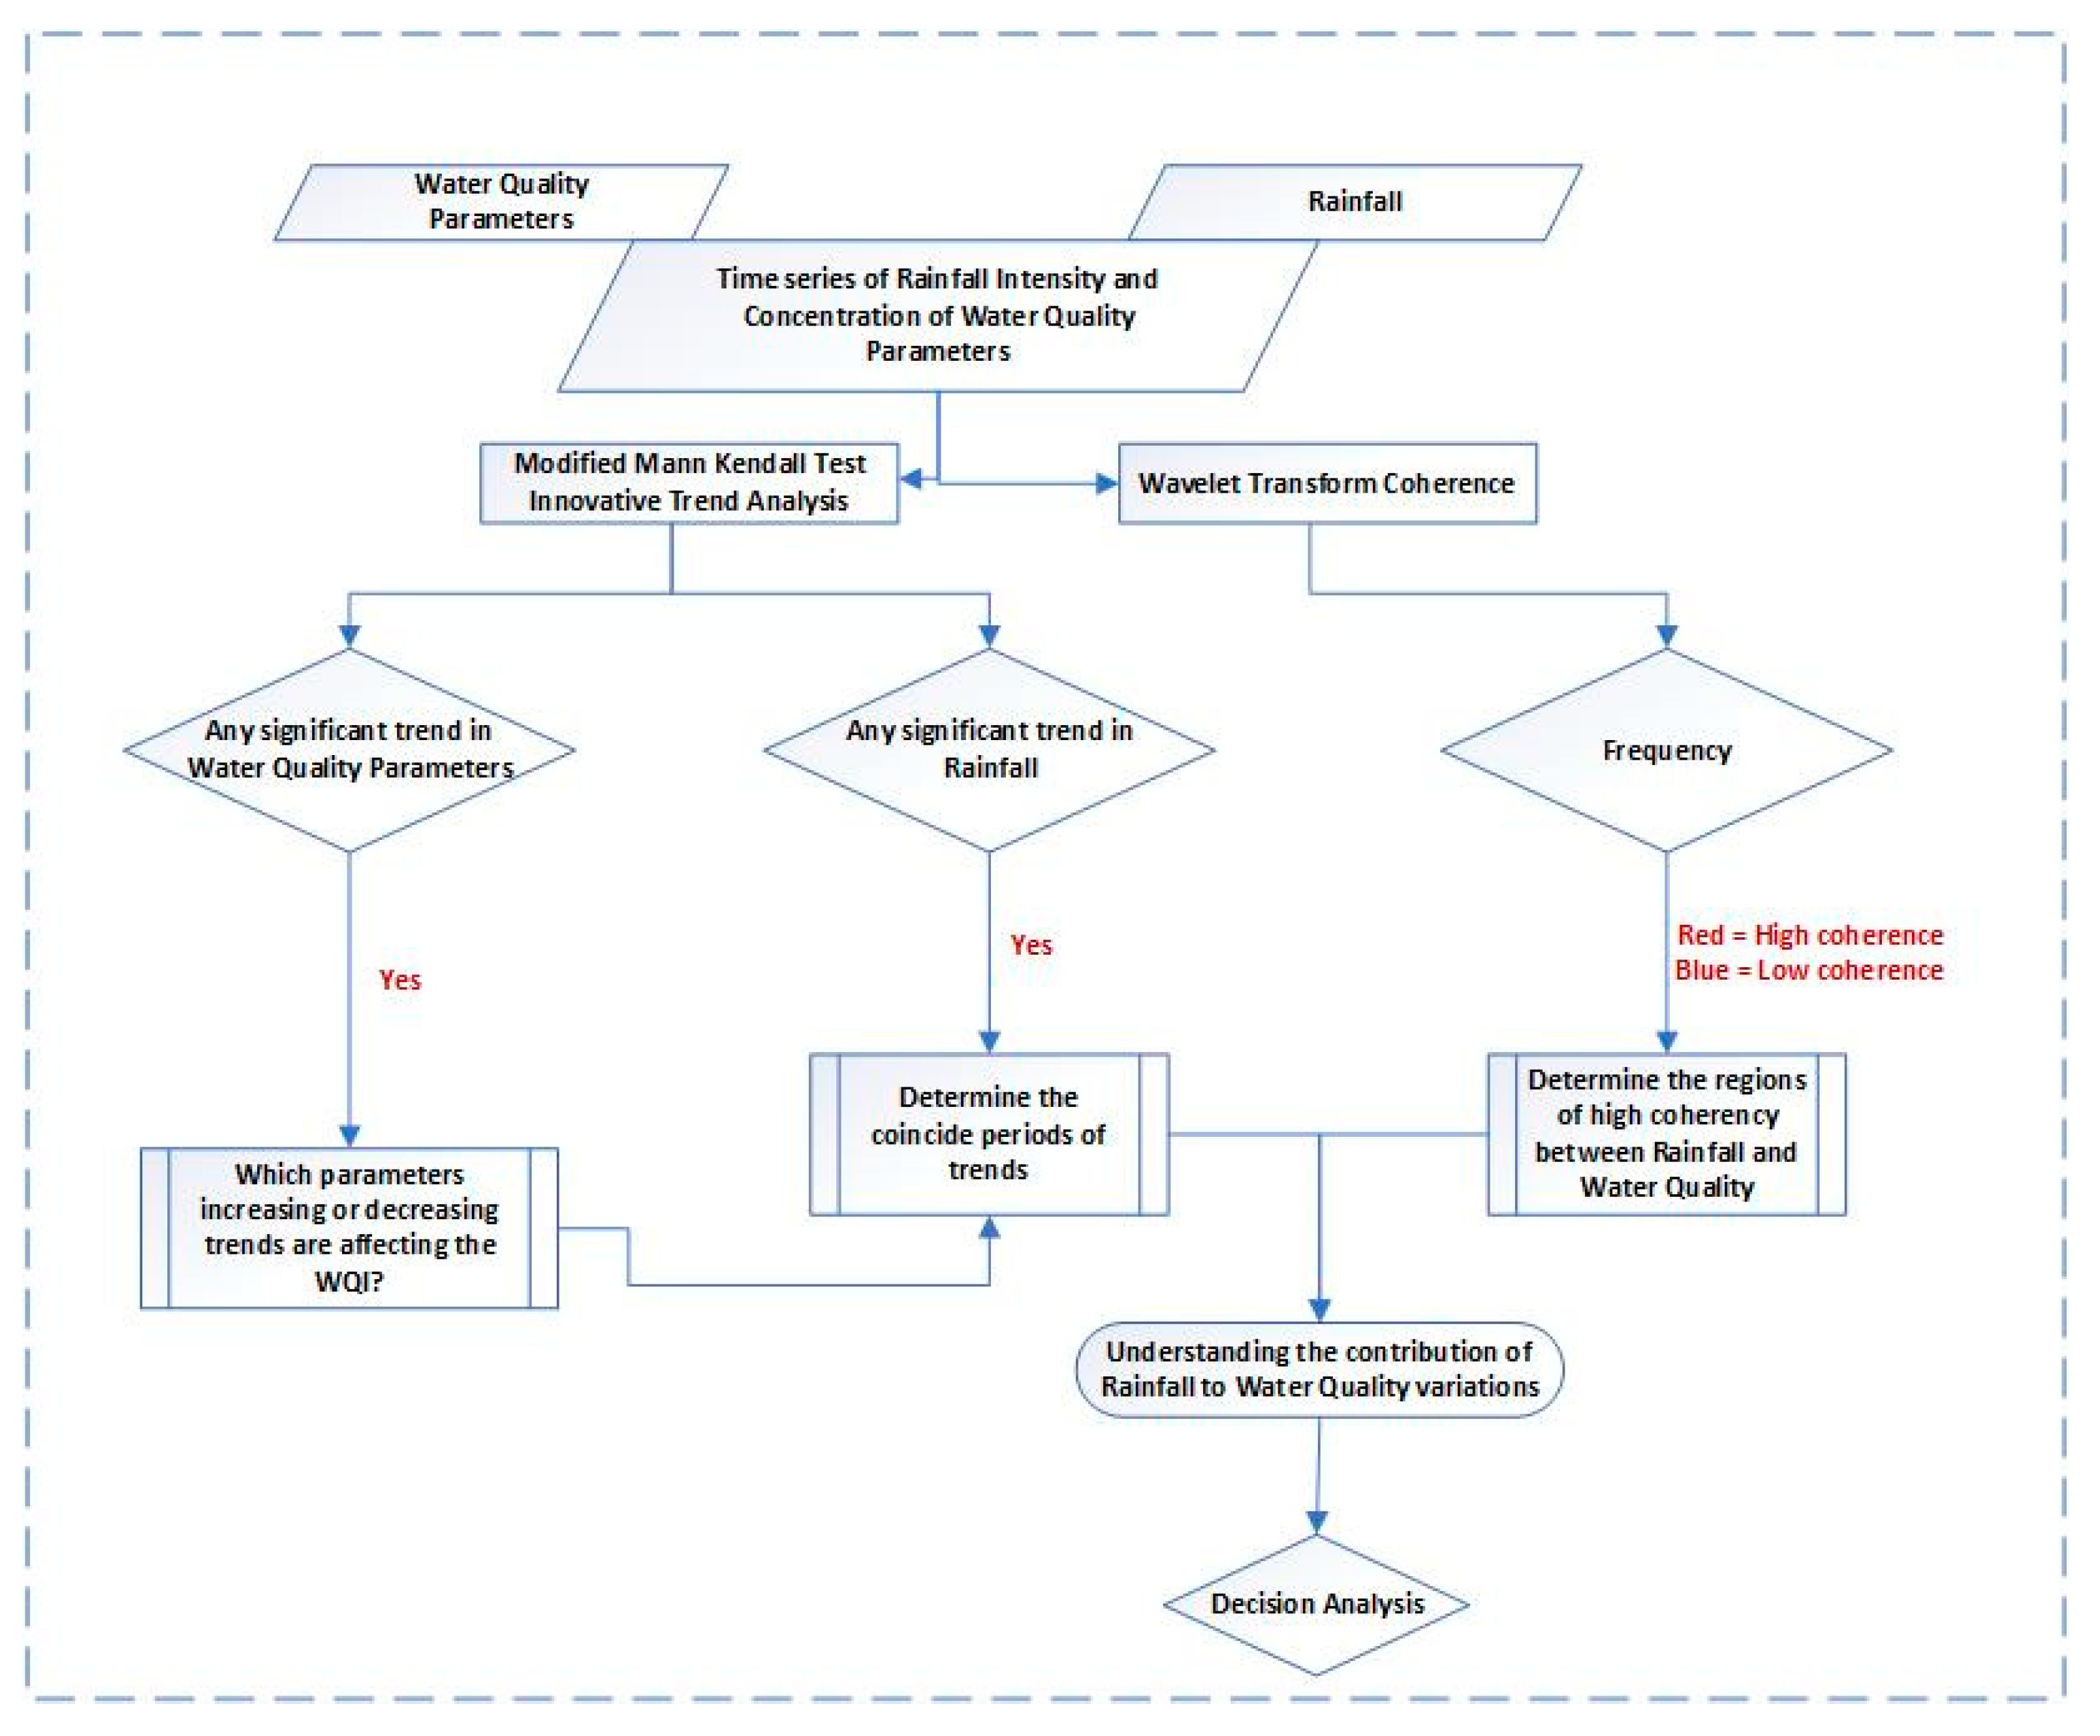
This submodule is based on our second analysis related to this study [73]. In the graphic user interface of the framework, this second submodule starts with taking the seasonal time series rainfall and water quality data (Figure 3). Firstly, the rainfall and water quality data are fed into the codes of MMK (mmklag1) in R studio. The lag1 is used in the code so that the code can detect the autocorrelation in both rainfall and water quality data. The output of MMK can provide where the significant trend/s in rainfall and water quality exist. By observing the trends of each water quality parameter, following the weightage in the first submodule determines which parameter fluctuations are affecting the WQI. We use the seasonal data to observe the trends, but daily, weekly and monthly data can be applied to detect the trends. MMK tests cannot provide proper results if the number of observations is limited, and it is essential to have enough observations in the data when Kendall’s tau (τ) is applied as an early warning signal. Nevertheless, an MMK test is an efficient method that does not require a large number of datasets to evaluate the significance of Kendall’s tau (τ) values in an early warning system using a single time series [94]. Furthermore, the ITA method can be used to easily examine the straightforward trends and shifts in the data. The statistical, mathematical and graphical methods are aimed at observing the trends in water quality parameters that, along with rainfall and the time series data, can be obtained from the database or in situ measurements. Moreover, along with ITA and MMK, by inserting the two-time series (Rainfall and Water Quality) in WTC coding in R studio, a clear co-movement pattern can be easily understood via generated WTC plots where red and yellow colours show the stronger correlation.
(iii)
Correlation analysis of Rainfall, Streamflow and Water Quality and Prediction of WQI by AI
This module is based on our third study [40], which is the correlation analysis between rainfall, streamflow and water quality parameters and the prediction of WQI by using streamflow as the input parameter via the ML algorithm.
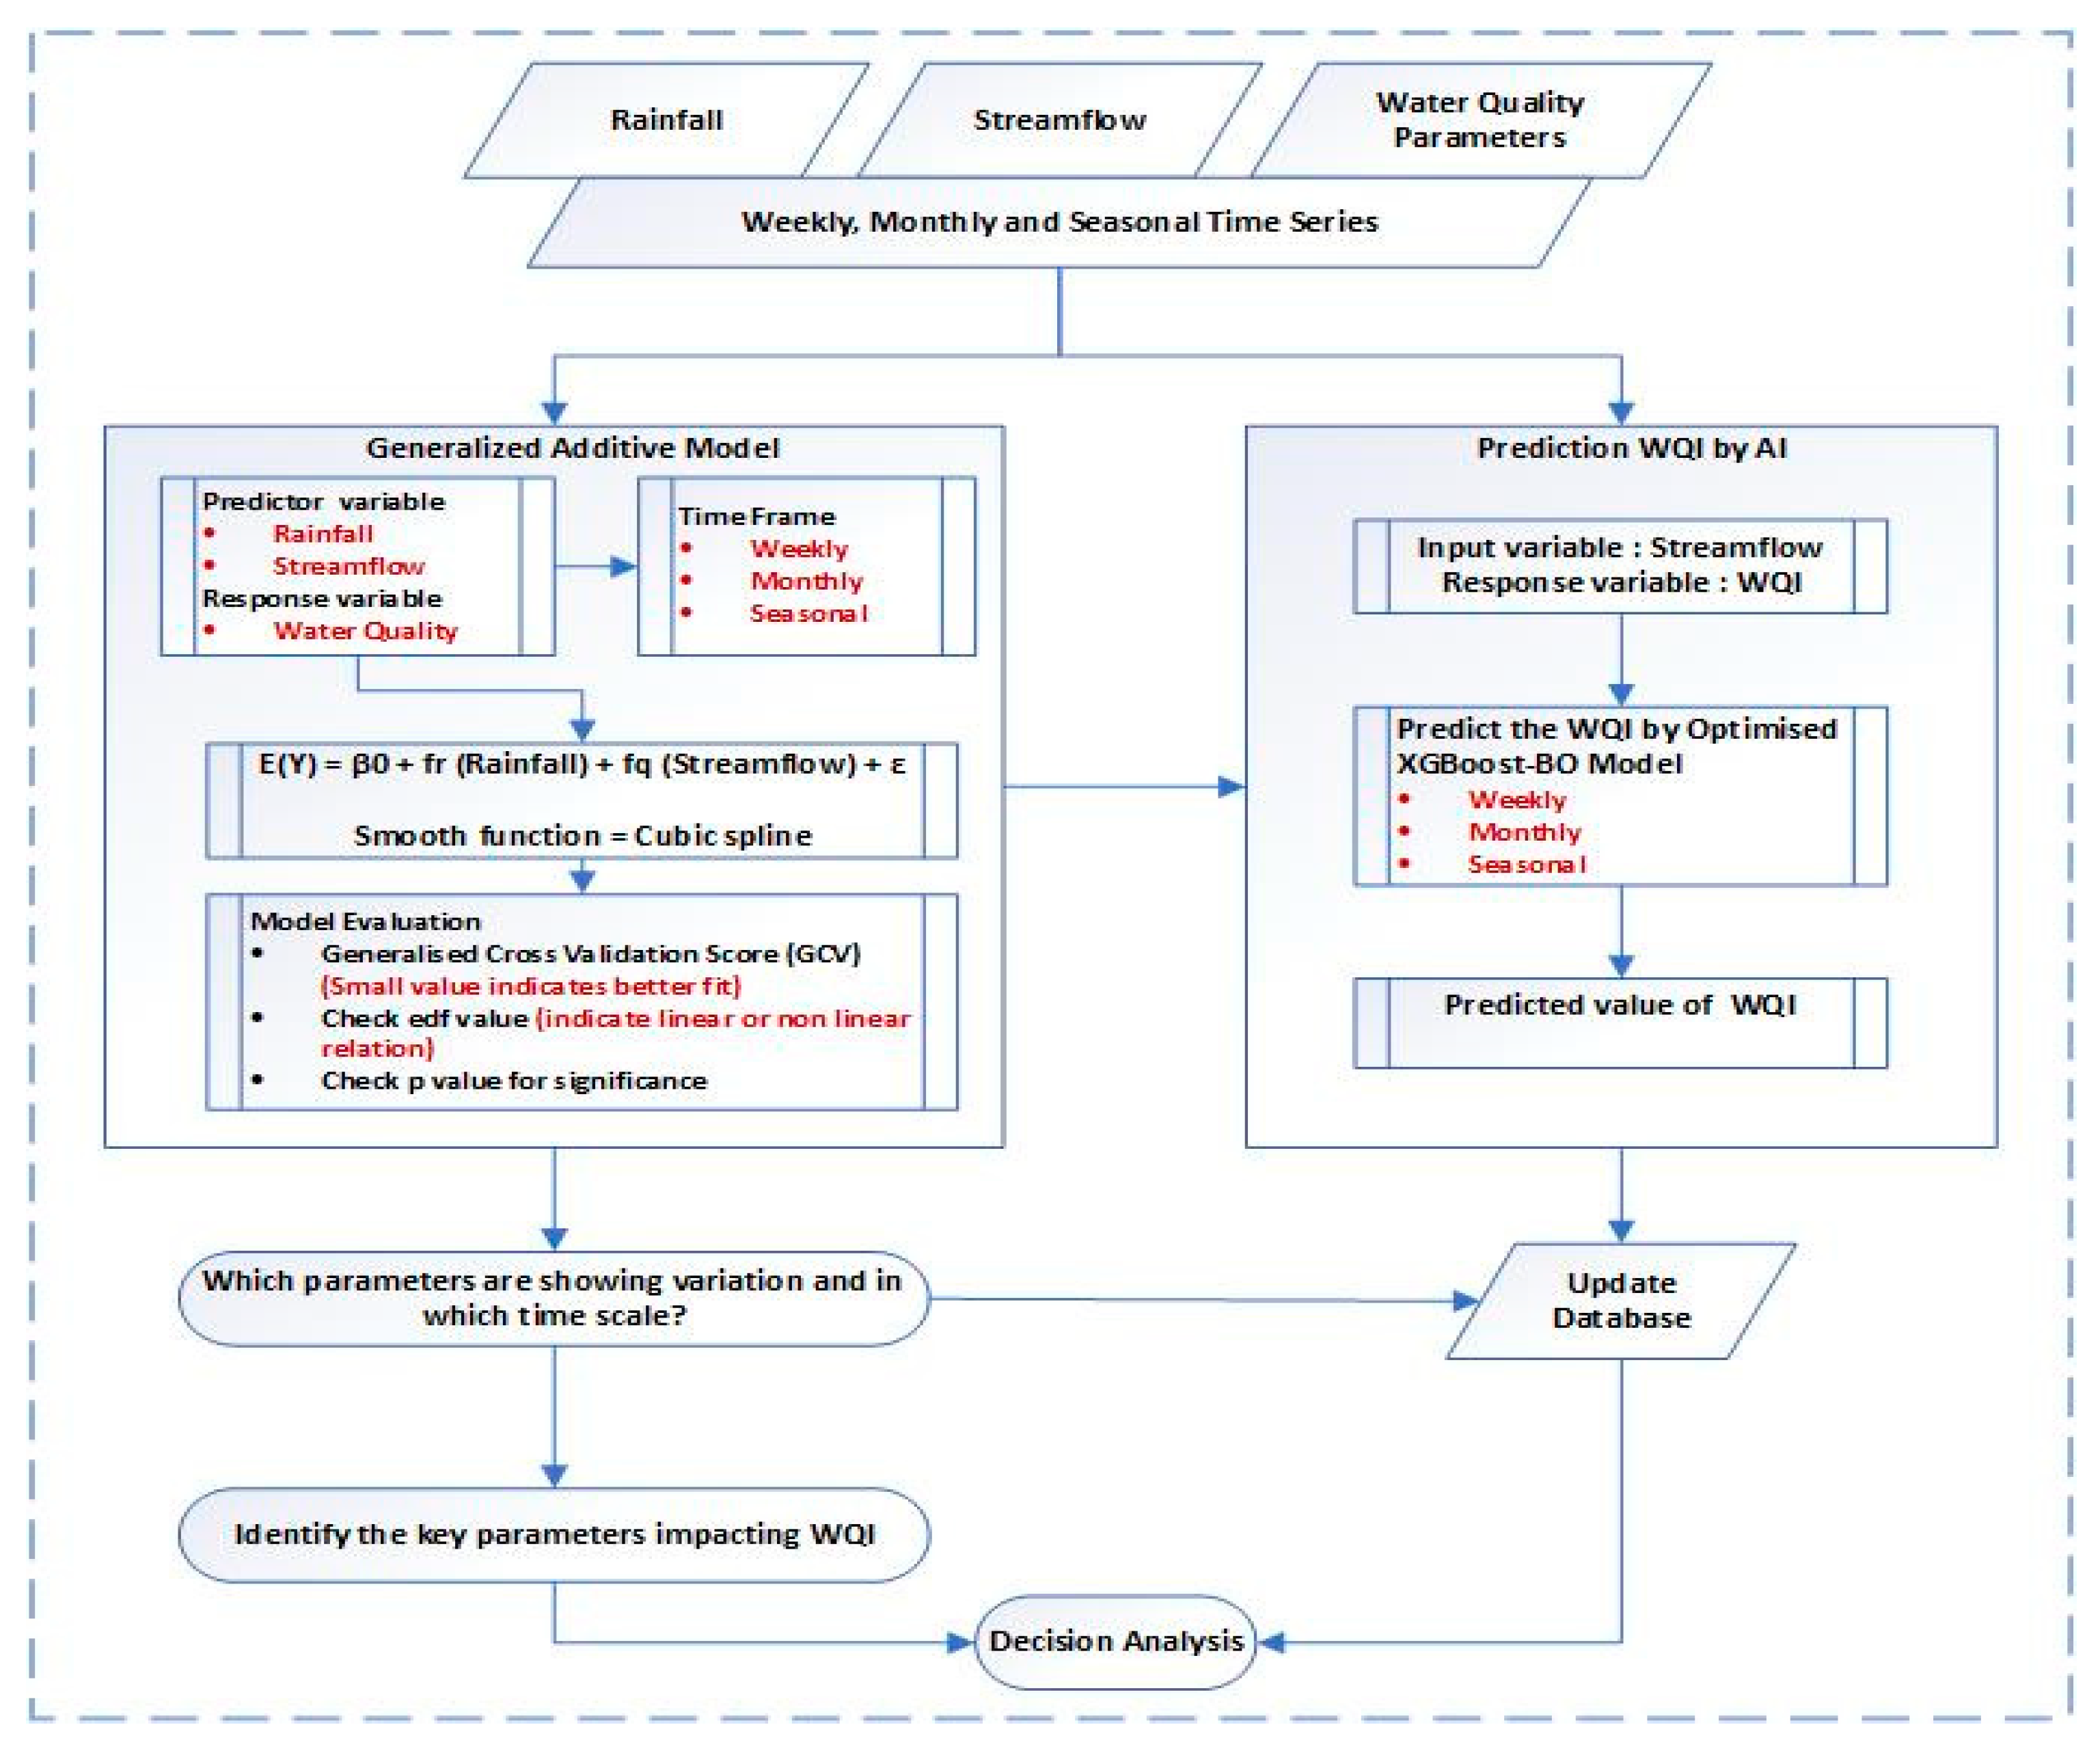
In the graphic user interface of this submodule (Figure 4), the correlation analysis starts with taking the time series data of rainfall, streamflow and water quality parameters. The data sheets are loaded from the database, and the values of edf are displayed for the end-users. The input data are fed into the equation of GAM in R studio, and the edf values with significance (p value) are displayed in the result. By observing which parameters are showing variation and by following the weightage noted in the first module, it will be easy to identify the key parameters whose variations are impacting the WQI. The key parameters should be updated in the database. In the subsequent step of the WQI prediction, the time series of streamflow is used as input in the XGBoost-BO model to predict the WQI. The R2 value is 0.75 in training and 0.67 in the testing phase of our developed model on a weekly scale. After that, the predicted WQI value can be added to the database.
In the Analysis module, the WQI prediction model is developed twice, first by using the selected water quality parameters as an input and second with the streamflow as an input [39,40]. The final step of this module is model selection. The first WQI model is developed by using six algorithms: four ML algorithms and two DL algorithms. Based on the accuracy of the models, the one with the highest accuracy model can be selected to predict the WQI. Additionally, an optimised robust model (XGBoost-BO) is developed and its accuracy also evaluated, and it can be applied to predict WQI using streamflow as an input.

4.1.3. Planning and Management Module

According to the Department of Regional Development Manufacturing and Water [95], water plans should support responses to climate variability, and hydrological models should be updated to include new climate science, which ensures that the climate-related effects are properly considered and up to date. This phase of the proposed framework lays the groundwork for effective management strategies after the analysis is complete. This stage involves a comprehensive approach, starting with explaining our selected study area to ensure that the strategies are contextually relevant. A detailed picture of the present status of the water quality, surrounding land use status, pollution sources and hydrological conditions is presented. Following this, the future impact of the present situation is discussed. This explanation covers how changing precipitation patterns, temperature variations and extreme weather events could alter water quality dynamics over time, helping to anticipate and prepare for future challenges. Once the strategies are in place, the next step transitions to monitoring and management, where adaptive decision making is emphasised. This section involves continuous engagement with stakeholders both through in-person interactions and online forums to ensure that the strategies remain responsive and effective in the face of changing conditions. The following sections illustrate the workflow for planning and management.
(A)
Strategies
This part involves a systematic approach to understanding the current conditions of our study area, anticipating future challenges and making information available that will guide effective actions. The elements of strategies are explained in the following sections.
(i)
Case study
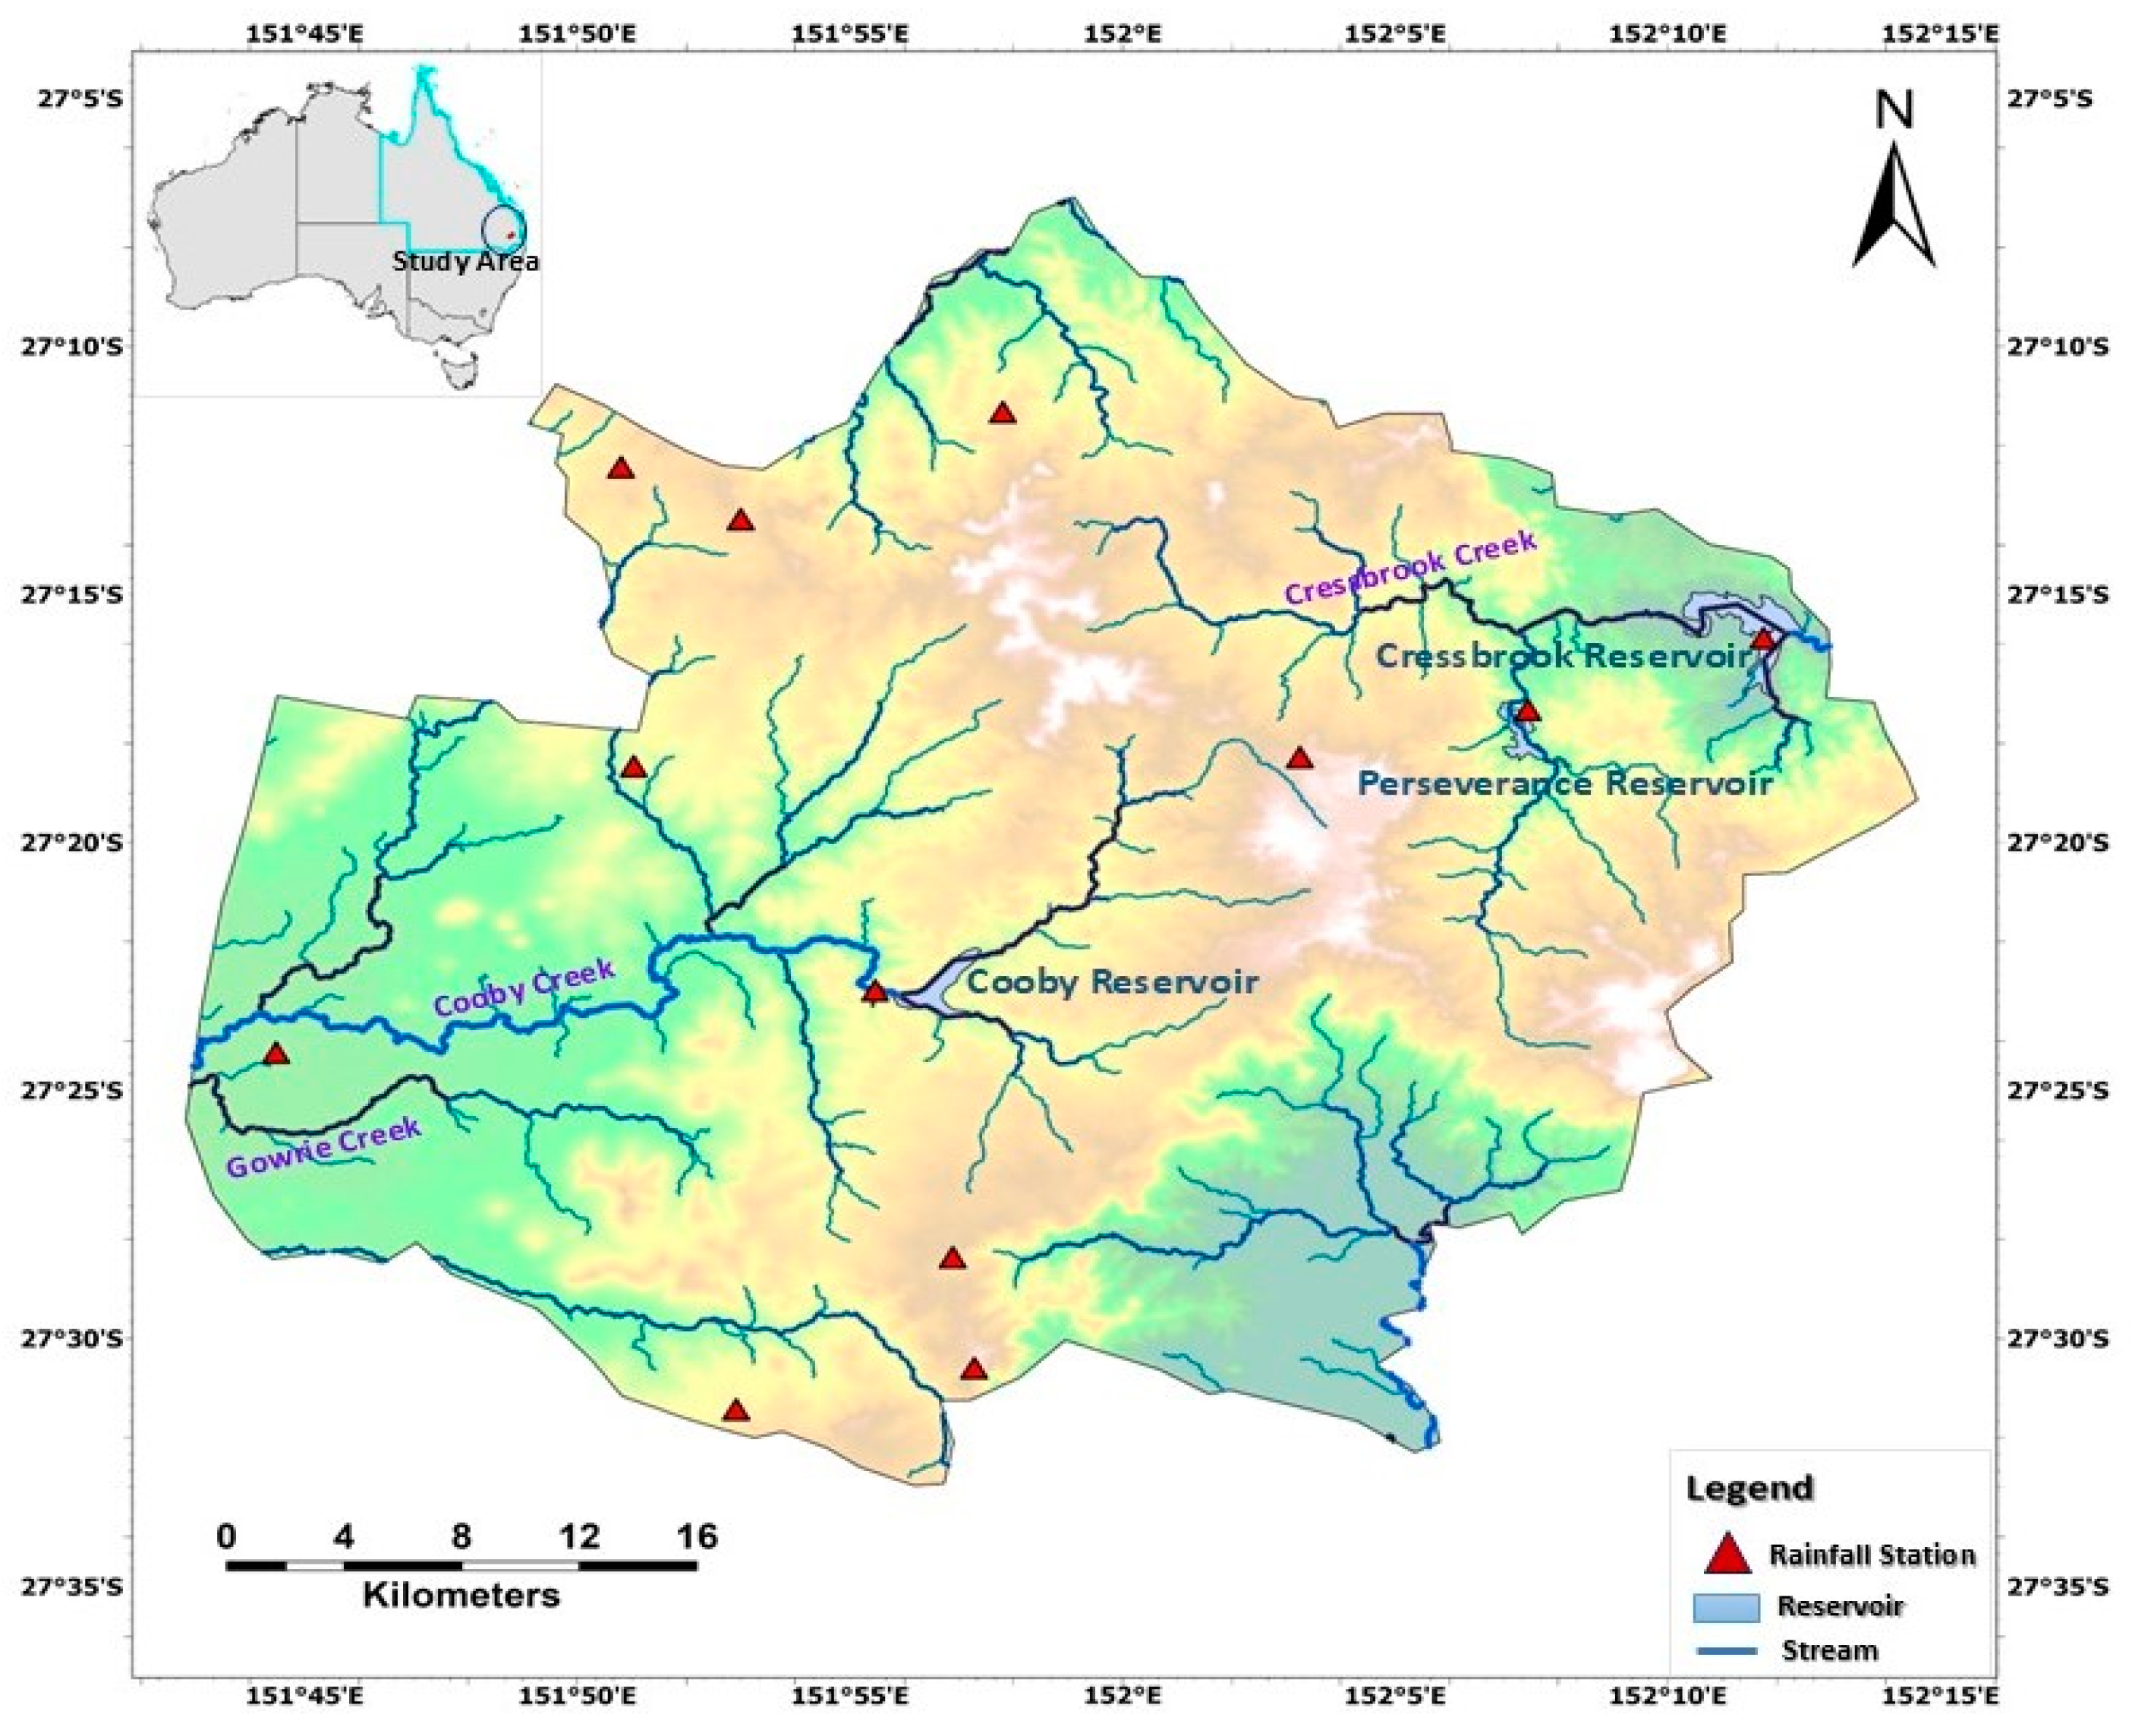
Practical implementation of the proposed decision support framework is based on a real-life case study. The selected case study area (Figure 5) encompasses three water supply reservoirs (namely Cooby, Cressbrook and Perseverance) in Toowoomba, Australia. These three local dam reservoirs act as a primary source of drinking water supply for the Toowoomba region and the surrounding towns [96]. The Toowoomba region is located in the Darling Downs area of Queensland, Australia, at an elevation range of between 125 m and 740 m with an average elevation of about 450 m above mean sea level (MSL) [97,98]. The average annual rainfall and temperature are 735 mm and 19 °C, respectively [99,100]. The study area is situated within the segment of the mountain chain that constitutes the Great Dividing Range of eastern Australia [101]. To observe the effects of rainfall on water quality fluctuations, twelve rainfall stations’ data surrounding the three reservoirs are brought into the analysis of our three previous studies, and the discharge of Cressbrook Creek is considered due to the availability of those data. The features of the catchment of the three reservoir catchments are summarised in Table 2.
(ii)
Situation analysis
In this section, the present conditions of the catchments are examined to identify the current challenges experienced by the catchment. The present situation is summarised based on a report prepared by the Toowoomba Regional Council (TRC) [96] and pointed out below.
  • Regarding the water quality mitigating actions, firstly it is mentioned that storm events and prolonged drought cannot be predicted and are beyond the control of anyone.
  • Urban area expansion, extensive operations of primary industries and agricultural activities are significantly impacting the drinking water quality in the reservoirs.
  • It is difficult to mitigate the washing of nutrient pollutants into the catchment, specifically the flow of nitrogen and phosphorus. Farm runoff is likely the largest contributor of nutrients.
  • Algal toxins in the dam are likely caused by runoff from urban and agricultural areas within the surrounding catchments.
  • Accurate estimation of pollutant loads is challenging due to the limited availability of runoff data.
  • Inadequate grazing management, including the placement and number of water points, access to creek banks and overall pasture management, contribute to soil erosion in the catchment.
  • The current TRC procedures for catchment protection have not been fully integrated with all planning and management activities, limiting their effectiveness.
(iii)
Future impact analysis
Australia is especially susceptible to extreme weather events [14]. From 1997 to 2022, the country experienced numerous extreme climatic phenomena, such as a millennium drought (1997–2008), Brisbane’s flood in 2011, bushfires in New South Wales and Queensland with record-breaking temperatures, and the 2021–2022 Southern Queensland Floods [102,103,104]. These extreme events have short-term and long-term effects on water quality, in both pre- and post-treatment stages, impairing the capacity of water utility services to supply potable water to consumers. Moreover, there are significant uncertainties regarding the time and nature of specific future events, and this is a major factor complicating water management efforts [14]. Based on the present scenario of the Toowoomba dam catchments, and the uncertainty of extreme weather events in Australia, some key findings may include:
  • Rainfall variability and high temperatures followed by intense storm events are likely to cause fluctuations in streamflow, which could lead to more frequent occurrences of nutrient runoff and subsequent algal blooms. This emphasises the importance of adaptive management strategies that can cope with extreme conditions in water quality management.
  • As the rainfall and streamflow patterns evolve with extreme events, the predictive accuracy of WQI models is essential for early warning and response systems and their efficacy.
  • Ongoing urbanisation and agricultural expansion within the catchment could exacerbate pollutant loads, further complicating the correlation pattern of streamflow and water quality. As such, there is a necessity to integrate land use planning with water quality management.
(iv)
Assessment and selection of actions
Based on the discussion of the present and future challenges, this section outlines the process of evaluating and selecting actions to mitigate future risks to water quality. The selection of actions can be focused on the following:
  • Model-driven tools: WQI prediction models, developed by using both specific water quality parameters and discharge as input, can provide a robust foundation for decision making. Actions can be prioritised based on their ability to address the most influential predictors and the time scale identified in the model, ensuring that proper actions are allocated to areas with the highest potential impact.
  • Adaptive and optimised management: Given the variability in rainfall and discharge and their correlation with water quality variations, adaptive management strategies can be recommended with proper integration in the steps of planning and management.
  • Integrated monitoring and response: To enhance the effectiveness of the selected actions, a comprehensive monitoring plan can be proposed. This plan will use real-time data to continuously update WQI predictions and trigger early responses to potential water quality issues. The integration of ML and DL models into the monitoring system ensures that the framework will remain responsive to future changes.
A list of proposed management strategies to reduce the contamination prior to water treatment is given in Table 3.
(B)
Monitoring and Management
For sustainable water quality management, the prime objective should be to formulate local and regional measures for water quality based on the temporal and spatial variability of driving factors [49]. In addition, the traditional approach of determining watershed management planning based on hydrological characteristics is inadequate. As such, updated technological advancements should be applied to gain insights into the underlying processes. Our analysis shows the responses of water quality parameters to rainfall and discharge and prediction models, which can provide meaningful guidelines to the relevant department to provide early warning to prevent pollution and optimise adaptation during extreme and normal weather events. Three aspects can be incorporated under this sub phase, which are as follows:
(i)
Adaptive decisions: Adaptive decision making is the dynamic process of continuous evaluation and adjustment of strategies, actions and responses based on growing incidents, feedback and new information [105]. Regular reviews and adjusting actions based on new data, as well as changing conditions and stakeholder feedback, can ensure that the management framework can respond to emerging challenges and opportunities. This flexibility is important in addressing the uncertainties and dynamic nature of climate impacts on water quality.
(ii)
Online forums: A recent study revealed that software evolution and maintenance tasks can be improved through the input of rich and pivotal sources of information coming from end-user reviews. Online user forums enable a large amount of people who are crowd users to share useful notions, experiences and concerns publicly about the software applications [106]. In development projects, digital tools can provide a platform for continuous stakeholder engagement [107]. The accessibility of online forums ensures that a broader audience that includes experts, community members and policymakers can contribute to the decision making process, thereby enhancing the inclusivity and relevance of the strategies being implemented.
(iii)
Stakeholder engagement: Along with online forums, face-to-face interactions with experts, policy makers and stakeholders can ensure the successful implementation of water management strategies. The engagement may include deeper discussions through meetings and a more nuanced understanding of the issues.
(C)
Risk Management
The National Research Council [108] in recommendation 3 directed that decision makers in the both public and private sectors should adapt an iterative risk management strategy to address climate-related decisions. This approach will help to identify potential climate damages, co-benefits, equity considerations, societal attitudes and the availability of possible response options. Decisions and policies should be continuously revised as new information, experiences and stakeholder feedback emerge. Furthermore, risk management should be grounded in the best available data and assessments to ensure informed and effective action. In water quality management, impact types (direct, indirect and cumulative) and duration (short-term, medium-term and long-term) should be identified [109], and modelling and analysis of vulnerability should be performed during an assessment [108] and after assessment. Risk prevention management options should be implemented by minimising pollutant loadings at the source and improving strategies for pollutant removal at the water treatment plant [109].

4.1.4. Database Management Module

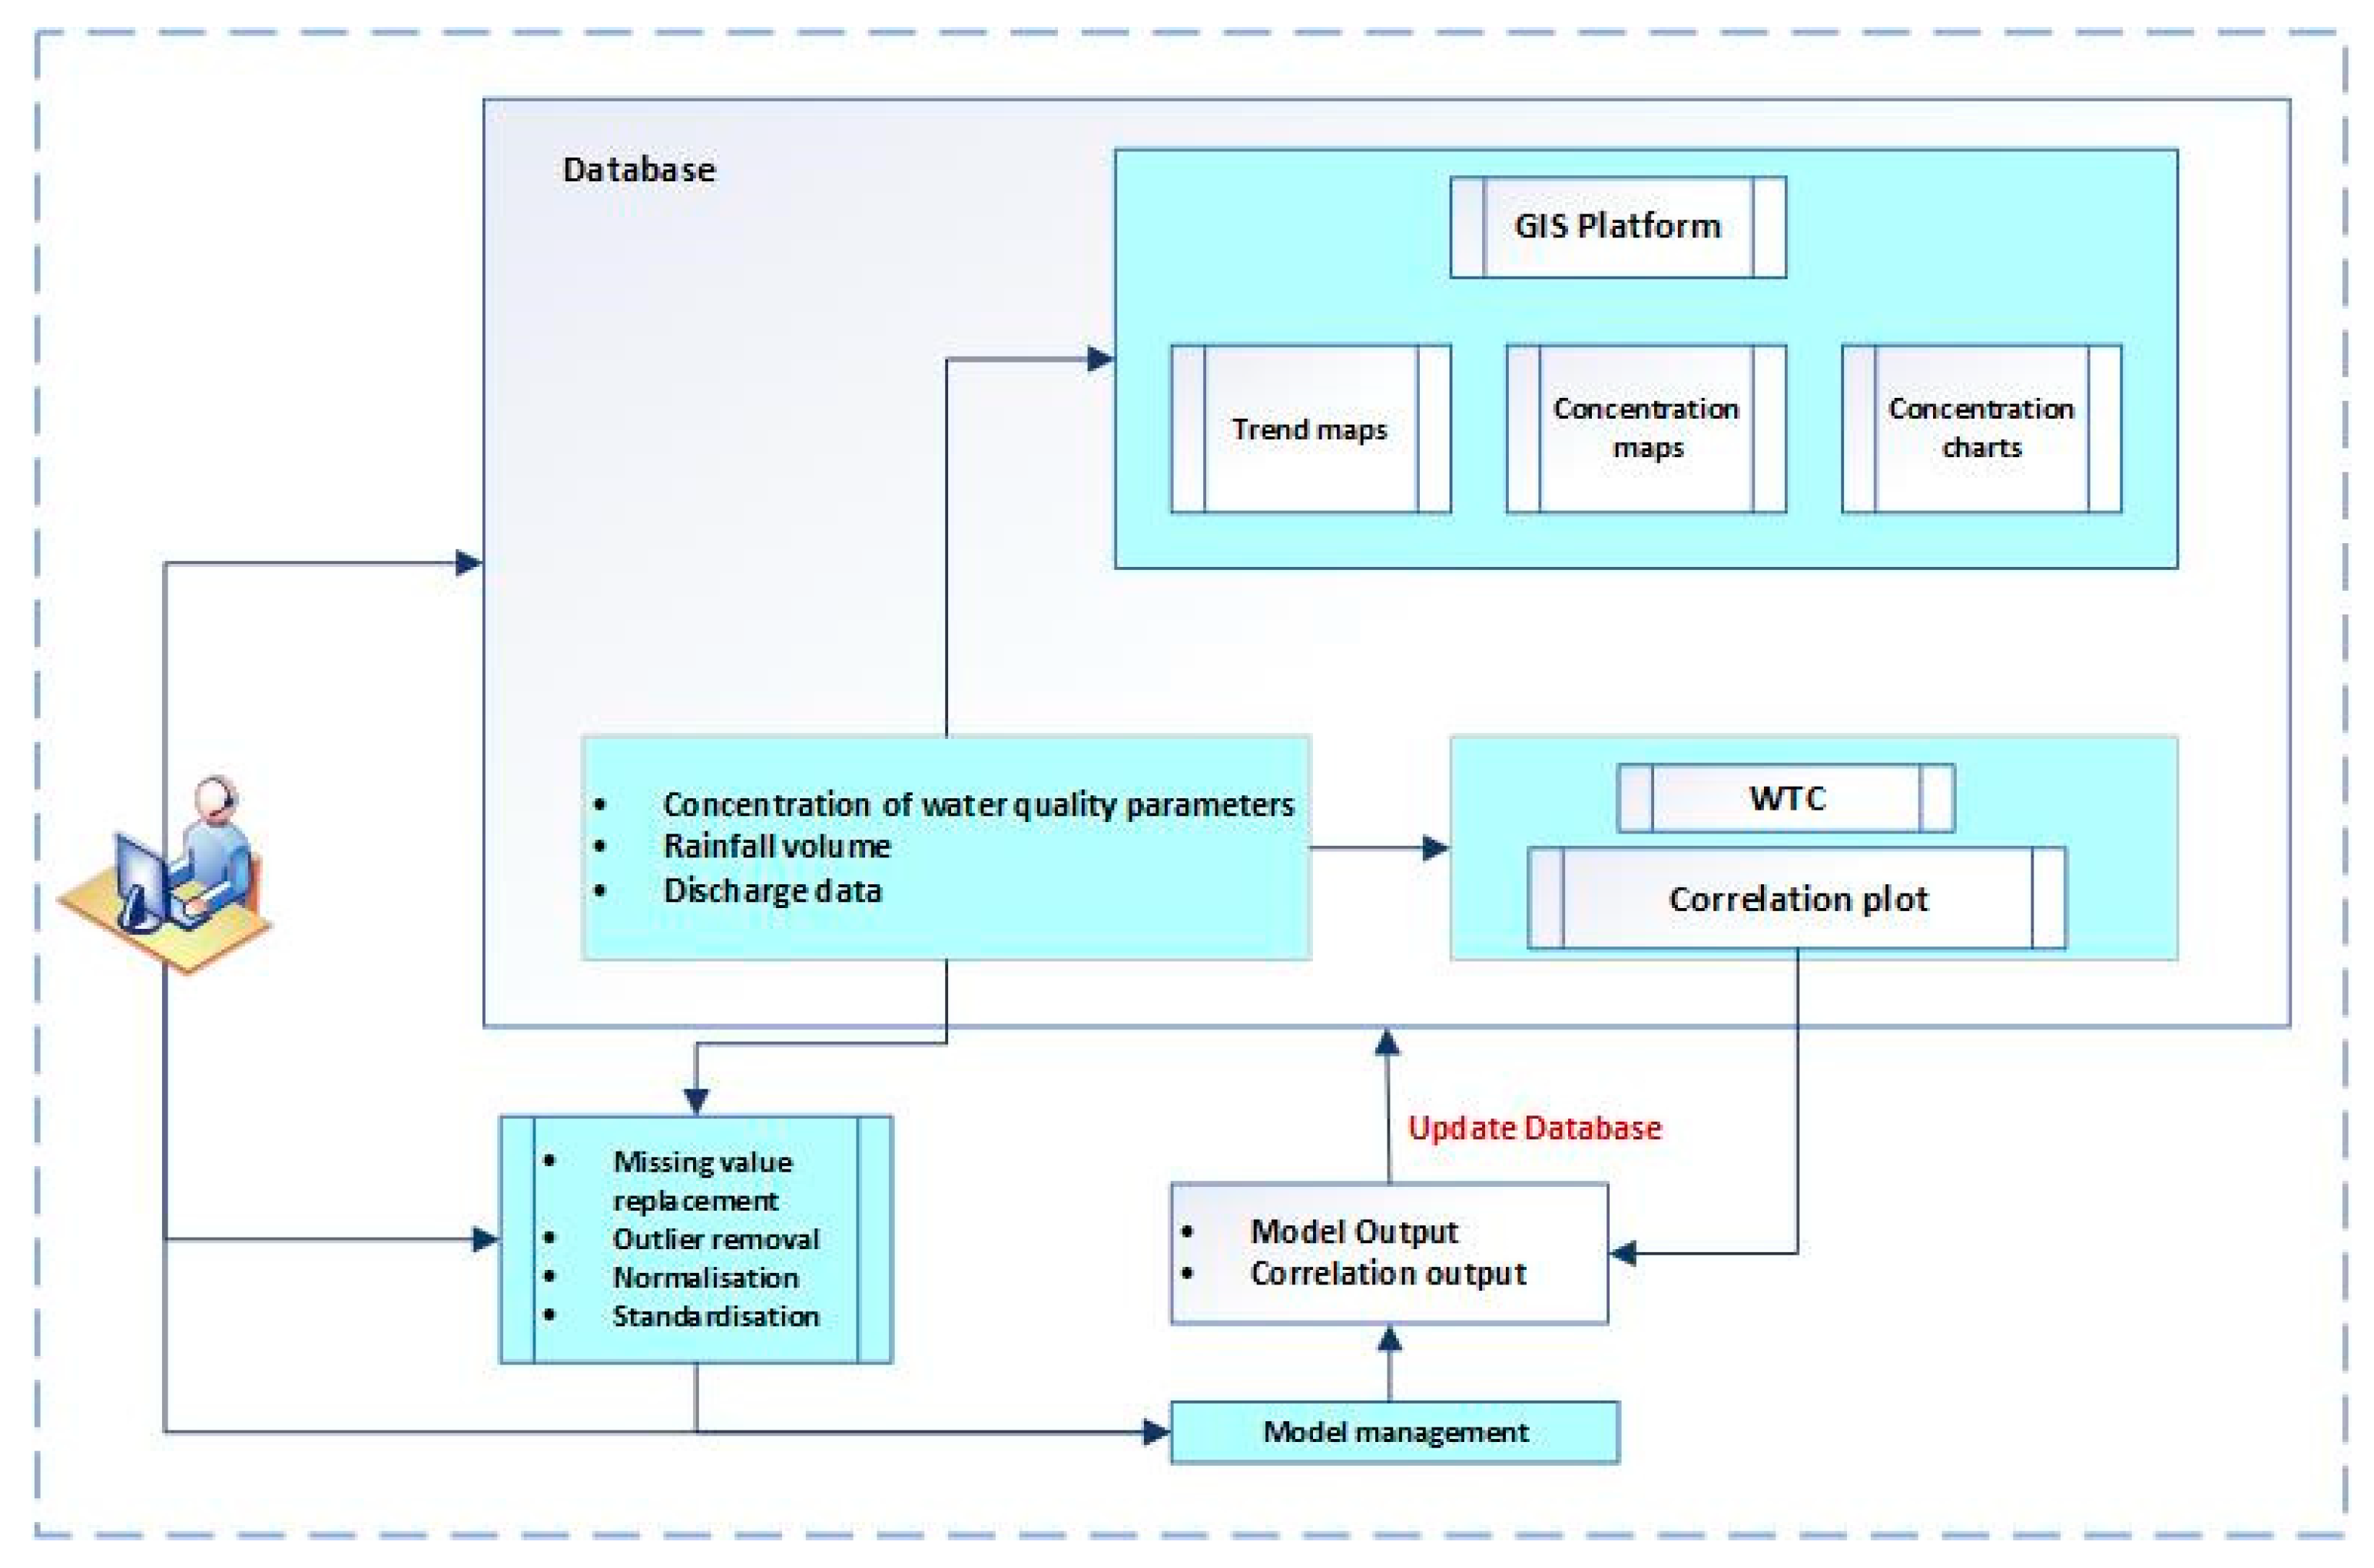
As the analysis is based on three types of data, such as rainfall, discharge and water quality, we propose three separate modules. The rainfall module will contain a table that records rainfall trends and precipitation patterns. The streamflow module will store streamflow records, discharge rates and related hydrological data. Finally, and most importantly, the water module will contain the data of selected water quality parameters—WQI prediction values.
In database management (Figure 6), it is essential to import standardised data to ensure consistency in data analysis. Prior to adding the data for modelling purposes, pre-processing steps such as the replacement of missing values and outliers, normalising and aggregating should be performed to ensure the reliability of the analysis. Experts in the fields of SQL and GIS can perform the insertion of data and modelling outputs in the database. Data version control is an important tool that can ingest new data while different users work on the same datasets [110]. Specifically for ML and DL models, users may have different versions of the same trained models where this tool can track datasets by registering changes.
For real-time data analysis and model predictions, it should be ensured that databases are seamlessly integrated with the analytical tools in the framework (e.g., ML, DL models, statistical, mathematical tools). In addition, visualising data together with maps and charts helps technical and non-technical users to uncover the structure, patterns, trends and relationships in data. In our analysis, we prepared the maps and charts through the application of ArcGIS Pro software. Various characteristics and relationships in large amounts of tabular data (vector or feature data, stand-alone tables) can be clearly visualised by this software and the charts and maps can be shared as project maps, map packages, graphic files and added to a layout [111].
The database should be updated by the users from time to time, and regular data quality checks should be performed to ensure the data remain accurate, consistent and up to date. This may include validating new data against historical records. The database structure, data retrieval processes and overall data management can be improved by using feedback from users and stakeholders.

4.2. Implementation and Limitations of the Proposed Framework

In the previous three analyses, on which the proposed framework is based and was developed, we sought to provide deeper insights into how water quality responses need to be considered, mindful of how many factors and interactions between factors come into play. The following aspects can be addressed to provide decision support to the users engaged with planning, managing and optimising water quality monitoring.
  • The typical end-user workflow can start with defining the goal. For example: What is the concentration or load of parameters in the reservoir? Which parameter should be in focus? Can we reach our goal by considering different climate change scenarios?
  • After the goal has been set, the effects on the water body and the dynamics of hydrological parameters can be observed to explore different management options. These options may include reducing nutrient runoff, reforestation of agricultural land and erosion. Some areas within the catchments can be particularly vulnerable to changes in water quality. These areas can be considered as focal points for monitoring and management strategies.
  • This framework allows for adjustments in order to respond to local and regional specifications.
  • The developed model with test data showed good prediction results. However, users need to consider that the framework should be aimed at the adjustment of scenarios rather than providing a comprehensive risk assessment.
  • The model outputs should be considered as changes that are relative to the reference situation, rather than as actual concentrations.
  • Specific action plans should be tailored to identify challenges in both short- and long-term measures.
  • To make the framework a valuable tool for the decision-making process, the scenarios can be ranked by concentrating on the significant parts instead of less reliable sections of results.
  • This framework is flexible and can be updated, allowing the integration of new methods, while catering to the specific requirements of end-users.
However, there are some limitations to the proposed framework. The TRC currently measures the water quality at only one point in each of the three reservoirs, rather than taking samples from multiple locations. Collecting data from various points could provide more comprehensive results, such as spatial patterns of water quality changes. In addition to this, discharge data are only available for the Cressbrook Reservoir, limiting our ability to analyse and predict the WQI using discharge as input for the other two reservoirs. The data requirements and input data quality are a major concern for ML and DL models, so the data used to develop the model should be free from missing values and standardised. If the datasets are small, the models may not provide accurate predictions. Moreover, to effectively run the models proposed within the framework, users need to be well trained and possess strong knowledge of AI and other software applications.
In our future studies, we plan to include a rainfall-runoff model developed by AI into this framework. Additionally, integrating remote sensing data such as high-resolution satellite imagery, LiDAR data, drone images and dynamic datasets into this framework can enhance real-time monitoring and predictive accuracy by providing high-resolution, spatially comprehensive information on surface water quality, land use changes and environmental conditions, thereby enabling more dynamic and informed decision making.

5. Conclusions

This study provides an extensive literature review and introduces a novel decision support framework applying artificial intelligence and statistical and mathematical methods for managing water quality. It encompasses both quantitative and qualitative approaches. The proposed framework aims at addressing climate change issues, emphasising the need for adaptive and integrated management based on the results of our three previous studies [39,40,73]. The framework consists of four phases: Identifying and Understanding, Analysis, Planning and Management and Database, which will serve the following purposes:
  • The first phase serves as the foundation for effective water quality management [39]. Extreme precipitation is selected as a climate change impact, recognising its significant impact on water quality. Key water quality parameters are selected based on their sensitivity to extreme rainfall runoff. The water quality assessment primarily involves two components: the computation of WQI and the evaluation of water quality based on the value of WQI. By addressing these aspects, this phase provides a comprehensive understanding of the current state of the water system and the potential impact of rainfall, forming a foundation for the subsequent stages of the framework.
  • The analysis phase is pivotal for deriving actionable insights and understanding complex interactions, which comprise three outputs. The WQI is predicted based on historical real-time data utilising ML and DL algorithms, such as SVR, RFR, Ada Boost, XGBoost, BiLSTM, and GRU. These models forecast WQI values by integrating selected water quality parameters [39]. In the second part, statistical and mathematical analysis are conducted to identify trends and explore the relationship between rainfall and water quality parameters [73]. Finally, the third part extends the analysis by including discharge data, examining the combined effects of rainfall and discharge on water quality, and predicting WQI [40].
  • The planning and management stage highlights the importance of conducting comprehensive situation analyses and future impact assessments, ensuring the actions are tailored to specific case study areas. The subsequent monitoring and management stage underscores the requirement for adaptive decision making supported by real-time data analysis, risk management and stakeholder engagement both in person and online forums.
  • The database component can serve as a critical repository for organising, storing and managing diverse datasets, ensuring that the decision-making process is based on accurate and timely information. It is designed to handle large volumes of data efficiently, while ensuring data integrity and accessibility.
Adaptive management depends on focused monitoring, investigations and understanding changing environmental conditions [112]. The significance of our proposed framework lies in its potential to perform water quality management in the face of ongoing environmental challenges, and it offers a clear methodology for evaluating complex relationships between water quality and hydrological variables and a new standard for how data-driven decision making can be implemented in environmental management. The ability to observe and predict water quality degradation due to extreme rainfall and runoff can help water managers optimise reservoir operations and ensure the safety of drinking water supplies. The broader implications of this work extend beyond immediate water quality concerns, offering a blueprint for future frameworks that address the interconnected challenges posed by climate change. This contribution is crucial for advancing sustainable practices that ensure the longevity and health of essential water systems.

Author Contributions

Conceptualisation: S.Z.F.; data collection and compilation: S.Z.F.; methods and analysis: S.Z.F.; writing—original draft preparation: S.Z.F.; writing—review and editing: S.Z.F., D.R.P., M.J.A. and S.C.; supervision: D.R.P., M.J.A. and S.C. All authors have read and agreed to the published version of the manuscript.

Funding

This research received no external funding.

Data Availability Statement

The data supporting the findings of this study are available from the first author upon reasonable request.

Acknowledgments

The authors would like to thank the TRC for providing the water quality data. This research has been supported by the Graduate Research School, University of Southern Queensland and this is a part of the first author’s Ph.D. project entitled “An Integrated Spatial Decision Support Framework for Monitoring and Management of Surface Water Quality Influenced by Climate Change”.

Conflicts of Interest

The authors declare no conflicts of interest. Jahangir Alam works at the MDBA; however, this research has no link with the MDBA.

References

  1. Giri, S. Water quality prospective in Twenty First Century: Status of water quality in major river basins, contemporary strategies and impediments: A review. Environ. Pollut. 2021, 271, 116332. [Google Scholar] [CrossRef] [PubMed]
  2. US Environmental Protection Agency. Water Quality Standards Handbook: Chapter 3: Water Quality Criteria; Office of Water, US Environmental Protection Agency: Washington, DC, USA, 2017.
  3. United States Environmental Protection Agency. Human Health Water Quality Criteria and Methods for Toxics. Available online: https://www.epa.gov/wqc/human-health-water-quality-criteria-and-methods-toxics (accessed on 20 August 2024).
  4. Alnahit, A.O.; Mishra, A.K.; Khan, A.A. Evaluation of high-resolution satellite products for streamflow and water quality assessment in a Southeastern US watershed. J. Hydrol. Reg. Stud. 2020, 27, 100660. [Google Scholar] [CrossRef]
  5. Rostami, S.; He, J.; Hassan, Q.K. Riverine water quality response to precipitation and its change. Environments 2018, 5, 8. [Google Scholar] [CrossRef]
  6. De Paul Obade, V.; Moore, R. Synthesising water quality indicators from standardized geospatial information to remedy water security challenges: A review. Environ. Int. 2018, 119, 220–231. [Google Scholar] [CrossRef] [PubMed]
  7. Destandau, F.; Zaiter, Y. Spatio-temporal design for a water quality monitoring network maximising the economic value of information to optimise the detection of accidental pollution. Water Resour. Econ. 2020, 32, 100156. [Google Scholar] [CrossRef]
  8. World Economic Forum. Global Risks 2015; World Economic Forum: Geneva, Switzerland, 2015. [Google Scholar]
  9. Li, Y.; Wang, H.; Deng, Y.; Liang, D.; Li, Y.; Shen, Z. How climate change and land-use evolution relates to the non-point source pollution in a typical watershed of China. Sci. Total Environ. 2022, 839, 156375. [Google Scholar] [CrossRef]
  10. Kundzewicz, Z.W.; Krysanova, V. Climate change and stream water quality in the multi-factor context: An editorial comment. Clim. Chang. 2010, 103, 353–362. [Google Scholar] [CrossRef]
  11. Delpla, I.; Jung, A.; Baures, E.; Clement, M.; Thomas, O. Impacts of climate change on surface water quality in relation to drinking water production. Environ. Int. 2009, 35, 1225–1233. [Google Scholar] [CrossRef]
  12. Clark, G.; Johnston, E. Australia State of the Environment 2016: Coasts, Independent Report to the Australian Government Minister for Environment and Energy; Australian Government, Department of the Environment and Energy: Canberra, Australia, 2017.
  13. IPCC. Climate Change 2014: Synthesis Report. Contribution of Working Groups I, II and III to the Fifth Assessment Report of the Intergovernmental Panel on Climate Change; Core Writing Team, Pachauri, R.K., Meyer, L.A., Eds.; IPCC: Geneva, Switzerland, 2014; p. 151. [Google Scholar]
  14. Bertone, E.; Sahin, O.; Richards, R.; Roiko, A. Extreme events, water quality and health: A participatory Bayesian risk assessment tool for managers of reservoirs. J. Clean. Prod. 2016, 135, 657–667. [Google Scholar] [CrossRef]
  15. Milly, P.C.; Betancourt, J.; Falkenmark, M.; Hirsch, R.M.; Kundzewicz, Z.W.; Lettenmaier, D.P.; Stouffer, R.J. Stationarity is dead: Whither water management? Science 2008, 319, 573–574. [Google Scholar] [CrossRef]
  16. Whitehead, P.G.; Wilby, R.L.; Battarbee, R.W.; Kernan, M.; Wade, A.J. A review of the potential impacts of climate change on surface water quality. Hydrol. Sci. J. 2009, 54, 101–123. [Google Scholar] [CrossRef]
  17. Khan, S.J.; Deere, D.; Leusch, F.D.; Humpage, A.; Jenkins, M.; Cunliffe, D. Extreme weather events: Should drinking water quality management systems adapt to changing risk profiles? Water Res. 2015, 85, 124–136. [Google Scholar] [CrossRef] [PubMed]
  18. Raseman, W.J.; Kasprzyk, J.R.; Rosario-Ortiz, F.L.; Stewart, J.R.; Livneh, B. Emerging investigators series: A critical review of decision support systems for water treatment: Making the case for incorporating climate change and climate extremes. Environ. Sci. Water Res. Technol. 2017, 3, 18–36. [Google Scholar] [CrossRef]
  19. Lee, H.W.; Yeom, B.-M.; Choi, J.H. Modelling water quality improvements in a South Korean inter-basin water transfer system. Water 2020, 12, 3173. [Google Scholar] [CrossRef]
  20. Lee, H.W.; Kim, M.; Son, H.W.; Min, B.; Choi, J.H. Machine-learning-based water quality management of river with serial impoundments in the Republic of Korea. J. Hydrol. Reg. Stud. 2022, 41, 101069. [Google Scholar] [CrossRef]
  21. Ouyang, Y.; Nkedi-Kizza, P.; Wu, Q.; Shinde, D.; Huang, C. Assessment of seasonal variations in surface water quality. Water Res. 2006, 40, 3800–3810. [Google Scholar] [CrossRef]
  22. Zare Abyaneh, H. Evaluation of multivariate linear regression and artificial neural networks in prediction of water quality parameters. J. Environ. Health Sci. Eng. 2014, 12, 40. [Google Scholar] [CrossRef]
  23. Najah, A.; El-Shafie, A.; Karim, O.A.; El-Shafie, A.H. Application of artificial neural networks for water quality prediction. Neural Comput. Appl. 2013, 22, 187–201. [Google Scholar] [CrossRef]
  24. Chen, Z.; Xu, H.; Jiang, P.; Yu, S.; Lin, G.; Bychkov, I.; Hmelnov, A.; Ruzhnikov, G.; Zhu, N.; Liu, Z. A transfer Learning-Based LSTM strategy for imputing Large-Scale consecutive missing data and its application in a water quality prediction system. J. Hydrol. 2021, 602, 126573. [Google Scholar] [CrossRef]
  25. Kim, S.; Alizamir, M.; Zounemat-Kermani, M.; Kisi, O.; Singh, V.P. Assessing the biochemical oxygen demand using neural networks and ensemble tree approaches in South Korea. J. Environ. Manag. 2020, 270, 110834. [Google Scholar] [CrossRef]
  26. Ahmed, A.N.; Othman, F.B.; Afan, H.A.; Ibrahim, R.K.; Fai, C.M.; Hossain, M.S.; Ehteram, M.; Elshafie, A. Machine learning methods for better water quality prediction. J. Hydrol. 2019, 578, 124084. [Google Scholar] [CrossRef]
  27. Khan, Y.; Chai, S. Ensemble of ANN and ANFIS for water quality prediction and analysis-a data driven approach. J. Telecommun. Electron. Comput. Eng. (JTEC) 2017, 9, 117–122. [Google Scholar]
  28. Ahmed, U.; Mumtaz, R.; Anwar, H.; Shah, A.A.; Irfan, R.; García-Nieto, J. Efficient water quality prediction using supervised machine learning. Water 2019, 11, 2210. [Google Scholar] [CrossRef]
  29. Kostadinov, S. Understanding GRU Networks. Towards Data Science. Available online: https://towardsdatascience.com/understanding-gru-networks (accessed on 24 June 2024).
  30. Behmel, S.; Damour, M.; Ludwig, R.; Rodriguez, M. Intelligent decision-support system to plan, manage and optimize water quality monitoring programs: Design of a conceptual framework. J. Environ. Plan. Manag. 2021, 64, 703–733. [Google Scholar] [CrossRef]
  31. Lin, T.; Fan, W.; Xiao, C.; Yao, Z.; Zhang, Z.; Zhao, R.; Pan, Y.; Chen, Y. Energy management and operational planning of an ecological engineering for carbon sequestration in coastal Mariculture environments in China. Sustainability 2019, 11, 3162. [Google Scholar] [CrossRef]
  32. Li, S.; Xiao, W.; Zhao, Y.; Xu, J.; Da, H.; Lv, X. Quantitative analysis of the ecological security pattern for regional sustainable development: Case study of Chaohu Basin in Eastern China. J. Urban Plan. Dev. 2019, 145, 04019009. [Google Scholar] [CrossRef]
  33. Liu, D.; Zhang, G.; Li, H.; Fu, Q.; Li, M.; Faiz, M.A.; Ali, S.; Li, T.; Khan, M.I. Projection pursuit evaluation model of a regional surface water environment based on an Ameliorative Moth-Flame Optimisation algorithm. Ecol. Indic. 2019, 107, 105674. [Google Scholar] [CrossRef]
  34. How, M.L.; Cheah, S.M.; Chan, Y.J.; Khor, A.C.; Say, E.M.P. Artificial intelligence-enhanced decision support for informing global sustainable development: A human-centric AI-thinking approach. Information 2020, 11, 39. [Google Scholar] [CrossRef]
  35. Xiang, X.; Li, Q.; Khan, S.; Khalaf, O.I. Urban water resource management for sustainable environment planning using artificial intelligence techniques. Environ. Impact Assess. Rev. 2021, 86, 106515. [Google Scholar] [CrossRef]
  36. Kautish, S.; Thapliyal, M. Concept of Decision Support Systems in relation with Knowledge Management–Fundamentals, theories, frameworks and practices. Int. J. Appl. Innov. Eng. Manag. 2012, 1, 9. [Google Scholar]
  37. Hahn, B.M.; Kofalk, S.; De Kok, J.L.; Berlekamp, J.; Evers, M. Elbe DSS: A planning support system for strategic river basin planning. In Planning Support Systems Best Practice and New Methods; Geertman, S., Stillwell, J., Eds.; Springer: Maastricht, The Netherlands, 2009; Volume 95, pp. 113–136. [Google Scholar]
  38. Varadharajan, C.; Appling, A.P.; Arora, B.; Christianson, D.S.; Hendrix, V.C.; Kumar, V.; Lima, A.R.; Müller, J.; Oliver, S.; Ombadi, M. Can machine learning accelerate process understanding and decision-relevant predictions of river water quality? Hydrol. Process. 2022, 36, e14565. [Google Scholar] [CrossRef]
  39. Farzana, S.Z.; Paudyal, D.R.; Chadalavada, S.; Alam, M.J. Prediction of Water Quality in Reservoirs: A Comparative Assessment of Machine Learning and Deep Learning Approaches in the Case of Toowoomba, Queensland, Australia. Geosciences 2023, 13, 293. [Google Scholar] [CrossRef]
  40. Farzana, S.Z.; Paudyal, D.R.; Chadalavada, S.; Alam, M.J. Temporal Dynamics and Predictive Modelling of Streamflow and Water Quality Using Advanced Statistical and Ensemble Machine Learning Techniques. Water 2024, 16, 2107. [Google Scholar] [CrossRef]
  41. Tiyasha, T.; Tung, T.M.; Yaseen, Z.M. A survey on river water quality modelling using artificial intelligence models: 2000–2020. J. Hydrol. 2020, 585, 124670. [Google Scholar] [CrossRef]
  42. Rajaee, T.; Khani, S.; Ravansalar, M. Artificial intelligence-based single and hybrid models for prediction of water quality in rivers: A review. Chemom. Intell. Lab. Syst. 2020, 200, 103978. [Google Scholar] [CrossRef]
  43. Chang, L.-C.; Chang, F.-J.; Yang, S.-N.; Kao, I.-F.; Ku, Y.-Y.; Kuo, C.-L.; bin Mat Amin, I.M.Z. Building an intelligent hydroinformatics integration platform for regional flood inundation warning systems. Water 2018, 11, 9. [Google Scholar] [CrossRef]
  44. Modgil, S.; Gupta, S.; Bhushan, B. Building a living economy through modern information decision support systems and UN sustainable development goals. Prod. Plan. Control 2020, 31, 967–987. [Google Scholar] [CrossRef]
  45. Baek, S.-S.; Pyo, J.; Chun, J.A. Prediction of water level and water quality using a CNN-LSTM combined deep learning approach. Water 2020, 12, 3399. [Google Scholar] [CrossRef]
  46. Jadhav, S.B.; Pingle, N.S. Automatic Measurement and Reporting System of Water Quality Based On GSM. Int. J. Electr. Electron. Res. 2016, 4, 20–27. [Google Scholar]
  47. Saraiva, M.; Protas, É.; Salgado, M.; Souza Jr, C. Automatic mapping of center pivot irrigation systems from satellite images using deep learning. Remote Sens. 2020, 12, 558. [Google Scholar] [CrossRef]
  48. Figueiredo, I.; Esteves, P.; Cabrita, P. Water wise—A digital water solution for smart cities and water management entities. Procedia Comput. Sci. 2021, 181, 897–904. [Google Scholar] [CrossRef]
  49. Yuan, W.; Liu, Q.; Song, S.; Lu, Y.; Yang, S.; Fang, Z.; Shi, Z. A climate-water quality assessment framework for quantifying the contributions of climate change and human activities to water quality variations. J. Environ. Manag. 2023, 333, 117441. [Google Scholar] [CrossRef] [PubMed]
  50. United Nations. Sustainable Development Goals Report 2023: Special Edition; Development Data and Outreach Branch, United Nations Statistics Division: New York, NY, USA, 2023. [Google Scholar]
  51. Nijhawan, A.; Howard, G. Associations between climate variables and water quality in low-and middle-income countries: A scoping review. Water Res. 2022, 210, 117996. [Google Scholar] [CrossRef] [PubMed]
  52. Murdoch, P.S.; Baron, J.S.; Miller, T.L. Potential effects of climate change on surface-water quality in North America 1. JAWRA J. Am. Water Resour. Assoc. 2000, 36, 347–366. [Google Scholar] [CrossRef]
  53. Yang, Q.; Zhang, X.; Almendinger, J.E.; Huang, M.; Chen, X.; Leng, G.; Zhou, Y.; Zhao, K.; Asrar, G.R.; Li, X. Climate change will pose challenges to water quality management in the St. Croix River basin. Environ. Pollut. 2019, 251, 302–311. [Google Scholar] [CrossRef]
  54. Yang, Q.; Tian, H.; Friedrichs, M.A.; Hopkinson, C.S.; Lu, C.; Najjar, R.G. Increased nitrogen export from eastern North America to the Atlantic Ocean due to climatic and anthropogenic changes during 1901–2008. J. Geophys. Res. Biogeosciences 2015, 120, 1046–1068. [Google Scholar] [CrossRef]
  55. Yang, Q.; Zhang, X.; Abraha, M.; Del Grosso, S.; Robertson, G.; Chen, J. Enhancing the soil and water assessment tool model for simulating N2O emissions of three agricultural systems. Ecosyst. Health Sustain. 2017, 3, e01259. [Google Scholar] [CrossRef]
  56. J-Nkanga, E. Investigations of pipe-borne pollution in Benin City, Nigeria. Water Air Soil Pollut. 1980, 13, 425–437. [Google Scholar] [CrossRef]
  57. Bastaraud, A.; Perthame, E.; Rakotondramanga, J.-M.; Mahazosaotra, J.; Ravaonindrina, N.; Jambou, R. The impact of rainfall on drinking water quality in Antananarivo, Madagascar. PLoS ONE 2020, 15, e0218698. [Google Scholar] [CrossRef]
  58. Nogueira, G.; Nakamura, C.V.; Tognim, M.C.; Abreu Filho, B.A.; Dias Filho, B.P. Microbiological quality of drinking water of urban and rural communities, Brazil. Rev. Saúde Pública 2003, 37, 232–236. [Google Scholar] [CrossRef]
  59. Berhe, M.; Demissie, M.; Tesfaye, G. Isoniazid preventive therapy adherence and associated factors among HIV positive patients in Addis Ababa, Ethiopia. Adv. Epidemiol. 2014, 2014, 230587. [Google Scholar] [CrossRef]
  60. Nearing, M.; Jetten, V.; Baffaut, C.; Cerdan, O.; Couturier, A.; Hernandez, M.; Le Bissonnais, Y.; Nichols, M.; Nunes, J.; Renschler, C. Modeling response of soil erosion and runoff to changes in precipitation and cover. Catena 2005, 61, 131–154. [Google Scholar] [CrossRef]
  61. Mohamadi, M.A.; Kavian, A. Effects of rainfall patterns on runoff and soil erosion in field plots. Int. Soil Water Conserv. Res. 2015, 3, 273–281. [Google Scholar] [CrossRef]
  62. Jiang, C.; Zhang, L.; Tang, Z. Multi-temporal scale changes of streamflow and sediment discharge in the headwaters of Yellow River and Yangtze River on the Tibetan Plateau, China. Ecol. Eng. 2017, 102, 240–254. [Google Scholar] [CrossRef]
  63. Neitsch, S.L.; Arnold, J.G.; Kiniry, J.R.; Williams, J.R. Soil and Water Assessment Tool Theoretical Documentation Version 2009; Texas Water Resources Institute: College Station, TX, USA, 2011. [Google Scholar]
  64. Khoi, D.N.; Sam, T.T.; Nhi, P.T.T.; Quan, N.T.; Hung, B.V.; Phung, N.K.; Van Thinh, N. Uncertainty assessment for climate change impact on streamflow and water quality in the Dong Nai River Basin, Vietnam. In Proceedings of the World Environmental and Water Resources Congress, Pittsburgh, PA, USA, 19–23 May 2019; pp. 366–373. [Google Scholar]
  65. Thang, L.V.; Khoi, D.N.; Phi, H.L. Impact of climate change on streamflow and water quality in the upper Dong Nai river basin, Vietnam. Houille Blanche 2018, 104, 70–79. [Google Scholar] [CrossRef]
  66. Fabian, P.S.; Kwon, H.-H.; Vithanage, M.; Lee, J.-H. Modeling, challenges, and strategies for understanding impacts of climate extremes (droughts and floods) on water quality in Asia: A review. Environ. Res. 2023, 225, 115617. [Google Scholar] [CrossRef]
  67. Si, F.; Huang, T.; Li, N.; Li, K.; Wen, G.; Li, Y.; Zhang, H. Effects of flood discharge on the water quality of a drinking water reservoir in China–Characteristics and management strategies. J. Environ. Manag. 2022, 314, 115072. [Google Scholar] [CrossRef]
  68. Li, Y.; Zhang, Q.; Ye, R.; Yao, J.; Tan, Z. 3D hydrodynamic investigation of thermal regime in a large river-lake-floodplain system (Poyang Lake, China). J. Hydrol. 2018, 567, 86–101. [Google Scholar] [CrossRef]
  69. Chuo, M.; Ma, J.; Liu, D.; Yang, Z. Effects of the impounding process during the flood season on algal blooms in Xiangxi Bay in the Three Gorges Reservoir, China. Ecol. Model. 2019, 392, 236–249. [Google Scholar] [CrossRef]
  70. Peng, Z.; Zhang, Y.; Zhu, J.; Hu, W.; Liu, G.; Zhang, H.; Gao, R. Large lake sluice operations during an extreme rainfall season greatly affect circulation and water quality dynamics of a shallow eutrophic lake. Sci. Total Environ. 2021, 781, 146756. [Google Scholar] [CrossRef]
  71. Ma, B.; Dong, F.; Peng, W.; Liu, X.; Ding, Y.; Huang, A.; Gao, X. Simulating the water environmental capacity of a seasonal river using a combined watershed-water quality model. Earth Space Sci. 2020, 7, e2019EA001008. [Google Scholar] [CrossRef]
  72. Whitehead, P.; Jin, L.; Bussi, G.; Voepel, H.; Darby, S.; Vasilopoulos, G.; Manley, R.; Rodda, H.; Hutton, C.; Hackney, C. Water quality modelling of the Mekong River basin: Climate change and socioeconomics drive flow and nutrient flux changes to the Mekong Delta. Sci. Total Environ. 2019, 673, 218–229. [Google Scholar] [CrossRef] [PubMed]
  73. Farzana, S.Z.; Paudyal, D.R.; Chadalavada, S.; Alam, M.J. Spatiotemporal Variability Analysis of Rainfall and Water Quality: Insights from Trend Analysis and Wavelet Coherence Approach. Geosciences 2024, 14, 225. [Google Scholar] [CrossRef]
  74. Department of Environment and Heritage Protection (2009) Queensland Water Quality Guidelines, Version 3, ISBN 978-0-9806986-0-2. Available online: https://environment.des.qld.gov.au/__data/assets/pdf_file/0020/95150/water-quality-guidelines.pdf (accessed on 24 June 2024).
  75. Cotruvo, J.A. 2017 WHO guidelines for drinking water quality: First addendum to the Fourth edition. Am. Water Work. Assoc. 2017, 109, 44–51. [Google Scholar] [CrossRef]
  76. Singh, A.K.; Sathya, M.; Verma, S.; Jayakumar, S. Spatiotemporal variation of water quality index in Kanwar wetland, Begusarai, India. Sustain. Water Resour. Manag. 2020, 6, 44. [Google Scholar] [CrossRef]
  77. Hamed, K.H.; Rao, A.R. A modified Mann-Kendall trend test for autocorrelated data. J. Hydrol. 1998, 204, 182–196. [Google Scholar] [CrossRef]
  78. Gao, F.; Wang, Y.; Chen, X.; Yang, W. Trend analysis of rainfall time series in Shanxi Province, Northern China (1957–2019). Water 2020, 12, 2335. [Google Scholar] [CrossRef]
  79. Wang, Y.; Xu, Y.; Tabari, H.; Wang, J.; Wang, Q.; Song, S.; Hu, Z. Innovative trend analysis of annual and seasonal rainfall in the Yangtze River Delta, eastern China. Atmos. Res. 2020, 231, 104673. [Google Scholar] [CrossRef]
  80. Şen, Z. Innovative trend analysis methodology. J. Hydrol. Eng. 2012, 17, 1042–1046. [Google Scholar] [CrossRef]
  81. Pour, S.H.; Abd Wahab, A.K.; Shahid, S.; Ismail, Z.B. Changes in reference evapotranspiration and its driving factors in peninsular Malaysia. Atmos. Res. 2020, 246, 105096. [Google Scholar] [CrossRef]
  82. Labat, D. Recent advances in wavelet analyses: Part 1. A review of concepts. J. Hydrol. 2005, 314, 275–288. [Google Scholar] [CrossRef]
  83. Grinsted, A.; Moore, J.C.; Jevrejeva, S. Application of the cross wavelet transform and wavelet coherence to geophysical time series. Nonlinear Process. Geophys. 2004, 11, 561–566. [Google Scholar] [CrossRef]
  84. Nazari-Sharabian, M.; Karakouzian, M. Relationship between sunspot numbers and mean annual precipitation: Application of cross-wavelet transform—A case study. J Multidiscip. Sci. J. 2020, 3, 7. [Google Scholar] [CrossRef]
  85. Roushangar, K.; Alizadeh, F. Identifying complexity of annual precipitation variation in Iran during 1960–2010 based on information theory and discrete wavelet transform. Stoch. Environ. Res. Risk Assess. 2018, 32, 1205–1223. [Google Scholar] [CrossRef]
  86. Bureau of Meteorology. Climate Glossary. Available online: http://www.bom.gov.au/climate/glossary/seasons.shtml (accessed on 13 June 2023).
  87. Talmoudi, K.; Bellali, H.; Ben-Alaya, N.; Saez, M.; Malouche, D.; Chahed, M.K. Modeling zoonotic cutaneous leishmaniasis incidence in central Tunisia from 2009-2015: Forecasting models using climate variables as predictors. PLoS Neglected Trop. Dis. 2017, 11, e0005844. [Google Scholar] [CrossRef]
  88. Yang, G.; Moyer, D.L. Estimation of nonlinear water-quality trends in high-frequency monitoring data. Sci. Total Environ. 2020, 715, 136686. [Google Scholar] [CrossRef]
  89. Shi, R.; Xu, X.; Li, J.; Li, Y. Prediction and analysis of train arrival delay based on XGBoost and Bayesian optimization. Appl. Soft Comput. 2021, 109, 107538. [Google Scholar] [CrossRef]
  90. Wu, J.; Chen, X.-Y.; Zhang, H.; Xiong, L.-D.; Lei, H.; Deng, S.-H. Hyperparameter optimization for machine learning models based on Bayesian optimization. J. Electron. Sci. Technol. 2019, 17, 26–40. [Google Scholar]
  91. Bovee, K.D.; Waddle, T.J.; Bartholow, J.; Burris, L. A Decision Support Framework for Water Management in the Upper Delaware River; U.S. Geological Survey Open-File Report 2007-1172; U.S. Geological Survey: Reston, VA, USA, 2007. [Google Scholar]
  92. Quinn, N.W.; Dinar, A.; Sridharan, V. Decision support tools for water quality management. Water 2022, 14, 3644. [Google Scholar] [CrossRef]
  93. Australian Government Initiative. Water Quality Management Framework, Guidelines for Fresh and Marine Water Quality. Available online: https://www.waterquality.gov.au/anz-guidelines/framework (accessed on 1 September 2024).
  94. Chen, S.; Ghadami, A.; Epureanu, B.I. Practical guide to using Kendall’s τ in the context of forecasting critical transitions. R. Soc. Open Sci. 2022, 9, 211346. [Google Scholar] [CrossRef]
  95. Department of Regional Development Manufacturing and Water. Towards Climate Resilience and Sustainable Water Management; Queensland Government: Brisbane, Australia, 2023.
  96. Toowoomba Regional Council. Cooby, Perseverance and Cressbrook Dams, Drinking Water Catchment Management Review; Toowoomba Regional Council: Darling Downs, QLD, Australia, 2016; 7640-29.
  97. Queensland Government. Queensland Place Names. Available online: https://www.qld.gov.au/environment/land/title/place-names (accessed on 23 June 2024).
  98. Queensland Government. Business Queensland. Available online: https://www.business.qld.gov.au/running-business/support-assistance/mapping-data-imagery/maps/topographic-maps (accessed on 20 June 2024).
  99. Bureau of Meteorology. Climate Statistics for Australian Locations. Available online: http://www.bom.gov.au/climate/averages/tables/cw_041103.shtml (accessed on 23 June 2024).
  100. Queensland Government. Climate Change in the Eastern Downs Regions, Version 1; Department of Environment and Science, Queensland Government: Brisbane, QLD, Australia, 2019.
  101. Amos, M.; Baxter, G.; Finch, N.; Lisle, A.; Murray, P. I just want to count them! Considerations when choosing a deer population monitoring method. Wildl. Biol. 2014, 20, 362–370. [Google Scholar] [CrossRef]
  102. Heberger, M. Australia’s millennium drought: Impacts and responses. In The World’s Water: The Biennial Report on Freshwater Resources; Springer: Berlin/Heidelberg, Germany, 2012; pp. 97–125. [Google Scholar] [CrossRef]
  103. Van den Honert, R.C.; McAneney, J. The 2011 Brisbane floods: Causes, impacts and implications. Water 2011, 3, 1149–1173. [Google Scholar] [CrossRef]
  104. Queensland Government. Queensland Bushfires Review; Queensland Government: Brisbane, QLD, Australia, 2019–20.
  105. The Oxford Review. Adaptive Decision Making—Definition and Explanation. Available online: https://oxford-review.com/the-oxford-review-dei-diversity-equity-and-inclusion-dictionary/adaptive-decision-making-definition-and-explanation/ (accessed on 26 August 2024).
  106. Khan, J.A.; Yasin, A.; Fatima, R.; Vasan, D.; Khan, A.A.; Khan, A.W. Valuating requirements arguments in the online user’s forum for requirements decision-making: The CrowdRE-VArg framework. Softw. Pract. Exp. 2022, 52, 2537–2573. [Google Scholar] [CrossRef]
  107. Toukola, S.; Ahola, T. Digital tools for stakeholder participation in urban development projects. Proj. Leadersh. Soc. 2022, 3, 100053. [Google Scholar] [CrossRef]
  108. National Research Council. Informing an Effective Response to Climate Change; The National Academies Press: Washington, DC, USA, 2010; p. 346. [Google Scholar] [CrossRef]
  109. Imen, S.; Chang, N.-B.; Yang, Y.J.; Golchubian, A. Developing a model-based drinking water decision support system featuring remote sensing and fast learning techniques. IEEE Syst. J. 2016, 12, 1358–1368. [Google Scholar] [CrossRef]
  110. Orr, E. Data Version Control: What It Is and How It Works. Available online: https://lakefs.io/data-version-control/ (accessed on 26 August 2024).
  111. Esri. Spatial Analysis in ArcGIS Pro, Charts. Available online: https://pro.arcgis.com/en/pro-app/latest/help/analysis/geoprocessing/charts/what-is-a-chart-.htm (accessed on 27 June 2024).
  112. Melbourne Water. Adaptive Management, Healthy Waterways Strategy; Victoria State Government: Melbourne, Australia, 2018.
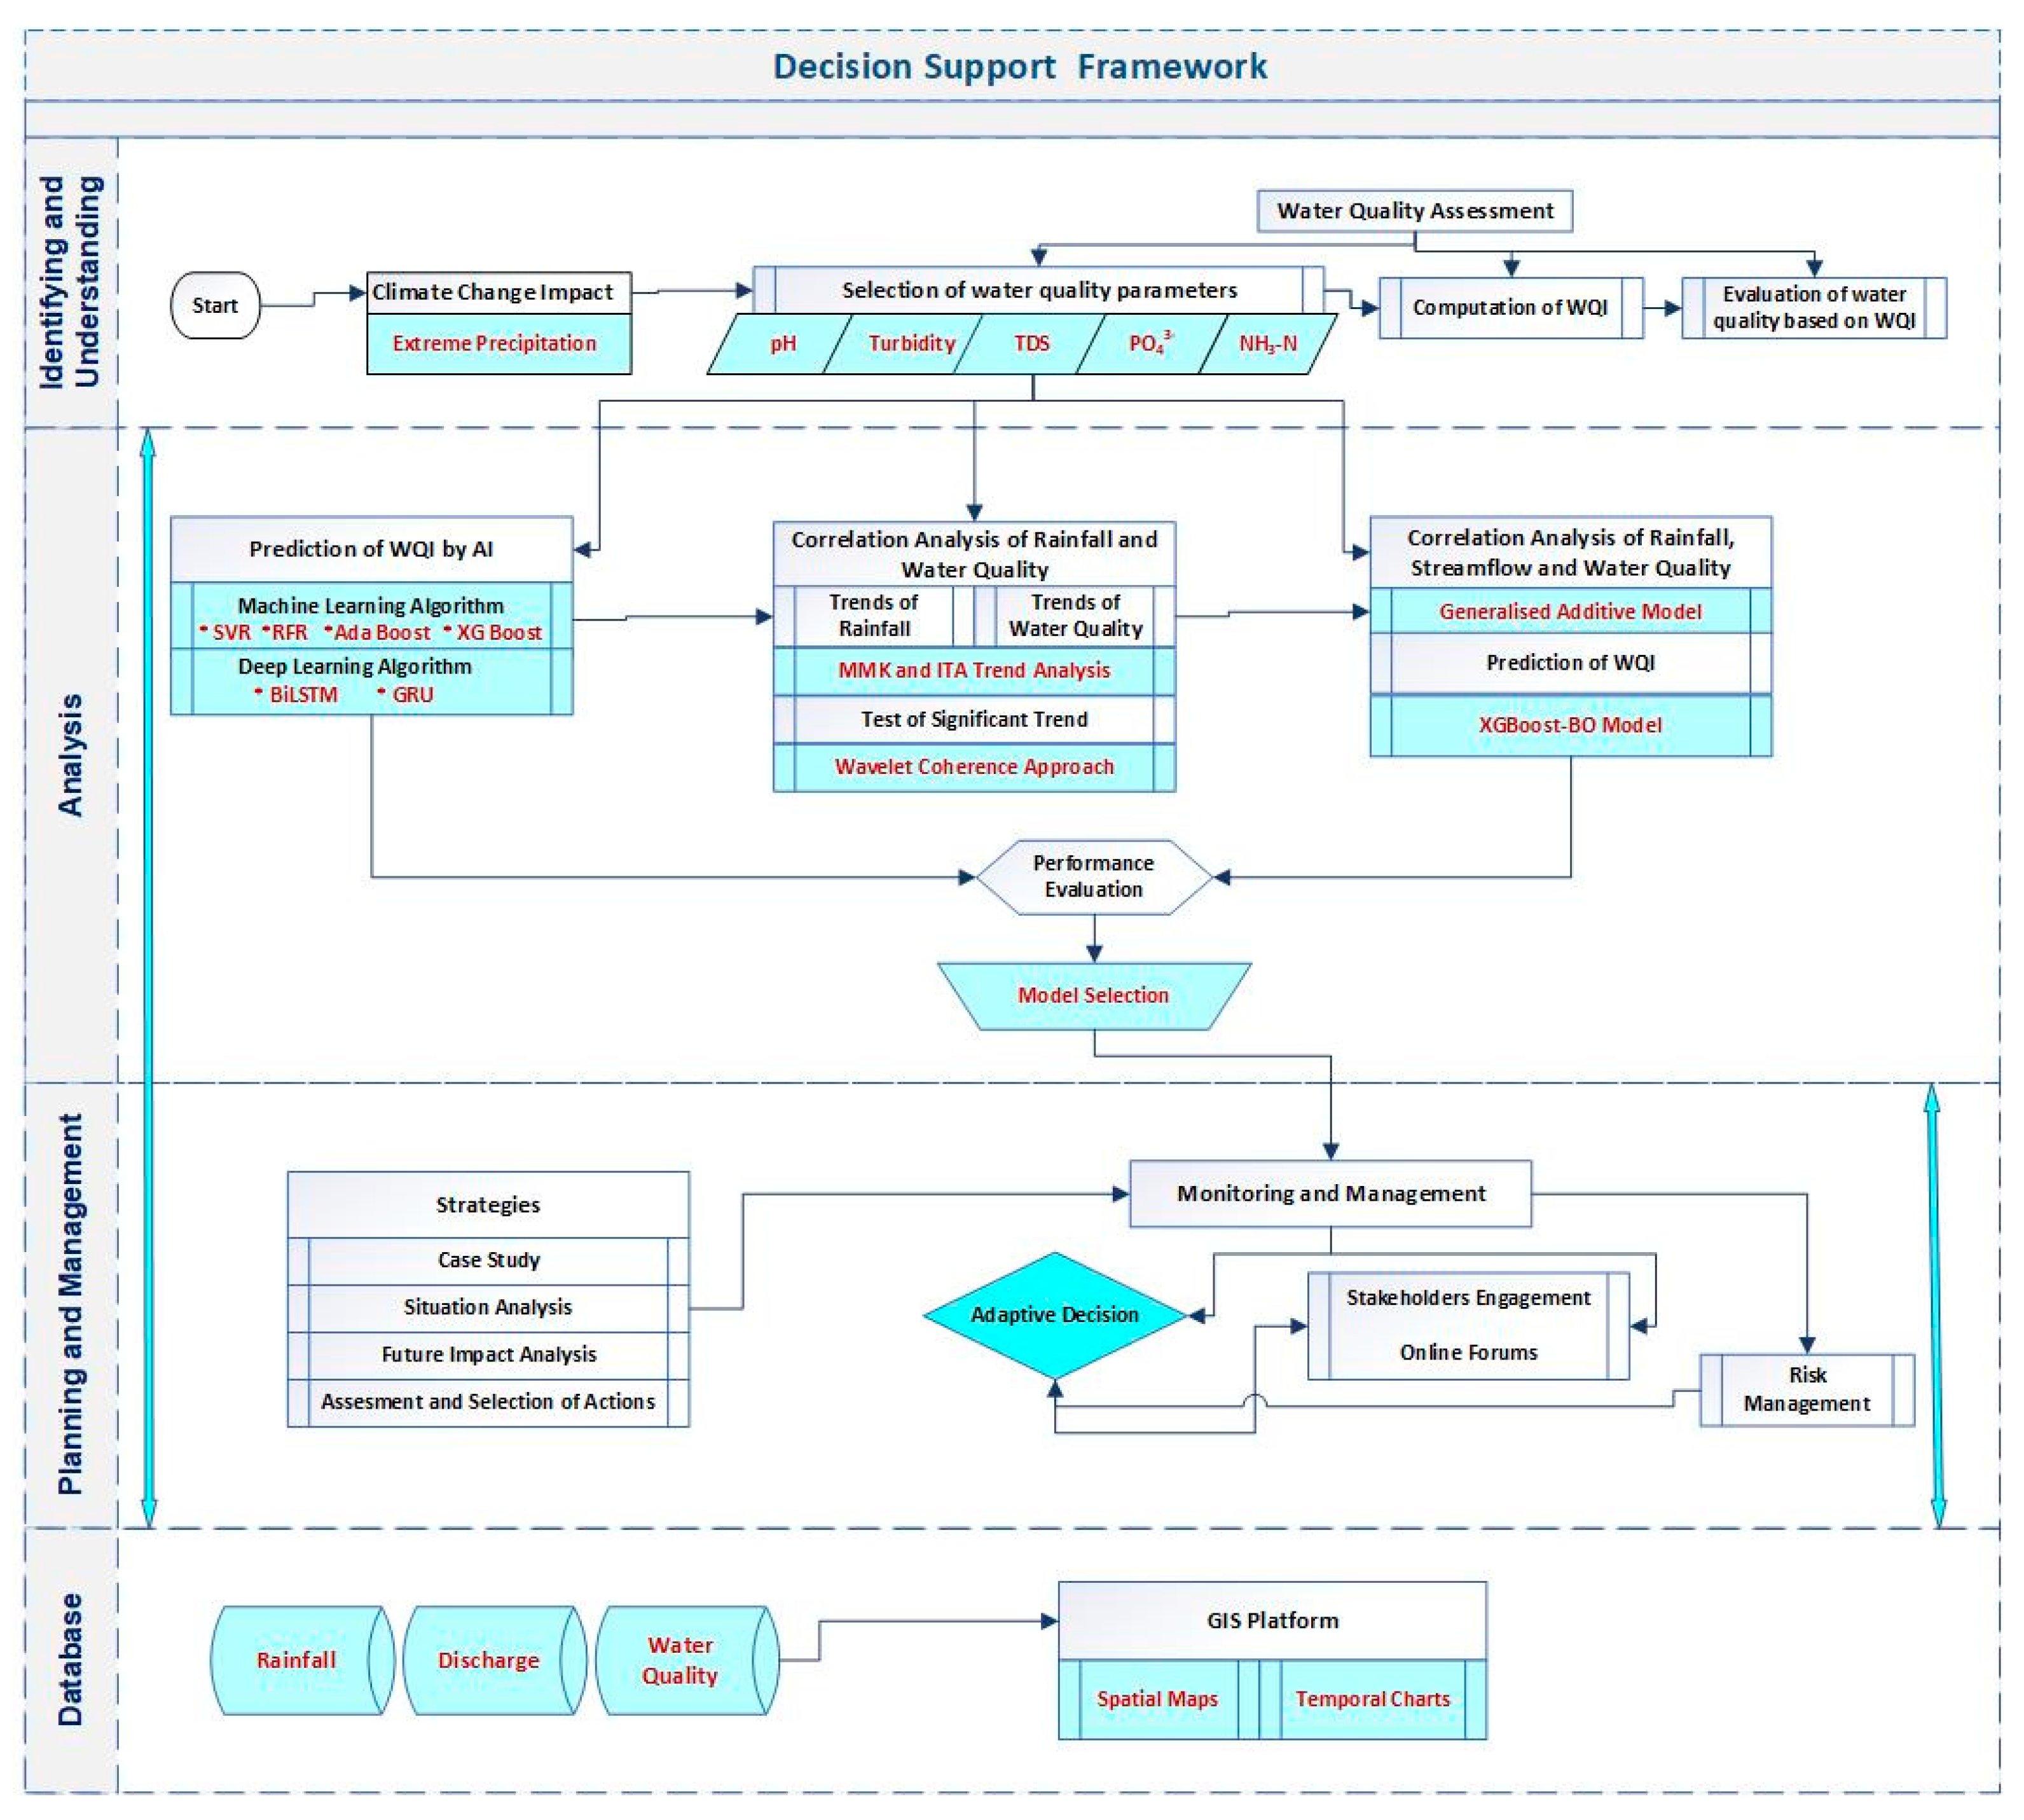
Figure 1. Schematic diagram of the proposed framework.
Water 16 02944 g001
Figure 2. Structure of the prediction model submodule.
Water 16 02944 g002
Figure 3. Structure of correlation submodule.
Water 16 02944 g003
Figure 4. Structure of correlation and WQI prediction submodule.
Water 16 02944 g004
Figure 5. Study area map. The map in the upper left side is the map of Australia in which the blue highlighted area is state of Queensland, and the red mark indicates the approximate location of the study area.
Water 16 02944 g005
Figure 6. Structure of the database management module.
Water 16 02944 g006
Table 1. List of required software and their applications.
Name VersionApplication
Windows 10 and higher Compatible operating system
Python 3.11 or updatedTo develop the prediction model
R studio4.3.2 or updated To do trend and correlation analysis
ArcGIS Pro3.3.0To prepare spatial maps and temporal charts
Table 2. Features of the reservoir catchments.
FeatureCoobyCressbrookPerseveranceReference
ClimateCool, dry winters; warm, wet summers[39]
TopographyGentle slopes at lower elevation, hills at higher elevations[101]
Surface area301 hectares517 hectares250 hectares[96]
Water capacity23,092 ML81,800 ML30,140 ML[96]
SupplyApprox. 15%Approx. 54%Approx. 28%[96]
Major land use Grazing (65.2%),
Residential (16%),
Forestry (6.5%)
Cultivation (5.4%)
Grazing (63%),
Residential (11%),
Reserves (12%),
Forestry (8%)
Horticulture (4%)
Grazing (57.7%),
Residential (11.7%),
Reserves (21.5%),
Cultivation (4.1%)
Horticulture (3.4%)
[96]
Major pressure on catchmentRapid urban
encroachment,
extensive primary
industry operations,
Cattle grazing,
removal and
degradation of
riparian vegetation,
agriculture,
deforestation,
rural residential
development and
industry
Cattle grazing,
removal and
degradation of
riparian vegetation, agriculture,
deforestation,
rural residential
development and
industry
[96]
Runoff 44 mm78 mm100 mm[96]
WQI 25–50 (Poor)0–25 (Very poor)0–25 (Very poor)[39]
Table 3. Proposed management strategies.
Source of PollutantsManagement Strategies
Urban dischargeEnforcement of urban planning codes to ensure proper household wastewater treatment system
Agricultural runoffExpand vegetation protection measures, prevent
improper and poorly timed application of fertiliser and pesticides
Grazing, Horticulture, LivestockNutrient management
Minimise runoff impact from farms
Recreational activitiesParks, Fishing activities should be placed away from
reservoirs
Soil erosionIncrease plantation in the area adjacent to reservoirs
Disclaimer/Publisher’s Note: The statements, opinions and data contained in all publications are solely those of the individual author(s) and contributor(s) and not of MDPI and/or the editor(s). MDPI and/or the editor(s) disclaim responsibility for any injury to people or property resulting from any ideas, methods, instructions or products referred to in the content.