Article

Hydrological Modeling to Unravel the Spatiotemporal Heterogeneity and Attribution of Baseflow in the Yangtze River Source Area, China

1
The National Key Laboratory of Water Disaster Prevention, Hohai University, Nanjing 210098, China
2
College of Hydrology and Water Resources, Hohai University, Nanjing 210098, China
3
Bureau of Rivers and Lakes Protection, Construction, Operation and Safety of Chang Jiang Water Resources Commission, Wuhan 430010, China
4
Changjiang River Scientific Research Institute, Changjiang Water Resources Commission, Ministry of Water Resources of China, Wuhan 430010, China
5
Nanjing Institute of Geography and Limnology, Chinese Academy of Sciences, Nanjing 210008, China
6
College of Water Conservancy and Hydropower, Sichuan Agricultural University, Yaan 625014, China
*
Authors to whom correspondence should be addressed.
Water 2024, 16(20), 2892; https://doi.org/10.3390/w16202892
Submission received: 11 September 2024 / Revised: 5 October 2024 / Accepted: 8 October 2024 / Published: 11 October 2024

Abstract

:
Revealing the spatiotemporal variation in baseflow and its underlying mechanisms is critical for preserving the health and ecological functions of alpine rivers, but this has rarely been conducted in the source region of the Yangtze River (SRYR). Our study employed the Soil and Water Assessment Tool (SWAT) model coupled with two-parameter digital filtering and geostatistical approaches to obtain a visual representation of the spatiotemporal heterogeneity characteristics of the baseflow and baseflow index (BFI) in the SRYR. The SWAT model and multiple linear regression model (MLR) were used to quantitatively estimate the contribution of climate change and human activities to baseflow and BFI changes. The results underscore the robust applicability of the SWAT model within the SRYR. Temporally, the precipitation, temperature, and baseflow exhibited significant upward trends, and the baseflow and BFI showed contrasting intra-annual distribution patterns, which were unimodal and bimodal distribution, respectively. Spatially, the baseflow increased from northwest to southeast, and from the watershed perspective, the Tongtian River exhibited higher baseflow values compared to other regions of the SRYR. The baseflow and BFI values of the Dangqu River were greater than those of other tributaries. More than 50% of the entire basin had an annual BFI value greater than 0.7, which indicates that baseflow was the major contributor to runoff generation. Moreover, the contributions of climate change and human activities to baseflow variability were 122% and −22%, and to BFI variability, 60% and 40%. Specifically, precipitation contributed 116% and 60% to the baseflow and BFI variations, while the temperature exhibited contributions of 6% and 8%, respectively. Overall, it was concluded that the spatiotemporal distributions of baseflow and the BFI are controlled by various factors, and climate change is the main factor of baseflow variation. Our study offers valuable insights for the management and quantitative assessment of groundwater resources within the SRYR amidst climate change.

Graphical Abstract

1. Introduction

Baseflow is the streamflow formed by groundwater from early rainfall and interflow recharge with slow convergence velocity. It is the most stable source of river runoff, especially during periods of drought or low precipitation, and it is important for maintaining the ecology of rivers [1,2]. The global BFI is basically around 59 ± 7%, indicating the important contribution of baseflow to river runoff [3,4]. Evidently, baseflow plays an important role in water supply, water safety, water quality evaluation, water resource evaluation and exploration, and underground runoff simulation [5]. Therefore, it is of great significance to accurately estimate baseflow and identify its spatiotemporal variations for groundwater resource evaluation and river ecosystem protection and restoration. Baseflow varies intricately, and its variation mainly depends on the climate, soil composition, topography, geology, and geomorphology of the basin. It is difficult to monitor the baseflow process directly through hydrological stations [6]. Hydrologists have developed numerous calculation methods to quantify the baseflow. According to different separation principles, the methods for baseflow separation can be broadly classified as the graphical method, water balance method, isotope method, hydrological simulation method, mathematical physics method, and numerical simulation method [7,8,9,10]. Among all the mentioned methods, graphical method is relatively simple but subjective. Although the isotope tracer method has high accuracy, it has a high cost and less application in practice [11]. In contrast, the digital filtering method can reduce the subjectivity and randomness of the artificial separation method by using computer automation, which is simple and efficient. With the continuous improvements in computer technology, the digital filtering method has become the most widely used baseflow separation method [12].
Due to the important role of baseflow in the hydrological cycle, river ecology, and water resource protection and utilization, scholars have conducted extensive research in the field of baseflow and have achieved a series of significant accomplishments [13,14,15]. Apart from investigating the applicability of baseflow separation methods, profound studies have been conducted on the temporal characteristics of baseflow time series, as well as the underlying causes of baseflow and BFI fluctuations. Climate change and human activities may affect the global water cycle process, and therefore, baseflow may correspondingly change. In this context, there is growing interest in understanding the response mechanisms of baseflow processes to climate change and human activities [16,17,18]. For example, Wu et al. [19] applied the elastic coefficient method to identify the factors driving baseflow variation in the Loess Plateau, revealing climate change as the predominant influence on BFI fluctuations. Liu et al. [20] used the digital filtering method to separate baseflow and examined the quantitative impacts of precipitation, evapotranspiration, temperature, and vegetation restoration on baseflow. Sun et al. [21] assessed both the seasonal and spatial variations in baseflow and investigated the factors driving these variations. Murray et al. [22] employed Lyne and Hollick’s one-parameter digital filter to obtain a baseflow time series and analyzed its change trend and influencing factors. Previous work has shown that most scholars have only paid attention to the spatial variation characteristics of the baseflow of rivers with the observed hydrological data of sufficient spatial density. However, there is a lack of research on the spatial heterogeneity characteristics of baseflow across whole basins due to a lack of sufficient monitoring data.
The distributed hydrological model SWAT, based on the principles of water balance and integrated with the ArcGIS platform, exhibits robust capabilities in the spatial representation of geographical elements, thereby enabling researchers to undertake secondary development and construct a watershed hydrological information visualization system [23,24]. The SWAT model could present new opportunities for spatialization and quantification research of baseflow [25,26], which is rarely carried out. In addition, it offers the possibility of quantitatively decoupling the contribution of climate change and human activities to baseflow evolution based on physical hydrological mechanisms.
Situated in the hinterland of the Qinghai–Tibet Plateau, the SRYR is at a high altitude, experiences low temperatures, and has abundant glaciers, snow melt, and frozen soils. It is known as the “China Water Tower”, serving as acritical ecological security barrier and a strategic resource reserve base in China [27]. Amidst global climate change, the water resources of the SRYR have undergone great changes, notably evident in glaciers melting, altered precipitation patterns, and changes in the wetland areas [28]. In recent years, the SRYR’s baseflow has exhibited significant increases due to the influences of warming [2,29]. From previous works, it is evident that researchers have predominantly focused on the temporal analysis of hydrological processes [2,30]. Meanwhile, there have been few studies describing the spatial variations in hydrological factors. This is primarily attributed to the lack of hydrological observation data in the SRYR. Based on the advantages of the SWAT model in hydrological simulation and spatial visualization, some scholars have tried to use the SWAT model to simulate and present the spatial distribution of hydrological processes in the SRYR [31]. For example, Luo [31] established the SWAT model of the SRYR and quantitatively discussed the response of the hydrological system to the ecological engineering strength. Yuan et al. [32] estimated the blue water and green water flow and green water storage of the SRYR using the SWAT model. Ahmed et al. [33] employed the SWAT model to simulate the hydrologic process in the SRYR and quantitatively analyzed the contribution of climate change and land use and land cover change (LUCC) to streamflow. Previous studies and attempts have shown that the SWAT model is reliable in simulating the hydrological process of the SRYR.
Considering the role of baseflow in maintaining water resources and aquatic ecosystems in the SRYR, it is urgent to study the spatiotemporal variation and driving mechanism of baseflow more comprehensively. Our study employed the SWAT model coupled with two-parameter digital filtering to simulate the baseflow processes in the SRYR, examining the spatiotemporal variation characteristics of the baseflow and BFI. Additionally, we applied the SWAT model coupled with the multiple linear regression method to quantitatively identify the contribution of human activities and climate change to the changes in baseflow and the BFI, providing valuable insights into the evolution and driving mechanism of the baseflow in the cold region of the plateau.

2. Materials and Methods

2.1. Study Area

The SRYR lies within the Qinghai–Tibet Plateau’s hinterland (Figure 1) between the Kunlun Mountains and the Tanggula Mountains [34]. It plays a key function in water volume regulation and climate modulation in the middle and lower reaches of the Yangtze River. The regional topography exhibits higher elevation in the northwest and lower elevation in the southeast [35], with altitudes ranging from 3480 m to 6580 m. This area falls within the semi-humid and semi-arid regions of the continental plateau sub-cold zone and the plateau cold zone. Glaciers are predominantly found along the northern slope of Tanggula Mountain, Sejier Mountain, and the southern slope of Kunlun Mountain. The SRYR is composed of the Tuotuo River, the Dangqu River, the Chumaer River, and the Tongtian River. The total length of the SRYR is 1174 km, and the catchment area is 13.77 × 10⁴ km2. The annual average temperature is −3.1 °C, which increases from northwest to southeast [36,37]. The annual precipitation ranges from 250 mm to 600 mm, steadily decreasing from south to north. The average annual runoff is 132 × 108 m3. The runoff and precipitation within the basin exhibit similar intra-annual distribution patterns, with 60–80% concentrated during the warm season from July to September.

2.2. Data Sources

The input data for the SWAT model include geospatial data, remote sensing data, meteorological, and hydrological data, etc. The digital elevation model (DEM) data used in this study were sourced from a geospatial data cloud, while the land use pattern data were obtained from the Institute of Geographical Science and Resources of the Chinese Academy of Sciences. The soil data were extracted from the world soil database, the meteorological data were acquired from the National Meteorological Science Data Centre, and the hydrological data were collected from the Zhimenda Hydrological Station of the Qinghai Hydrology and Water Resources Forecasting Centre. The data mentioned above are described in detailed in Table 1 and Figure 2.

2.3. SWAT Model

SWAT was developed by the Agricultural Research Centre of the United States Department of Agriculture in 1994 [38]. The basic principle of the model is as follows:
S W t = S W 0 + i = 1 t ( R d a y Q s u r f E a W s e e p Q g w ) .
where S W t denotes the ultimate water content of the soil (mm), S W 0 denotes the initial water content of the soil (mm), t is time (days), R day denotes the precipitation quantity (mm), Q s u r f denotes the surface runoff volume (mm), E a denotes the evapotranspiration quantity (mm), W s e e p (mm) denotes the volume of water that enters the vadose zone through the soil profile, and Q g w (mm) denotes the amount of return flow.
Our study area was located in the hinterland of the Qinghai–Tibet Plateau. According to the spatial distribution map of the LUCC (Figure 2), in this area, the glacier coverage area was only 1.8%, so this study mainly considered the impact of snow melting on runoff by the SWAT model under the assumption that the thawing of frozen soil was not considered. The SWAT model employs a temperature index method to estimate snow accumulation and melting and uses a lag factor to control the effect of the previous day’s temperature on the snow temperature of the day [39].
S N O m l t = b m e l t S N O cov T s n o w + T max 2 S M T M P
where S N O m l t denotes the snowmelt equivalent (mm), b m e l t denotes the snowmelt factor (mm/d°C), S N O cov denotes the snow cover fraction in HRUs, T s n o w denotes the snow cover temperature (°C), T max denotes the simulated daily maximum temperature (°C), and S M T M P denotes the snowmelt critical temperature (°C).
The calculation equation for the snowdrift temperature is [40]:
T s n o w ( d n ) = T s n o w ( d n 1 ) ( 1 λ s o n ) + T ¯ a v λ s o n
where T s n o w ( d n ) denotes the snow temperature of the simulated day (°C), T s n o w ( d n 1 ) denotes the previous day’s snow temperature (°C), λ s o n denotes the snow lag factor, and T ¯ a v denotes the daily average temperature (°C).
The calculation formula of the snow melting factor b m e l t is as follows:
b m e l t = b max + b min 2 + b max b min 2 sin 2 π 365 ( d n 81 )
where b m e l t is the snowmelt factor (mm/d°C), b max denotes the maximum snowmelt ablation (mm/d°C), b min is the minimum snowmelt ablation factor (mm/d°C), and d n is the number of days in the current year (d).
The quality of the model is assessed on the basis of the coefficient of determination ( R 2 ) and the Nash–Sutcliffe efficiency coefficient ( N S E ) [41].
N S E = 1 i = 1 n ( Q i o b s Q i s i m ) 2 i = 1 n ( Q i o b s Q m e a n s i m ) 2
R 2 = [ i = 1 n ( Q i o b s Q m e a n o b s ) ( Q i s i m Q m e a n o b s ) ] 2 i = 1 n ( Q i o b s Q m e a n o b s ) 2 ( Q i s i m Q m e a n o b s ) 2
where n expresses the observation number; Q i o b s is the i t h observed runoff; Q i s i m is the i t h simulated runoff; Q m e a n o b s is the mean of the observed data; Q m e a n s i m is the mean of the simulated runoff.

2.4. Baseflow Separation Approaches

The digital filtering baseflow segmentation method was used to filter out the high-frequency signals in the streamflow records related to surface runoff from the low-frequency signals related to groundwater discharge or baseflow. In order to separate the baseflow from the runoff series, scholars have developed several equations. Many studies have confirmed that the two-parameter digital filtering equation proposed by Eckhardt [42] has fine performance in baseflow separation. The study by Wu et al. [43] showed that the Eckhardt method has good adaptability for baseflow segmentation in the SRYR. Therefore, it was adopted in our study:
Q b ( i ) = 1 B F I max α Q b ( i 1 ) + ( 1 α ) B F I max Q ( i ) 1 α B F I max
B F I = i Q b ( i ) i Q ( i )
where α expresses the recession constant; B F I max expresses the maximum B F I , or the maximum proportion of baseflow to the total runoff in a long period; Q ( i ) and Q b ( i ) denote the total runoff and baseflow at time step i , respectively.

2.5. Trend and Mutation Analysis

The Mann–Kendall (MK) test, which is a nonparametric method, is suitable for analyzing trends and mutations in meteorological and hydrological time series with non-normal distribution, and is not affected by a few interference values [44]. The Pettitt test method is widely used for mutation detecting. In this study, the MK test method was employed to analyze the trend of precipitation, temperature, baseflow, and BFI time series in the SRYR. The Pettitt test and the MK test were applied to detect if there were any mutation points in the time series. The results of the two test methods were mutually verified. Through analysis, the hydro-meteorological series were divided into the base stage ( P 1 : baseflow and BFI before the mutation year) and the change stage ( P 2 : baseflow and BFI from the mutation year to 2020).

2.6. Attributions to Baseflow Variation

2.6.1. Decoupling Climate Change and Human Contribution

In our study, it was assumed that baseflow is mainly affected by climate change and human activities in the source region of the Yangtze River. Based on the baseflow separation of the observed runoff data and Mann–Kendall mutation test, the mean annual baseflow rates during P 1 and P 2 are denoted as B 1 and B 2 , respectively. The changes in the annual baseflow during the study period can be expressed as follows:
Δ B = B 1 B 2
Δ B = Δ B c + Δ B h
where Δ B c and Δ B h are the changes in the annual baseflow caused by climate change and human activities, respectively.
The contribution of climate change and human activities to the changes in baseflow can be expressed as follows:
η h = Δ B c Δ B × 100 %
η h = Δ B h Δ B × 100 %
where η c and η h represent the percentages of climate change and human activities to the changes in baseflow, respectively.
Based on the SWAT model, in order to quantitatively estimate the impact of climate change to baseflow, we kept the calibrated parameters and land use patterns in the model unchanged, reconstructed the runoff series that were not affected by human activities, and performed baseflow segmentation. The impact of climate change on baseflow was estimated as follows:
Δ B c = B 2 s i m B 1 s i m
where B 1 s i m is the baseflow separation of the simulated runoff during P 1 , and B 2 s i m is the baseflow separation of the simulated runoff during P 2 . Δ B c is the baseflow variation attributed to climate change. By substituting Equation (13) into Equations (9)–(12), the contributions of climate change and human activities to baseflow variation were separated.

2.6.2. Estimation of Climate Factor Contribution

The multi-year average variable values X ¯ P 1 of the hydro-meteorological factors in the P 1 stage were calculated. Then, we calculated the amplitude of each hydro-meteorological factor relative to X ¯ P 1 in different years of the P 2 stage. This can be expressed by the following equation:
Δ X = X i P 2 X ¯ P 1 X ¯ P 1 × 100 %
where Δ X represents the variation ranges of the hydro-meteorological factors, such as temperature, precipitation, and baseflow, and X i P 2 is the value of each hydro-meteorological factor in the i period of the P 2 stage.
Considering that the SRYR baseflow is mainly affected by two meteorological factors, precipitation and temperature, the relationship can be expressed as follows:
Δ B c = a Δ P R E + b Δ T M P
In the formula, Δ B c represents the normalized baseflow variation; P R E and T M P are the precipitation and temperature; a and b are the regression coefficients of normalized precipitation and temperature variation, respectively. The contribution rate of precipitation and temperature to baseflow variation can be expressed as follows:
η PRE = a a + b × η c
η T M P = b a + b × η c

3. Results

3.1. SWAT Model Performance

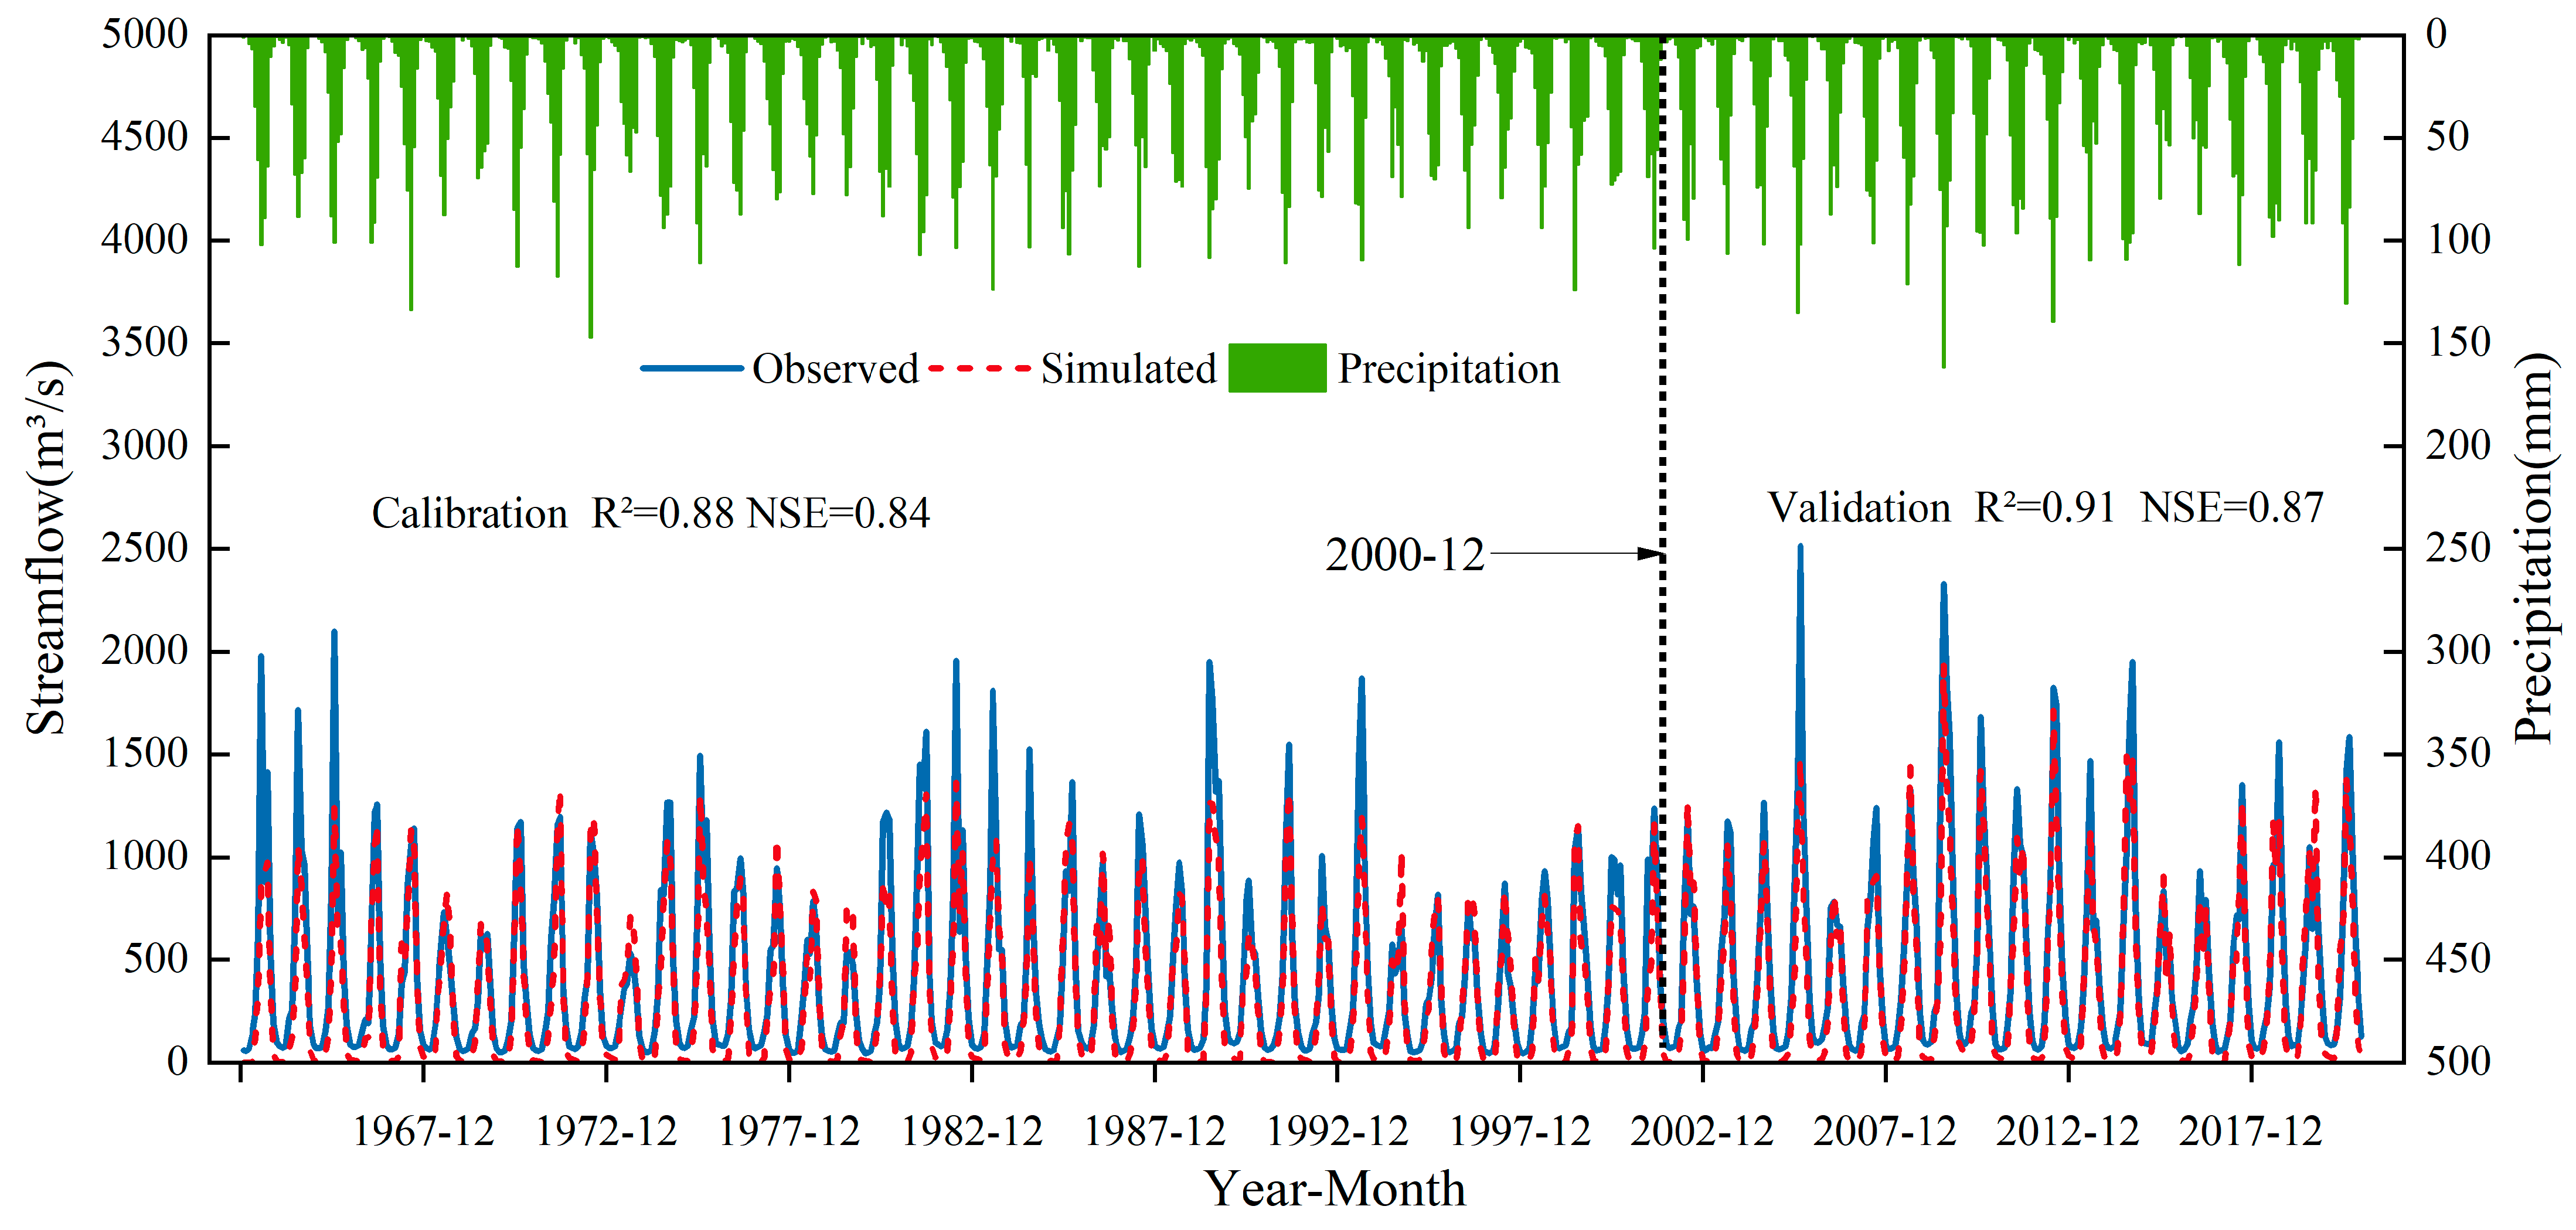
The model parameters were calibrated and verified using the measured monthly average runoff data at the Zhimenda Hydrological Station during the period from 1963 to 2020. The calibration period was selected to be from 1963 to 2000, and the validation period was from 2000 to 2020. As shown in Figure 3, after the SWAT-CUP calculation, the determination coefficient (R2) and efficiency coefficient (NSE) of the simulated and measured monthly average runoff during the calibration and validation periods of the model obtained values of 0.88 and 0.84, and 0.91 and 0.87, respectively. The results show that the model had good applicability in the hydrological simulation in the SRYR. The best parameter values are shown in Table 2.

3.2. Sensitivity Analysis

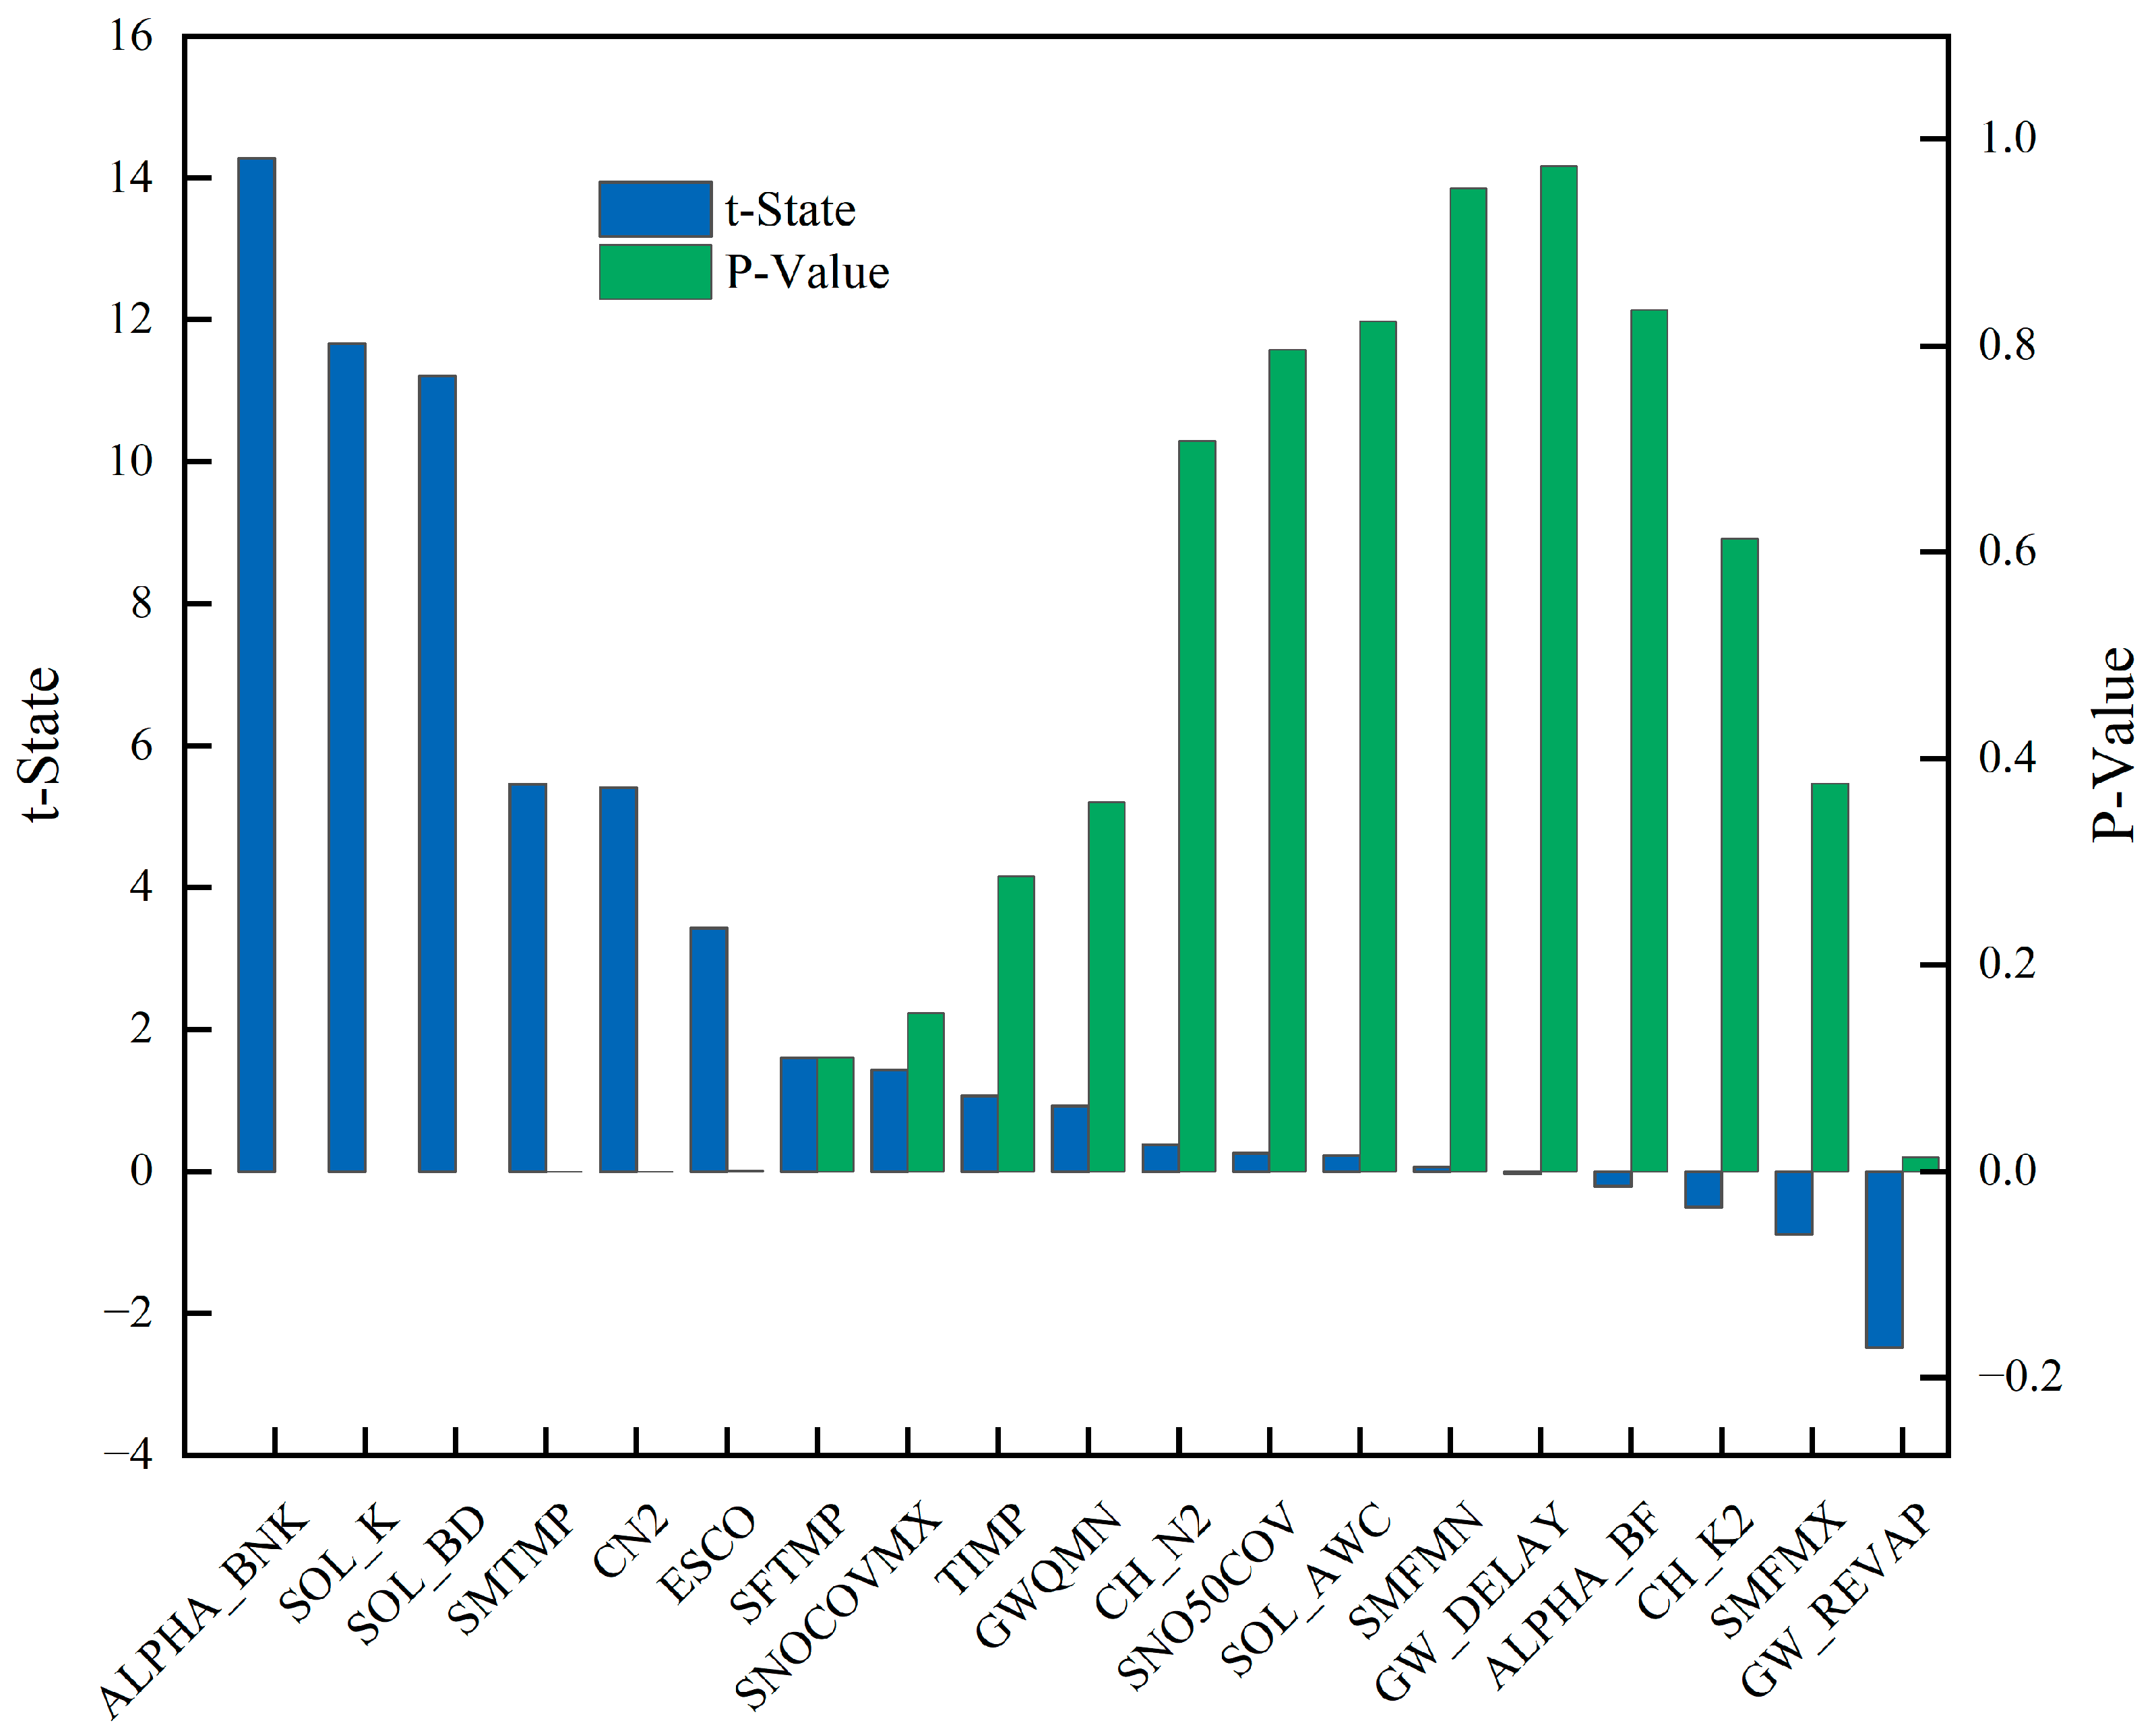
The global sensitivity analysis method in SWAT-CUP was used to evaluate the sensitivity of the model parameters. Figure 4 presents the sensitivity ranking of the main model parameters from high to low. Notably, ALPHA-BNK, SOL-K, SOL-BD, SMTMP, CN2, ESCO, SFTMP, SNOCOVMX, TIMP, and GWQMN exhibited higher sensitivity. The results reveal that the runoff was mainly affected by the baseflow, soil characteristics, SCS runoff curve, groundwater, and snow melting in the SRYR.

3.3. Statistical Analysis of Baseflow and Meteorological Factors

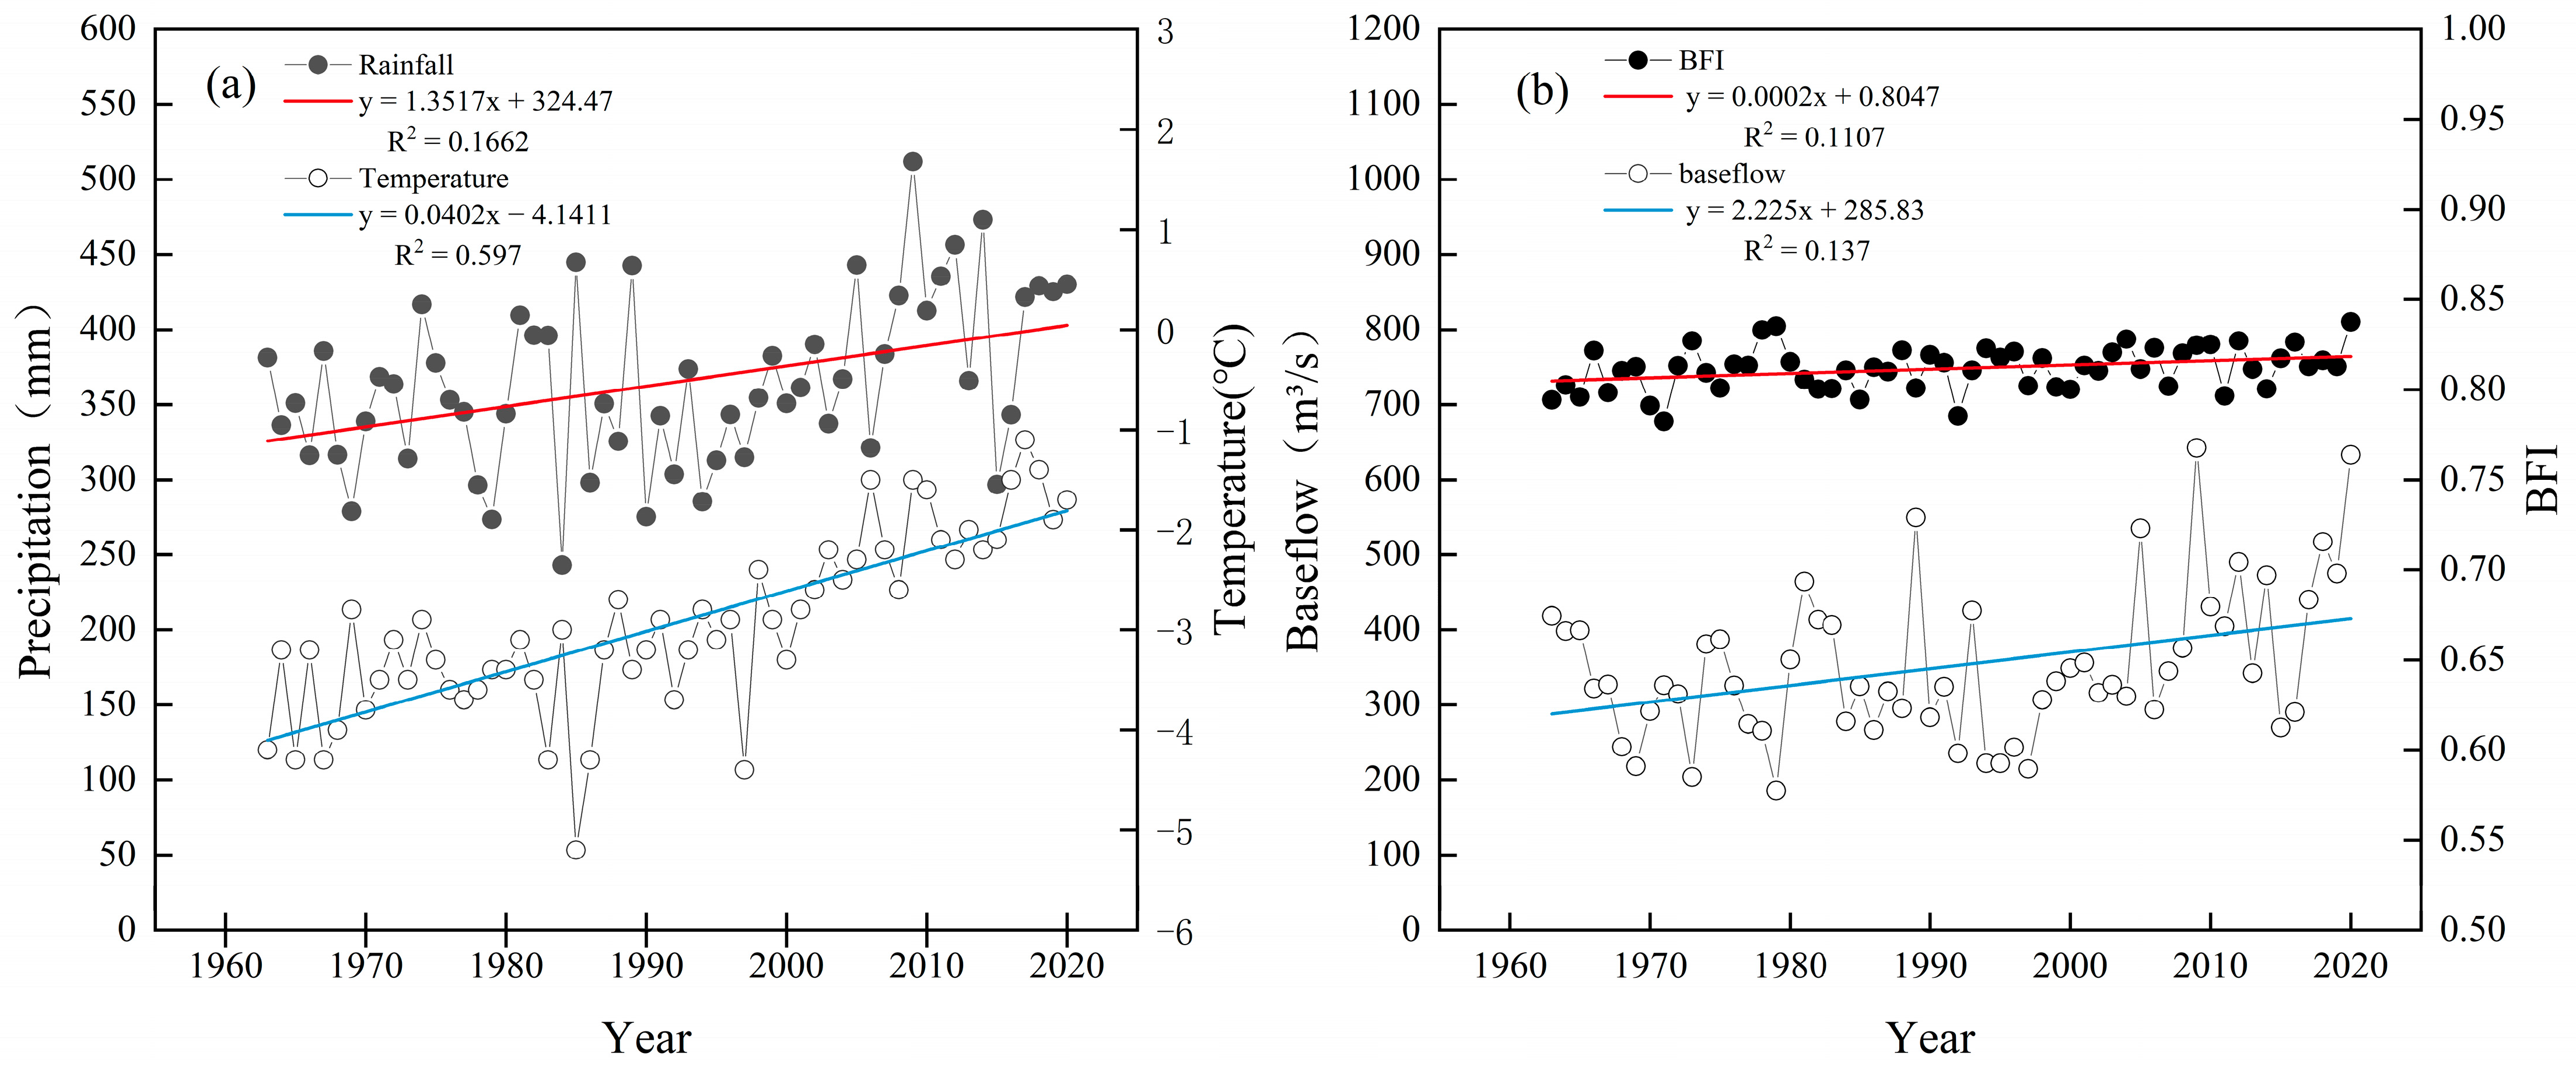
It can be seen in Figure 5 and Table 2 that the annual precipitation, temperature, and baseflow in the SRYR showed significant upward trends from 1963 to 2020. The precipitation increased by 1.35 mm per year, the temperature rose by 0.04 °C per year, the baseflow saw an increase of 2.22 m3/s per year, and the BFI increased by 0.0002 per year.
It can be seen in Figure 6 and Table 3 that the temperature and precipitation in the source region of the Yangtze River have undergone significant mutations. Specifically, the temperature had a significant mutation around 2003, and the precipitation had a significant mutation around 2004. The baseflow and baseflow index had no obvious mutation characteristics.

3.4. Spatiotemporal Variation of Baseflow

According to the SWAT model simulation output and baseflow segmentation, the baseflow time series was extracted and analyzed to evaluate the time change from 1963 to 2020. As shown in Figure 7, the baseflow exhibited a unimodal intra-annual distribution pattern, namely an initial increase and subsequent decrease throughout the year, peaking in July and reaching its lowest point in March. In contrast, the BFI presented a bimodal intra-annual distribution pattern. The BFI displayed a decreasing trend from January to April, followed by a subsequent rise reaching its first peak in May. Subsequently, it declined again until June, after which it steadily increased, culminating in its second peak in November.
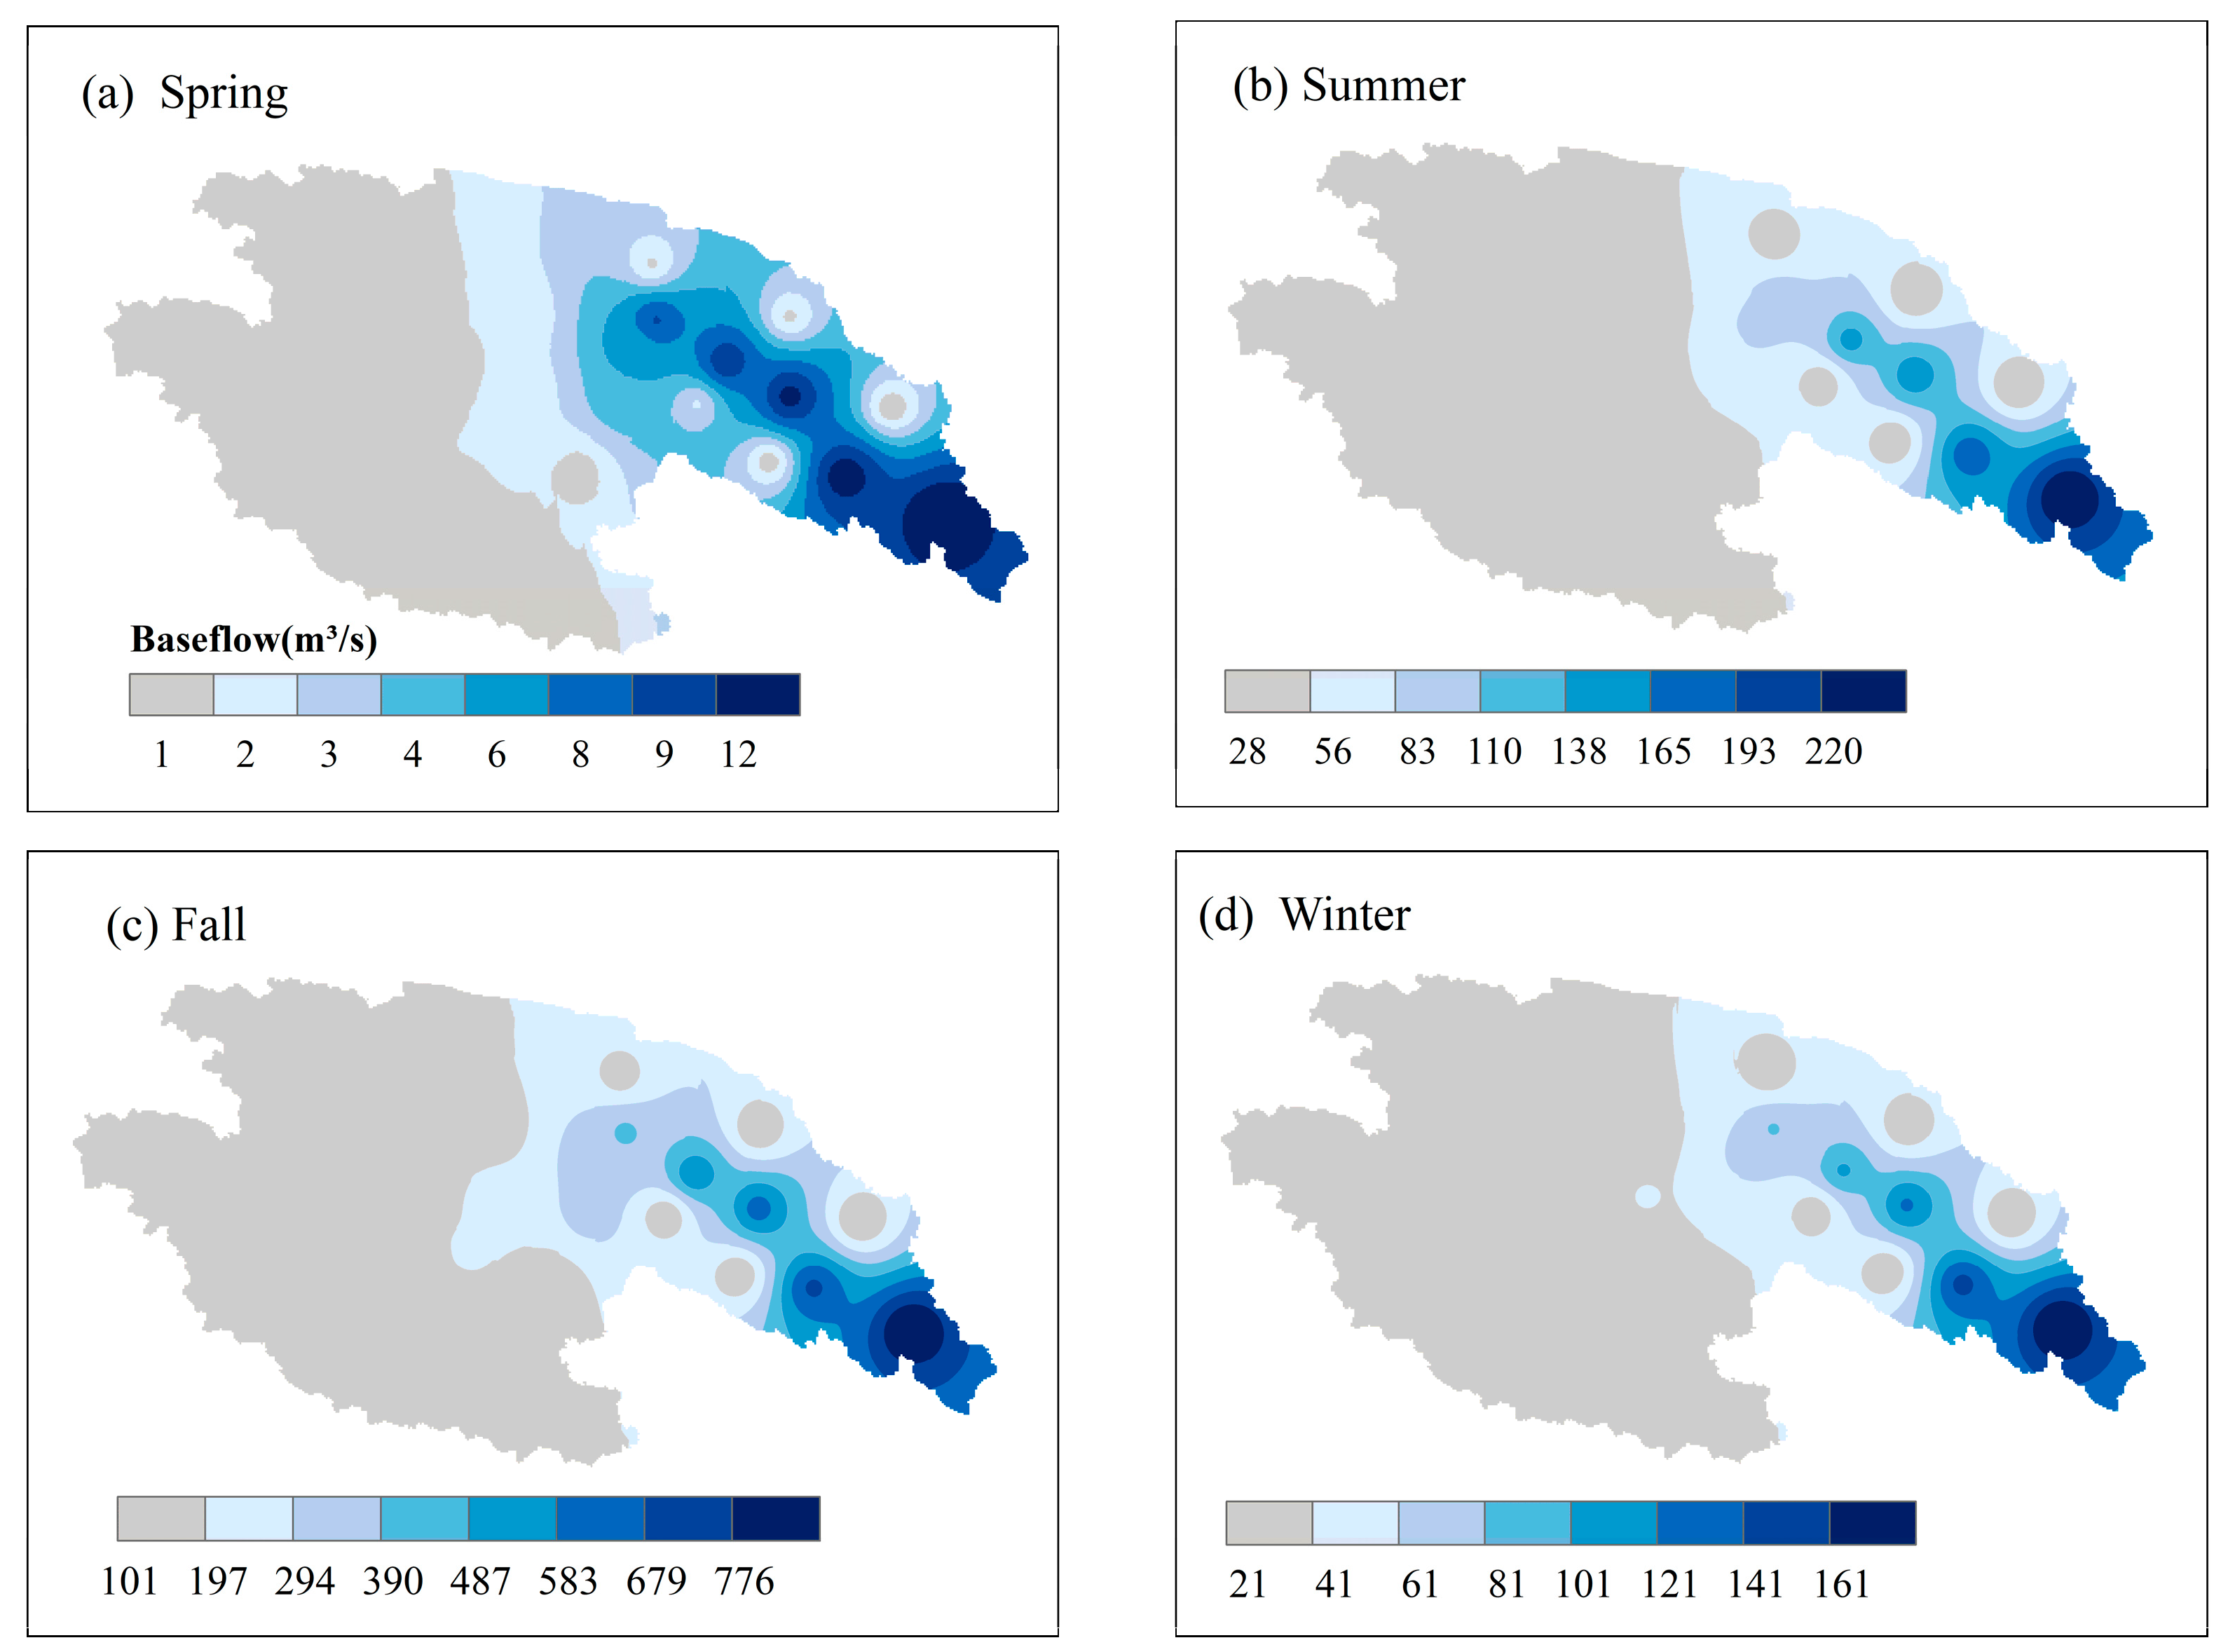
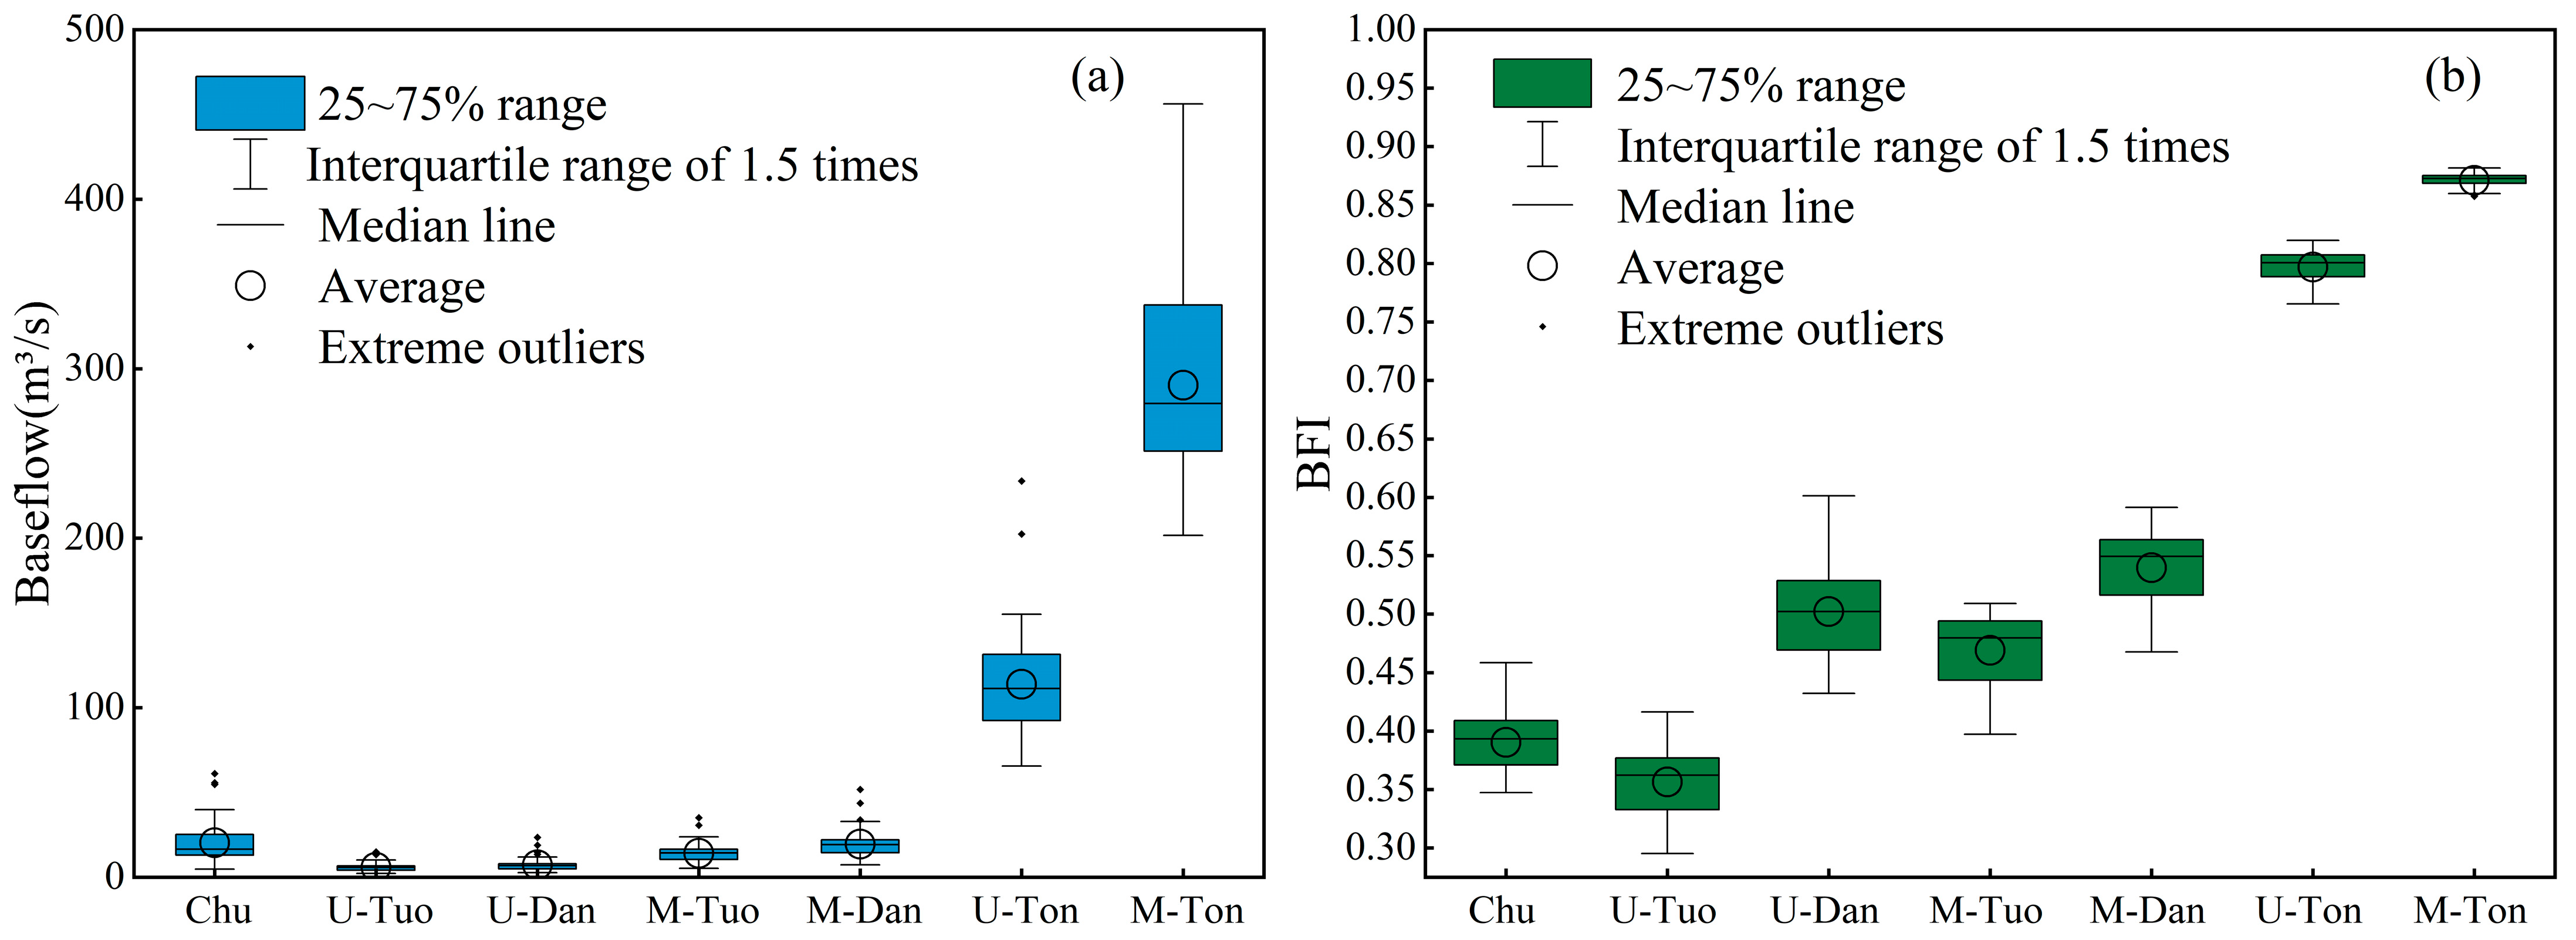
In this study, the annual and seasonal spatial distribution characteristics of baseflow and the BFI in the SRYR were determined by geostatistics (Figure 8, Figure 9, Figure 10 and Figure 11). As shown in Figure 8 and Figure 9, the spatial distribution of baseflow increased from northwest to southeast, and the baseflow in fall was greater than that in spring, summer, and winter. The minimum baseflow in spring was less than 10 m³/s in most areas (Figure 8a). The baseflow in warm months was greater than that in cold months. The Tongtian River exhibited higher baseflow values compared to other regions of the SRYR. The baseflow value of the Dangqu River was greater than that of the other tributaries (Figure 12a).
The annual and seasonal spatial distributions characteristics of BFI are shown in Figure 10, Figure 11 and Figure 12b. The BFI values in the spring, winner and cold months were greater than those in the summer, autumn, and warm months. Specifically, the BFI in winter was higher than in the other periods. Of the whole basin, the BFI value was the largest in the middle and lower reaches of the Tongtian River, followed by the upper reaches of the Tongtian River; the BFI in the Dangqu River was higher than in the other tributaries. Meanwhile, the lowest annual BFI value was concentrated in the upper reaches of the Tuotuo River, as low as 0.42. Additionally, the highest annual BFI value was distributed in middle and lower reaches of the Tongtian River, reaching 0.88.
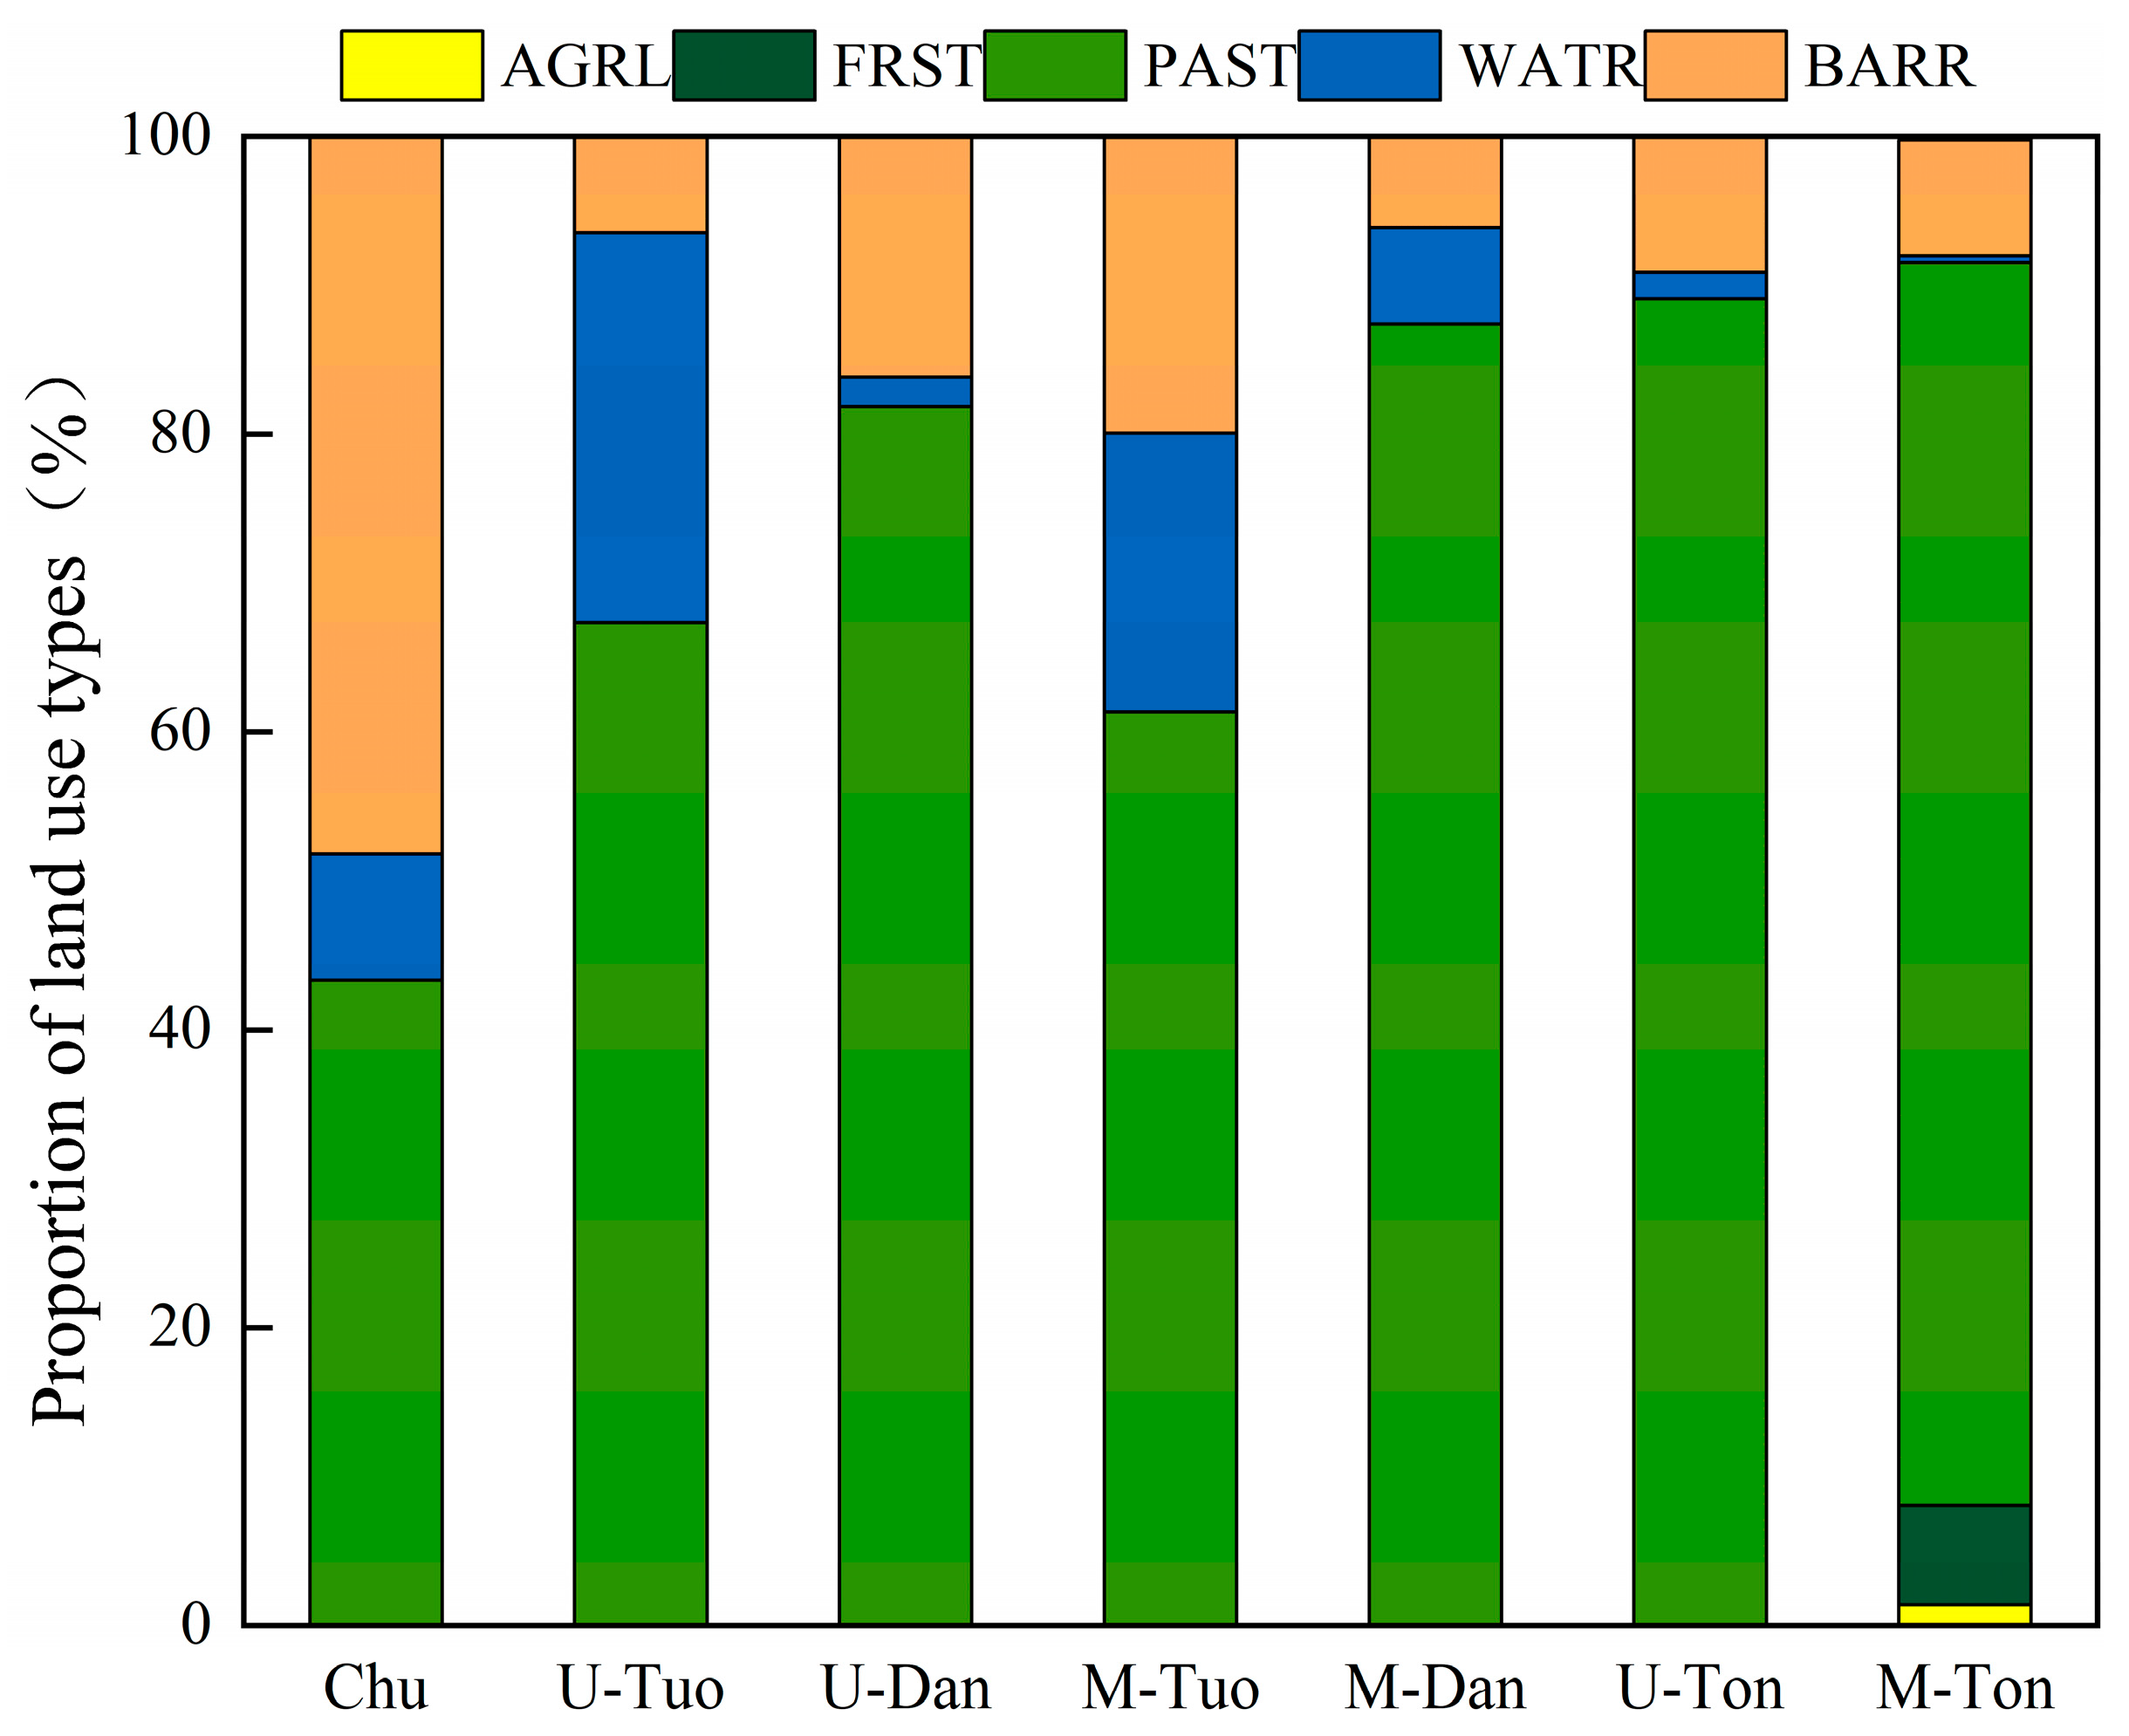
Note: Chu, U-Tuo, U-Dan, M-Tuo, M-Dan, U-Ton, M-Ton represent the Chumaer River, the upper reaches of the Tuotuo River, the upper reaches of the Dangqu River, the middle and lower reaches of the Tuotuo River, the middle and lower reaches of the Dangqu River, the upper reaches of the Tongtian River, and the middle and lower reaches of the Tongtian River, respectively.

3.5. Attribution of Climate Change and Human Activities to Baseflow Variation

Our research mainly focused on exploring the effects and contributions of precipitation, temperature, and human activities on the spatiotemporal variation in baseflow. Based on the mutation test results of meteorological and hydrological factors (Figure 6), the year 2004 was selected as the mutation point to determine the base period (P1), spanning 1963–2004, and the change period (P2), covering 2005–2020. The attribution analysis of baseflow variation was carried out using Formulas (9)–(17).
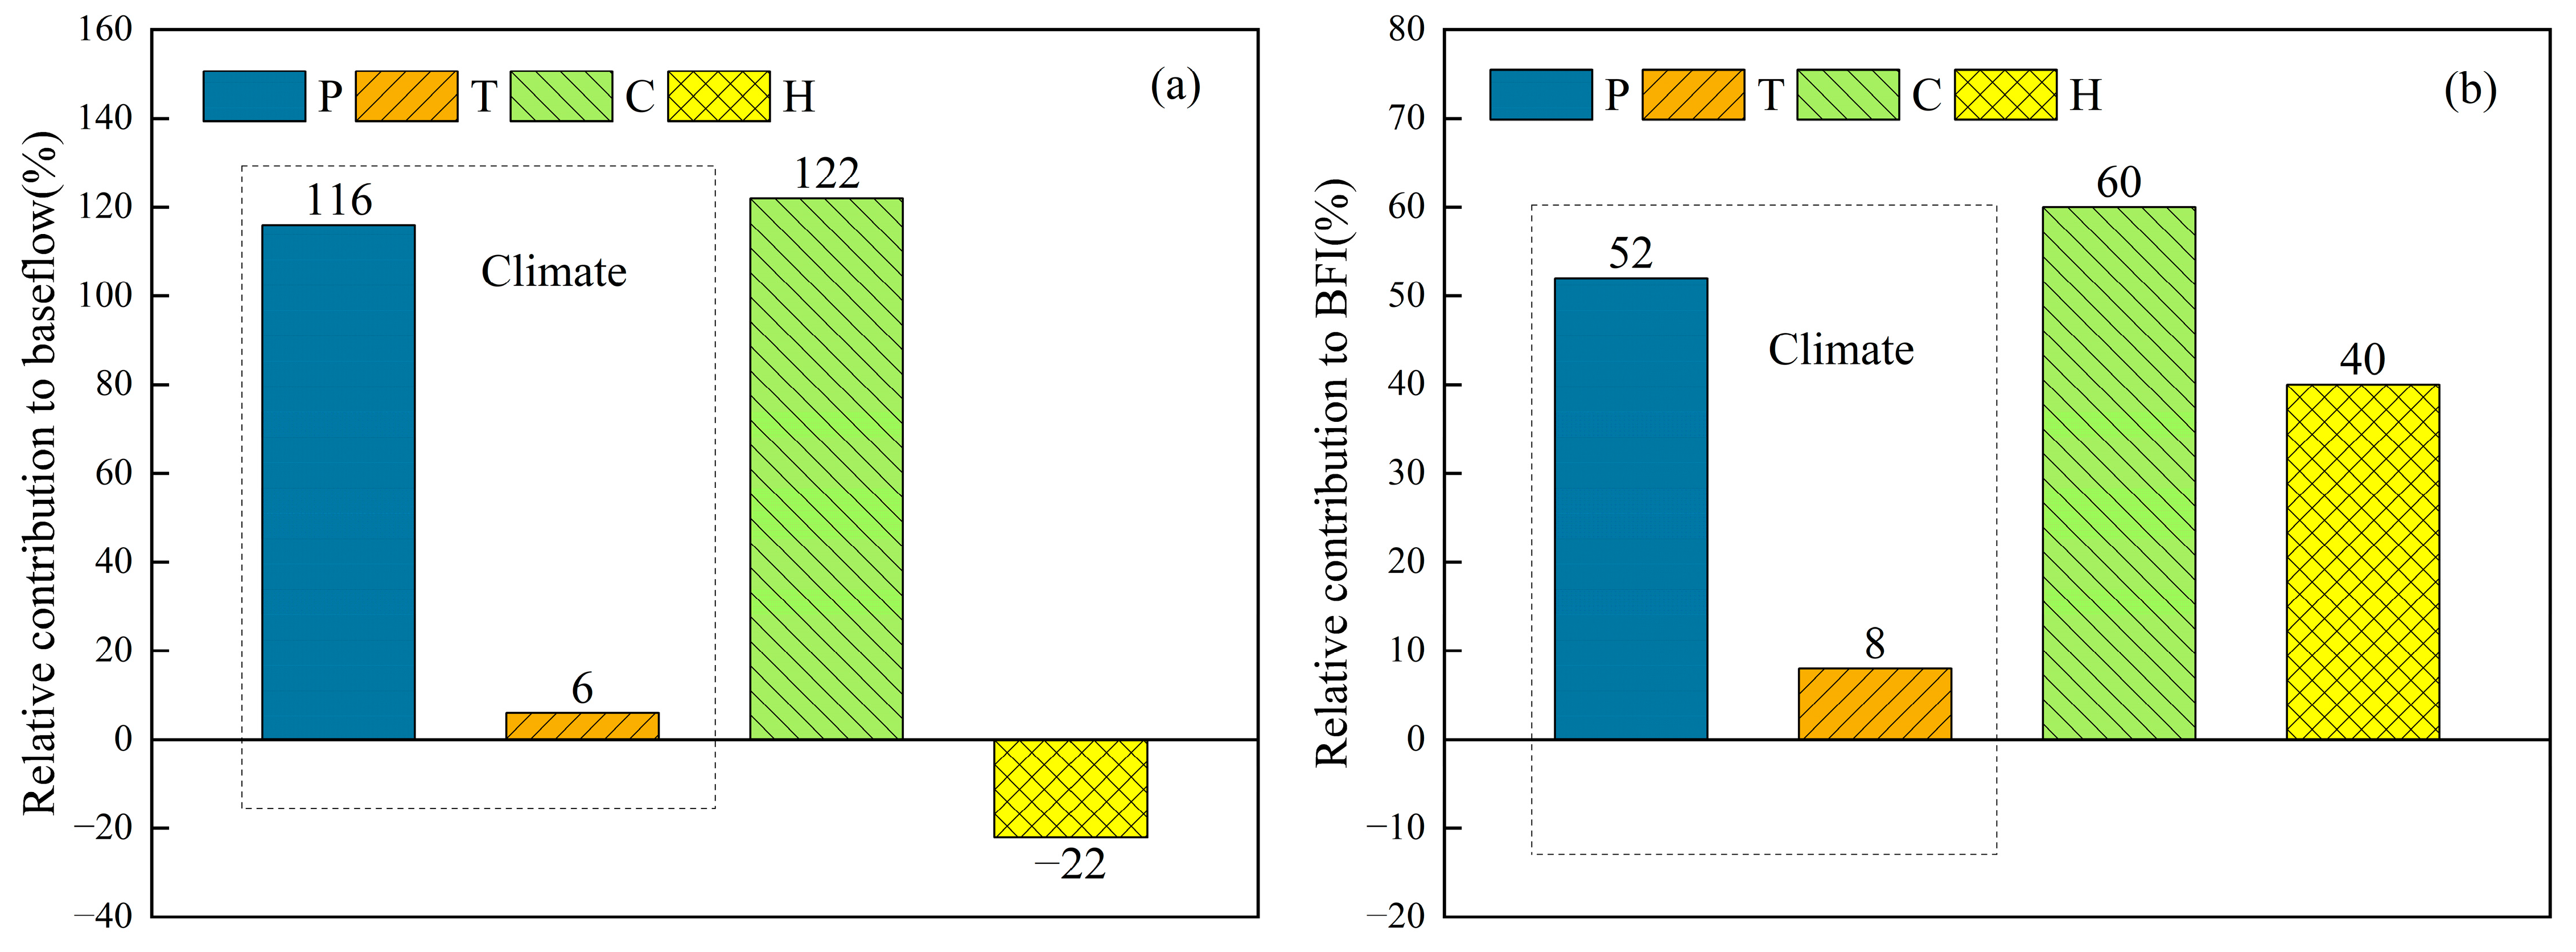
The magnitude and attributions to changes in the baseflow and BFI are shown in Table 4 and Figure 13. The contribution of climate change to the baseflow accounted for 122%, of which the contribution rate of precipitation was 116%, and the contribution rate of temperature was 6%. The contribution rate of human activities was −22%. Therefore, precipitation was the main factor affecting the changes in baseflow in the SRYR. The climate change contribution to the BFI accounted for 60%, of which the contribution rate of precipitation was 52%, and the contribution of temperature was 6%. Human activities contributed 40% to the changes in the BFI. The effects of human activity on the BFI variations cannot be neglected.

4. Discussion

4.1. Key Role of Baseflow in Streamflow Generation

Globally, as the most stable source of stream runoff, baseflow plays an important role in protecting river ecological health [1,2]. Ahiablame et al. [45] pointed out that 60% of the Missouri River runoff came from baseflow in the basin. The simulation results of [46] showed that 6% of the surface water in the upper reaches of the Upper Colorado River Basin was derived from baseflow. As shown in Figure 14, compared to rivers in temperate regions, the SRYR has a larger proportion of groundwater discharge. The BFI results reveal that baseflow is the main contributor to streamflow. The baseflow contributed 53% to 100% of the monthly average streamflow, with an annual mean of 82%, and over 50% of the entire basin had an annual BFI value greater than 0.7. Clearly, our results align with the findings of Li and Fan [30], indicating that baseflow constituted a substantial portion of the runoff components in the SRYR, especially during the cold season. Gonzales et al. [47] even found that groundwater accounted for a higher proportion of 90% in cold regions. Our findings further corroborate the ideas of Guo et al. [48] who found that the contribution of groundwater was much more important than previously thought in alpine basins. Compared to temperate rivers, baseflow can provide relatively more water sources for the surface water body of rivers and plays a more vital role in maintaining the ecological environment in the SRYR. This conclusion can provide an important reference for water resource management and river ecosystem protection and restoration for alpine rivers around the world.

4.2. Underlying Mechanisms of Baseflow and BFI Spatiotemporal Variations

Our results show that climate change was the main influencing factor of baseflow variation, while human activities had less impact. In contrast, the impact of human activities on the BFI was more significant. Since the implementation of the SRYR ecological protection project in 2005, the annual runoff has decreased by 57%, and the summer flood peak flow has decreased by 78% [49]. But human activities, through the restoration of land cover, improved the water retention capacity, and therefore, they may have significantly affected the proportion of baseflow in streamflow.
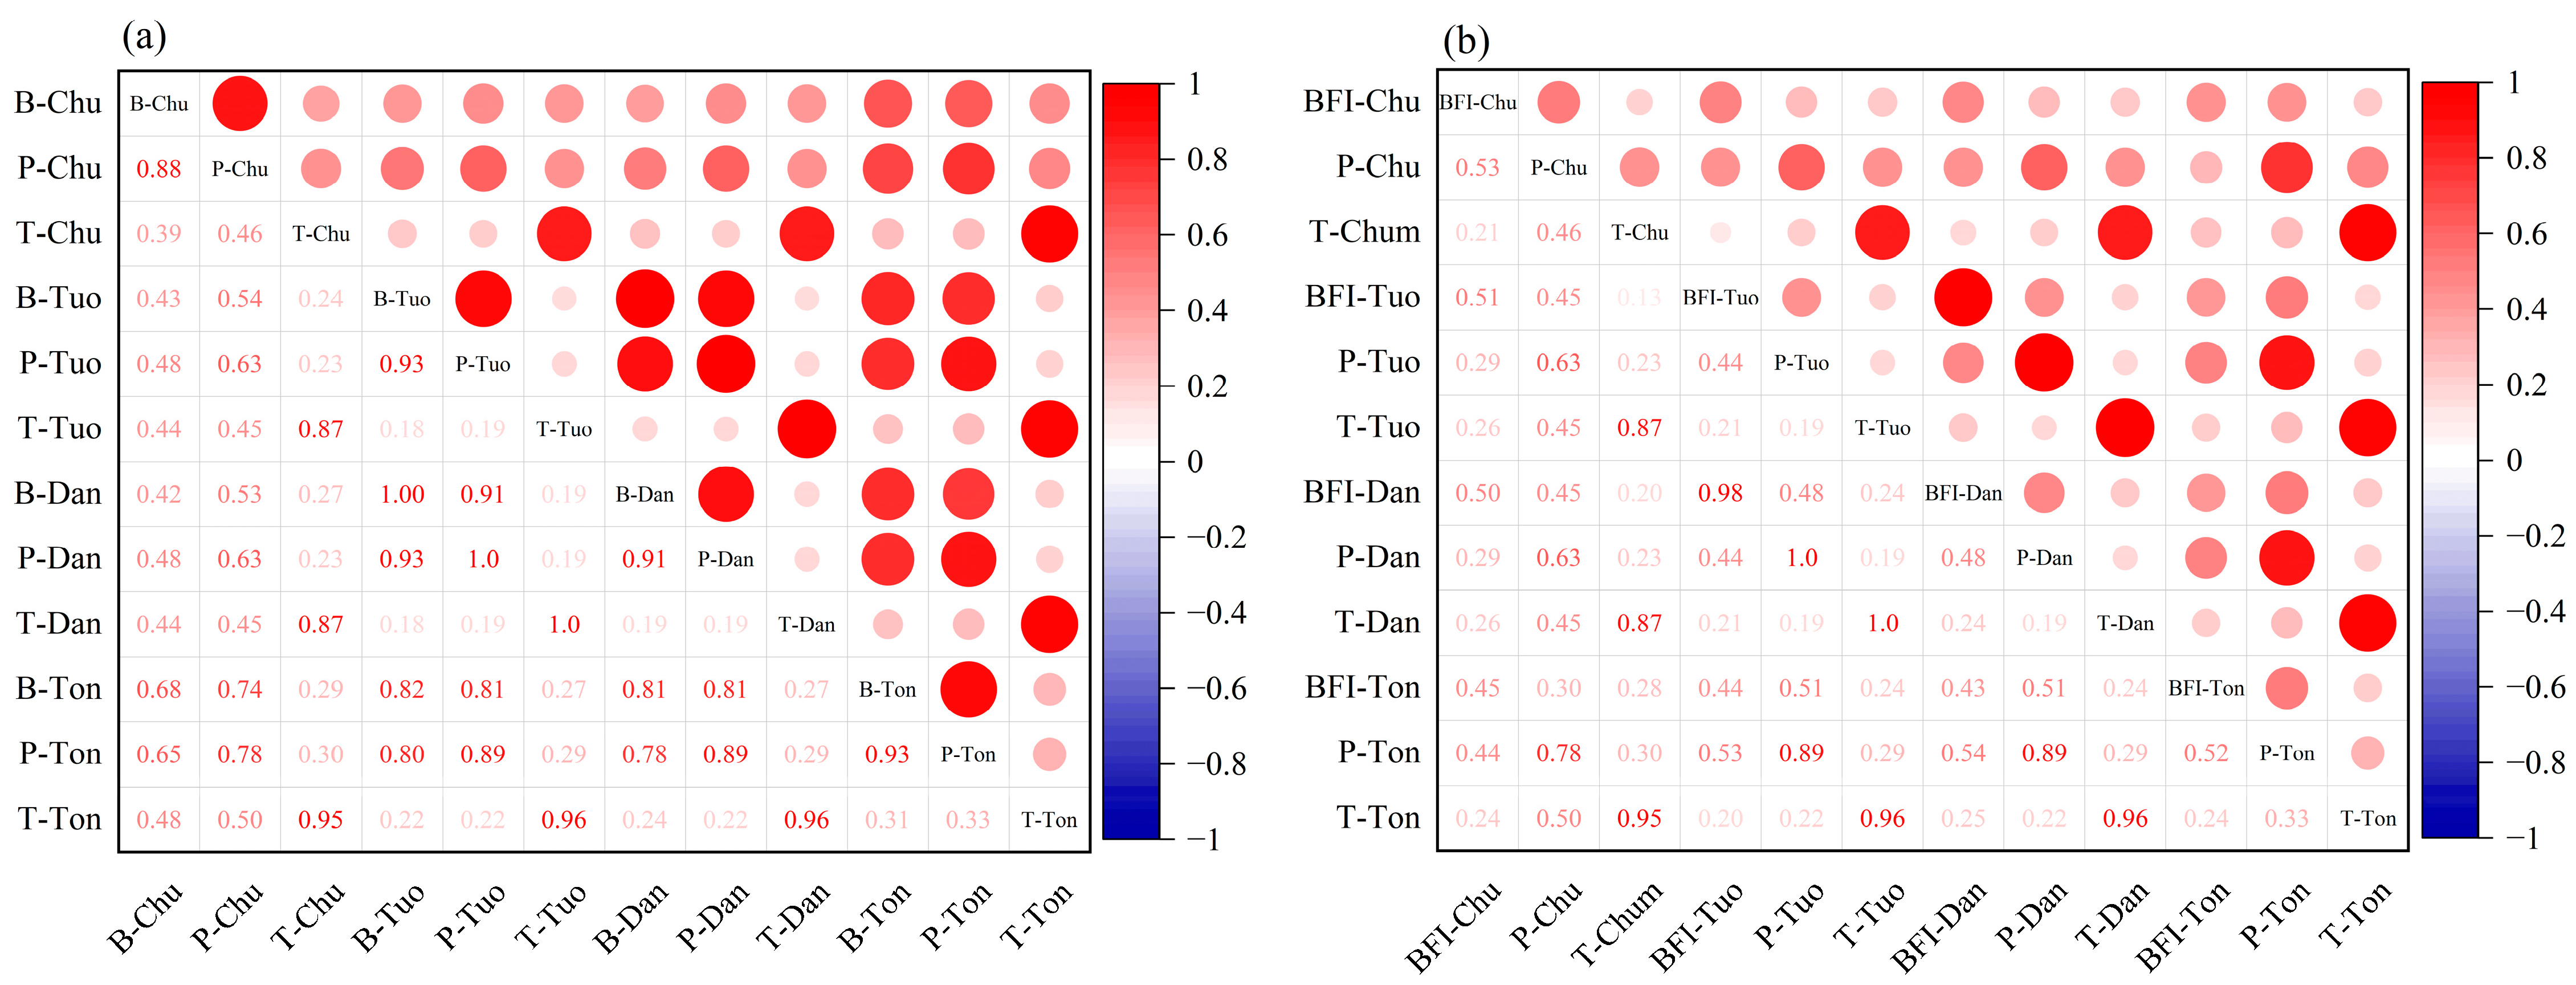
From 1963 to 2020, the baseflow had a gradual increasing trend. The increase in baseflow was probably related to the rising precipitation and warming. Our results show that the increase in precipitation was the most important factor driving the changes in baseflow, and the annual contribution rate was 116%. As shown in Figure 15a, in each sub-basin, there was a significant correlation between baseflow and precipitation. Precipitation can influence baseflow through water availability [45]. When precipitation increases, a larger amount of water infiltrates into the soil and percolates down to the groundwater. This augmented groundwater recharge subsequently leads to higher baseflow contributions to streams and rivers. Temperature is also an important predictor of the alpine region [50]. Compared to the temperate regions, the SRYR experienced faster temperature changes [51], and an increasing gradient of 0.37 °C per decade was observed over the past 64 years. Our results indicate that the contribution of temperature was 6%; though the contribution was not that high, it should not be ignored. This means that warming may significantly enhance the supply of snowmelt water and glacier water to baseflow. This may be related to the melting of permafrost caused by the rise in temperature and its participation in the water cycle [52]. In addition, the warming-induced permafrost thawing may support deeper flow paths and further enhance infiltration [53], leading to increases in baseflow. In our study, temperature was the second main contributor. By comparison, some studies, like that by Yi et al. [52], may disagree with our findings; they thought temperature increases were the most important reason for the increase in baseflow. In summary, temperature played an important role in the variation in baseflow in the SRYR.
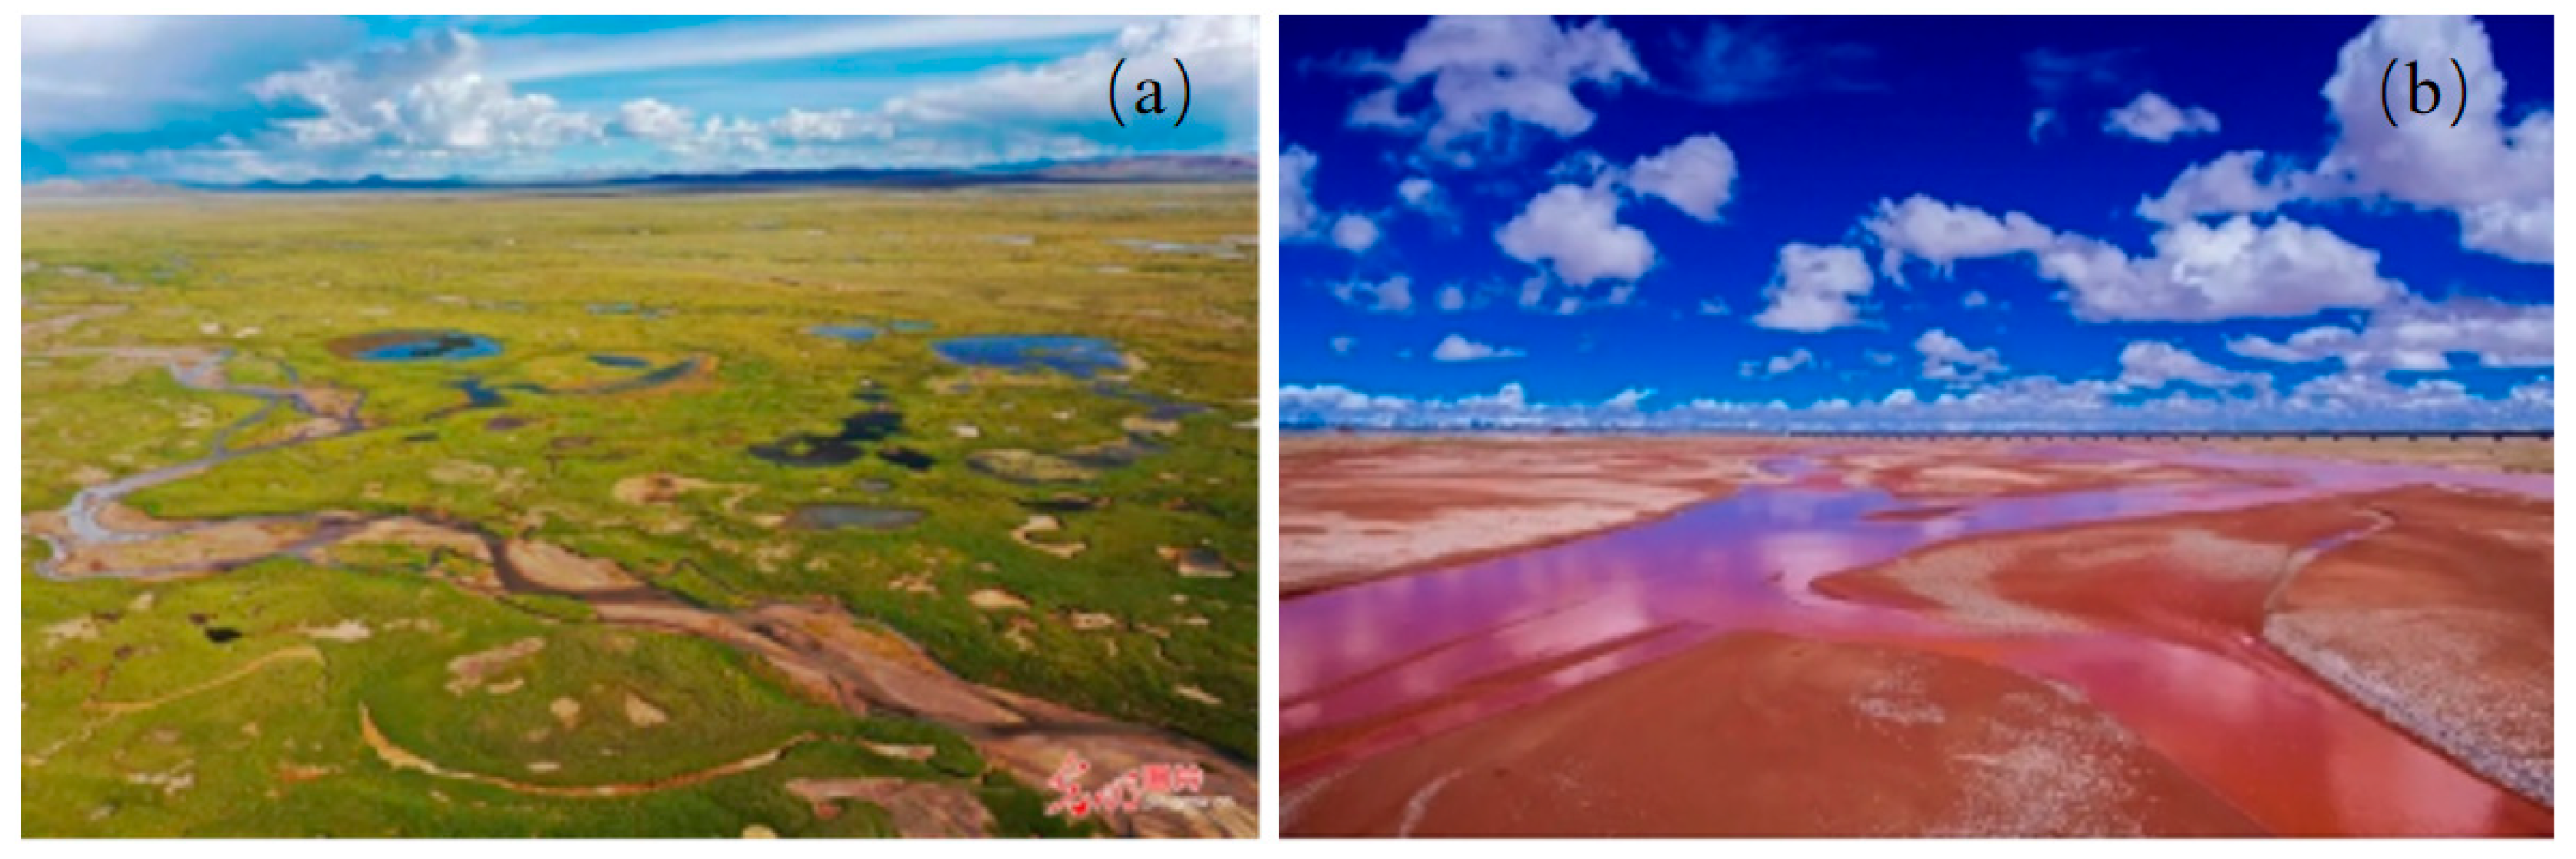
Although the spatial variability in baseflow is related to the spatial distribution characteristics of factors such as precipitation, temperature, and vegetation coverage, it is not solely controlled by any single factor [54]. Moreover, in different regions, the dominant controlling factors of baseflow may differ significantly [55]. Our study illustrates that the baseflow and BFI exhibited distinct spatial distribution characteristics in the SRYR. Generally, there was an increasing trend in the baseflow from upstream to downstream [21]. For example, the baseflow of the Tuotuo River, the Chumaer River, and the Tongtian River tended to increase down the river. Downstream of the Tongtian River had the highest baseflow throughout the SRYR. But this was not the case for the Dangqu River; higher BFI values appeared in the Dangqu River in the upper sections. As we know, the Chadan Wetland (Figure 16a), the largest peat wetland in the SRYR, is distributed upstream of the Dangqu River (meaning swamp river). Wetlands can act as natural storage reservoirs for groundwater [56]. During the warm period, excess water percolates into the wetland, replenishing the groundwater table. This stored groundwater then slowly discharges into adjacent streams, providing a persistent source even during cold periods [57,58], which contributes to the high BFI in the wetlands. In addition, these wetlands are situated areas with low-lying topography or depressions in the landscape, and snowmelt or glacial meltwater in the surrounding highlands could support a sustained baseflow contribution to the surface water body [59]. In other places, the influence of land use types on the spatial distribution of baseflow and the BFI was also obvious (Figure 17); the highest BFI in the whole SRYR occurred in the middle and lower reaches of the Tongtian River due to its good vegetation coverage of 83% grassland. In addition, the lower BFI values throughout the SRYR occurred in the Chumaer River. This area was mainly covered by bare lands, with a mere 48% of vegetation coverage, and had compacted or exposed soils (Figure 16b and Figure 17), which can limit the infiltration capacity of water into the ground [60]. This reduced infiltration may result in increased surface runoff, and more water flows over the land surface rather than infiltrating into the soil [61]. As a result, a higher proportion of precipitation reaches the stream network quickly as overland flow, contributing to the reduced baseflow and BFI. In addition, although this region received the highest precipitation (Figure 17) within the entire SRYR, it also experienced the lowest temperatures and extensive distribution of permafrost. Under the influence of these combined factors, this region consequently exhibited a relatively small BFI in the SRYR.
Furthermore, there were localized areas of high baseflow values observed in the Tongtian River and Dangqu River. This phenomenon was likely associated with the extensive distribution of seasonal frozen soil in these regions, as seen in Figure 18 [62,63]. In summary, the spatial distribution characteristics of the baseflow and BFI were influenced by a combination of factors, including precipitation, temperature, human activities, vegetation coverage, seasonal frost and permafrost, and soil characteristics.
The above analysis on the influence mechanisms of various environmental factors on the spatial-temporal variation patterns of baseflow is of great significance for further understanding the future evolution of baseflow, and the protection and management of groundwater resources in the plateau cold region under the changing environment.

4.3. Uncertainties and Limitations

In this study, we simulated and analyzed the spatiotemporal variations in baseflow through the SWAT model and two-parameter digital filtering and attributed its variations through multiple regression. Although our SWAT model did not incorporate the module of simulating glaciers and frozen soil and did not consider the effects of land cover and land use, our SWAT model still produced plausible simulation results. Nevertheless, if our model could also model glaciers and permafrost, the physical mechanisms of the simulation would be much clearer and more plausible. Therefore, in future hydrological simulation studies in cold regions, in order to reduce the error of model simulation, the glacier and permafrost simulation module should be added to the whole hydrological simulation framework.

5. Conclusions and Prospects

This study analyzed the spatiotemporal variations in baseflow in the SRYR and quantitatively separated the contributions of climate change and human activities to baseflow variation. The following conclusions were reached:
(1)
Precipitation, temperature, and baseflow in the SRYR exhibited significant upward trends. The baseflow during warm months was greater than that during cold months. On the contrary, the BFI in cold months was greater than that in warm months. Additionally, the baseflow and BFI exhibited distinct intra-annual distribution patterns—unimodal and bimodal, respectively.
(2)
The spatial distribution of baseflow increased from northwest to southeast, and more than 50% of the entire basin had an annual BFI value greater than 0.7, which insinuates that baseflow was the major contributor to runoff generation. The Tongtian River exhibited the highest baseflow values compared to other regions of the SRYR, and the baseflow and BFI values of the Dangqu River were greater than that of the other tributaries. The maximum BFI value occurred in the middle and lower reaches of the Tongtian River, and the smallest BFI values occurred in the Chumaer River and the upper reaches of the Tuotuo River.
(3)
The contributions of climate change and human activities to baseflow variability were 122% and −22%, and those to BFI variability were 60% and 40%, respectively. Precipitation contributed to the baseflow and BFI variations by 116% and 60%, respectively, while temperature exhibited contributions of 6% and 8%. All in all, the spatiotemporal variability in the baseflow and BFI primarily resulted from the combined influence of precipitation, temperature, and human activity (changing land cover).
In the future, a hydrological simulation of glacier permafrost will be incorporated to improve the accuracy of the hydrological simulation of the SRYR, and the characteristics of land use change will be further analyzed, which will be added to the hydrological simulation. In addition, the isotope tracer method should be further introduced to improve the accuracy of baseflow estimation. This study offers valuable insights for the management and quantitative assessment of groundwater resources, and river ecosystem protection and restoration within the SRYR amidst climate change.

Author Contributions

Conceptualization, methodology, and software, H.R., L.S., G.W. and W.T.; formal analysis, validation, and investigation, H.R. and L.S.; resources, data curation, C.L., B.L., S.N. and Y.W.; writing—original draft preparation, H.R.; writing—review and editing, W.T., C.L., B.L. and Y.L.; visualization, H.R.; supervision, L.S.; project administration and funding acquisition, G.W. and H.R. All authors have read and agreed to the published version of the manuscript.

Funding

This work was supported by the Fundamental Research Funds for Central Public Welfare Research Institutes (CKSF20241012/SZ), the National Key Research and Development Programs of China (2022YFC3201700), and the National Natural Science Foundation of China (52009006).

Data Availability Statement

The data presented in this study are available in this article.

Acknowledgments

We thank the editors and reviewers for their constructive comments and suggestions to improve our manuscript.

Conflicts of Interest

The authors declare no conflicts of interest.

References

  1. Ficklin, D.L.; Robeson, S.M.; Knouft, J.H. Impacts of Recent Climate Change on Trends in Baseflow and Stormflow in United States Watersheds. Geophys. Res. Lett. 2016, 43, 5079–5088. [Google Scholar] [CrossRef]
  2. Shao, J.; Xiong, Y.; Bu, H.; Wang, Z. Base flow variation in the source region of the Yangtze River and its meteorological influencing factors. Yangtze River 2022, 53, 61–65+71. [Google Scholar] [CrossRef]
  3. Xie, J.; Liu, X.; Jasechko, S.; Berghuijs, W.R.; Wang, K.; Liu, C.; Reichstein, M.; Jung, M.; Koirala, S. Majority of Global River Flow Sustained by Groundwater. Nat. Geosci. 2024, 17, 770–777. [Google Scholar] [CrossRef]
  4. Guisiano, P.A.; Santoni, S.; Huneau, F.; Mattei, A.; Garel, E. Garel Using Natural Tracers and Calibrated Analytical Filter to Highlight Baseflow Contribution to Mountainous Mediterranean Rivers in a Context of Climate Change. J. Hydrol. 2024, 641, 131842. [Google Scholar] [CrossRef]
  5. Duan, H.; Li, L.; Kong, Z.; Ye, X. Combining the Digital Filtering Method with the SWAT Model to Simulate Spatiotemporal Variations of Baseflow in a Mountainous River Basin. J. Hydrol. Reg. Stud. 2024, 56, 101972. [Google Scholar] [CrossRef]
  6. Qian, K.; Lv, J.; Chen, T.; Liang, S.; Wan, L. A review on base-flow calculation and its application. Hydrogeol. Eng 2011, 38, 20–25+31. [Google Scholar] [CrossRef]
  7. Sundar, B.S.; Kumar, J.M.; Bhumika, U. Assessing Efficacy of Baseflow Separation Techniques in a Himalayan River Basin, Northern India. Environ. Process. 2024, 11, 4. [Google Scholar]
  8. Nagy, E.D.; Szilagyi, J.; Torma, P. Calibrating the Lyne-Hollick Filter for Baseflow Separation Based on Catchment Response Time. J. Hydrol. 2024, 638, 131483. [Google Scholar] [CrossRef]
  9. He, S.; Yan, Y.; Yu, K.; Xin, X.; Guzman, S.M.; Lu, J.; He, Z. Baseflow Estimation Based on a Self-Adaptive Non-Linear Reservoir Algorithm in a Rainy Watershed of Eastern China. J. Environ. Manag. 2023, 332, 117379. [Google Scholar] [CrossRef]
  10. Tunqui Neira, J.M.; Tallec, G.; Andréassian, V.; Mouchel, J.-M. Revisiting the Hydrograph Separation Issue Using High-Frequency Chemical Information. Enviro. Model Assess 2024, 29, 813–826. [Google Scholar] [CrossRef]
  11. Mei, Y.; Wang, D.; Zhu, J.; Tang, G.; Cai, C.; Shen, X.; Hong, Y.; Zhang, X. Optimal Baseflow Separation Through Chemical Mass Balance: Comparing the Usages of Two Tracers, Two Concentration Estimation Methods, and Four Baseflow Filters. Water Resour. Res. 2024, 60, e2023WR036386. [Google Scholar] [CrossRef]
  12. Anh, V.T.; Anh, H.L.; Kien, M.D.; Hoai, V.; Nhan, D.D.; Kumar, U.S. Stream Analysis for a Sub-Catchment of Red River (Vietnam) Using Isotopic Technique and Recursive Digital Filter Method. J. Hydro-Environ. Res. 2024, 52, 1–16. [Google Scholar] [CrossRef]
  13. Lyu, S.; Guo, C.; Zhai, Y.; Huang, M.; Zhang, G.; Zhang, Y.; Cheng, L.; Liu, Q.; Zhou, Y.; Woods, R.; et al. Characterising Baseflow Signature Variability in the Yellow River Basin. J. Environ. Manag. 2023, 345, 118565. [Google Scholar] [CrossRef] [PubMed]
  14. Malede, D.A.; Alamirew, T.; Andualem, T.G. Integrated and Individual Impacts of Land Use Land Cover and Climate Changes on Hydrological Flows over Birr River Watershed, Abbay Basin, Ethiopia. Water 2023, 15, 166. [Google Scholar] [CrossRef]
  15. Narimani, R.; Jun, C.; Nezhad, S.M.; Bateni, S.M.; Lee, J.; Baik, J. The Role of Climate Conditions and Groundwater on Baseflow Separation in Urmia Lake Basin, Iran. J. Hydrol. Reg. Stud. 2023, 47, 101383. [Google Scholar] [CrossRef]
  16. Nong, X.; Nie, W.; Ma, X. Baseflow variation and driving factors in the Blow-sand region of Wuding River Basin. Soil Water Conserv. 2023, 37, 103–113. [Google Scholar] [CrossRef]
  17. Liu, Z.; Sheng, F.; Liu, S.Y.; Wang, Y.Y.; Zhou, C.M.; Gu, C.J. Baseflow Variations and Its Causes in a Subtropical Watershed of Southern China. J. Mt. Sci. 2022, 19, 2817–2829. [Google Scholar] [CrossRef]
  18. Lamichhane, M.; Phuyal, S.; Mahato, R.; Shrestha, A.; Pudasaini, U.; Lama, S.D.; Chapagain, A.R.; Mehan, S.; Neupane, D. Assessing Climate Change Impacts on Streamflow and Baseflow in the Karnali River Basin, Nepal: A CMIP6 Multi-Model Ensemble Approach Using SWAT and Web-Based Hydrograph Analysis Tool. Sustainability 2024, 16, 3262. [Google Scholar] [CrossRef]
  19. Wu, J.; Miao, C.; Duan, Q.; Lei, X.; Li, X.; Li, H. Dynamics and Attributions of Baseflow in the Semiarid Loess Plateau. J. Geophys. Res. Atmos. 2019, 124, 3684–3701. [Google Scholar] [CrossRef]
  20. Liu, L.; Cao, W.; Shao, Q.; Huang, L.; He, T. Characteristics of Land Use/Cover and Macroscopic Ecological Changes in the Headwaters of the Yangtze River and of the Yellow River over the Past 30 Years. Sustainability 2016, 8, 237. [Google Scholar] [CrossRef]
  21. Sun, J.; Wang, X.; Shamsuddin, S.; Li, H. An Optimized Baseflow Separation Method for Assessment of Seasonal and Spatial Variability of Baseflow and the Driving Factors. J. Geogr. Sci. 2021, 31, 1875–1896. [Google Scholar] [CrossRef]
  22. Murray, J.; Ayers, J.; Brookfield, A. The Impact of Climate Change on Monthly Baseflow Trends across Canada. J. Hydrol. 2023, 618, 129254. [Google Scholar] [CrossRef]
  23. Biswas, S.; Biswas, S. Estimation of Monthly Snowmelt Contribution to Runoff Using Gridded Meteorological Data in SWAT Model for Upper Alaknanda River Basin, India. Env. Monit Assess 2024, 196, 86. [Google Scholar] [CrossRef] [PubMed]
  24. Xu, R.; Qiu, D.; Wu, C.; Mu, X.; Zhao, G.; Sun, W.; Gao, P. Quantifying Climate and Anthropogenic Impacts on Runoff Using the SWAT Model, a Budyko-Based Approach and Empirical Methods. Hydrol. Sci. J. 2023, 68, 1358–1371. [Google Scholar] [CrossRef]
  25. Chiphang, N. Assessment of Baseflow Estimates Using ArcSWAT and Digital Filter Method in Mago River Basin of Arunachal Pradesh. Sustain. Water Resour. Manag. 2023, 9, 161. [Google Scholar] [CrossRef]
  26. Lee, J.; Park, M.; Min, J.-H.; Na, E.H. Integrated Assessment of the Land Use Change and Climate Change Impact on Baseflow by Using Hydrologic Model. Sustainability 2023, 15, 12465. [Google Scholar] [CrossRef]
  27. Xu, X.; Dong, L.; Zhao, Y.; Wang, Y. Effect of the Asian Water Tower over the Qinghai-Tibet Plateau and the Characteristics of Atmospheric Water Circulation. Chin. Sci. Bull. 2019, 64, 2830–2841. [Google Scholar]
  28. Di, Y.; Zhang, Y.; Zeng, H.; Tang, Z. Effects of Changed Asian Water Tower on Tibetan Plateau Ecosystem. Chin. Acad. Sci. 2019, 34, 1322–1331. [Google Scholar] [CrossRef]
  29. Li, Q. Investigation of Runoff Evolution at the Headwaters of Yangtze River and Its Driving Forces. Yangtze River Sci. Res. 2018, 35, 1–5+16. [Google Scholar]
  30. Li, G.; Fan, L. Comparative analysis of base flow segmentation methods and characteristics of base flow in the source area of the Yangtze River. Yangtze River Sci. Res 2023, 40, 185–190. [Google Scholar]
  31. Luo, K. Response of Hydrological Systems to the Intensity of Ecological Engineering. J. Environ. Manag. 2021, 296, 113173. [Google Scholar] [CrossRef] [PubMed]
  32. Yuan, Z.; Xu, J.; Wang, Y. Historical and Future Changes of Blue Water and Green Water Resources in the Yangtze River Source Region, China. Theor. Appl. Clim. 2019, 138, 1035–1047. [Google Scholar] [CrossRef]
  33. Ahmed, N.; Wang, G.; Lü, H.; Booij, M.J.; Marhaento, H.; Prodhan, F.A.; Ali, S.; Ali Imran, M. Attribution of Changes in Streamflow to Climate Change and Land Cover Change in Yangtze River Source Region, China. Water 2022, 14, 259. [Google Scholar] [CrossRef]
  34. Naveed, A.; Wang, G.-x.W.; Oluwafemi, A.; Munir, S.; Hu, Z.-y.; Shakoor, A.; Imran, M.A. Temperature Trends and Elevation Dependent Warming during 1965–2014 in Headwaters of Yangtze River, Qinghai Tibetan Plateau. J. Mountain Sci. 2020, 17, 556–571. [Google Scholar]
  35. Yu, G.; Liu, L.; Li, Z.; Li, Y.; Huang, H.; Brierley, G.; Blue, B.; Wang, Z.; Pan, B. Fluvial diversity in relation to valley setting in the source region of the Yangtze and Yellow Rivers. J. Geogr. Sci. 2013, 23, 817–832. [Google Scholar] [CrossRef]
  36. Ali, S. Climatic Variability and Periodicity for Upstream Sub-Basins of the Yangtze River, China, Water 2020. Water 2021, 12, 842. [Google Scholar]
  37. Yuan, J.; Xu, Y.; Wu, L.; Wang, J.; Wang, Y.; Xu, Y.; Dai, X. Variability of Precipitation Extremes over the Yangtze River Delta, Eastern China, during 1960–2016. Theor. Appl. Climatol. 2019, 138, 305–319. [Google Scholar] [CrossRef]
  38. Arnold, J.G.; Srinivasan, R.; Muttiah, R.S.; Williams, J.R. Large Area Hydrologic Modeling and Assessment Part I: Model Development. JAWRA J. Am. Water Resour. Assoc. 1998, 34, 73–89. [Google Scholar] [CrossRef]
  39. Hock, R. Temperature Index Melt Modelling in Mountain Areas. J. Hydrol. 2003, 282, 104–115. [Google Scholar] [CrossRef]
  40. Zhao, H.; Li, H.; Xuan, Y.; Li, C.; Ni, H. Improvement of the SWAT Model for Snowmelt Runoff Simulation in Seasonal Snowmelt Area Using Remote Sensing Data. Remote Sens. 2022, 14, 5823. [Google Scholar] [CrossRef]
  41. Nash, J.E.; Sutcliffe, J.V. River Flow Forecasting through Conceptual Models Part I—A Discussion of Principles. J. Hydrol. 1970, 10, 282–290. [Google Scholar] [CrossRef]
  42. Eckhardt, K. A Comparison of Baseflow Indices, Which Were Calculated with Seven Different Baseflow Separation Methods. J. Hydrol. 2008, 352, 168–173. [Google Scholar] [CrossRef]
  43. Wu, G.; Zhang, J.; Li, Y.; Liu, Y.; Ren, H.; Yang, M. Revealing Temporal Variation of Baseflow and Its Underlying Causes in the Source Region of the Yangtze River (China). Hydrol. Res. 2024, 55, 392–411. [Google Scholar] [CrossRef]
  44. Stefano, F.; Roberto, D.; Francesco, V.; Giuseppe, M. On the Role of Serial Correlation and Field Significance in Detecting Changes in Extreme Precipitation Frequency. Water Resour. Res. 2021, 57, e2021WR030172. [Google Scholar]
  45. Ahiablame, L.; Sheshukov, A.Y.; Rahmani, V.; Moriasi, D. Annual Baseflow Variations as Influenced by Climate Variability and Agricultural Land Use Change in the Missouri River Basin. J. Hydrol. 2017, 551, 188–202. [Google Scholar] [CrossRef]
  46. Miller, M.P.; Buto, S.G.; Susong, D.D.; Rumsey, C.A. The Importance of Base Flow in Sustaining Surface Water Flow in the Upper Colorado River Basin. Water Resour. Res. 2016, 52, 3547–3562. [Google Scholar] [CrossRef]
  47. Gonzales, A.L.; Nonner, J.; Heijkers, J.; Uhlenbrook, S. Comparison of Different Base Flow Separation Methods in a Lowland Catchment. Hydrol. Earth Syst. Sci. Discuss. 2009, 6, 2055–2068. [Google Scholar] [CrossRef]
  48. Guo, X.; Feng, Q.; Yin, Z.; Si, J.; Xi, H.; Zhao, Y. Critical Role of Groundwater Discharge in Sustaining Streamflow in a Glaciated Alpine Watershed, Northeastern Tibetan Plateau. Sci. Total Environ. 2022, 822, 153578. [Google Scholar] [CrossRef]
  49. Luo, K. Contribution of Ecological Conservation Programs and Climate Change to Hydrological Regime Change in the Source Region of the Yangtze River in China. Reg. Env. Change 2022, 22, 10. [Google Scholar] [CrossRef]
  50. Ayers, J.R.; Villarini, G.; Schilling, K.; Jones, C. On the Statistical Attribution of Changes in Monthly Baseflow across the U.S. Midwest. J. Hydrol. 2020, 592, 125551. [Google Scholar] [CrossRef]
  51. Pepin, N.; Bradley, R.S.; Diaz, H.F.; Baraer, M.; Caceres, E.B.; Forsythe, N.; Fowler, H.; Greenwood, G.; Hashmi, M.Z.; Liu, X.D. Elevation-Dependent Warming in Mountain Regions of the World. Nat. Clim. Change 2015, 5, 424–430. [Google Scholar] [CrossRef]
  52. Yi, W.; Feng, Y.; Liang, S.; Kuang, X.; Yan, D.; Wan, L. Increasing Annual Streamflow and Groundwater Storage in Response to Climate Warming in the Yangtze River Source Region. Environ. Res. Lett. 2021, 16, 084011. [Google Scholar] [CrossRef]
  53. Walvoord, M.A.; Striegl, R.G. Increased Groundwater to Stream Discharge from Permafrost Thawing in the Yukon River Basin: Potential Impacts on Lateral Export of Carbon and Nitrogen. Geophys. Res. Lett. 2007, 34, 2007GL030216. [Google Scholar] [CrossRef]
  54. Lyu, S.; Zhai, Y.; Zhang, Y.; Cheng, L.; Kumar Paul, P.; Song, J.; Wang, Y.; Huang, M.; Fang, H.; Zhang, J. Baseflow Signature Behaviour of Mountainous Catchments around the North China Plain. J. Hydrol. 2022, 606, 127450. [Google Scholar] [CrossRef]
  55. Waterman, B.R.; Alcantar, G.; Thomas, S.G.; Kirk, M.F. Spatiotemporal Variation in Runoff and Baseflow in Watersheds Located across a Regional Precipitation Gradient. J. Hydrol. Reg. Stud. 2022, 41, 101071. [Google Scholar] [CrossRef]
  56. Erwin, K.L. Wetlands and Global Climate Change: The Role of Wetland Restoration in a Changing World. Wetl. Ecol. Manag. 2009, 17, 71. [Google Scholar] [CrossRef]
  57. Min, J.-H.; Perkins, D.B.; Jawitz, J.W. Wetland-Groundwater Interactions in Subtropical Depressional Wetlands. Wetlands 2010, 30, 997–1006. [Google Scholar] [CrossRef]
  58. Bertassello, L.E.; Rao, P.S.C.; Park, J.; Jawitz, J.W.; Botter, G. Stochastic Modeling of Wetland-Groundwater Systems. Adv. Water Resour. 2018, 112, 214–223. [Google Scholar] [CrossRef]
  59. Bullock, A.; Acreman, M. The Role of Wetlands in the Hydrological Cycle. Hydrol. Earth Syst. Sci. 2003, 7, 358–389. [Google Scholar] [CrossRef]
  60. Owuor, S.O.; Butterbach-Bahl, K.; Guzha, A.C.; Rufino, M.C.; Pelster, D.E.; Díaz-Pinés, E.; Breuer, L. Groundwater Recharge Rates and Surface Runoff Response to Land Use and Land Cover Changes in Semi-Arid Environments. Ecol. Process. 2016, 5, 16. [Google Scholar] [CrossRef]
  61. Paule-Mercado, M.A.; Lee, B.Y.; Memon, S.A.; Umer, S.R.; Salim, I.; Lee, C.-H. Influence of Land Development on Stormwater Runoff from a Mixed Land Use and Land Cover Catchment. Sci. Total Environ. 2017, 599–600, 2142–2155. [Google Scholar] [CrossRef] [PubMed]
  62. Bayard, D.; Stähli, M.; Parriaux, A.; Flühler, H. The Influence of Seasonally Frozen Soil on the Snowmelt Runoff at Two Alpine Sites in Southern Switzerland. J. Hydrol. 2005, 309, 66–84. [Google Scholar] [CrossRef]
  63. Lyu, H.; Wu, T.; Su, X.; Wang, Y.; Wang, C.; Yuan, Z. Factors Controlling the Rise and Fall of Groundwater Level during the Freezing-Thawing Period in Seasonal Frozen Regions. J. Hydrol. 2022, 606, 127442. [Google Scholar] [CrossRef]
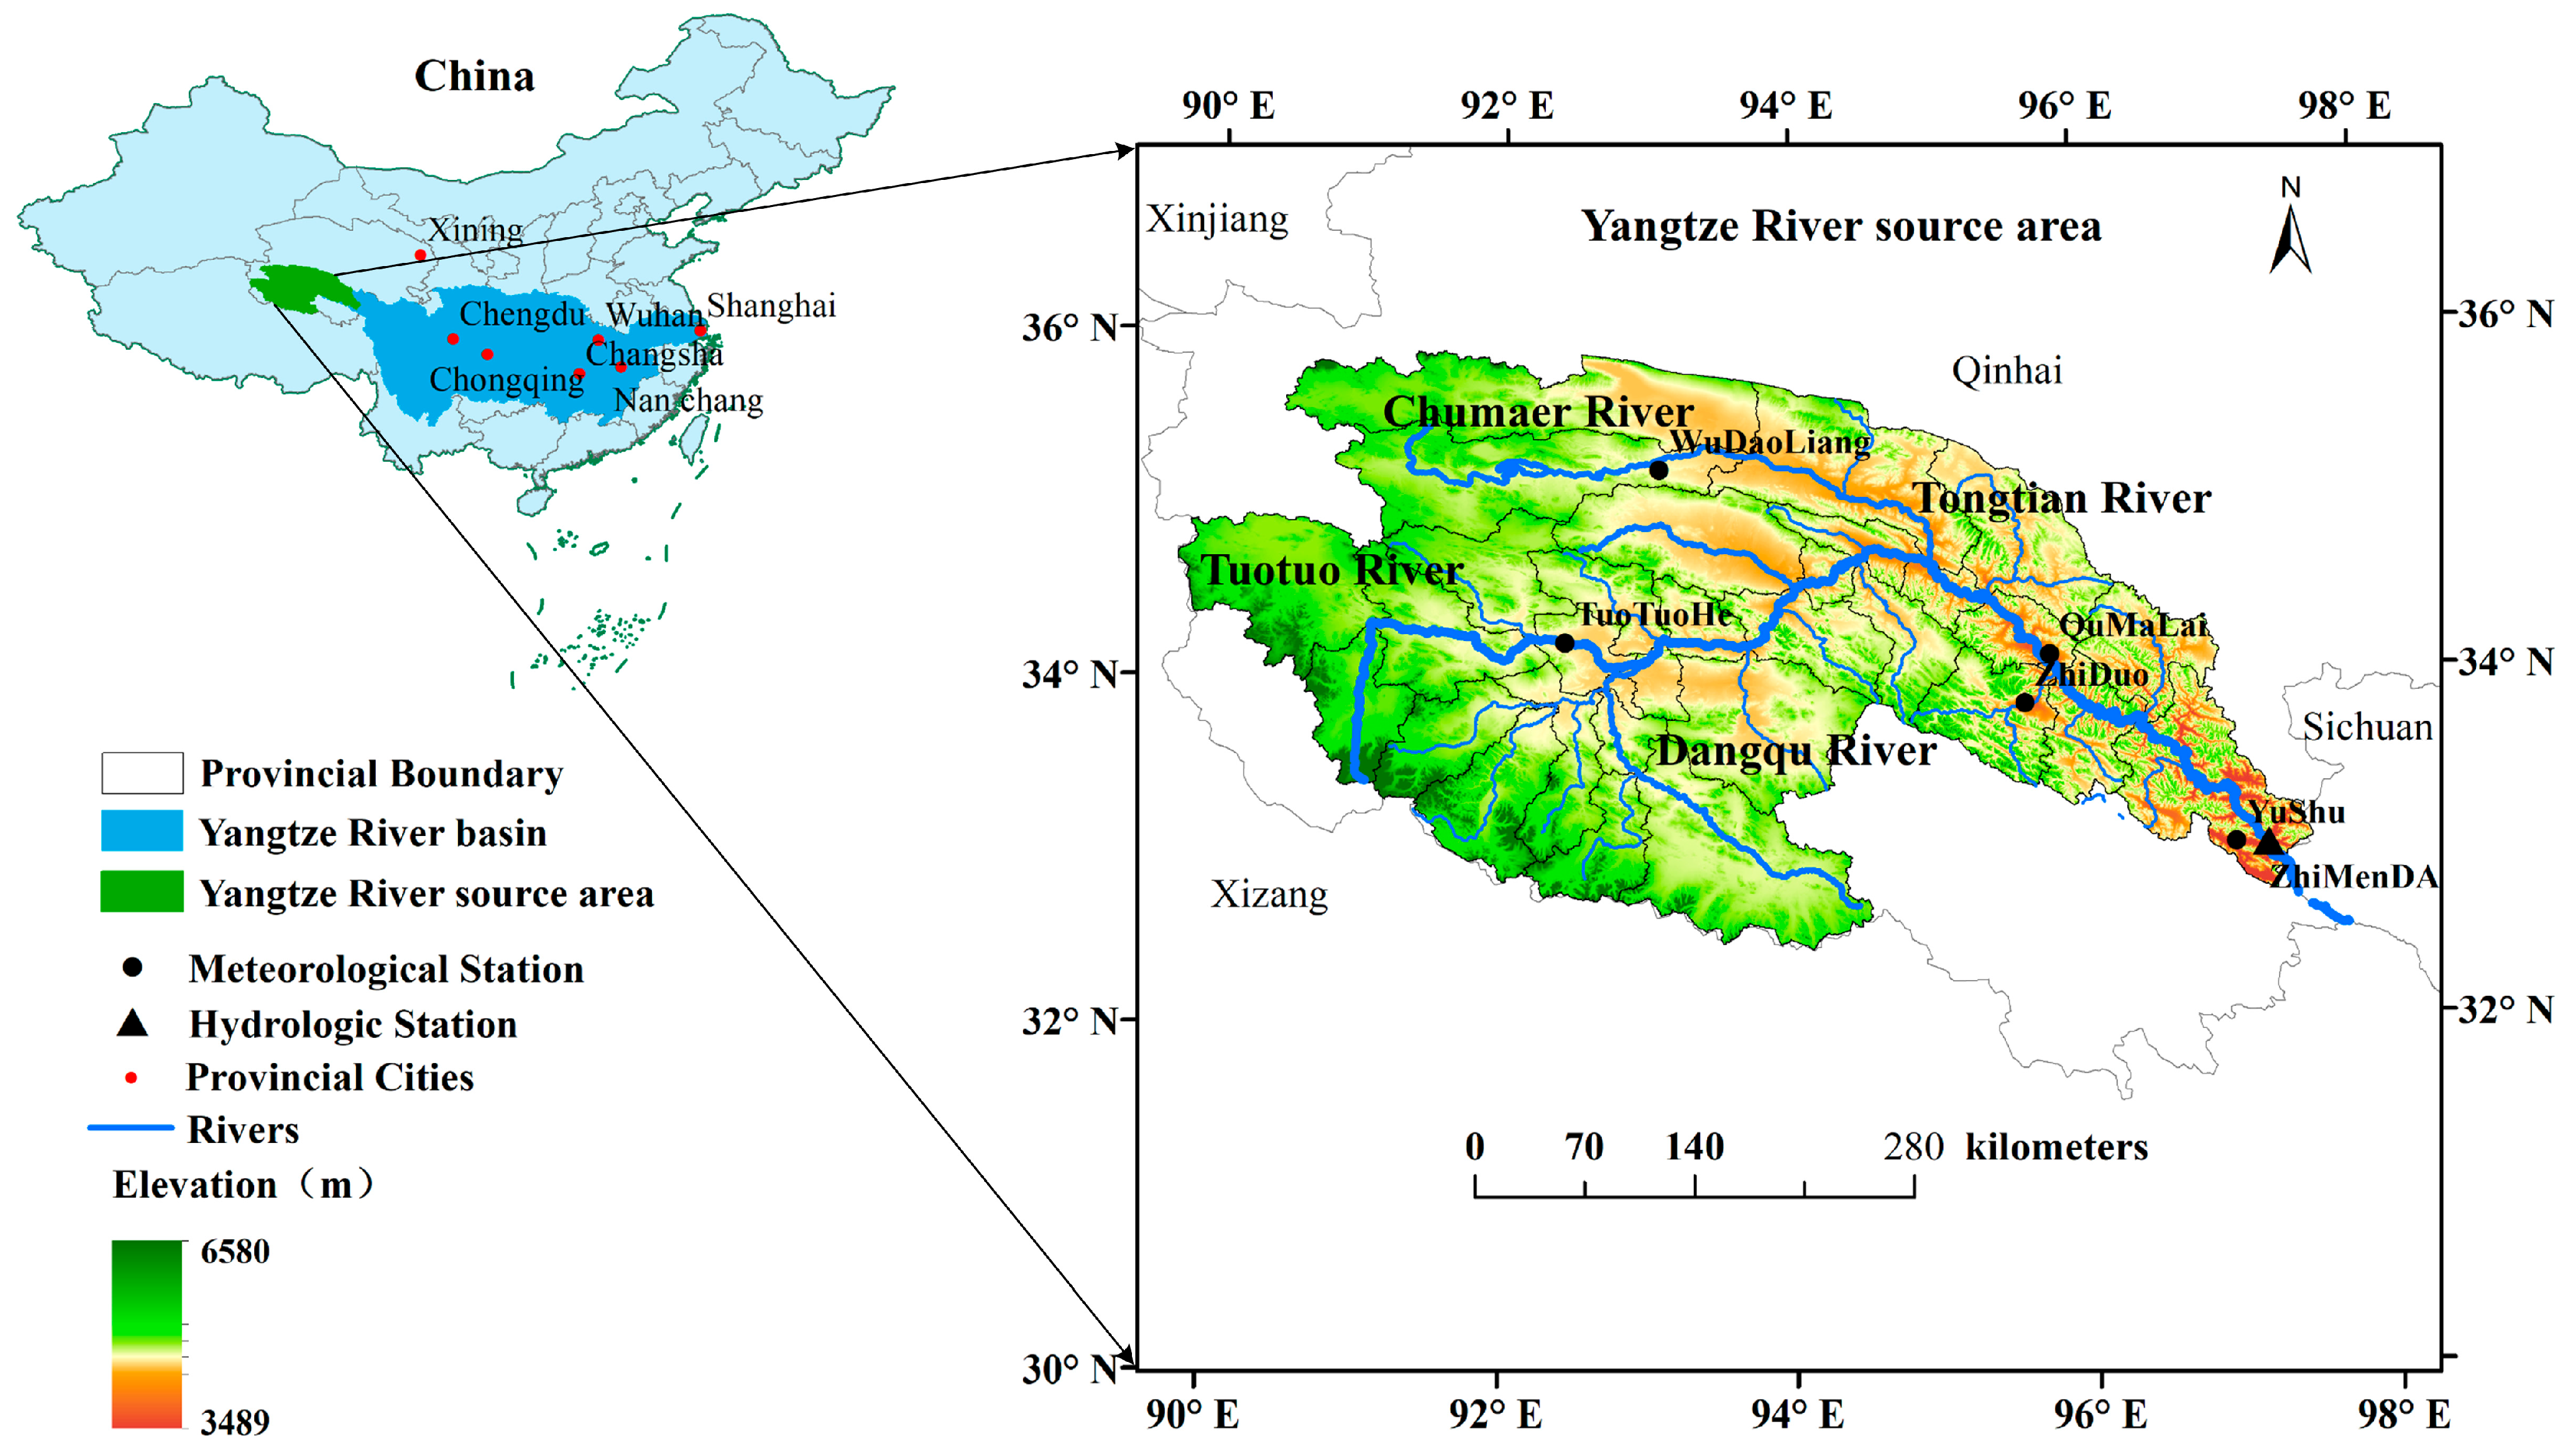
Figure 1. Locations of the study area and meteorological and hydrological stations in the SRYR.
Water 16 02892 g001
Figure 2. Spatial distribution of land use patterns in 1980 and 2020 in the SRYR (AL, FL, PL, WR, UL, BL, and SN denote arable land, woodland, grassland, waters, towns, bare land and glaciers, and permanent snow, respectively).
Water 16 02892 g002
Figure 3. Comparison of observed and simulated runoff values in the calibration and validation period.
Water 16 02892 g003
Figure 4. The sensitivity changes in the main parameters of the SWAT model.
Water 16 02892 g004
Figure 5. Annual variations in precipitation and temperature (a) and baseflow and BFI (b).
Water 16 02892 g005
Figure 6. Mann−Kendall curve of baseflow (a), BFI (b), temperature (c), and precipitation (d).
Water 16 02892 g006
Figure 7. Comparison of baseflow and BFI in different months (a,b).
Water 16 02892 g007
Figure 8. Spatial distribution of baseflow in spring (a), summer (b), fall (c), and winter (d).
Water 16 02892 g008
Figure 9. Spatial distribution of baseflow in cold months (a), warm months (b), and year (c).
Water 16 02892 g009
Figure 10. Spatial distribution of BFI in spring (a), summer (b), fall (c), and winter (d).
Water 16 02892 g010
Figure 11. Spatial distribution of BFI in cold months (a), warm months (b), and year (c).
Water 16 02892 g011
Figure 12. Comparison of baseflow and BFI in different subbasins (a,b).
Water 16 02892 g012
Figure 13. Relative contribution rates of climate change and human activities to baseflow (a) and BFI (b) changes.
Water 16 02892 g013
Figure 14. Variations in streamflow and baseflow (a) and BFI (b) of the SRYR over the last 58 years.
Water 16 02892 g014
Figure 15. Correlation analysis of precipitation, temperature, and baseflow and BFI drivers in different sub-basins. (a) The correlation coefficients among baseflow, precipitation, and temperature; (b) the correlation coefficients among BFI, precipitation, and temperature.
Water 16 02892 g015
Figure 16. Vegetation photos taken in the upper reaches of the Dangqu River (a) and the Chumaer River (b).
Water 16 02892 g016
Figure 17. The proportions of land use patterns in each sub-basin.
Water 16 02892 g017
Figure 18. Spatial distribution maps of precipitation (a), temperature (b), and frozen soil (c) in the SRYR (SF and PF denote the seasonally frozen ground and permafrost).
Water 16 02892 g018
Table 1. Summary of datasets used in this study.
DataDetailsPeriodsSources
DEM mapRaster 30 m-resolution-Geospatial Data Cloud (https://www.gscloud.cn)
LUCC mapRaster 30 m-resolution1980, 2020Resource and Environment Science and Data Center, China (https://www.resdc.cn/Default.aspx)
Soil type mapRaster 30 m-resolution-Harmonized World Soil Database v 1.2
Meteorological dataDaily1963–2020China Meteorological Data Service Centre (http://data.cma.cn/)
Hydrological dataDaily1963–2020Zhimenda Hydrological Station
Table 2. Calibration parameter values of SWAT model.
ParameterParameter DefinitionFitted_Value
r_CN2.mgtSCS runoff curve number −0.0868
v_ALPHA_BF.gwBaseflow alpha factor0.857
v_GW_DELAY.gwGroundwater delay116.939995
v_GWQMN.gwThreshold depth of water in the shallow aquifer1.366
v_GW_REVAP.gwGroundwater “revap” coefficient0.1182
v_ESCO.hruSoil evaporation compensation factor0.8034
v_CH_N2.rteManning’s “n” value for the main channel0.2157
v_CH_K2.rteEffective hydraulic conductivity in main channel alluvium19.375
v_ALPHA_BNK.rteBaseflow alpha factor for bank storage0.289
r_SOL_AWC(1).solAvailable water capacity of the soil layer−0.0062
r_SOL_K(1).solSaturated hydraulic conductivity0.76
r_SOL_BD(1).solMoist bulk density0.4515
v_SFTMP.bsnSnowfall temperature4.75
v_SMTMP.bsnSnow melt base temperature2.79
v_SMFMX.bsnMaximum melt rate of snow during the year8.145
v_SMFMN.bsnMinimum melt rate of snow during the year1.028
v_TIMP.bsnSnow pack temperature lag factor0.787
v_SNOCOVMX.bsnMinimum snow water content that corresponds to 100% snow cover1.863
v_SNO50COV.bsnSnow water equivalent that corresponds to 50% snow cover0.4395
Table 3. Hydrometeorological factor trends and mutation test.
FactorsTrend
SlopeUSignificance (a = 0.05, Ua/2 = 1.96)
Temperature0.04 °C/a6.499S+
Precipitation1.35 mm/a2.961S+
Baseflow2.22 m³/s.a2.274S+
BFI0.00022.595S+
Note: S+ denotes a significant increasing trend.
Table 4. Attributions to baseflow and BFI variations.
BaseflowBFI
△Bobs△BsimContribution (%)△BFIobs△BFIsimContribution (%)
CPTHCPTH
111.3135.71221166−220.0060.0036052840
Note: C, P, T, and H denote the contributions of climate change, precipitation, temperature, and human activities to baseflow and BFI changes.
Disclaimer/Publisher’s Note: The statements, opinions and data contained in all publications are solely those of the individual author(s) and contributor(s) and not of MDPI and/or the editor(s). MDPI and/or the editor(s) disclaim responsibility for any injury to people or property resulting from any ideas, methods, instructions or products referred to in the content.