Abstract
Groundwater recharge zone identification is vital for managing water resources, particularly in semi-arid and dry climates. Accurate and quantifiable assessment is necessary for the sustainable management of groundwater resources, and it is possible to carry this method out using modern techniques and technical standards. To identify likely groundwater locations in the Diyala River Catchment, Iraq, which serves as an example study basin, the current research examines a new methodology that employs a geographic information system, and an Analytical Hierarchy Process connected with remote sensing data. The technique of ArcGIS was employed to generate spatially distributed thematic layers of rainfall, lithology, slope, drainage density, land use/land cover, relief and soil. The raster data from these layers were then converted and categorized. The weights assigned to thematic strata depended on their significance relative to groundwater occurrence. A pairwise judgement matrix for the Analytical Hierarchy Process was used, with the categorized ranking, to assess the standardized weights of the layers under consideration. The layers for the formation of groundwater zones have then been placed using the overlay-weighted summation approach. Three regions, which are classed as excellent, good and moderate, have been identified on the resulting groundwater potential zones map, representing roughly 29, 69 and 2% of the basin’s total area, respectively. The study’s conclusions indicate that, in such a climate, the adopted strategy would produce favourable results to promote the organizing of opinions and the sustainable use of groundwater resources.
1. Introduction
Semi-arid and arid regions are experiencing an increasing shortage of water resources globally due to low precipitation correlated with high evapotranspiration [1,2,3]. Therefore, groundwater resources are the main alternative possible source in such climatic zones [4,5,6,7]. According to the United Nations, Iraq, among most Middle Eastern nations, especially semi-arid and arid areas, falls below the universal water shortage index. Iraq is facing water deficiencies across most of its regions. Growing dam development by riparian nations and climate-associated threats have eventually caused diminishing surface water delivery in the country [8,9,10,11]. The Iraqi government supports the existence of a comprehensive groundwater observation database, which will improve the local capacity for groundwater source organization and investigation to safeguard the nation’s hydroelectric resources. The Diyala River is the third-biggest stream of the River Tigris and is considered the central water source of Diyala City for different uses. One of the shared river catchments, the Diyala River Basin (DRB), borders between Iran and Iraq. The basin is currently experiencing a water deficit, which is made worse by countries upstream, growing human activity and climate change.
The Diyala River’s discharge has significantly decreased, based on various research studies [12,13,14,15]. The result has impacted the river’s vital role in sustaining entire societies. Accordingly, the implication of groundwater as another water source grows. Identifying groundwater prospective areas (GWPz) may become the first step in maintaining the country’s water resources [16]. Recently, several research studies have taken place regarding groundwater resources in Iraq and particularly in the Kurdistan region (KRG) [8,17,18,19,20,21,22,23]. For example, Sangawi et al. [20] delineated GWPz in the Sangaw sub-basin, Sulaymaniyah, KRG Iraq, by integrating electrical resistivity tomography, remote sensing (RS), geographic information system (GIS) and analytical hierarchy process (AHP) methods. However, no specific research study has focused on the identification of groundwater zones in the DRB as a whole basin area. Although Al-Jawad et al. [8] and Jalut et al. [23] discussed groundwater management and modelling in the DRB, they did not identify GWP or apply RS and GIS in their research studies. So, no research has been found on GWPz in the DRB, despite its local importance as a shared catchment in a water-stressed area. Consequently, examining GWPz in a basin can play a substantial part in executing effective groundwater management and safeguarding strategies.
Since groundwater resources are unseen and difficult to identify directly, determining them is an intriguing assignment. A modern substitute for the GWPz documentation is the integration of RS data with GIS environments [20]. Applying RS to hydrogeological research would provide significant data in spatiotemporal measures, which are essential for ongoing research and water resource simulations [9,20]. The representation of a basin’s general properties and physical characteristics, such as slope, land use (LU) and land cover (LC), drainage density, cracks and faults, which are crucial requirements for GWPz identification, requires the ability of Landsat imagery to cover large local areas [16]. Numerous water resources studies have utilized several of these characteristics (Table 1) for GWPz outlining.
Additionally, GIS offers an ideal atmosphere for analysing and loading geo-referenced data collected from maps, satellite imagery and land surveys [9,20,24]. Therefore, RS and GIS denote manageable tools for delineating and evaluating groundwater resources [25]. Different approaches have been proven reliable and effective in identifying GWPz, such as the analytic hierarchy process (AHP) [26,27,28,29,30,31,32,33], frequency ratio [34], weights of evidence [34,35] and logistic regression [36]. Moreover, a variety of machine-learning techniques have been employed to define GWPz. These methods comprise Naïve Bayes [37], Artificial Neural Network, Support Vector Machine [38,39], Boosted Regression Trees [40], Classification and Regression Tree [40]. Moreover, several recent studies have highlighted the advantages of multi-criteria decision analysis (MCDA) techniques for managing groundwater resources [41,42,43]. The AHP is known for its versatility, cost-effectiveness and ease-of-use in analysing complex challenges [29]. This method allows experts to weigh the relative importance of thematic maps in identifying GWPz [30].
Concerning the drought-prone red and lateritic zones of West Bengal, India, Roy et al.’s study [24] employed RS and GIS to identify GWPz. The researchers proposed that satellite remote sensing could provide a promising method for efficiently and cost-effectively identifying surface and sub-surface water resources. Their findings suggested that the methodology, incorporating AHP with enhanced parameterization, has the potential to more realistically identify and map GWPz, thus offering an effective approach to mitigate drought risks in the area.
A study conducted by researcher Aykut [27] utilized RS, GIS and AHP to evaluate GWPz in the Edirne-Kalkansogut region of northwestern Turkey. The findings have the potential to improve water management policies, promote the sustainable use of natural resources, guide physical planning and support sustainable groundwater development in the region, especially in response to the adverse impacts of climate change on human life. The researcher also highlighted that the methodologies used in the research are globally applicable and can be employed in further research related to sustainable groundwater management, basin management, agriculture and the interaction between climate change and groundwater.

Table 1.
Literature review of the thematic layers used to delineate groundwater potential zones.
Table 1.
Literature review of the thematic layers used to delineate groundwater potential zones.
| Literature | R 1 | LI 2 | S 3 | DD 4 | LULC 5 | RL 6 | SOI 7 | LD 8 | GE 9 | WD 10 | FI 11 |
|---|---|---|---|---|---|---|---|---|---|---|---|
| Ahmed et al., 2021 [9] | ■ | ■ | ■ | ■ | ■ | ■ | |||||
| Roy et al., 2020 [24] | ■ | ■ | ■ | ■ | ■ | ■ | |||||
| Gururani et al., 2023 [25] | ■ | ■ | ■ | ■ | ■ | ■ | |||||
| Shaban et al., 2024 [26] | ■ | ■ | ■ | ■ | ■ | ■ | ■ | ||||
| Aykut, 2021 [27] | ■ | ■ | ■ | ■ | ■ | ■ | ■ | ■ | |||
| Ifediegwu, 2022 [28] | ■ | ■ | ■ | ■ | ■ | ■ | ■ | ■ | |||
| Rajesh et al., 2021 [29] | ■ | ■ | ■ | ■ | ■ | ■ | ■ | ■ | |||
| Saranya and Saravanan, 2020 [30] | ■ | ■ | ■ | ■ | ■ | ■ | ■ | ||||
| Lentswe and Molwalefhe, 2020 [32] | ■ | ■ | ■ | ■ | ■ | ||||||
| Kadam et al., 2020 [40] | ■ | ■ | ■ | ■ | ■ | ■ | |||||
| Yıldırım, 2021 [41] | ■ | ■ | ■ | ■ | ■ | ■ | ■ | ■ | ■ | ||
| Beshir et al., 202 4 [43] | ■ | ■ | ■ | ■ | ■ | ■ | ■ | ||||
| Kawara et al., 2024 [44] | ■ | ■ | ■ | ■ | ■ | ■ | ■ | ||||
| Gachari et al., 2011 [45] | ■ | ■ | ■ | ■ | ■ | ■ | ■ | ||||
| Aju et al., 2021 [46] | ■ | ■ | ■ | ■ | ■ | ■ | ■ | ■ | ■ | ||
| Ndhlovu and Woyessa, 2021 [47] | ■ | ■ | ■ | ■ | ■ | ■ | ■ | ||||
| Zhu and Abdelkareem, 2021 [48] | ■ | ■ | ■ | ■ | ■ | ||||||
| Al-Manmi and Rauf, 2016 [49] | ■ | ■ | ■ | ■ | ■ | ■ | |||||
| Allafta et al., 2021 [50] | ■ | ■ | ■ | ■ | ■ | ■ | ■ | ■ | ■ | ||
| Anbarasu et al., 2019 [51] | ■ | ■ | ■ | ■ | ■ | ■ | |||||
| Arya et al., 2021 [52] | ■ | ■ | ■ | ■ | ■ | ■ | ■ | ■ |
Notes: 1 Rainfall; 2 Lithology; 3 Slope; 4 Drainage density; 5 Land use and land cover; 6 Relief; 7 Soil; 8 Linment density; 9 Geomorphology; 10 Distance to river; 11 Fractional impervious surface.
Furthermore, research by Verma and Patel [31] has emphasized the widespread and evolving use of AHP in water resources management. Yıldırım [41] demonstrated the effectiveness of the MCDA method in identifying groundwater recharge zones when combined with GIS support. Additionally, GIS and RS are invaluable tools for managing, monitoring and assessing groundwater resources [10,15,16]. The integration of GIS with AHP, first proposed by Thomas Saaty in 1980 [42], has successfully simplified complex decisions through pairwise comparisons. It is important to note that while AHP and GIS methods are frequently applied to assess groundwater potential, they also have inherent drawbacks. One of the main issues with AHP is its reliance on expert knowledge, which can introduce a significant amount of uncertainty [20]. The AHP method has been primarily employed in natural resources management, regional development and environmental influence valuation [27,28,29]. Therefore, the current study aims to incorporate GIS with RS data to delimit GWPz in the Diyala River Basin. Seven themes—rainfall, lithology, slope, drainage density, LULC, soil and relief—have been considered to accomplish the current research goal. The outcome of this study would be valuable for groundwater resource managers and engineers working in a similar climatic environment.
2. Materials and Methods
2.1. The Illustrated Basin
The Diyala River is the third stream of the Tigris River, Iraq; it originates near Sanandaj in the Zagros Peaks in Iran, establishing the Iran–Iraq boundary for over 30 km, with an entire length of about 574 km [14,15]. The Basin of Diyala River (DRB) lies between 33.216° and 35.833° N latitude, and between 44.500° and 46.833° E longitude, with a total area of nearly 32,752 km2 [8]. Approximately 75% of the basin resides in Iraq, and the remaining is located in Iran (Figure 1). The mean annual precipitation and air temperature are 420 mm and 36 °C, respectively. The flow system of DRB is highly seasonal, with a peak occurring in April and a low cyclical flow rate starting in July and ending in December. About 23% of the land in the basin is used for agriculture, leaving the remaining 77% of the catchment covered by forest [14,15].
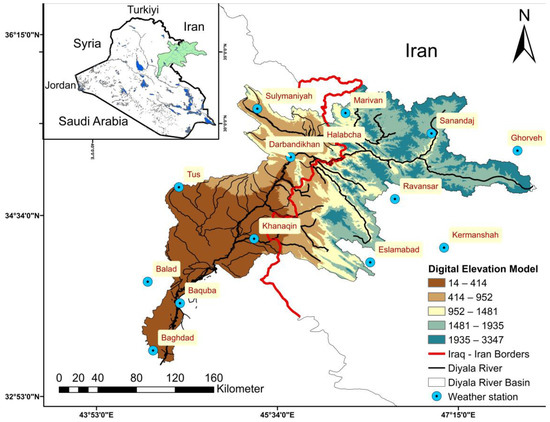
Figure 1.
The hydrographical system of the Diyala River Basin, which is shown on the map.
2.2. Data and Thematic Layers Preparation
Rainfall, LULC, infiltration rates, soil structure, lithology and drainage configurations are the main factors influencing groundwater flow [52]. Finding the governing parameters of movement, storage and existence could help to identify the GWPz [51,52,53]. Many factors, such as the purpose of the research, the features of the basin and the availability of data, influence the selection of variables that impact on behaviour and groundwater movement. Based on DRB’s geological formation and climate, seven thematic layers—soil, lithology, slope, drainage density, LULC, relief and rainfall—have been identified and combined as shown in Figure 2. These layers were created with ArcGIS 10.8 and displayed numerically as theme layers.
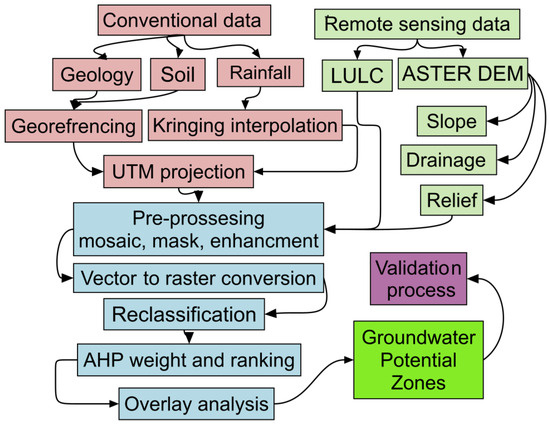
Figure 2.
The study methodology flowchart describing the incorporation between the multi-influencing aspects regarding the groundwater potential zone identifications. ASTER DEM, Advanced Spaceborne and Thermal Emission Reflection Radiometer Digital Elevation Model; LULC, Land use and land cover; UTM, Universal Transverse Mercator; and AHP, Analytical Hierarchy Process.
The dataset includes daily rainfall measurements from 14 meteorological stations, which are situated within and outside the DRB. The Ministry of Agriculture and Water Resources in Iraq’s Kurdistan Province supplied the information. The Global Administrative Areas [54] and Global Land Cover Facility [55] databases provided the shapefiles that depict the borders of Iraq and the DRB, respectively. The following website gave access to a digital soil map of the world that provides the soil type data [56]. The USGS Earth Explorer website provided satellite images and the Digital Elevation Model (DEM) with a spatial resolution of 30 m [57]. Using satellite imagery, image classification techniques and a maximum likelihood algorithm, the slope, drainage density, relief and LULC map were produced in ArcGIS 10.8. To extract streams, topography features and slope characteristics, DEM is processed in a GIS context by filling in the sinks, flow direction, and flow accumulation grids. The geographical layers were resampled into a raster format to create a unified database.
2.3. Thematic Layers Evaluation and Weighting
The current study uses the ArcGIS programme and RS data to create the GWPz map. Seven governing factors—rainfall, lithology, slope, drainage density, LULC, soil and relief—were selected to find GWPz. The AHP methodology has been utilized, to test the thematic layers of these factors using standardized weights. This method requires specific knowledge, solid evidence and an evaluation of array reliability [31]. The AHP simplifies decision-making through formations of an opinion and decisions into a multi-level classified configuration founded on a pairwise evaluation of the significance of several measures in the following five steps:
- (1)
- Selecting the factors that govern groundwater recharge.
- (2)
- Estimating the relative measure weights of selected factors by a particular decision based on Saaty’s rating scale of 1–9 (Table 2). Table 2 presents the value range that is used to quantify the expert opinions. The AHP methodology in the pairwise comparison matrix (PCM) assessment involves incorporating the insights of experts and the results of literature reviews from multiple researchers [28,30]. The authors assigned weights based on the potential impact on groundwater recharge. A thematic layer with a high weight indicates significant influence, while a layer with a low weight suggests minimal impact on groundwater potential. The findings from the PCM, which were used to evaluate the significance and impact of each theme, are summarized in Table 3. According to [42], the values assigned to the thematic layers range from 1 (equal significance) to 9 (extreme significance). A value of 1 denotes equal significance for the two specified criteria, while a value of 9 denotes exceptional importance for one over the other. The outcomes of the inverse comparison are shown by the reciprocals of these values, which range from 1/2 to 1/9.
 Table 2. Scale of Relative Importance [42].
 Table 3. Pairwise comparison matrix of seven thematic layers using the Analytical Hierarchy Process.
 - (3)
- Utilising a pairwise judgement matrix.
- (4)
- Evaluating the consistency percentage (Cr) and variation indicator (CI) of the matrix using Equations (2) and (3) as well as Table 2 to determine the reliability of the matrix. The subjective judgement needs to be changed, if the consistency ratio Cr is more than 10%, but if it is less than or equal to 10%, the inconsistency is acceptable [42]. For all thematic layers in the current study, Cr ≤ 0.1. Hence, the variation is sufficient (Table 3, Table 4 and Table 5).
 Table 4. Normalized pairwise comparison matrix for the Analytical Hierarchy Process in the Diyala River Basin (Eigenvalue λmax = 7.36; consistency index CI = 0.054; consistency ratio Cr = 0.041).
 Table 5. Random inconsistency values (RI) [42].
 - (5)
- Gaining and applying all resultant loads to factors.
Based on the number of thematic layers symbolised by the GWPz, a pairwise comparison matrix was created [52]. Every comparison matrix input defines the row layer effect relative to the column layer. Every layer ranked on groundwater potentiality associated with a different layer was rated, grounded on the Saaty’s [42] rating scale, in which 1 represents an identical effect of the binary factors, and 9 signifies the highest effect of a row layer related to column one [52] (Table 2). In contrast, small loads propose small groundwater potentials, and vice versa [51].
The importance of each thematic layer and the weight of its feature class have been assigned according to previous research (e.g., Table 1) and expert information. Rainfall represents the main recharge of groundwater, and it is considered the most significant parameter. Therefore, rainfall was designated as the first thematic layer and positioned in the first row and column of the pairwise comparison matrix (Table 3). Lithology plays a part in the groundwater movement. It was designated as the second factor and set in the second row and second column of the pairwise comparison matrix (Table 3). The slope was chosen as the third layer since the slope controls the rainfall infiltration into the ground [35]. The density of the DRB drainage has an inverse relationship with the permeability infiltration level [31,35] and was designated as a fourth factor. The soil thematic layer was selected as the seventh element in AHP since infiltration and permeability is directly reliant on the grain size of the soil and the associated porosity [25,28]. Since LULC and relief have the least impact on groundwater recharge, they have been given the lowest importance. Therefore, a comparison matrix was created to describe the importance and rank of each factor (Table 3). A theme scale, ranging from one to seven, was assigned to each pair of layers, indicating their respective importance. The eigenvector states the structure of the layer’s impact on groundwater potentiality [28].
Only when λmax ≥ the number of the selected factors (seven was considered in this research), a pairwise matrix is assessed as consistent; if not, a different matrix must be created [46,48]. The primary eigenvalue (λmax) (Table 4) was obtained by adding products of factor columns summation in the comparison matrix and eigenvectors. A principal eigenvalue of 7.36 for a 7 × 7 matrix was found and applied for Cr calculation (Table 4). The Cr value was computed to test the stability of the standardised loads [25]. The assigned loads are measured and found to be constant, if Cr ≤ 10%, or else, these loads must be re-evaluated to decrease variation [25]. The consistency ratio calculation contains the computing of the consistency index (CI) [25] as shown in Equation (1).
where λmax signifies the main eigenvalue, and N denotes the number of factors. Accordingly, the CI in this research is
The Cr is then estimated based on Equation (2) [33].
where RI signifies the accidental index that is specified in Table 5 for diverse N values. In the present research, RI = 1.32 for seven factors. Consequently, Cr is
Note that Cr also represents 4.50% < 0.1, which is acceptable to conduct the subjective overlap investigation to incorporate the weighted factors for the GWPz drawing.
The final step involves GWPz that can be calculated according to Equation (3) [35].
where Wj signifies the j factor normalized weight, Xi refers to the i-type weight of the factor, m represents the total of the factors and n indicates the sum of types in a particular factor. The GWPz was calculated depending on Equation (4) [33].
where R, LI, S, DD, LULC, RL and SOI are rainfall, lithology, slope, drainage density, LULC, relief and soil in that order. The character ‘w’ expresses a layer, and the character ‘r’ states the rank sub-classes in each thematic layer.
A sensitivity analysis using the map removal method is carried out to fully comprehend the impact of assigned ranks and weights on each class and thematic layer and the significant thematic layers of the obtained GWPz [20]. The results of this analysis indicate which maps are most or least important in influencing the values of the output map. In this process, one theme gets eliminated at a time, and the GWPz is rebuilt with the remaining themes; the sensitivity of the removed theme is determined using Equation (5) [31].
where SA, GWPz, GWPzc and N are sensitivity analysis, groundwater potential zones, recalculated groundwater potential zones and the number of thematic layers, respectively.
3. Results
3.1. Rainfall
After accounting for the relative effects of each parameter on groundwater potential, the pairwise judgement matrix assigned weights to each of the seven parameters based on experience and the literature review. The minimum load on soil is 0.04%, and the maximum load is 0.38% due to rainfall. Rainfall is the primary water source. Prolonged and low-intensity rainfall does not result in significant runoff. Kadam et al. [40] found a positive link between rainfall values and the probability of groundwater obtainability. The DRB lies in three different climate zones. A semi-humid to moderate climate has been chosen for the catchment’s northern portion. However, according to Allafta et al. [50], the central and southern regions of the basin are categorised as semi-arid and dry climatic zones, respectively.
The basin’s average annual rainfall values ranged from 108 mm to 1107 mm based on 35 years of rainfall data (Figure 3). Precipitation is high in the northern and extremely low in the southern parts of the basin. Inversely, moderate values are recorded in the central DRB area, close to the Derbendikan reservoir. It has been found that approximately 45% of the catchment area has high groundwater availability after considering the average annual rainfall for the hydrological years 1979 to 2013. However, 6% of the overall catchment area is considered to have very little groundwater availability. Furthermore, according to Table 6 and Figure 3, the portions with high, moderate and low groundwater availability are around 10, 29 and 11%, respectively.
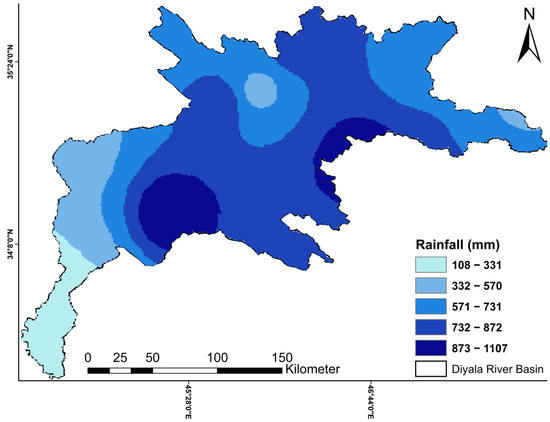
Figure 3.
Spatial distribution of the long-term rainfall over the Diyala River Basin.

Table 6.
Classification of factors controlling the groundwater potential zones in the Diyala River Basin.
3.2. Lithology
Lithology controls water infiltration, movement and storage. The theme map of the lithology revealed five units of unconsolidated sediments: ordinary volcanic rocks, carbonate sedimentary rocks, pyroclastic rock and simple plutonic rocks (Figure 4). Over 48% of the basin consists of unconsolidated sediments in the downstream portion of the catchment. However, the upstream part of the basin area consists significantly of carbonate alluvial rocks that comprise approximately 30% of the catchment region. The remaining portion of the basin consists of simple volcanic rocks, pyroclastic rocks and fundamental plutonic rocks with percentages of 18, 2 and 1%, respectively (Table 6 and Figure 4).
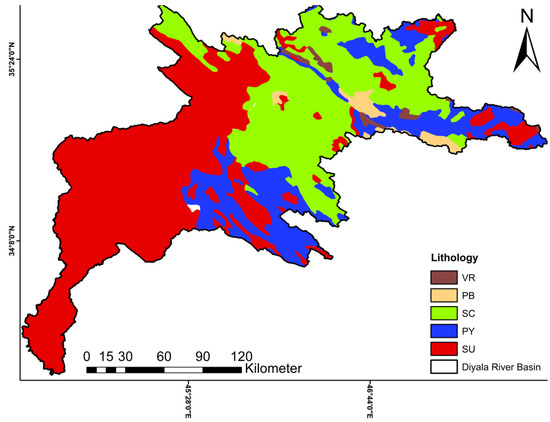
Figure 4.
Lithology map of the Diyala River Basin. VR, basic volcanic rocks; PB, plutonic rocks; SC, carbonate sedimentary rocks; PY, pyroclastic; SU, unconsolidated sediments.
3.3. Slope
The gradient of the terrain plays a crucial role in determining local relief and its impact on groundwater recharge. This factor is commonly used in delineating GWPZ, as it directly influences the infiltration of surface water. The slope of the basin governs the energy of water flow and consequently influences the rate of both infiltration and runoff. Steep slopes allow for inadequate time for infiltration compared to gradual slopes, resulting in reduced groundwater recharge due to high runoff rates and vice versa [49]. The basin slope can be derived using the ArcGIS environment through the spatial analyst/surface/slope tool.
The DRB slope varies between 0° and 76° and is divided into five classes: <6° (gentle), covering approximately 16 km2 (48%); 6°–14° (moderate), covering around 7 km2 (20%); 14°–23° (steep), covering about 5 km2 (16%); 23°–33° (very steep), covering approximately 4 km2 (12%); and >33° (extreme), covering about 1 km2 (5%). The larger portion of the catchment area consists of mild to moderate slopes, predominantly in the downstream part (refer to Figure 5). The areas classified as steep, very steep, and extreme slopes mainly encompass the upstream area of the catchment (refer to Figure 5). Higher emphasis is placed on mild and moderate gradient zones due to lower surface runoff and longer water infiltration times, resulting in lesser impacts on steep, very steep, and extreme slope regions, which experience higher surface runoff and limited infiltration (refer to Table 6 and Figure 5).
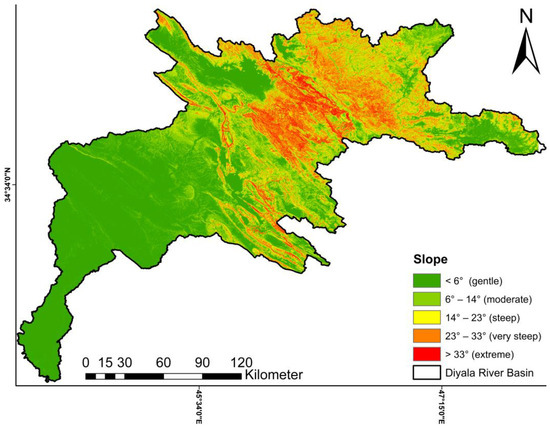
Figure 5.
The slope map of the Diyala River Basin.
3.4. Drainage Density
By dividing the basin’s total area by the quotient of the stream length throughout, one can determine the drainage density. The density of basin drainage affects the distribution of surface runoff and infiltration rates. Reduced infiltration and GWPz result from increased surface runoff from a high drainage density and vice versa. The drainage density was determined in this study using the spatial analyst option, which is included in the Toolbars of ArcMap. This option is used to run the line density function that is a part of the density environment.
The DRB drainage density is represented by five classes: 0.48–2.9 km/km2, which makes up more than 6% of the studied region; 3–3.9 km/km2, which equates to roughly 15%; 4–4.7 km/km2, which covers more than 32%; 4.8–5.5 km/km2, which makes up more than 26%; and 5.6–7.5 km/km2, which represents more than 20.13%. Consequently, the maximum region of the basin has low to moderate drainage densities (Figure 6).
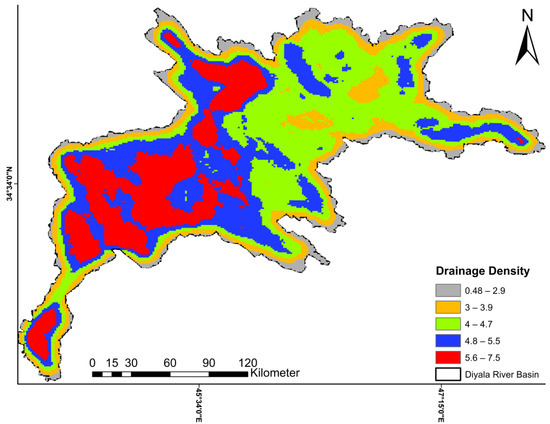
Figure 6.
The drainage density map of the Diyala River Basin.
3.5. Land Use and Land Cover
Alteration in LU and LC is known to change the underlying mechanisms that assign precipitation to surface runoff by altering an ecosystem’s hydrological properties, such as groundwater recharge and infiltration. Land used for agriculture and (bodies of) water are considered valuable resources for replenishing groundwater. Rocky terrain and developed areas serve as low repositories of groundwater recharge because of their high runoff and low permeability.
Local LU and LC is mostly affected by the hydrological processes in the basin, such as runoff, evapotranspiration and infiltration. For example, forest and agricultural lands have substantially decreased runoff, consequently increasing infiltration. Accordingly, LU and LC can be considered a significant factor in GWPz. Five main types of LU and LC are recognized in DRB: water bodies are about 367.41 km2 (1%); forests are 219.95 km2 (0.67%); agricultural lands dominate with 29,878.43 km2 (90.61%); built lands comprise 1454.25 km2 (4.41%); and bare lands are only 1055.60 km2 (3.20%) (Figure 7).
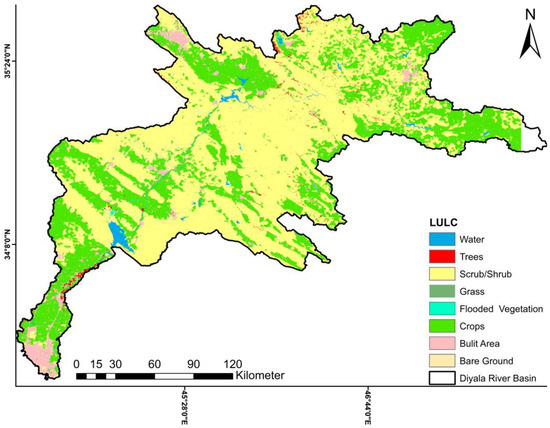
Figure 7.
The land use and land cover (LULC) map of the Diyala River Basin.
Agricultural areas have the maximum extent across most of the basin. Forests are intense in the southern and northern regions, and minor areas are located in the south-east. There is a general spread of cropland throughout the region, but its main concentration lies in the south-west. Water bodies contain the Diyala River, Derbendikan reservoir and Hemren lake. Water bodies receive the highest load because they are thought to be high drainage areas. The lowest load is allocated to bare, urban, dense forest and agricultural lands with very low hydraulic conductivity and infiltration capability (Table 6).
3.6. Relief
Potential groundwater zones are mainly dependent on elevation; in the event of a sufficient amount of precipitation, low-lying areas would retain rainwater longer and generate less runoff, thereby expanding the groundwater recharge zone in low-lying areas. In contrast, high-land areas would retain rainfall longer and produce more runoff. The DRB relief ranges from 18 to 2700 metres above sea level. Groundwater prospects are at their worst in most of the basin (between 33 and 29%), with very high to high relief (Table 6 and Figure 8).
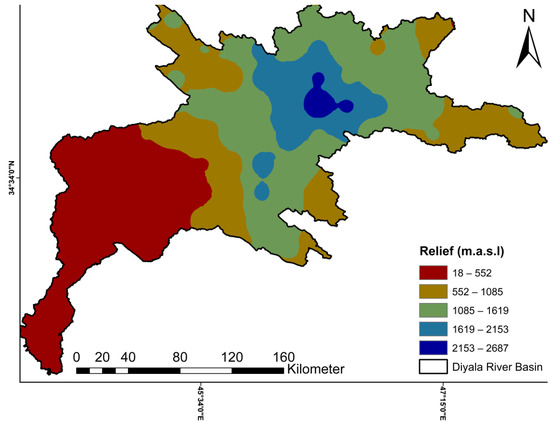
Figure 8.
The elevation map of the Diyala River Basin.
3.7. Soil
Soil data were in the form of a shape file denoting polygons of various soil textures. The data were explored and displayed in ArcGIS 10.8 as a map format and verified that the data satisfactorily covered the DRB area. Four soil texture classes (loam, clay loam, sandy loam and clay) were recognized in the studied basin. More than 91% of the DRB soil types are loam and clay loam. Loam soils prevail in the northeastern part of the basin, while clay loam soils prevail in the middle parts of the catchment. Sandy loamy soils are observed in the southern areas of the catchment and denote more than 12% of the total soil types. Clay soils constitute about 6% of the soil categories (Table 6 and Figure 9).
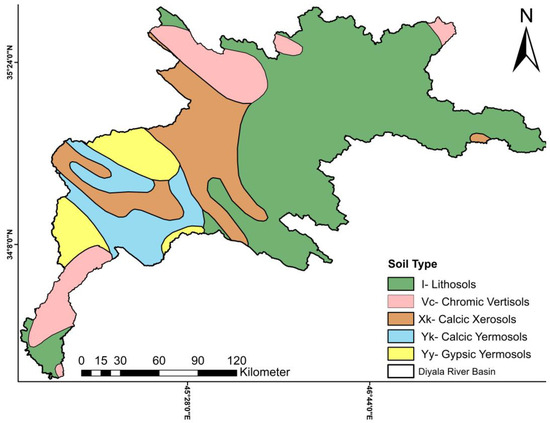
Figure 9.
The soil map of the Diyala River Basin.
3.8. Groundwater Potential Zones
The study basin has been classified into three areas: (a) moderate, (b) good and (c) very good GWPz with areas of 1330.9 km2 (4.06%), 9433.42 km2 (28.81%) and 21,987.68 km2 (67.13%), respectively (Table 6 and Figure 10). The area under moderate GWP is located mainly in the south-western parts around Balad, Baquba and Baghdad characterized by a vast region of very sparsely vegetated low dissected hills and carbonate sedimentary rock formations, poorly cultivated area and low rainfall. Good GWPz were observed in the central region and small parts of the south-eastern areas due to the distribution of low slope, high drainage density, pyroclastic and unconsolidated sediments, high lineament density and natural and agricultural land use. Very good GWPz existed mainly in low and elevated areas in the southern and eastern parts of the study region where lower slopes and unconsolidated sediments and carbonate sedimentary rocks are the main lithology.
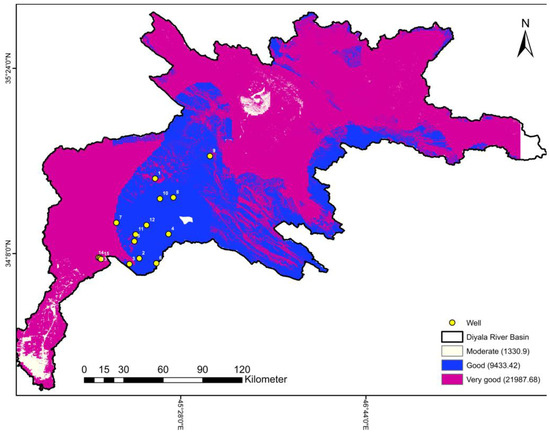
Figure 10.
The groundwater potential zones map of the Diyala River Basin.
3.9. Groundwater Potential Zones Validation
Validating the GWPz output data is one of the most vital steps to determine the accuracy of the potential results. The GWPz maps are validated in lots of different ways such as the receiver operating characteristics approach, data from groundwater wells, data on groundwater availability and data on groundwater level fluctuations. This study aims to validate the GWPz map created in the Diyala Basin using data from groundwater wells. The applicable dataset for GWPz map validation is the well yield of a region.
The Department of Water Resources in the province of Diyala provided the experimental data, as Table 7 [58] illustrates. Coordinates and discharge values for the wells are among the information. After identifying the GWPz, a validation between GWPz classes and well yield ranges were considered based on a classification given by Patle et al. [59] and the corresponding results are shown in Table 7. The results revealed that numbers and percentages of points (with concerning yield ranges) are correctly classified in all the zones of groundwater potential over the entire area.

Table 7.
Well data and validation between groundwater potential zones classes and well yield ranges [58].
3.10. Groundwater Potential Zone Sensitivity Analysis
It is important to conduct a sensitivity analysis to understand the impact of each factor on the groundwater potential map [20]. The results of the sensitivity analysis, which involves the computation of variation index values after the removal of one thematic layer at a time, shows that the thematic layers with the highest variation index values after removal were the lithological layer (mean variation index = 16.87%) and soil (14.77%). The results indicate that lithology and soil are the most influential factors. However, rainfall (14.24%) and slope (13.98%) showed moderate sensitivity, while LULC (12.87%) and drainage density (12.70%) were the least sensitive parameters. In summary, lithology and soil had the greatest influence, while LULC and drainage density had the least impact on the groundwater potential within the study basin.
4. Discussion
Many factors influence the evaluation of groundwater replenishment potential. In the current study, RS, GIS and AHP were used to explore these elements and delineate favourable recharge areas. The findings indicate that the rainfall, drainage density, slope, relief, LULC, soil and geology have a substantial impact on groundwater levels in the region. Certain specific locations within the research area have been identified as having the potential for groundwater replenishment, particularly those neighbouring fault lines with low drainage density in the northern and western regions, characterized by secondary formations and alluvial rock. Conversely, central areas with minimal fault line inclination were discovered to have limited replenishment potential. The discrepancies in groundwater potential are attributed to various geological factors [9].
Lineaments, as a structural weakness, could play an essential role in GWP recharge zones by increasing the infiltration capacity of the soil and facilitating groundwater flow and movement [9]. The occurrence of lithological units with high permeability, such as alluvial sediments, could increase groundwater storage and discharge [52], which directly impact on water infiltration and percolation [23,53]. The dominant slope gradient may also have an impact on the infiltration capacity. Steep slopes allow for low groundwater recharge, because of rapid surface runoff and low infiltration capacity, whereas gentle slopes allow for sufficient time for infiltration [15]. Drainage density is another key factor in identifying recharge sites, because it has an important effect on surface flow. The existence of a dense drainage system indicates high water permeability zones in the basin [54].
The influence of these factors on managing the groundwater system affects the possibility of replenishing different aquifers. Areas with good to moderate groundwater potential are affected by the type of rock, the slope of the terrain and the density of water pathways. This categorization can help to pinpoint promising sites for groundwater exploration by considering various hydrogeological characteristics that can affect groundwater availability. The outcomes of this study align with the results of comparable research on recharge potential in different regions across the globe [58].
The creation of the recharge potential map using the AHP method may not completely reflect the actual conditions on the ground due to the lack of recent drilling data to verify the results. It was evident that the drilling program was not well-optimized and lacked initial investigation into groundwater availability. This was noticeable when comparing the well locations across the study area. The placement of boreholes is commonly influenced by local topography and, at times, local fractures, as well as social factors such as the location of the house to be supplied or property boundaries. Therefore, it is crucial to improve the validation of the groundwater potential map by integrating recent drilling data to gain a more accurate understanding of the actual conditions on the ground. Moreover, even identifying a zone with good recharge potential does not guarantee a 100% success rate in drilling, despite promising site conditions and available water yield data. A comprehensive investigation is necessary to address the limitations resulting from theoretical interpolations of surface data.
Due to limited data, this study has limitations. It is impossible to validate the favourability maps without appropriate ground truth surveys. Therefore, they contain errors. An essential challenge in this analysis is that the lineaments are extracted automatically without being compared to photointerpretation. The methodology used for lineament extraction is known to overestimate lineament density, as it does not differentiate between natural and artificial features [20]. In this instance, manual extraction was not feasible due to its time-consuming nature and the need for multiple independent experts to complete the task [20]. Another limitation was the subjectivity of the accumulation value used to extract drainage density. The delineated channels may not accurately represent water channels in DRB.
The presence of vegetation, trees and unpaved roads in urban areas of DRB poses challenges in accurately differentiating these areas from agricultural land using the LU classification method outlined. Moreover, there is uncertainty regarding the hydrological importance of the identified features; some may have a notable impact on GW due to specific faults, while others may not interact considerably. The subjective nature of the weights assigned to different features implies they are open to modification based on expert input. The study’s limitations present opportunities for future research; enhanced data collection and advancements in RS techniques will improve accuracy. Furthermore, the potential inclusion of nighttime land surface temperatures as a hydrological factor holds promise for reducing uncertainties. Integrating well and geophysical data will considerably decrease uncertainty.
Given these limitations, some may consider the analytical hierarchy process to be impractical, because it improperly considers the intrinsic qualities of the aquifer and relies too much on surface-level variables for mapping such as topography, exposed lithology and LULC. It would be advantageous to take into account variables such as aquifer classification (unconfined, confined or semi-confined), hydraulic properties, saturated thickness, groundwater levels and groundwater quality. However, ideal conditions often do not apply for many case studies in developing countries.
5. Conclusions
According to the results, GWPz in DRB has been classified into three main zones: moderate, good and very good. Approximately 4.06% of the basin area are located in modest GWPz, while good and excellent GWPz occurs in 28.81 and 67.13% of the area, respectively. Good GWPz is intense in the upper and lower parts of the catchment, caused by the very high rainfall and flat slope, respectively. Excellent GWPz is found in the middle part of the catchment and is caused by high rainfall linked to moderate drainage density and relief.
The findings showed that RS, GIS and AHP are practical tools for defining the transboundary DRB’s GWP regions. Compared with the old procedures, the research results delivered a solid calculation for groundwater resources in DRB using a much more price- and time-effective technique. Seven thematic layers (rainwater, drainage density, slope, relief, LULC, soil and geology) have been prepared using remote sensing and the ArcGIS environment. Loads from many thematic layers have been evaluated depending on Saaty’s multi-criteria method.
Incorporating remote sensing data and understanding precise GWP estimation would contribute to the possibility of more effective research work on groundwater within similar climatic conditions. The applied methodology is particularly suitable for developing countries where complete hydrological data are often scarce. The proposed methodology would also help water resources managers and policymakers to develop plans for routine groundwater resource exploration, which would enhance the ability of neighbouring aquifers to recharge and discharge water, allowing groundwater management to be sustainable in such climate conditions. When studying GWP, it is essential to consider groundwater quality as a critical factor. Even if groundwater storage is ample, poor-quality information may make groundwater potential mapping analysis ineffective. Additionally, it is crucial to estimate groundwater recharge using the latest techniques for sustainable water management and future water supply schemes.
The final GWPz map, obtained by the merger of thematic layers, was verified by cross-referencing well locations and total yield values within the study region. The validation results indicated that the AHP approach is very effective for generating GWP maps in the area. However, the findings from GWPz provide a promising opportunity to address the challenge of inadequate groundwater supplies in regions with a small proportion of suitable lands by using artificial recharge for the purpose of groundwater management and planning. Furthermore, an assessment was carried out to determine the significance of different factors by analysing their impact on the sensitivity of map removal. The results show that lithology, soil, rainfall and slope have the greatest influence, while drainage density, LULC and drainage density have the least effect.
The findings assist decision-makers, water resource management authorities and other stakeholders in effectively utilizing and monitoring the potential groundwater recharge area in the basin to ensure long-term sustainability. Moreover, it provides improved planning and management of water resources to enhance the irrigation sector. The study findings can be utilized for land management, planning and aquifer resource utilization.
Additionally, to enhance the understanding of the groundwater recharge capacity in the target area, it would be beneficial for future research to expand the range of metrics used and incorporate economic and social data. In addition, conducting a more comprehensive evaluation of the bore wells would be valuable. Furthermore, it is important to recognize that this study only considers the geographical variations that may impact on the identification of potential groundwater recharge areas. It is advisable to consider temporal variations for future investigations. Subsequent investigations will examine the effects of spatiotemporal changes on the study area’s potential to produce groundwater resources.
6. Recommendations
The conclusions drawn from this study underscore the need for further comprehensive fieldwork and pertinent research to accurately delineate the groundwater potential at a large scale within small districts and villages. Consequently, the current methodology can serve as a benchmark for future exploration in similar intricate terrains globally, while considering the area’s climate and hydrogeology. The findings have practical implications for the sustainable management of groundwater resources in the region, especially concerning artificial recharge. Policymakers addressing this issue can formulate an effective strategy for the optimal utilization of groundwater in the area, ensuring its long-term sustainability.
The areas observed can contribute to key strategies for selecting new well sites to improve efficient water resource management within the basin. This finding could be beneficial for implementing a groundwater harvesting plan. It is worth noting the constraints and opportunities of the study as well as the novelty of the work. In this research, seven thematic layers were utilized, but incorporating additional data, such as hydro-geological and geomorphology maps (geomorphology and water level), could have yielded more precise outcomes. Sustainable planning primarily focuses on groundwater utilization, water management, controlled extraction, advanced water infrastructure, water conservation awareness, alternative agricultural techniques as well as residential and industrial water preservation. Preparing non-contaminated groundwater could be advantageous for long-term water enhancement.
One of the study’s limitations encompasses the absence of high-resolution satellite images, which could impact on the accuracy of the results. It would be beneficial for more comprehensive research to utilize, for example, Landsat images to attain a finer spatial resolution. Further work should consider also a multi-model approach for additional elucidation. It is advisable to also investigate GWPz using alternative satellites, such as the Google Earth Engine platform and Sentinel. Finally, the method could be utilized to analyse the impact of climate change on GWPz under similar climatic conditions in the future.
Author Contributions
Conceptualization, R.M.; methodology, R.M.; software, R.M.; validation, R.M.; formal analysis, R.M.; investigation, R.M.; resources, R.M.; data curation, R.M.; writing—original draft preparation, R.M.; writing—review and editing, M.S.; visualization, R.M.; project administration, M.S.; funding acquisition, M.S. All authors have read and agreed to the published version of the manuscript.
Funding
This research received no external funding.
Data Availability Statement
The data presented in this study are openly available in [USGS] at [https://earthexplorer.usgs.gov/, accessed on 25 September 2023].
Acknowledgments
The authors thank their specific organizations for their support. There was no outside sponsorship for this study. The information required for the analysis was kindly provided by the Iraqi General Authority on Seismic and Meteorological Monitoring.
Conflicts of Interest
Miklas Scholz was employed by the Bau & Service Oberursel, Kunststoff-Technik Adams and Nexus by Sweden, which did not influence the content of this article. The authors declare that the research was conducted in the absence of any commercial or financial relationships that could be construed as a potential conflict of interest.
References
- Mohammed, R.; Scholz, M. Quality control and homogeneity analysis of precipitation time series in the climatic region of Iraq. Atmosphere 2023, 14, 197. [Google Scholar] [CrossRef]
- Mohammed, D.R.; Mohammed, R.K. Climate Change’s Impacts on Drought in Upper Zab Basin, Iraq: A Case Study. Tikrit J. Eng. Sci. 2023, 31, 161–171. [Google Scholar] [CrossRef]
- Mohammed, R.; Scholz, M. Climate Change Scenarios for Impact Assessment: Lower Zab River Basin (Iraq and Iran). Atmosphere 2024, 15, 673. [Google Scholar] [CrossRef]
- Allan Freeze, R.; Cherry, J.A. Groundwater; Prentice-Hall: Hoboken, NJ, USA, 1979. [Google Scholar]
- Schiavo, M. Entropy, fractality, and thermodynamics of groundwater pathways. J. Hydrol. 2023, 617, 128930. [Google Scholar] [CrossRef]
- Zehe, E.; Loritz, R.; Jackisch, C.; Westhoff, M.; Kleidon, A.; Blume, T.; Hassler, S.K.; Savenije, H.H. Energy states of soil water–a thermodynamic perspective on soil water dynamics and storage-controlled streamflow generation in different landscapes. Hydrol. Earth Syst. Sci. 2019, 23, 971–987. [Google Scholar] [CrossRef]
- Mohammed, R.; Scholz, M. Flow–duration curve integration into digital filtering algorithms for simulating climate variability based on river baseflow. Hydrol. Sci. J. 2018, 63, 1558–1573. [Google Scholar] [CrossRef]
- Al-Jawad, J.Y.; Al-Jawad, S.B.; Kalin, R.M. Decision-making challenges of sustainable groundwater strategy under multi-event pressure in arid environments: The Diyala River Basin in Iraq. Water 2019, 11, 2160. [Google Scholar] [CrossRef]
- Ahmed, A.; Alrajhi, A.; Alquwaizany, A.S. Identification of Groundwater Potential Recharge Zones in Flinders Ranges, South Australia Using Remote Sensing, GIS, and MIF Techniques. Water 2021, 13, 2571. [Google Scholar] [CrossRef]
- Michel, D. Iran’s impending water crisis. In Water, Security and US Foreign Policy; Routledge: London, UK, 2017; pp. 168–188. [Google Scholar]
- Alkhafaji, H. Iraq’s Water Crisis: Challenges and Solutions. Al-Bayan Centre for Planning and Studies. 2018. Available online: https://www.bayancenter.org/en/wp-content/uploads/2018/01/980987665.pdf (accessed on 1 September 2023).
- Al-Khafaji, M.S.; Al-Chalabi, R.D. Assessment and mitigation of streamflow and sediment yield under climate change conditions in Diyala River Basin, Iraq. Hydrology 2019, 6, 63. [Google Scholar] [CrossRef]
- Khayyun, T.S.; Alwan, I.A.; Hayder, A.M. Hydrological model for Hemren dam reservoir catchment area at the middle River Diyala reach in Iraq using ArcSWAT model. Appl. Water Sci. 2019, 9, 133. [Google Scholar] [CrossRef]
- Younus, M.H.; Mohammed, R. Geo-informatics techniques for detecting changes in land use and land cover in response to regional weather variation. Theor. Appl. Climatol. 2023, 154, 89–106. [Google Scholar] [CrossRef]
- Younus, M.H.; Mohammed, R. Spectral drought indices: A methodology for detecting basin-wide drought. Ecohydrol. Hydrobol. 2024, 24, 178–187. [Google Scholar] [CrossRef]
- Mahdi, Z.A.; Mohammed, R. Land use/land cover changing aspect implications: Lesser Zab River Basin, northeastern Iraq. Environ. Monit. Assess. 2023, 194, 652. [Google Scholar] [CrossRef] [PubMed]
- Jalut, Q.H.; Abbas, N.L.; Mohammad, A.T. Management of groundwater resources in the Al-Mansourieh zone in the Diyala River Basin in Eastern Iraq. Groundw. Sustain. Dev. 2018, 6, 79–86. [Google Scholar] [CrossRef]
- Al-Sudani, H.I.; Ramadhan, A.A.; Saeed, B.M.A.M. Groundwater System of Khanaqin Basin in Diyala Governorate–East of Iraq. Tikrit J. Pure Sci. 2018, 23, 111–121. [Google Scholar] [CrossRef]
- Al-Mashhadani, R.B.; Al-Kubaisi, Q.Y. Calculating Groundwater Recharge Using Water Balance in Mandaly City, Diyala Governorate, Eastern Iraq. Iraqi J. Sci. 2023, 64, 1820–1828. [Google Scholar] [CrossRef]
- Sangawi, A.; Al-Manmi, D.A.M.; Aziz, B.Q. Integrated GIS, Remote Sensing, and Electrical Resistivity Tomography Methods for the Delineation of Groundwater Potential Zones in Sangaw Sub-Basin, Sulaymaniyah, KRG-Iraq. Water 2023, 15, 1055. [Google Scholar] [CrossRef]
- Alparuany, K.B.N.; Ajeena, A.R.; Yassian, A.K.Q.; Falih, A.H.; Abd AlSalam, A.; Abass, A.; Abt, A.; Hameed, E. Application of stable isotopes to evaluate the interaction between surface water and groundwater in Northeast of Diyala, Iraq. Iraqi Geol. J. (IGJ) 2020, 53, 108–121. Available online: https://igj-iraq.org/igj/index.php/igj/article/view/257 (accessed on 25 September 2023). [CrossRef]
- Huseen, M.R.; Abed, B.S. Groundwater simulation and wells distribution at Qazaniyah city in Diyala governorate. J. Eng. 2020, 26, 95–113. [Google Scholar] [CrossRef]
- Jalut, Q.H. Groundwater Modeling of Ahmed Taher and Bakhtiari areas southwest of Khanaqin Basin in Diyala Governorate–Iraq. In IOP Conference Series: Materials Science and Engineering; IOP Publishing: Bristol, UK, 2021; Volume 1076, p. 012093. [Google Scholar] [CrossRef]
- Roy, S.; Hazra, S.; Chanda, A.; Das, S. Assessment of groundwater potential zones using multi-criteria decision-making technique: A micro-level case study from red and lateritic zone (RLZ) of West Bengal, India. Sustain. Water Resour. Manag. 2020, 6, 1–14. [Google Scholar] [CrossRef]
- Gururani, D.M.; Singh, S.; Joshi, H.; Kumar, Y.; Kumar, A.; Bohra, M.S.; Mehta, P. Assessment of groundwater prospects zones using RS, GIS, and MIF methods. In Surface and Groundwater Resources Development and Management in Semi-Arid Region: Strategies and Solutions for Sustainable Water Management; Springer International Publishing: Cham, Switzerland, 2023; pp. 317–335. [Google Scholar]
- Shaban, A.; Farhat, N.; El-Hage, M.; Fadel, B.; Sheib, A.; Bitar, A.; Darwish, D. Litho SFR Model for Mapping Groundwater Potential Zones Using Remote Sensing and GIS. Water 2024, 16, 1951. [Google Scholar] [CrossRef]
- Aykut, T. Determination of groundwater potential zones using Geographical Information Systems (GIS) and Analytic Hierarchy Process (AHP) between Edirne-Kalkansogut (northwestern Turkey). Groundw. Sustain. Dev. 2021, 12, 100545. [Google Scholar] [CrossRef]
- Ifediegwu, S.I. Assessment of groundwater potential zones using GIS and AHP techniques: A case study of the Lafia district, Nasarawa State, Nigeria. Appl. Water Sci. 2022, 12, 1–17. [Google Scholar] [CrossRef]
- Rajesh, J.; Pande, C.B.; Kadam, S.A.; Gorantiwar, S.D.; Shinde, M.G. Exploration of groundwater potential zones using analytical hierarchical process (AHP) approach in the Godavari river basin of Maharashtra in India. Appl. Water Sci. 2021, 11, 182. [Google Scholar] [CrossRef]
- Saranya, T.; Saravanan, S. Groundwater potential zone mapping using analytical hierarchy process (AHP) and GIS for Kancheepuram District, Tamilnadu, India. Model. Earth Syst. Environ. 2020, 6, 1105–1122. [Google Scholar] [CrossRef]
- Verma, N.; Patel, R.K. Delineation of groundwater potential zones in lower Rihand River Basin, India using geospatial techniques and AHP. Egypt J. Remote Sens. Space Sci. 2021, 24, 559–570. [Google Scholar] [CrossRef]
- Lentswe, G.B.; Molwalefhe, L. Delineation of potential groundwater recharge zones using analytic hierarchy process-guided GIS in the semi-arid Motloutse watershed, eastern Botswana. J. Hydrol. Reg. Stud. 2020, 28, 100674. [Google Scholar] [CrossRef]
- Ozdemir, A. GIS-Based Groundwater Spring Potential Mapping in the Sultan Mountains (Konya, Turkey) Using Frequency Ratio, Weights of Evidence and Logistic Regression Methods and Their Comparison. J. Hydrol. 2011, 411, 290–308. [Google Scholar] [CrossRef]
- Madani, A.; Niyazi, B. Groundwater Potential Mapping Using Remote Sensing Techniques and Weights of Evidence GIS Model: A Case Study from Wadi Yalamlam Basin, Makkah Province, Western Saudi Arabia. Environ. Earth Sci. 2015, 74, 5129–5142. [Google Scholar] [CrossRef]
- Park, S.; Hamm, S.-Y.; Jeon, H.-T.; Kim, J. Evaluation of Logistic Regression and Multivariate Adaptive Regression Spline Models for Groundwater Potential Mapping Using R and GIS. Sustainability 2017, 9, 1157. [Google Scholar] [CrossRef]
- Miraki, S.; Zanganeh, S.H.; Chapi, K.; Singh, V.P.; Shirzadi, A.; Shahabi, H.; Pham, B.T. Mapping Groundwater Potential Using a Novel Hybrid Intelligence Approach. Water Resour. Manag. 2019, 33, 281–302. [Google Scholar] [CrossRef]
- Lee, S.; Hong, S.-M.; Jung, H.-S. GIS-Based Groundwater Potential Mapping Using Artificial Neural Network and Support Vector Machine Models: The Case of Boryeong City in Korea. Geocarto Int. 2018, 33, 847–861. [Google Scholar] [CrossRef]
- Naghibi, S.A.; Pourghasemi, H.R. A Comparative Assessment between Three Machine Learning Models and Their Performance Comparison by Bivariate and Multivariate Statistical Methods in Groundwater Potential Mapping. Water Resour. Manag. 2015, 29, 5217–5236. [Google Scholar] [CrossRef]
- Naghibi, S.A.; Pourghasemi, H.R.; Dixon, B. GIS-Based Groundwater Potential Mapping Using Boosted Regression Tree, Classification and Regression Tree, and Random Forest Machine Learning Models in Iran. Environ. Monit. Assess. 2016, 188, 1–27. [Google Scholar] [CrossRef] [PubMed]
- Kadam, A.K.; Umrikar, B.N.; Sankhua, R.N. Assessment of recharge potential zones for groundwater development and management using geospatial and MCDA technologies in semiarid region of Western India. SN Appl. Sci. 2020, 2, 312. [Google Scholar] [CrossRef]
- Yıldırım, Ü. Identification of Groundwater Potential Zones Using GIS and Multi-Criteria Decision-Making Techniques: A Case Study Upper Coruh River Basin (NE Turkey). ISPRS Int. J. Geoinf. 2021, 10, 396. [Google Scholar] [CrossRef]
- Saaty, T. How to make a decision: The analytic hierarchy process? Eur. J. Oper. Res. 1990, 48, 9–26. [Google Scholar] [CrossRef]
- Beshir, S.; Moges, A.; Dananto, M. Assessing Groundwater Potential Zones and Their Implications for Landslides in the Upper Wabe-Shebele River Basin of Southeastern Ethiopia. J. Eng. 2024, 1, 7044576. [Google Scholar] [CrossRef]
- Kawara, A.Q.; Elsebaie, I.H.; Alnahit, A.O. Groundwater recharge potential zone modeling in the Wadi Al-Lith Basin, Saudi Arabia. Appl. Water Sci. 2024, 14, 117. [Google Scholar] [CrossRef]
- Gachari, D.N.K.M.K.; Mary, W.; Mungai, E. Mapping groundwater potential in Kitui District, Kenya using geospatial technologies. Int. J. Water Res. Environ. Eng. 2021, 4, 15–22. [Google Scholar]
- Aju, C.D.; Achu, A.L.; Raicy, M.C.; Reghunath, R. Identification of suitable sites and structures for artificial groundwater recharge for sustainable water resources management in Vamanapuram River Basin, South India. Hydrol. Res. 2021, 4, 24–37. [Google Scholar] [CrossRef]
- Ndhlovu, G.Z.; Woyessa, Y.E. Integrated Assessment of Groundwater Potential Using Geospatial Techniques in Southern Africa: A Case Study in the Zambezi River Basin. Water 2021, 13, 2610. [Google Scholar] [CrossRef]
- Zhu, Q.; Abdelkareem, M. Mapping groundwater potential zones using a knowledge-driven approach and GIS analysis. Water 2021, 13, 579. [Google Scholar] [CrossRef]
- Al-Manmi, D.A.M.; Rauf, L.F. Groundwater potential mapping using remote sensing and GIS-based, in Halabja City, Kurdistan, Iraq. Arab. J. Geosci. 2016, 9, 357. Available online: https://link.springer.com/article/10.1007/s12517-016-2385-y (accessed on 25 September 2023). [CrossRef]
- Allafta, H.; Opp, C.; Patra, S. Identification of groundwater potential zones using remote sensing and GIS techniques: A case study of the Shatt Al-Arab Basin. Remote Sens. 2021, 13, 112. Available online: https://www.mdpi.com/2072-4292/13/1/112 (accessed on 25 September 2023). [CrossRef]
- Anbarasu, S.; Brindha, K.; Elango, L. Multi-influencing factor method for delineation of groundwater potential zones using remote sensing and GIS techniques in the western part of Perambalur district, southern India. Earth Sci. Inform. 2019, 13, 317–332. [Google Scholar] [CrossRef]
- Arya, S.; Subramani, T.; Karunanidhi, D. Delineation of groundwater potential zones and recommendation of artificial recharge structures for augmentation of groundwater resources in Vattamalaikarai Basin, South India. Environ. Earth Sci. 2021, 79, 102. [Google Scholar] [CrossRef]
- Jothibasu, A.; Anbazhagan, S. Spatial mapping of groundwater potential in Ponnaiyar River basin using probabilistic-based frequency ratio model. Model. Earth Syst. Environ. 2017, 3, 33. Available online: https://link.springer.com/article/10.1007/s40808-017-0283-2 (accessed on 25 September 2023). [CrossRef]
- GADM. Global Administrative Areas Database Boundaries without Limits. Available online: http://www.gadm.org (accessed on 10 March 2024).
- GLCF, Global and Land Cover Facility. Earth Science Data Interface. Available online: https://www.sciencebase.gov/catalog/item/4f4e4ae0e4b07f02db687f5d (accessed on 5 March 2024).
- FAO. Food and Agriculture Organization of the United Nations. Available online: https://data.apps.fao.org/map/catalog/srv/eng/catalog.search#/metadata/446ed430-8383-11db-b9b2-000d939bc5d8 (accessed on 7 October 2023).
- USGS. United States Geological Survey. Available online: https://earthexplorer.usgs.gov/ (accessed on 25 September 2023).
- Alattar, M.H. Mapping groundwater dynamics in Iraq: Integrating multi-data sources for comprehensive analysis. Model. Earth Syst. Environ. 2024, 10, 4375–4385. [Google Scholar] [CrossRef]
- Patle, D.; Awasthi, M.K.; Nema, S. Validation of Derived Groundwater Potential Zones Using Well Yield Data through Agreement Scheme Approach with Geoinformatics in Ken River Basin. Indian J. Ecol. 2024, 51, 118–125. [Google Scholar]
Disclaimer/Publisher’s Note: The statements, opinions and data contained in all publications are solely those of the individual author(s) and contributor(s) and not of MDPI and/or the editor(s). MDPI and/or the editor(s) disclaim responsibility for any injury to people or property resulting from any ideas, methods, instructions or products referred to in the content. |
© 2024 by the authors. Licensee MDPI, Basel, Switzerland. This article is an open access article distributed under the terms and conditions of the Creative Commons Attribution (CC BY) license (https://creativecommons.org/licenses/by/4.0/).