
The Impact of Decreased Atmospheric Pressure on Forced Aeration of Discharged Flow

Abstract
1. Introduction
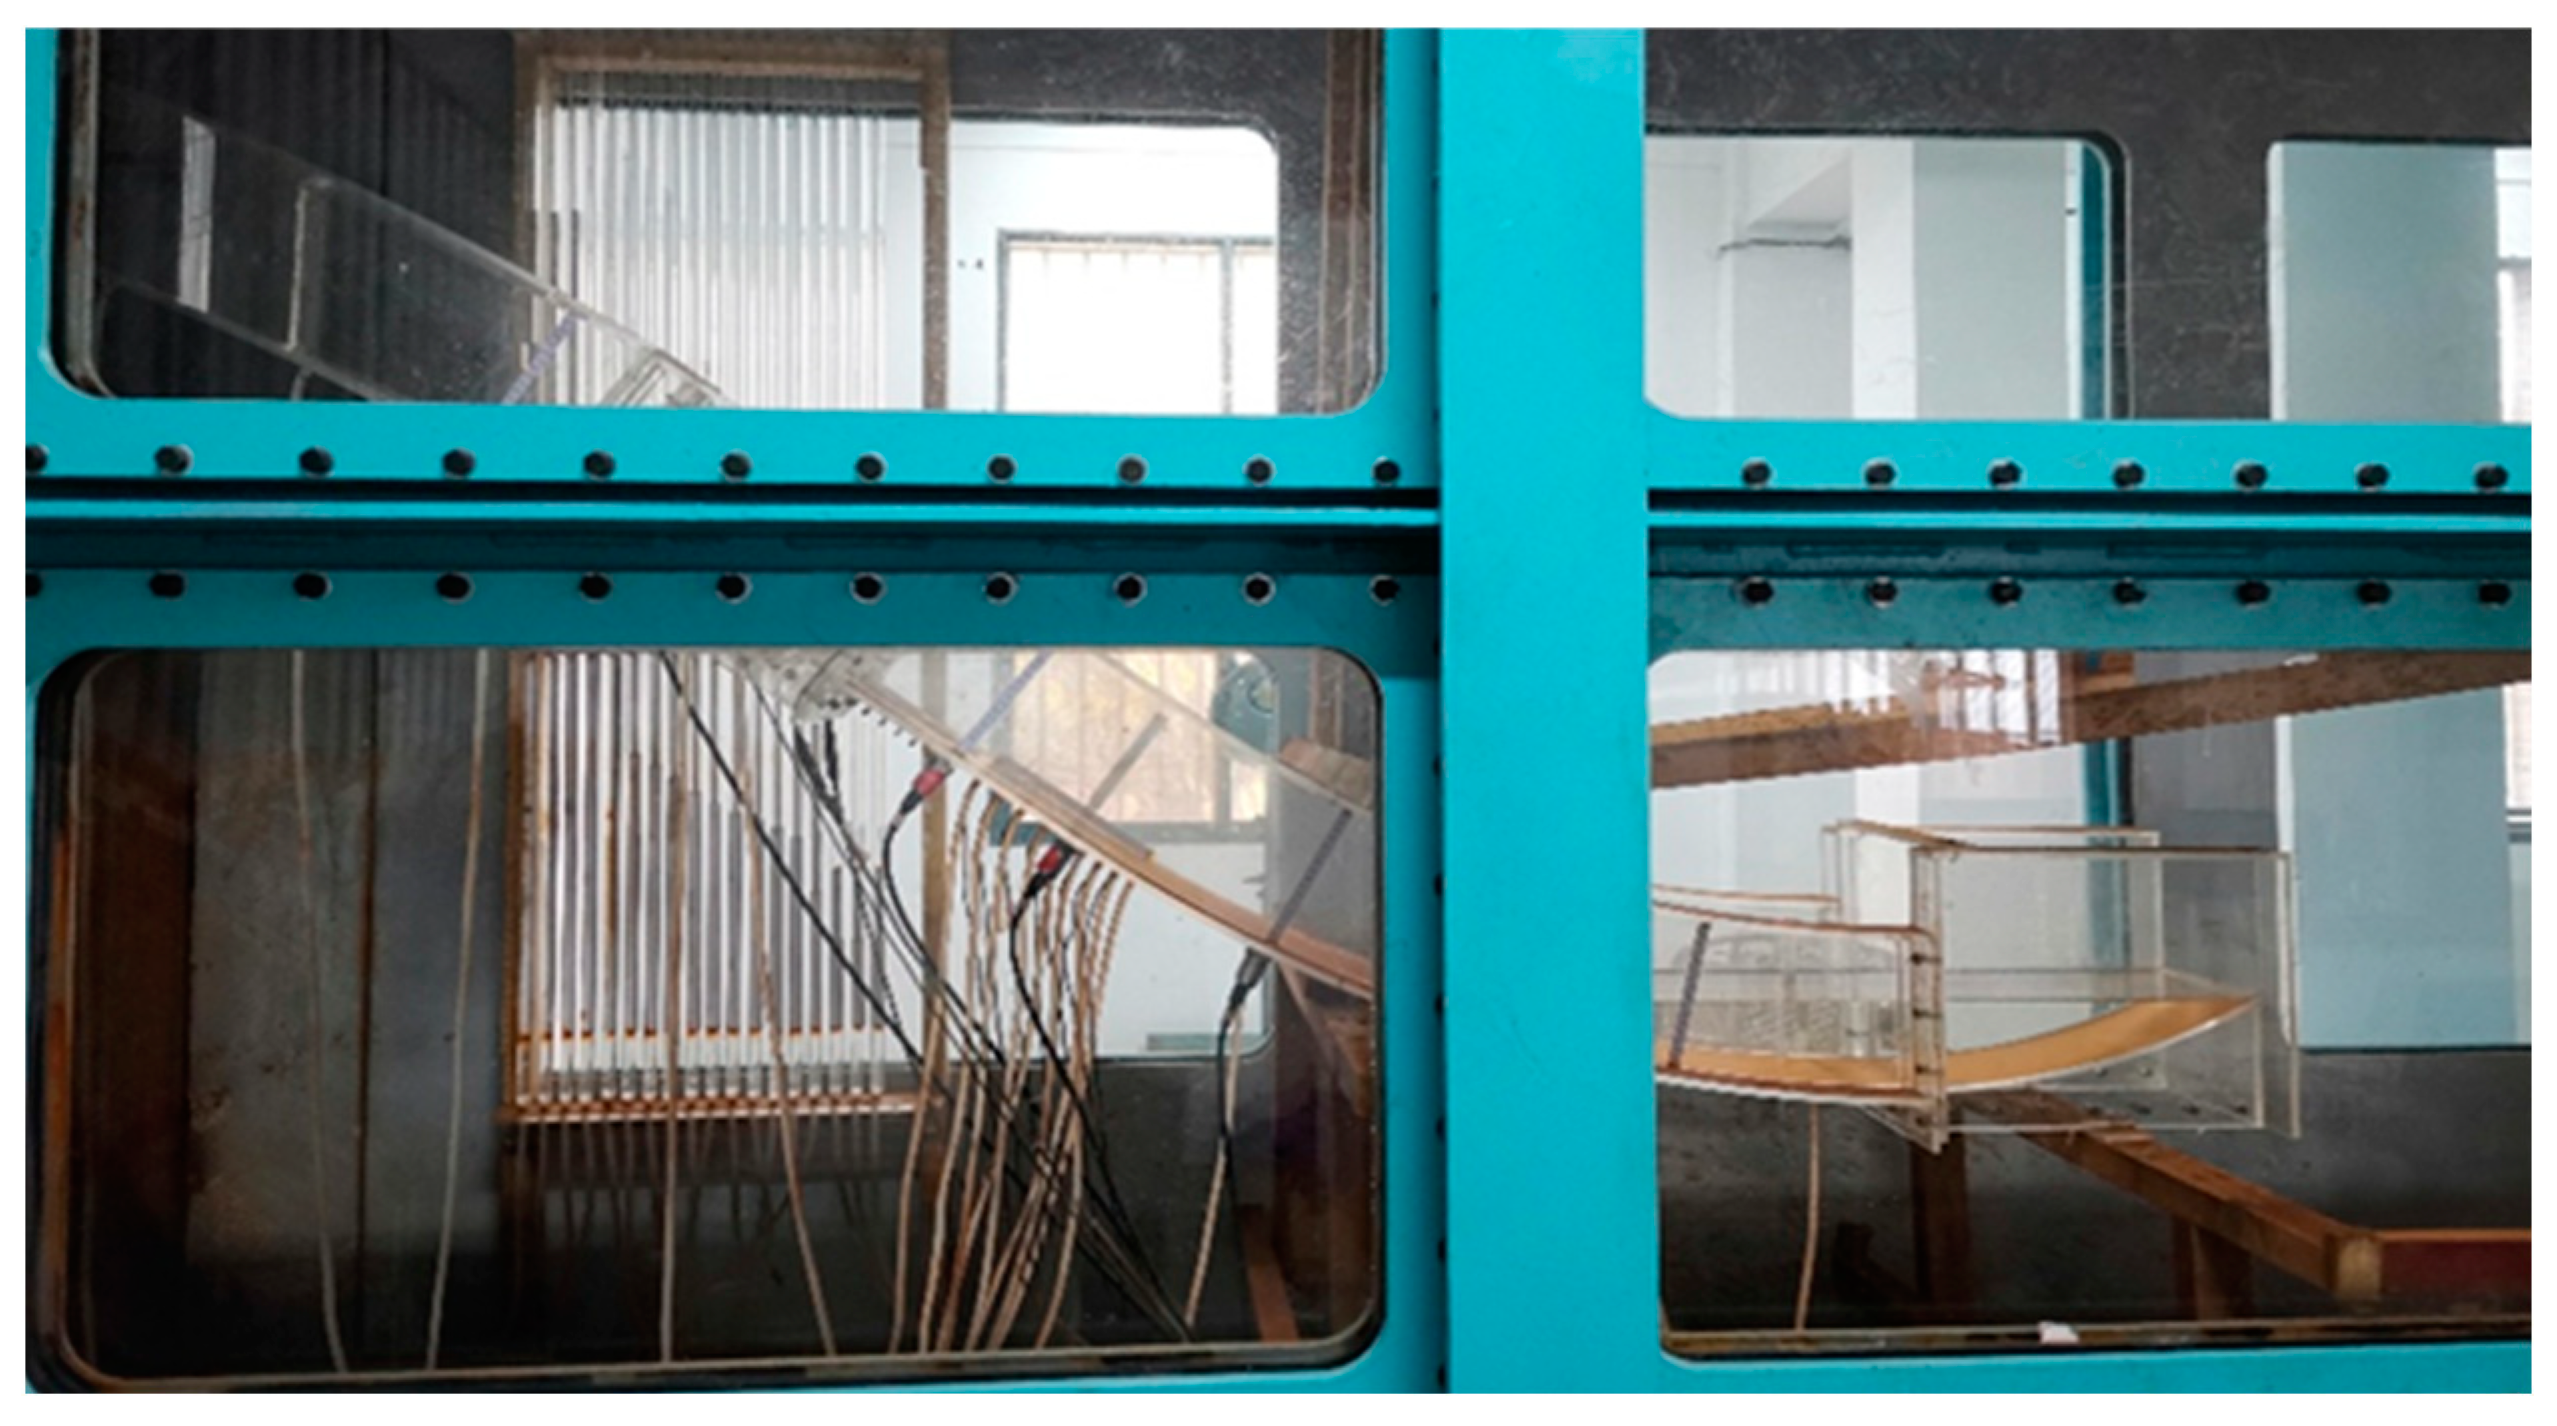
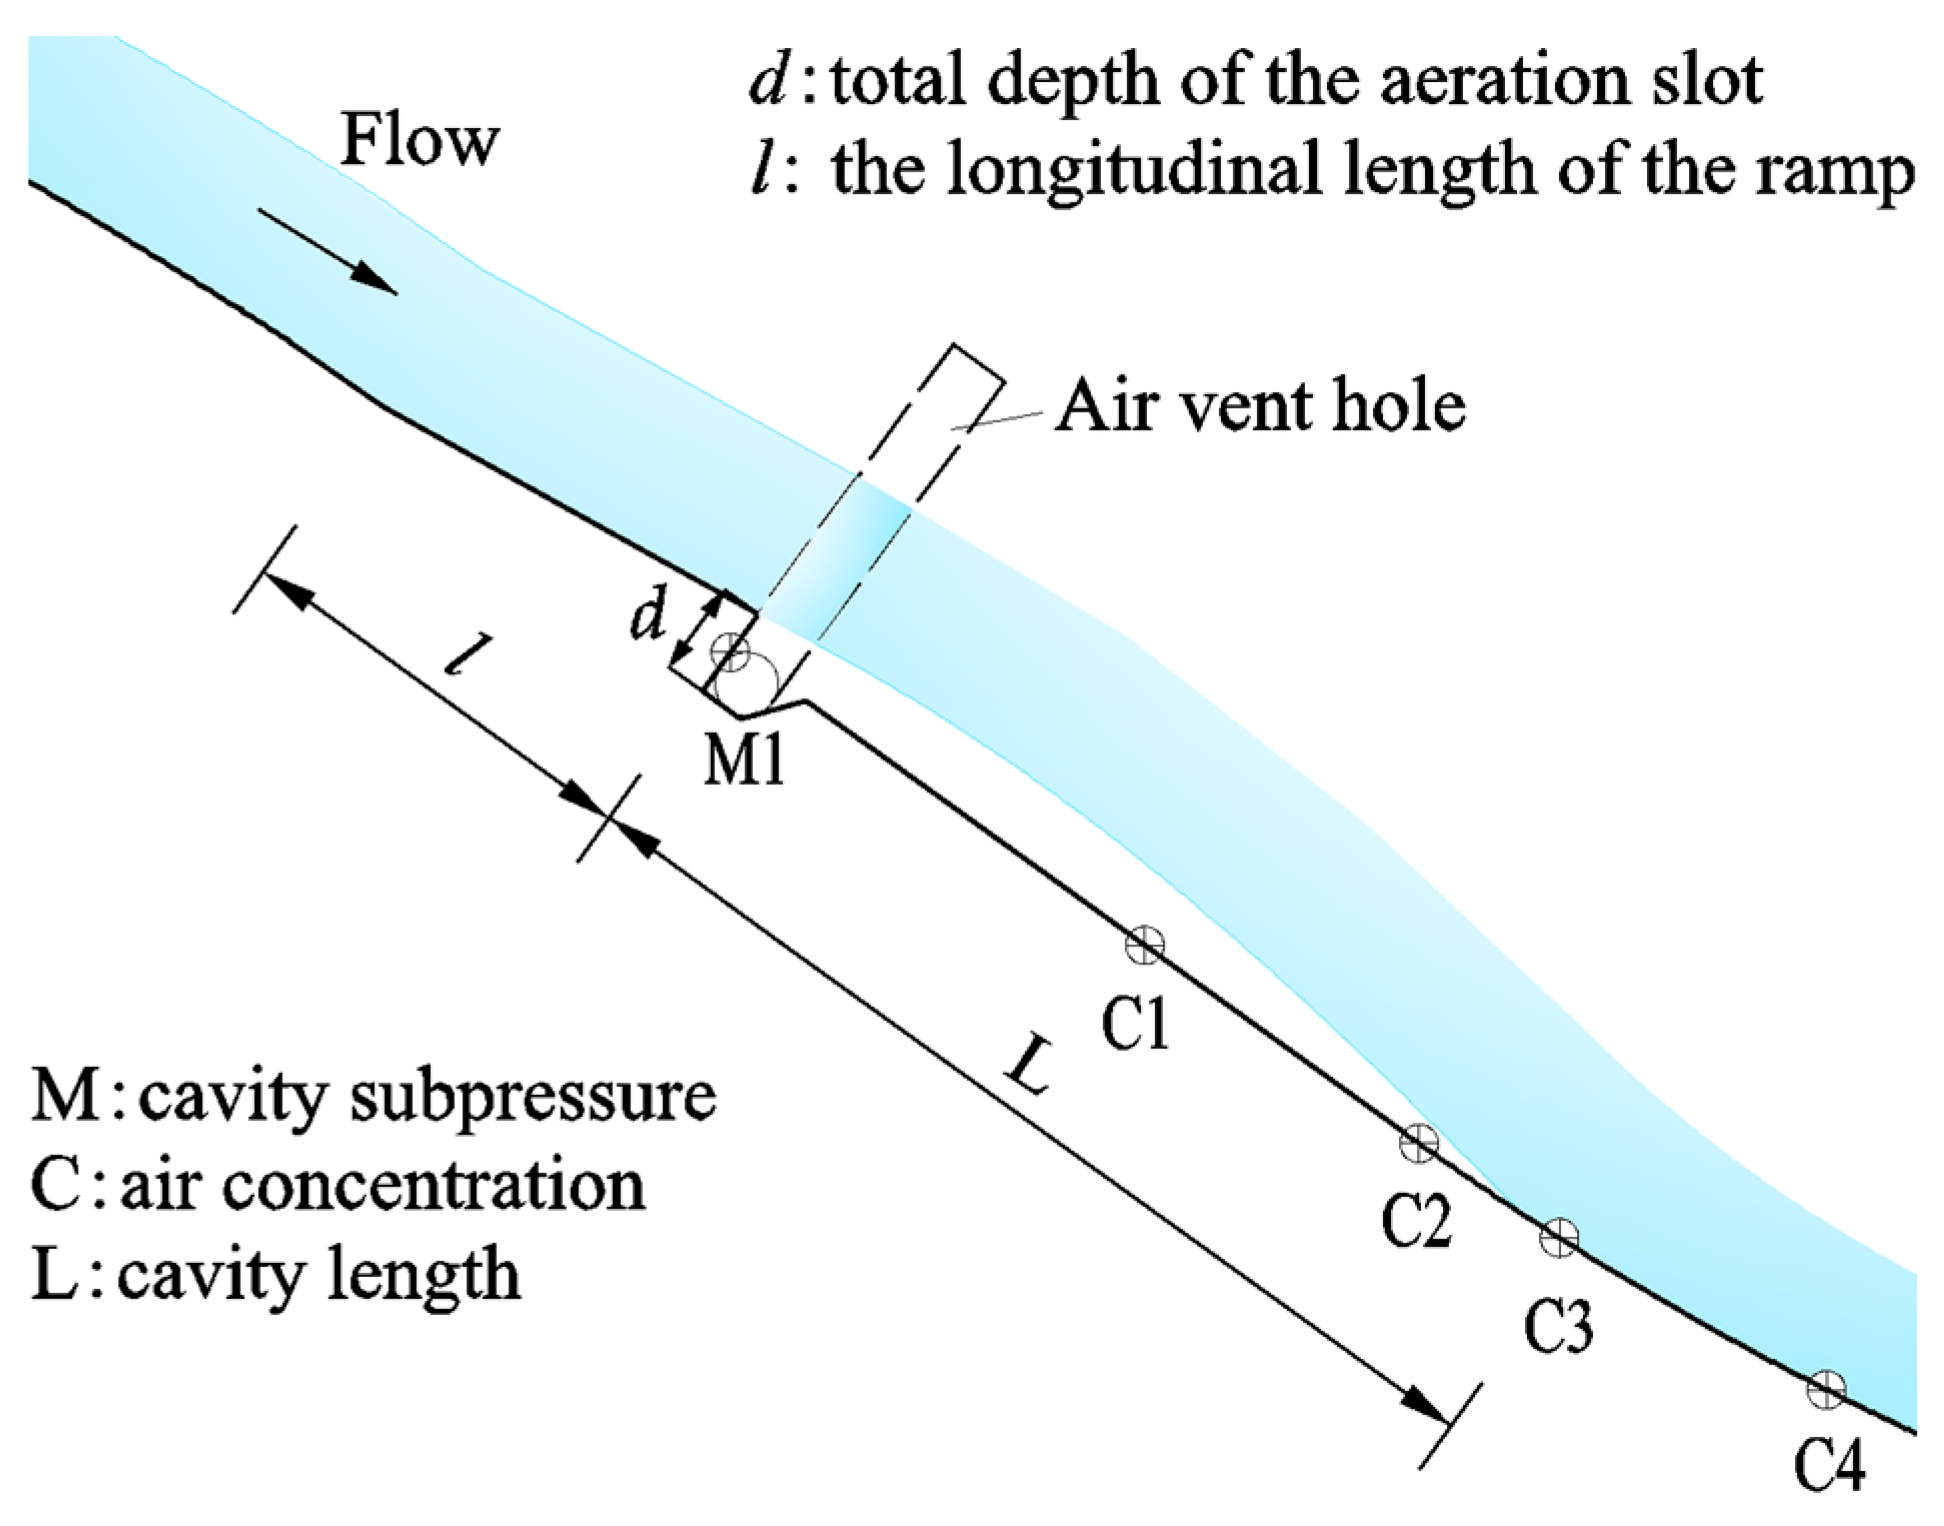
2. Research Methods
3. Forced Aeration Characteristics under Low Atmospheric Pressure
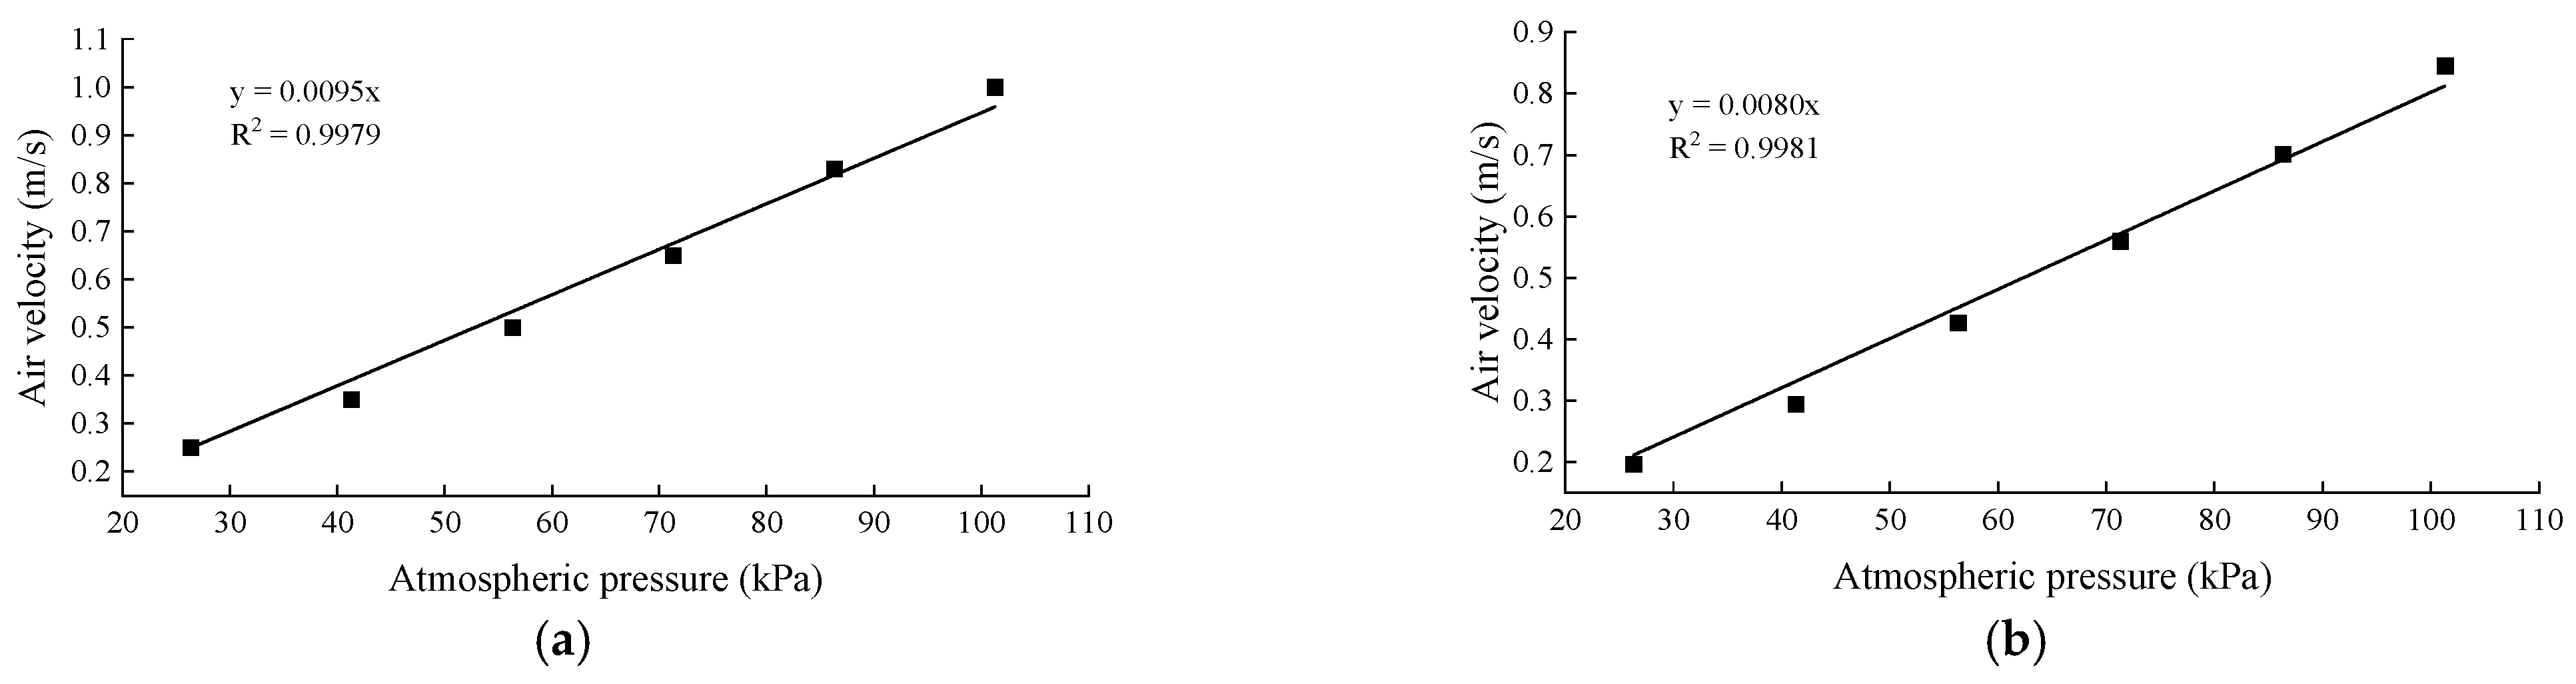
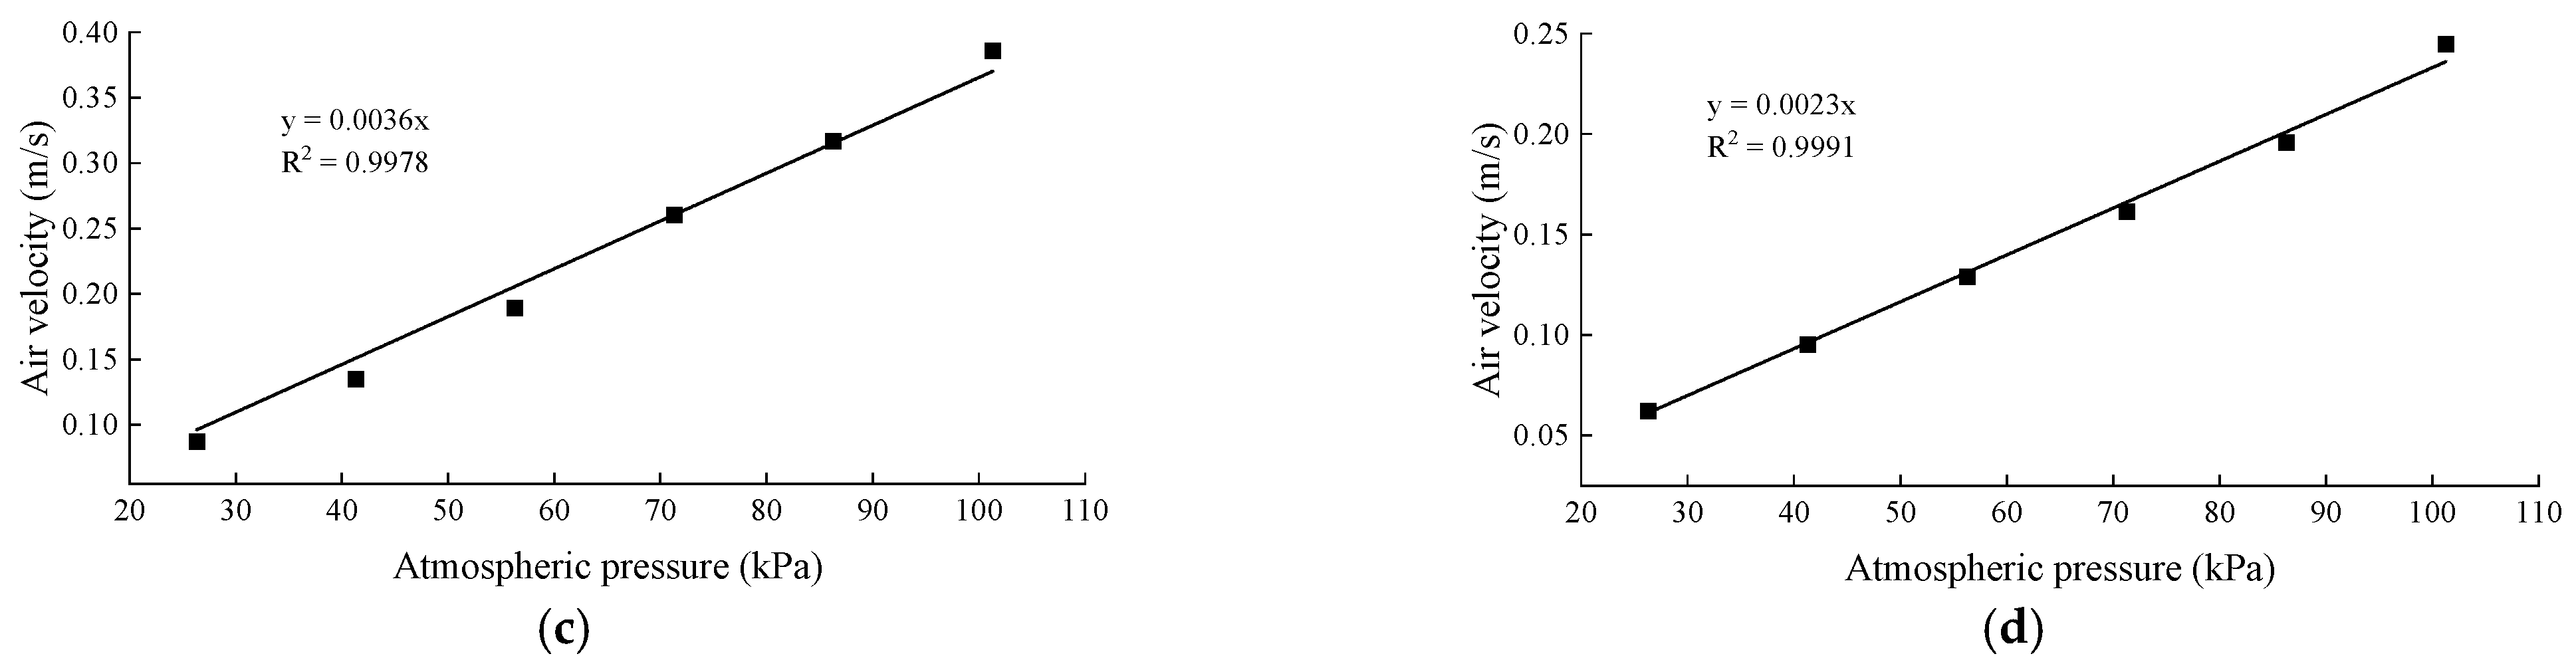
3.1. Ventilation Hole Air Velocity
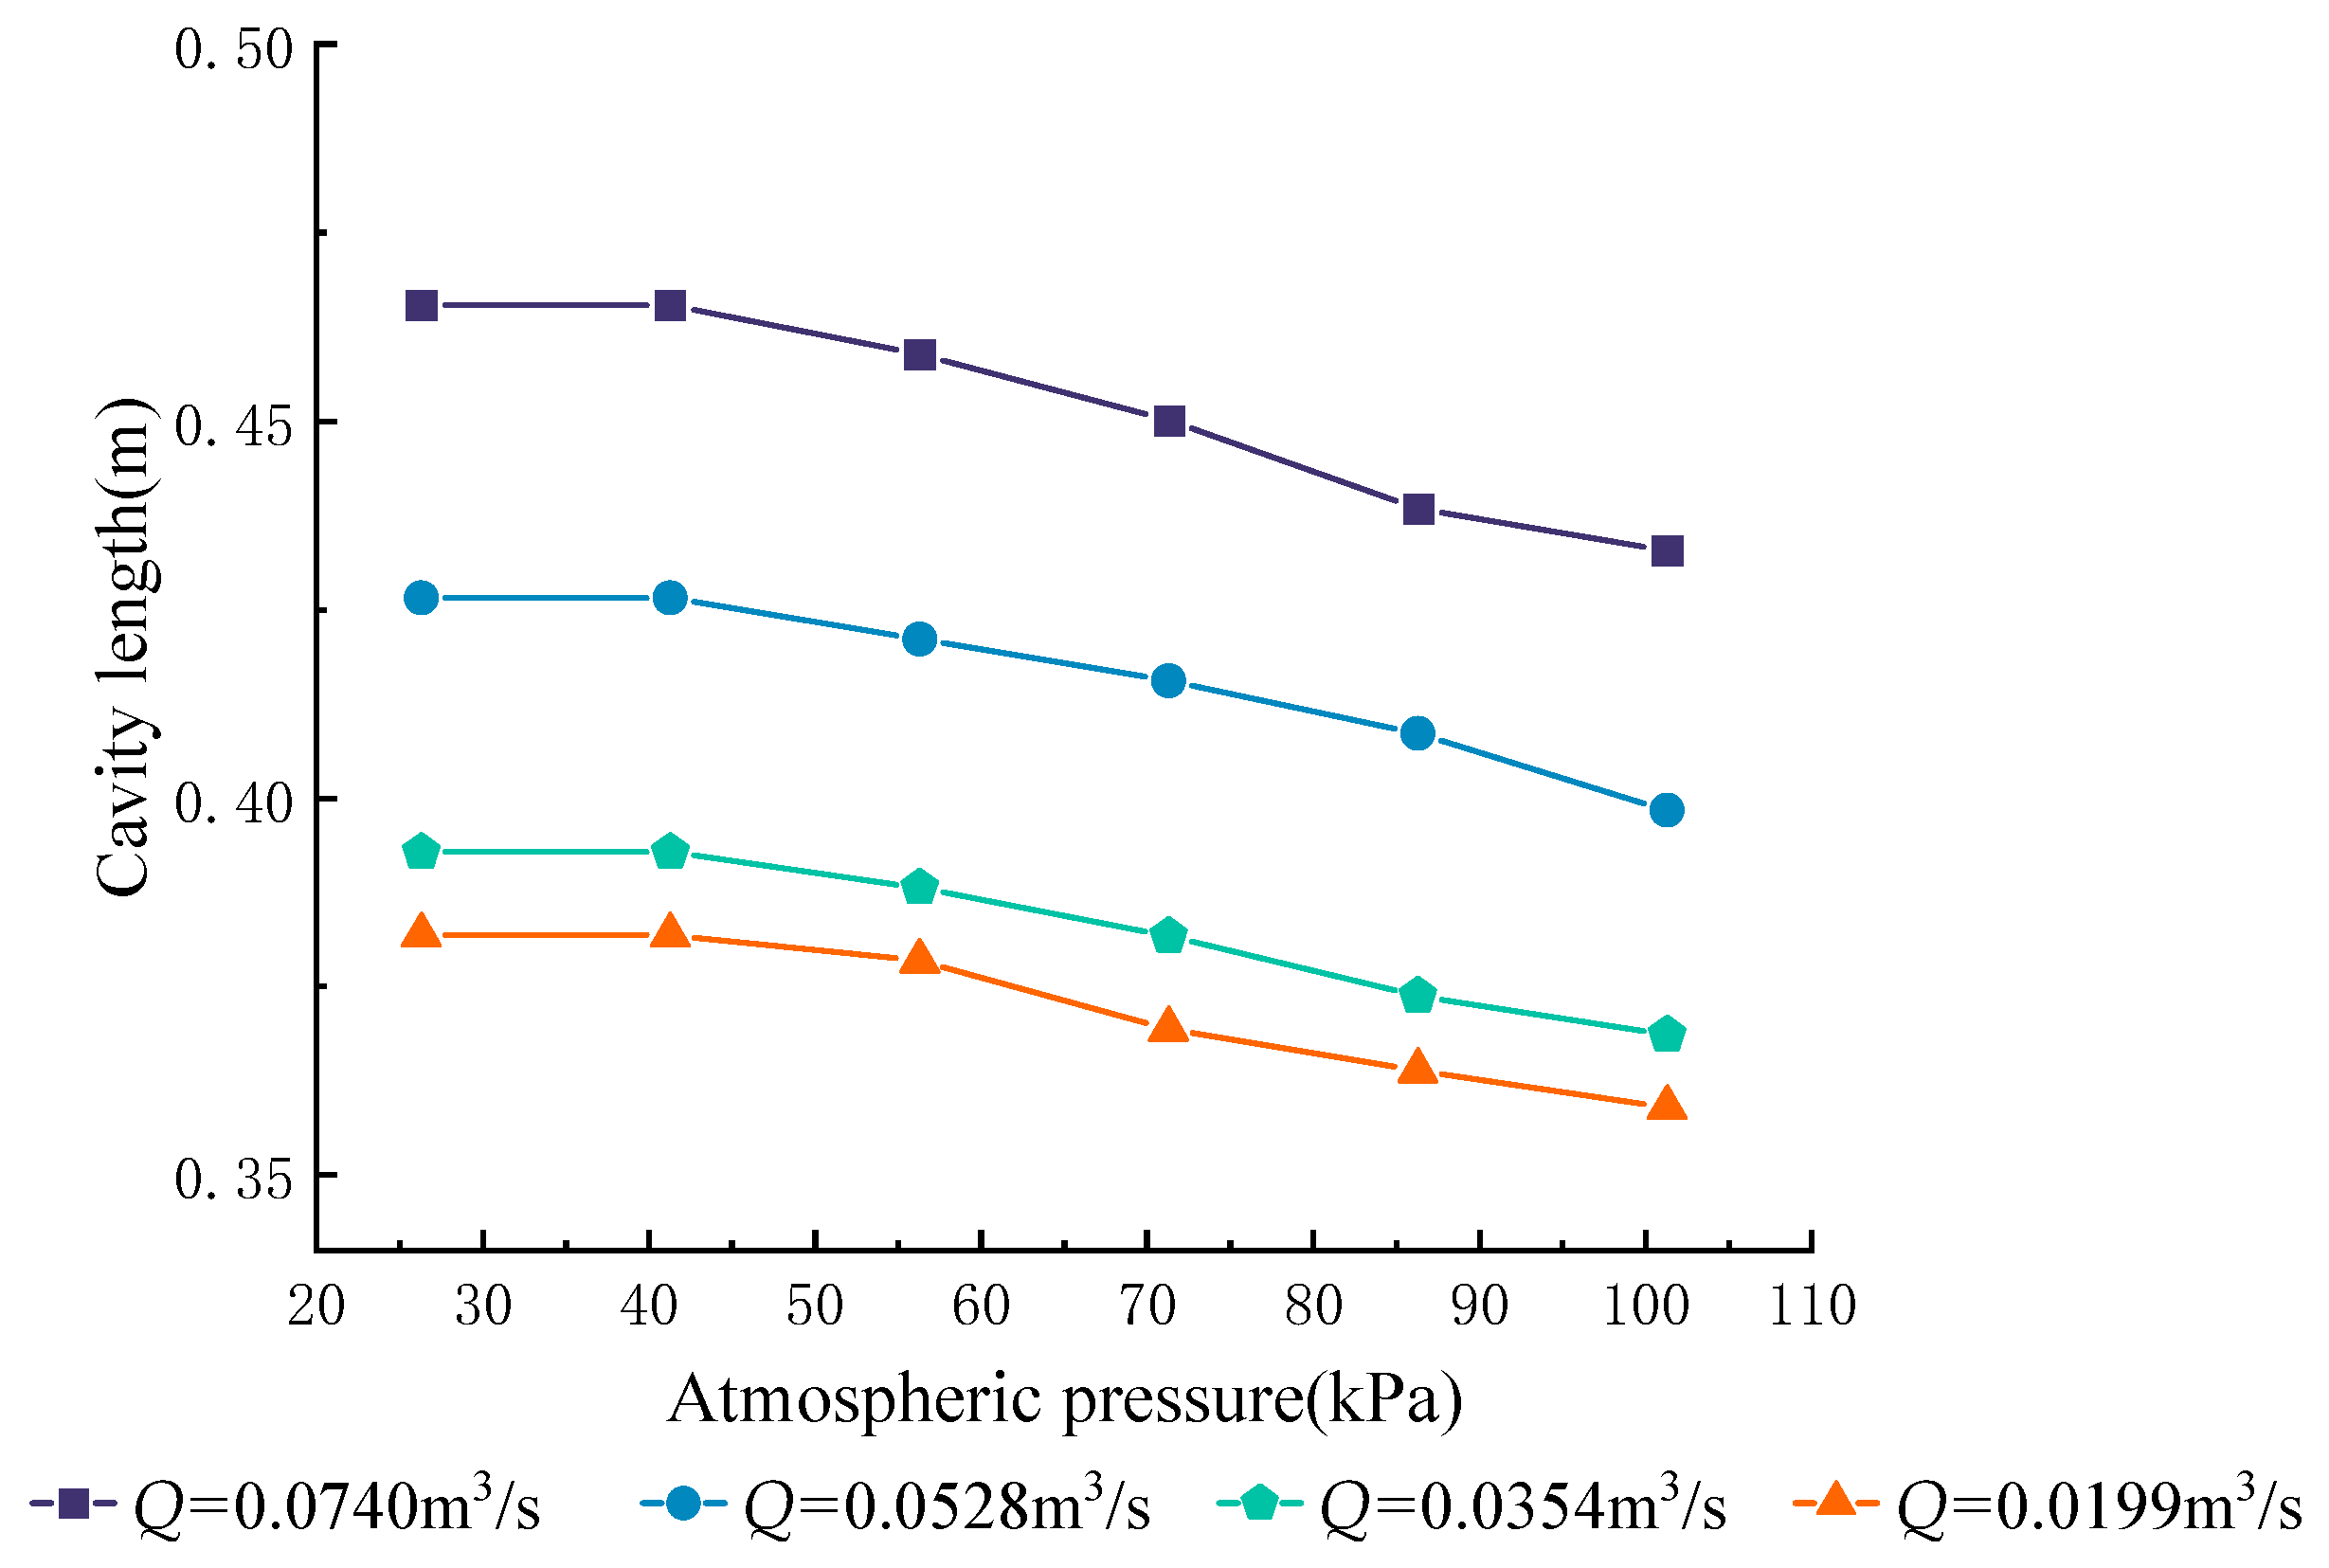
3.2. Cavity Length
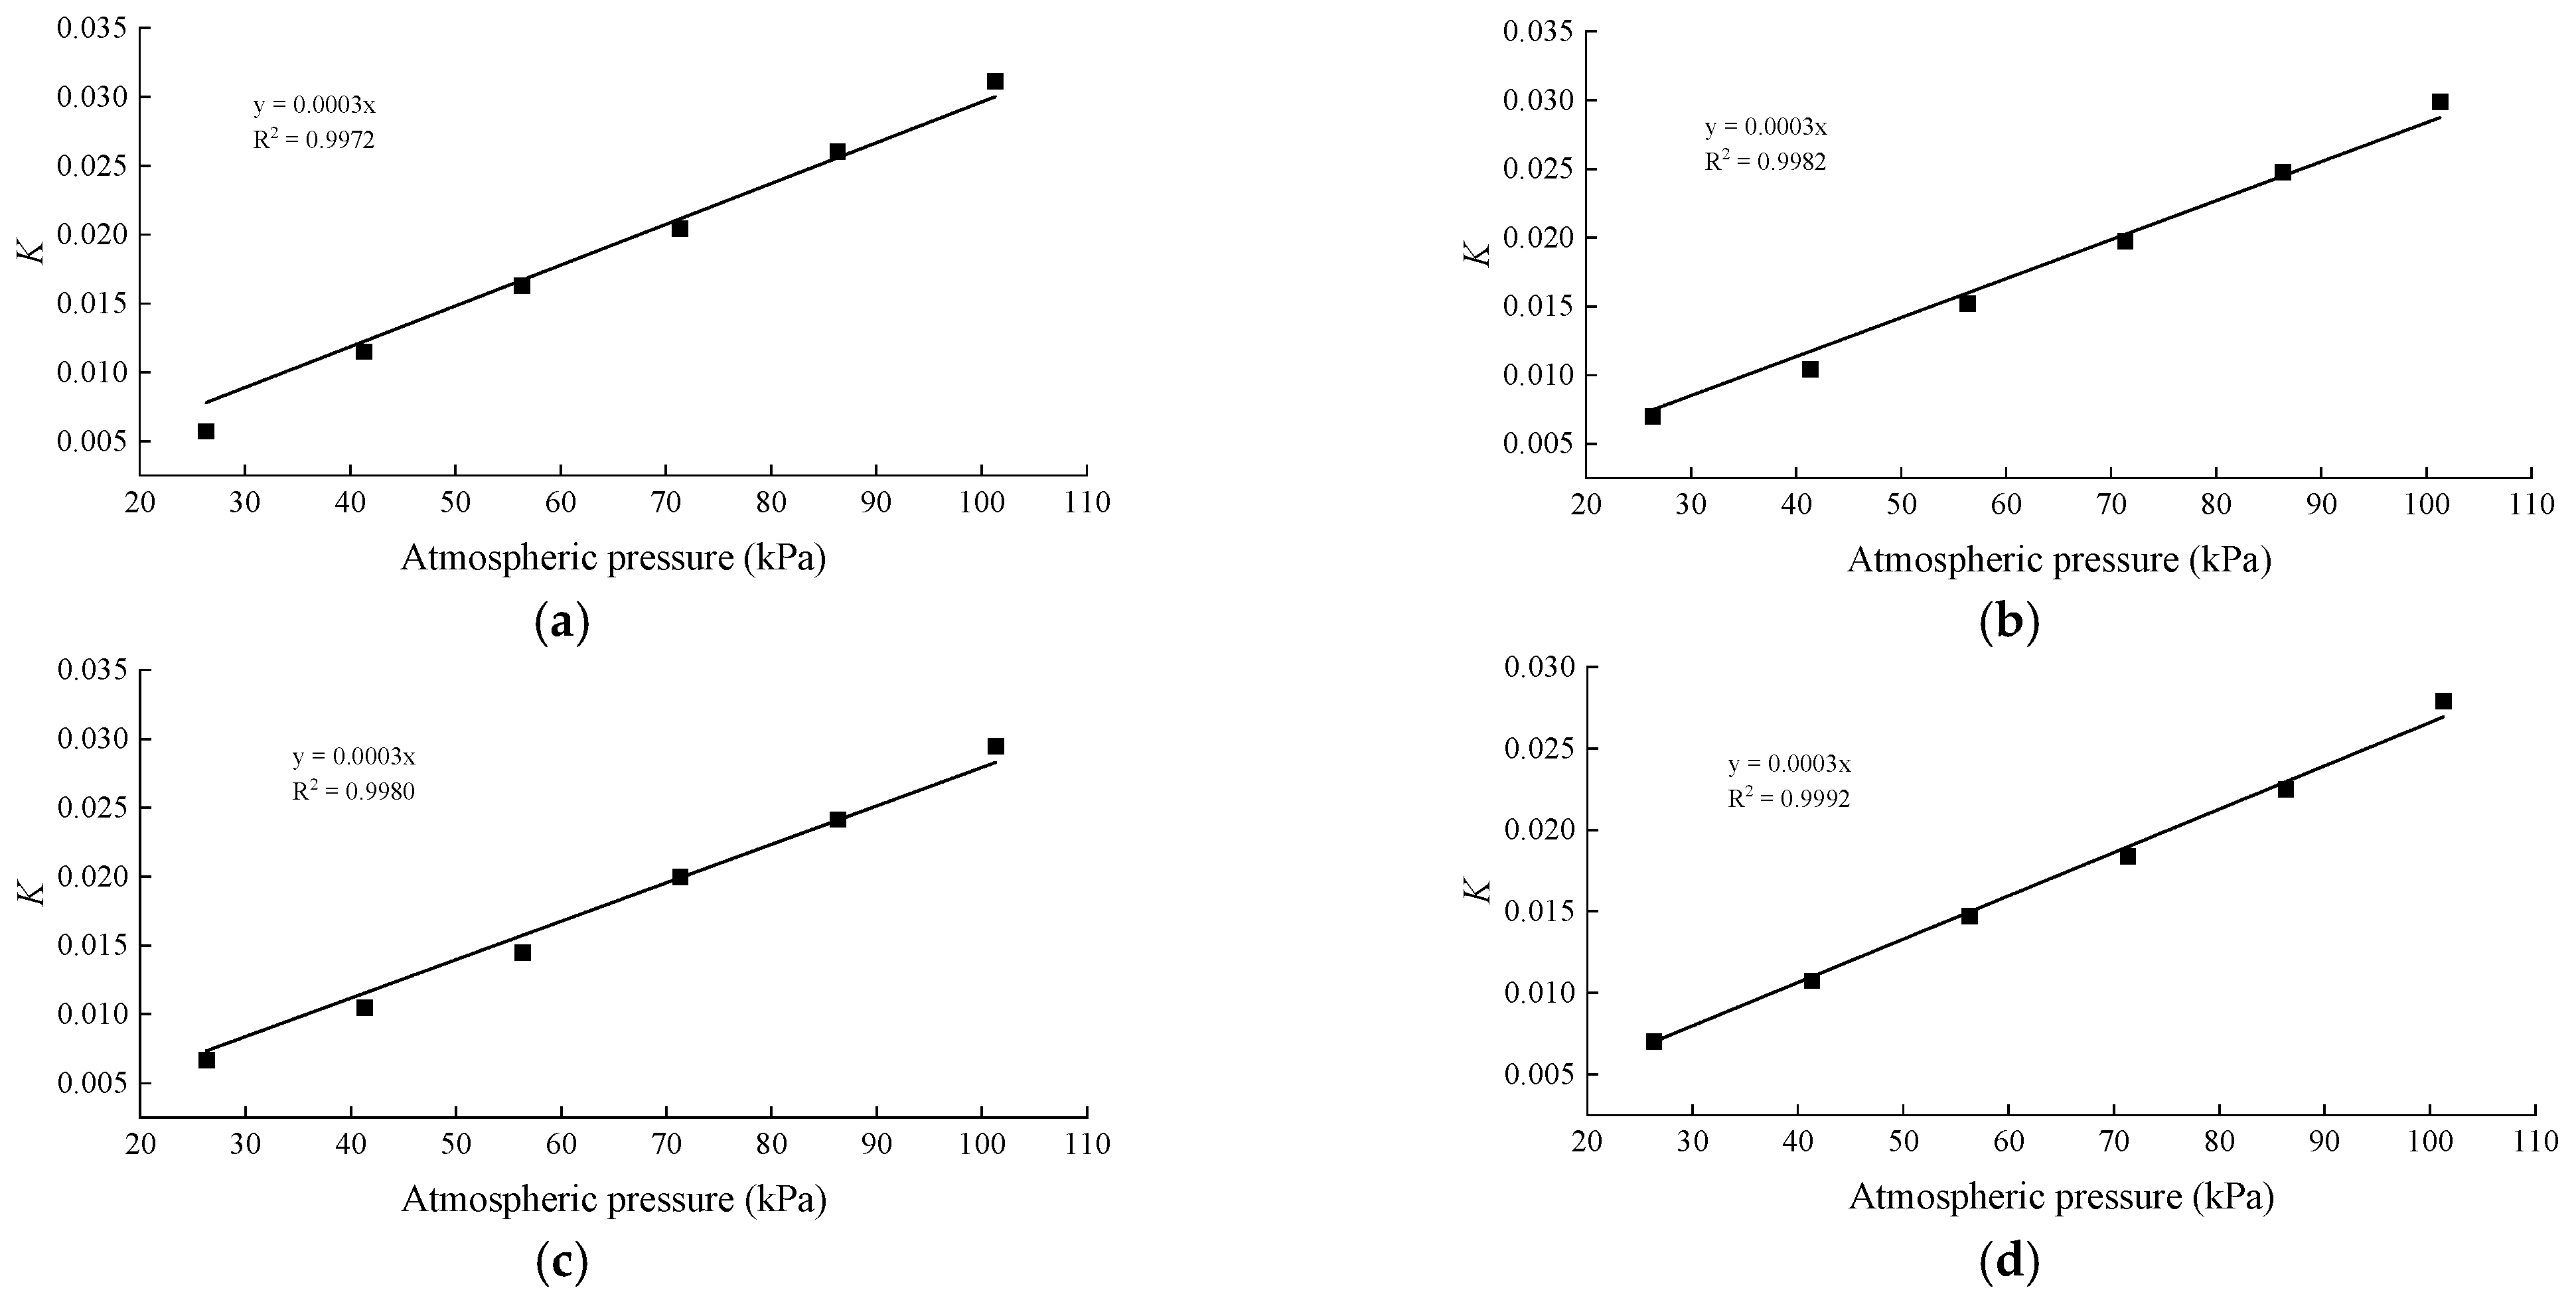
3.3. Correction of Aeration Coefficient under Low Atmospheric Pressure
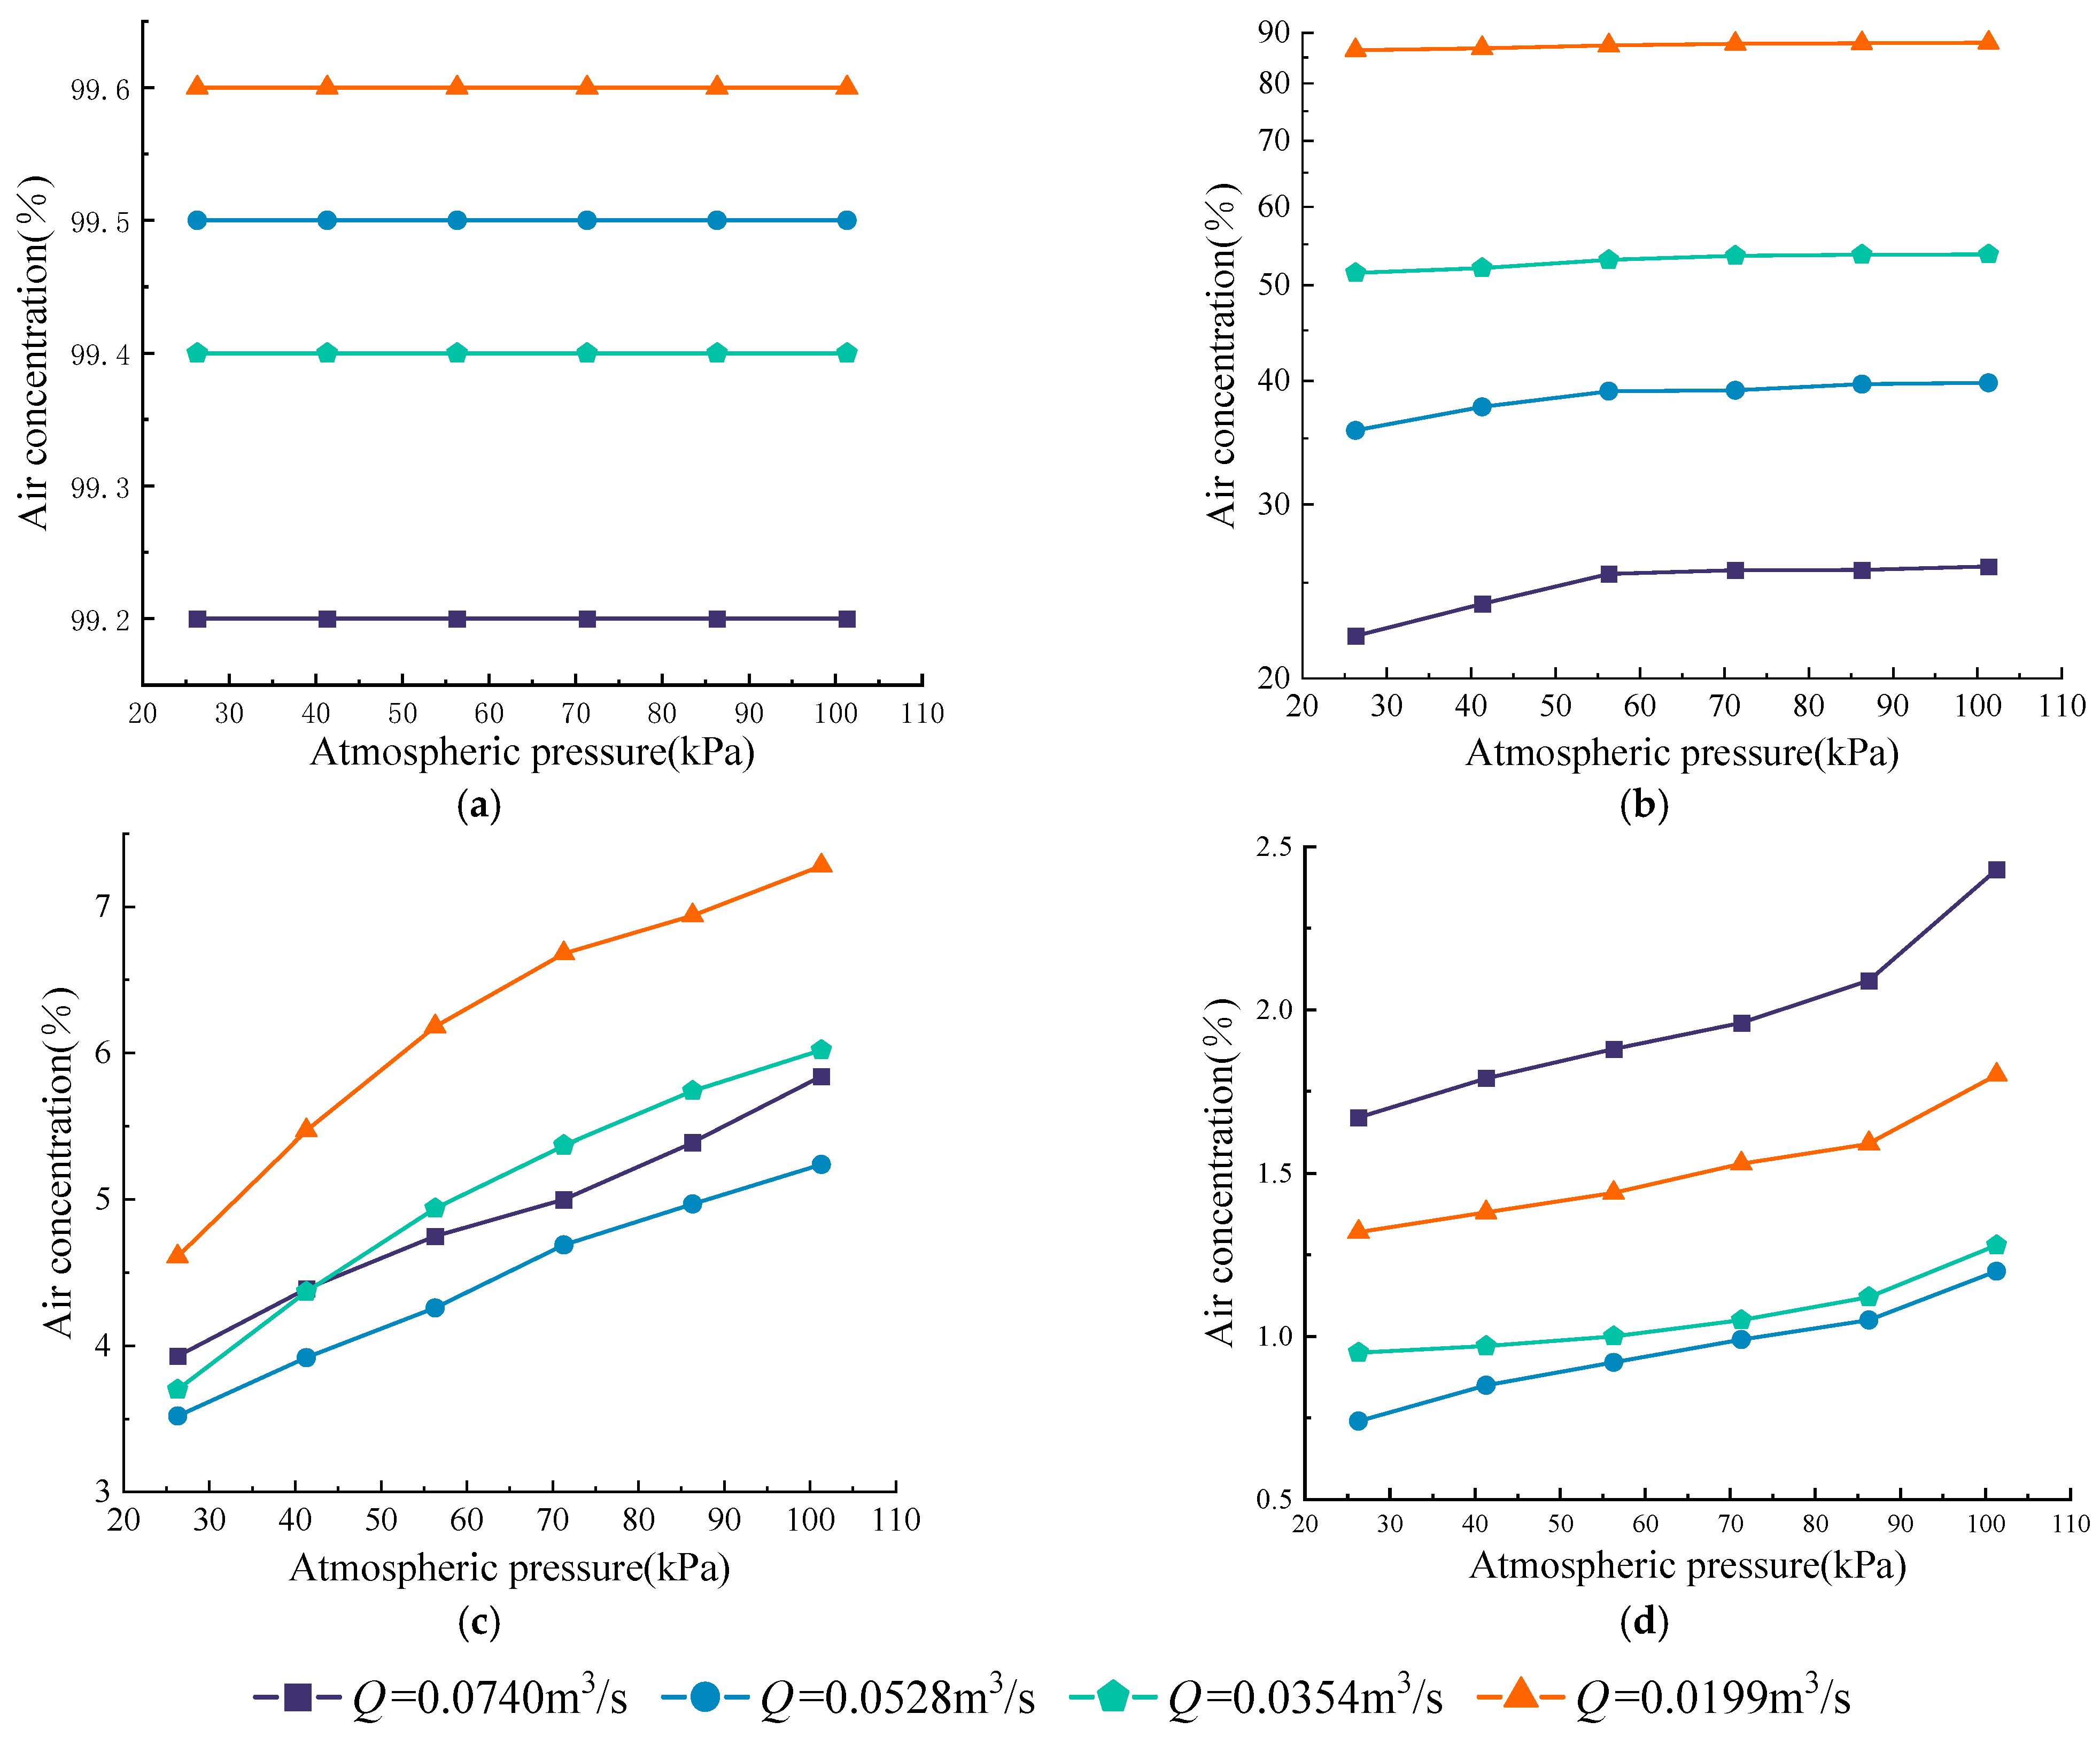
4. The Effect of Atmospheric Pressure on the Air Concentration in Water
5. Conclusions
- (1)
- There is a favorable linear relationship between atmospheric pressure and the airflow velocity of the ventilation hole. With a decrease in atmospheric pressure, the airflow velocity and ventilation volume through the hole decreased. For every 15 kPa decrease in atmospheric pressure, the air velocity decreased by an average of 24.6%. Additionally, with the decrease in atmospheric pressure, the subpressure in the cavity significantly decreased, and there was a trend of increasing cavity length.
- (2)
- When the atmospheric pressure decreased from 101.3 kPa to 26.3 kPa, the maximum reduction in air concentration in the cavity backwater area was 14.9%. The minimum reduction in air concentration at the end of the cavity was 32.7%, and the maximum reduction could reach 38.5%. The minimum reduction in air concentration in the bubble escape section downstream of the cavity was 25.8%, and the maximum reduction could reach 38.3%. As the atmospheric pressure decreased, there was a trend of decreasing air concentration in the water, and the extent of this decrease depended on the initial air concentration. When the water air concentration was higher, the reduction was initially small, followed by a more significant decrease. Conversely, when the water air concentration was lower, the reduction showed an initially larger decrease followed by a smaller decrease.
- (3)
- A low-atmospheric-pressure correction method for the aeration coefficient and water air concentration in the bubble escape section has been proposed. This method can be applied for the rapid estimation of ventilation volume and air concentration in aeration devices under low atmospheric pressure.
Author Contributions
Funding
Data Availability Statement
Conflicts of Interest
References
- Qi, C.F. Intensive Study of Aeration and Ventilation Characteristics of Aeration Devices and Air Supply System for Hydraulic Structures. Ph.D. Thesis, Tianjin University, Tianjin, China, 2019. [Google Scholar]
- Bhosekar, V.V.; Jothiprakash, V.; Deolalikar, P.B. Orifice spillway aerator: Hydraulic design. J. Hydraul. Eng. 2012, 138, 563–572. [Google Scholar] [CrossRef]
- Falvey, H.T. Cavitation in Chutes and Spillways; Engineering Monograph 42; United States Department of the Interior, Bureau of Reclamation: Denver, CO, USA, 1990.
- Guo, J.; Zhang, D.; Liu, Z.P.; Fan, L. Achievements on hydraulic problems in large spillway tunnel with a high head and large discharge flow and its risk analysis. J. Hydraul. Eng. 2006, 10, 1193–1198. [Google Scholar]
- Lin, J.Y.; Zhang, S.R. Hydraulic Structure, 6th ed.; China Water & Power Press: Beijing, China, 2019; ISBN 978-7-5170-7791-6. (In Chinese) [Google Scholar]
- Yang, J.; Li, S.C.; Lin, C. Plausible Differences between the Laboratory and Prototype Behaviors of Spillway Aerator Flows. Water 2022, 14, 3264. [Google Scholar] [CrossRef]
- Wu, J.H.; Luo, C. Effects of Entrained Air Manner on Cavitation Damage. J. Hydrodyn. 2011, 23, 333–338. [Google Scholar] [CrossRef]
- Wang, Y.J.; Zhang, L.C.; Luo, S.Z. Influence of Environmental Pressure Drop on Surface Tension Coefficient of Water. Sci. Technol. Eng. 2017, 17, 136–138. (In Chinese) [Google Scholar]
- Pang, B.H. Influence of atmospheric pressure on cavitation characteristics of high velocity flow at high altitude. J. Yangtze River Sci. Res. Inst. 2019, 36, 64–67. (In Chinese) [Google Scholar] [CrossRef]
- Liu, Z.C.; Wang, X.Q.; Fan, W.J.; Yv, K. Study on Some Properties of Hydrodynamic Cavitation Damage. In Proceedings of the 4th International Conference on Renewable Energy Technologies, Kuala Lumpur, Malaysia, 16–18 January 2018. [Google Scholar]
- Zabaleta, F.; Bombardelli, F.A.; Toro, J.P. Towards an understanding of the mechanisms leading to air entrainment in the skimming flow over stepped spillways. Environ. Fluid Mech. 2020, 20, 375–392. [Google Scholar] [CrossRef]
- Bruschin, J. Forced Aeration of High Velocity Flows. J. Hydraul. Res. 1987, 25, 5–14. [Google Scholar] [CrossRef]
- Chanson, H. Study of air entrainment and aeration devices. J. Hydraul. Res. 1989, 27, 301–319. [Google Scholar] [CrossRef]
- Luna-Bahena, J.C.; Pozos-Estrada, O.; Ortiz-Martínez, V.M.; Gracia-Sánchez, J. Experimental Investigation of Artificial Aeration on a Smooth Spillway with a Crest Pier. Water 2018, 10, 1383. [Google Scholar] [CrossRef]
- Rutschmann, P.; Hager, W.H. Air entrainment by spillway aerators. J. Hydraul. Eng. ASCE 1990, 116, 765–782. [Google Scholar] [CrossRef]
- Wu, J.H.; Fan, B.; Xu, W.L. Inverse problem of bottom slope design for aerator devices. J. Hydrodyn. 2013, 25, 805–808. [Google Scholar] [CrossRef]
- Bai, R.D.; Liu, C.; Feng, B.Y.; Liu, S.J.; Zhang, F.X. Development of Bubble Characteristics on Chute Spillway Bottom. Water 2018, 10, 1129. [Google Scholar] [CrossRef]
- Liu, X.C.; Bai, R.D.; Liu, S.J. Air entrainment scale effects in chute aerator flows. Eur. J. Mech. B Fluids 2023, 99, 163–172. [Google Scholar] [CrossRef]
- Lian, J.J.; Qi, C.F.; Liu, F.; Gou, W.J.; Pan, S.Q.; Ouyang, Q.A. Air Entrainment and Air Demand in the Spillway Tunnel at the Jinping-I Dam. Appl. Sci. 2017, 7, 930. [Google Scholar] [CrossRef]
- Zhang, L.C.; Luo, S.Z.; Wang, X. Experimental study of air entrainment to alleviate cavitations for chute with high-speed discharge. Eng. Mech. 2013, 30, 329–332. [Google Scholar] [CrossRef]
- Yang, Y.S.; Chen, C.Z.; Yu, Q.Y. A mathematical model for self-aeration capacity of free jet on the aerator. J. Hydraul. Eng. 1996, 3, 13–21. [Google Scholar]
- Pfister, M.; Hager, W.H.; Minor, H. Bottom Aeration of Stepped Spillways. J. Hydraul. Eng. 2006, 132, 850–853. [Google Scholar] [CrossRef]
- Kells, J.A.; Smith, C.D. Reduction of cavitation on spillways by induced air entrainment. Can. J. Civ. Eng. 2011, 18, 358–377. [Google Scholar] [CrossRef]
- Wei, L.; Yang, Q.; Dai, G.Q.; Du, Z.Y.; Zhong, J. Experimental Study on Ventilation Volume of the Flip Bucket. Adv. Eng. Sci. 2015, 47, 18–23. [Google Scholar]
- Wang, Y.M.; Deng, J.; Wei, W.R. Investigation on the Cavity Backwater of Chute Aerators under Various Atmospheric Pressures. Water 2022, 14, 1513. [Google Scholar] [CrossRef]
- Pang, B.H.; Zhang, L.C.; Lu, J.; Chi, F.D. Influence of Atmospheric Pressure on Distribution of Gas Nuclei in Water Body. Water Resour. Power 2018, 36, 30–33. (In Chinese) [Google Scholar]
- Wu, J.H. Cavitation and its damage in hydro-electric engineering projects. In Proceedings of the 18th National Conference on Hydrodynamics (NCHD), Urumqi, China, 9–26 August 2004. (In Chinese). [Google Scholar]
- Zhao, J.P.; Hu, Y.A. Research on Pressure Reduction Model Testing for the Tail Section of the Spillway Tunnel during the Technical Implementation Phase of the Baihetan Hydropower Station; Nanjing Hydraulic Research Institute: Nanjing, China, 2020. (In Chinese) [Google Scholar]
- Pang, B.H.; Zhang, L.C.; Chi, F.D. Analysis of Ambient Air Pressure Effect on Cavity Length of Aeration Facility. Water Resour. Power 2020, 38, 114–116+121. (In Chinese) [Google Scholar]
- Xue, B.; Zhao, Y.P.; Liao, W.L.; Li, Z.H. Numerical study on the influence of high altitude environment on hydraulic mechanical performance. In Proceedings of the IAHR’s Symposium on Hydraulic Machinery and Systems, Beijing, China, 16–19 November 2017. [Google Scholar]
- Wu, J.H.; Ruan, S.P. Cavity length below chute aerators. Sci. China Ser. E-Technol. Sci. 2008, 51, 170–178. [Google Scholar] [CrossRef]
- Pan, S.B.; Shao, Y.Y.; Shi, Q.S.; Dong, X.L. The self-aeration capacity of the water jet over the aeration ramp. J. Hydraul. Eng. 1980, 5, 13–22. (In Chinese) [Google Scholar]
- Peterka, A.J. The effect of entrained air on cavitation pitting. In Proceedings of the Minnesota International Hydraulic Convention, Minneapolis, MN, USA, 1–4 September 1953. [Google Scholar]
- Russell, S.O.; Sheehan, G.J. Effect of Entrained Air on Cavitation Damage. Can. J. Civ. Eng. 1974, 1, 97–107. [Google Scholar] [CrossRef]


| Series | Atmospheric Pressure (kPa) | Simulating High Altitudes (m) | Depressurization Chamber Vacuum Degree (kPa) |
|---|---|---|---|
| 1 | 101.3 | 0 | 0 |
| 2 | 86.3 | 1330 | 15.0 |
| 3 | 71.3 | 2900 | 30.0 |
| 4 | 56.3 | 4700 | 45.0 |
| 5 | 41.3 | 6950 | 60.0 |
| 6 | 26.3 | 10,000 | 75.0 |
| Series | Discharge (m3/s) | Incoming Flow Velocity (m/s) | Froude Number |
|---|---|---|---|
| 1 | 0.0740 | 4.96 | 5.61 |
| 2 | 0.0528 | 4.63 | 5.99 |
| 3 | 0.0354 | 4.33 | 6.62 |
| 4 | 0.0199 | 4.19 | 8.41 |
| Atmospheric Pressure (kPa) | Feature Parameters (m/s) | Degree of Influence on the Average Value (%) | |||
|---|---|---|---|---|---|
| Maximum Value | Minimum Value | RMS Value | Average Value | ||
| 101.3 | 1.63 | 0.60 | 0.14 | 1.00 | |
| 86.3 | 1.46 | 0.49 | 0.12 | 0.83 | 17.2 |
| 71.3 | 1.13 | 0.40 | 0.10 | 0.65 | 22.1 |
| 56.3 | 0.87 | 0.32 | 0.07 | 0.50 | 21.9 |
| 41.3 | 0.56 | 0.21 | 0.05 | 0.35 | 29.9 |
| 26.3 | 0.34 | 0.18 | 0.03 | 0.25 | 29.2 |
| Measurement Point | Atmospheric Pressure (kPa) | ||||||
|---|---|---|---|---|---|---|---|
| 101.3 | 86.3 | 71.3 | 56.3 | 41.3 | 26.3 | ||
| M1 | Measurement Value (kPa) | 101.108 | 86.166 | 71.230 | 56.259 | 41.275 | 26.294 |
| Subpressure Value(kPa) | 0.192 | 0.134 | 0.070 | 0.041 | 0.025 | 0.006 | |
| Pressure gradient force (N/kg) | 0.908 | 0.728 | 0.458 | 0.339 | 0.281 | 0.106 | |
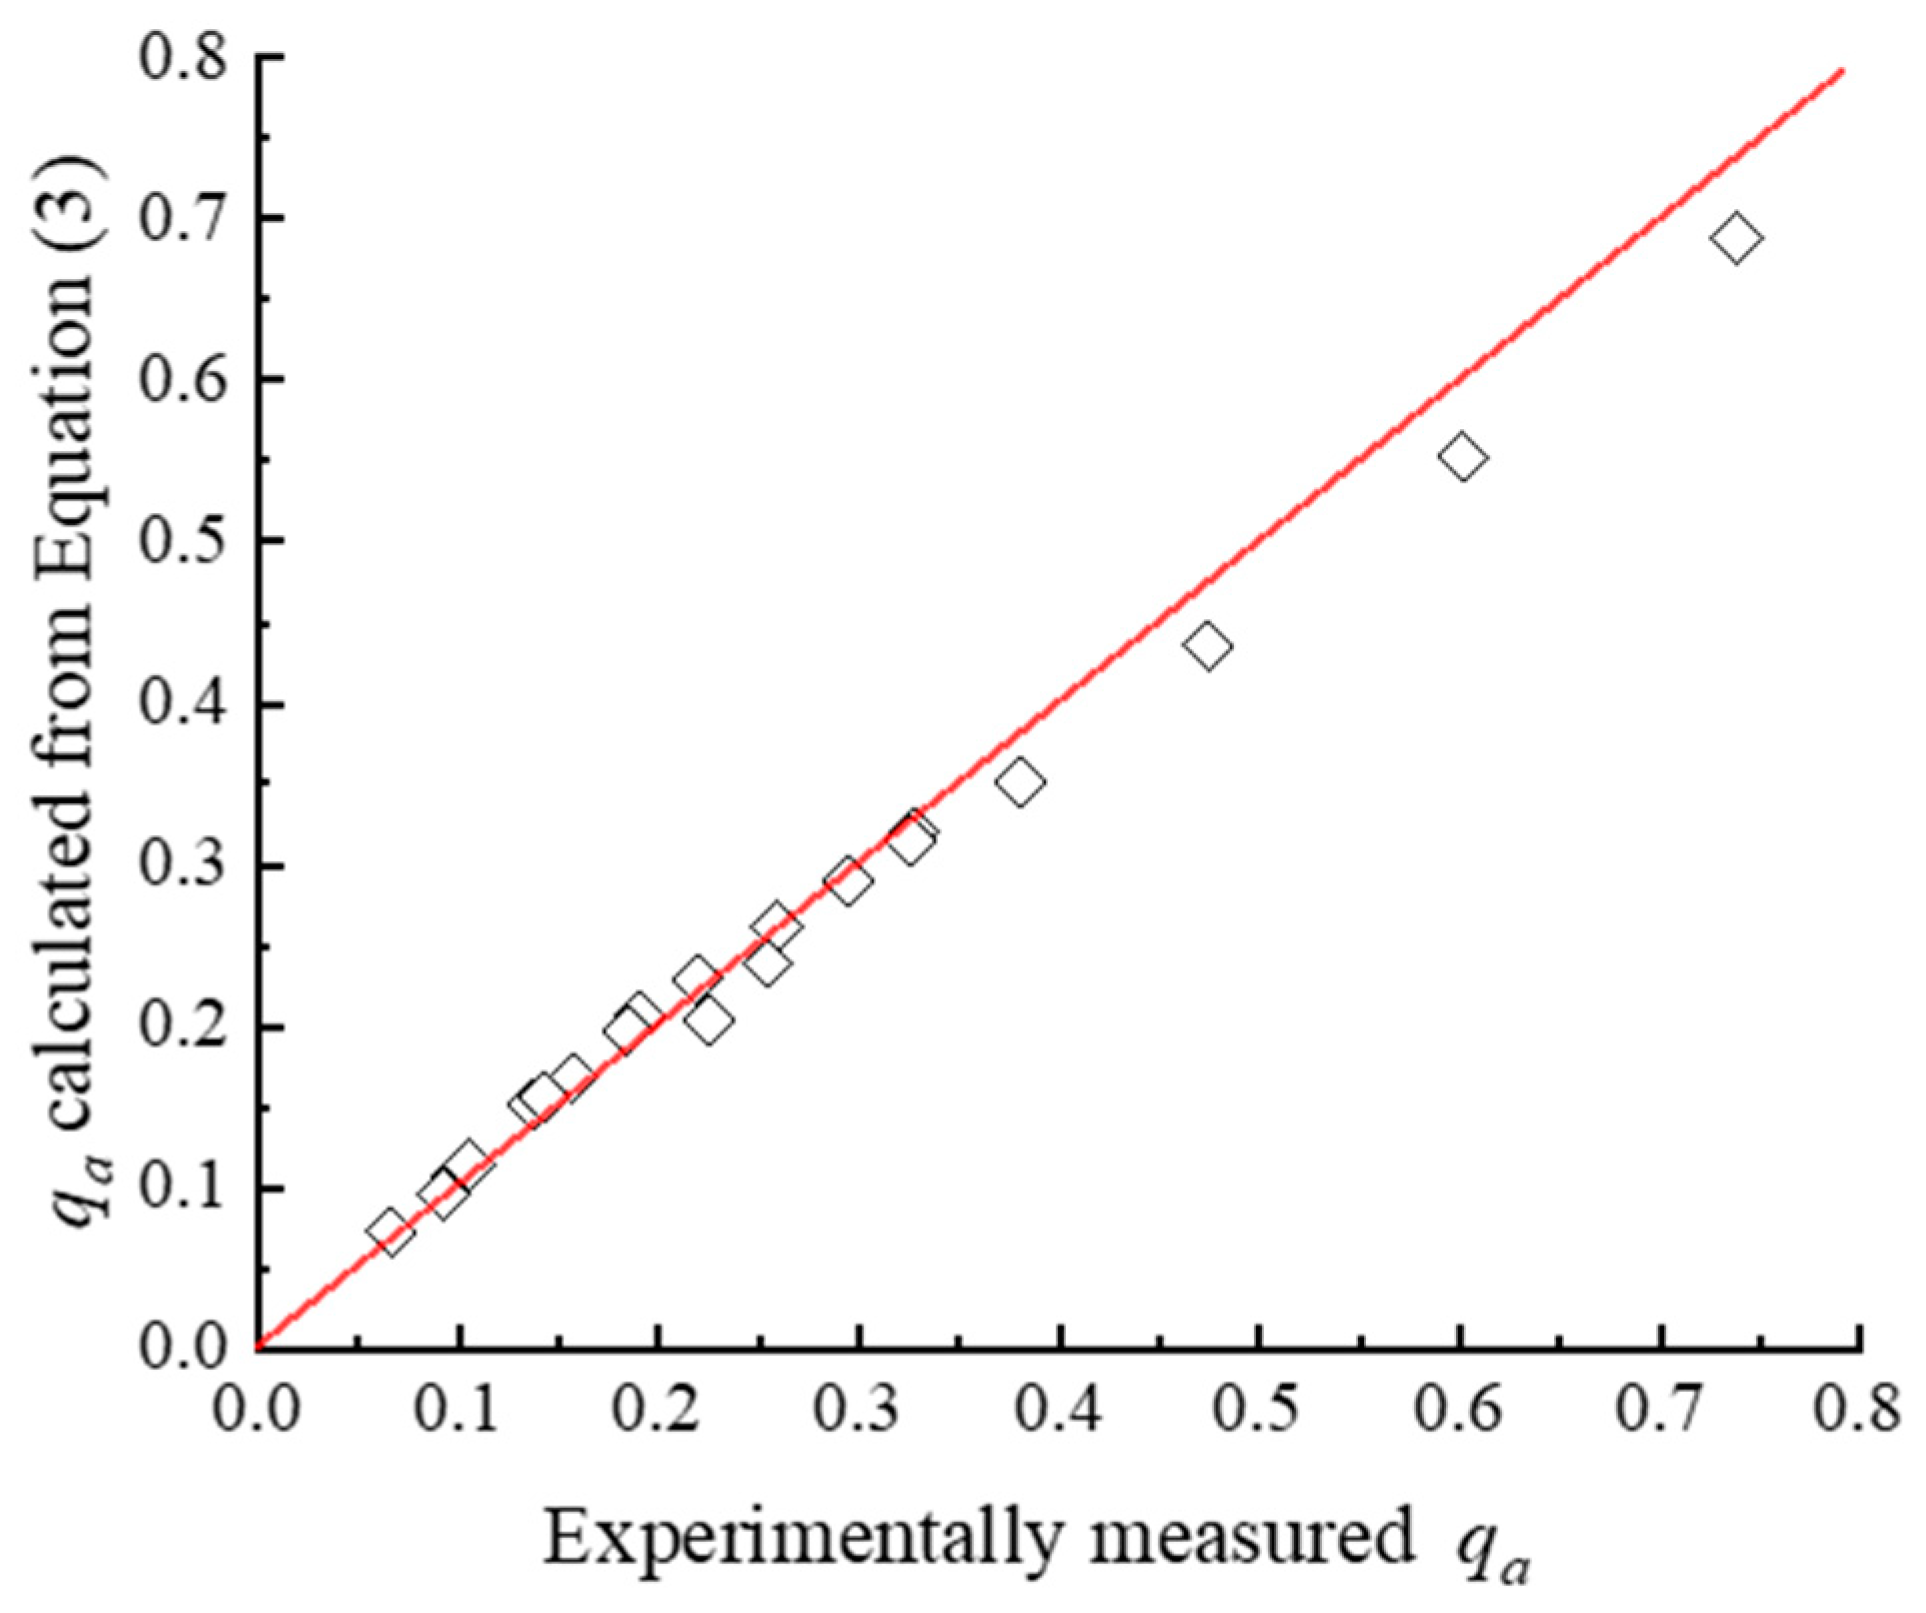
| Upstream Flow Velocity (m/s) | Prototype qa | Model Test qa | Model Test Error (%) | Calculation of qa Using Equation (3) | Calculation Error (%) Using Equation (3) |
|---|---|---|---|---|---|
| 25 | 16.2 | 19.38 | 19.60 | 16.48 | 1.72 |
Disclaimer/Publisher’s Note: The statements, opinions and data contained in all publications are solely those of the individual author(s) and contributor(s) and not of MDPI and/or the editor(s). MDPI and/or the editor(s) disclaim responsibility for any injury to people or property resulting from any ideas, methods, instructions or products referred to in the content. |
© 2024 by the authors. Licensee MDPI, Basel, Switzerland. This article is an open access article distributed under the terms and conditions of the Creative Commons Attribution (CC BY) license (https://creativecommons.org/licenses/by/4.0/).
Share and Cite
Guo, Y.; Zhang, L.; Yu, L.; Luo, S.; Liu, C.; Liu, Y. The Impact of Decreased Atmospheric Pressure on Forced Aeration of Discharged Flow. Water 2024, 16, 353. https://doi.org/10.3390/w16020353
Guo Y, Zhang L, Yu L, Luo S, Liu C, Liu Y. The Impact of Decreased Atmospheric Pressure on Forced Aeration of Discharged Flow. Water. 2024; 16(2):353. https://doi.org/10.3390/w16020353
Chicago/Turabian StyleGuo, Yijiao, Luchen Zhang, Lei Yu, Shaoze Luo, Chuang Liu, and Yuan Liu. 2024. "The Impact of Decreased Atmospheric Pressure on Forced Aeration of Discharged Flow" Water 16, no. 2: 353. https://doi.org/10.3390/w16020353
APA StyleGuo, Y., Zhang, L., Yu, L., Luo, S., Liu, C., & Liu, Y. (2024). The Impact of Decreased Atmospheric Pressure on Forced Aeration of Discharged Flow. Water, 16(2), 353. https://doi.org/10.3390/w16020353