

A Study on the Evolution of Urban Underlying Surfaces and Extreme Rainfall in the Pearl River Delta


Abstract
1. Introduction
2. Materials and Methods
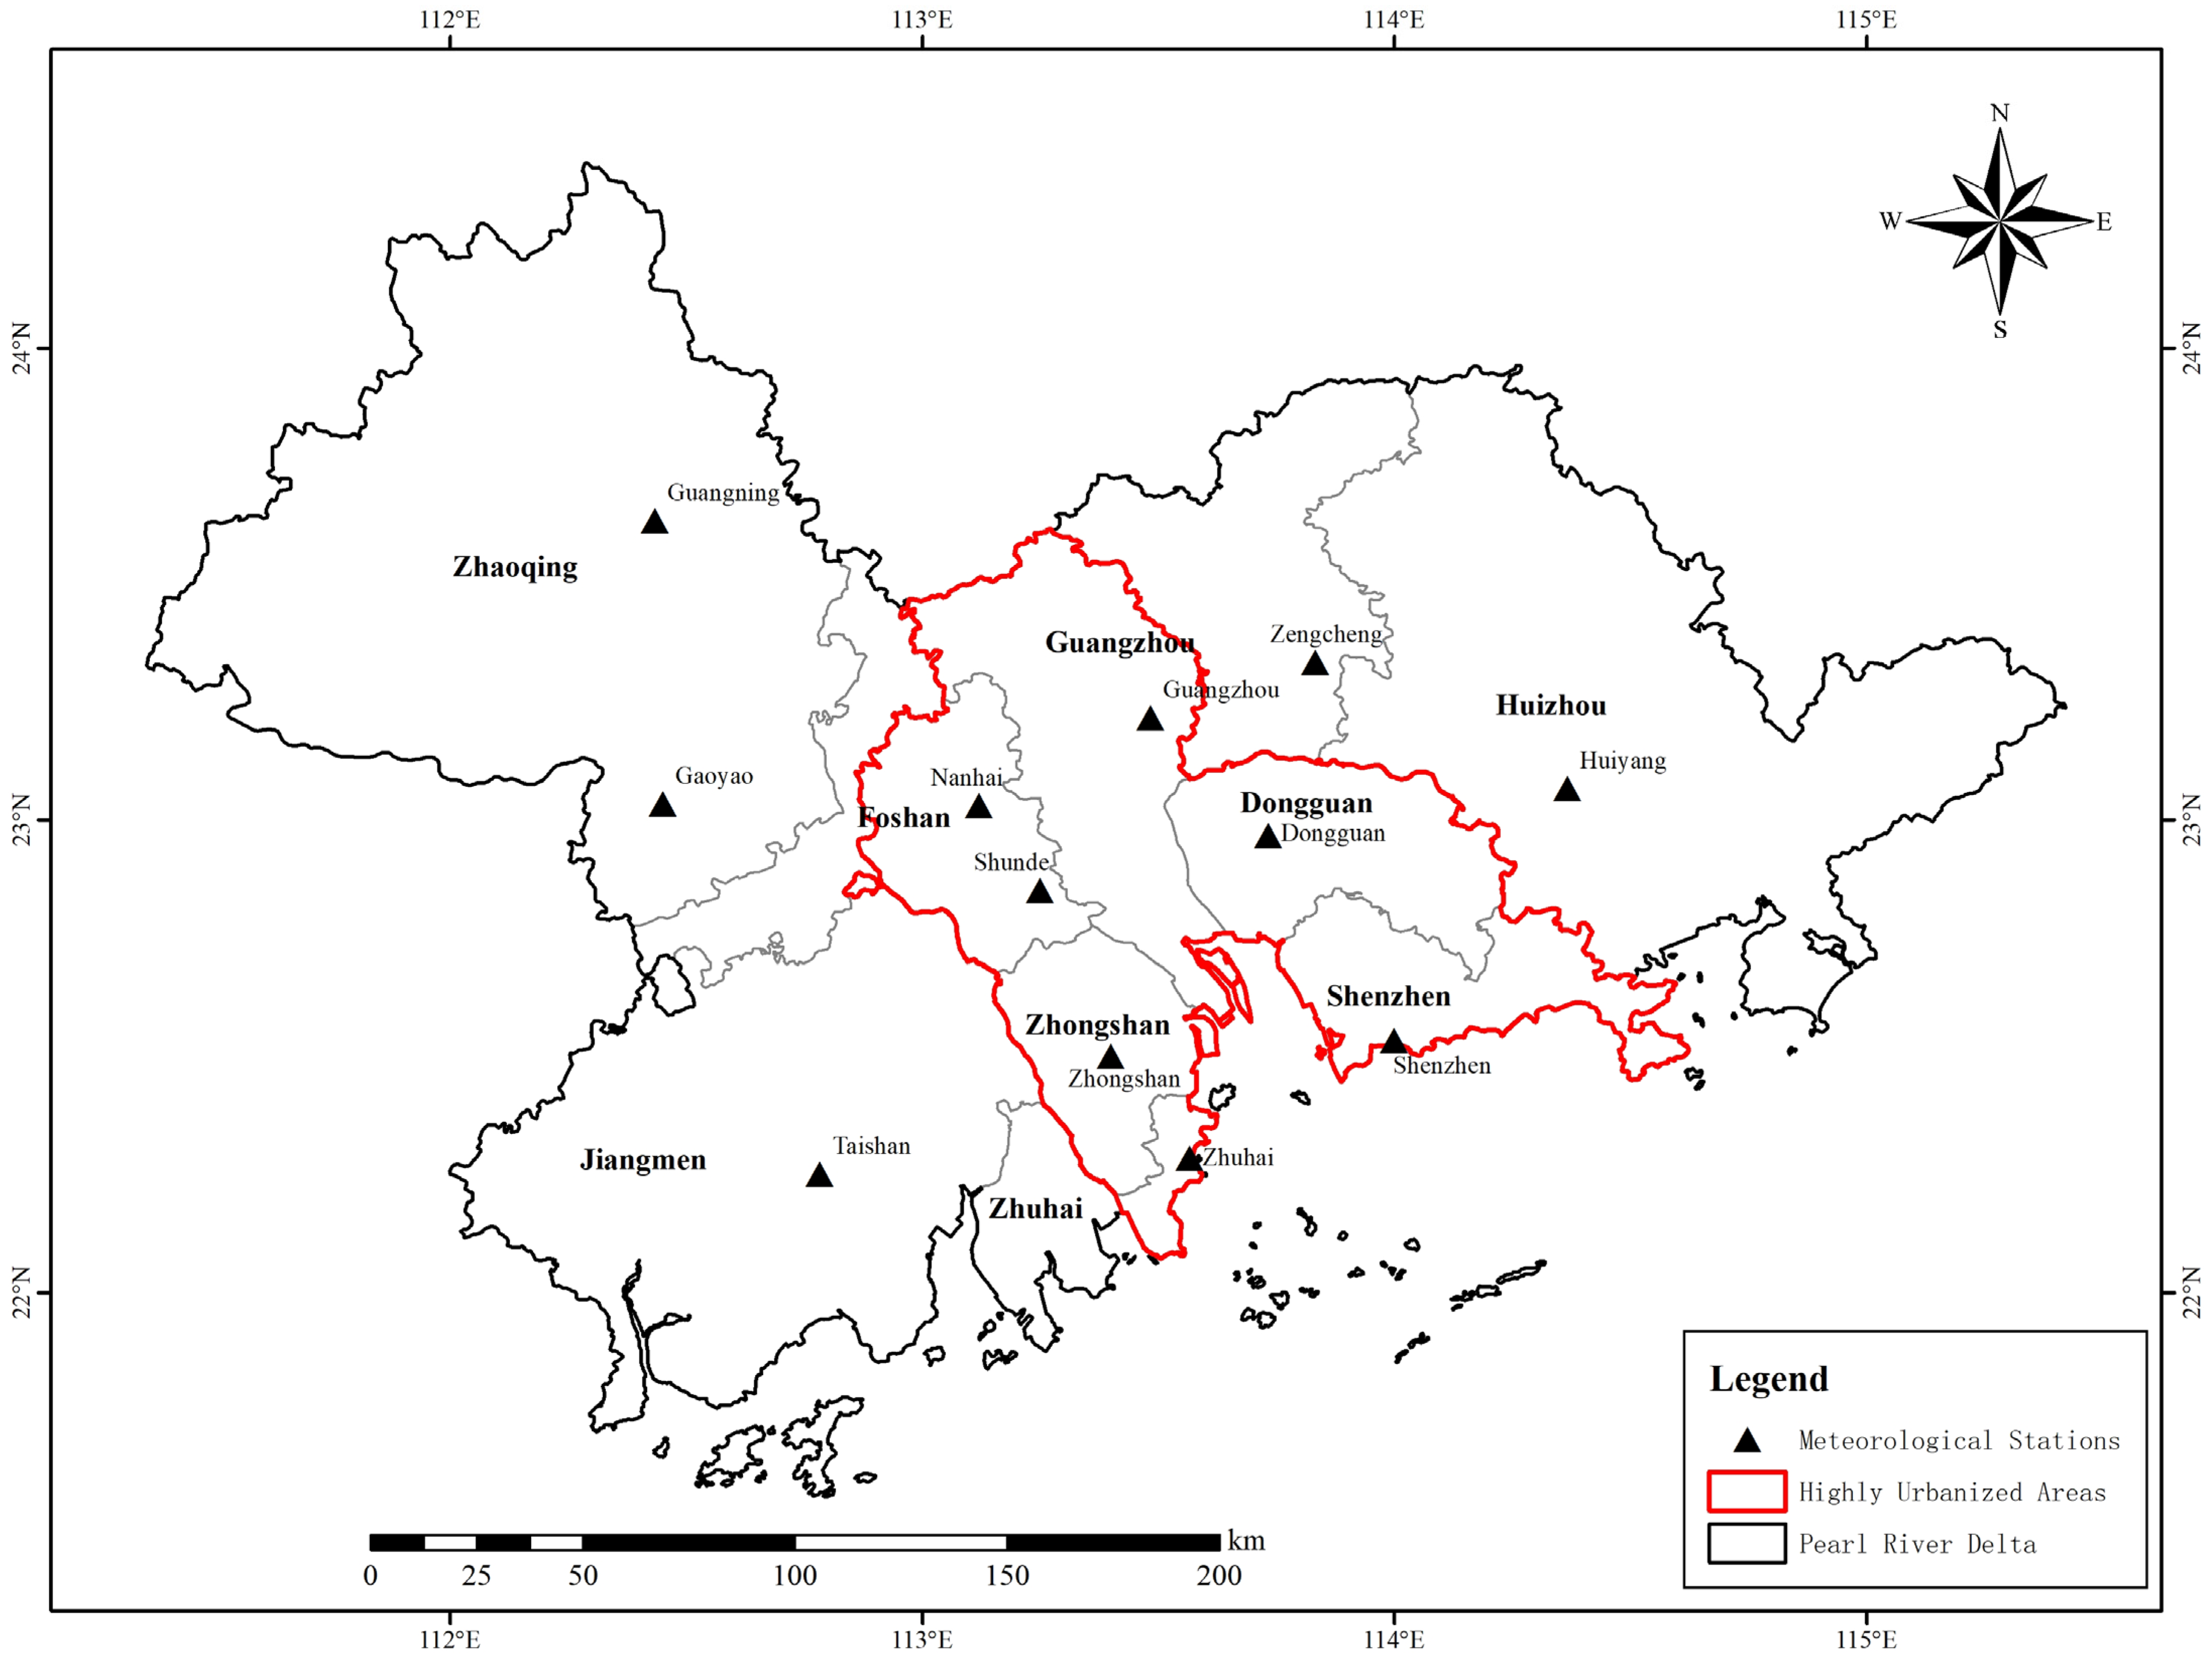
2.1. Study Area
2.2. Materials
- (1)
- Normalized Difference Built-up Index (NDBI)
- (2)
- Precipitation data
2.3. Methods
- (1)
- Calculation of Normalized Difference Built-up Index (NDBI)
- (2)
- Determination of extreme precipitation data
- (3)
- Trend analysis
- (4)
- Correlation analysis
3. Results
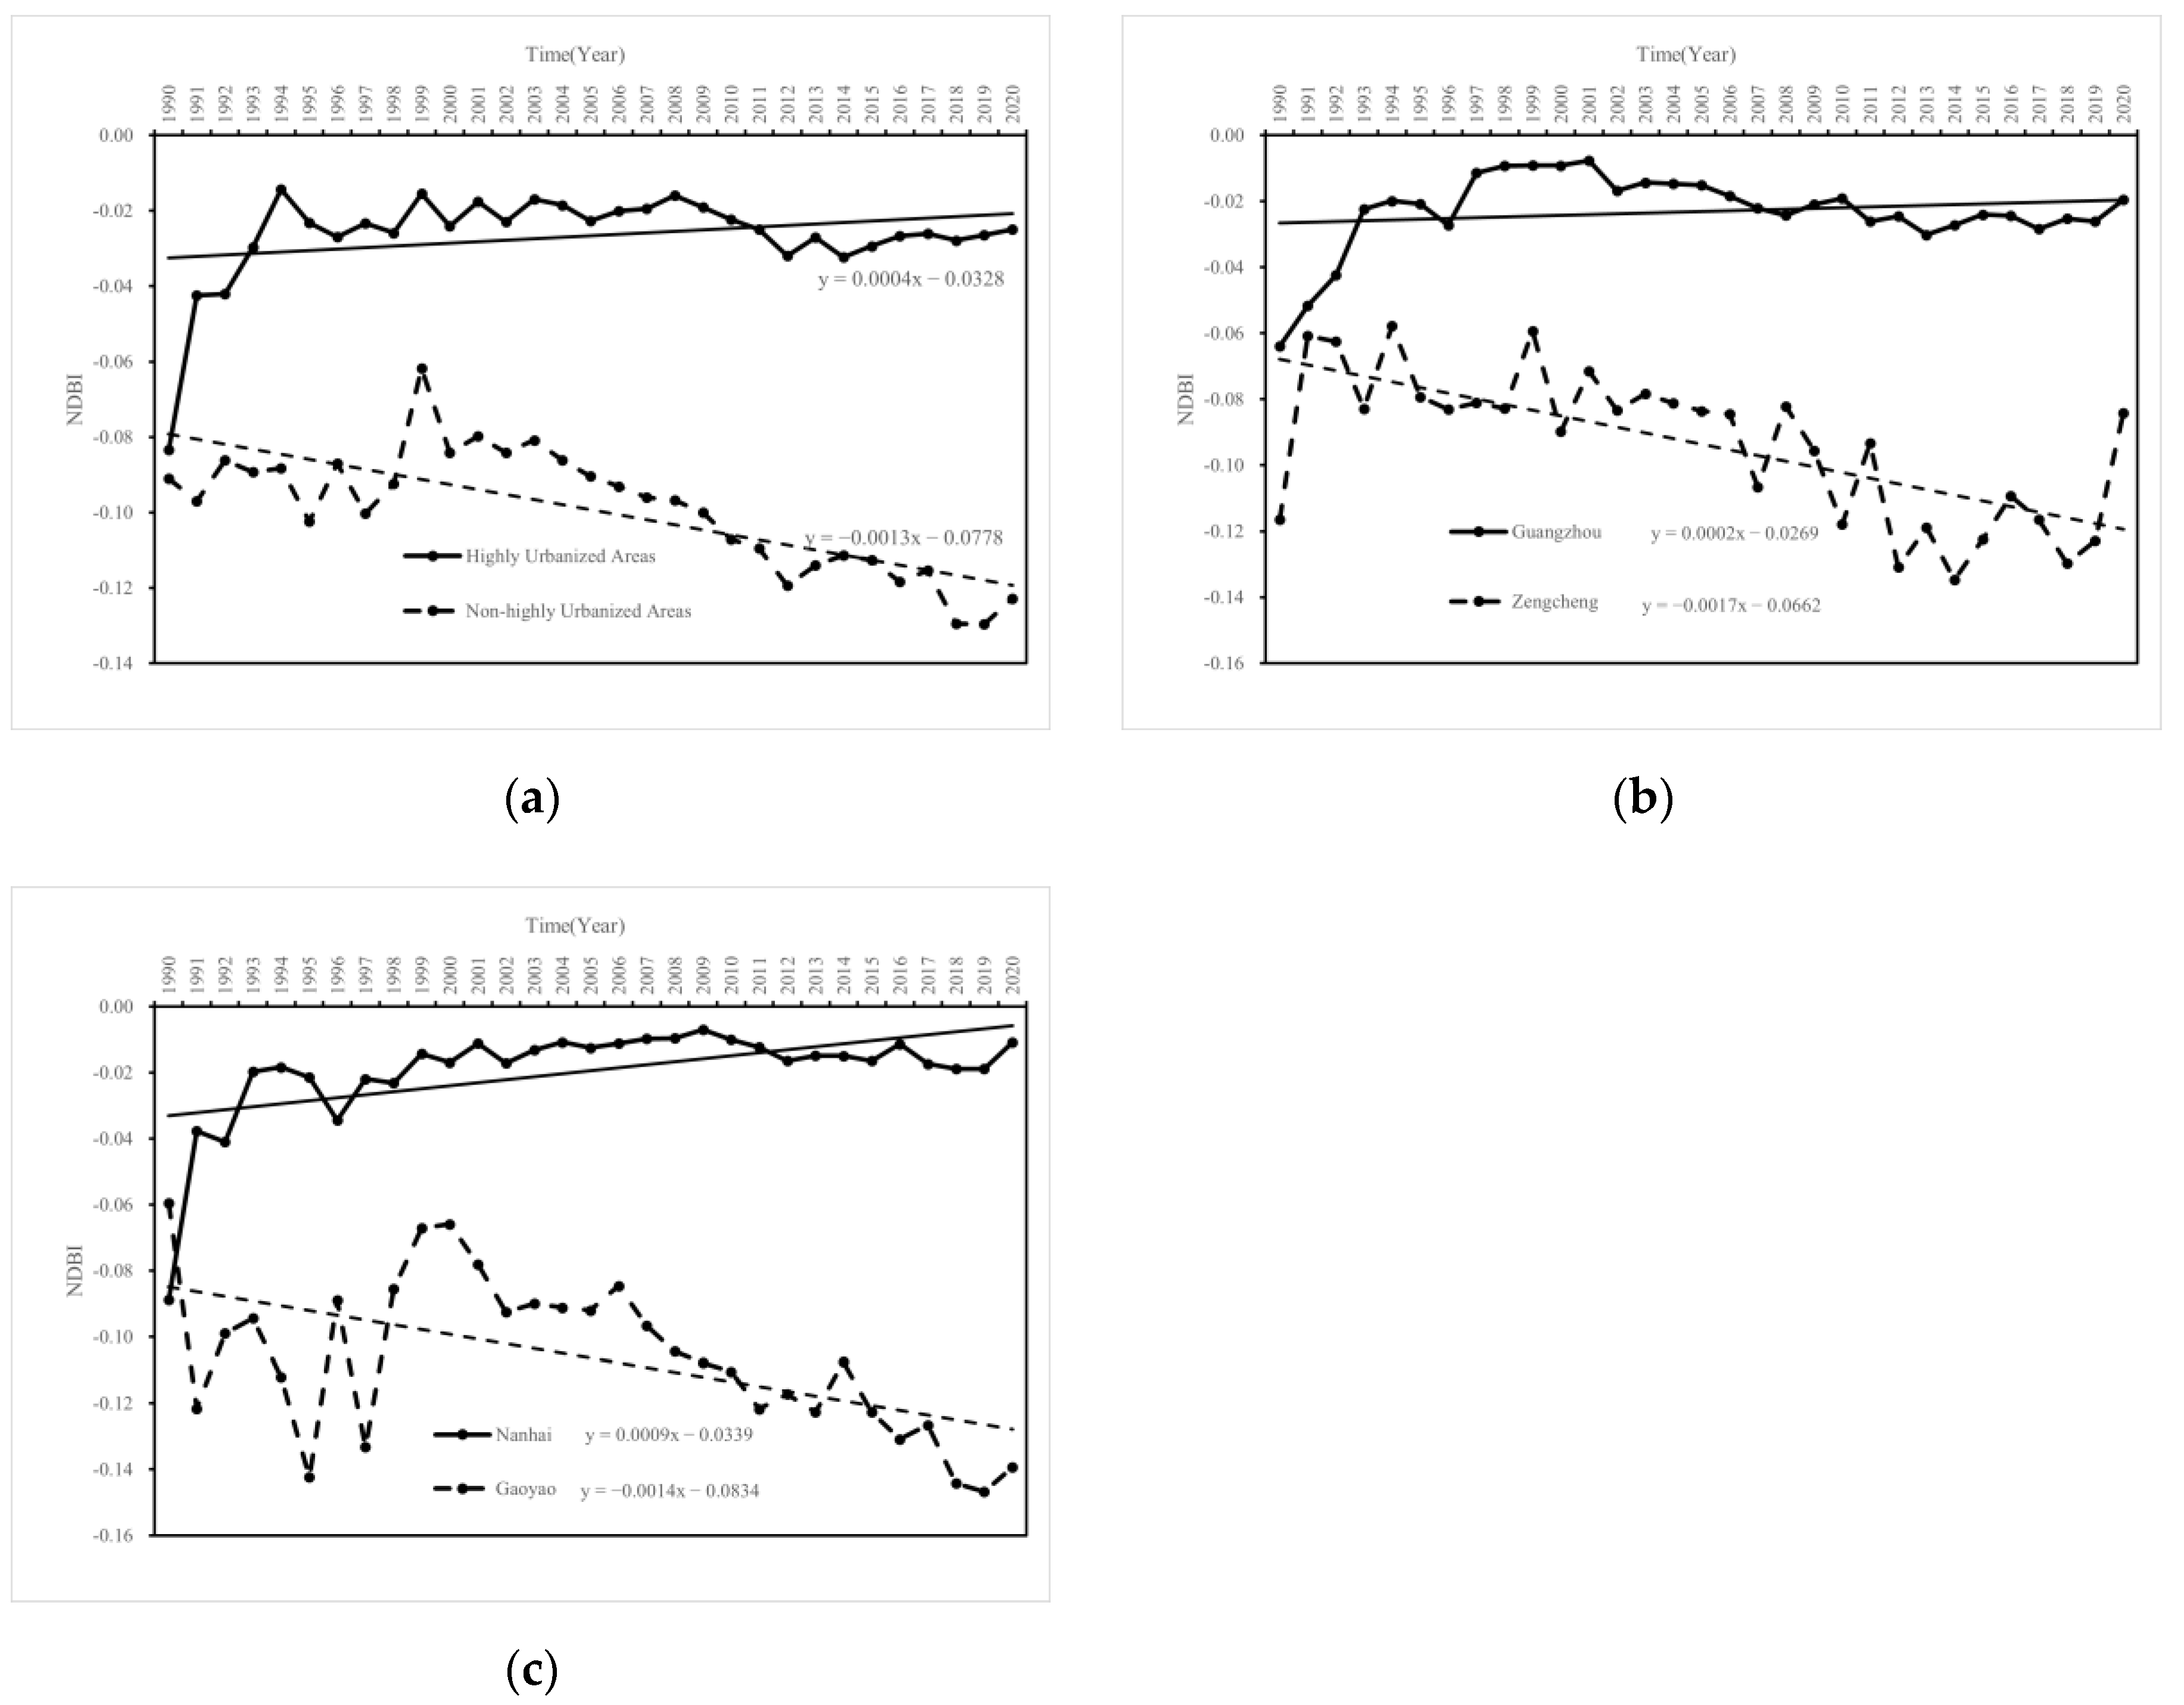
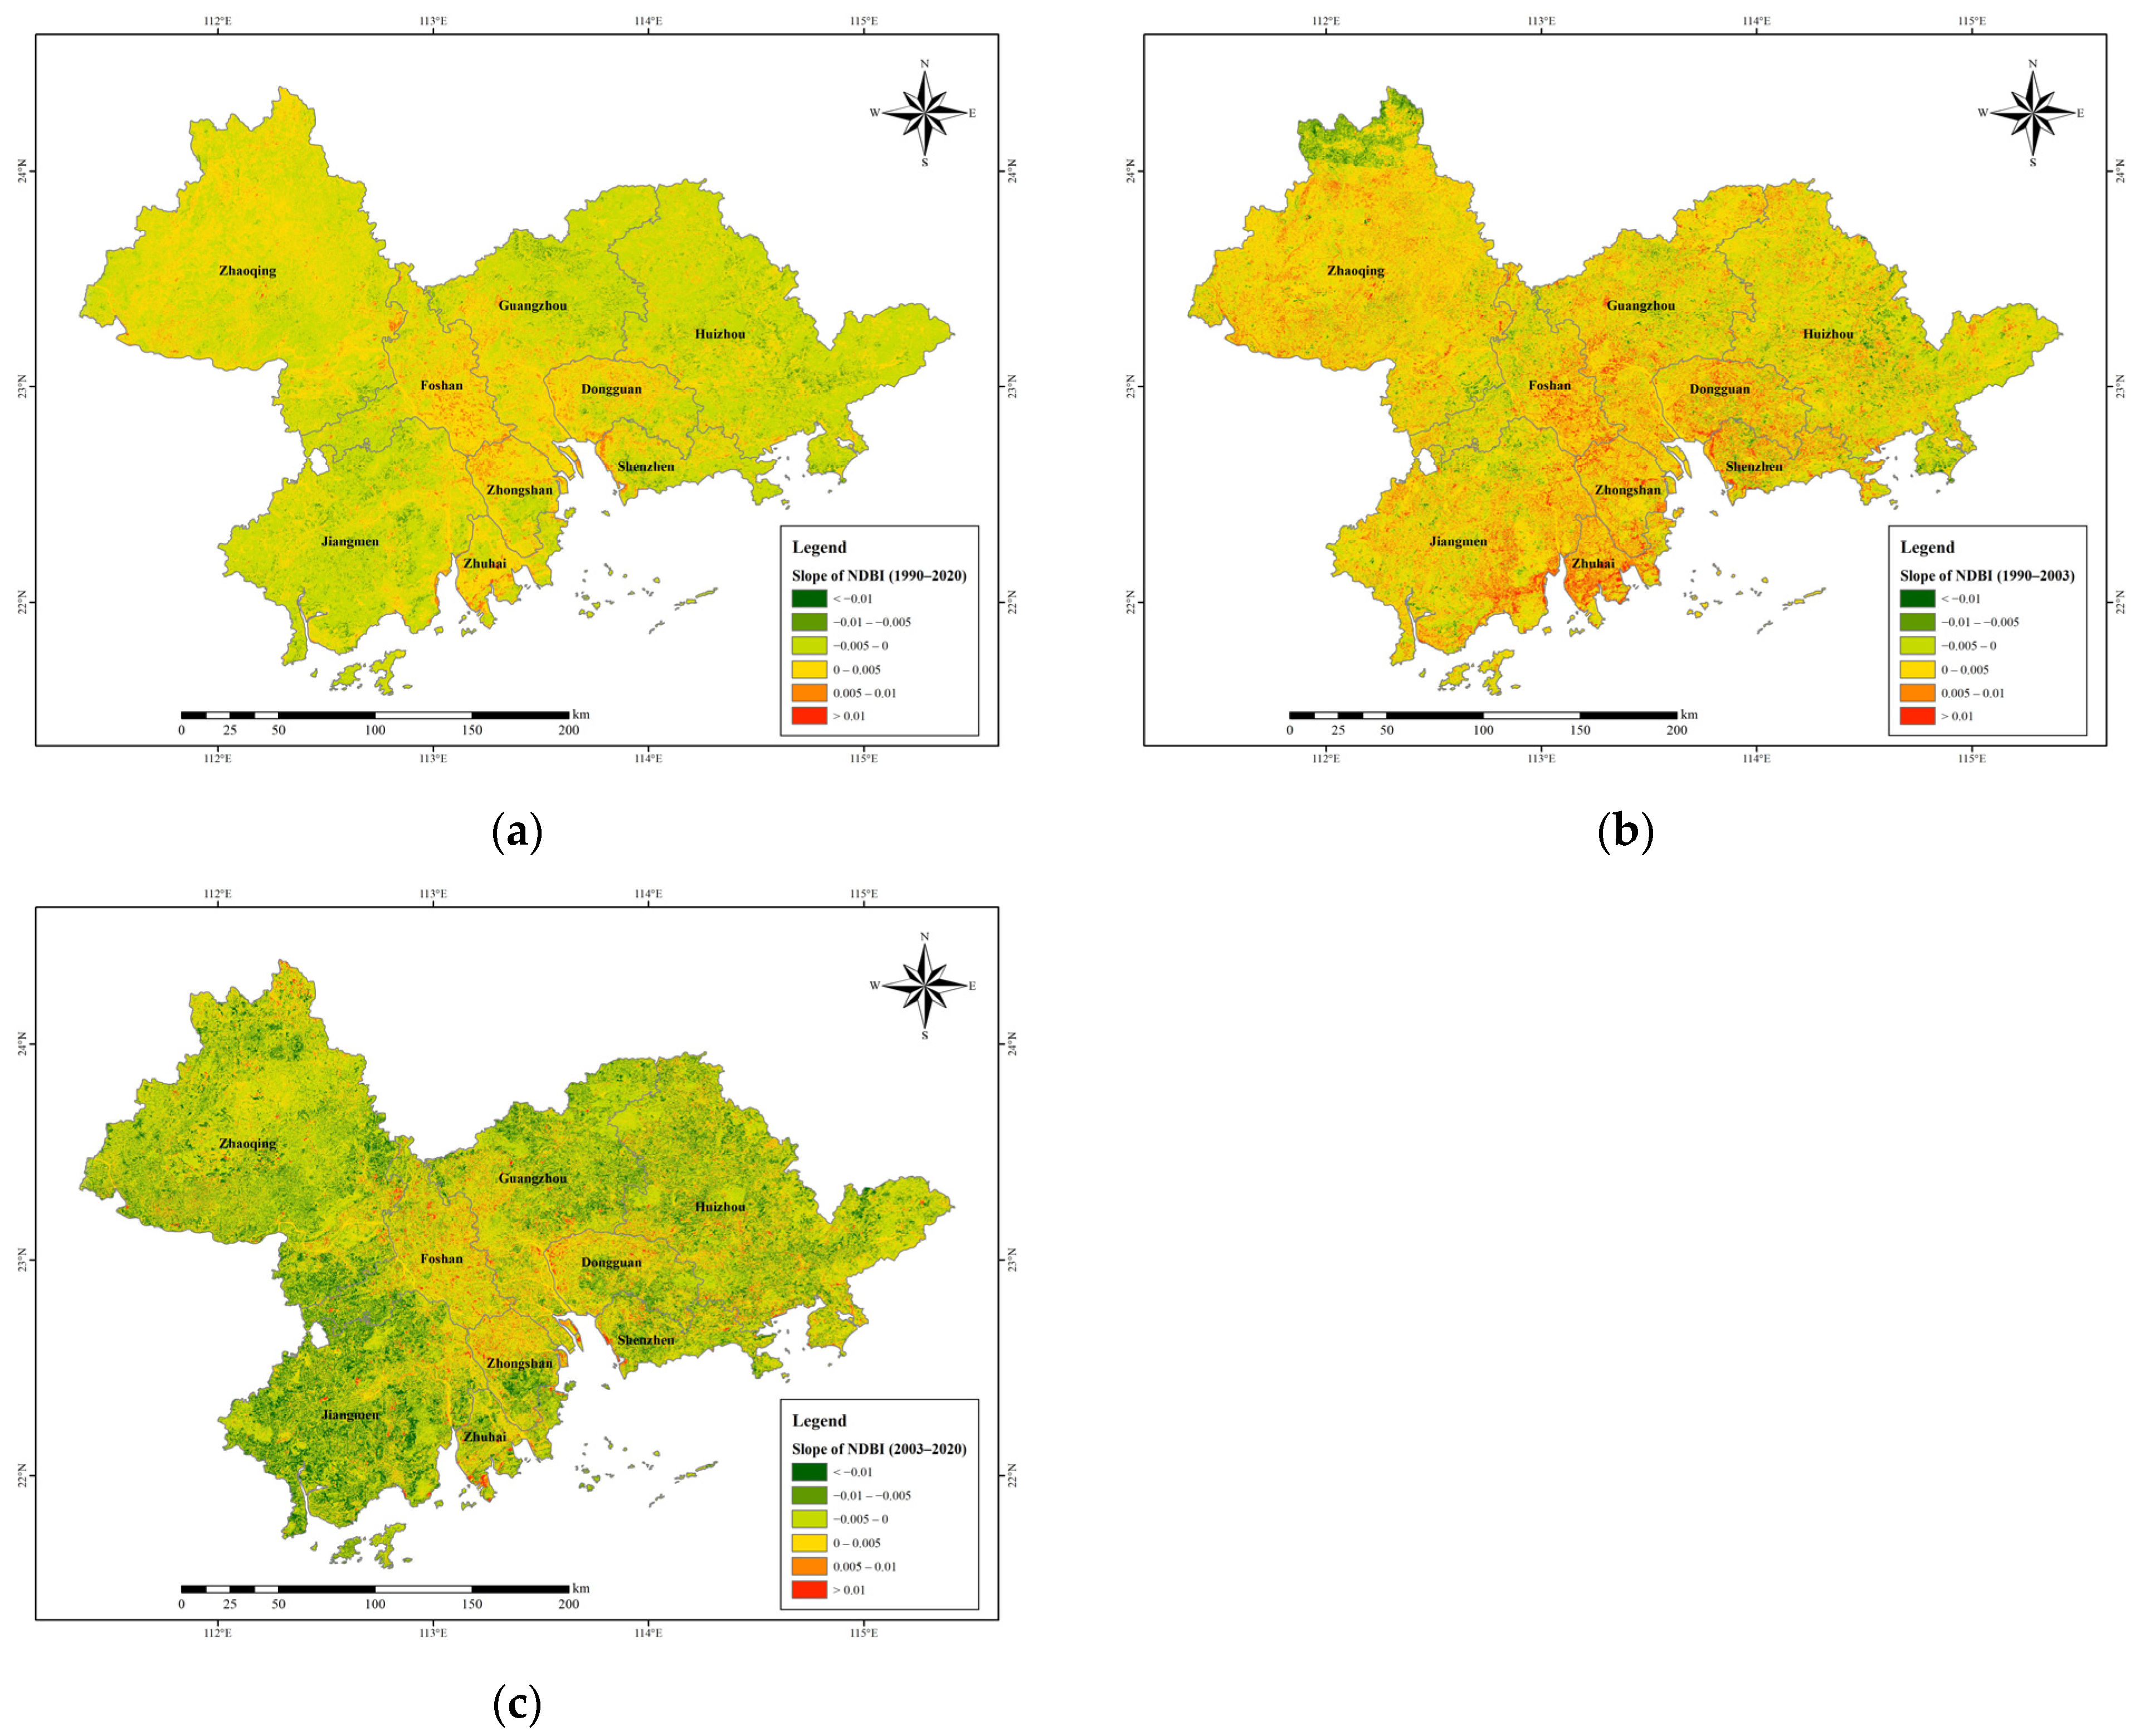
3.1. The Evolution of Urban Underlying Surfaces
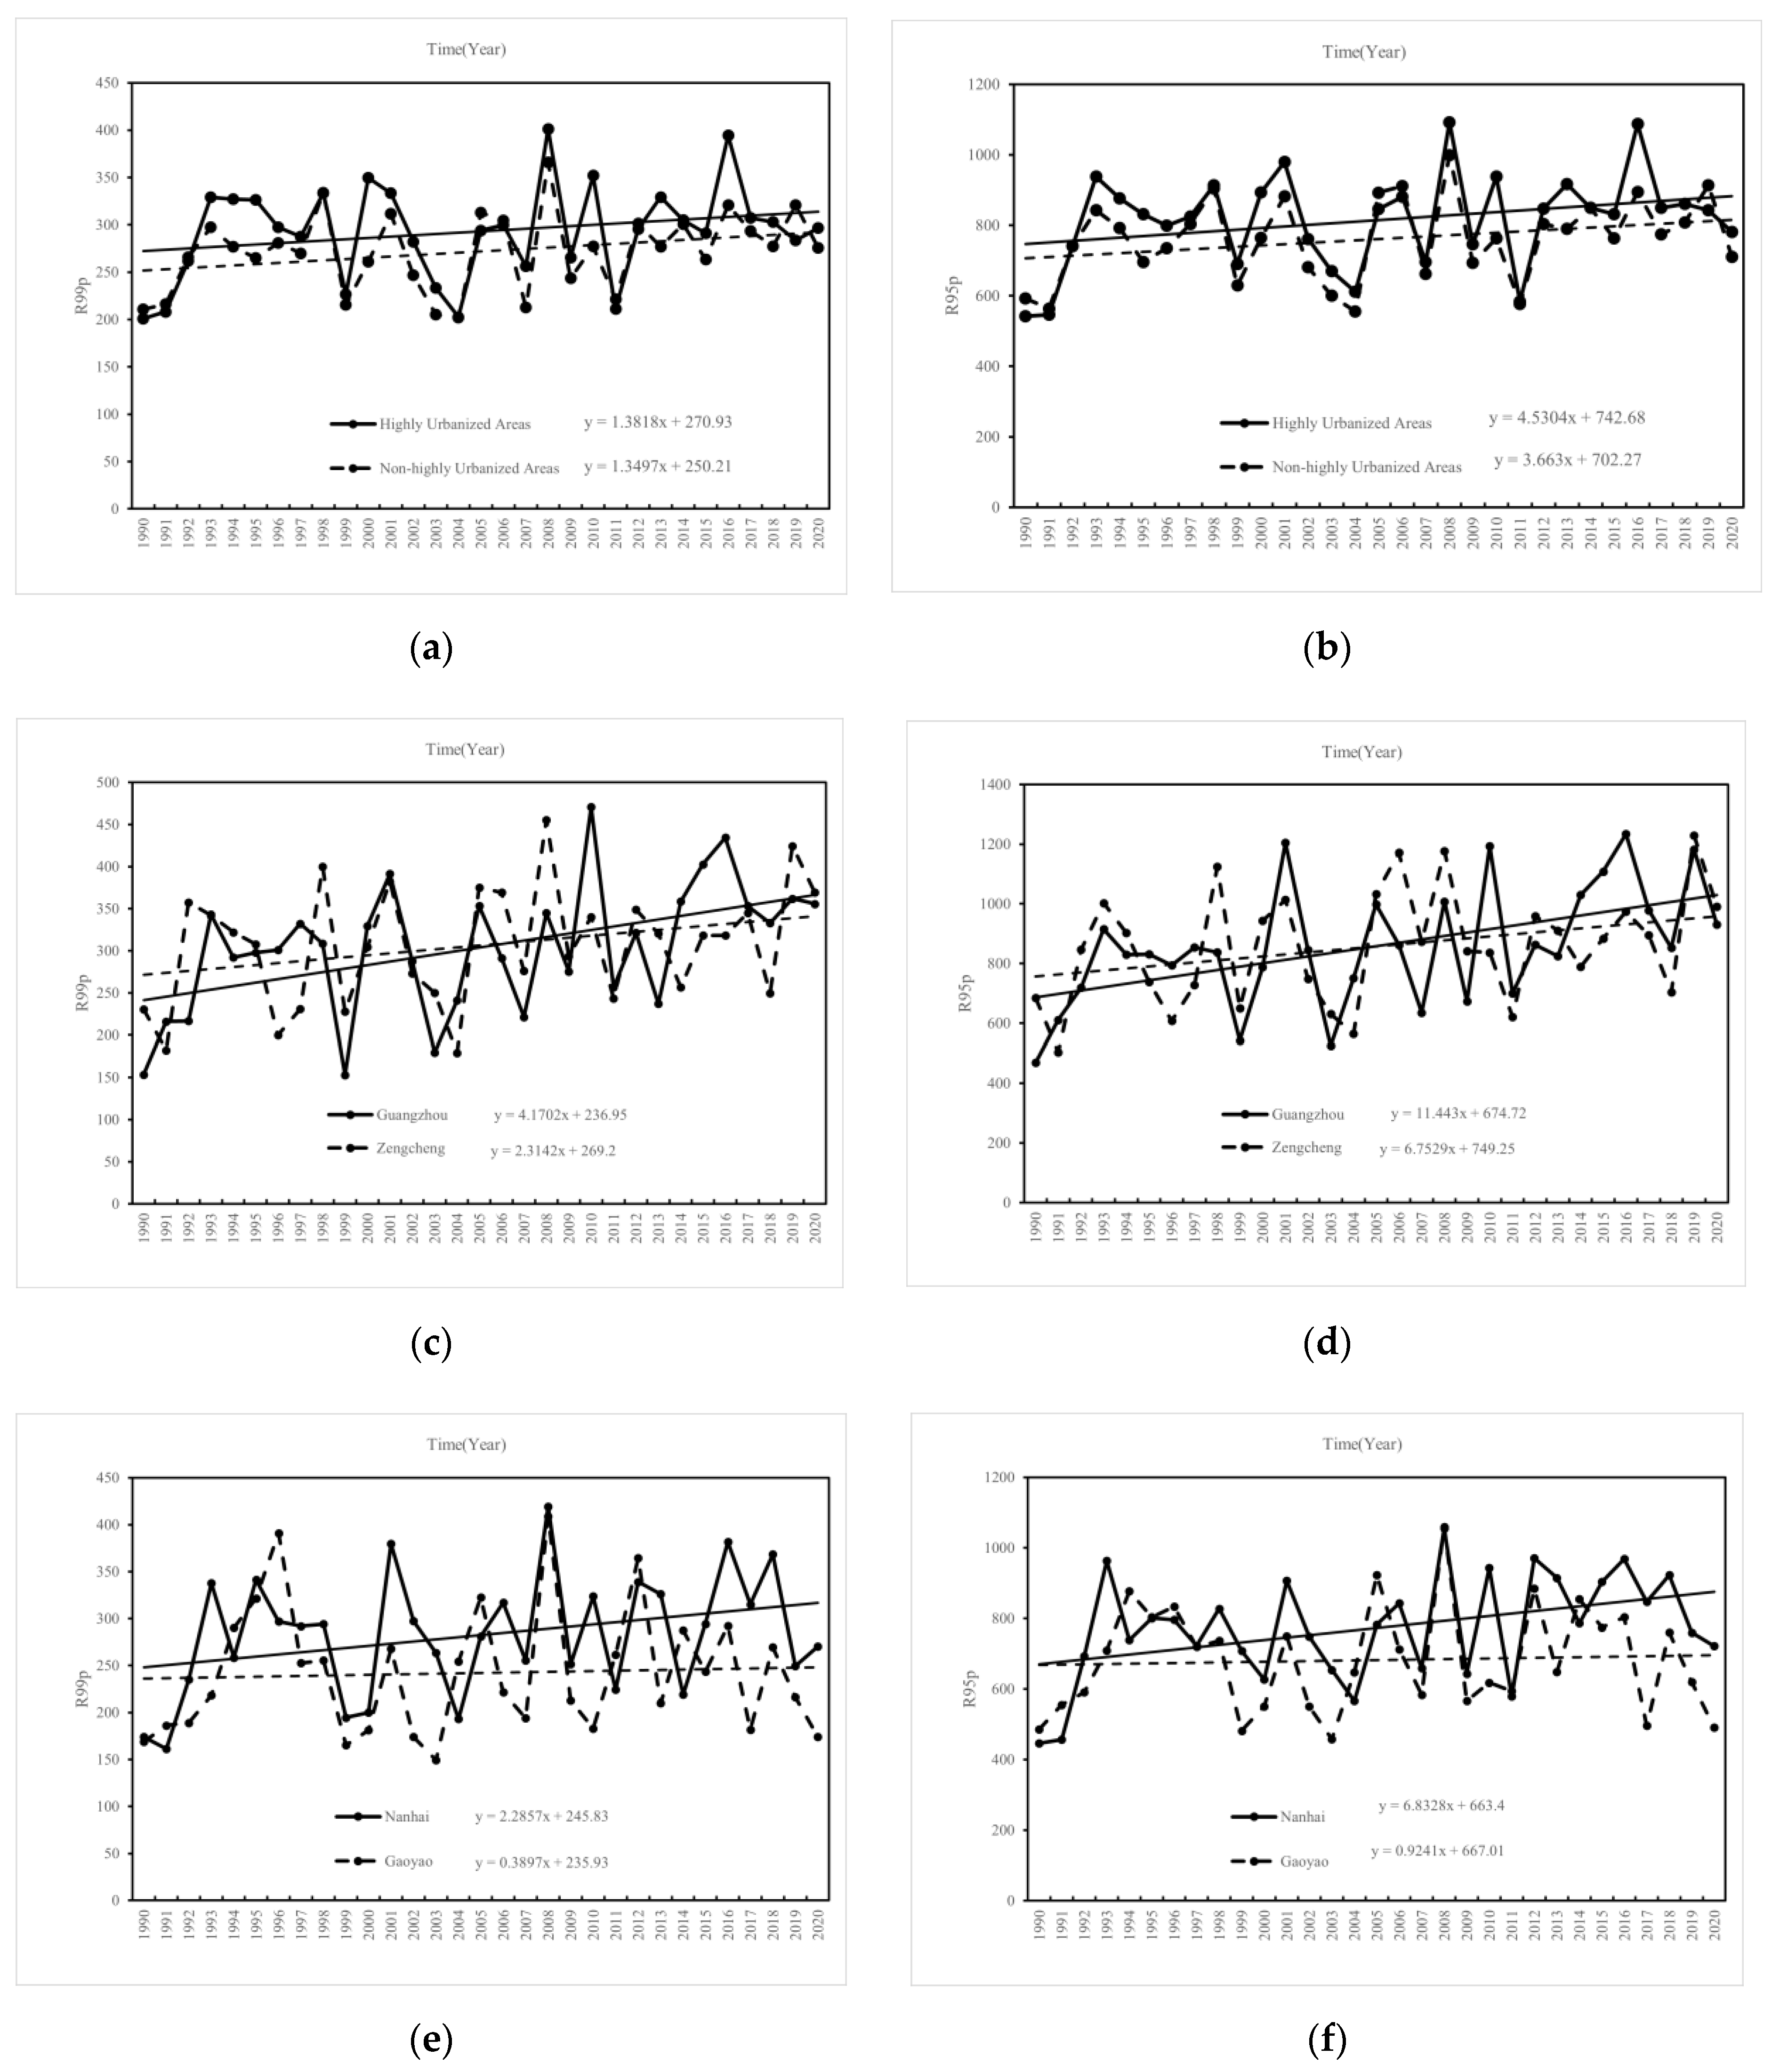
3.2. The Evolution of Extreme Precipitation
3.3. The Relationship between Extreme Precipitation and Underlying Surfaces
4. Discussion
5. Conclusions
- (1)
- From 1990 to 2020, the NDBI in highly urbanized areas in the Pearl River Delta was higher than that in non-highly urbanized areas. The NDBI in highly urbanized areas showed an increasing trend, and the growth rate tended to slow down;
- (2)
- From 1990 to 2020, extreme rainfall in highly urbanized areas of the Pearl River Delta was higher than in non-highly urbanized areas. Extreme rainfall in both highly urbanized areas and non-highly urbanized areas showed an increasing trend, with that in highly urbanized areas increasing faster;
- (3)
- The positive correlation between the NDBI and extreme rainfall indicators in highly urbanized areas is more significant than that in non-highly urbanized areas.
Author Contributions
Funding
Data Availability Statement
Conflicts of Interest
References
- National Bureau of Statistics of China. China Statistical Yearbook 2021; China Statistics Press: Beijing, China, 2021; pp. 97–98.
- Purevdorj, T.S.; Tateishi, R.; Ishiyama, T.; Honda, Y. Relationships between percent vegetation cover and vegetation indices. Int. J. Remote Sens. 1998, 19, 3519–3535. [Google Scholar] [CrossRef]
- Tucker, C.J. Red and photographic infrared linear combinations for monitoring vegetation. Remote Sens. Environ. 1979, 8, 127–150. [Google Scholar] [CrossRef]
- Zha, Y.; Gao, J.; Ni, S. Use of normalized difference built-up index in automatically mapping urban areas from TM imagery. Int. J. Remote Sens. 2003, 24, 583–594. [Google Scholar] [CrossRef]
- Intergovernmental Panel on Climate Change. Climate Change 2013—The Physical Science Basis; Cambridge University Press: Cambridge, UK, 2014. [Google Scholar]
- Min, S.-K.; Zhang, X.; Zwiers, F.W.; Hegerl, G.C. Correction: Corrigendum: Human contribution to more-intense precipitation extremes. Nat. Int. Wkly. J. Sci. 2013, 498, 378–381. [Google Scholar]
- Gao, L.; Huang, J.; Chen, X.; Chen, Y.; Liu, M. Contributions of natural climate changes and human activities to the trend of extreme precipitation. Atmos. Res. 2018, 205, 60–69. [Google Scholar] [CrossRef]
- Donat, M.G.; Lowry, A.L.; Alexander, L.V.; O’Gorman, P.A.; Maher, N. Addendum: More extreme precipitation in the world’s dry and wet regions. Nat. Clim. Chang. 2017, 7, 508–513. [Google Scholar] [CrossRef]
- Jung, I.W.; Bae, D.H.; Kim, G. Recent trends of mean and extreme precipitation in Korea. Int. J. Climatol. 2011, 31, 359–370. [Google Scholar] [CrossRef]
- Karagiannidis, A.F.; Karacostas, T.; Maheras, P.; Makrogiannis, T. Climatological aspects of extreme precipitation in Europe, related to mid-latitude cyclonic systems. Theor. Appl. Climatol. 2012, 107, 165–174. [Google Scholar] [CrossRef]
- Rupa, C.; Mujumdar, P.P. Dependence structure of urban precipitation extremes. Adv. Water Resour. 2018, 121, 206–218. [Google Scholar]
- Horton, R.E. Thunderstorm-breeding spots. Mon. Weather Rev. 1921, 49, 193. [Google Scholar] [CrossRef]
- Changnon, S.A., Jr. METROMEX: An investigation of inadvertent weather modification. Bull. Am. Meteorol. Soc. 1971, 52, 958–968. [Google Scholar] [CrossRef]
- Changnon, S.A. Inadvertent Weather Modification in Urban Areas: Lessons for Global Climate Change. Bull. Am. Meteorol. Soc. 1992, 73, 619–627. [Google Scholar] [CrossRef]
- Shepherd, J.M. A review of the current investigations of urban induced rainfall and recommendations for the future. Earth Interact Actions 2005, 9, 1–27. [Google Scholar] [CrossRef]
- Lowry, W.P. Urban effects on precipitation amount. Prog. Phys. Geogr. 1998, 22, 477–520. [Google Scholar] [CrossRef]
- Shepherd, J.M.; Carter, M. The Impact of Urbanization on Current and Future Coastal Precipitation: A Case Study for Houston. Environ. Plan. B Plan. Des. 2010, 37, 284–304. [Google Scholar] [CrossRef]
- Subhanil, G.; Himanshu, G.; Neetu, G.; Anindita, D. A long-term seasonal analysis on the relationship between LST and NDBI using Landsat data. Quat. Int. 2020, prepublish. [Google Scholar]
- Xu, Q.; Gao, Q.; Hu, J.; Hu, X. Homogeneity Test and Analysis of Meteorological Data before and after Qianjiang Station Moving. Plateau Meteorol. 2011, 30, 1709–1715. [Google Scholar]
- Zou, S.; Abuduwaili, J.; Duan, W.; Ding, J.; De Maeyer, P.; Van De Voorde, T.; Ma, L. Attribution of changes in the trend and temporal non-uniformity of extreme precipitation events in Central Asia. Sci. Rep. 2021, 11, 1. [Google Scholar] [CrossRef]
- Ren, G. Urbanization as a major driver of urban climate change. Adv. Clim. Change Res. 2015, 6, 1–6. [Google Scholar] [CrossRef]
- Ding, Y. Climate change and urbanization effects on extreme rainstorms in Chinese mega-cities. China Food Drought Manag. 2018, 28, 1–2. [Google Scholar]
- Liu, J.; Luo, Z.; Zhang, Y.; Zhou, J.; Shao, W. Influence of urbanization on spatial distribution of extreme precipitation in Henan Province. Water Resour. Prot. 2022, 38, 6. [Google Scholar]
- Wei, F. Modern Climate Statistical Diagnosis and Prediction Technology; China Meteorological Press: Beijing, China, 2007.
- Zhao, N.; Jiao, Y.; Ma, T.; Zhao, M.; Fan, Z.; Yin, X.; Liu, Y.; Yue, T. Estimating the effect of urbanization on extreme climate events in the Beijing-Tianjin-Hebei region, China. Sci. Total Environ. 2019, 688, 1005–1015. [Google Scholar] [CrossRef]
- Miao, Z.; Li, N.; Lu, M.; Xu, L. Variation characteristics of extreme precipitation event in Beijing-Tianjin-Hebei region during 1961–2017. Water Resour. Hydropower Eng. 2019, 50, 34–44. [Google Scholar]
- Ren, G.; Liu, Y.; Sun, X.; Zhang, L.; Ren, Y.; Zhang, H.; Zhan, Y.; Wang, T.; Guo, Y.; Chen, Y.; et al. Spatial and temporal patterns of precipitation variability over mainland China: III: Causes for recent trends. Adv. Water Resour. 2016, 27, 327–348. [Google Scholar] [CrossRef]
- Zhou, B.; Shi, J.; Li, S.; Chen, T.; Ma, L. Spatio-temporal variations of extreme precipitation in the Yangtze River Delta during 1960–2012. J. Yangtze River Sci. Res. Inst. 2016, 33, 5–9. [Google Scholar]
- Gu, X.; Zhang, Q.; Chen, X. The spatiotemporal rates of heavy precipitation occurrence at difference scales in China. J. Hydraul. Eng. 2017, 48, 505–515. [Google Scholar]
- Kakavand, A.; Nikakhtar, S.; Sardaripour, M. Prediction of internet addiction, based on perceived social support, loneliness and social phobia. J. Sch. Psychol. 2017, 6, 81–98. [Google Scholar]
- Kafy, A.-A.; Dey, N.N.; Al Rakib, A.; Rahaman, Z.A.; Nasher, N.R.; Bhatt, A. Modeling the relationship between land use/land cover and land surface temperature in Dhaka Bangladesh Using CA-ANN Algorithm. Environ. Chall. 2021, 4, 100190. [Google Scholar] [CrossRef]
- Tang, C.; Chen, T.; Cai, B.; Yu, K. Process of the annual mean surface air temperature of Guangzhou (Tianhe) over the last 100 years. Trop. Geogr. 2014, 6, 729–736. [Google Scholar]
- Changnon, S.A., Jr. Urban effects on severe local storms at St Louis. J. Appl. Meteorol. 1978, 17, 578–586. [Google Scholar] [CrossRef]

| Station Number | Longitude/ Decimal Degree | Latitude/ Decimal Degree | Altitude/m | Station Name | Time Series |
|---|---|---|---|---|---|
| 59271 | 112.43 | 23.63 | 57.3 | Guangning | 1990–2020 |
| 59278 | 112.45 | 23.03 | 41 | Gaoyao | 1990–2020 |
| 59287 | 113.48 | 23.22 | 41 | Guangzhou | 1990–2020 |
| 59288 | 113.12 | 23.03 | 3.1 | Nanhai | 1990–2020 |
| 59289 | 113.73 | 22.97 | 19.8 | Dongguan | 1990–2020 |
| 59294 | 113.83 | 23.33 | 38.9 | Zengcheng | 1990–2020 |
| 59298 | 114.37 | 23.07 | 22.4 | Huiyang | 1990–2020 |
| 59478 | 112.78 | 22.25 | 32.7 | Taishan | 1990–2020 |
| 59480 | 113.25 | 22.85 | 21.4 | Shunde | 1990–2020 |
| 59485 | 113.40 | 22.50 | 2.1 | Zhongshan | 1990–2020 |
| 59488 | 113.57 | 22.28 | 54 | Zhuhai | 1990–2020 |
| 59493 | 114.00 | 22.53 | 18.2 | Shenzhen | 1990–2020 |
| Satellite | Bands | Wavelength/μm | GEE Data Set |
|---|---|---|---|
| Landsat 5 (TM) | NIR: B4 | 0.76–0.90 | C01/T1_SR |
| SWIR1: B5 | 1.55–1.75 | C01/T1_SR | |
| Landsat 7 (ETM+) | NIR: B4 | 0.76–0.90 | C01/T1_SR |
| SWIR1: B5 | 1.55–1.75 | C01/T1_SR |
| City | Slope | ||
|---|---|---|---|
| Non-Highly Urbanized Areas | Guangning | −0.0011 * | −0.0014 * |
| Gaoyao | −0.0022 * | ||
| Zengcheng | −0.0020 * | ||
| Huiyang | −0.0012 * | ||
| Taishan | −0.0016 * | ||
| Highly Urbanized Areas | Guangzhou | −0.0002 | 0.0000 |
| Shenzhen | −0.0004 | ||
| Dongguan | 0.0010 ** | ||
| Zhongshan | 0.0001 | ||
| Zhuhai | 0.0016 ** | ||
| Nanhai | 0.0004 ** | ||
| Shunde | 0.0006 * | ||
| Slope | R99p | R95p | Annual Precipitation | ||||
|---|---|---|---|---|---|---|---|
| Non-Highly Urbanized Areas | Guangning | 1.22 | 1.27 | 3.8 | 3.84 | 7.44 | 9.37 |
| Gaoyao | 0.48 | 1.18 | 2.66 | ||||
| Zengcheng | 2.42 | 6.87 | 16.44 | ||||
| Huiyang | 2.92 * | 7.15 * | 11.23 | ||||
| Taishan | 0.37 | 1.45 | −0.94 | ||||
| Highly Urbanized Areas | Guangzhou | 3.97 ** | 0.95 | 11.27 ** | 2.75 | 22.88 ** | 7.44 |
| Shenzhen | −0.2 | −1.18 | −4.67 | ||||
| Dongguan | 2.26 * | 6.60 * | 11.92 | ||||
| Zhongshan | 0.29 | 2.57 | 7.85 | ||||
| Zhuhai | −1.88 | −3.77 | −4.17 | ||||
| Nanhai | 2.44 | 6.26 | 14.26 * | ||||
| Shunde | 1.7 | 4.92 | 9.38 | ||||
| Pearson’s Correlation Coefficients | R99p | R95p | Annual Precipitation | |
|---|---|---|---|---|
| Non-Highly Urbanized Areas | Guangning | −0.110 | −0.047 | −0.005 |
| Gaoyao | −0.184 | −0.172 | −0.174 | |
| Zengcheng | −0.088 | −0.161 | −0.247 | |
| Huiyang | −0.415 * | −0.227 | −0.064 | |
| Taishan | −0.123 | −0.190 | −0.123 | |
| Highly Urbanized Areas | Guangzhou | 0.334 | 0.293 | 0.293 |
| Shenzhen | 0.262 | 0.416 * | 0.447 * | |
| Dongguan | 0.352 | 0.418 * | 0.358 * | |
| Zhongshan | 0.206 | 0.186 | 0.232 | |
| Zhuhai | 0.332 | 0.288 | 0.259 | |
| Nanhai | 0.391 * | 0.457 ** | 0.4 * | |
| Shunde | 0.361 * | 0.428 * | 0.373 * | |
Disclaimer/Publisher’s Note: The statements, opinions and data contained in all publications are solely those of the individual author(s) and contributor(s) and not of MDPI and/or the editor(s). MDPI and/or the editor(s) disclaim responsibility for any injury to people or property resulting from any ideas, methods, instructions or products referred to in the content. |
© 2024 by the authors. Licensee MDPI, Basel, Switzerland. This article is an open access article distributed under the terms and conditions of the Creative Commons Attribution (CC BY) license (https://creativecommons.org/licenses/by/4.0/).
Share and Cite
Xu, T.; Yang, Z.; Gao, X.; Zhou, J. A Study on the Evolution of Urban Underlying Surfaces and Extreme Rainfall in the Pearl River Delta. Water 2024, 16, 267. https://doi.org/10.3390/w16020267
Xu T, Yang Z, Gao X, Zhou J. A Study on the Evolution of Urban Underlying Surfaces and Extreme Rainfall in the Pearl River Delta. Water. 2024; 16(2):267. https://doi.org/10.3390/w16020267
Chicago/Turabian StyleXu, Tianyin, Zhiyong Yang, Xichao Gao, and Jinjun Zhou. 2024. "A Study on the Evolution of Urban Underlying Surfaces and Extreme Rainfall in the Pearl River Delta" Water 16, no. 2: 267. https://doi.org/10.3390/w16020267
APA StyleXu, T., Yang, Z., Gao, X., & Zhou, J. (2024). A Study on the Evolution of Urban Underlying Surfaces and Extreme Rainfall in the Pearl River Delta. Water, 16(2), 267. https://doi.org/10.3390/w16020267