Article

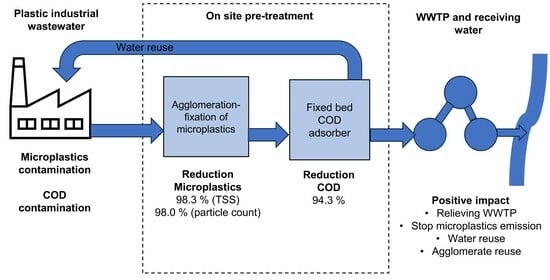
Beyond Microplastics: Implementation of a Two-Stage Removal Process for Microplastics and Chemical Oxygen Demand in Industrial Wastewater Streams

1
Wasser 3.0 gGmbH, Neufeldstr. 17a-19a, 76187 Karlsruhe, Germany
2
abcr GmbH, Im Schlehert 10, 76187 Karlsruhe, Germany
*
Author to whom correspondence should be addressed.
Water 2024, 16(2), 268; https://doi.org/10.3390/w16020268
Submission received: 8 December 2023 / Revised: 28 December 2023 / Accepted: 5 January 2024 / Published: 12 January 2024

Abstract

:
Wastewater from plastic manufacturing or processing industries is often highly polluted with microplastics (MPs) and high levels of oxidizable organic matter, which results in a high chemical oxygen demand (COD). When industrial wastewater enters wastewater streams, the high microplastic load is a high burden for municipal wastewater treatment plants (WWTPs), as they are not sufficiently removed. To prevent MP from entering the WWTPs, an upstream prevention method is essential. This paper presents a pilot-scale plant study for the removal of MP and COD from industrial wastewater that was tested on-site at a plastic manufacturer in Germany. Eight test phases were performed over 3 months, with each test phase processing 1 m3 wastewater and four treatments. Per test phase, 12 samples were analyzed for 5 parameters: COD, total suspended solids (TSSs), particle count, pH, and turbidity. The results showed an average decrease in MP by 98.26 ± 2.15% measured by TSSs and 97.92 ± 2.31% measured by particle count. This prevents the emission of 1.1 kg MP/m3 water and an estimated 2.7 t MP/year. The COD was reduced efficiently by 94.3 ± 8.9%. Besides MP and COD, this treatment allows reuse of water and agglomerates, resulting in a reduction in the CO2 footprint.

Graphical Abstract

1. Introduction

Clean fresh water is the basis for all life on earth. It is necessary for drinking and sanitation, irrigating crops, for livestock, industry, and providing functional and resilient ecosystems [1]. The demand for water grows along with the increase in human population, while at the same time, climate change and human activity are affecting the natural water cycles, pushing freshwater resources to their limits or beyond [2]. To make water usage sustainable and relieve the stress on freshwater resources, circular water economy and appropriate wastewater treatment are essential [3,4,5,6]. The European Union wants to support this goal with the Water Framework Directive and Urban Wastewater Treatment Directive, which have the goal of restoring and maintaining the good condition of rivers, lakes, and groundwater and prevent detrimental environmental impacts from urban wastewater discharges within Europe [7,8].
Modern municipal wastewater treatment plants (WWTPs) are designed to effectively remove organic contaminants from wastewaters, and if equipped with an additional treatment stage, phosphorus, which is the main driver of eutrophication of water bodies [9]. Additional contaminants, such as organic and inorganic micropollutants and microplastics, cannot be sufficiently removed from the sewage treatment plants and pose a major challenge to the protection of our aquatic ecosystems [6,10,11,12]. It is therefore essential to avoid the input of such substances into the wastewater stream by targeting their removal from point sources such as industrial wastewaters [6,13,14]. Preventing the entry of pollutants upstream at the source is always more effective, involves lower costs than removing them downstream, and ensures that the polluter bears the costs instead of the public [15,16].
In Germany, the discharge of industrial wastewaters is regulated by the German Federal Water Act and Wastewater Directive [8,17,18]. Requirements for the quality of the wastewater to be discharged vary among industries and are outlined in the Wastewater Directive, based on the Best Available Techniques reference documents from the Joint Research Centre of the European Commission [18]. A distinction is made between direct discharges, where wastewater is released directly into the environment, and indirect discharges, where wastewater is released into the municipal sewer network and ultimately to the municipal WWTP [19]. For indirect discharges, there are additional municipal requirements and costs for the discharge of wastewater into the sewer network. If limit values cannot be adhered to, the wastewater must be pretreated on-site. However, restrictions on microplastics are not provided in these regulations; the only relevant restriction is on the total suspended solids [17]. It is currently the responsibility of the companies themselves to prevent the release of microplastics.
It is assumed that sewage treatment plants remove 80–99% of microplastics from wastewater [10,20,21,22,23]. Numerous studies show increased microplastic contamination after wastewater treatment plant discharge points in the aquatic environment, making them important point sources of microplastics into the environment. This is due to the high volumes of wastewater released and the extreme microplastic contamination in the inflowing wastewater, which means that even with a removal rate of up to 99%, the treated wastewater is still significantly contaminated. Microplastics released in natural water bodies can be transferred over the water cycle into drinking water and tap water [24]. Further, microplastic removal does not lead to a degradation of the microplastics: the majority of them end up in sewage sludge, whereby the problem is only displaced [25]. This is particularly problematic when sewage sludge is applied to fields as fertilizer and transferring the microplastics to terrestrial environments [26]. In Germany, the application of sludge as fertilizer is often prohibited in order to prevent the transfer of pollutants, e.g., heavy metals, micropollutants, microplastics, and nanoparticles, that are in the sewage sludge to the fields [27]. Instead, the sludge is thermally utilized in combustion systems.
Various commonly applied methods for particle removal have been tested for the separation of microplastics from wastewater, but due to various drawbacks, such as high operation costs, maintenance requirements, and a limited adaptably to microplastics, their application is limited and they do not cover the whole mixture of different polymer pollution.
One method that is often discussed is sand filtration, which shows varying effectiveness among different studies, ranging from 39.5% to 99.9% [28,29,30,31,32]. Some shortcomings of sand filtration include the fact that small microplastics can pass through the sand filter [33], the backwash water and sand must be disposed of when replaced, as well as large space requirements, and if the system cannot be integrated into the hydraulic gradient of the water treatment system, additional energy requirements [34,35].
Membrane filtration is also often discussed, as it can remove particles and microplastics efficiently from waters. The primary drawback of the method is that the small pores required to remove small microplastics more efficiently increase energy consumption and make the process more prone to malfunction [33]. Membrane scaling and fouling also increase the energy demand and are associated with high maintenance requirements, and microplastics are suspected to increase fouling due to their interaction with the membranes [33,34,36]. To avoid scaling, anti-scaling agents need to be applied, and the cleaning of the membrane uses aggressive chemicals that are costly to dispose of [37]. The potential release of microplastics due to membrane abrasion has also been discussed [34].
Methods to increase particle size and thus make it easier to remove the particles from the water are flocculation and coagulation, leading to a more efficient removal, lower energy demands, and lower operational and maintenance costs, making them more sustainable and easy-to-apply methods [28,38]. The main challenge in microplastic flocculation and coagulation is the varying surface properties of the countless plastic and polymer types [38,39]. As the interaction between the microplastic surface and the coagulant or flocculant is essential for the effectiveness of the process, finding the appropriate coagulants and flocculants is challenging. Further, microplastic surface properties can change due to the adsorption of dissolved substances or chemical transformations of the plastics’ surface [40]. The chemical composition of the water, dissolved substances, ions, and the pH all have a strong influence on flocculation and coagulation [38,39]. Thus, results for the removal of microplastics from waters using flocculation and coagulation vary significantly, ranging from less than 10% to over 99% [38,40,41,42].
Due to the various drawbacks and shortcomings of using common particle removal methods for microplastic removal, numerous novel approaches to remove microplastics from wastewater have been developed, most of which have only been tested at the laboratory scale and hardly applicable on a larger scale [28,39,42]. Examples include magnetic separation or the application of metal organic frameworks (MOFs) [43,44].
This study presents the application of a novel pilot plant for the removal of microplastics and the chemical oxygen demand (COD) from the wastewater of an industrial plastics processor. The aim of the feasibility study is to quantify and evaluate the efficiency of the pilot system for microplastic and COD removal from highly contaminated industrial wastewater. The overall goal is to prevent microplastics from entering the wastewater system and reduce the COD load, thereby enabling an easier and more efficient treatment of the wastewater by the municipal wastewater treatment plant before being released into the natural water cycle. This reduces treatment costs and creates a positive environmental impact.
The microplastic removal is based on the physicochemical agglomeration fixation of microplastics from waters by organosilanes [45,46,47,48,49]. This method has previously been examined at the laboratory scale, where it yielded highly efficient removal, and has also been demonstrated in a pilot study using municipal wastewater [45,46,47,48,49]. The COD removal is carried out via a fixed bed reactor filled with absorbent materials for COD and trace substance reduction. The pilot-scale plant is operated at a mid-sized plastic processor in Germany. It is operated as a semi-automated process. Over a period of three months, eight test phases were performed and analyzed.

2. Materials and Methods
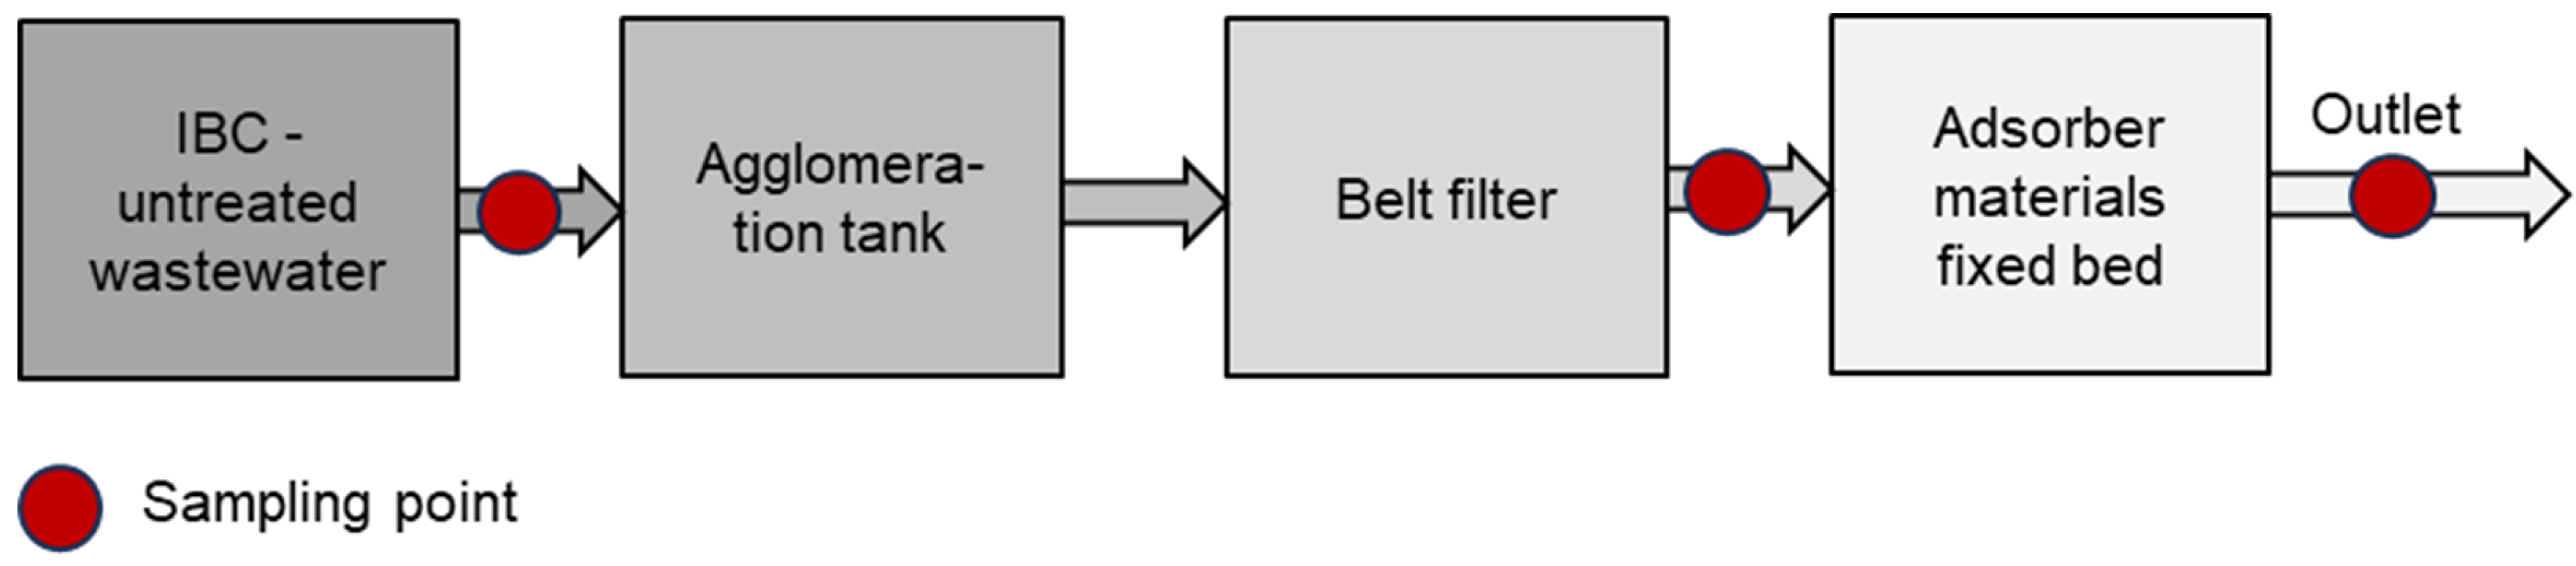
2.1. Pilot Plant

The Wasser 3.0 PE-X® technology is an additional (waste)water treatment unit for the removal of microplastics and a reduction in COD (Figure 1). The system consists of a 250 L stainless steel tank with a mechanical stirrer, in which agglomeration–fixation of the particles takes place. After filling the tank with water, the localization process is started, forming a vortex. In this vortex, a 200 mL agglomeration reagent (Wasser 3.0 PE-X®, AB930003, abcr GmbH, Karlsruhe, Germany) is added by a dosing pump and the agglomeration–fixation process takes place.
In the second step, the separation unit, consisting of a belt filter with a filter fleece (FIV12-1067, Leiblein GmbH, Hardheim, Germany, material: polyester, pore size: 70–80 μm), removes the formed microplastic agglomerates from the water.
For the COD reduction, the filtered wastewater is then pumped through a 250 L fixed bed reactor containing 175 L granulated activated carbon (GAC) (AquaSorb™ 2000 by Jacobi Carbons, Premnitz, Germany) with a contact time of 10 min. The goal is to reduce the COD below 1000 mg/L to comply with municipal and federal regulations for the discharge of wastewater and to avoid additional wastewater fees [8,18,19].
The pilot plant is operated on-site at a full-service provider for pure grinding and refinement of polymer-based products.

2.2. Test Phases and Sampling

The pilot-scale plant is operated as semicontinuously. This combines the flexibility of batch systems with the benefits of an automatic transport system. Each test phase of 1 m3 consists of four batches of 250 L, which are processed in a fully automated manner. For each batch, samples were taken at three different sampling locations (Figure 1): 1st—untreated wastewater, 2nd—after the belt filter, and 3rd—after the fixed bed reactor. Thus, per 1 m3 test phase, for each of the four batches, three samples were taken, which results in a total of 12 samples per test phase. The samples were stored at 5 °C and sent via cooled express shipping to the Wasser 3.0 gGmbH laboratories, where the analyses were performed.

2.3. Analyses

The analyses of the samples included measurements of pH value, COD (DIN ISO 15705-H45), particle count, total suspended solids (TSSs, DIN 38 409-H2-2), and turbidity (DIN EN ISO 7027).

2.3.1. pH Value

The pH value of the samples was measured using the table pH meter pH 50 VioLab Set (Dostmann electronic GmbH, Wertheim-Reicholzheim, Germany).

2.3.2. Chemical Oxygen Demand (COD)

The COD was measured using Macherey Nagel’s tube test nanocolor COD 40-15000 (Machery-Nagel GmbH & Co. KG, Düren, Germany). Macherey Nagel’s tube tests comply with DIN ISO 15705-H45. For the measurements, the spectrophotometer Nanocolor UV/VIS II and the thermoblock Nanocolor Vario C2 from Machery Nagel were used.

2.3.3. Particle Count of Microplastics

Due to the processes from which the wastewater originates, it can be presumed that the particles within the wastewater are microplastics resulting from the industrial process of plastic grinding. Therefore, a complex microplastic analysis can be replaced by simple particle counting, as there are only plastic particles in the wastewater.
The particle count was performed by filtration onto a membrane filter (with grid) followed by optical counting under a microscope. For easier filtration and a more even particle distribution onto the filter, highly contaminated samples were diluted with demineralized water, resulting in a total of 100 mL of solution. Depending on the level of contamination, a dilution ranging from 1:100 to undiluted was chosen. The samples were filtered using vacuum filtration onto a white round membrane filter with grid (pore size: 0.45 µm, Ø 47 mm, Cytiva Whatmann, Global Lifescience Solutions Operations UK Ltd., Amersham, UK). After filtration, the membrane filter is stored in a labeled petri dish and inspected under a Leica DMS300 microscope with Leica LAS X software (version 3.0.1423224, Leica Mikrosysteme Vertrieb GmbH, Wetzlar, Germany). Photos of 5 squares were taken per filter and the particles were counted manually. Using the total surface area of the filter and the used water volume, the particle count was extrapolated to particles/L. The minimum size of detectable particles is 5 µm, determined by the resolution of the microscope.

2.3.4. TSS—Microplastics by Weight

Another way to determine the level of microplastic contamination is to measure the particle weight. For this, it is also presumed that the particles within the industrial wastewater, the suspended solids, are microplastics from the manufacturing process.
The quantitative determination of the TSSs is based on DIN 38 409-H2-2. 125 mm round filters (MN 640w, retention capacity 7–12 µm, Machery-Nagel GmbH & Co. KG, Düren, Germany) were used in a vacuum filtration process. The filters were first flushed with 100 mL demineralized water and dried for 3 h at 105 °C. The dry, empty filters are subsequently weighed. After weighing, 1 L of the sample is filtered, and the filters are dried again for 3 h at 105 °C and subsequently weighed. The weight difference between the full and empty filters results in the TSSs.

2.3.5. Turbidity

The turbidity was measured using the spectrophotometer Nanocolor UV/VIS II from Macherey Nagel according to DIN EN ISO 7027. For this purpose, empty tubes with an outer diameter of 16 mm from Macherey Nagel were used (reaction tubes 16 mm OD, item number 91680, Machery-Nagel GmbH & Co. KG, Düren, Germany). Ten milliliters of sample were pipetted into the reaction tube, shaken until homogeneous, placed in the spectrophotometer, and measured.

3. Results

3.1. pH Value

The average pH value of the untreated samples was 6.70 ± 0.36, with the values ranging between 6.0 and 7.2 (Figure 2). After the belt filter, the average pH value was 6.49 ± 0.57 with a minimum of 5.1 and a maximum of 7.4. After the fixed bed, a pH value of 6.50 ± 0.63 was measured, with values ranging from 5.6 to 8.0. The data indicate that there is a significant effect of the microplastic removal on the pH value (t-test, paired, two-sided, p = 0.03), as it is slightly reduced. This may be caused by the water-induced reaction of the applied organosilanes [49]. The COD removal by the fixed bed has no significant effect on the pH. The increased pH after the COD removal in test phase one may be due to GAC material residues after production and insufficient pre-flushing.

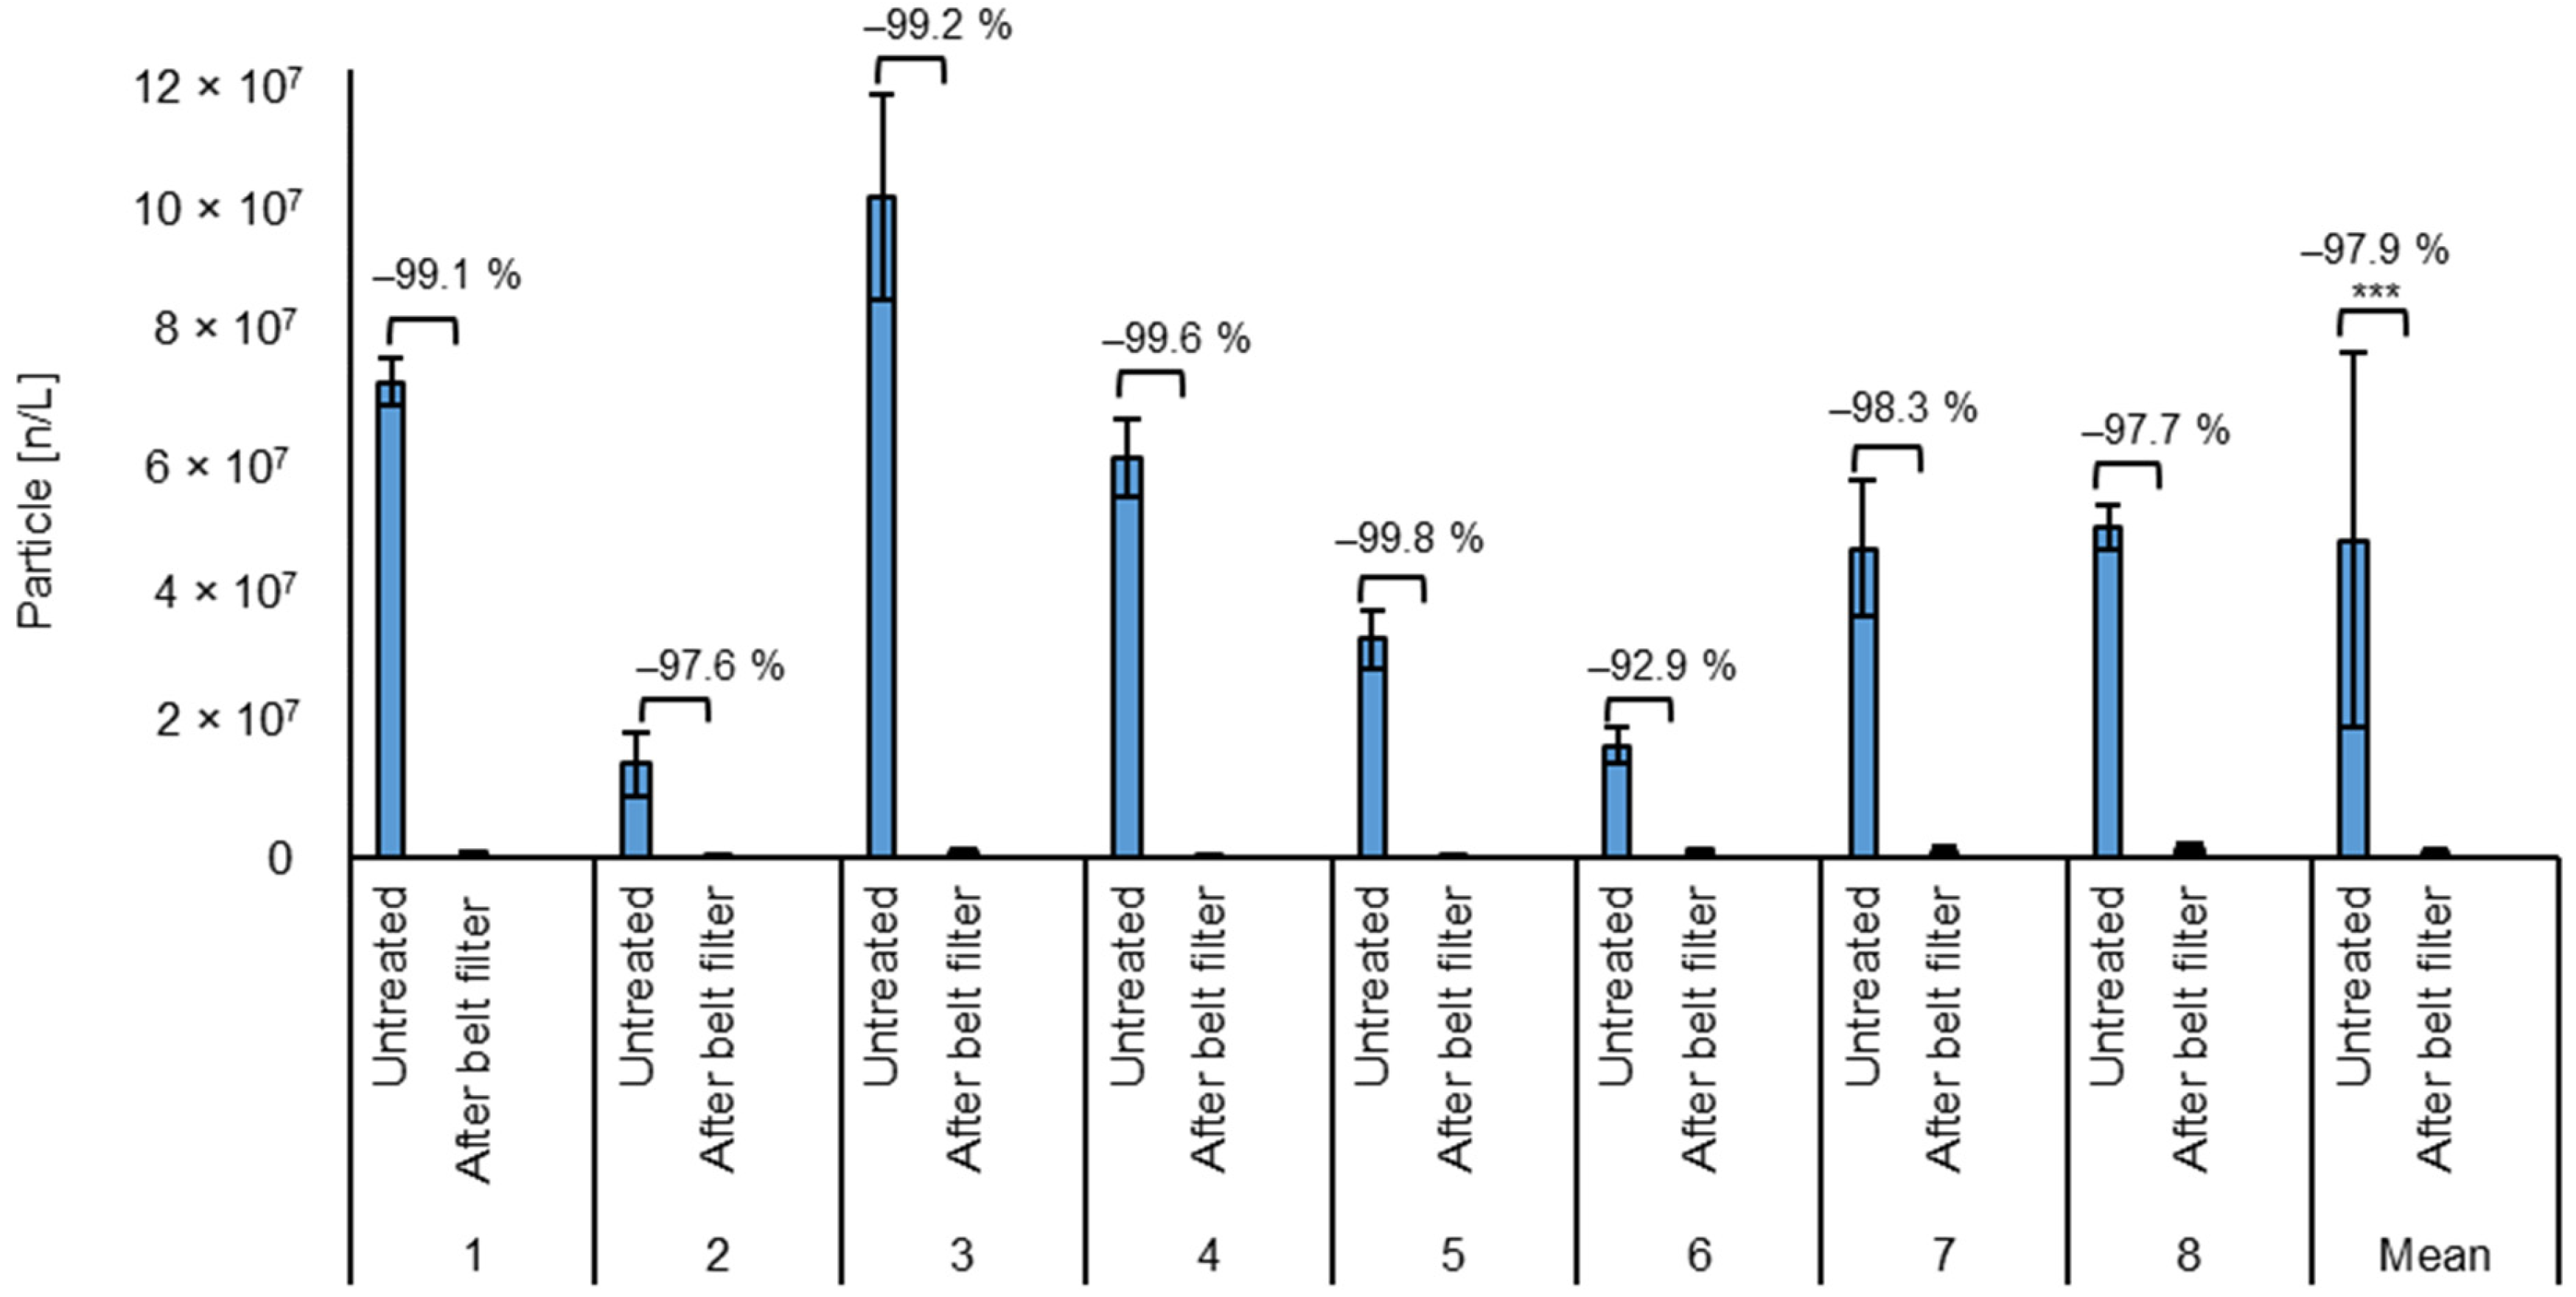
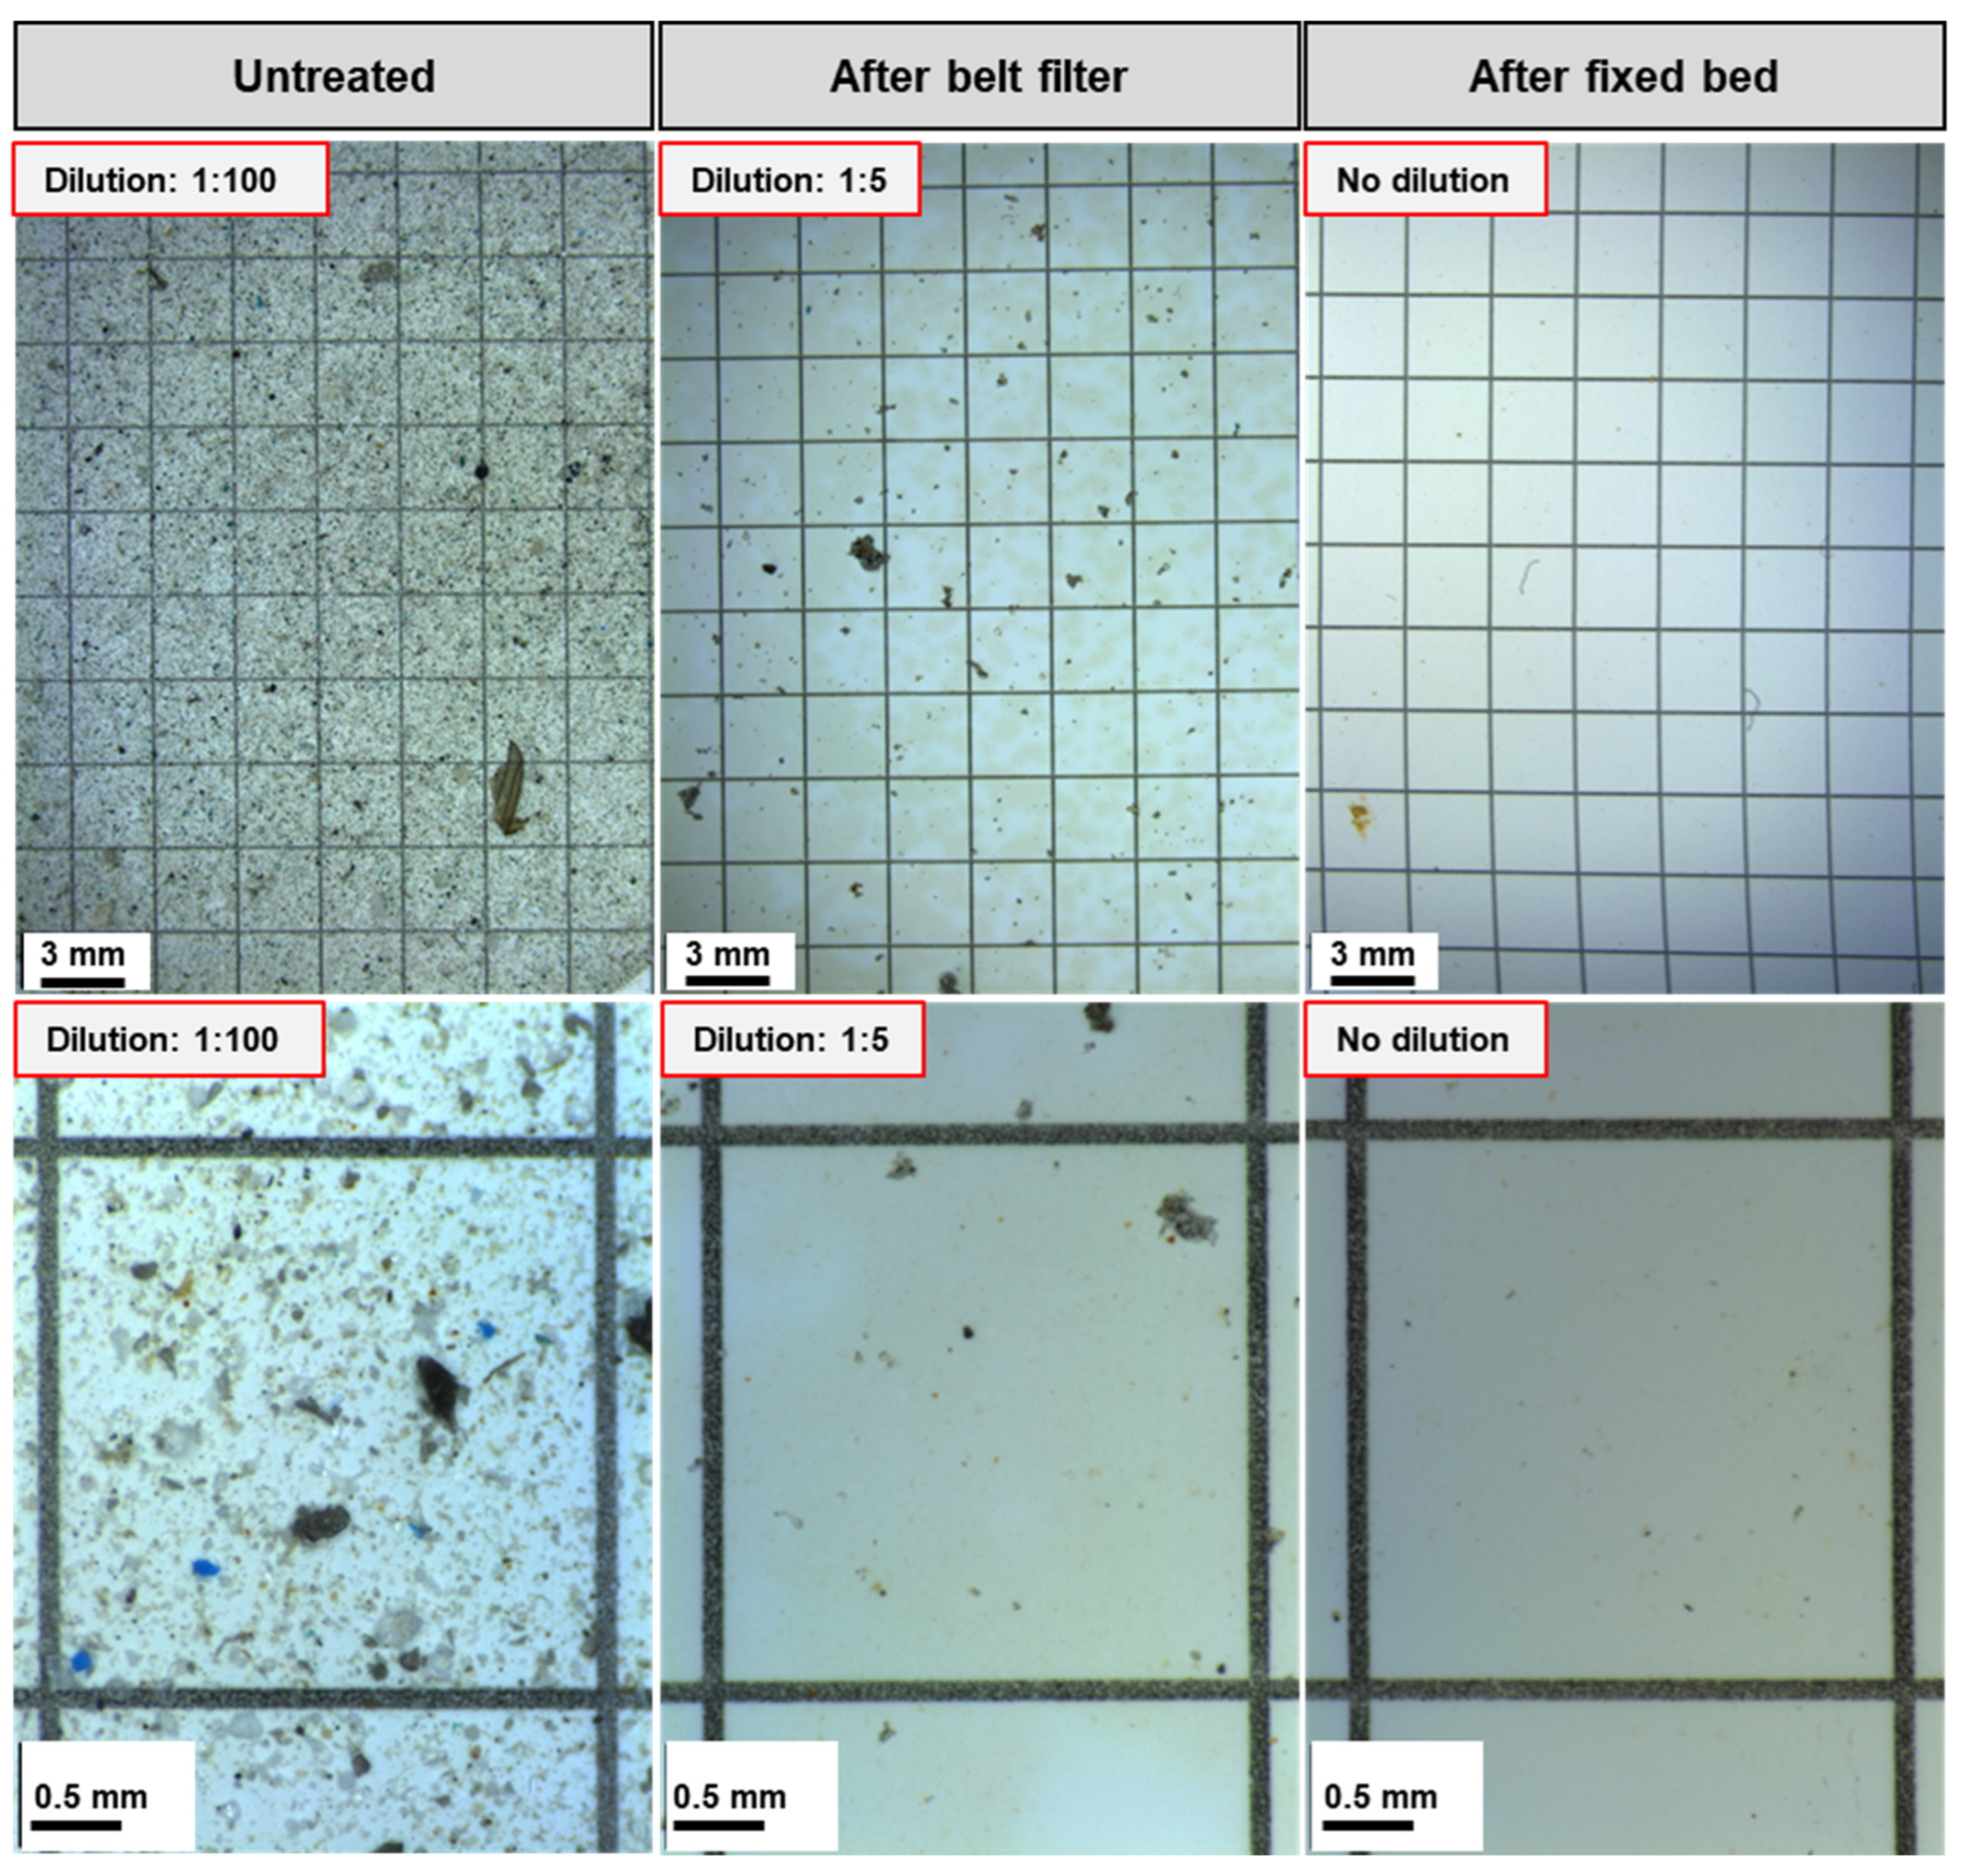
3.2. Microplastic Removal by Particle Count

The average particle count of the untreated wastewater was 48 million ± 28 million particles/L (Figure 3). The high standard deviation shows the strong fluctuations in the contamination level of the incoming water, ranging from 125 million to 10 million particles/L. Due to the processes from which the wastewater originates, it can be assumed that approximately all the particles are microplastics resulting from the grinding processes. Assuming an estimated average of 10 m3 wastewater per day, this would result in an average of 480 billion particles per day.
After the belt filter, the particle count was on average 0.66 million ± 0.54 million particles/L, ranging from 0.02 to 2.3 million particles/L. This corresponds to an average reduction of 97.92 ± 2.31%. The particle count reduction ranges from 90.8% to 99.9% for all batches. The low standard deviation shows the stability of the process against fluctuations in the wastewater composition. Due to the emission of absorbent material caused by the abrasion of the fixed bed, the particle count cannot be quantified after fixed bed treatment. The particle reduction can also be seen optically on the microscopic images of the filters used for particle counting in Figure 4.

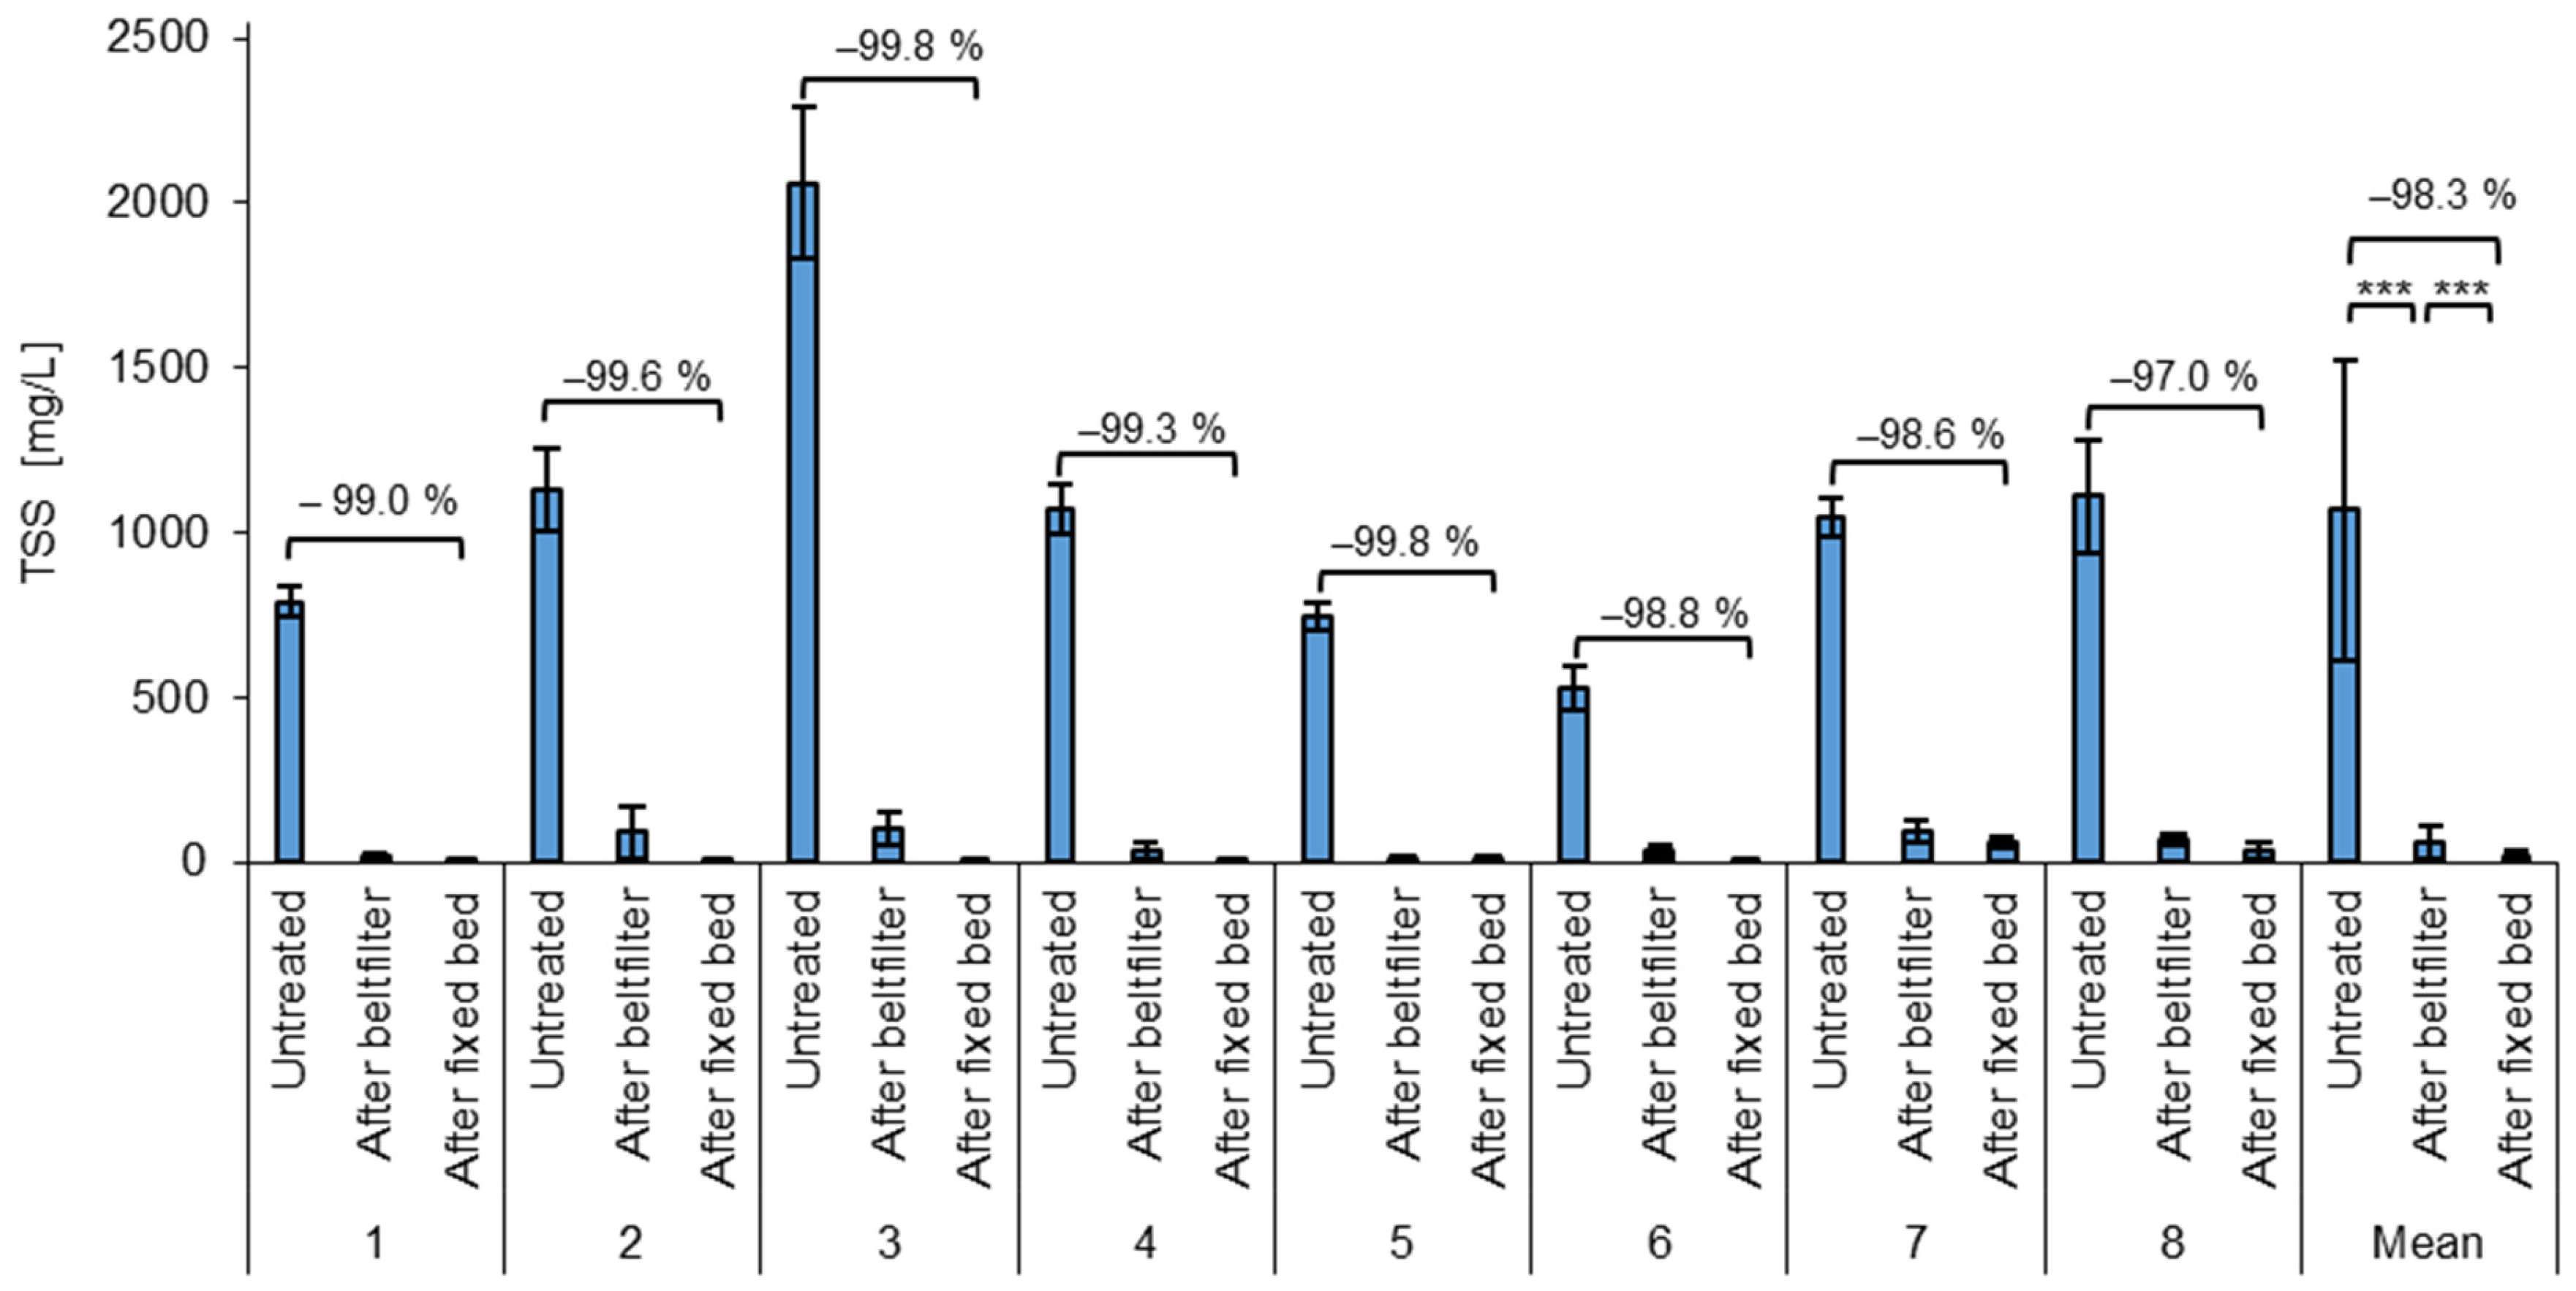
3.3. Microplastic Removal by TSSs

Another way to measure the removal efficiency of the process is by TSS removal (Figure 5). In the untreated wastewater, the TSSs ranged from 411 mg/L to 2381 mg/L, with an average of 1068 ± 456 mg/L. Similar to the particle count, the incoming wastewater also shows high fluctuations of the TSSs, due to changing plastic refining processes. With an estimated average wastewater amount of 10 m3 per day, this would result in an average emission of 10.7 kg TSSs/day, which consists mainly of microplastics. Assuming 250 working days per year, this would lead to a release of 2.68 t TSSs/year.
After the belt filter, the average TSS content is 58 ± 51 mg/L, with values ranging from 5.3 mg/L to 192 mg/L. This results in an average removal of 94.6 ± 3.9%, with a minimum removal of 85.2% and a maximum removal of 99.4%.
The fixed bed treatment also shows an effect on the TSSs, as it can retain both particles and agglomerates. The TSS concentrations after the fixed bed range from 0.6 to 85.20 mg/L with an average of 16.34 ± 21.35 mg/L. The average TSS reduction from the untreated wastewater to the fixed bed effluent and therefore the total treatment process is 98.26 ± 2.15%. This is a significantly improved removal compared to the first removal step. The total TSS removals ranged from 91.5% to 100% for all batches processed. Also here, the low standard deviation of the removal efficiency (2.15%) shows the stability of the process.

3.4. COD Removal

The initial COD in the untreated wastewater ranges from 1241 mg/L to 10,929 mg/L with an average of 3562 ± 2558 mg/L (Figure 6). Thus, like the particle contamination and TSSs, COD contamination is not constant and there is a fluctuation among the sample days. After the belt filter, the COD is reduced by 49.55 ± 20.72%, corresponding to 564 to 9250 mg/L with an average of 1982 ± 2376 mg/L. As the COD is associated with the amount of dissolved and particulate oxidizable substances, removing the particles reduces the COD to the amount of only the dissolved substances [50]. Thus, the microplastic removal step leads to a significant reduction in the COD.
The removal of the dissolved substances from the wastewater is subsequently targeted by the fixed bed treatment. After the fixed bed, the COD ranged from 3.8 to 3693 mg/L with an average of 333 ± 886 mg/L. Thus, the average reduction was 94.3 ± 8.9% with a minimum of 65.3% and a maximum of 99.9% COD removal. In the first test phase, the settings were not yet adjusted correctly, which led to a significantly reduced contact time of the water with the adsorbent materials in the fixed bed and the lowest COD reduction of 75.3% on average.
The goal to reduce the COD below 1000 mg/L, due to municipal and federal requirements, was reached in in all other seven test phases (two to eight), applying the correct settings and a contact time of 10 min. A decrease in removal performance caused by saturation of the adsorbent materials over time was not observed during the test period.

3.5. Turbidity

The turbidity of all samples was measured to determine if it may be applicable as an easy-to-measure process control parameter. In the first treatment step (particle removal), the turbidity is reduced from 650 ± 142 NTU (min: 342 NTU, max: 995 NTU) to 49.0 ± 42.2 NTU (min: 12 NTU, max: 165 NTU). The average reduction corresponds to 92.3 ± 6.6%. After the fixed bed treatment, the turbidity decreased further and accounted for 10.9 ± 7.8 NTU (min: 1 NTU, max: 31 NTU). The overall reduction from the untreated water to the fixed bed effluent was 98.3 ± 1.3% (min: 93.8%, max: 99.9%). Therefore, both the particle removal and the fixed bed treatment significantly reduce the turbidity. The correlations and capability for process control are shown in more detail in the next Section 3.6 Correlation analysis.

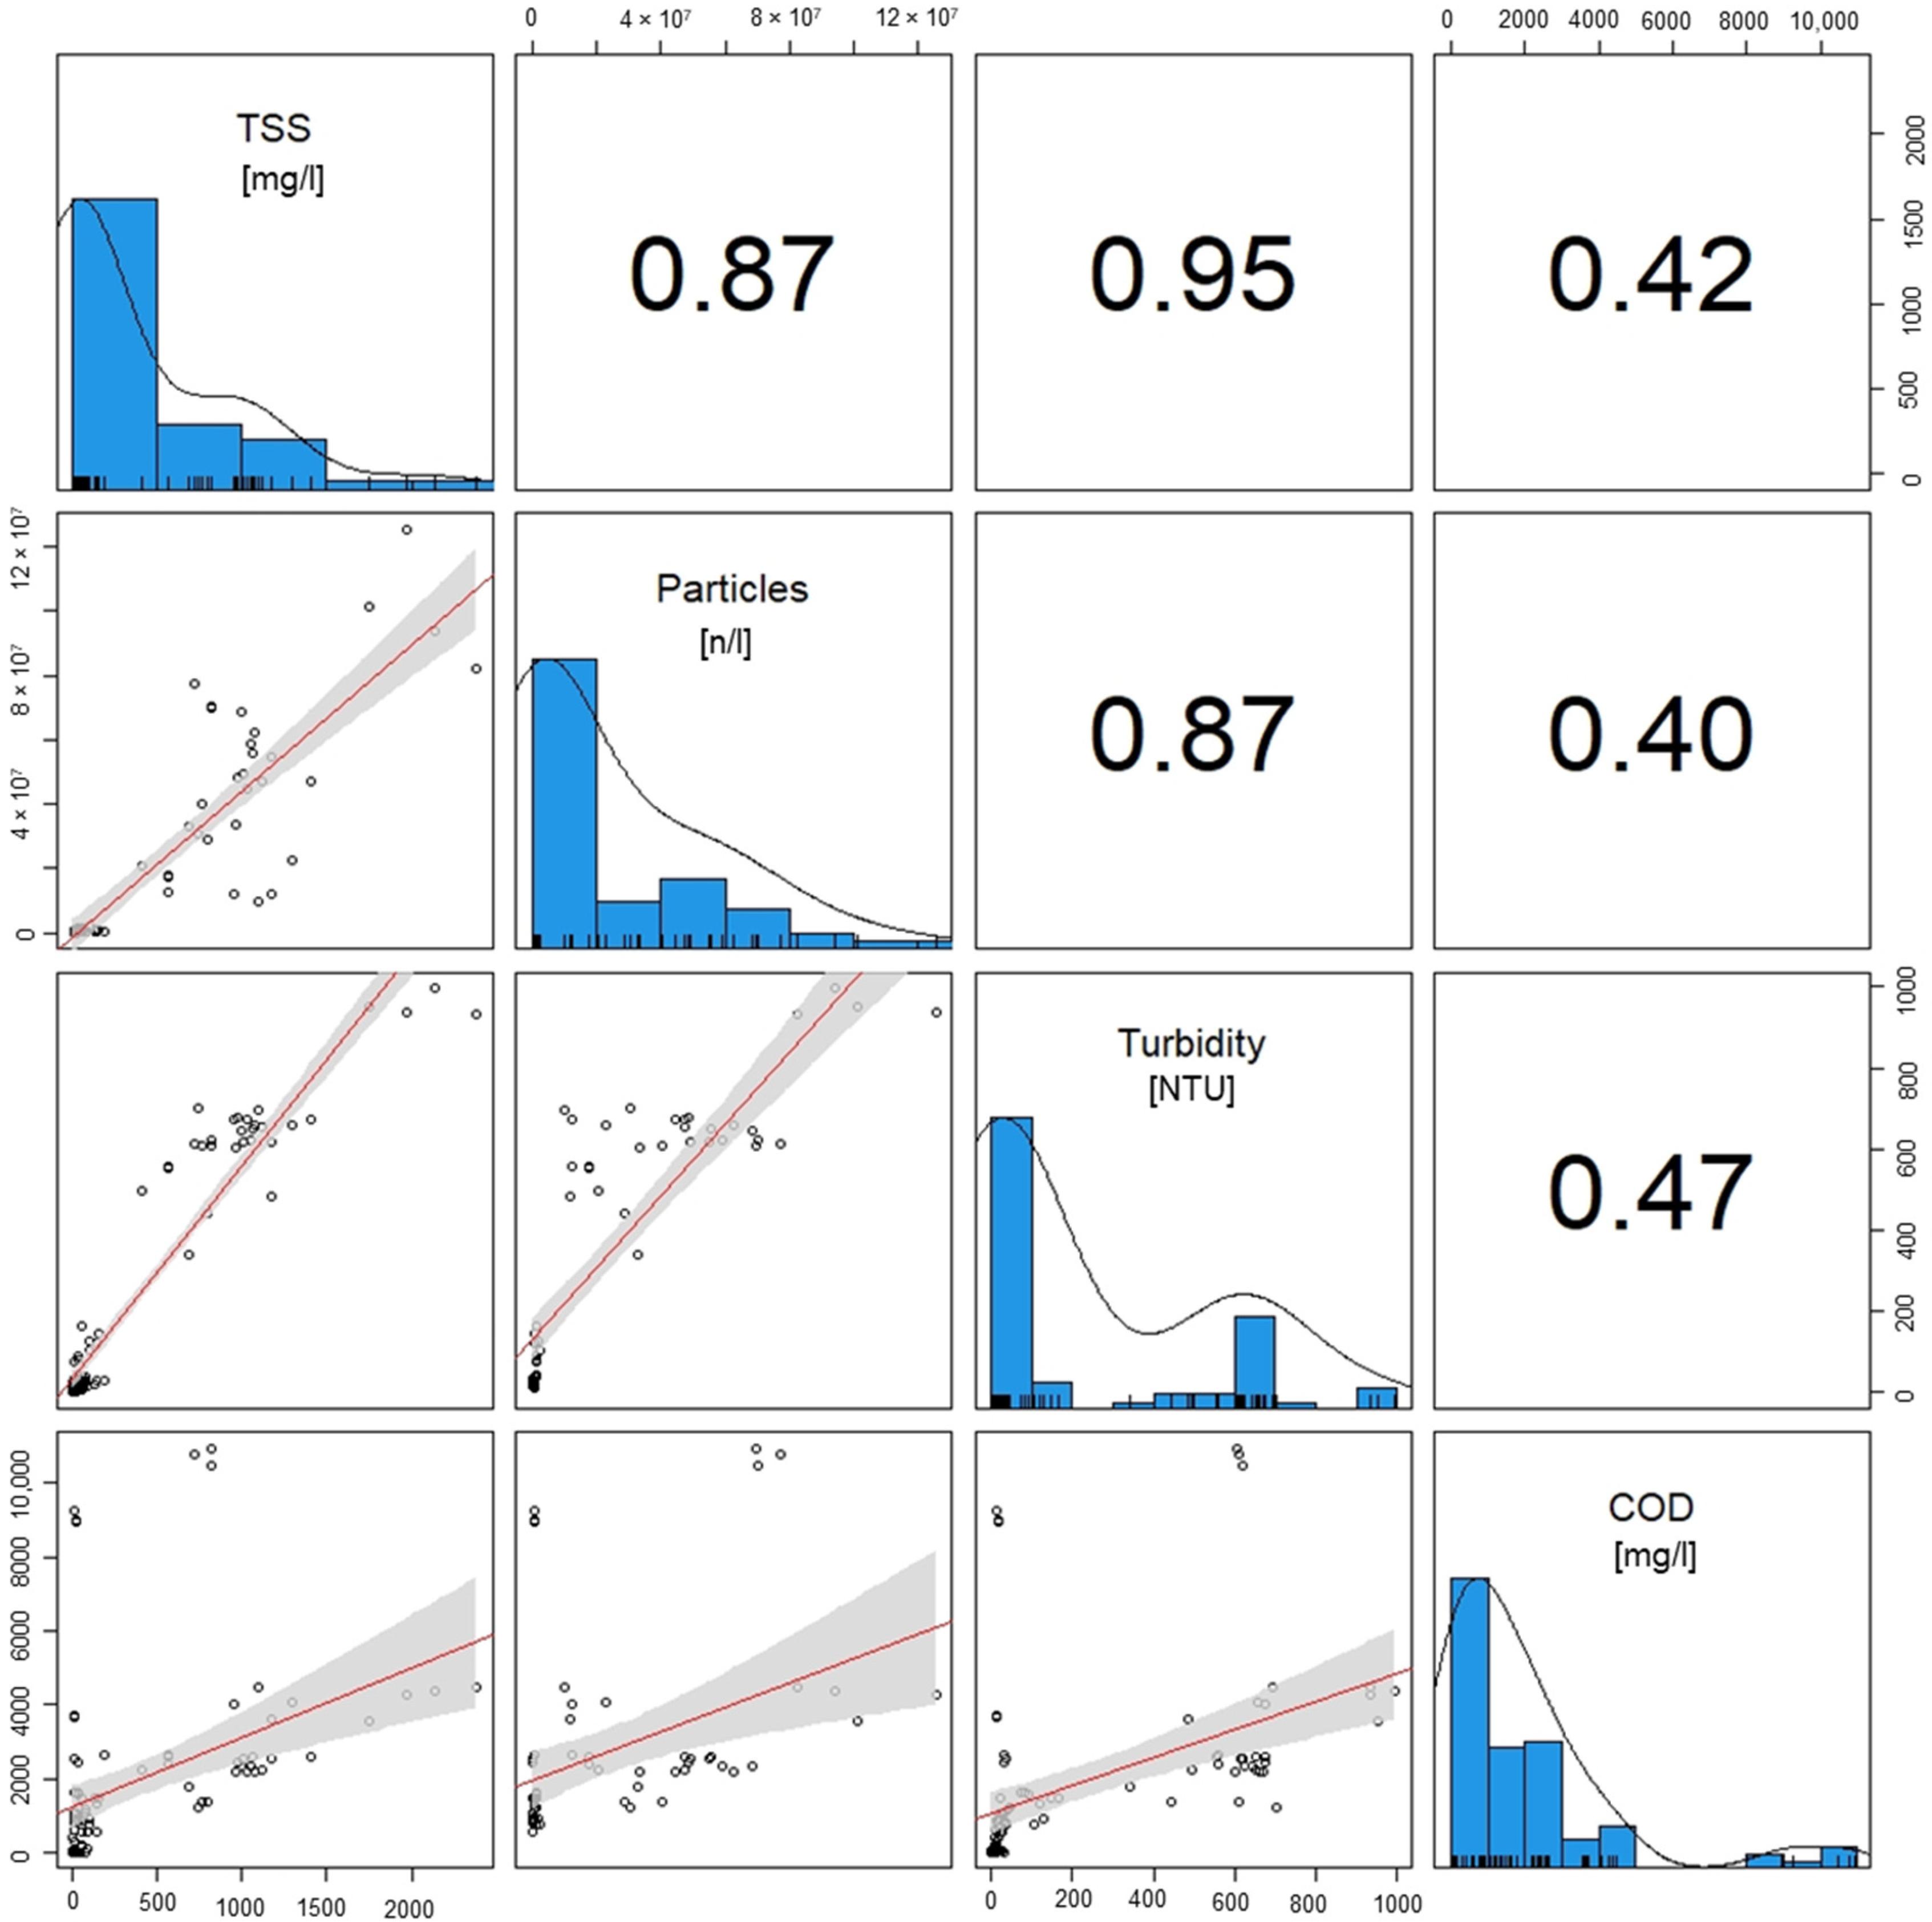
3.6. Correlation Analysis

The correlation analysis (Figure 7) shows that the TSSs and amount of particles are correlated with a Pearson correlation coefficient (r) of 0.87, which can be classified as a strong correlation [51]. In the scatterplot, there are deviations in the ratio of TSSs to particle number. This is caused by different size distributions of the microplastics contained in the wastewater. Smaller particles have a lower weight, whereby with the same particle weight, there is a higher number of small particles. Another possible cause for deviations could be the optical analysis of the microscopic images for particle counting. Despite these deviations, the correlation confirms that samples with high TSSs also show a high particle count and both variables are directly correlated.
The turbidity shows a very strong correlation with TSSs (r = 0.95) and a strong correlation with particle count (r = 0.87). Thus, turbidity is a possible parameter for process control with little effort required for the measurements. Regular samples can be taken and measured in the influent and effluent of the removal plant or a sensor for continuous operation can be installed [52,53].
The correlation of the COD and TSSs (r = 0.42), particle count (r = 0.40), and turbidity (r = 0.47) is moderate and not sufficient to predict COD from turbidity measurements, TSSs, or particle count from the COD. This can also be seen in the scatterplots. Therefore, an effective process control requires a separate COD measurement.

4. Discussion

4.1. Microplastic Removal Performance of the Pilot Plant

The method presented in this paper for microplastic removal from water using organosilanes was investigated and developed at lab scale in previous studies and now tested for its applicability for industrial wastewaters [45,46,47,48,49]. Organosilanes are a new class of agglomeration–fixation reagent that can attach to the surface of microplastics dispersed in water, collect them in large agglomerates and subsequently chemically fix the agglomerates in a water-induced sol–gel process, which has been investigated in previous studies [46,49]. The combination of physical agglomeration and chemical fixation makes the process more efficient and stable compared to common flocculants and coagulants [47,49,54]. Further, the organosilanes can be chemically adjusted to interact with specific polymer types [47].
The high removal rates obtained in the pilot trails with 97.92 ± 2.31% removal measured by particle count and 98.26 ± 2.15% removal by weight are in a similar range to the results obtained in the laboratory studies [47,48,49]. This shows that microplastic removal using organosilanes can be applied in a reproducible and stable manner at a large scale for highly contaminated industrial wastewaters.
The company that implemented the pilot plant processes a wide variety of polymer types, with their composition and quantity changing depending on the respective orders from customers and the batches being processed. The variation in pH in the incoming wastewater is relatively stable, with a mean of 6.70 ± 0.36 and a range of 6.0–7.2. Also, variations in the amounts of dissolved substances were present, evident by the high fluctuation in COD of the incoming wastewater, ranging from 1241 mg/L to 10,929 mg/L with an average of 3562 ± 2558 mg/L. With a removal of 92.9–99.2% by particle count and 97.0–99.8% removal by weight, good removal performance was achieved for all batches, which demonstrates that these fluctuations in COD, microplastic load, and polymer composition did not affect the removal.
Comparing the dosing of the agglomeration reagent to other investigations into microplastic flocculation or coagulation, with 800 mL/L, the dosing is comparably high, as typical dosages of flocculants or coagulants are about 0.05–10 mg/L. Since the amount of agglomeration reagent added depends on the microplastic load in the wastewater, the high amount added is due to the very high microplastic load [38,40].
A previous pilot trail tested the removal of microplastics with organosilanes from municipal wastewater. It was operated continuously and connected to a granulated activated carbon treatment (GAC) [55]. This pilot plant had a capacity of 2 m3 and was operated with a flow rate of 12 m3/h using the effluent from the third cleaning stage of a municipal wastewater treatment plant. Unlike in the pilot plant presented in the current study, the microplastic agglomerates were removed by skimming. An average removal of 60.9 ± 27.5% by particle count ranging from 7.9% to 81.5% was reached in the pilot trails. The removal efficiencies are comparably lower due to the lower microplastic concentrations in the wastewater (29.1 ± 15.1 MP/L). This makes it more difficult for the microplastics to be located and collected in an agglomerate. It is noticeable that the high fluctuations of the microplastic concentrations in the wastewater stream make quantification of the process difficult.
These results suggest that the removal of microplastics in highly contaminated wastewater from plastic producing and plastic processing industries is more effective. Since this prevents the plastic from entering the sewer network and subsequently the sewage treatment plant, much smaller amounts of wastewater need be treated, and the polluter takes the responsibility and costs for the treatment rather than the general public (beginning-of-the-pipe) [15]. Further, efficient particle removal allows the water to be reused with the aim of a circular water economy, which is especially desirable in areas with water scarcity [4,5,6]. Here, politicians are asked to take the polluters into responsibility instead of passing the burden on to the general public [15,16].

4.2. COD Removal of the Pilot Plant

Biological wastewater treatment is most commonly used for COD removal, but is hard to apply at mid-sized and small companies, as it needs a high level of monitoring and maintenance and requires a large amount of space [37,56]. Advanced oxidation processes for COD reduction are discussed in scientific research, but the associated increased energy consumption or the use of costly chemicals leads to high operational costs [57,58]. Further, during the oxidation process, unknown intermediates can be formed, with unknown effects on the environment [58]. Membrane filtration is a further method for COD removal, but as previously discussed, suffers from high maintenance requirements due to fouling and scaling, and thus the use and disposal of aggressive chemicals for cleaning and anti-scaling agents needs to be considered [36].
The particle removal method in combination with the fixed bed containing absorbent materials presented within this study reduced the COD effectively, with an average reduction of 94.3% for influent COD values ranging from 1241 mg/L to 10,929 mg/L. With the fixed bed reactor used and a contact time of 10 min it is possible to treat up to 1 m3/h. As only 8 m3 of wastewater, equivalent to 45 bed volumes, was treated during the trial period, it is unclear when the adsorption capacity is reached and when the absorbent material needs to be exchanged [59,60,61,62]. The removal performance of the fixed bed adsorption system is directly dependent on the contact time. If higher removal efficiencies are needed, the contact time can be increased [60]. Depending on the requirements of the industrial process, the water can also be reused, enabling a circular water economy [4,5,6]. When considering circular economy processes, and to prevent the creation of additional waste, a concept for a regeneration of the absorbent materials is needed to increase the sustainability of the process [63]. Another advantage of the application of the fixed bed is the removal of micropollutants that may be associated with microplastics, such as phthalates, phenols or bisphenol-a [64,65]. For wastewaters containing heavy metals, ion exchange resins for heavy metal removal can also be easily added if necessary [66].

5. Conclusions

The long-term tests show that the pilot plant for microplastic removal with subsequent COD reduction can be operated reproducibly and reliably. As the composition of the incoming wastewater varied strongly among the sampling days, the system shows a good resilience to those fluctuations and delivers consistently high removal efficiencies.
Microplastic levels could be reduced on average by 97.92 ± 2.31% determined by the particle count and 98.26 ± 2.15% by weight (TSS). The COD was reduced by 94.3 ± 8.9% after the particle removal and removal of dissolved substances by the fixed bed reactor. In this specific application, the COD removal leads further to a reduction in wastewater fees when considering the effluent discharge fees into the municipal sewer network. Removal of both COD and microplastics enables water to be cleaned more easily by the WWTP and released into the natural water cycle. This increases the overall sustainability of the processes due to reuse of process water. In areas with water shortages, direct reuse for agricultural irrigation is possible.
The correlation analysis shows a direct correlation of particle count and TSSs in the wastewater. In addition, both parameters are strongly correlated with turbidity, an easily measurable parameter, which makes it potentially very useful as a cost-effective process control. Further process control, e.g., dosage quantity of the Wasser 3.0 PE-X® or retention time in the fixed bed reactor, can be accomplished with turbidity as an indicative parameter to potentially increase the efficiency of the process and lower the energy and flocculant usages.

Supplementary Materials

The following supporting information can be downloaded at https://www.mdpi.com/article/10.3390/w16020268/s1. Table S1: Raw data of all measured parameters for all test phases and batches.

Author Contributions

Conceptualization, D.S. and K.S.; methodology, D.S., A.K., M.T.S. and K.S.; validation, D.S., A.K., M.T.S. and K.S.; formal analysis, M.T.S., A.K. and K.S.; investigation, A.K. and D.S.; resources, K.S.; data curation, M.T.S. and K.S.; writing—original draft preparation, M.T.S., E.M. and K.S.; writing—review and editing, M.T.S., E.M. and K.S.; visualization, M.T.S.; supervision, K.S.; project administration, K.S.; funding acquisition, K.S. All authors have read and agreed to the published version of the manuscript.

Funding

This project has received co-funding from the European Union’s HORIZON EUROPE innovation program under grant agreements 101093964 and 101112877. This publication reflects the views only of the author, and the European Commission cannot be held responsible for any use that may be made of the information contained therein. Additionally, the project has also received co-funding from the Veolia Foundation (GERMANY)|Project konti|detect.

Data Availability Statement

The data presented in this study are available in the current manuscript and in the Supplementary Materials.

Acknowledgments

The authors thank abcr GmbH, Karlsruhe, Germany for their project-related support.

Conflicts of Interest

The authors declare no conflict of interests.

References

  1. United Nations Environment Programme. Freshwater Strategic Priorities 2022–2025. Available online: https://wedocs.unep.org/bitstream/handle/20.500.11822/39607/Freshwater_Strategic_Priorities.pdf (accessed on 9 November 2023).
  2. Richardson, K.; Steffen, W.; Lucht, W.; Bendtsen, J.; Cornell, S.E.; Donges, J.F.; Drüke, M.; Fetzer, I.; Bala, G.; von Bloh, W.; et al. Earth beyond six of nine planetary boundaries. Sci. Adv. 2023, 9, eadh2458. [Google Scholar] [CrossRef] [PubMed]
  3. Gleick, P.H. Water in crisis: Paths to sustainable water use. Ecol. Appl. 1998, 8, 571–579. [Google Scholar] [CrossRef]
  4. Mannina, G.; Gulhan, H.; Ni, B.-J. Water reuse from wastewater treatment: The transition towards circular economy in the water sector. Bioresour. Technol. 2022, 363, 127951. [Google Scholar] [CrossRef]
  5. Sgroi, M.; Vagliasindi, F.G.; Roccaro, P. Feasibility, sustainability and circular economy concepts in water reuse. Curr. Opin. Environ. Sci. Health 2018, 2, 20–25. [Google Scholar] [CrossRef]
  6. Wagner, M.; Bauer, S. Industrial and Municipal Wastewater Treatment with a Focus on Water-Reuse; MDPI: Basel, Switzerland, 2023; ISBN 978-3-0365-6255-1. [Google Scholar]
  7. Boeuf, B.; Fritsch, O.; Martin-Ortega, J. Undermining European Environmental Policy Goals? The EU Water Framework Directive and the Politics of Exemptions. Water 2016, 8, 388. [Google Scholar] [CrossRef]
  8. European Comission. Directive of the European Parliament and of the Council Concerning Urban Wastewater Treatment (Recast): COM(2022) 541 Final 2022/0345 (COD); European Comission: Brussels, Belgium, 2022; Available online: https://eur-lex.europa.eu/resource.html?uri=cellar:fc078ec8-55f7-11ed-92ed-01aa75ed71a1.0001.02/DOC_2&format=PDF (accessed on 8 January 2024).
  9. Abu-Orf, M.; Bowden, G.; Burton, F.L.; Pfrang, W.; Stensel, H.D.; Tchobanoglous, G.; Tsuchihashi, R.; AECOM (Firm). Wastewater Engineering: Treatment and Resource Recovery, 5th ed.; Mcgraw-Hill Education: New York, NY, USA, 2014; Volume 1, ISBN 978-0073401188. [Google Scholar]
  10. Ahmed, S.F.; Islam, N.; Tasannum, N.; Mehjabin, A.; Momtahin, A.; Chowdhury, A.A.; Almomani, F.; Mofijur, M. Microplastic removal and management strategies for wastewater treatment plants. Chemosphere 2023, 347, 140648. [Google Scholar] [CrossRef]
  11. Brown, P.C.; Borowska, E.; Schwartz, T.; Horn, H. Impact of the particulate matter from wastewater discharge on the abundance of antibiotic resistance genes and facultative pathogenic bacteria in downstream river sediments. Sci. Total Environ. 2019, 649, 1171–1178. [Google Scholar] [CrossRef]
  12. Rogowska, J.; Cieszynska-Semenowicz, M.; Ratajczyk, W.; Wolska, L. Micropollutants in treated wastewater. Ambio 2020, 49, 487–503. [Google Scholar] [CrossRef]
  13. Iloms, E.; Ololade, O.O.; Ogola, H.J.O.; Selvarajan, R. Investigating Industrial Effluent Impact on Municipal Wastewater Treatment Plant in Vaal, South Africa. Int. J. Environ. Res. Public Health 2020, 17, 1096. [Google Scholar] [CrossRef]
  14. Gkika, D.A.; Tolkou, A.K.; Evgenidou, E.; Bikiaris, D.N.; Lambropoulou, D.A.; Mitropoulos, A.C.; Kalavrouziotis, I.K.; Kyzas, G.Z. Fate and Removal of Microplastics from Industrial Wastewaters. Sustainability 2023, 15, 6969. [Google Scholar] [CrossRef]
  15. Bergmann, M.; Arp, H.P.H.; Carney Almroth, B.; Cowger, W.; Eriksen, M.; Dey, T.; Gündoğdu, S.; Helm, R.R.; Krieger, A.; Syberg, K.; et al. Moving from symptom management to upstream plastics prevention: The fallacy of plastic cleanup technology. One Earth 2023, 6, 1439–1442. [Google Scholar] [CrossRef]
  16. Napper, I.E.; Thompson, R.C. Plastics and the Environment. Annu. Rev. Environ. Resour. 2023, 48, 55–79. [Google Scholar] [CrossRef]
  17. Deutscher Bundestag. Verordnung über Anforderungen an das Einleiten von Abwasser in Gewässer. BGBl. I 2022, p. 87. Available online: https://www.gesetze-im-internet.de/abwv/AbwV.pdf (accessed on 8 January 2024).
  18. Deutscher Bundestag. Gesetz zur Ordnung des Wasserhaushalts (Wasserhaushaltsgesetz—WHG): WHG. BGBl. I, 2020, p. 1408. Available online: https://www.gesetze-im-internet.de/whg_2009/WHG.pdf (accessed on 8 January 2024).
  19. Ministerium für Umwelt, Landwirtschaft, Natur- und Verbraucherschutz des Landes Nordrhein-Westfalen. Entwicklung und Stand der Abwasserbeseitigung in NRW—Kaptiel 8 Industrielle Abwassereinleitungen. Available online: https://www.lanuv.nrw.de/fileadmin/lanuv/wasser/abwasser/lagebericht/pdf/2020/12_EStAb2020_Kap08_Industrielle_Abwassereinleitungen.pdf (accessed on 17 November 2023).
  20. Cristaldi, A.; Fiore, M.; Zuccarello, P.; Oliveri Conti, G.; Grasso, A.; Nicolosi, I.; Copat, C.; Ferrante, M. Efficiency of Wastewater Treatment Plants (WWTPs) for Microplastic Removal: A Systematic Review. Int. J. Environ. Res. Public Health 2020, 17, 8014. [Google Scholar] [CrossRef] [PubMed]
  21. Magni, S.; Binelli, A.; Pittura, L.; Avio, C.G.; Della Torre, C.; Parenti, C.C.; Gorbi, S.; Regoli, F. The fate of microplastics in an Italian Wastewater Treatment Plant. Sci. Total Environ. 2019, 652, 602–610. [Google Scholar] [CrossRef] [PubMed]
  22. Franco, A.A.; Arellano, J.M.; Albendín, G.; Rodríguez-Barroso, R.; Zahedi, S.; Quiroga, J.; Coello, M. Mapping microplastics in Cadiz (Spain): Occurrence of microplastics in municipal and industrial wastewaters. J. Water Process Eng. 2020, 38, 101596. [Google Scholar] [CrossRef]
  23. Sturm, M.T.; Myers, E.; Schober, D.; Korzin, A.; Schuhen, K. Development of an Inexpensive and Comparable Microplastic Detection Method Using Fluorescent Staining with Novel Nile Red Derivatives. Analytica 2023, 4, 27–44. [Google Scholar] [CrossRef]
  24. Barchiesi, M.; Chiavola, A.; Di Marcantonio, C.; Boni, M.R. Presence and fate of microplastics in the water sources: Focus on the role of wastewater and drinking water treatment plants. J. Water Process Eng. 2021, 40, 101787. [Google Scholar] [CrossRef]
  25. Zhang, Z.; Chen, Y. Effects of microplastics on wastewater and sewage sludge treatment and their removal: A review. Chem. Eng. J. 2020, 382, 122955. [Google Scholar] [CrossRef]
  26. Rolsky, C.; Kelkar, V.; Driver, E.; Halden, R.U. Municipal sewage sludge as a source of microplastics in the environment. Curr. Opin. Environ. Sci. Health 2020, 14, 16–22. [Google Scholar] [CrossRef]
  27. Roskosch, A.; Heidecke, P. Klärschlammentsorgung in der Bundesrepublik Deutschland. Available online: https://www.umweltbundesamt.de/sites/default/files/medien/376/publikationen/2018_10_08_uba_fb_klaerschlamm_bf_low.pdf (accessed on 7 December 2023).
  28. Krishnan, R.Y.; Manikandan, S.; Subbaiya, R.; Karmegam, N.; Kim, W.; Govarthanan, M. Recent approaches and advanced wastewater treatment technologies for mitigating emerging microplastics contamination—A critical review. Sci. Total Environ. 2023, 858, 159681. [Google Scholar] [CrossRef]
  29. Bayo, J.; López-Castellanos, J.; Olmos, S. Membrane bioreactor and rapid sand filtration for the removal of microplastics in an urban wastewater treatment plant. Mar. Pollut. Bull. 2020, 156, 111211. [Google Scholar] [CrossRef]
  30. Funck, M.; Al-Azzawi, M.S.; Yildirim, A.; Knoop, O.; Schmidt, T.C.; wes, J.E.; Tuerk, J. Release of microplastic particles to the aquatic environment via wastewater treatment plants: The impact of sand filters as tertiary treatment. Chem. Eng. J. 2021, 426, 130933. [Google Scholar] [CrossRef]
  31. Wolff, S.; Weber, F.; Kerpen, J.; Winklhofer, M.; Engelhart, M.; Barkmann, L. Elimination of Microplastics by Downstream Sand Filters in Wastewater Treatment. Water 2021, 13, 33. [Google Scholar] [CrossRef]
  32. Sembiring, E.; Fajar, M.; Handajani, M. Performance of rapid sand filter—Single media to remove microplastics. Water Supply 2021, 21, 2273–2284. [Google Scholar] [CrossRef]
  33. González-Camejo, J.; Morales, A.; Peña-Lamas, J.; Lafita, C.; Enguídanos, S.; Seco, A.; Martí, N. Feasibility of rapid gravity filtration and membrane ultrafiltration for the removal of microplastics and microlitter in sewage and wastewater from plastic industry. J. Water Process Eng. 2023, 51, 103452. [Google Scholar] [CrossRef]
  34. Pizzichetti, A.R.P.; Pablos, C.; Álvarez-Fernández, C.; Reynolds, K.; Stanley, S.; Marugán, J. Evaluation of membranes performance for microplastic removal in a simple and low-cost filtration system. Case Stud. Chem. Environ. Eng. 2021, 3, 100075. [Google Scholar] [CrossRef]
  35. Umar, M.; Singdahl-Larsen, C.; Ranneklev, S.B. Microplastics Removal from a Plastic Recycling Industrial Wastewater Using Sand Filtration. Water 2023, 15, 896. [Google Scholar] [CrossRef]
  36. Poerio, T.; Piacentini, E.; Mazzei, R. Membrane Processes for Microplastic Removal. Molecules 2019, 24, 4148. [Google Scholar] [CrossRef]
  37. Alipour, Z.; Azari, A. COD removal from industrial spent caustic wastewater: A review. J. Environ. Chem. Eng. 2020, 8, 103678. [Google Scholar] [CrossRef]
  38. Ali, I.; Tan, X.; Xie, Y.; Peng, C.; Li, J.; Naz, I.; Duan, Z.; Wan, P.; Huang, J.; Liang, J.; et al. Recent innovations in microplastics and nanoplastics removal by coagulation technique: Implementations, knowledge gaps and prospects. Water Res. 2023, 245, 120617. [Google Scholar] [CrossRef]
  39. Tang, W.; Li, H.; Fei, L.; Wei, B.; Zhou, T.; Zhang, H. The removal of microplastics from water by coagulation: A comprehensive review. Sci. Total Environ. 2022, 851, 158224. [Google Scholar] [CrossRef] [PubMed]
  40. Lapointe, M.; Farner, J.M.; Hernandez, L.M.; Tufenkji, N. Understanding and Improving Microplastic Removal during Water Treatment: Impact of Coagulation and Flocculation. Environ. Sci. Technol. 2020, 54, 8719–8727. [Google Scholar] [CrossRef]
  41. Zhang, Y.; Wang, X.; Li, Y.; Wang, H.; Shi, Y.; Li, Y.; Zhang, Y. Improving nanoplastic removal by coagulation: Impact mechanism of particle size and water chemical conditions. J. Hazard. Mater. 2022, 425, 127962. [Google Scholar] [CrossRef] [PubMed]
  42. Gao, Y.; Liu, Y. Removal of microplastics by coagulation treatment in waters and prospect of recycling of separated microplastics: A mini-review. J. Environ. Chem. Eng. 2022, 10, 108197. [Google Scholar] [CrossRef]
  43. Chen, X.; Ma, H.; Ji, X.; Han, R.; Pang, K.; Yang, Z.; Liu, Z.; Peng, S. Engineering green MOF-based superhydrophobic sponge for efficiently synchronous removal of microplastics and pesticides from high-salinity water. Water Res. 2023, 243, 120314. [Google Scholar] [CrossRef] [PubMed]
  44. Rhein, F.; Scholl, F.; Nirschl, H. Magnetic seeded filtration for the separation of fine polymer particles from dilute suspensions: Microplastics. Chem. Eng. Sci. 2019, 207, 1278–1287. [Google Scholar] [CrossRef]
  45. Herbort, A.F.; Sturm, M.T.; Fiedler, S.; Abkai, G.; Schuhen, K. Alkoxy-silyl Induced Agglomeration: A New Approach for the Sustainable Removal of Microplastic from Aquatic Systems. J. Polym. Environ. 2018, 26, 4258–4270. [Google Scholar] [CrossRef]
  46. Herbort, A.F.; Sturm, M.T.; Schuhen, K. A new approach for the agglomeration and subsequent removal of polyethylene, polypropylene, and mixtures of both from freshwater systems—A case study. Environ. Sci. Pollut. Res. Int. 2018, 25, 15226–15234. [Google Scholar] [CrossRef]
  47. Sturm, M.T.; Horn, H.; Schuhen, K. Removal of Microplastics from Waters through Agglomeration-Fixation Using Organosilanes—Effects of Polymer Types, Water Composition and Temperature. Water 2021, 13, 675. [Google Scholar] [CrossRef]
  48. Sturm, M.T.; Schuhen, K.; Horn, H. Method for rapid biofilm cultivation on microplastics and investigation of its effect on the agglomeration and removal of microplastics using organosilanes. Sci. Total Environ. 2022, 806, 151388. [Google Scholar] [CrossRef]
  49. Sturm, M.T.; Herbort, A.F.; Horn, H.; Schuhen, K. Comparative study of the influence of linear and branched alkyltrichlorosilanes on the removal efficiency of polyethylene and polypropylene-based microplastic particles from water. Environ. Sci. Pollut. Res. Int. 2020, 27, 10888–10898. [Google Scholar] [CrossRef]
  50. Geerdink, R.B.; van den Sebastiaan Hurk, R.; Epema, O.J. Chemical oxygen demand: Historical perspectives and future challenges. Anal. Chim. Acta 2017, 961, 1–11. [Google Scholar] [CrossRef] [PubMed]
  51. Schober, P.; Boer, C.; Schwarte, L.A. Correlation Coefficients: Appropriate Use and Interpretation. Anesth. Analg. 2018, 126, 1763–1768. [Google Scholar] [CrossRef] [PubMed]
  52. Lee, C.; Foster, G. Assessing the potential of reservoir outflow management to reduce sedimentation using continuous turbidity monitoring and reservoir modelling. Hydrol. Process. 2013, 27, 1426–1439. [Google Scholar] [CrossRef]
  53. Ratnaweera, H.; Fettig, J. State of the Art of Online Monitoring and Control of the Coagulation Process. Water 2015, 7, 6574–6597. [Google Scholar] [CrossRef]
  54. Lee, P.S.; Jung, S.M. Quantitative analysis of microplastics coagulation-removal process for clean sea salt production. Int. J. Environ. Sci. Technol. 2022, 19, 5205–5216. [Google Scholar] [CrossRef]
  55. Sturm, M.T.; Myers, E.; Schober, D.; Korzin, A.; Thege, C.; Schuhen, K. Comparison of AOP, GAC, and Novel Organosilane-Based Process for the Removal of Microplastics at a Municipal Wastewater Treatment Plant. Water 2023, 15, 1164. [Google Scholar] [CrossRef]
  56. Sikosana, M.L.; Sikhwivhilu, K.; Moutloali, R.; Madyira, D.M. Municipal wastewater treatment technologies: A review. Procedia Manuf. 2019, 35, 1018–1024. [Google Scholar] [CrossRef]
  57. Deng, Y.; Zhao, R. Advanced Oxidation Processes (AOPs) in Wastewater Treatment. Curr. Pollut. Rep. 2015, 1, 167–176. [Google Scholar] [CrossRef]
  58. Sharma, A.; Ahmad, J.; Flora, S.J.S. Application of advanced oxidation processes and toxicity assessment of transformation products. Environ. Res. 2018, 167, 223–233. [Google Scholar] [CrossRef]
  59. Chern, J.-M.; Chien, Y.-W. Adsorption of nitrophenol onto activated carbon: Isotherms and breakthrough curves. Water Res. 2002, 36, 647–655. [Google Scholar] [CrossRef] [PubMed]
  60. Perrich, J.R. Activated Carbon Adsorption for Wastewater Treatment; CRC Press: Boca Raton, FL, USA, 2018; ISBN 1315890364. [Google Scholar]
  61. Zietzschmann, F.; Stützer, C.; Jekel, M. Granular activated carbon adsorption of organic micro-pollutants in drinking water and treated wastewater—Aligning breakthrough curves and capacities. Water Res. 2016, 92, 180–187. [Google Scholar] [CrossRef] [PubMed]
  62. Benstöm, F. Granular Activated Carbon for the Elimination of Organic Micropollutants form Municipal Wastewater; RWTH Aachen University: Aachen, Germany, 2017. [Google Scholar]
  63. El Gamal, M.; Mousa, H.A.; El-Naas, M.H.; Zacharia, R.; Judd, S. Bio-regeneration of activated carbon: A comprehensive review. Sep. Purif. Technol. 2018, 197, 345–359. [Google Scholar] [CrossRef]
  64. Choi, K.J.; Kim, S.G.; Kim, C.W.; Kim, S.H. Effects of activated carbon types and service life on removal of endocrine disrupting chemicals: Amitrol, nonylphenol, and bisphenol-A. Chemosphere 2005, 58, 1535–1545. [Google Scholar] [CrossRef]
  65. Adhoum, N.; Monser, L. Removal of phthalate on modified activated carbon: Application to the treatment of industrial wastewater. Sep. Purif. Technol. 2004, 38, 233–239. [Google Scholar] [CrossRef]
  66. Fu, F.; Wang, Q. Removal of heavy metal ions from wastewaters: A review. J. Environ. Manag. 2011, 92, 407–418. [Google Scholar] [CrossRef]
Figure 1. Scheme of pilot plant including sampling points.
Water 16 00268 g001
Figure 2. Average pH value of the test phases (1–8) and the mean for all test phases of untreated wastewater after the belt filter (microplastic removal) and after the fixed bed (COD removal). n.s. = Not significant, * = highly significant (p < 0.05, t-test, 2 sided, paired).
Water 16 00268 g002
Figure 3. Average particle count of the test phases and the mean for all test phases of untreated wastewater and after the belt filter (microplastic removal)). *** = Highly significant (p < 0.001, t-test, 1 sided, paired).
Water 16 00268 g003
Figure 4. Microscopic images of the filtered wastewater samples before and after treatment from test p 8, batch 4. (Top) Overview image. (Bottom) Image of one of the five squares for counting the particles.
Water 16 00268 g004
Figure 5. Average TSSs of the test phases and the mean for all test phases of untreated wastewater after the belt filter (microplastic removal) and after the fixed bed (COD removal). *** = highly significant (p < 0.001, t-test, 1 sided, paired).
Water 16 00268 g005
Figure 6. Average COD of the test phases and the mean for all test phases of untreated wastewater after the belt filter (microplastic removal) and after the fixed bed (COD removal). *** = Highly significant (p < 0.001, t-test, 1 sided, paired).
Water 16 00268 g006
Figure 7. Correlation analysis of the of the test phases for the parameter’s particle count, TSSs, turbidity and COD. A linear regression is performed using the Pearson correlation method. The numbers present the correlation coefficient.
Water 16 00268 g007
Disclaimer/Publisher’s Note: The statements, opinions and data contained in all publications are solely those of the individual author(s) and contributor(s) and not of MDPI and/or the editor(s). MDPI and/or the editor(s) disclaim responsibility for any injury to people or property resulting from any ideas, methods, instructions or products referred to in the content.

