Article

Analysis of Spatiotemporal Variation Characteristics and Driving Factors of Drought in Yinshanbeilu Inner Mongolia Based on a Cloud Model

1
School of Water Conservancy, North China University of Water Resources and Electric Power, Zhengzhou 450046, China
2
Yinshanbeilu Grassland Eco-Hydrology National Observation and Research Station, China Institute of Water Resources and Hydropower Research, Beijing 100038, China
3
Institute of Water Resources of Pastoral Area, Ministry of Water Resources, Hohhot 010020, China
*
Author to whom correspondence should be addressed.
Water 2024, 16(2), 265; https://doi.org/10.3390/w16020265
Submission received: 5 December 2023 / Revised: 30 December 2023 / Accepted: 8 January 2024 / Published: 11 January 2024
(This article belongs to the Section Water and Climate Change)

Abstract

:
Drought refers to a meteorological disaster that results in insufficient soil moisture due to a long-term lack of rainfall and disrupts the moisture balance of crops. Yinshanbeilu in Inner Mongolia is an arid and semi-arid region, and the onset of drought and its subsequent transmission is a key challenge in water resource management. This study takes Yinshanbeilu as the study area, analyses the changing characteristics of multi-timescale drought from 1971 to 2020 based on the Standardised Precipitation Index (SPI), and analyses the stochasticity and stability of the drought by using a cloud model. Finally, the cross-wavelet transform method and Pearson’s test are used to explore the correlation between atmospheric circulation factors, PRE and PET, and drought. The results indicate that (1) on the annual scale, the frequency of drought in Yinshanbeilu mainly ranges from 22% to 28%, with a high frequency of light droughts, a low frequency of severe droughts, a high frequency of droughts in the east and west, and a low frequency of droughts in the north and south; on the seasonal scale, the frequency of droughts in winter is the highest, with a rate of 34.6%, and the lowest frequency of droughts is in autumn, with a rate of 28.3%. (2) There is a decreasing trend in Entropy (En) and Hyper-Entropy (He), and an increasing trend in Expectation (Ex) for the inter-annual SPI-12 cloud model. Spatially, Ex and He are negatively correlated, while En and He are positively correlated. The inter-annual variation in cloud eigenvalues is greater than the inter-site variation, so the cloud model better reflects the spatial stochasticity and stability of regional inter-annual SPI. For the seasonal-scale SPI-3 cloud model, Ex is smaller in all seasons, En is also smaller, and He is larger. (3) Sunspot, PRE (precipitation), and PET (Potential Evapotranspiration) are all positively correlated with SPI and have the highest correlation. This study reveals the characteristics and causes of variations of drought in Yinshanbeilu, which can be applied to future research areas related to regional drought risk management.

1. Introduction

As human society continues to develop and global warming increases, the damage caused by drought is becoming more serious [1]. While the global average annual economic loss due to drought disasters was USD 17.33 billion in 1980–2009, the average annual economic loss due to drought disasters increased to USD 23.125 billion in 2010–2017, far outpacing the increase in other meteorological hazards [2,3]. China is a drought-prone country, and in recent years, global climate change has caused a decrease in precipitation and an increase in evaporation in the region, which in turn has led to an increase in the frequency and intensity of droughts, as well as a trend towards a widening of the scope of their impacts [4,5]. Drought is an important environmental constraint for Yinshanbeilu as an important ecological barrier in China, so there is an urgent need to systematically analyse the spatial and temporal characteristics and causes of drought in order to gain a more comprehensive understanding of drought [6].
Constructing a drought index is an effective method for analysing drought, and choosing an objective and reasonable drought index can effectively assess the drought situation in different regions [7,8,9]. Drought indices include the standardized precipitation index (SPI) [10], the Palmer Drought Severity Index (PDSI) [11], the Precipitation anomaly (Pa) [12], and the Standardized Precipitation Evapotranspiration Index (SPEI) [13]. SPI, based on station precipitation, is favoured by many because of the ease of access to the required rainfall information and the simplicity of the calculation [14,15], and has been widely used in research for identifying drought events in different regions [16], evaluating drought indicators [17], analysing the intensity of drought [18], analysing the frequency of drought [19], identifying drought-prone areas [20], as well as monitoring and evaluating drought [21].
In practice, the manifestations of uncertainty tend to be more complex and confusing due to the variety and complexity of factors affecting the drought situation [22]. The SPI calculated from precipitation data has a high degree of uncertainty, and in order to quantify this uncertainty, Li et al. [23] proposed the concept that combines qualitative and quantitative aspects based on the correlation characteristics of stochastic and fuzzy uncertainty to characterize uncertainty. Nowadays, cloud modelling theory has become a reliable tool for moving from qualitative descriptions to quantitative calculations, and its methods are widely used in drought characterisation studies. Bai et al. [24] analysed the spatial and temporal evolution characteristics of drought in northern Anhui Province based on the cloud model, and concluded that future drought disasters in northern Anhui will show a more serious trend with the increase of latitude. Fu et al. [22] analysed the drought characteristics of the Haihe Plain from 1955 to 2017 using SPI and cloud models, and concluded that the frequency of droughts in the region decreases with increasing drought class. Guo et al. [25] analysed agricultural droughts in the Songliao Plain from 1981 to 2016 based on the Copula function and cloud model to derive the frequency of crop droughts during different growing periods.
Yinshanbeilu is an arid and semi-arid region, and it is highly affected by drought. Although there have been some studies on the spatial and temporal distribution of drought in the region, there are few studies on drought drivers in combination with large-scale circulation factors, PET and PRE. In addition, the existing studies mainly focus on the evaluation of the applicability of drought indicators [26], drought characterization [27], drought modelling projections [28,29], and agricultural drought [30,31], while relatively few studies have been conducted on the spatial and temporal distribution of drought using cloud models.
The main research objectives of this paper are (1) to analyse the spatial and temporal characteristics of meteorological drought in Yinshanbeilu from 1971 to 2020; (2) to clarify the spatial stochasticity and stability of SPI; and (3) to identify key drivers of drought using general circulation factors, PET and PRE.

2. Data and Methodology
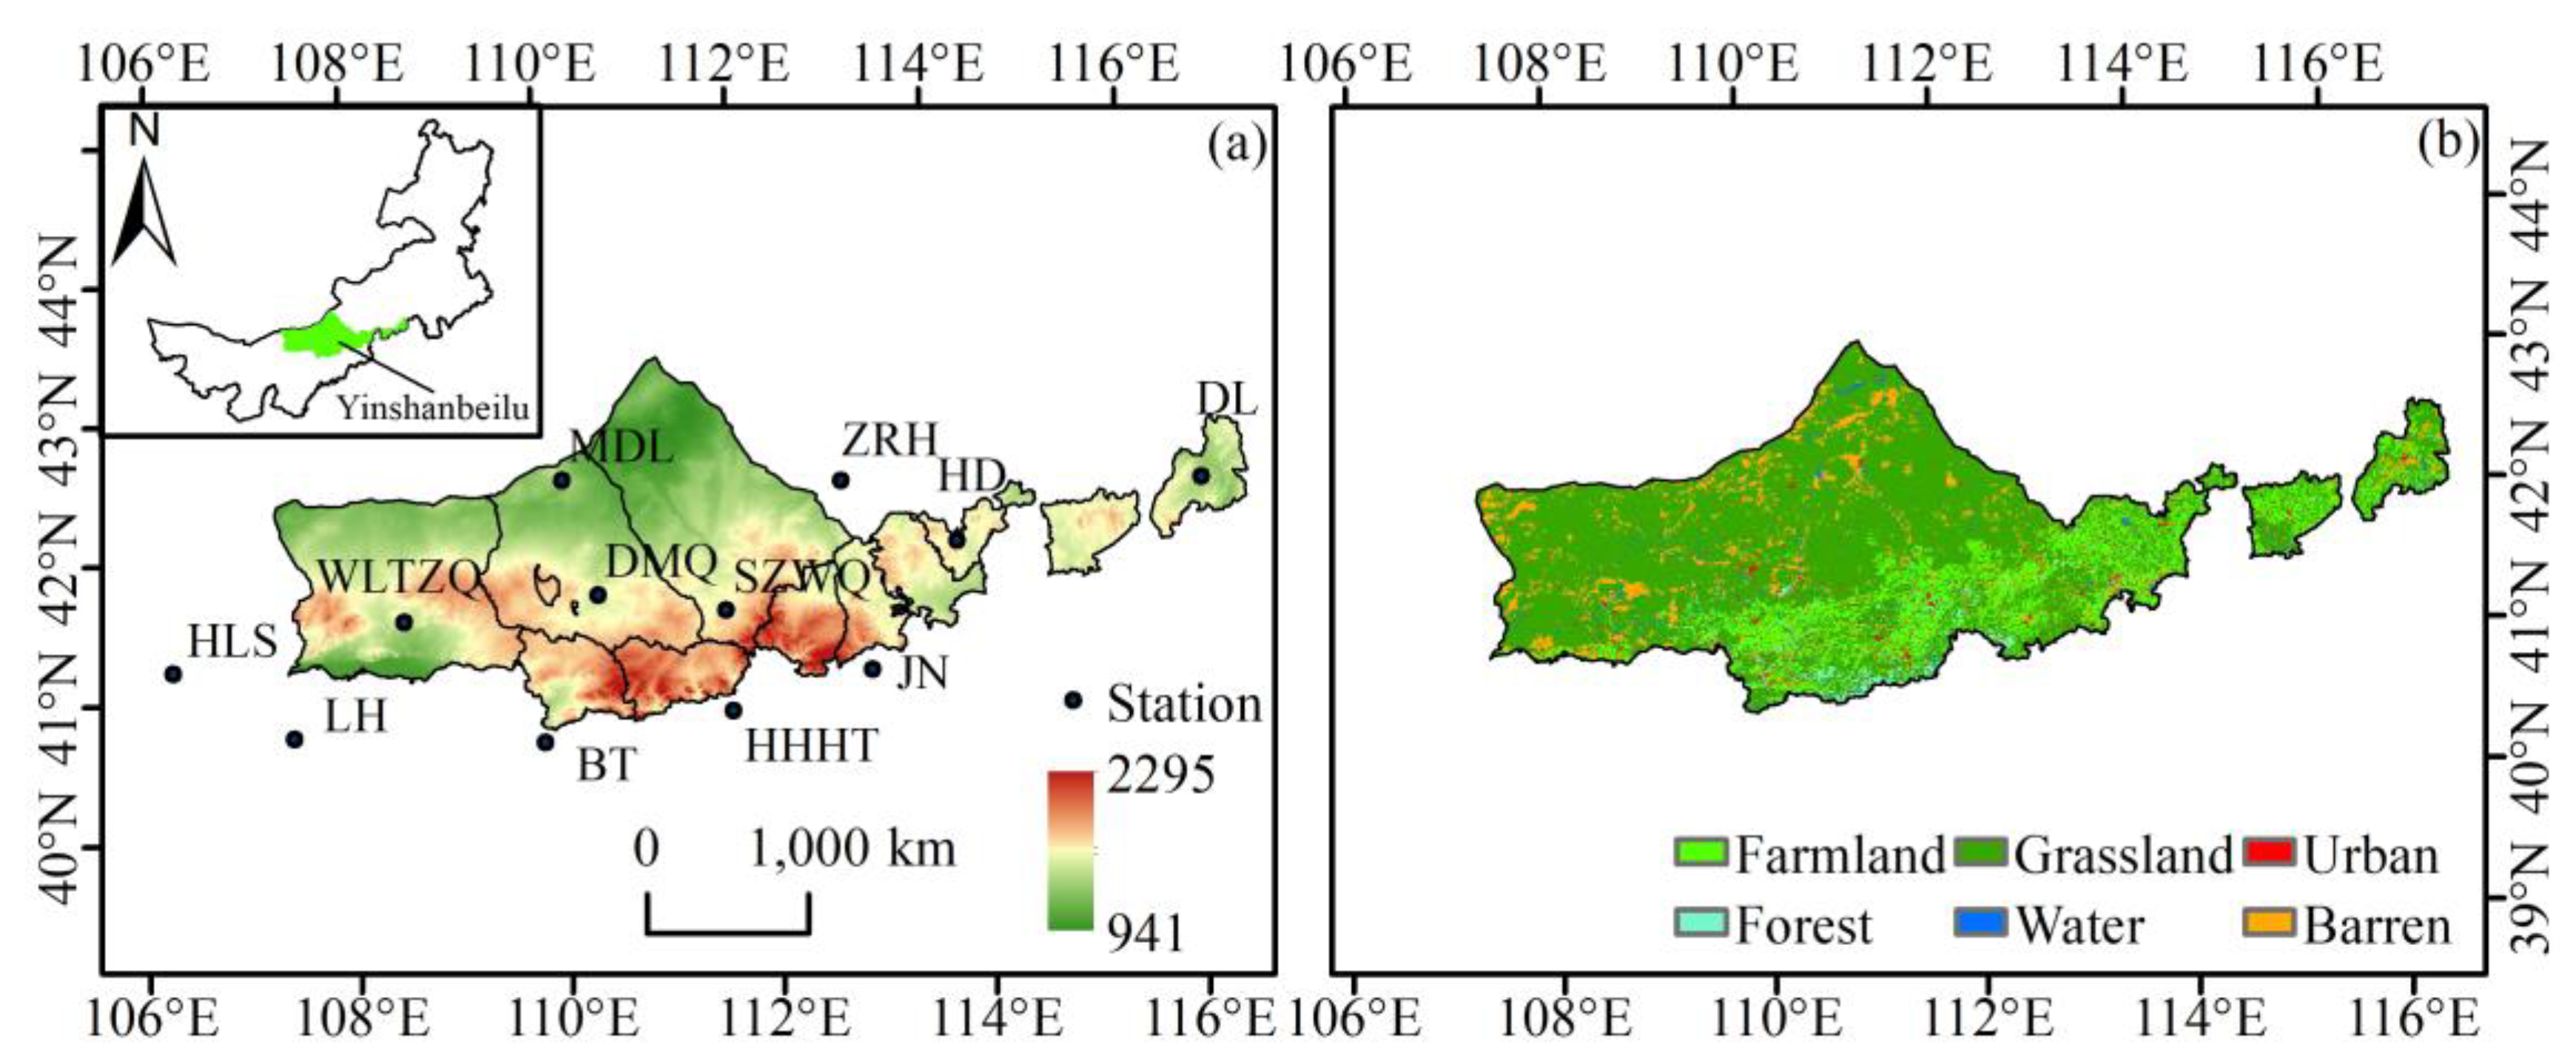
2.1. Study Region

Yinshanbeilu is located in the centre of the Inner Mongolia Autonomous Region, with geographic coordinates 107°17′~117°30′ E, 40°13′~42°28′ N [32]. The study area is a typical arid and semi-arid region with an average elevation of 1600 m and a total area of 96,524.0 km2, where the heat and cold are intense, and there is a big difference in temperature between day and night [33]. The Yinshanbeilu area and its 12 basic meteorological stations are shown in Figure 1.

2.2. Data Source

The data in this study were selected from the day-by-day precipitation data of 12 basic meteorological stations in the Yinshanbeilu of Inner Mongolia from 1971 to 2020. Daily precipitation data were used as the basis for SPI calculations after consistency tests and missing data were interpolated and extended using linear regression. As shown in Table 1, the data were selected from six global large-scale climate factor data from 1971 to 2020, including ENSO (El Niño-Southern Oscillation), PDO (Pacific decadal oscillation), AO (Atlantic oscillation), NAO (North Atlantic oscillation), AMO (Atlantic multidecadal oscillation), sunspot, and also PET (Potential Evapotranspiration) and PRE (precipitation) data.

2.3. Research Methodology

2.3.1. SPI and Drought Levels

In this paper, we use SPI-3 and SPI-12 to characterize the degree of drought in Yinshanbeilu. We often use the Γ distribution to characterise drought conditions, and then obtain the SPI by normalising the cumulative probability [18,34], with the SPI calculated as (1):
S P I = s t c 2 t + c 1 t + c 0 d 3 t + d 2 t + d 1 t + 1.0
where t = l n 1 H 2 , H is the drought probability associated with the Γ; s are the positive and negative coefficients of the probability density, when H > 0.5 and s = 1, and when H 0.5 , s = −1; c0 = 2.515517, c1 = 0.802853, c2 = 0.010328, d1 = 1.432788, d2 = 0.189269, d3 = 0.001308.
According to the literature [35], SPI corresponds to 5 levels; see Table 2.

2.3.2. Drought Frequency

Drought frequency refers to the frequency of occurrence of a certain drought level at a site, calculated by the formula:
p i , j = n i , j N × 100 %
where p i , j is the drought frequency; N is the total number of years, 50 in this paper; and n i , j is the SPI of 12 meteorological stations in the Yinshanbeilu region at different time scales for 50 years.

2.3.3. Cloud Generator Algorithm

Li et al. [23] proposed a conversion model between qualitative concepts and quantitative descriptions in probabilistic and fuzzy mathematics. The core of this model is to realise the mapping between qualitative and quantitative by constructing a cloud generator, which can effectively solve the ambiguities and uncertainties arising in the process of drought evaluation. The numerical definition of cloud can be explained as follows [36].
The cloud model can characterise the quantitative features of a qualitative concept in its entirety using only three numerical eigenvalues, Ex, En and He.
(1)
Ex is equivalent to the expected value rank-squared estimate in statistical theory, reflecting the expected value of the spatial distribution of the thesis domain, i.e., the spatial distribution of the centre of gravity of the cloud droplets.
(2)
En corresponds to the variance of the likelihood distribution in statistical theory, reflecting the range of cloud drops accepted by the qualitative concepts in the domain space.
(3)
He corresponds to the hyperparameters in statistical theory and is a measure of uncertainty in entropy.
Normal cloud generators are divided into two categories: forward cloud generators and inverse cloud generators. The forward cloud generator is a mapping from qualitative concepts to quantitative values, and the reverse is true for the inverse cloud generator [22]. In this paper, drought is analysed using an inverse cloud generator, which produces cloud droplets based on three numerical eigenvalues (Ex, En, and He) of the cloud, each of which is a concrete implementation of the concept once. Let X be a set =   X = { x 1 , x 2 , , x n } ; the algorithm for the reverse inverse cloud generator is implemented as follows [37]:
E x = 1 n k = 1 n x k
Randomly and reproducibly draw m groups of samples from the set X with r samples in each group (m, r ∈ N*). The sample variance was calculated separately for each group according to Equation (4):
S 2 = 1 r 1 j = 1 r ( x i j E x i ) 2 , i = 1 ,   2 , , m
i E x i represents the sample mean and { s 1 , s 2 , , s m } is the set of normal distribution N(En, He). Then, using the sets x 1 , x 2 , , x n and { s 1 , s 2 , , s m } the En and He are calculated according to Equations (5) and (6):
E n = π 2 · 1 n k = 1 n | x k E x |
H e = S E n 2
The normal cloud model is expressed as follows: if x satisfies x ~ N ( E x , ( E n 1 ) 2 ), where E n 1 is the eigenvalue obeying the normal distribution, and E n 1 ~ N ( E n , H e 2 ) , and the certainty of x on C, µ(x), is satisfied:
μ x = exp   [ x E x 2 2 E n 1 2 ]
Then, we get a certain µ(x) of x as a cloud droplet.

2.3.4. Cross-Wavelet Transform Technology

In this paper, a cross-wavelet approach is used to analyse the correlations of large-scale circulation factors, sunspot, PET, and PRE with SPI-12, so as to explore and reveal the drivers of drought in Yinshanbeilu. The cross-wavelet transform technology combines wavelet variation and cross-spectral analysis, which can better present the resonance period and phase relationship between two non-smooth time series [38]. The theory is as follows: assuming that W n X s and W n Y s are the wavelet transform coefficients of the time series X = x 1 , x 2 , , x n and Y = y 1 , y 2 , , y n , respectively, the cross-wavelet transform is defined as [39]:
W n X Y s = W n X s × W n Y * s
where W n Y * s denotes the complex conjugate of W n Y s .

3. Results and Analyses

3.1. Characteristics of Spatial and Temporal Distribution of Drought

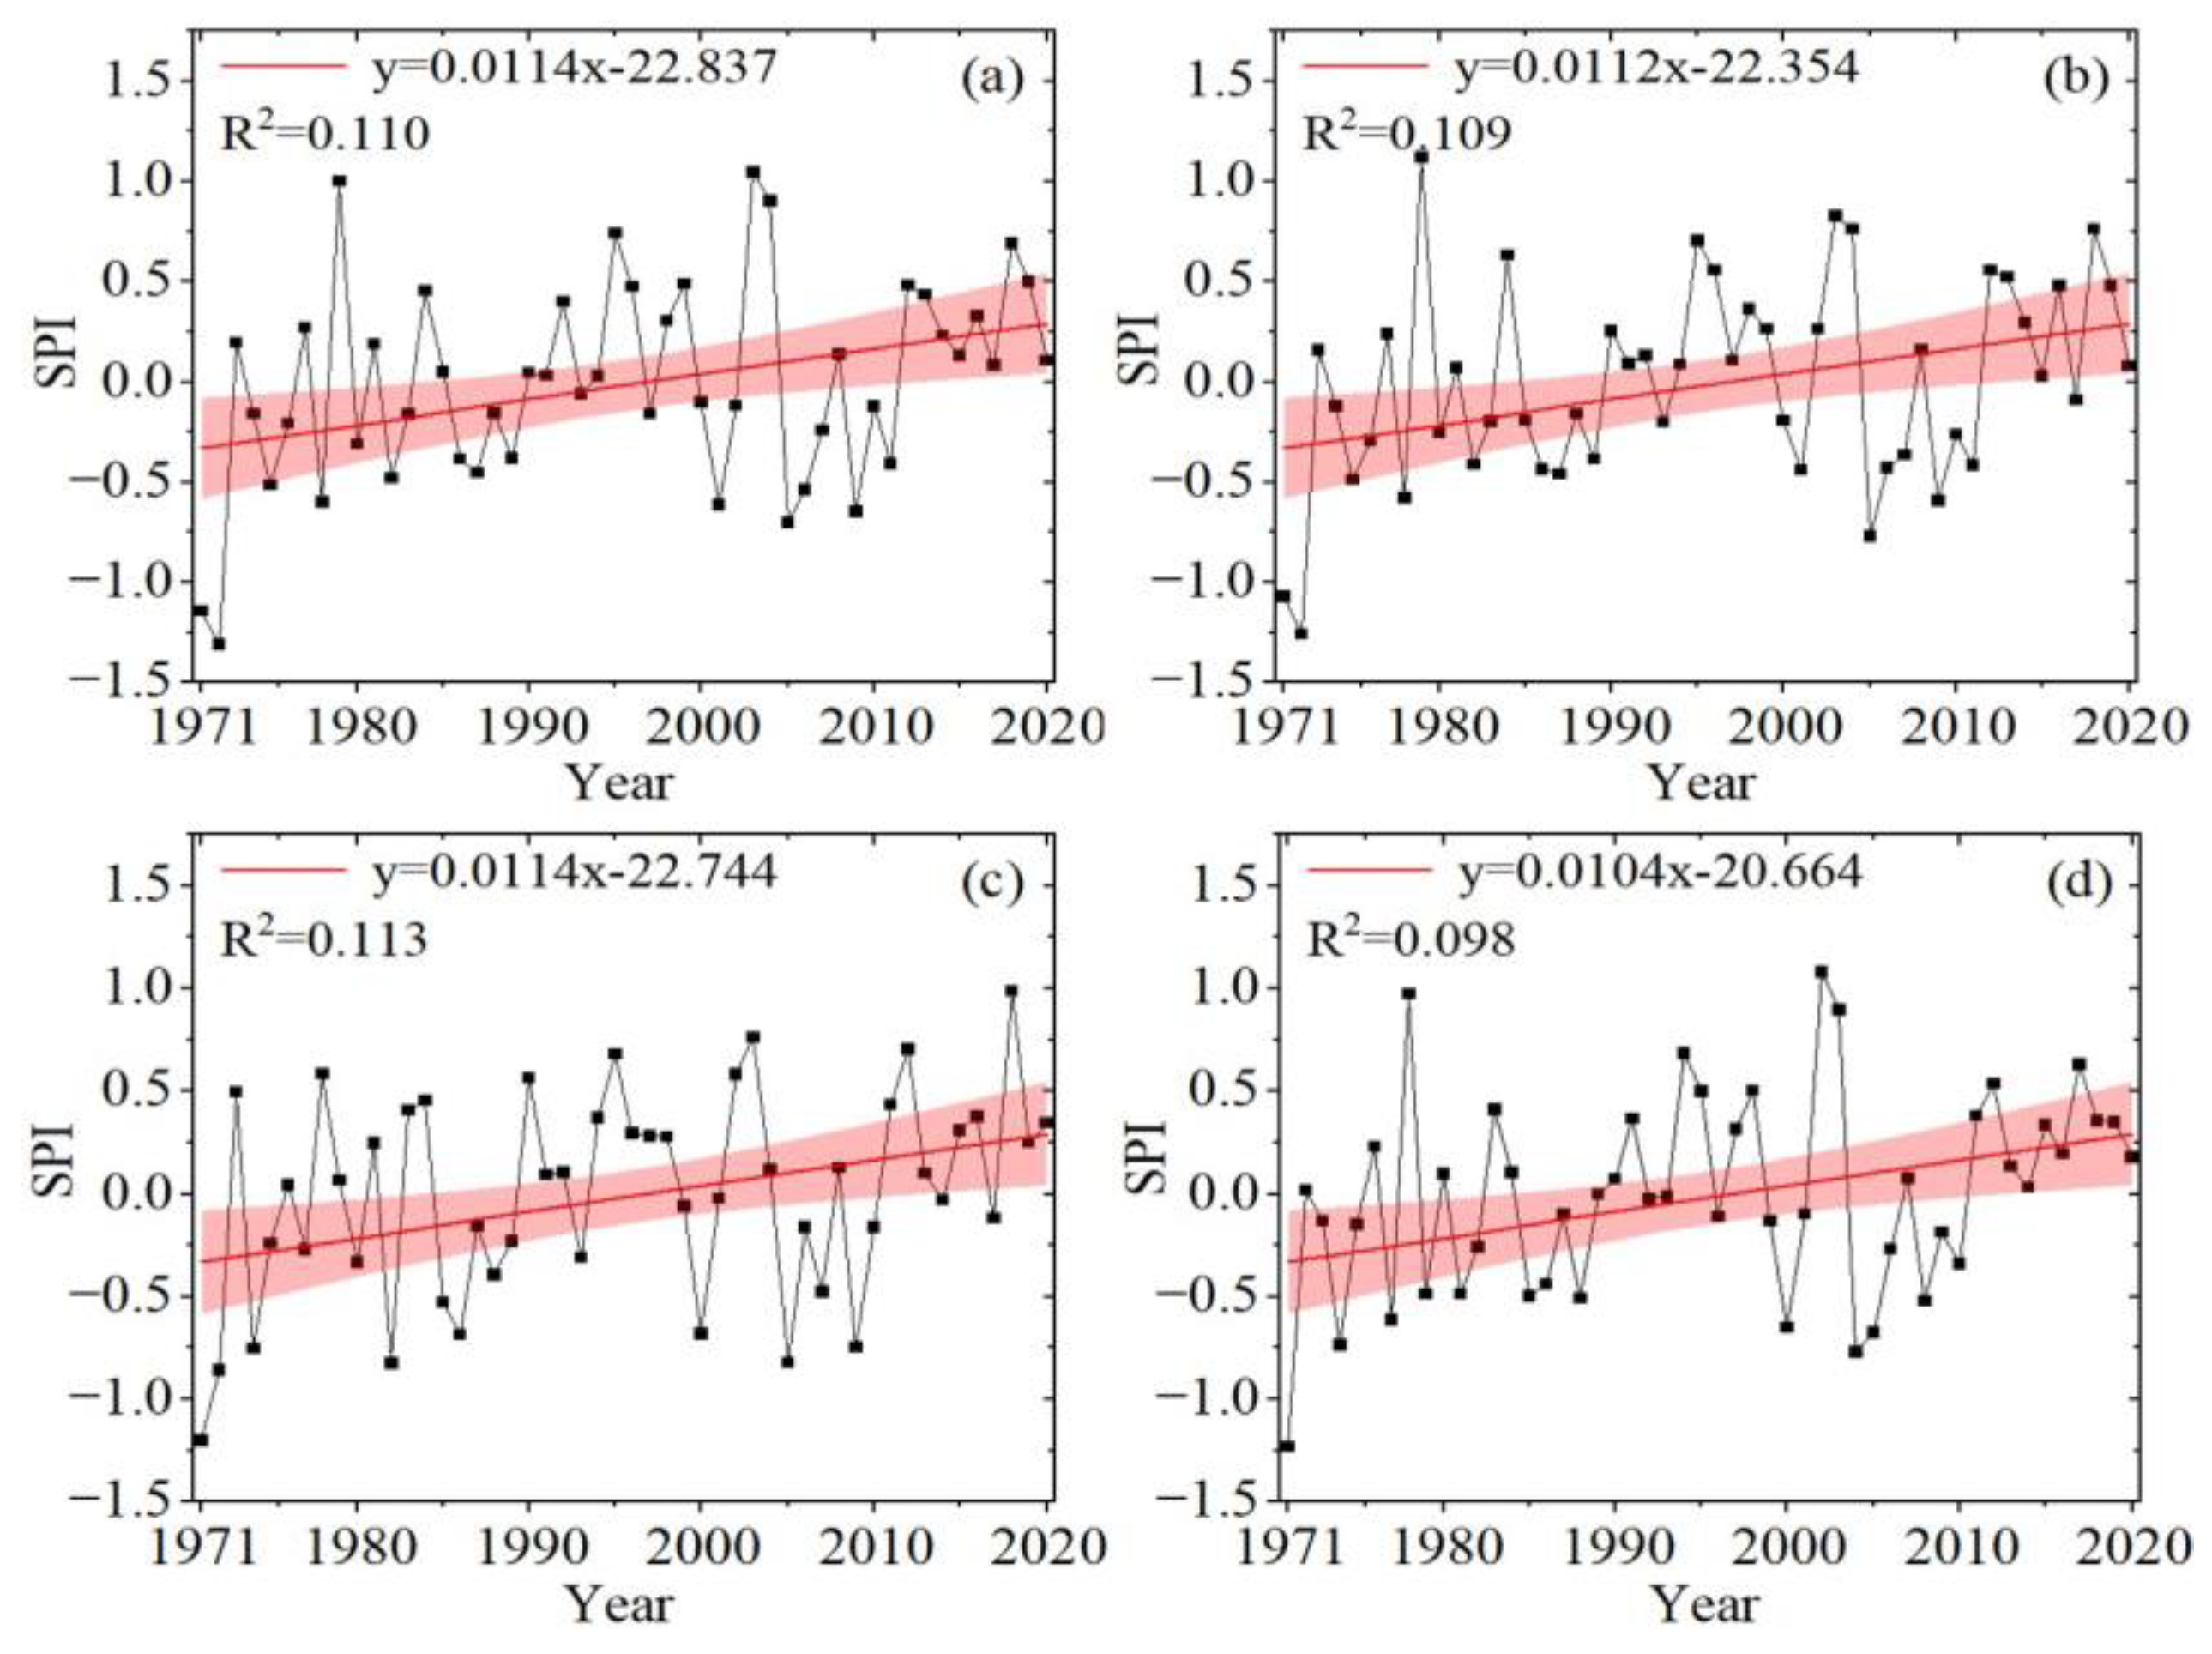
3.1.1. Annual Scale SPI-12 Distributional Characteristics

From the spatial distribution of drought frequencies in Figure 2, it can be seen that the drought frequency in Yinshanbeilu shows a trend of high east–west and low north–south, with the drought frequency distributed in the range of 22–28%, and only Baotou station and Zhurihe station are slightly lower, with a drought frequency of 18%. The mild drought high-frequency zone is highly overlapping with the drought high-frequency zone, mainly distributed between 16 and 24%, with only Baotou station and Hailisu station experiencing a smaller frequency of drought, at 8 and 12%, respectively; the high-frequency area of moderate drought is mainly located in Linghe station, with a frequency of drought of 8%. Areas of high values of severe drought are mainly located in Helisu station, with other areas having a frequency of less than 5%. Extreme droughts occur less frequently in Yinshanbeilu.
It can be seen that the Yinshanbeilu region as a whole is characterised by a high incidence of slight drought and a low incidence of severe drought. As the drought level increases, and the drought becomes more severe, its frequency decreases dramatically. The range of fluctuation between the maximum and minimum drought frequencies at each site becomes smaller and smaller from slight, to moderate, to severe, to extreme drought, with a consequent decrease in inter-regional differences.

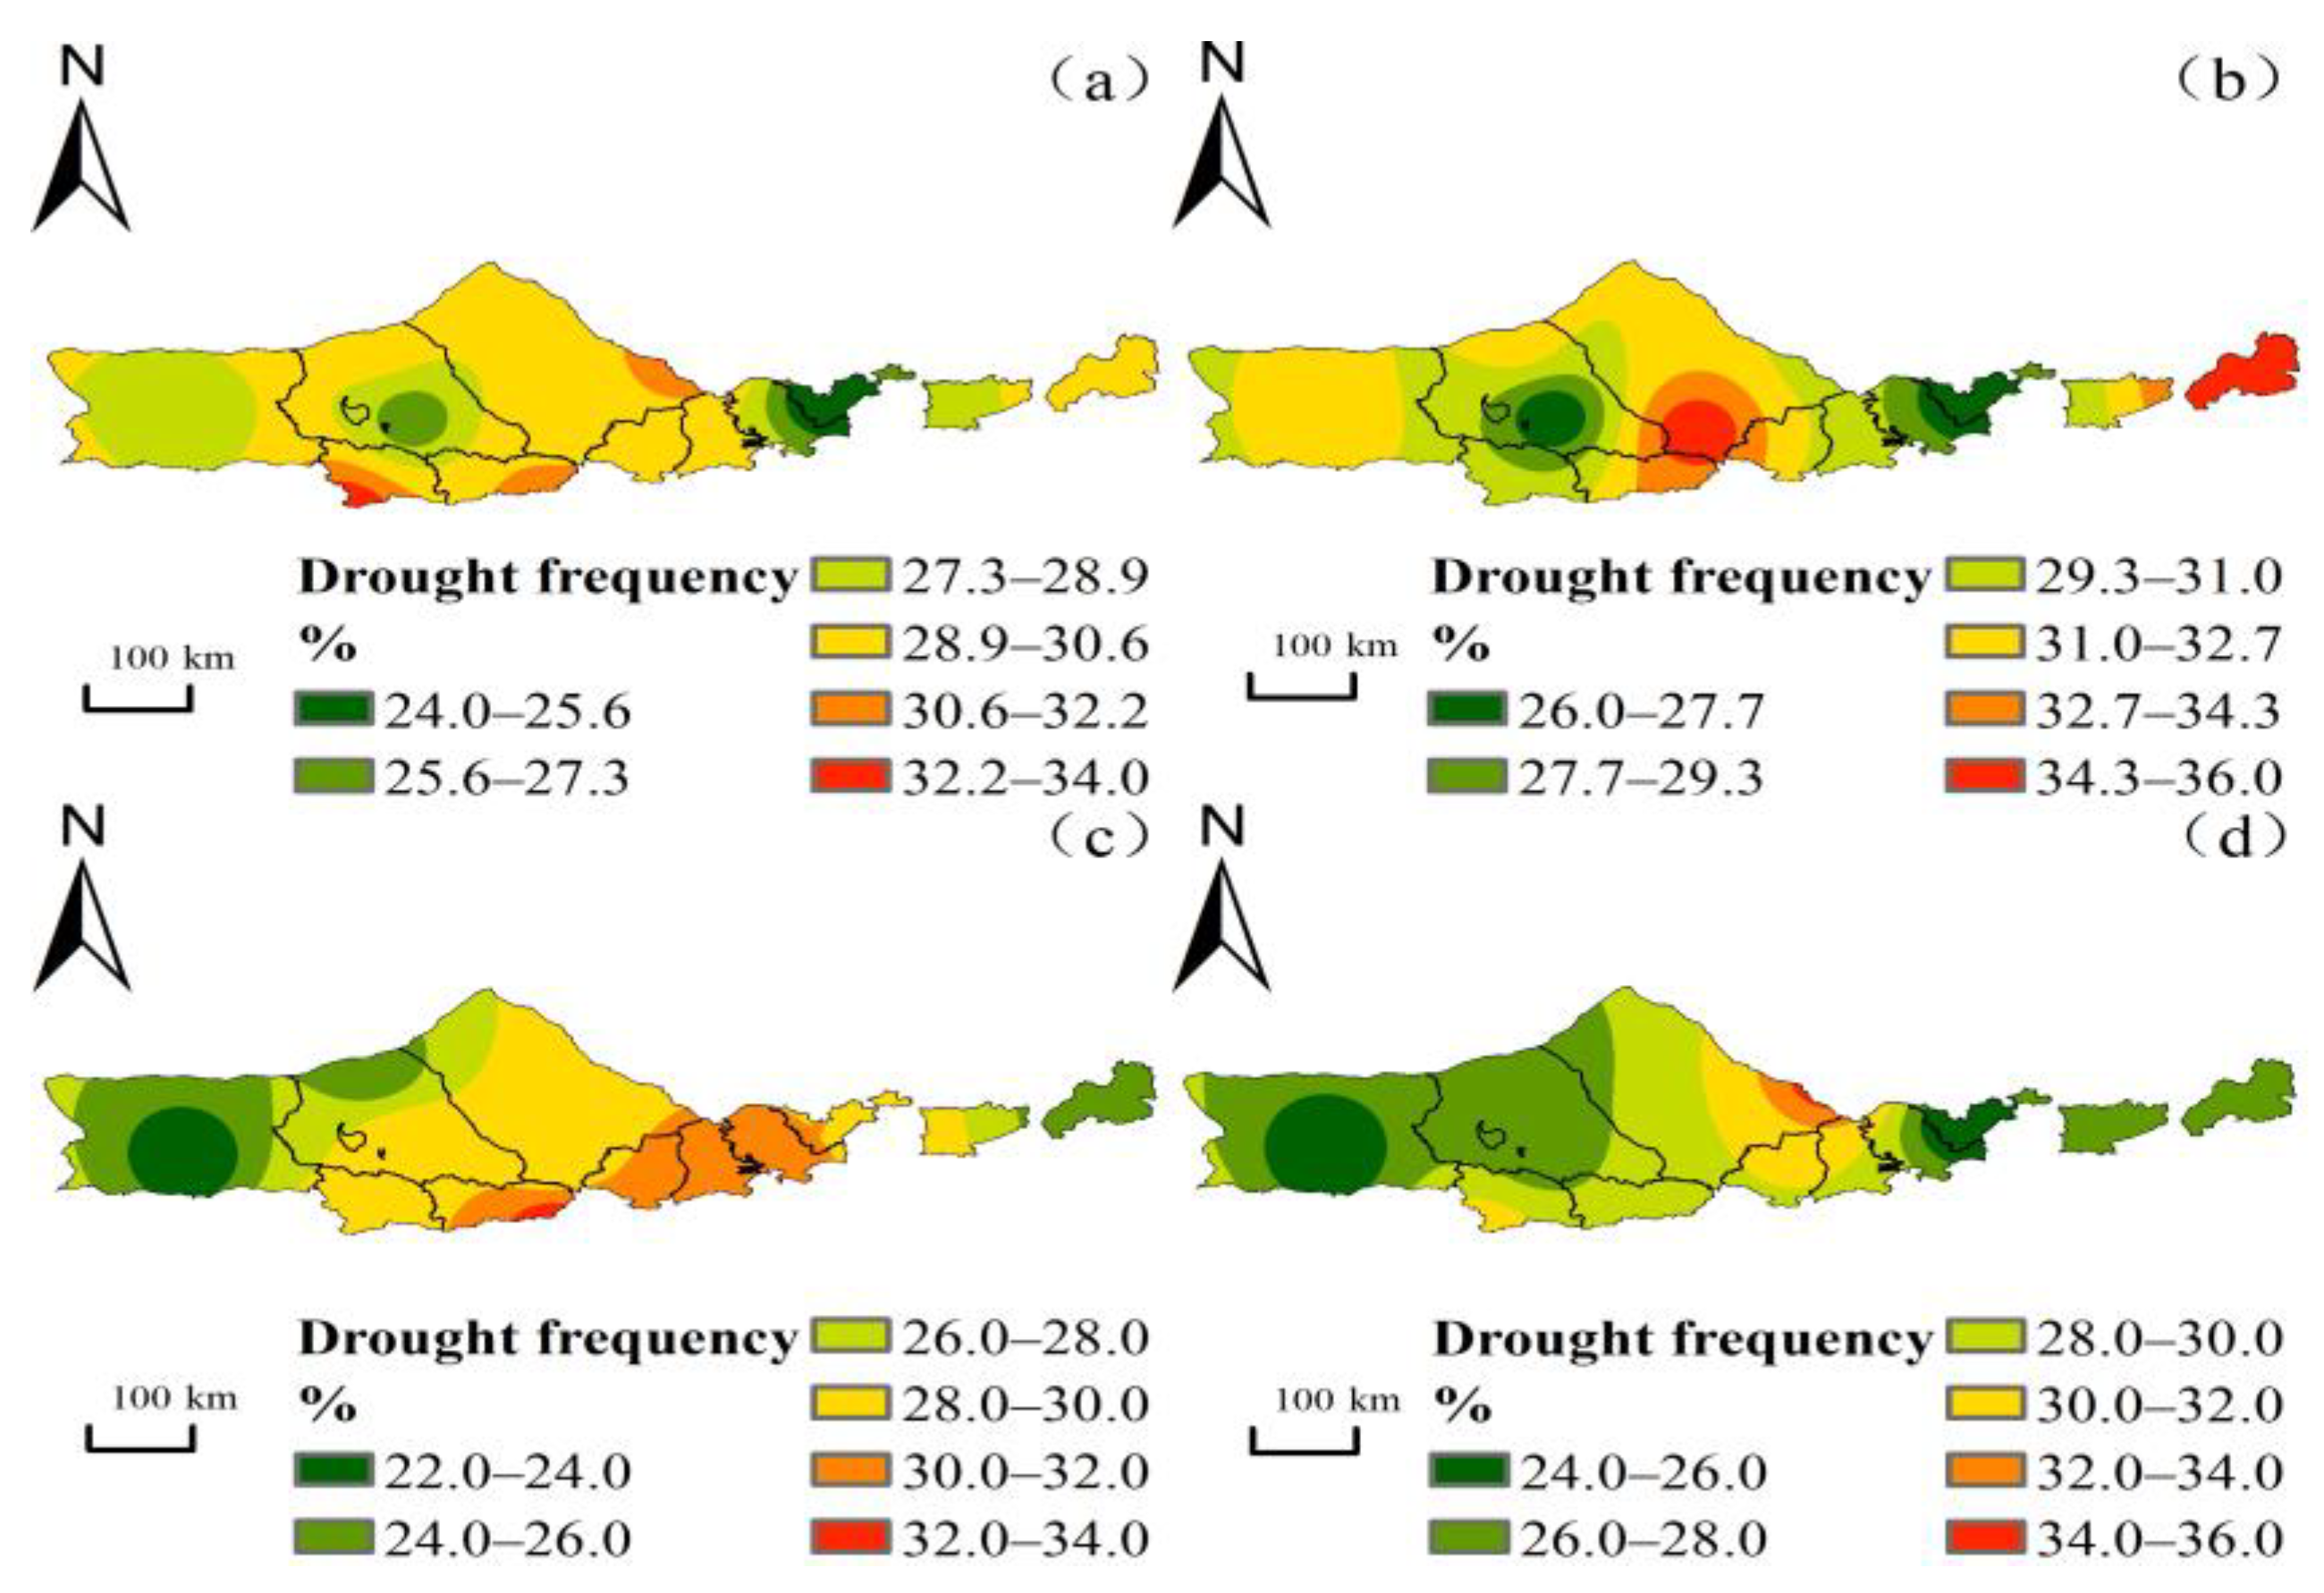
3.1.2. Seasonal Scale SPI-3 Distributional Characteristics

The statistical results of drought frequency in different seasons are shown in Table 3. The frequency of drought in Yinshanbeilu is 29.5% in spring, 31.0% in summer, 28.3% in autumn, and 34.6% in winter. Light drought occurs most frequently in autumn (16.0%), moderate drought in winter (10.6%), and severe drought unexpectedly occurs most frequently in spring (6.7%), while special drought occurs most frequently in all seasons (6.7%). The frequency of special drought was very low in all seasons.
The characteristics of SPI changes at seasonal scales in Yinshanbeilu from 1971 to 2020 are shown in Figure 3. The seasonal-scale SPI-3 in Yinshanbeilu has shown fluctuating trends in the last 50 years. The linear propensity of spring SPI is 0.0114/10a, that of summer SPI is 0.0112/10a, that of autumn SPI is 0.0114/10a, and that of winter SPI is 0.0104/10a. Meanwhile, the mean values of SPI for all four seasons are −0.346 × 10⁻² (spring), −0.059 × 10⁻² (summer), 0.048 × 10⁻² (autumn), and 0.159 × 10⁻² (winter), with minimum values occurring in 1972 (−1.14), 1972 (−1.26), 1971 (−1.20), and 1971 (−1.23), respectively. There were abrupt changes in drought in all four seasons around 1980 and 2000, with a significant increase in drought conditions and a shift from wet to dry again.
Figure 4 shows the distribution of drought frequency in different seasons. The distribution of drought in spring is relatively uniform, with the frequency of drought in most of the rest of the region below 32%, except for Baotou station, Hohhot station, and Zhurihe station. The distribution of summer droughts is also relatively even, with high values in Hohhot station, Siziwangqi station, and Duolun station, and the frequency of droughts in the rest of the country is below 32%. The frequency distribution of autumn drought shows a decreasing trend from south-east to north-west. The high drought frequency areas are mainly located in Hohhot station and Jining station, with a drought frequency distribution of 32–34%, while the rest of the area has a drought frequency distribution of 22–30%. The spatial distribution of winter drought frequency varies considerably, with the high value area located in Zhurihe station, with a drought frequency of 36%, and most of the rest of the region with a drought frequency of less than 30%. Damaoqi, Huade, and Mandula have a low drought frequency in all seasons, and interestingly, Hohhot and Zhurihe, which are close to these three places, have a high drought frequency in all seasons.

3.2. Drought Analysis Based on the Cloud Model

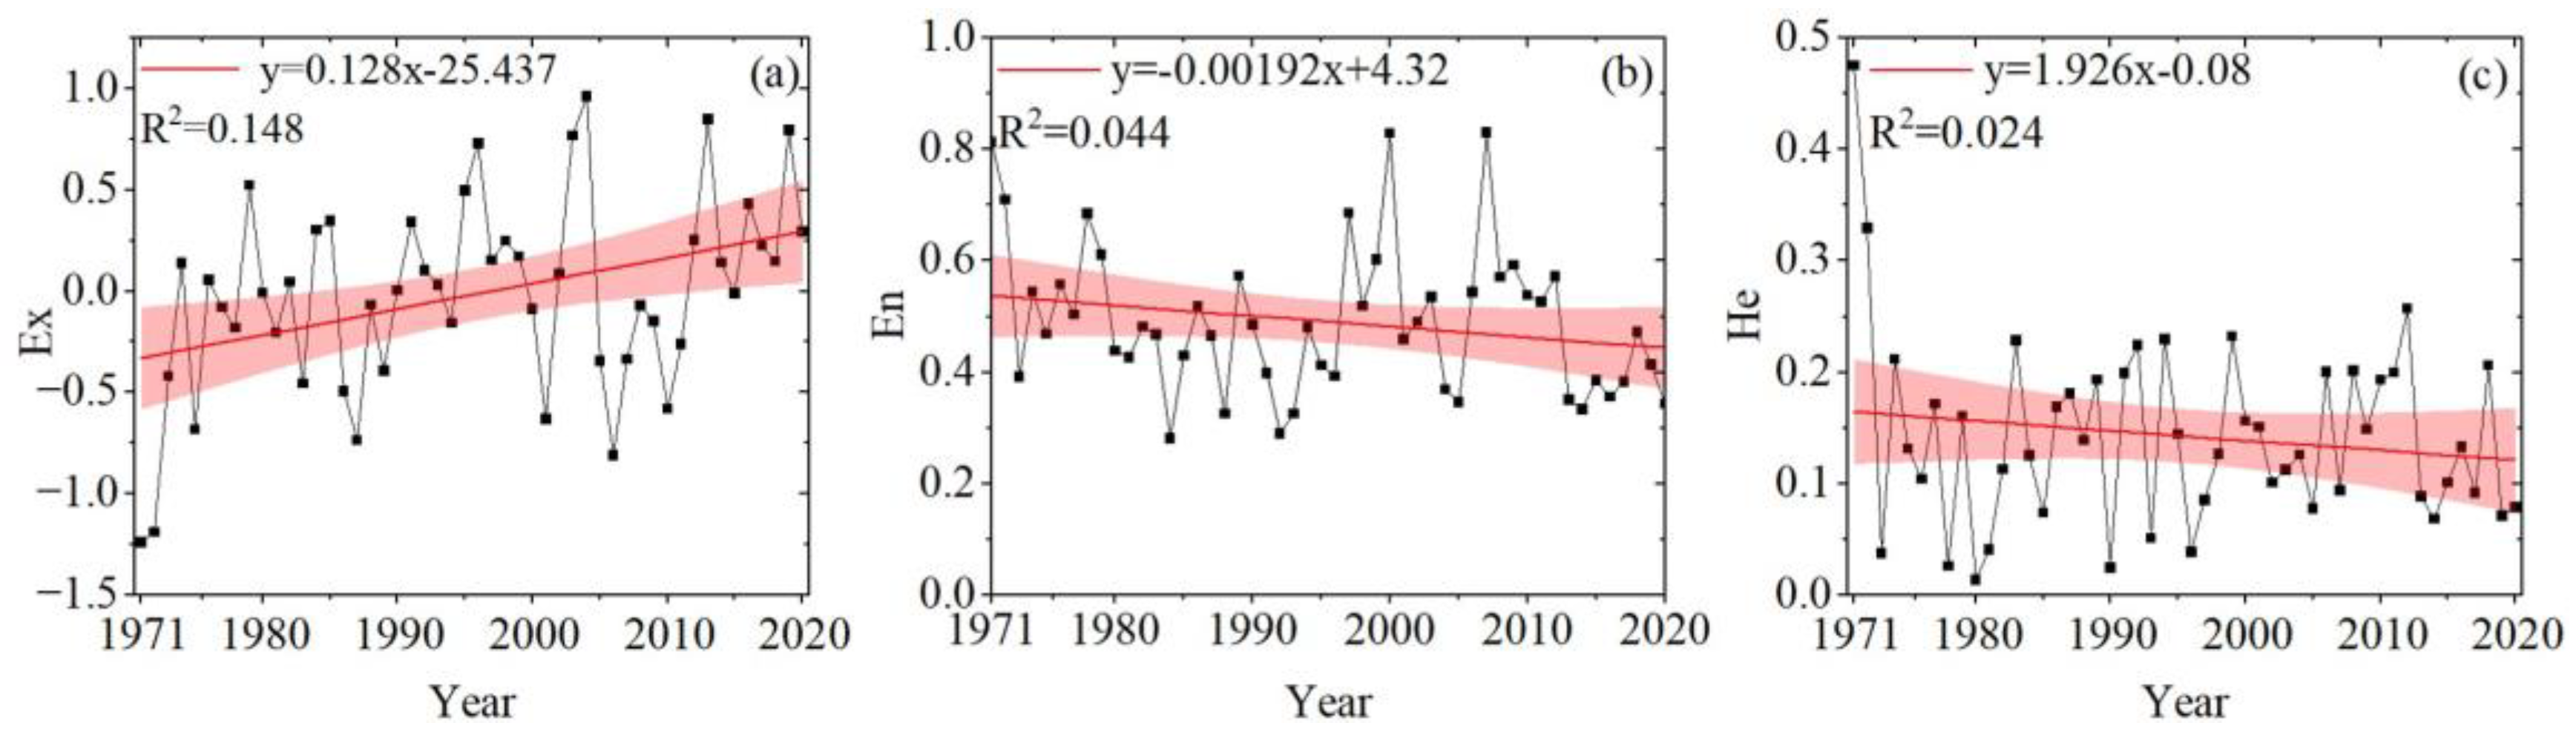
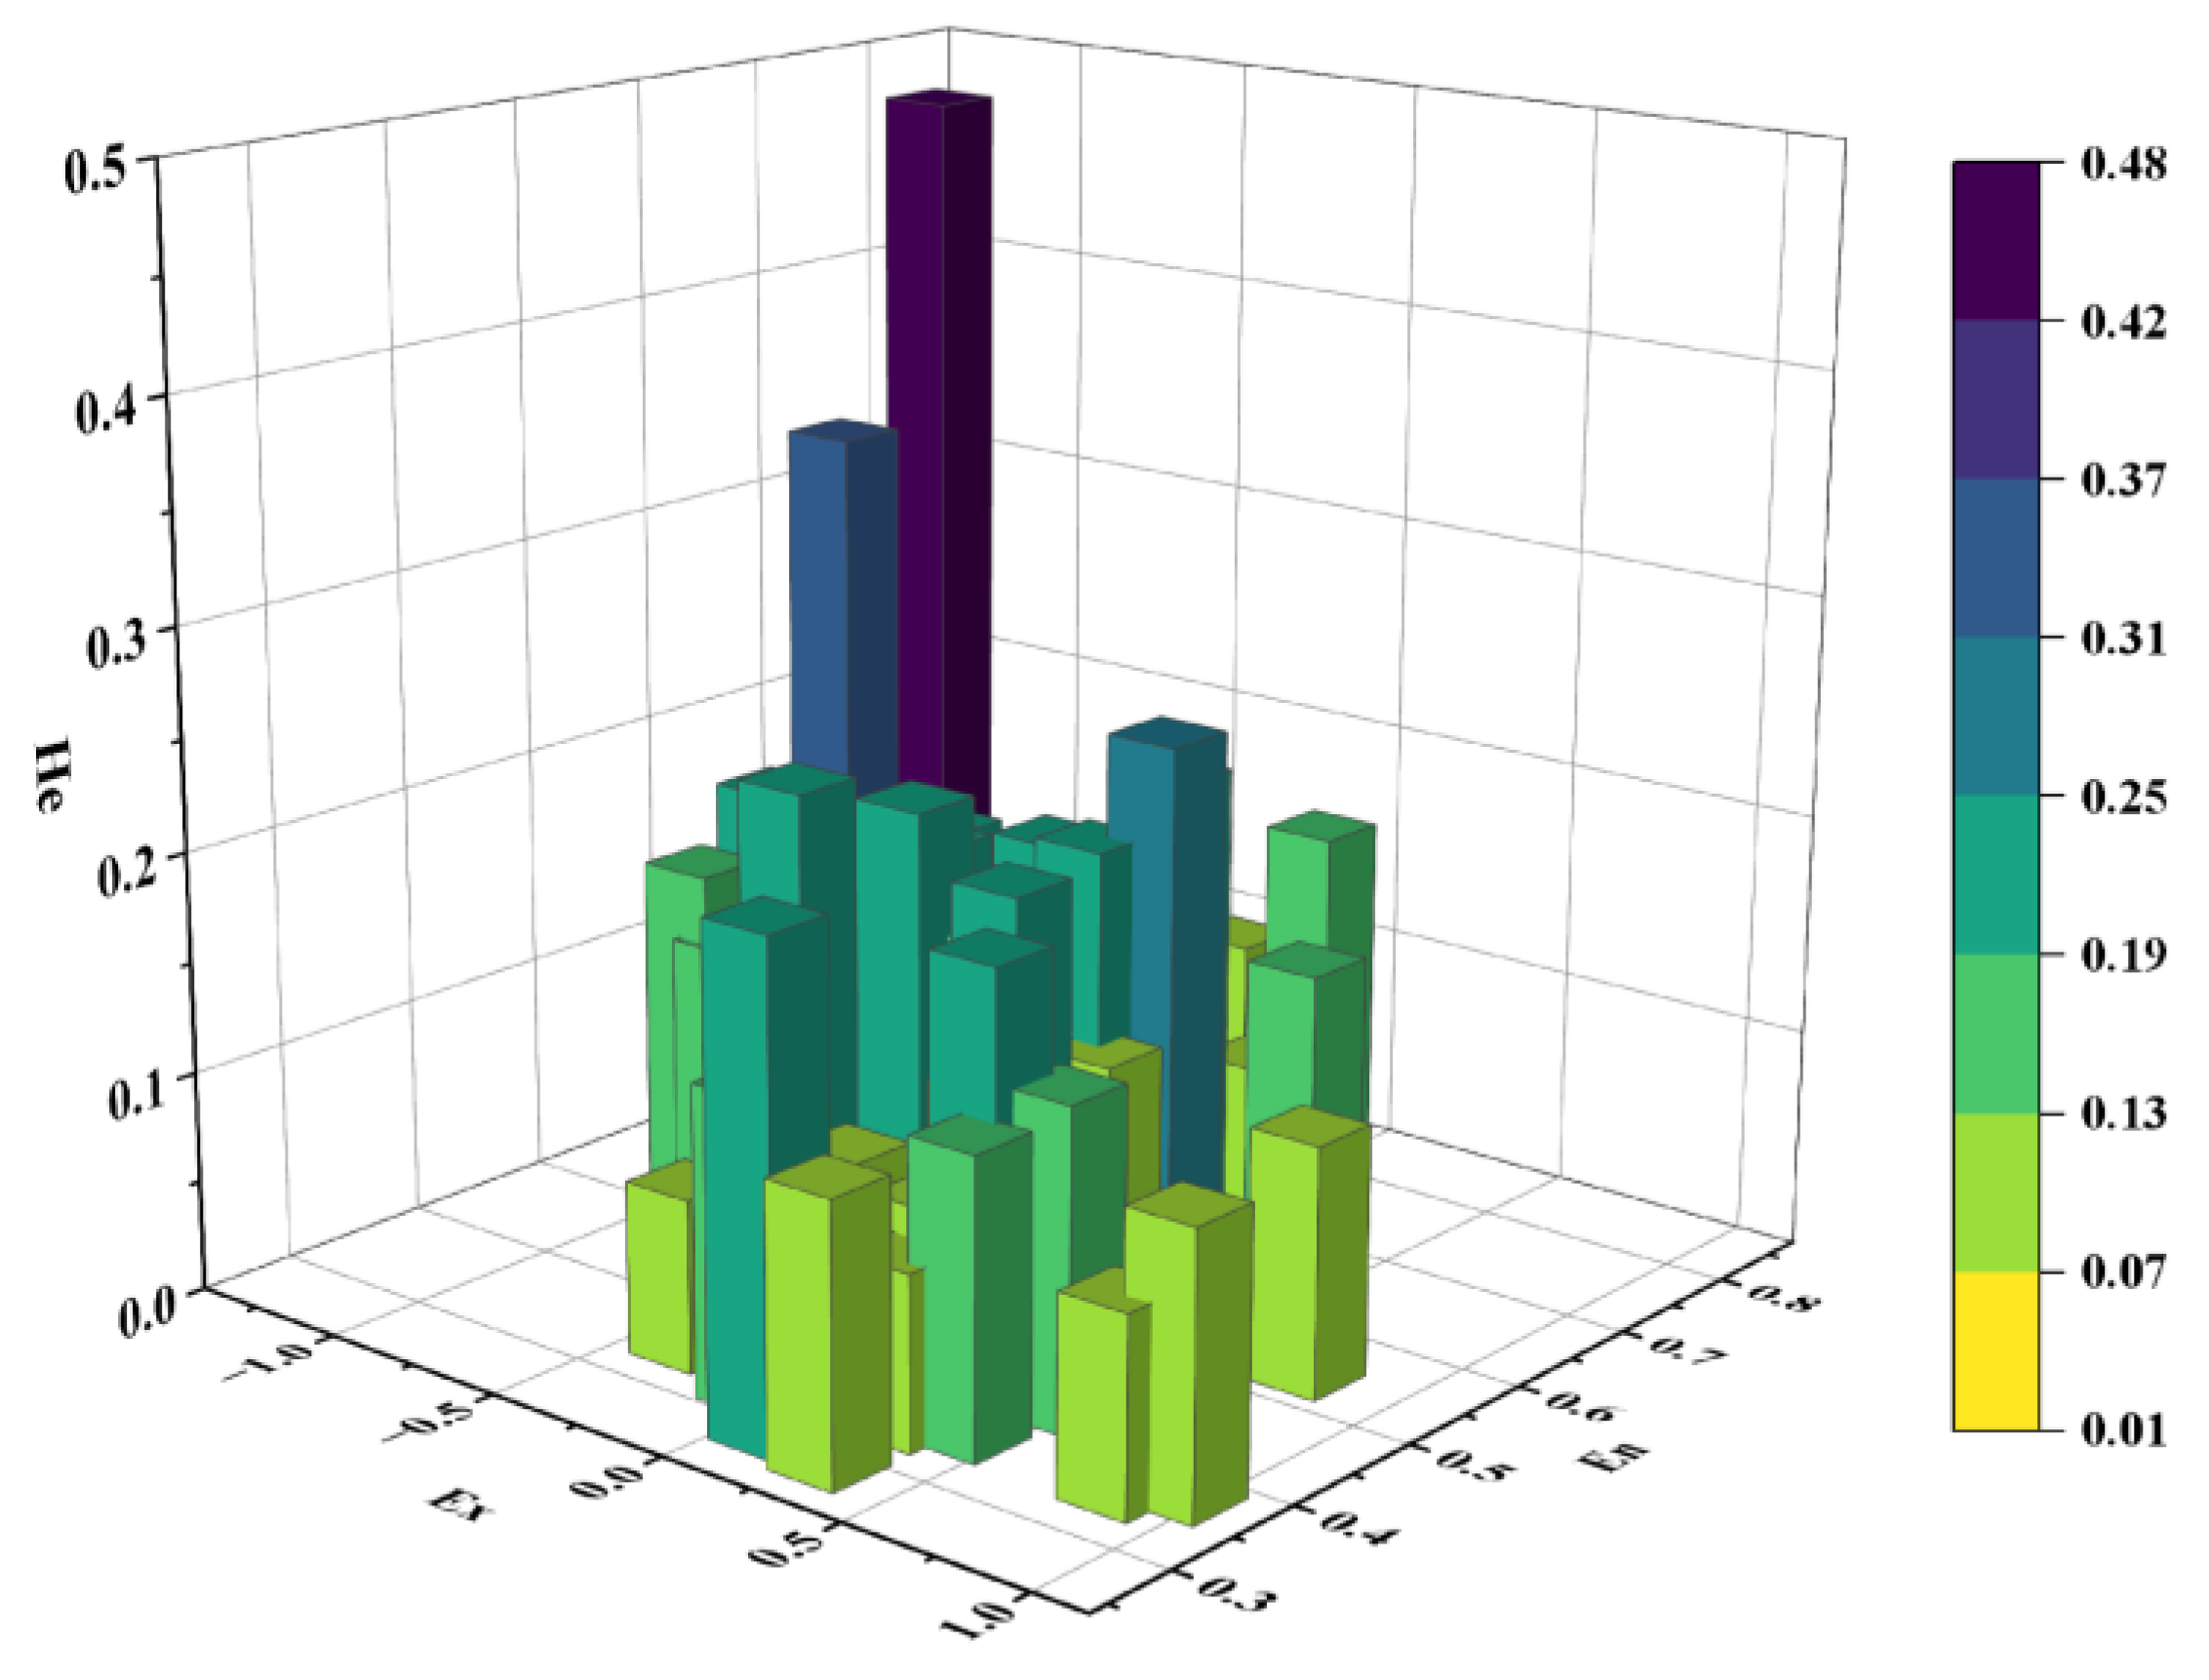
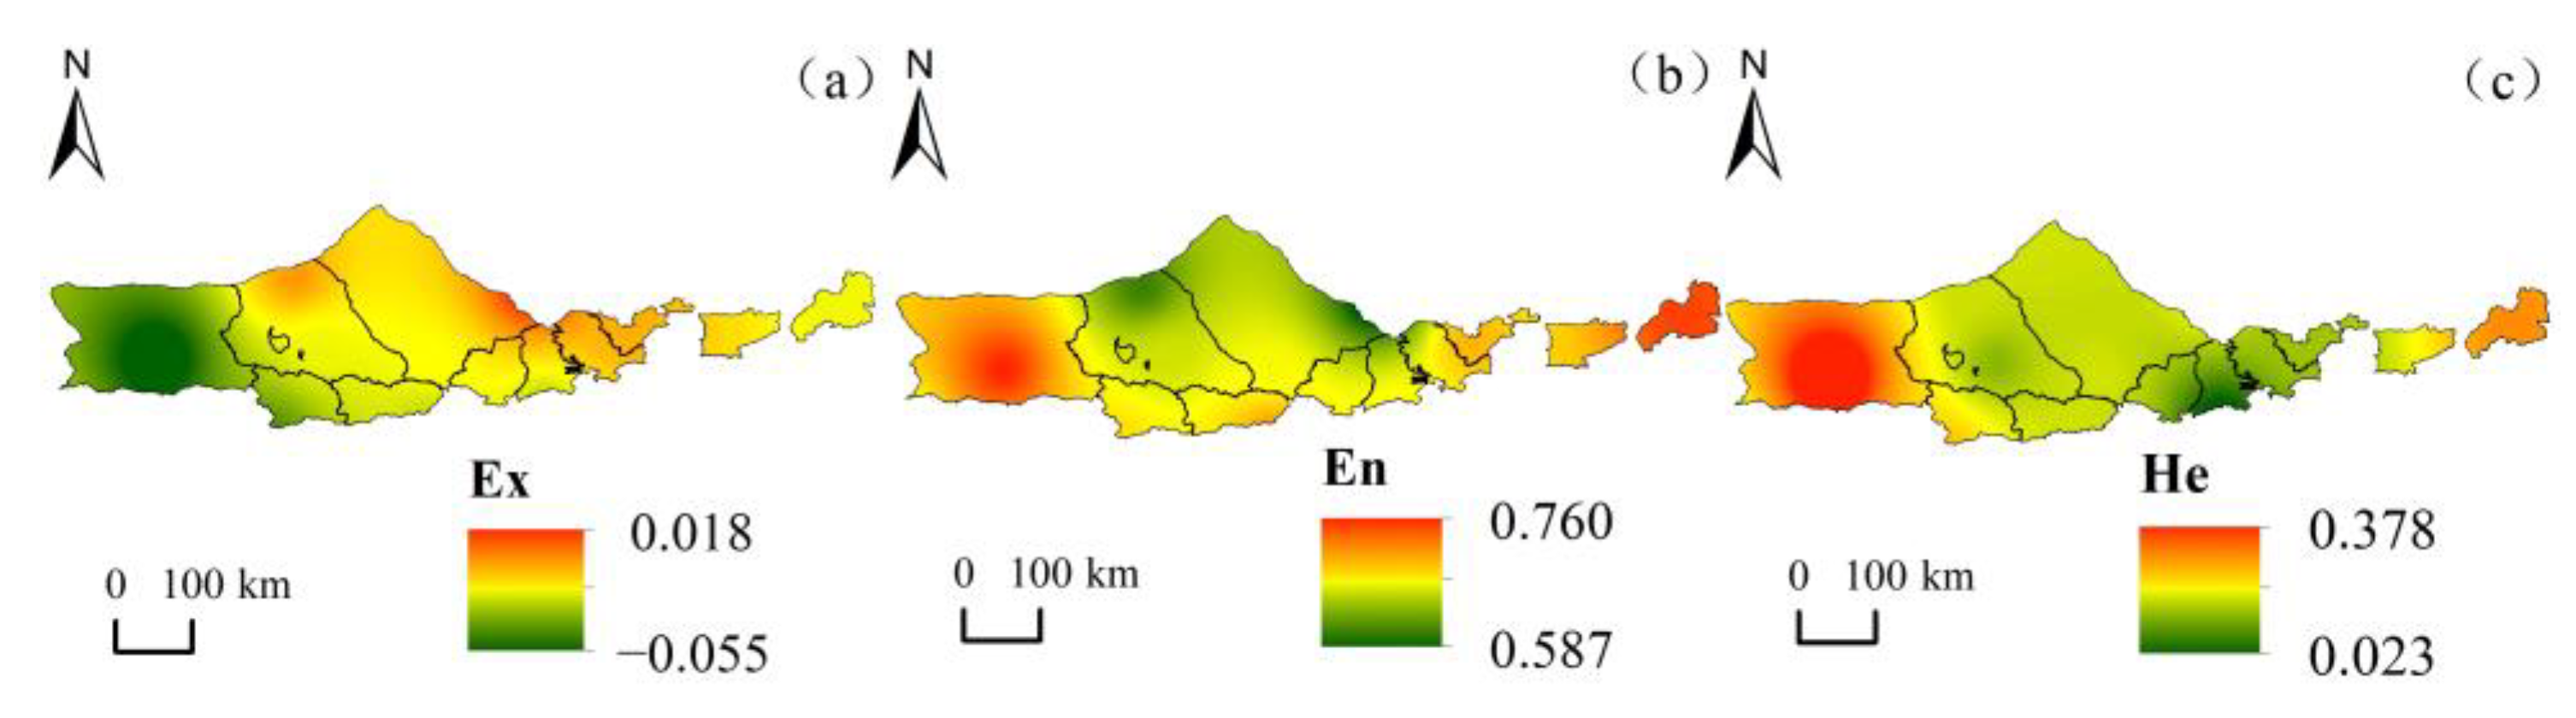
3.2.1. Cloud Characterisation of SPI-12

The annual scale SPI-12 for each of the 12 stations is used as a sample, the cloud eigenvalues of the annual SPI-12 are calculated according to the normal inverse cloud generator, and the process lines of the changes of Ex, En, and He during the 50-year period are plotted and analysed for trends. As shown in Figure 5, the Ex shows an increasing trend over the years, with a linear tendency rate of 1.28/10a, indicating that the intensity of drought in Yinshanbeilu is on a decreasing trend, with a maximum value of 0.964 in 2004, i.e., 2004 was the wettest year. The En shows a fluctuating downward trend expressed as −0.0192/10a; the drought intensity has a uniform trend, with the smallest value occurring in 1984 at 0.28, i.e., 1984 was the most uniform drought year. He showed a decreasing trend with a slope of −19.26/10a and stable drought conditions, with the minimum value of 0.0138 in 1980, i.e., 1980 was the most stable drought year. Therefore, in terms of inter-annual variations, the drought intensity showed a decreasing trend, and the differences in SPI at each site tended to decrease significantly, i.e., the stochasticity of the SPI at each site tended to decrease significantly, with a consequent increase in stability.
The correlation between the three eigenvalues of each meteorological station for 50 years is shown in Figure 6. Ex and He are negatively correlated, while En and He are positively correlated, indicating that as the SPI-12 expectation of each site increases in different years, the corresponding stochasticity and instability diminish, and the drought becomes more uniform and stable. That is, the drought year SPI is more deterministic and stable, and the more random and discrete the year is, the less homogeneous it is.
The 50-year SPI-12 for each site was used as a sample to calculate the single-site cloud eigenvalues, which were spatially interpolated using the IDW, as shown in Figure 7. The SPI-12 expectation for each site is spatially represented by the highest average drought of −0.055 in the western region of Wulatezhongqi station. In contrast, the Zhurihe SPI in the north-east has the greatest expectation, i.e., the lowest degree of drought, at 0.018. En is the largest in Wulatezhongqi station in the west and Duolun station in the east, with 0.760 and 0.752, respectively, suggesting that the distribution of drought in Wulatezhongqi station and Duolun station has the strongest stochasticity and the weakest certainty; Zhurihe station has the smallest En, so its drought distribution is more deterministic. In the spatial distribution of He, the largest He is found in the western part of Wulatezhongqi station, suggesting that this station has the worst inter-annual stability of droughts, and the smallest in southern Jining station, suggesting that its drought is most stable from year to year. Comparing the spatial distribution of the three eigenvalues reveals that there is some consistency in the trend of the spatial distributions of En and He, while the spatial distributions of Ex and En show an opposite trend. In summary, the SPI expectations for each year in the Yinshanbeilu region show the lowest values in the west, with an increasing trend in all directions, and the higher the expectation, the more uncertain but uniform the inter-annual distribution of SPI at the site.
The relationship between the three eigenvalues for the 12 sites is shown in Figure 8. Ex and He showed a negative correlation, while En and He showed a positive correlation. This leads to the conclusion that the higher the degree of drought, the less certain and less homogeneous the drought is between years at the site. In the case of the Wulatezhongqi station, for example, the Ex of SPI-12 at this station is small, −0.055, indicating a high degree of drought in the sense of perennial average. The larger the corresponding En, 0.760, the more stochastic and less deterministic the drought is, and the range of SPI variation becomes wide. He is also larger at 0.378, indicating a high degree of heterogeneity in drought intensity between years.
This paper analyses the correlation of cloud model eigenvalues of annual-scale SPI-12 at 12 meteorological stations in the Yinshanbeilu region, and selects three typical years and typical stations to analyse the stochastic and stability patterns of droughts in the region according to the principle of large parameter differences, respectively.
The years with large differences in En and He (1978, 2000, and 2007) were selected as typical years to map cloud droplets using a normal cloud generator, as shown in Figure 9a–c. The eigenvalues of Figure 9c are the largest in any of the typical yearly plots, and the distribution of cloud droplets in the plot is more scattered, which is due to the fact that the average value of precipitation is larger at all 12 stations in 2007, and at the same time, the difference in SPI among stations is large, with a maximum of 1.11 and a minimum of −1.71, so that the distribution of drought among the stations is the most stochastic and discrete, and also has poor stability. In contrast, 1978, with smaller mean precipitation and an interval of [−1.62, 0.74] for the SPI, was an overall dry year with thin cloud cover and a very cohesive distribution of cloud droplets, with the best deterministic and stable distribution of the SPI among the sites. The SPI interval for 2000 is [−1.43, 1.13], so the distribution range and cohesion of the SPI cloud droplets are in the middle.
The same method was used to select three typical stations, Hailisu, Huade, and Jining, to plot the cloud maps of SPI for different years at each station (Figure 9d–f). The relatively small difference between the SPI affiliation cloud plots of the three typical stations is due to the fact that the three eigenvalues of the cloud model do not differ much, Ex is close to 0 for all stations, and En and He are both relatively large.
The comparison of typical year cloud patterns and typical seasonal cloud model eigenvalues shows that the range of typical year eigenvalues is larger than typical station eigenvalues. The distribution of cloud droplets suggests that typical years are somewhat more variable than typical inter-site variations in terms of the location of the centre of the cloud map, the extent of its distribution, and its coherence.

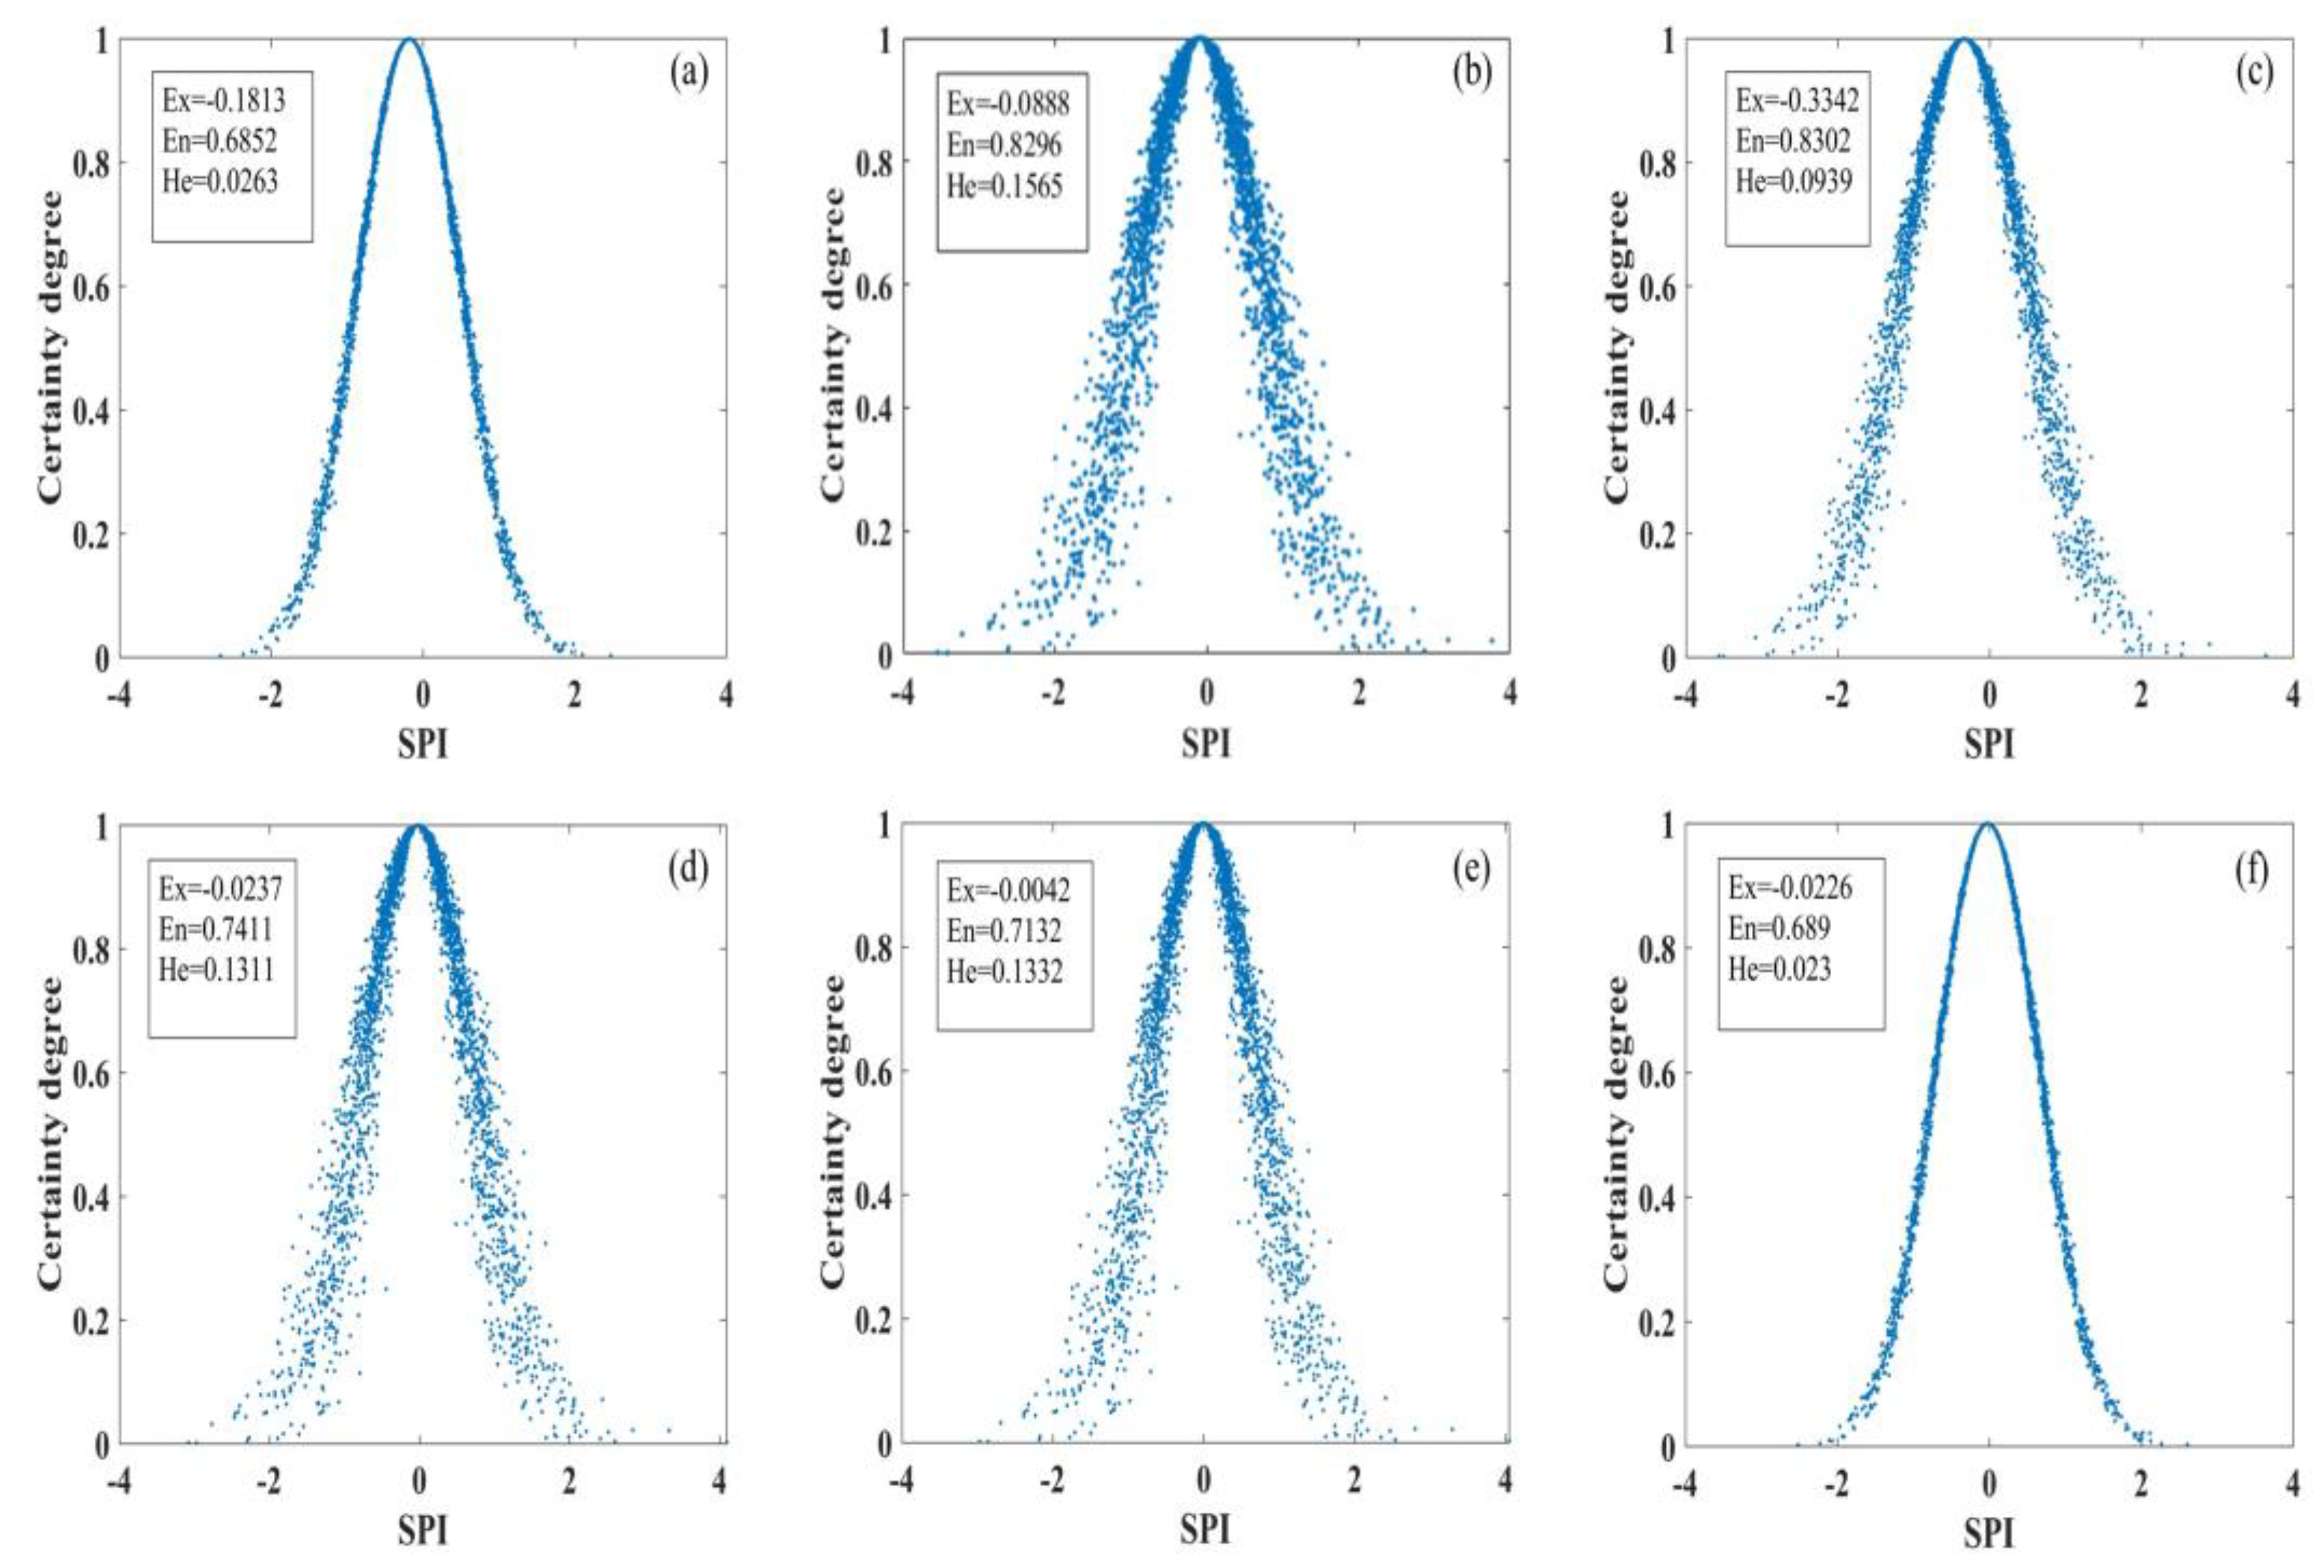
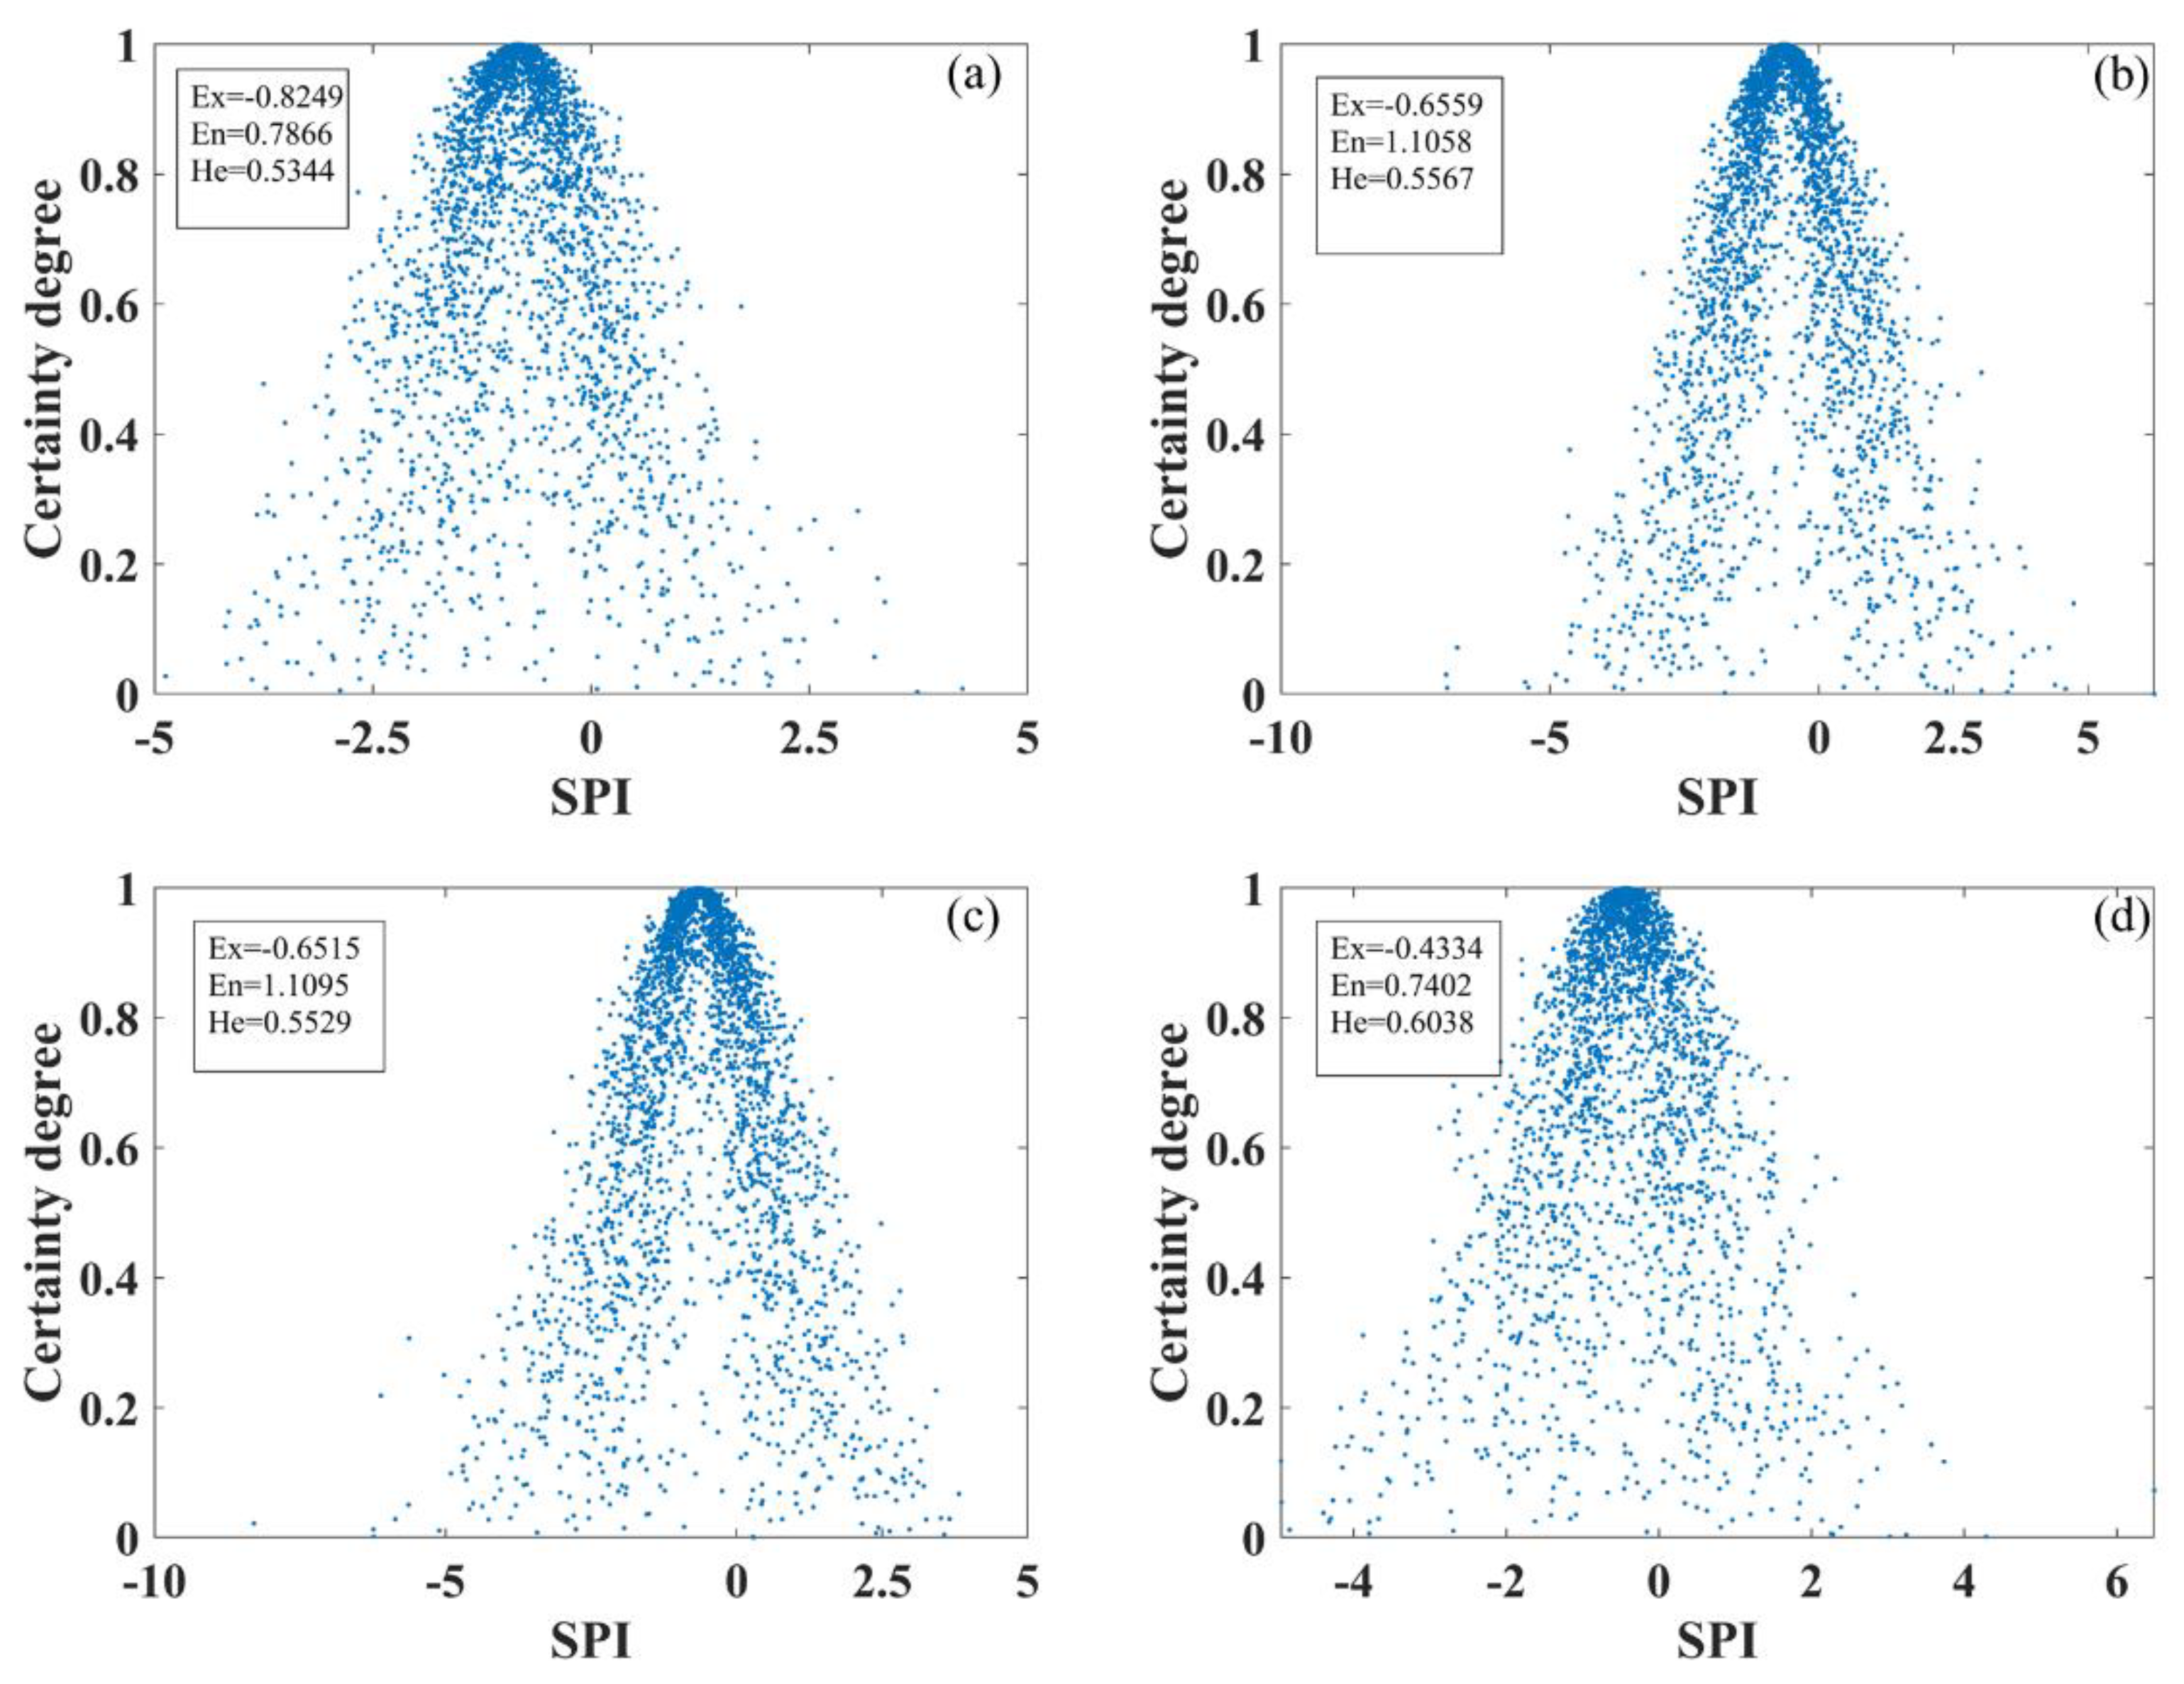
3.2.2. Cloud Characterisation of SPI-3

Figure 10 shows the affiliation cloud diagram of seasonal scale SPI-3, from which it can be seen that the four different seasons’ Ex values are −0.8249 (spring), −0.6559 (summer), −0.6515 (autumn), and −0.4334 (winter); the four seasons’ Ex values are smaller, indicating that its average aridity is stronger. The minimum values of spring and winter En are 0. 7866 and 0.7402, respectively, indicating that its cloud droplets have the narrowest distribution range and better stability, and all four seasons’ He values are larger, namely, 0.5344 (spring), 0.5567 (summer), 0.5529 (autumn), and 0.6038 (winter), respectively, indicating its stochasticity and discrete nature.

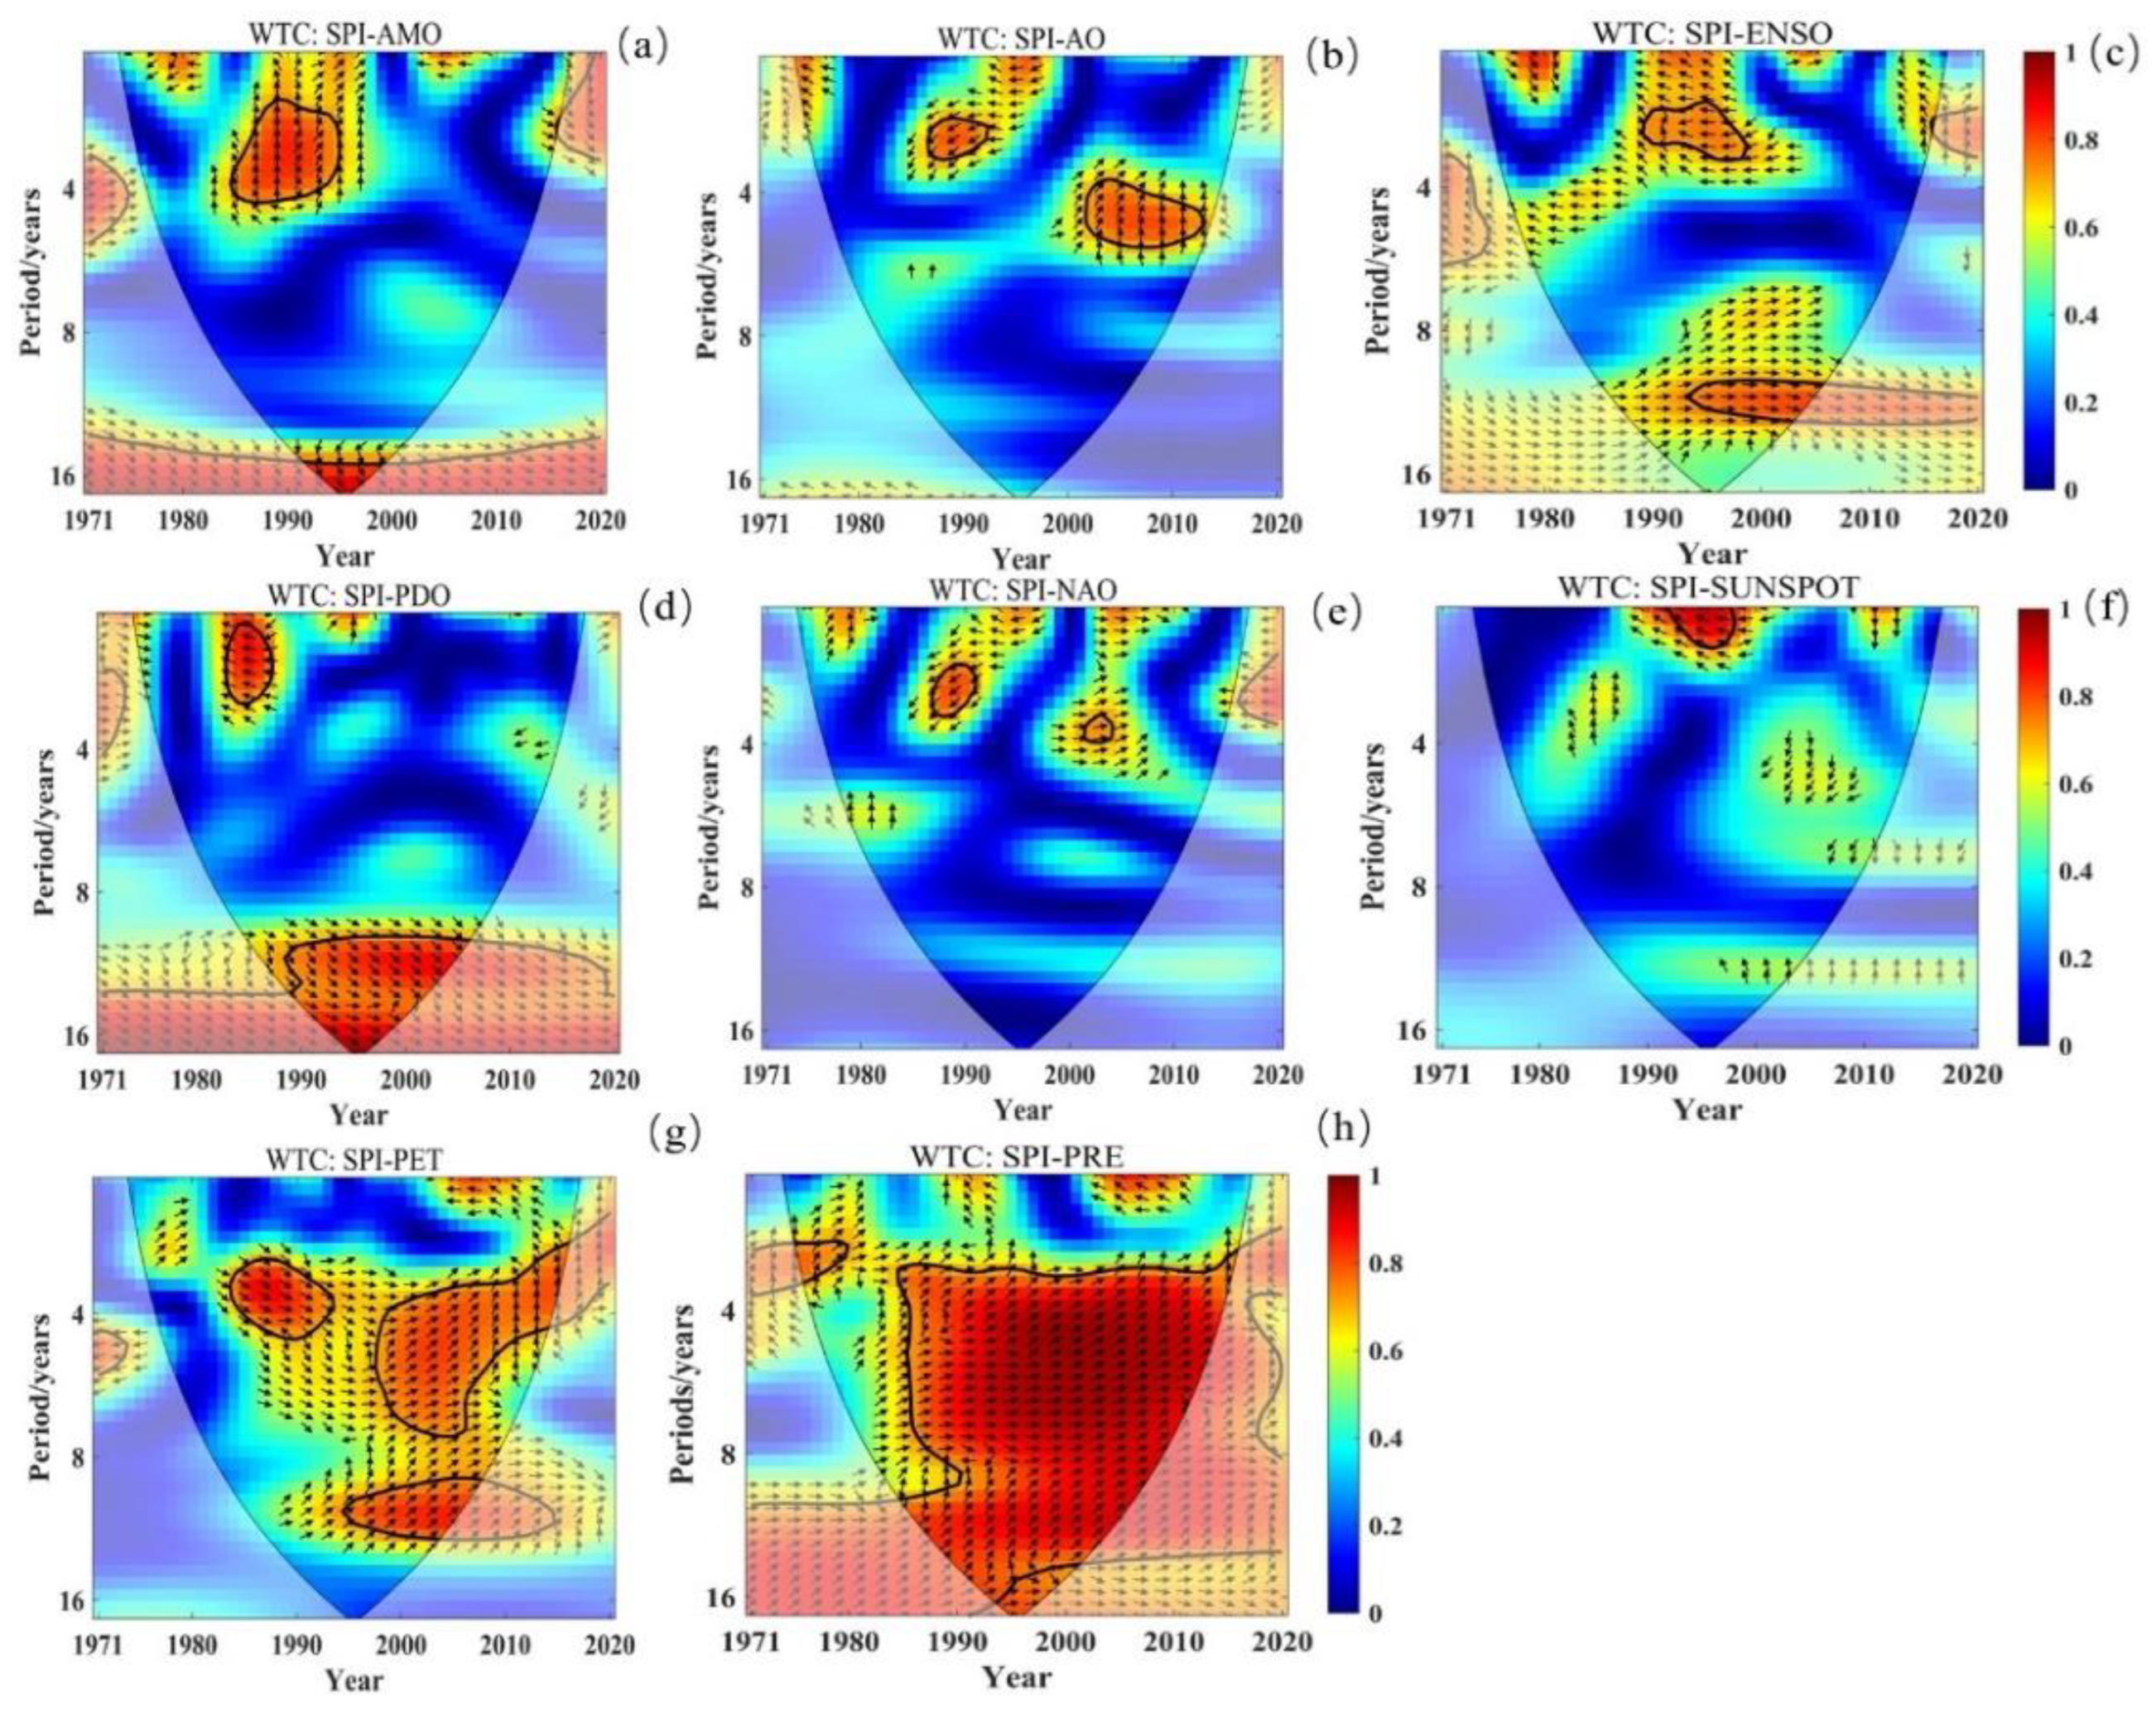
3.3. Drivers of Drought

In this paper, we reveal the effect of remote correlation factors (AMO, AO, ENSO, PDO, NAO, and sunspot), PET, and PRE on meteorological drought by cross-wavelet variation with drought indices.
The correlation coefficients between SPI-12 and the factors (AMO, AO, ENSO, PDO, NAO, sunspot, PET, and PRE) in the Yinshanbeilu region are shown in Table 4. The most strongly correlated large-scale circulation factor with SPI-12 is sunspot, and its correlation passes the 1% significance level test.
The cross-wavelet energy spectra and wavelet coalescence spectra of the six large-scale circulation factors (AMO, AO, ENSO, PDO, NAO, and sunspot) and PET and PRE with SPI are shown in Figure 11 and Figure 12. As can be seen in Figure 11a, there are three cycles of significant resonance between SPI-12 and AMO, which are 1986–1988, 1996–2000, and 2015–2016, where there are 3–4-year cycles, with a positive correlation in the 3–4-year cycle of 2015–2016. As can be seen in Figure 11b, there are two significant resonance cycles between SPI-12 and AO, a 3–4-year cycle from 1986 to 1988 with a negative correlation and a 4–6-year cycle from 2002 to 2014 with a positive correlation. As shown in Figure 11c, there are two cycles of significant resonance between SPI-12 and ENSO, a 2–4-year cycle from 1986 to 1990 with a negative correlation, a 3–5-year cycle from 1998 to 2004, and a 5–7-year cycle from 1998 to 2005 with a positive correlation. As shown in Figure 11d, there are five cycles of significant resonance between SPI-12 and PDO, which are the 2–3-year cycle of 1982–1988 with a negative correlation and the 3–4-year cycle of 1995–2000, the 4–5-year cycle of 2000–2002, the 4–5-year cycle of 2010–2013, and the 6–7-year cycle of 2000–2004 with a positive correlation. As can be seen in Figure 11e, there is only one cycle of significant resonance between SPI-12 and NAO, a 4–5-year cycle from 2002 to 2009 with a positive correlation. As can be seen in Figure 11f, there are three insignificant correlations between SPI-12 and sunspot, and all three cycles of significant resonance show a non-positive correlation, namely, the 2–4-year cycle from 1986 to 1989, the 3–4-year cycle from 1996 to 2004, and the 6–11-year cycle from 2002 to 2005. As can be seen in Figure 11g, there is only one significant resonance cycle between SPI-12 and PET, and only a 3–6-year significant resonance cycle exists for the period 2000–2013, and it shows a positive correlation. As can be seen in Figure 11h, there are two insignificant correlations between SPI-12 and PRE, and both resonance cycles show a positive correlation, the 2–3-year cycle from 1975 to 1979 and the 3–7-year cycle from 1995 to 2011.
As can be seen from Figure 12a, there are two significant resonance cycles between SPI-12 and AMO in the low-energy region, a 2–4-year cycle from 1986 to 1996 with a positive correlation and a 15–16-year cycle from 1992 to 2000 with an insignificant correlation. As shown in Figure 12b, there are two significant resonance cycles between SPI-12 and AO in the low-energy region, which are the 2–3-year cycle from 1988 to 1993 with a negative correlation and the 4–6-year cycle from 2001 to 2012 with an insignificant correlation. As shown in Figure 12c, there are two significant resonance cycles between SPI-12 and ENSO in the low-energy region, a 2–4-year cycle from 1990 to 2000 with a negative correlation and a 10–13-year cycle from 1995 to 2006 with a positive correlation. As shown in Figure 12d, SPI-12 and PDO mainly have two significant resonance cycles in the low-energy region, which are the 0–3-year cycle from 1982 to 1986 with a negative correlation and the 10–16-year cycle from 1988 to 2007 with a positive correlation. As shown in Figure 12e, there are two main significant resonance cycles between SPI-12 and NAO in the low-energy region, which are the 2–4-year significant resonance cycle from 1986 to 1990 with a negative correlation and the 3–4-year significant resonance cycle from 2002 to 2005 with a lower correlation. As shown in Figure 12f, SPI-12 and sunspot have only one significant resonance cycle in the low-energy region, and only a 0–2-year significant resonance cycle exists between 1991 and 1997, with a positive correlation. As can be seen in Figure 12g, there are three significant resonance cycles between SPI-12 and PET in the low-energy region, which are 2–5 years of significant resonance between 1984 and 1994 with a positive correlation, and 2–7 years of significant resonance and 10–13 years of significant resonance between 1995 and 2013. As can be seen in Figure 12h, there are two significant resonance cycles between SPI-12 and PRE, and both resonance cycles show a positive correlation, the 2–3-year cycle from 1975 to 1980 and the 3–16-year cycle from 1995 to 2016.

4. Discussion

4.1. Spatial and Temporal Variability of Drought

Yinshanbeilu is an ecologically fragile area in northern China. Due to the mismanagement of human activities in the region in recent years, it has gradually become an area of serious water shortage in China [40,41]. Huang et al. [42] analysed the drought situation in Inner Mongolia using SPI, investigated the drought drivers in the region using the cross-wavelet transform, and found that there is a trend of gradual aggravation of drought in most parts of Inner Mongolia, and that the drought cycle in most parts of northern China ranges from 2–5 years to 10–15 years. An et al. [43] analysed the drought in Inner Mongolia based on SPEI and found that the overall trend of drought has been intensifying from 1958 to 2019. They also found that the inter-annual distribution of drought changed significantly since 2000, and the drought was dominated by light and moderate drought, with a lower frequency of extreme droughts, which is in agreement with the results of the analysis in this study. The inter-annual distribution of droughts has changed significantly since 2000, and droughts are dominated by slight and medium droughts, with a lower frequency of extreme droughts, consistent with the results analysed in this study.
In this paper, the uniformity and stability of SPI-12 in the Yinshanbeilu region of Inner Mongolia were analysed using a cloud model; the correlation between the cloud eigenvalues was further analysed, and the results showed the highest frequency of light drought and winter drought, which is consistent with the findings of Wang et al. [44]. Wang et al. [44] also concluded that on an annual scale, Inner Mongolia has been dominated by mild and moderate droughts over the past 50 years, with a slight increase in drought intensity, while on a seasonal scale, spring, summer, and autumn droughts are dominant, winter droughts occurring with the highest frequency but with a significant decrease in the intensity of droughts. This is not the same as the results of this study, probably because the drought indicator selected in this paper is SPI, which only takes into account the factor of precipitation, and lacks the computation of the aspect of evaporation in contrast to the SPEI, which is not to be ignored in the context of global warming [45]. Wan et al. [6] concluded that even if precipitation levels increased in Inner Mongolia and ET remained constant, the increased precipitation would not be sufficient to offset the water loss through ET. As a result, drought in Inner Mongolia has intensified rather than improved over time, and several studies have shown that there is insufficient rainfall in the Inner Mongolian steppe region [33,46]. The study area of this paper is located in Yinshanbeilu, Inner Mongolia, a region that includes grasslands, and the calculated SPI values show that most of the area is in a mild drought, but drought in Inner Mongolia has been increasing year by year, which also confirms this conclusion.

4.2. Drought Drivers

Oceans and seas occupy the vast majority of the Earth and are rich in water, energy, and other materials. The direct interaction between the oceans and the atmosphere under specific scenarios has a profound impact on changes in the climate system [47,48]. However, the link between regional climate change and ocean–atmosphere circulation patterns is not clear, making it difficult to accurately characterize the effects of atmospheric circulation factors on drought [49]. Therefore, in this paper, we used the cross-wavelet transform method to analyse the effect of atmospheric circulation factors on drought in Yinshanbeilu, and found that sunspot has the greatest effect on drought in this area. It is known by Pearson’s test that sunspot, AMO, NAO, and AO are the first four large-scale circulation factors with the strongest linear correlation with SPI, but it was found using cross-wavelet analysis that there is some discrepancy with the results of Pearson’s correlation analysis, and that sunspot, ENSO, PDO, and NAO are the large-scale circulation factors with the strongest correlation with SPI. This may be due to the fact that Pearson’s correlation analysis is linear, while cross-wavelet analysis is nonlinear. Compared to linear analysis, nonlinear analysis is more complex and may result in a variable direction of change, increase or decrease. In addition, Kang et al. [50] established the Standardized Dry Heat Index (SDHI) to characterize the severity of drought-high temperature-extreme composite events in Inner Mongolia, and used multivariate correlation analysis to analyse the relationship between drought and atmospheric circulation factors on the SDHI in Inner Mongolia, concluding that drought in Inner Mongolia has been increasing year by year, and that 2010 was the driest in the past 40 years. And it was found that ENSO had the lowest relative importance for drought change in Inner Mongolia, while AMO had the highest relative importance for drought change in Inner Mongolia, which was different from the results of this study that sunspot had the greatest impact on drought. This difference may be due to the fact that the study area of that paper was the Inner Mongolia Region, whereas the study area of this paper is only the Yinshanbeilu region of the Inner Mongolia, where the Yinshan Mountain Range blocks the atmospheric circulation factor, making its impact on drought in this region less severe [51]. Wang et al. [52] analysed the effects of PET and PRE on drought in the Yellow River Basin. PRE was found to be the dominant factor for drought events, PET was found to be the dominant factor for drought variability, and the degree of influence of PRE is greater than PET, which contradicts the finding that the degree of influence of PET on the distribution of droughts is slightly greater than that of PRE. This may be due to the fact that that paper’s characterisation of drought indexes is chosen from the SPEI while this paper adopts SPI, which lacks the calculation of evapotranspiration, so the influence of PET is slightly larger than that of PRE. Pearson’s method was also used to analyse the driving role of the atmospheric circulation factors and SPEI-12, and it was found that SPEI-12 is positively correlated with NAO, while it is negatively correlated with AMO, AO, and PDO, which is in general consistent with the conclusions drawn in this paper.

4.3. Uncertainties and Limitations

There are certain limitations and uncertainties inherent in this study. Firstly, because of the small number of weather stations in the study area, the calculated weather information has some errors. Secondly, this paper only adopts SPI as the meteorological drought index, and SPI lacks the calculation of evapotranspiration compared with SPEI, so in the future, multiple drought indices can be combined to analyse the drought situation as a whole. Finally, this paper has only studied the effects of atmospheric circulation factors, PRE and PET, on drought, but has not explored their effects on drought in depth. In order to have a clearer understanding of the drought phenomenon, the effects of other meteorological factors, human activities, and subsurface conditions should be taken into account and explored in depth in the future.

5. Conclusions

In this study, we used SPI as an indicator of meteorological drought, and explored the characteristics of spatial and temporal changes of drought in the Yinshanbeilu region and its driving factors from 1971 to 2020 from a qualitative to a quantitative perspective based on a cloud model, cross-wavelet transform, and Pearson’s test. The conclusions are as follows:
(1)
Drought in the Yinshanbeilu region shows a spatial trend of high frequency of drought in the east and west and a low frequency of drought in the north and south. Drought in all seasons shows a fluctuating downward trend, with winter drought trending the most clearly and autumn drought trending the least, with the greatest inter-regional and inter-annual differences.
(2)
Cloud model analyses using annual-scale SPI-12 as a sample show that the Ex linear propensity ratio shows an increasing trend of 1.28/10a, so that the overall trend of drought at stations in the Yinshanbeilu region has tended to weaken over the past 50 years. SPI stochasticity was significantly reduced and tended to be stable and homogeneous across sites, with greater certainty and stability of SPI across sites in drought years. Spatially, inter-annual SPI stochasticity was weaker but more stable at sites with higher aridity. In addition, the inter-annual variation in SPI cloud model eigenvalues was greater than the variation between sites, with greater stochasticity and inhomogeneity in SPI between years. Cloud model analysis using seasonal-scale SPI-3 as a sample shows that Ex is smaller throughout the year, En is also smaller, and He is larger.
(3)
The six large-scale circulation factors, PET and PRE, drive the occurrence of drought. ENSO, AO, NAO, sunspot, PET, and PRE are all positively correlated with drought, among which sunspot, PET, and PRE have the strongest correlation with drought in the Yinshanbeilu region, while PDO and AMO are negatively correlated with drought.

Author Contributions

Conceptualization, Z.Z. and B.F.; data interpretation and methodology, B.F., S.W. and F.W.; validation, H.L.; software, K.F.; original draft preparation, H.G.; funding acquisition, Z.Z., S.W. and W.Z. All authors have read and agreed to the published version of the manuscript.

Funding

This research was supported by the Key Special Project of the “Science and Technology Revitalization of Mongolia” Action (grant number 2022EEDSKJXM004-4), the National Natural Science Fund of China (grant number 42301024), and the Key Special Project of the “Inner Mongolia Autonomous Region Scientific Research Infrastructure and Platform” Action (grant number 2023KYPT0002).

Data Availability Statement

Publicly available datasets were analyzed in this study. This data can be found here: [http://data.cma.cn/, accessed on 5 August 2023].

Acknowledgments

The authors thank Sinan Wang for the help provided in data collection.

Conflicts of Interest

The authors declare no conflicts of interest.

References

  1. Zhang, Q.; Han, L.; Jia, J.; Song, L.; Wang, J. Management of drought risk under global warming. Theor. Appl. Climatol. 2016, 125, 187–196. [Google Scholar] [CrossRef]
  2. Su, B.; Huang, J.; Fischer, T.; Wang, Y.; Kundzewicz, Z.W.; Zhai, J.; Sun, H.; Wang, A.; Zeng, X.; Wang, G. Drought losses in China might double between the 1.5 C and 2.0 C warming. Proc. Natl. Acad. Sci. USA 2018, 115, 10600–10605. [Google Scholar] [CrossRef]
  3. Sun, Y.; Miao, F.; Wang, Y.; Liu, H.; Wang, X.; Wang, H.; Guo, J.; Shao, R.; Yang, Q. L-Arginine alleviates the reduction in photosynthesis and antioxidant activity induced by drought stress in maize seedlings. Antioxidants 2023, 12, 482. [Google Scholar] [CrossRef] [PubMed]
  4. Lei, Y.; Yue, Y.; Yin, Y.; Sheng, Z. How adjustments in land use patterns contribute to drought risk adaptation in a changing climate—A case study in China. Land Use Policy 2014, 36, 577–584. [Google Scholar] [CrossRef]
  5. Haile, G.G.; Tang, Q.; Li, W.; Liu, X.; Zhang, X. Drought: Progress in broadening its understanding. Wiley Interdiscip. Rev. Water 2020, 7, e1407. [Google Scholar] [CrossRef]
  6. Wan, L.; Bento, V.A.; Qu, Y.; Qiu, J.; Song, H.; Zhang, R.; Wu, X.; Xu, F.; Lu, J.; Wang, Q. Drought characteristics and dominant factors across China: Insights from high-resolution daily SPEI dataset between 1979 and 2018. Sci. Total Environ. 2023, 901, 166362. [Google Scholar] [CrossRef] [PubMed]
  7. Spinoni, J.; Barbosa, P.; De Jager, A.; McCormick, N.; Naumann, G.; Vogt, J.V.; Magni, D.; Masante, D.; Mazzeschi, M. A new global database of meteorological drought events from 1951 to 2016. J. Hydrol. Reg. Stud. 2019, 22, 100593. [Google Scholar] [CrossRef]
  8. Yue, S.; Yang, F.; Sheng, X. Spatiotemporal evolution and the driving factors of meteorological drought in the Hun-Taizi River basin, NE China. J. Water Clim. Chang. 2022, 13, 1326–1339. [Google Scholar] [CrossRef]
  9. Ault, T.R. On the essentials of drought in a changing climate. Science 2020, 368, 256–260. [Google Scholar] [CrossRef]
  10. McKee, T.B.; Doesken, N.J.; Kleist, J. The relationship of drought frequency and duration to time scales. In Proceedings of the 8th Conference on Applied Climatology, Anaheim, CA, USA, 17–22 January 1993; pp. 179–183. [Google Scholar]
  11. Dai, A.; Trenberth, K.E.; Qian, T. A global dataset of Palmer Drought Severity Index for 1870–2002: Relationship with soil moisture and effects of surface warming. J. Hydrometeorol. 2004, 5, 1117–1130. [Google Scholar] [CrossRef]
  12. Van Rooy, M. A rainfall anomally index independent of time and space. Notos 1965, 14, 43–48. [Google Scholar]
  13. Vicente-Serrano, S.M.; Beguería, S.; López-Moreno, J.I. A multiscalar drought index sensitive to global warming: The standardized precipitation evapotranspiration index. J. Clim. 2010, 23, 1696–1718. [Google Scholar] [CrossRef]
  14. Yang, P.; Zhai, X.; Huang, H.; Zhang, Y.; Zhu, Y.; Shi, X.; Zhou, L.; Fu, C. Association and driving factors of meteorological drought and agricultural drought in Ningxia, Northwest China. Atmos. Res. 2023, 289, 106753. [Google Scholar] [CrossRef]
  15. Mishra, A.K.; Singh, V.P. A review of drought concepts. J. Hydrol. 2010, 391, 202–216. [Google Scholar] [CrossRef]
  16. Christian, J.I.; Basara, J.B.; Otkin, J.A.; Hunt, E.D.; Wakefield, R.A.; Flanagan, P.X.; Xiao, X. A methodology for flash drought identification: Application of flash drought frequency across the United States. J. Hydrometeorol. 2019, 20, 833–846. [Google Scholar] [CrossRef]
  17. Gocic, M.; Trajkovic, S. Water surplus variability index as an indicator of drought. J. Hydrol. Eng. 2015, 20, 04014038. [Google Scholar] [CrossRef]
  18. Naresh Kumar, M.; Murthy, C.; Sesha Sai, M.; Roy, P. On the use of Standardized Precipitation Index (SPI) for drought intensity assessment. Meteorol. Appl. J. Forecast. Pract. Appl. Train. Tech. Model. 2009, 16, 381–389. [Google Scholar] [CrossRef]
  19. Bhunia, P.; Das, P.; Maiti, R. Meteorological drought study through SPI in three drought prone districts of West Bengal, India. Earth Syst. Environ. 2020, 4, 43–55. [Google Scholar] [CrossRef]
  20. Bahmani, S.; Naganna, S.R.; Ghorbani, M.A.; Shahabi, M.; Asadi, E.; Shahid, S. Geographically weighted regression hybridized with Kriging model for delineation of drought-prone Areas. Environ. Model. Assess. 2021, 26, 803–821. [Google Scholar] [CrossRef]
  21. Kim, T.-W.; Jehanzaib, M. Drought risk analysis, forecasting and assessment under climate change. Water 2020, 12, 1862. [Google Scholar] [CrossRef]
  22. Fu, Y.; Zhang, X.; Anderson, R.G.; Shi, R.; Wu, D.; Ge, Q. Spatiotemporal distribution of drought based on the standardized precipitation index and cloud models in the Haihe Plain, China. Water 2022, 14, 1672. [Google Scholar] [CrossRef]
  23. Li, D.; Liu, C.; Gan, W. A new cognitive model: Cloud model. Int. J. Intell. Syst. 2009, 24, 357–375. [Google Scholar] [CrossRef]
  24. Bai, X.; Wang, Y.; Jin, J.; Ning, S.; Wang, Y.; Wu, C. Spatio-temporal evolution analysis of drought based on cloud transformation algorithm over Northern Anhui Province. Entropy 2020, 22, 106. [Google Scholar] [CrossRef] [PubMed]
  25. Guo, Y.; Lu, X.; Zhang, J.; Li, K.; Wang, R.; Rong, G.; Liu, X.; Tong, Z. Joint analysis of drought and heat events during maize (Zea mays L.) growth periods using copula and cloud models: A case study of Songliao Plain. Agric. Water Manag. 2022, 259, 107238. [Google Scholar] [CrossRef]
  26. Pei, Z.; Fang, S.; Wang, L.; Yang, W. Comparative analysis of drought indicated by the SPI and SPEI at various timescales in inner Mongolia, China. Water 2020, 12, 1925. [Google Scholar] [CrossRef]
  27. Liu, S.; Kang, W.; Wang, T. Drought variability in Inner Mongolia of northern China during 1960–2013 based on standardized precipitation evapotranspiration index. Environ. Earth Sci. 2016, 75, 145. [Google Scholar] [CrossRef]
  28. Kikon, A.; Dodamani, B.; Barma, S.D.; Naganna, S.R. ANFIS-based soft computing models for forecasting effective drought index over an arid region of India. AQUA-Water Infrastruct. Ecosyst. Soc. 2023, 72, 930–946. [Google Scholar] [CrossRef]
  29. Hukkeri, G.S.; Naganna, S.R.; Pruthviraja, D.; Bhat, N.; Goudar, R. Drought forecasting: Application of ensemble and advanced machine learning approaches. IEEE Access 2023, 11, 141375–141393. [Google Scholar] [CrossRef]
  30. Wuyun, D.; Sun, L.; Chen, Z.; Hou, A.; Crusiol, L.G.T.; Yu, L.; Chen, R.; Sun, Z. The spatiotemporal change of cropland and its impact on vegetation dynamics in the farming-pastoral ecotone of northern China. Sci. Total Environ. 2022, 805, 150286. [Google Scholar] [CrossRef]
  31. Luo, D.; Ye, L.; Sun, D. Risk evaluation of agricultural drought disaster using a grey cloud clustering model in Henan province, China. Int. J. Disaster Risk Reduct. 2020, 49, 101759. [Google Scholar] [CrossRef]
  32. Wang, S.; Wang, W.; Wu, Y.; Li, W.; Zhao, S.; Chen, Z. Effects of a changing climate and anthropogenic impacts on net primary production in Yinshanbeilu, Inner Mongolia, China. Environ. Impact Assess. Rev. 2023, 102, 107185. [Google Scholar] [CrossRef]
  33. Zhang, H.; Gao, Y.; Meng, Z.; Chen, B.; Huang, L. Soil Organic Carbon Mineralization After the Addition of Plant Litter in Yinshanbeilu Desert Steppe under Three Utilization Regimes. Pol. J. Environ. Stud. 2022, 31, 4469–4479. [Google Scholar] [CrossRef]
  34. Svoboda, M.; Hayes, M.; Wood, D. Standardized Precipitation Index: User Guide; World Meteorological Organization: Geneva, Switzerland, 2012. [Google Scholar]
  35. Zhang, C.; Liu, H.; Song, Y.; Liao, Y.; Duan, J.; Cai, W.; Wang, S. Grades of Meteorological Drought; China Quality Inspection Press: Beijing, China, 2017. [Google Scholar]
  36. Wu, C.; Ning, S.; Jin, J.; Zhou, Y.; Zhou, L.; Bai, X.; Zhang, L.; Cui, Y. Construction and application of comprehensive drought index based on uncertainty cloud reasoning algorithm. Sci. Total Environ. 2021, 779, 146533. [Google Scholar] [CrossRef] [PubMed]
  37. Zhang, H.; Sun, Y.; Zhang, W.; Song, Z.; Ding, Z.; Zhang, X. Comprehensive evaluation of the eco-environmental vulnerability in the Yellow River Delta wetland. Ecol. Indic. 2021, 125, 107514. [Google Scholar] [CrossRef]
  38. Han, Z.; Huang, S.; Huang, Q.; Leng, G.; Wang, H.; Bai, Q.; Zhao, J.; Ma, L.; Wang, L.; Du, M. Propagation dynamics from meteorological to groundwater drought and their possible influence factors. J. Hydrol. 2019, 578, 124102. [Google Scholar] [CrossRef]
  39. Lin, Q.; Wu, Z.; Singh, V.P.; Sadeghi, S.; He, H.; Lu, G. Correlation between hydrological drought, climatic factors, reservoir operation, and vegetation cover in the Xijiang Basin, South China. J. Hydrol. 2017, 549, 512–524. [Google Scholar] [CrossRef]
  40. Wu, X.; Fan, J.; Sun, L.; Zhang, H.; Xu, Y.; Yao, Y.; Yan, X.; Zhou, J.; Jia, Y.; Chi, W. Wind erosion and its ecological effects on soil in the northern piedmont of the Yinshan Mountains. Ecol. Indic. 2021, 128, 107825. [Google Scholar] [CrossRef]
  41. Jiang, L.; Huang, X.; Wang, F.; Liu, Y.; An, P. Method for evaluating ecological vulnerability under climate change based on remote sensing: A case study. Ecol. Indic. 2018, 85, 479–486. [Google Scholar] [CrossRef]
  42. Huang, J.; Xue, Y.; Sun, S.; Zhang, J. Spatial and temporal variability of drought during 1960–2012 in Inner Mongolia, north China. Quat. Int. 2015, 355, 134–144. [Google Scholar] [CrossRef]
  43. An, Q.; He, H.; Nie, Q.; Cui, Y.; Gao, J.; Wei, C.; Xie, X.; You, J. Spatial and temporal variations of drought in Inner Mongolia, China. Water 2020, 12, 1715. [Google Scholar] [CrossRef]
  44. Cailin, W.; Shuaibang, F.; Jirigala, B.; Qian, Z. Research progress on drought in Inner Mongolia. J. China Inst. Water Resour. Hydropower Res. 2023, 21, 23–26. [Google Scholar]
  45. Huang, S.; Li, P.; Huang, Q.; Leng, G.; Hou, B.; Ma, L. The propagation from meteorological to hydrological drought and its potential influence factors. J. Hydrol. 2017, 547, 184–195. [Google Scholar] [CrossRef]
  46. Wang, S.; Li, R.; Wu, Y.; Zhao, S. Effects of multi-temporal scale drought on vegetation dynamics in Inner Mongolia from 1982 to 2015, China. Ecol. Indic. 2022, 136, 108666. [Google Scholar] [CrossRef]
  47. Yang, Y.; Gan, T.Y.; Tan, X. Spatiotemporal changes of drought characteristics and their dynamic drivers in Canada. Atmos. Res. 2020, 232, 104695. [Google Scholar] [CrossRef]
  48. Chen, D.; Gao, Y.; Zhang, Y.; Wang, T. Effects of spring Arctic sea ice on summer drought in the middle and high latitudes of Asia. Atmos. Ocean. Sci. Lett. 2022, 15, 100138. [Google Scholar] [CrossRef]
  49. Yao, J.; Tuoliewubieke, D.; Chen, J.; Huo, W.; Hu, W. Identification of drought events and correlations with large-scale ocean–atmospheric patterns of variability: A case study in Xinjiang, China. Atmosphere 2019, 10, 94. [Google Scholar] [CrossRef]
  50. Kang, Y.; Guo, E.; Wang, Y.; Bao, Y.; Bao, Y.; Mandula, N.; Runa, A.; Gu, X.; Jin, L. Characterisation of compound dry and hot events in Inner Mongolia and their relationship with large-scale circulation patterns. J. Hydrol. 2022, 612, 128296. [Google Scholar] [CrossRef]
  51. Wei, B.; Wei, J.; Jia, X.; Ye, Z.; Yu, S.; Yin, S. Spatiotemporal Patterns of Land Surface Phenology from 2001 to 2021 in the Agricultural Pastoral Ecotone of Northern China. Sustainability 2023, 15, 5830. [Google Scholar] [CrossRef]
  52. Wang, Y.; Wang, S.; Zhao, W.; Liu, Y. The increasing contribution of potential evapotranspiration to severe droughts in the Yellow River basin. J. Hydrol. 2022, 605, 127310. [Google Scholar] [CrossRef]
Figure 1. Location of Yinshanbeilu and distribution of weather stations. (a) Yinshanbeilu location, and (b) land-use type. HLS: Hailisu, LH: Linghe, WLTZQ: Wulatezhongqi, DMQ: Damaoqi, MDL: Mandula, BT: Baotou, SZWQ: Siziwangqi, HHHT: Hohhot, ZRH: Zhurihe, JN: Jining, HD: Huade, DL: Duolun.
Water 16 00265 g001
Figure 2. Spatial distribution of annual-scale drought frequency in Yinshanbeilu, 1971–2020. (ae) denote Drought, Slight Drought, Moderate Drought, Severe Drought, and Extreme Drought.
Water 16 00265 g002
Figure 3. Fitted curve of SPI trends for the four seasons, 1971–2020. (a) Spring, (b) summer, (c) autumn, and (d) winter.
Water 16 00265 g003
Figure 4. Spatial distribution of seasonal drought frequency in Yinshanbeilu, 1971–2020. (a) Spring, (b) summer, (c) autumn, and (d) winter.
Water 16 00265 g004
Figure 5. Fitted curve of cloud eigenvalue trends for the period 1971–2020. (a) Ex, (b) En, and (c) He.
Water 16 00265 g005
Figure 6. Cloud eigenvalue correlation for Yinshanbeilu, 1971–2020.
Water 16 00265 g006
Figure 7. Spatial distribution of SPI cloud eigenvalues at 12 sites. (a) Ex, (b) En, and (c) He.
Water 16 00265 g007
Figure 8. SPI cloud eigenvalue correlation at 12 sites.
Water 16 00265 g008
Figure 9. Typical SPI affiliation cloud. (a) 1978; (b) 2000; (c) 2007; (d) HLS; (e) HD; and (f) JN.
Water 16 00265 g009
Figure 10. Four seasons’ SPI affiliation cloud. (a) Spring; (b) summer; (c) autumn; and (d) winter.
Water 16 00265 g010
Figure 11. Cross-wavelet energy spectrum: (a) AMO; (b) AO; (c) ENSO; (d) PDO, (e) NAO, (f) sunspot; (g) PET; and (h) PRE. Note: The arrows indicate the relative phases of the remotely related factors, PET and PRE, with respect to drought. An arrow to the right indicates that the change in phase is consistent with drought, i.e., there is a positive correlation between the two; an arrow to the left indicates that the change in phase is opposite to drought, i.e., there is a negative correlation between the two; the same is the case below.
Water 16 00265 g011
Figure 12. Cross-wavelet coalescence spectrum: (a) AMO; (b) AO; (c) ENSO; (d) PDO, (e) NAO, (f) sunspot; (g) PET; and (h) PRE.
Water 16 00265 g012
Table 1. Names, time frames, and data sources for the eightfactors.
Climatic FactorTime ScaleData Sources
ENSO1971–2020https://www.esrl.noaa.gov/psd/data/correlation/nina34.data (accessed on 26 October 2023)”
PDO1971–2020https://psl.noaa.gov/gcos_wgsp/Timeseries/PDO/(accessed on 26 October 2023)”
AO1971–2020https://psl.noaa.gov/gcos_wgsp/Timeseries/AO/(accessed on 26 October 2023)”
NAO1971–2020https://psl.noaa.gov/gcos_wgsp/Timeseries/NAO/(accessed on 26 October 2023)”
AMO1971–2020https://psl.noaa.gov/gcos_wgsp/Timeseries/AMO/(accessed on 26 October 2023)”
sunspot1971–2020https://www.side.be/sunspot-data (accessed on 26 October 2023)
PET1971–2020https://cds.climate.copernicus.eu/cdsapp#!/dataset/reanalysis-era5-land-monthly-means?tab=form (accessed on 25 December 2023)”
PRE1971–2020
Table 2. SPI drought classification.
HierarchyTypeSPI
INo DroughtSPI > −0.5
IISlight Drought−1.0 < SPI ≤ −0.5
IIIModerate Drought−1.5 < SPI ≤ −1.0
IVSevere Drought−2.0 < SPI ≤ −1.5
VExtreme DroughtSPI ≤ −2.0
Table 3. Frequency of drought at all levels for all seasons at 12 meteorological stations.
ParameterSeasonDroughtSlight DroughtModerate
Drought
Severe DroughtExtreme
Drought
FrequencySpring29.5%12.8%10.0%6.7%0.0%
Summer31.0%14.7%9.8%4.2%2.3%
Autumn28.3%16.0%7.8%2.8%1.7%
Winter34.6%15.8%10.6%4.8%3.4%
Table 4. Pearson correlation coefficients of 8 different factors with SPI-12.
TypeSPI-12
ENSO0.003
PDO−0.018
AO0.164
NAO0.161
AMO−0.200
sunspot1.000 **
PET0.259
PRE0.215
Note: ** indicates passing the 1% significance test.
Disclaimer/Publisher’s Note: The statements, opinions and data contained in all publications are solely those of the individual author(s) and contributor(s) and not of MDPI and/or the editor(s). MDPI and/or the editor(s) disclaim responsibility for any injury to people or property resulting from any ideas, methods, instructions or products referred to in the content.

