Article

Water Quality Parameter Retrieval with GF5-AHSI Imagery for Dianchi Lake (China)

1
Faculty of Geography, Yunnan Normal University, Kunming 650500, China
2
Key Laboratory of Resources and Environmental Remote Sensing for Universities in Yunnan Kunming, Kunming 650500, China
*
Author to whom correspondence should be addressed.
Water 2024, 16(2), 225; https://doi.org/10.3390/w16020225
Submission received: 13 November 2023 / Revised: 8 December 2023 / Accepted: 19 December 2023 / Published: 9 January 2024
(This article belongs to the Section Water Quality and Contamination)

Abstract

:
In response to the rapid changes in the chlorophyll-a concentration and eutrophication issues in lakes, with Dianchi Lake as an example, a remote sensing estimation model for chlorophyll-a, total phosphorus, and total nitrogen in Dianchi Lake was constructed using the three band method and ratio band method based on the visible-light shortwave infrared (AHSI) hyperspectral satellite data from Gaofen 5 (GF-5) and the water quality data collected at Dianchi Lake. The model results were compared with the multispectral data from the Gaofen 1 (GF-1) wide field-of-view (WFV) camera. The accuracy evaluation results indicate that the overall mean absolute percentage error of the remote sensing estimation models for chlorophyll a, total phosphorus, and total nitrogen are 7.658%, 4.511%, and 4.577%, respectively, which can meet the needs of lake water quality monitoring and evaluation. According to the remote sensing simulation results, chlorophyll a is mainly distributed in the northern part of Dianchi Lake, with phosphorus and nitrogen pollution throughout Dianchi Lake and relatively more abundant in the central and southern regions. The pollution is mainly concentrated in the northern and southern regions of Dianchi Lake, which is consistent with the actual situation. Further confirming the feasibility of using GF-5 satellite AHSI data for water quality parameter retrieval can provide new technical means for relevant departments to quickly and efficiently monitor the inland lake water environment.

1. Introduction

Water is an important resource for human survival and development; it plays a fundamental and strategic role in the sustainable development of human society and the ecological environment [1]. With the increase in population, the expansion and development of cities have exacerbated the pollution of water bodies. Inland lake water pollution is characterized by the eutrophication of water bodies, and the main pollution indicators are chlorophyll a, total phosphorus, and total nitrogen [2]. The retrieval of water quality parameters in lake water bodies is an important factor for monitoring and assessing lake water pollution. Dianchi is one of the six major freshwater lakes in China, and pollution there has always been of great concern; therefore, it is crucial to monitor the water quality of the Dianchi Basin by inverting the water quality parameters to quickly obtain the water quality status of Dianchi and achieve targeted prevention and control.
There are two main methods for water quality monitoring: traditional water quality monitoring [3] and remote sensing monitoring [4]. Compared with traditional water quality monitoring methods, remote sensing monitoring methods have the advantages of a large range and high efficiency, and information can be obtained in real time. Multisource remote sensing data, such as the MODIS [5], TM [6], ETM+ [7], Qui Bird [8], OLI [9], SeaWiFS [10], and MERIS [11] products, have been used in the monitoring of lake water quality. For example, Liu et al. [12] used Landsat data to model and invert the water quality parameters of Erlong Lake and explored the seasonal changes in different water quality indicators, and Zhu et al. [13] inverted the water quality parameters of a complex river network based on multispectral data. Most researchers have used multispectral data to monitor water quality in lakes and achieved reasonable results. However, the disadvantage of multispectral data is that tens to hundreds of nanometers in a single band, with gaps between different bands [14], and the continuous reflectance of water features cannot be reconstructed in detail. Compared to multispectral remote sensing data, hyperspectral remote sensing data span across more spectral bands and provide a greater amount of information [15]. In hyperspectral remote sensing, spectral data are usually highly correlated with each other in terms of high-dimensional and fine spectral bands. These spectral features support the identification of elements or the measurement of concentrations. Therefore, hyperspectral remote sensing technology is more suitable for complex inland water bodies with variable optical properties, where the substances in the water determine the spectral properties of the water body [16]. In recent years, there have been numerous studies using hyperspectral data to invert water quality and monitor inland water bodies. Zang Chuankai et al. [17] used a UAV-mounted hyperspectral sensor to monitor color change and identify suspected polluted inland water bodies on Chongming Island. Liu Han et al. [18] used a UAV-mounted hyperspectral imager with route and waypoint flight modes for hyperspectral data cube acquisition and to monitor water quality. Additionally, a ground-based remote sensor involving a camera placed on the ground and a hyperspectral sensor to shoot and collect image information for a water body is used for long-term monitoring [19,20], but both UAV remote sensing and ground-based remote sensing have a limited monitoring range, are affected by the weather, and yield unstable monitoring results. In addition, satellite-carried hyperspectral remote sensing devices are used; they provide high spatial resolution image data over wide ranges, and this type of acquisition saves time and effort [21]. Satellite-carried hyperspectral devices are characterized by stable operation, a regular repeat period, low image distortion and atmospheric effects, and rapid and efficient data collection. Compared with remote sensing platforms on unmanned aerial vehicles and on the ground, satellite-carried remote sensing platforms have certain advantages.
Gaofen-5 (GF-5) is the first full-spectrum hyperspectral satellite that was independently developed by China to observe the atmosphere and land, and its visible shortwave infrared hyperspectral camera, the advanced hyperspectral imager (AHSI), which has a high spectral resolution, many spectral bands, and high precision and can collect a large amount of information, can fully capture the detailed spectral characteristics of target features; thus, the resulting data are helpful for identifying minor changes in the water quality parameters of inland water bodies and have excellent potential for use in remote sensing studies of inland water bodies [22]. Some scholars in China have used GF-5 satellite hyperspectral data to monitor the chlorophyll a concentration in inland water bodies and lakes, constructing high-precision retrieval models and improving the modeling accuracy compared to that of models based on other types of traditional data [23,24,25]. However, the use of GF-5 hyperspectral data for monitoring the water quality of Dianchi, a plateau lake, has not been reported. In this study, the inverse modeling of chlorophyll a, total phosphorus, and total nitrogen was performed based on AHSI data from the GF-5 satellite, and a band combination method was used to analyze the overall water quality conditions of Dianchi. This approach provides technical support for the monitoring of the Dianchi water environment.

2. Overview of the Study Area and Data Sources

2.1. Overview of the Study Area

Dianchi (Figure 1) is the largest freshwater lake in Yunnan Province and deemed the ‘Pearl of the Plateau’. The lake surface elevation is 1887.4 m, the watershed area is approximately 2920 km2, the lake surface area is approximately 330 km2, the average water depth is 5 m, and the deepest depth is 11 m. The lake surface is 40 km long in the north–south direction (including Caohai) and 7 km wide on average in the east–west direction. The watershed is located in a subtropical monsoon humid climate zone; the average annual temperature is less than 15 °C, seasonal variations in precipitation are prominent, and the average annual precipitation is 935 mm [26]. The lake is located downstream of the city of Kunming and is the lowest concave area in the Kunming Basin. In terms of topography and terrain, the overall sewage and industrial wastewater discharges from Kunming city converge and enter Dianchi Lake. Moreover, the expansion of the city’s land area with the development of the economy has exacerbated the pollution of the lake. According to the GB3838-2002 [27] “Surface Water Environmental Quality Standards”, Dianchi Lake was once classified as below Grade V in water quality. However, after more than 20 years of remediation efforts, since 2018, the water quality of Dianchi Lake has consistently been maintained at Grade IV.

2.2. Remote Sensing Data and Preprocessing

The remote sensing data selected for this study are from the GF-5 AHSI (advanced hyperspectral imager) image dataset from 10 December 2018, spanning Kunming. The AHSI onboard the GF-5 satellite has a spectral range of 0.4 μm to 2.5 μm, an amplitude of 60 km, a spatial resolution of 30 m, a spectral resolution of 5 nm in the visible wavelength band, and a spectral resolution of 10 nm in the shortwave infrared band. Compared to other sensors, such as Landsat 8 [28], Sentinel 2 [29], and HJ-1 [30], the AHSI hyperspectral sensor is able to provide more effective spectral information.
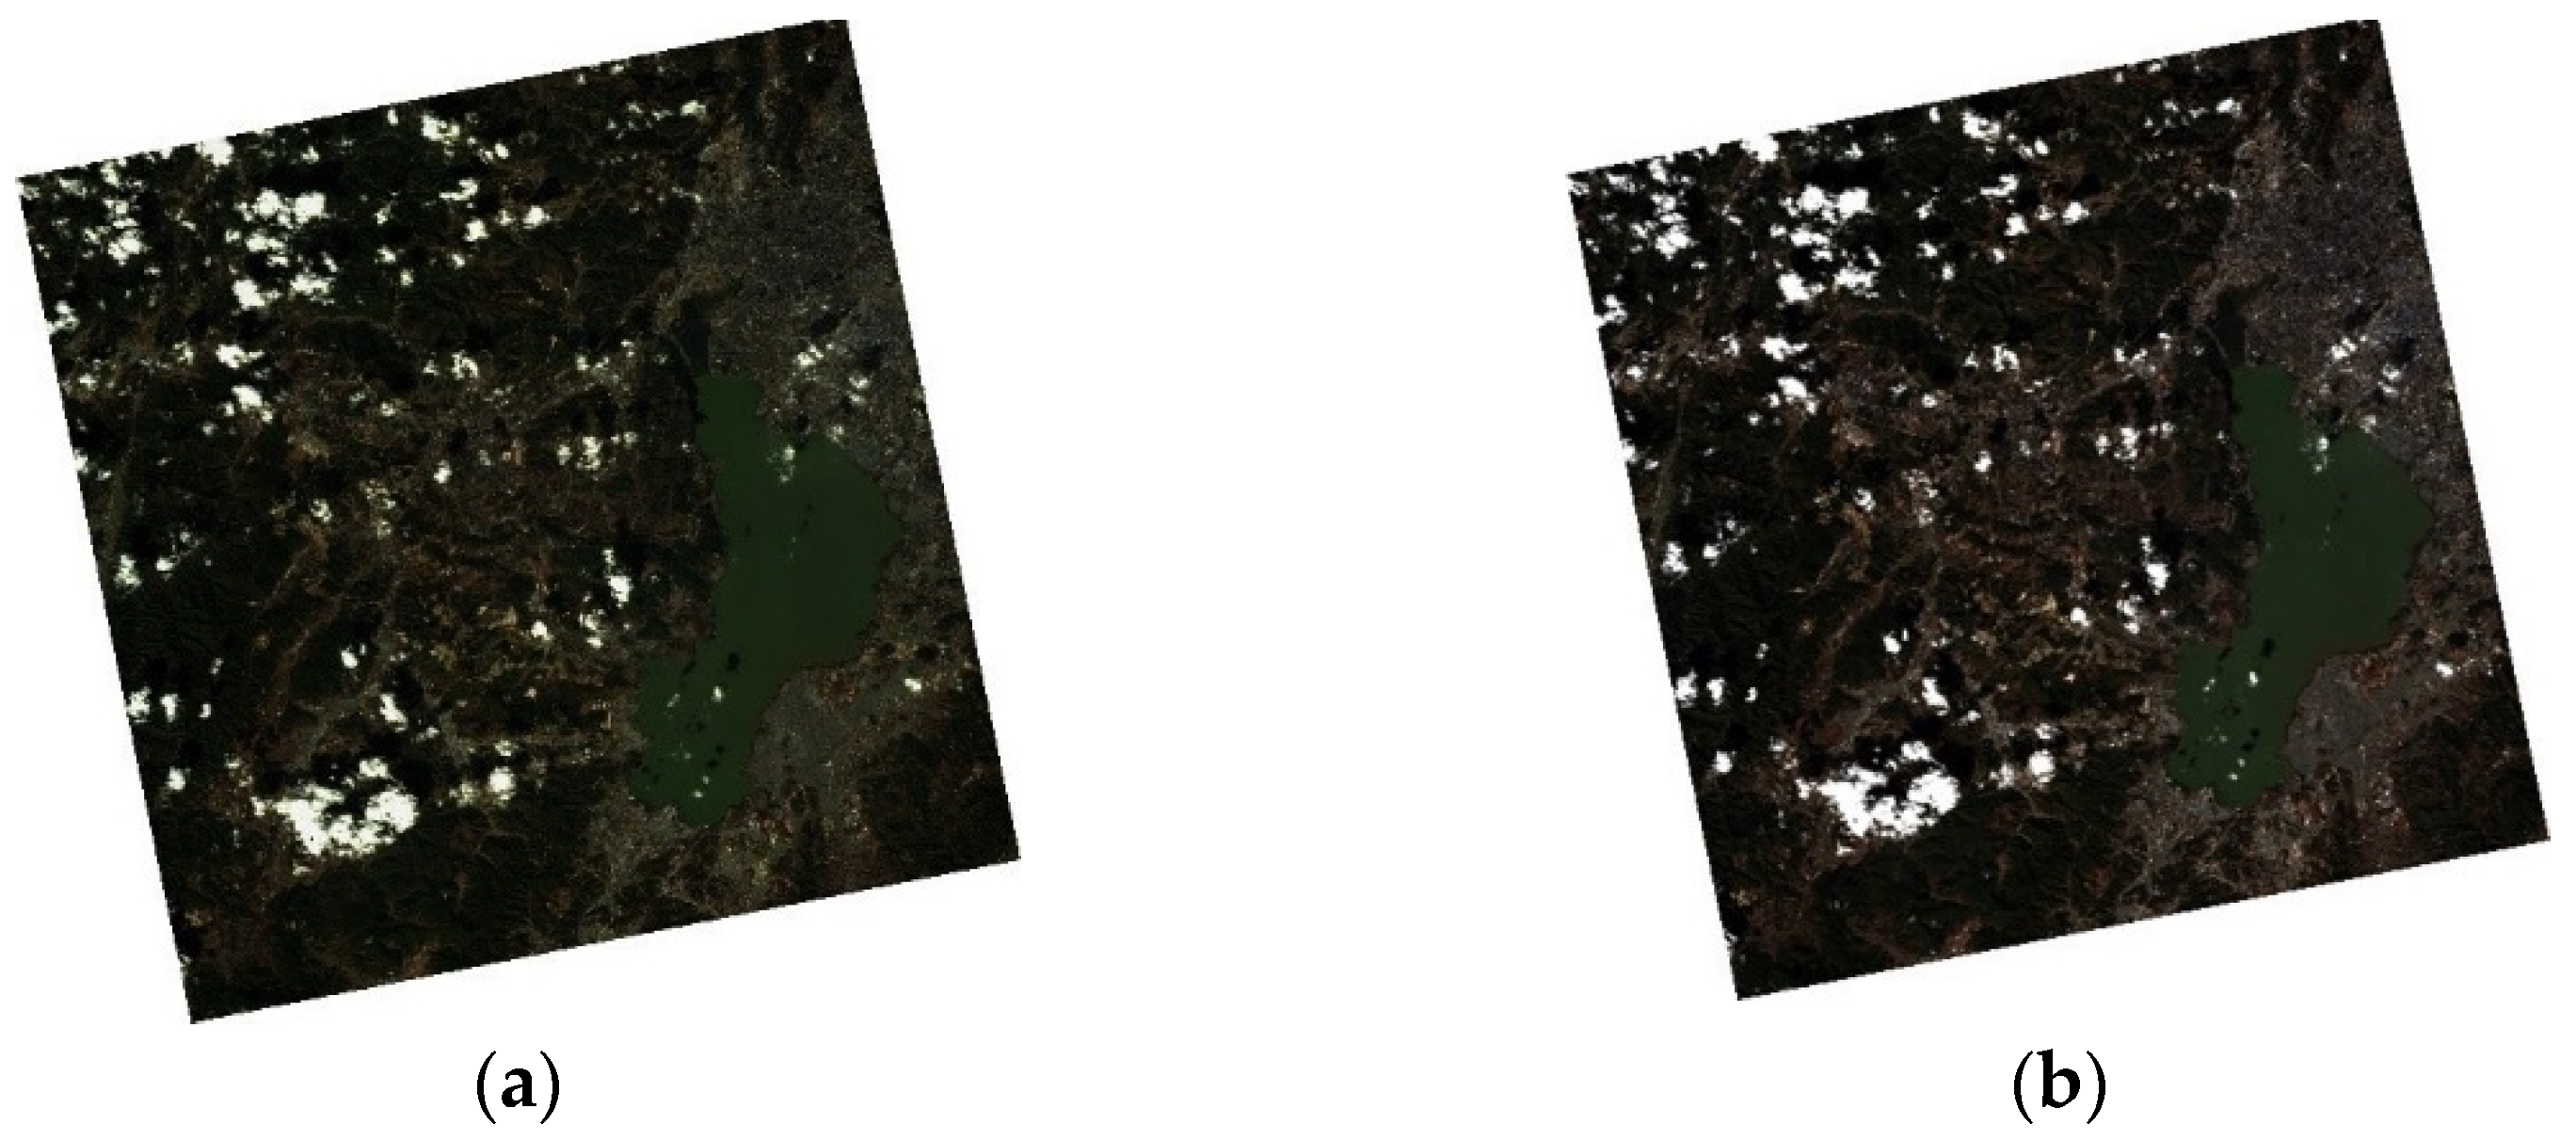
However, remote sensing images are subject to image distortion during atmospheric radiative transfer due to the effects of the sun’s position, atmospheric conditions, and the sensor’s performance limitations. Therefore, image preprocessing is necessary to remove and correct these effects. The preprocessing of GF-5 AHSI data mainly includes radiometric calibration, atmospheric correction, orthometric correction, and semiartificial Dianchi water body extraction. The radiometric calibration subtool in the radiometric correction toolbar of ENVI5.3 software was used to perform radiometric calibration of the GF-5 satellite image data, and then, the FLAASH tool was used to perform atmospheric correction. Figure 2 shows the image comparison before and after atmospheric correction. Finally, based on the Dianchi regional range vector data, the Dianchi waters were extracted, and the number of effective spectral bands was 298.
To further test the accuracy of the proposed model, GF-1 satellite WFV multispectral data for the same period on 10 December 2018 were used in this study, together with GF-5 satellite data, to invert the water quality parameters of Dianchi Lake.

2.3. Measured Water Quality Data

The measured water quality data were provided by the Yunnan Provincial Department of Ecology and the Environment and synchronized with the transit time of the GF-5 satellite; these data included the values of three water quality parameters: chlorophyll a, total phosphorus, and total nitrogen. There are nine water quality parameter monitoring stations in the Dianchi Lake area (as shown in Figure 1), generally covering the full lake area. The testing of water quality parameters followed three standards, HJ897-2017 [31] “Determination of Chlorophyll a with Spectrophotometry”, GB11893-89 [32] “Determination of Total Phosphorus with Ammonium Molybdate Spectrophotometry”, and HJ636-2012 [33] “Determination of Total Nitrogen with Alkaline Potassium Persulfate Elimination and Ultraviolet Spectrophotometry”, to ensure the accuracy and reliability of parameter measurements. Measurements were made at 1 h intervals for chlorophyll a and at 4 h intervals for total phosphorus and total nitrogen. The measured concentrations of the water quality parameters used in this study were averaged across the daily measurements, with a total of 56 measurements for each water quality parameter.

3. Research Method

3.1. Water Quality Retrieval Methods

The retrieval accuracy of water quality parameters using data from a single band is relatively low and therefore not applicable to lake water quality monitoring [34,35]. Furthermore, retrieval models constructed on the basis of chemometric analysis methods, such as support vector machines, partial least squares, or artificial neural networks, although relatively accurate, usually involve increasingly complex bands and longer retrieval times and are therefore not suitable for rapid monitoring aimed at efficiency. Currently, water quality retrieval models are generally constructed based on conventional algebraic models, which can effectively express the spectral characteristics of water quality parameters through the combination of multiband data. With effective algorithms (e.g., the phase difference factor and phase division factor algorithms), the spectral features of water quality parameters can be fully considered [36].
Based on the measured distributions of chlorophyll a, total phosphorus, and total nitrogen concentrations, a one-dimensional linear model was chosen as the basic algebraic model (Equation (1)) for the retrieval of different water quality parameters X (where X denotes different band combinations).
Y = A X + B
where A and B are the coefficients to be determined, X is the independent variable, which is a combination of multiple band forms, and Y is the measured value of each water quality parameter. Iterative and exhaustive methods are applied to determine X and the best combination of bands.

3.1.1. Three-Band Model

For the retrieval of chlorophyll a, Gitelson et al. [37] proposed a three-band model which eliminates some of the effects due to other optical parameters to a certain extent and is accurate for the retrieval of chlorophyll a. The combination of the three bands is used as the independent variable X (Equation (2)).
X = 1 R 1 1 R 2     R 3
Gurlin et al. [38] observed that a combined model with maximal sensitivity to the chlorophyll a concentration and minimum sensitivity to the concentrations of other components in the water body is ideal for inverting chlorophyll a concentrations from remotely sensed data. Anatoly et al. [37] applied a three-band modeling method to assess the chlorophyll a content in high-level plants and found that Rrs(λ)−1 at a wavelength of approximately 700 nm can be used as a measure of chlorophyll a. The three-band model has been utilized by numerous domestic and international researchers [39,40] to conduct retrievals for different lakes with different water quality levels, with the model generally displaying reasonable applicability.
The three-band formula is as follows:
C h l a R r s 1 λ 1 R r s 1 λ 2     R r s λ 3
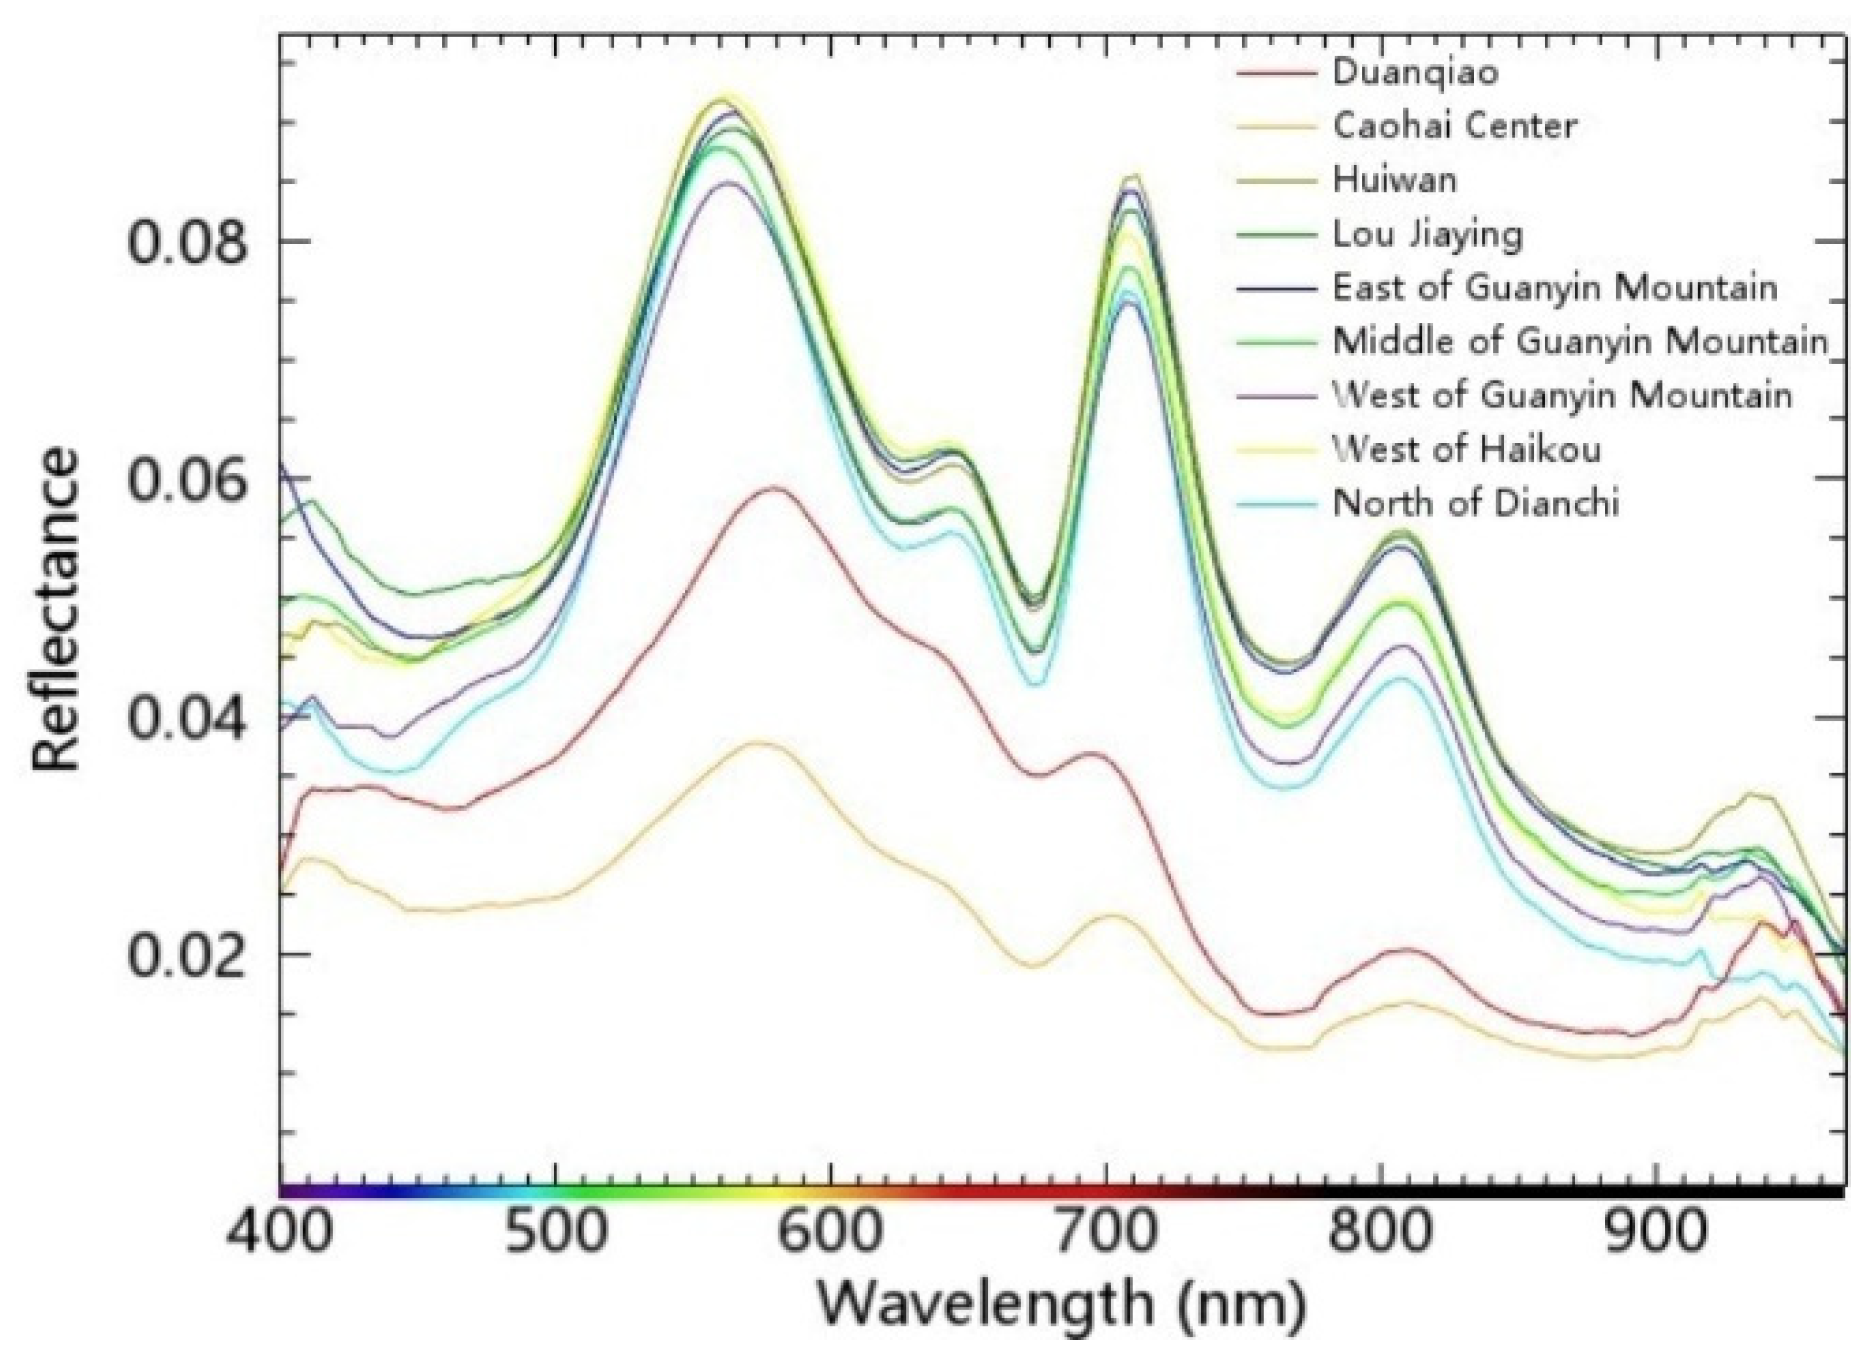
where R r s λ n indicates the value of water surface reflectance in the nth wavelength band. The concentration of chlorophyll a is related to the λ1, λ2, and λ3 wavelength bands to some extent: The spectral reflectance curve (Figure 2) displays a trough from 660~690 nm, which is influenced by the maximum absorption of chlorophyll a in this wavelength interval; additionally, λ1 corresponds to the maximum sensitive wavelength band of chlorophyll a. Therefore, the value interval of λ1 is in the range of 660~690 nm. Gitelson et al. [37] suggested that the λ2 range should satisfy the following conditions: (1) for the absorption coefficient of chlorophyll a, α C h l a ( λ 2 ) α C h l a ( λ 1 ) , (2) for the absorption coefficient of other impurities contained in water, such as total suspended matter, α T S M ( λ 2 ) α T S M ( λ 1 ) , and for the absorption coefficient of yellow matter, α C D O M ( λ 2 ) α C D O M ( λ 1 ) , so as to avoid the influence of other impurities on the chlorophyll a retrieval results; so, the value range of λ2 is set at 690 nm~730 nm. The main objective of introducing λ3 is to eliminate the effects of the light field of the water body and the total backscattering coefficient. The band nearest λ3 is the reflection band dominated by pure water, for which the absorption coefficients of chlorophyll a, yellow matter, and total suspended matter concentration are close to 0; therefore, the absorption coefficient α ( λ 3 ) α w ( λ 3 ) , which can be regarded as a constant, and the value of λ3 should be greater than 730 nm.

3.1.2. Ratio Model

Many academics have applied the ratio band method as a reasonably straightforward retrieval model for their retrieval analyses of water quality metrics. For instance, Huang Yu et al. [36] inversely determined the total phosphorus and total nitrogen values using the normalized difference index method, the ratio band method, and the difference index method. They discovered that the ratio band approach was most accurate. In their investigation of the retrieval of total nitrogen and phosphorus concentrations in Baiyangdian Lake using hyperspectral data, Chen Jie [41] and colleagues also discovered that a retrieval model based on the ratio band model yielded high accuracy. According to prior research [42,43], the ratio approach can produce reliable findings when inverting total phosphorus and total nitrogen data, even if only two bands are considered. This is because the ratio band method eliminates the general deviation between the absolute values of reflectance caused by errors in the measurement process and gives a good indication of the sensitivity of total phosphorus and total nitrogen to each selected characteristic. Hence, in this study, the combination of the ratio of the two bands is chosen as the independent variable X (Equation (4)) used in the inverse modeling of total phosphorus and total nitrogen.
X = R 1 R 2

3.2. Pearson’s Correlation Coefficient

Pearson’s correlation coefficient is the linear correlation between two variables X and Y in response and falls in the range of [−1, 1]. The Pearson’s correlation coefficient between two variables mainly depends on the quotient of the covariance and standard deviation between the two variables (Equation (5)) and is usually denoted by R.
R = i = 1 n X i X ¯ Y i Y ¯ i = 1 n X i X ¯ 2 i = 1 n Y i Y ¯ 2
In this paper, the combined reflectance values in different bands are correlated with the measured values of water quality parameters, and a high Pearson’s correlation coefficient indicates that the corresponding combination of the bands is suitable for the construction of the model.

3.3. Precision Evaluation Criteria

The accuracy evaluation of the water quality parameter retrieval model mainly includes the coefficient of determination R2, the root mean square error RMSE, and the mean absolute percentage error MAPE. The size of the coefficient of determination indicates the closeness of the correlation, the root mean square error indicates the degree of dispersion of the samples (Equation (6)), and the mean absolute percentage error identifies the relative magnitude of the deviation of the estimated water quality parameter from the measured value. (Equation (7)). Notably, EV denotes the estimated value of water quality parameters, and MV denotes the measured value of water quality parameters. The larger R2 is, the smaller the RMSE is, and the smaller the MAPE is, the higher the accuracy of the model.
R M S E = i = 1 n E V M V 2 n
M A P E = 1 n i = 1 n E V i M V i M V i     100 %

4. Model Construction and Retrieval

4.1. Spectral Characteristics of Dianchi Water

Figure 3 displays the spectral reflectance curves of water bodies at nine stations in Dianchi Lake based on GF-5 satellite images. Notably, the reflectance of the Dianchi water body displays the following spectral characteristics: In the range of 400~580 nm, the reflectance shows an increasing trend, and a reflection peak is formed at approximately 580 nm. This peak is formed due to the weak absorption of chlorophyll and carotene as well as the scattering effects of common algae, phytoplankton, and suspended matter in the water. Between 590 nm and 690 nm, the reflectance of Dianchi Lake displays a general decreasing trend, and a reflection valley is located between 670 nm and 690 nm. This valley is caused by the strong absorption of chlorophyll a in the water body. A rapidly rising steep peak is present between 690 nm and 720 nm, and it is an important basis for determining the presence or absence of chlorophyll in the water body due to the fluorescence effect of phytoplankton pigments; specifically, the sum of the absorption coefficients of water and chlorophyll a reaches a minimum in this wavelength interval. Currently, hyperspectral sensors are unable to differentiate variables such as nitrogen and phosphorus that lack distinct optical characteristics. Therefore, an approximate spectral band for the retrieval of nitrogen and phosphorus is obtained by relying on their relationships with nutrients and their effects on the turbidity and color of the water. The reflectance curve graphs for two sites, namely, Broken Bridge and Caohai Center, are similar to those at other sites, but their specific reflectance values are comparatively lower, indicating that the reflectance at these two sites is low.

4.2. Water Quality Parameters and Single-Band Reflectance Correlation Analysis

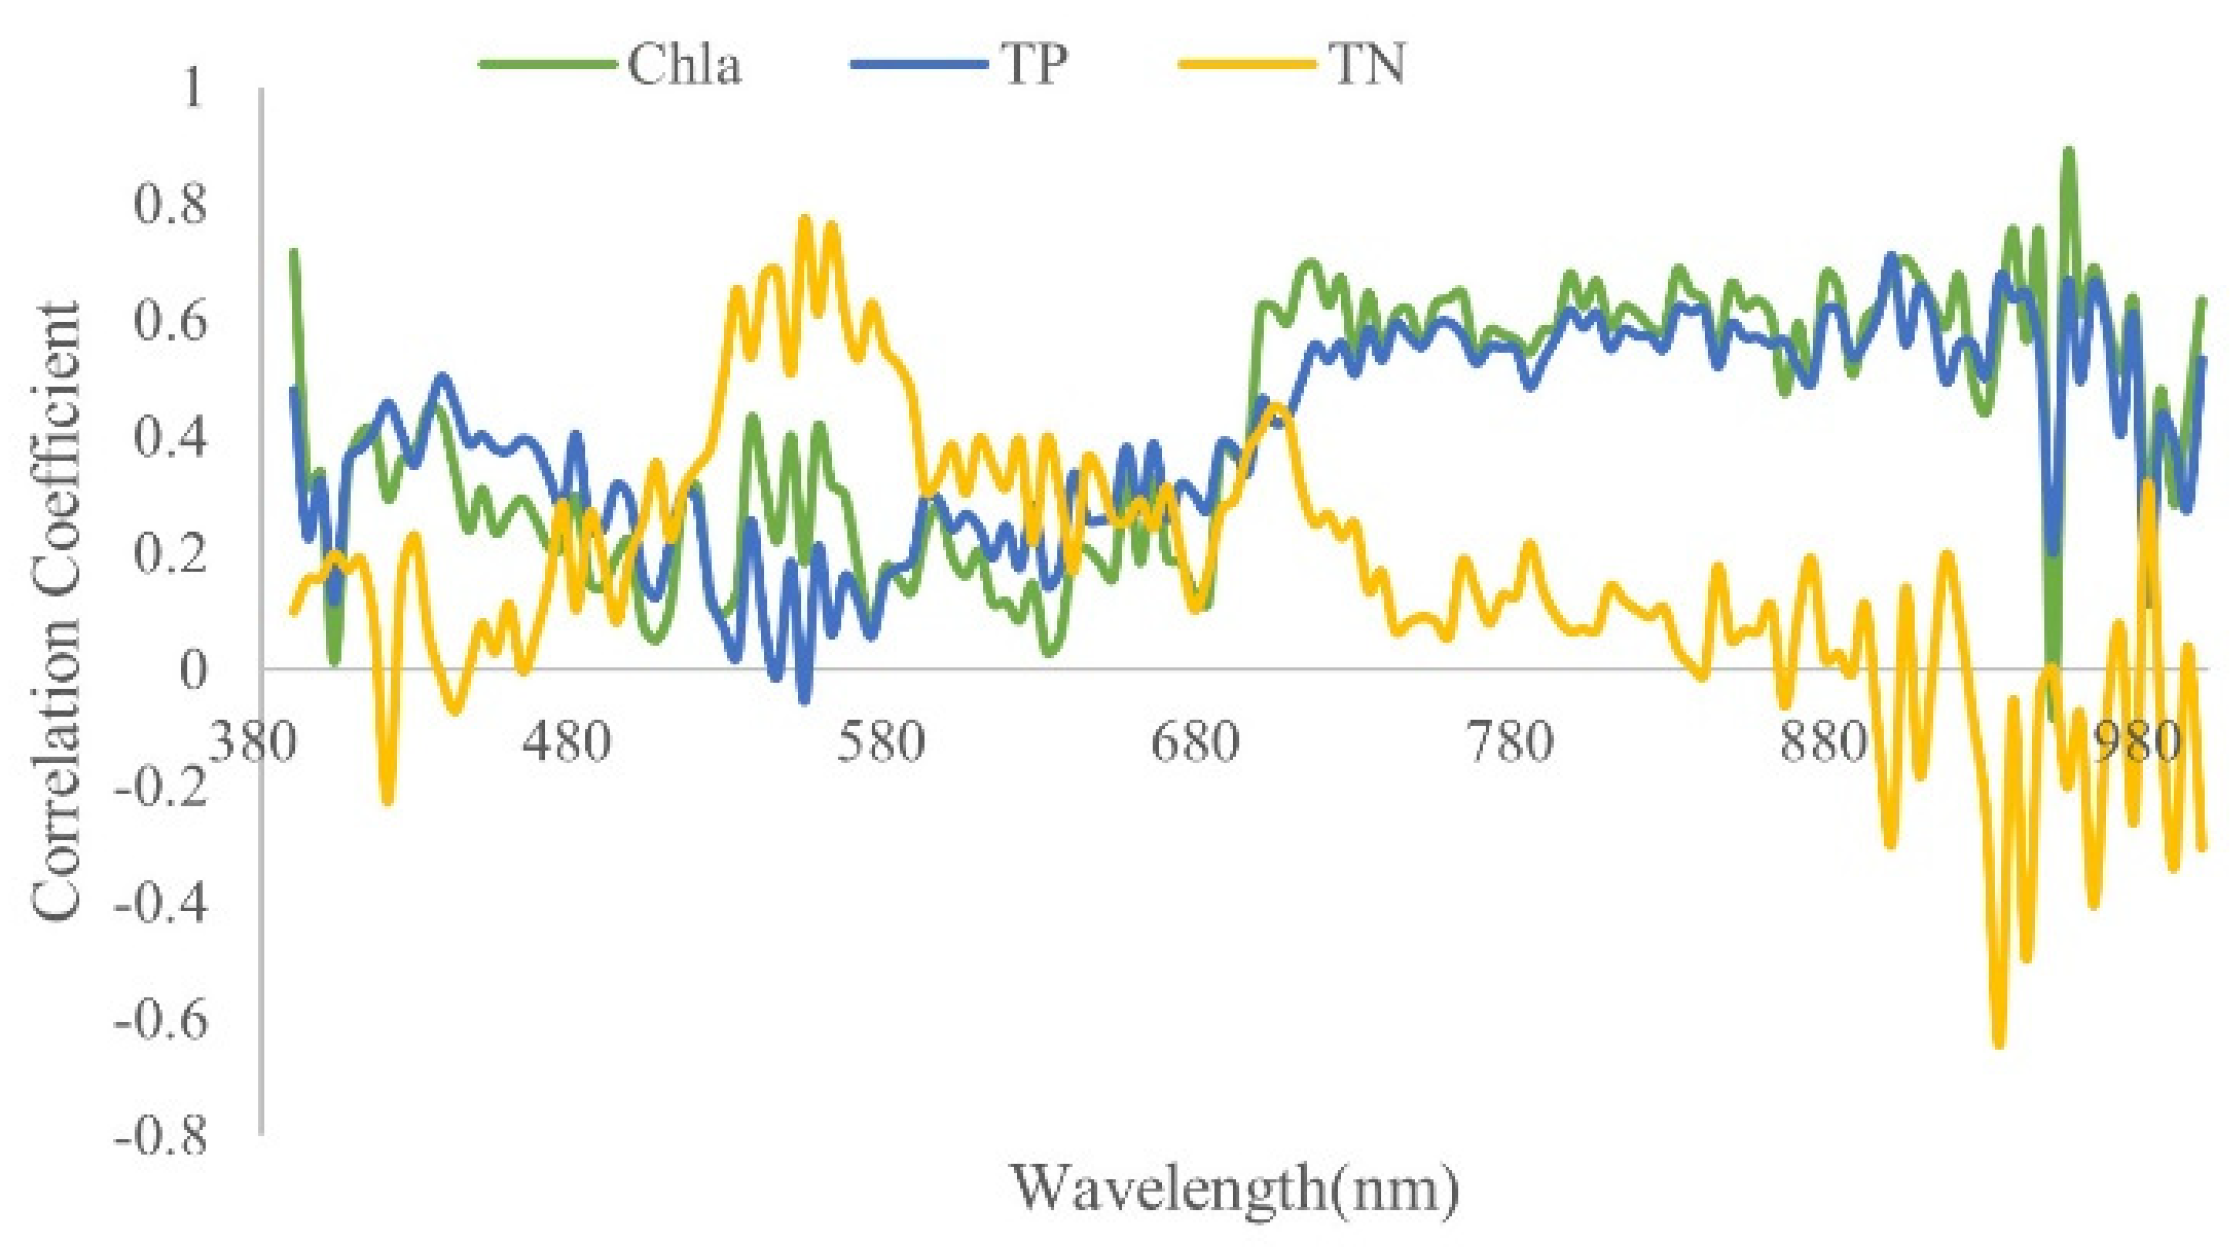
The measured concentrations of water quality parameters (chlorophyll a, total phosphorus, and total nitrogen) in Dianchi Lake were correlated with the corresponding single-band spectral reflectance values, and the correlation coefficients obtained are shown in Figure 4.
As shown in Figure 4, chlorophyll a is positively correlated with spectral reflectance at all wavelengths between 390 nm and 1000 nm, and the correlation coefficient is generally highest between 690 nm and 970 nm. Total phosphorus is basically positively correlated with spectral reflectance at all wavelengths and is only negatively correlated near the wavelength of 570 nm, with the highest correlation coefficient centered between 690 nm and 970 nm. For total nitrogen, the concentration is positively correlated with spectral reflectance between 480 nm and 880 nm, partially negatively correlated between 380 nm and 480 nm, as well as between 880 nm and 1000 nm, and highly correlated between 510 nm and 580 nm.

4.3. Chlorophyll a Model Construction

The range of values for the three bands can be found based on the spectral properties of water bodies; an iterative method is used to screen the best combination of bands. Specifically, SPSS20.0 software correlation analysis is used, and the Pearson’s correlation coefficient is applied as the basis for screening. The final determination of the three bands is as follows: λ1 = 668.44 nm, λ2 = 723.98 nm, and λ3 = 771.04 nm. These three bands are used to construct the chlorophyll retrieval model as follows:
C h l a = 28.017     R r s 1 λ 668.44 n m R r s 1 λ 723.98 n m     R r s λ 771.04 n m 5.352
The correlation coefficient between the data from this combination of bands and the measured values of chlorophyll a is 0.923, and a linear model is constructed as follows:
y = 28.017 x 5.352
where y denotes the concentration of chlorophyll a and x denotes the combination of the three bands: R r s 1 λ 668.44 n m R r s 1 λ 723.98 n m     R r s λ 771.04 n m . The model yields a coefficient of determination R2 = 0.852 and root mean square error RMSE = 0.460 mg/L.
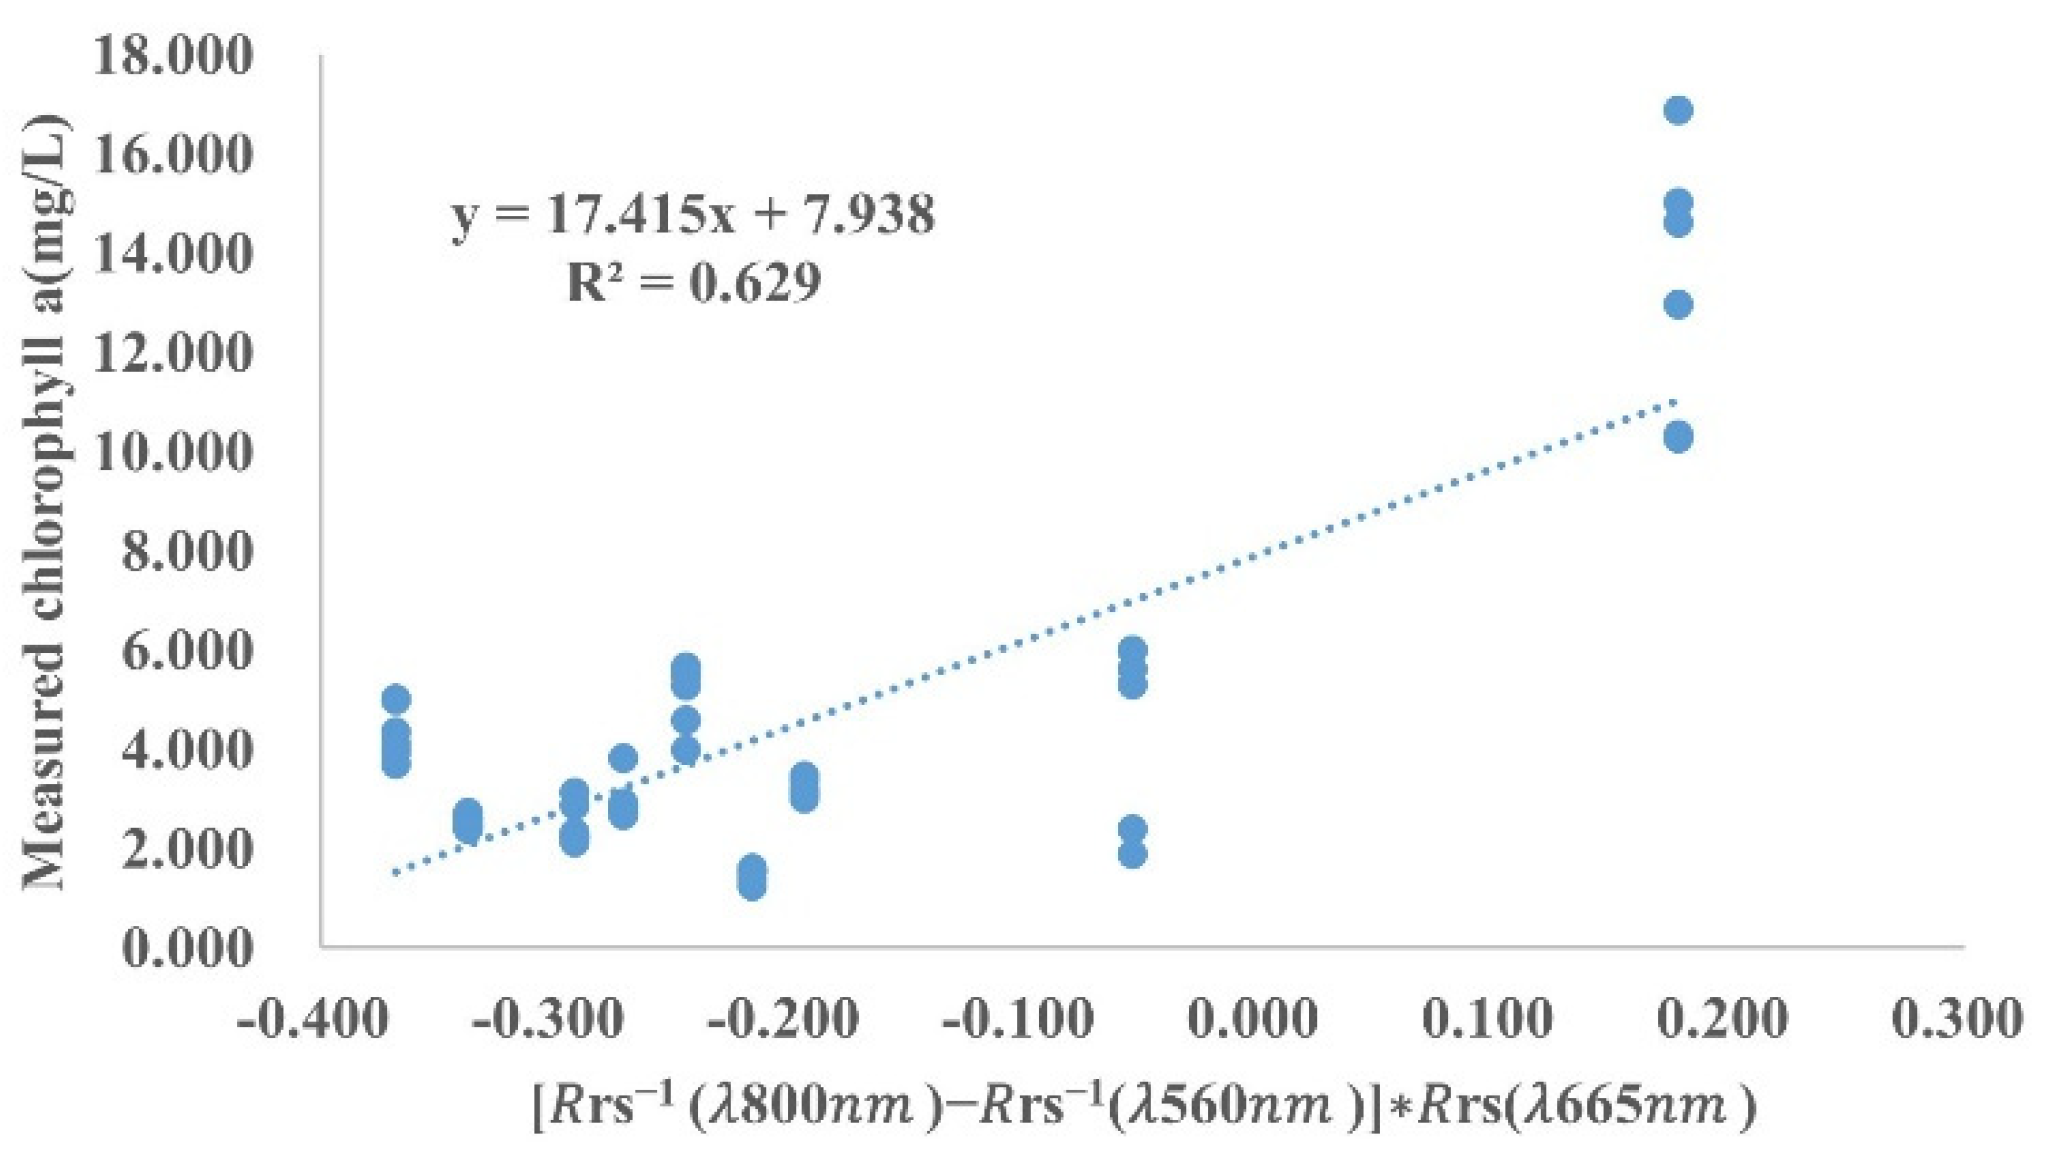
To test the accuracy of the model constructed based on the GF-5 AHSI hyperspectral satellite data, a chlorophyll a retrieval model is created using the same methodology as that for the original model based on the GF-1 data, and the two models are compared and analyzed. An exhaustive method is used to select three of the four bands of GF-1 to construct the chlorophyll a retrieval model. Through correlation analysis using SPSS 20.0 software, the three band combinations with the highest Pearson’s correlation coefficients are found to be λ1 = 800 nm, λ2 = 560 nm, and λ3 = 665 nm. Based on these three bands, the following chlorophyll a retrieval model is constructed:
C h l a = 17.415     R r s 1 λ 800 n m R r s 1 λ 560 n m     R r s λ 665 n m + 7.938
The correlation coefficient between the data from this combination of bands and the measured values of chlorophyll a is 0.793, and a linear model is constructed as follows:
y = 17.415 x + 7.938
where y denotes the concentration of chlorophyll a and x denotes the combination of the three bands: R r s 1 λ 800 n m R r s 1 λ 560 n m     R r s λ 665 n m . The model yields a coefficient of determination R2 = 0.629 and root mean square error RMSE = 2.165 mg/L.
Based on a comparative analysis of Figure 5 and Figure 6, the scatter points in Figure 5 are more clustered and those in Figure 6 are relatively dispersed. Referring to the data in Table 1, for the same model, the R2 and RMSE values of the chlorophyll a retrieval model constructed based on the GF-1 satellite data are lower than those of the model constructed using the GF-5 AHSI data.

4.4. Total Phosphorus and Total Nitrogen Model Construction

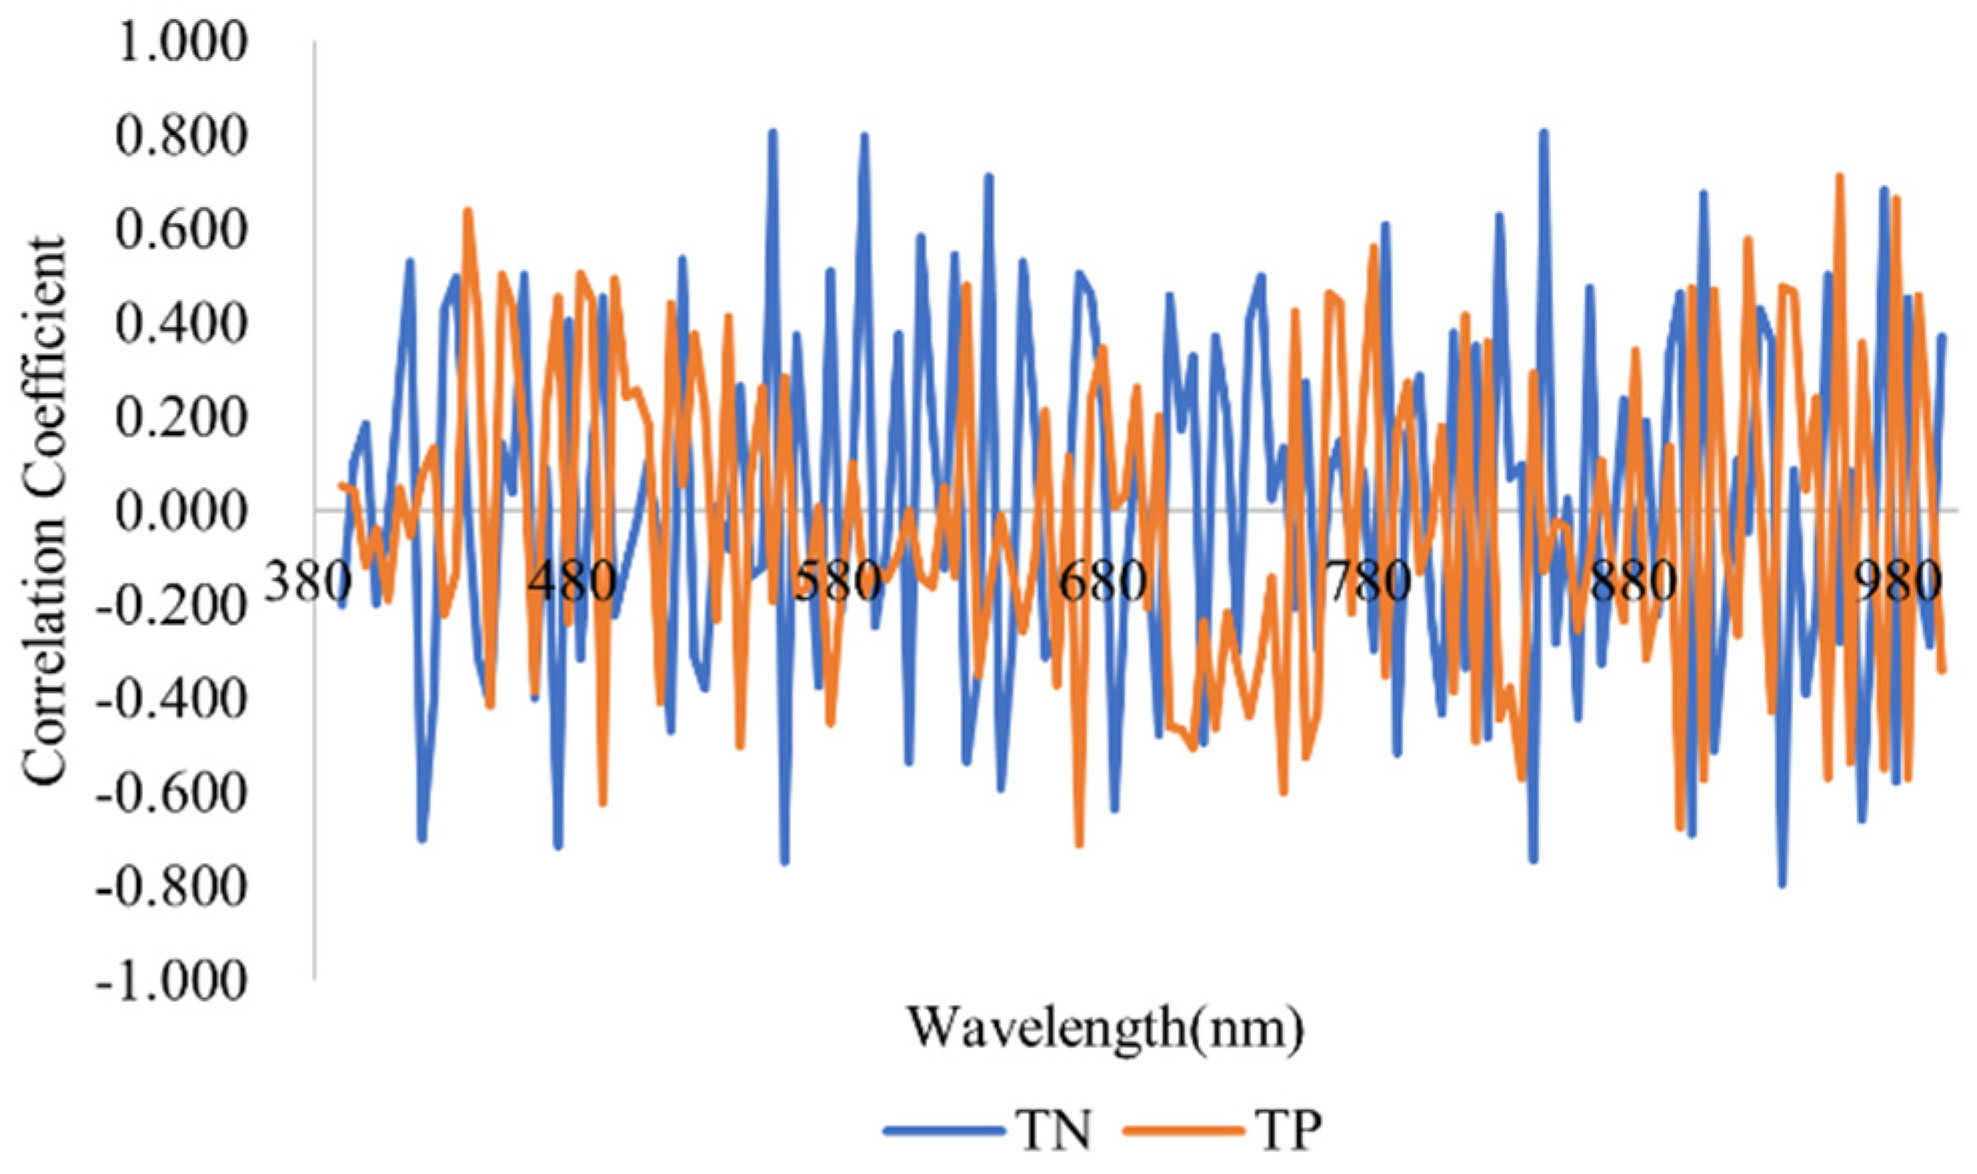
We performed correlation analysis between the ratio of water reflectance within the wavelength range of 390~1000 nm and the concentrations of total phosphorus and total nitrogen. The correlation coefficients are shown in Figure 7.
The model was constructed according to the two bands that have the highest correlation coefficient between the concentration and ratio of bands for both total phosphorus and total nitrogen; therefore, the retrieval models of total phosphorus and total nitrogen for Dianchi Lake were constructed by selecting the combination of the B55 and B65 bands and the combination of the B119 and B130 bands for the AHSI data from the GF-5 satellite, respectively (as shown in Figure 8).
The one-dimensional linear method was used to fit the total phosphorus and total nitrogen concentrations to the ratio band model. The obtained linear models provide a certain degree of universality, and the results of the fit are relatively intuitive. As shown in Table 2, R2 = 0.567 and RMSE = 0.008 mg/L for the total phosphorus model, and R2 = 0.765 and RMSE = 0.143 mg/L for the total nitrogen model.
Similarly, the GF-1 satellite data were used to construct a retrieval model of total phosphorus and total nitrogen based on the ratio band method, the ratio of reflectance in all bands was enumerated using the exhaustive enumeration method, and the maximum value of correlation coefficients between the reflectance ratios and the measured concentrations of total phosphorus and total nitrogen was screened out. The correlation coefficient of total phosphorus was 0.727 and that of total nitrogen was 0.686. Thus, the ratio of reflectance was selected as an independent variable for the construction of the retrieval models. The retrieval models were constructed as one-dimensional linear models. Figure 9 shows the retrieval models of total phosphorus and total nitrogen constructed from the GF-1 data. The distribution of scatter points is relatively discrete in both cases, the fitting effect is not ideal, and the R2 values of the models are relatively low.
The total nitrogen and total phosphorus models constructed from GF-1 satellite data were as follows (Equations (12) and (13)), with R2 = 0.471 and RMSE = 0.465 for the total nitrogen model and R2 = 0.531 and RMSE = 0.012 mg/L for the total phosphorus model.
The statistical results (Table 3 and Table 4) indicate that the R2 and RMSE values of the total nitrogen and total phosphorus models constructed from GF-1 satellite data are lower than the corresponding values for the total nitrogen and total phosphorus models constructed from GF-5 satellite data, which indicates that the models constructed from GF-5 hyperspectral data are more effective.
y = 3.761 x 1.719
y = 0.116 x 0.032

4.5. Accuracy Assessment

In this study, data were collected at 56 water sampling points, and these data were divided in a ratio of 4:1; notably, 42 were used for model building and 14 were used for model validation. After an accuracy assessment, we found that all accuracy indexes (including R2, RMSE, and MAPE) for the chlorophyll a retrieval model constructed based on GF-5 satellite data were better than those for the model constructed based on GF-1 satellite data (Table 5). For total phosphorus and total nitrogen, the models based on GF-5 satellite data also performed better than the models constructed based on GF-1 satellite data in terms of the various accuracy indexes (Table 6 and Table 7). In conclusion, for the same modeling method, the overall accuracy of GF-5 satellite data is better than that of GF-1 satellite data, confirming the unique advantages of AHSI data.
As listed in Table 5, Table 6 and Table 7, the R2 values of the test models for chlorophyll a, total phosphorus, and total nitrogen constructed from GF-5 satellite data are 0.943, 0.841, and 0.884, respectively, and the RMSEs are 0.291 mg/L, 0.005 mg/L, and 0.203 mg/L, respectively. Furthermore, the MAPE values are 7.658%, 4.511%, and 4.577%, respectively, and the three types of accuracy assessment parameters all indicate better performance than do those of the models based on GF-1 multispectral data. Based on the above analysis, the models constructed by GF-5 data yield high precision and accurate results, and they meet the water quality monitoring needs for Dianchi Lake.

4.6. Retrieval Analysis of Water Quality Parameters

Based on the models of chlorophyll a, total phosphorus, and total nitrogen constructed based on GF-5 satellite data, a retrieval analysis of these three water quality parameters in Dianchi waters was performed. From the retrieval results (Figure 10), the spatial distribution characteristics of chlorophyll a, total phosphorus, and total nitrogen in Dianchi Lake can be clearly seen. As shown in Figure 10, chlorophyll a is mainly distributed in the northern region of Dianchi, where the concentration of chlorophyll a is high. This may be related to the sewage discharge in the region, which has caused relatively serious pollution. Total phosphorus and total nitrogen are distributed throughout Dianchi Lake, and the concentrations of these factors are highest in the central and southern parts of the lake, which is in line with the actual situation.
There are many reasons for the pollution of Dianchi Lake. Firstly, this relates to Dianchi Lake’s location downstream of the city, with its eastern and northern shores adjacent to the Guandu Economic Development Zone, from which the discharge of a substantial amount of urban domestic sewage enters into Dianchi Lake, coupled with the primarily agricultural land use along its southern shore, where agricultural fertilizer runoff and wastewater emitted by factories built around the lake contribute significantly to its pollution. Second, Dianchi is in a phosphorus mining area, and the loss of surface phosphorus during the rainy season, with surface runoff into Dianchi, increases the phosphorus content of the lake. In addition, Kunming is located in a subtropical monsoon climate, with little variation in temperature throughout the year, a large amount of rainfall, and sufficient sunshine; therefore, the conditions are ideal for the growth of algae, leading to rapid reproduction and consequently, a high chlorophyll a content. In summary, the pollution of Dianchi Lake is related not only to anthropogenic factors but also to the local climate and geological environment. By inverting the water quality parameters, we can comprehensively grasp the pollution situation in Dianchi Lake. This approach provides the necessary technical support for governmental departments to implement preventive and control measures.

5. Conclusions and Discussion

5.1. Conclusion

The hyperspectral image data for Dianchi Lake acquired by the AHSI visible shortwave infrared hyperspectral camera onboard the GF-5 satellite and the data collected at 56 water quality sites at Dianchi Lake were used to jointly construct models of chlorophyll a, total phosphorus, and total nitrogen, and comparisons of the models established based on WFV sensor data from GF-1 and AHSI sensor data from GF-5 were performed. Additionally, comprehensive analyses of model parameters and accuracy assessments were conducted. The following conclusions were obtained:
  • The chlorophyll a retrieval model was constructed using the AHSI GF-5 data, with R2 = 0.852 and RMSE = 0.460 mg/L initially. An accuracy test of the model yielded R2 = 0.943, RMSE = 0.291 mg/L, and MAPE = 7.658%. Overall, the accuracy of this model was higher than that of the model constructed with the WFV GF-1 data, which is consistent with the results of many scholars globally. Therefore, the proposed model can be used for chlorophyll a retrieval in the Dianchi Lake region.
  • Under the GF-5 satellite data, the inverse models of total phosphorus and total nitrogen were constructed by using the ratio band method; the R2 values were 0.567 and 0.765, respectively, and the RMSEs were 0.008 mg/L and 0.143 mg/L, respectively. In a precision evaluation, the R2 values of the two test models reached more than 0.8, and the MAPEs were 4.511% and 4.577%, respectively, indicating small errors. Thus, the ratio band model can be used to estimate total phosphorus and total nitrogen levels in Dianchi Lake.
  • From the point of view of the spatial distribution, chlorophyll a in Dianchi is mainly distributed in the northern part of the lake, and phosphorus and nitrogen levels are high throughout the water body, with the highest levels in the central and southern parts of the lake. These results indicate that hyperspectral remote sensing data can provide valuable information, spectral data, and band combinations for the retrieval of water quality parameters. The results in this paper further confirm the feasibility of using GF-5 satellite AHSI data for the retrieval of water quality parameters, which is important for relevant departments seeking to perform rapid and efficient monitoring of the water environmental quality of inland lakes.

5.2. Discussion

  • This study shows that the AHSI sensor onboard GF-5 is able to provide robust spectral data and a wide range of band combinations, thus enhancing the options for model construction. However, these results may not be completely accurate because they are based on the processing of data acquired from a single satellite image and do not account for seasonal variations and the specific optical properties of the atmosphere, which may impact the results.
  • For each water quality parameter, only one model was used in this study, and a comparison of the retrieval ability of different models was not performed. Although the three-band method and the ratio band method are commonly used, more models should be added for comparison in subsequent studies.
  • In addition, the limiting factor of semiempirical models in the retrieval of water quality parameters is mainly the synchronization between remote sensing satellite data and measured data. Future research will focus on how to effectively determine the intrinsic optical quantities of Dianchi Lake, such as the absorption coefficient, scattering coefficient, and backscattering coefficient, and use these optical quantities to construct a retrieval model to overcome the limitation of data synchronization.
  • The results of this study highlight the significant role that GF-5 hyperspectral remote sensing satellite data play in monitoring the water quality of Dianchi Lake. This study offers a viable and efficient approach for quickly and accurately determining the lake’s water quality status. In the future, with the in-depth study of modern communication technology, wireless internet technology, big data mining, artificial intelligence, distributed measurement, and other technologies, based on the study of the spectral response mechanism of different water quality parameters, it is possible to obtain a better retrieval model, push the monitoring toward networked and intelligent development, and realize online real-time monitoring in the real world. In addition, by combining the advantages of satellite remote sensing, an all-weather, wide-coverage, and early prediction water quality detection system has been established to realize all-round monitoring of water quality.

Author Contributions

Conceptualization, H.Z. and W.H.; methodology, H.Z.; software, H.Z.; validation, H.Z. and W.H.; formal analysis, H.Z.; investigation, H.Z.; resources, H.Z.; data curation, H.Z.; writing—original draft preparation, H.Z.; writing—review and editing, H.Z. and W.H.; visualization, H.Z.; supervision, H.Z.; project administration, H.Z.; funding acquisition, Y.J. All authors have read and agreed to the published version of the manuscript.

Funding

This research was funded by the Yunnan Province Basic Research Special Key Project (202201AS070024) and the Yunnan University Innovation Team.

Data Availability Statement

Data are not available due to ethical and legal restrictions. The data procurement agreement also prohibits the disclosure of these data legally.

Acknowledgments

Thanks are given to the Department of Ecology and Environment of Yunnan Province for the actual measurement data of Dianchi water quality. Thanks for the provision of the GF-1 satellite data are given to the High-Resolution Yunnan Center.

Conflicts of Interest

The authors declare no conflict of interest.

References

  1. Cao, X.; Zhang, J.; Meng, H.; Lai, Y.; Xu, M. Remote sensing retrieval of water quality parameters in the Yellow River Delta. Ecol. Indic. 2023, 155, 110914. [Google Scholar] [CrossRef]
  2. Bhateria, R.; Jain, D. Water quality assessment of lake water: A review. Sustain. Water Resour. Manag. 2016, 2, 161–173. [Google Scholar] [CrossRef]
  3. Wang, L.; Yue, X.; Wang, H.; Ling, K.; Ling, K.; Liu, Y.; Wang, J.; Hong, J.; Pen, W.; Song, H. Dynamic retrieval of inland aquaculture water quality based on UAVs-WSN spectral analysis. Remote Sens. 2020, 12, 402. [Google Scholar] [CrossRef]
  4. Chebud, Y.; Naja, G.M.; Rivero, R.G.; Melesse, A.M. Water quality monitoring using remote sensing and an artificial neural network. Water Air Soil Pollut. 2012, 223, 4875–4887. [Google Scholar] [CrossRef]
  5. Xu, J.; Liu, H.; Lin, J.; Lyu, H.; Dong, X.; Li, Y.; Guo, H.; Wang, H. Long-term monitoring particulate composition change in the Great Lakes using MODIS data. Water Res. 2022, 222, 118932. [Google Scholar] [CrossRef] [PubMed]
  6. Torbick, N.; Hession, S.; Hagen, S.; Wiangwang, N.; Becker, B.; Qi, J. Mapping inland lake water quality across the Lower Peninsula of Michigan using Landsat TM imagery. Int. J. Remote Sens. 2013, 34, 7607–7624. [Google Scholar] [CrossRef]
  7. Moges, M.A.; Schmitter, P.; Tilahun, S.A.; Ayana, E.K.; Ketema, A.A.; Nigussie, T.E.; Steenhuis, T.S. Water quality assessment by measuring and using Landsat 7 ETM+ images for the current and previous trend perspective: Lake tana Ethiopia. J. Water Resour. Prot. 2017, 9, 1564. [Google Scholar] [CrossRef]
  8. Wheeler, S.M.; Morrissey, L.A.; Levine, S.N.; Livingston, G.P.; Vincent, W.F. Mapping cyanobacterial blooms in Lake Champlain’s Missisquoi Bay using Quick Bird and MERIS satellite data. J. Great Lakes Res. 2012, 38, 68–75. [Google Scholar] [CrossRef]
  9. Imran, U.; Zaidi, A.; Mahar, R.B.; Khokhar, W.A. Assessment of the lake water quality using Landsat 8 OLI imagery: A case study of Manchar Lake, Pakistan. Arab. J. Geosci. 2022, 15, 1094. [Google Scholar] [CrossRef]
  10. Hyde, K.J.W.; O’Reilly, J.E.; Oviatt, C.A. Validation of SeaWiFS chlorophyll a in Massachusetts Bay. Cont. Shelf Res. 2007, 27, 1677–1691. [Google Scholar] [CrossRef]
  11. Reinart, A.; Pierson, D. Water Quality monitoring of Large European Lakes Using MERIS Full Resolution Data. In Proceedings of the 2004 Envisat & ERS Symposium, Salzburg, Austria, 6–10 September 2004. [Google Scholar]
  12. Al-Shaibah, B.; Liu, X.; Zhang, J.; Tong, Z.; Zhang, M.; El-Zeiny, A.; Faichia, C.; Hussain, M.; Tayyab, M. Modeling water quality parameters using landsat multispectral images: A case study of Erlong lake, northeast China. Remote Sens. 2021, 13, 1603. [Google Scholar] [CrossRef]
  13. Zhu, X.; Wen, Y.; Li, X.; Yan, F.; Zhao, S. Remote Sensing Retrieval of Typical Water Quality Parameters of a Complex River Network: A Case Study of Qidong’s Rivers. Sustainability 2023, 15, 6948. [Google Scholar] [CrossRef]
  14. Lu, B.; He, Y.; Dao, P.D. Comparing the performance of multispectral and hyperspectral images for estimating vegetation properties. IEEE J. Sel. Top. Appl. Earth Obs. Remote Sens. 2019, 12, 1784–1797. [Google Scholar] [CrossRef]
  15. Landgrebe, D. Hyperspectral image data analysis. IEEE Signal Process. Mag. 2002, 19, 17–28. [Google Scholar] [CrossRef]
  16. Chander, S.; Gujrati, A.; Krishna, A.V.; Sahay, A.; Singh, R.P. Remote sensing of inland water quality: A hyperspectral perspective. In Hyperspectral Remote Sensing; Elsevier: Amsterdam, The Netherlands, 2020; pp. 197–219. [Google Scholar]
  17. Zang, C.; Shen, F.; Yang, Z. Aquatic Environmental Monitoring of Inland Waters Based on Hyperspectral Remote Sensing. Remote Sens. Nat. Resour. 2021, 33, 45–53. [Google Scholar]
  18. Liu, H.; Yu, T.; Hu, B.; Hou, X.; Zhang, Z.; Liu, X.; Liu, J.; Wang, X.; Zhong, J.; Tan, Z.; et al. Uav-borne hyperspectral imaging remote sensing system based on acousto-optic tunable filter for water quality monitoring. Remote Sens. 2021, 13, 4069. [Google Scholar] [CrossRef]
  19. Elsayed, S.; Ibrahim, H.; Hussein, H.; Elsherbiny, O.; Elmetwalli, A.H.; Moghanm, F.S.; Ghoneim, A.M.; Danish, S.; Datta, R.; Gad, M. Assessment of water quality in Lake Qaroun using ground-based remote sensing data and artificial neural networks. Water 2021, 13, 3094. [Google Scholar] [CrossRef]
  20. Cao, Q.; Yu, G.; Sun, S.; Dou, Y.; Li, H.; Qiao, Z. Monitoring water quality of the Haihe River based on ground-based hyperspectral remote sensing. Water 2021, 14, 22. [Google Scholar] [CrossRef]
  21. Zhong, Y.; Wang, X.; Wang, S.; Zhang, L. Advances in spaceborne hyperspectral remote sensing in China. Geo-Spat. Inf. Sci. 2021, 24, 95–120. [Google Scholar] [CrossRef]
  22. Li, S.; Liu, Z.; Liu, K.; Zhao, Z.F. Advances in application of space hyperspectral remote sensing (invited). Infrared Laser Eng. 2019, 48, 303001. [Google Scholar]
  23. Xiao, C.; Wang, Q.; Wang, M.; Ruan, J.; Chen, M.; Ding, L.; Huang, S. Retrieval of chlorophyll-a concentration in the Yangtze River estuary based on remote sensing data trom GF-5 satellite. J. Donghua Univ. (Nat. Sci. Ed.) 2022, 48, 4. [Google Scholar]
  24. Deng, S.; Tian, L.; Li, J.; Chen, X.; Sun, Z.; Zhang, L.; Wei, A. A novel chlorophyll-a retrieval model in turbid water for GF-5 satellite hyperspectral sensor—A case in Poyang Lake. J. Cent. China Norm. Univ. (Nat. Sci.) 2018, 52, 409–415. [Google Scholar]
  25. Wei, A.; Tian, Q.; Chen, L.; Yu, Y. Retrieval and application of Chlorophyll-a concentration in the Poyang Lake based on exhaustion method: A case study of Chinese Gaofen-5 Satellite AHSI data. J. Cent. China Norm. Univ. (Nat. Sci.) 2020, 54, 447–453. [Google Scholar]
  26. Chen, D.; Fan, J.; Zhao, H.; Gu, B.; Li, X. Empirical Study on Ecosystem Integrity Change and Its Driving Mechanism in Dianchi Lake Basin:1-16. Available online: http://kns.cnki.net/kcms/detail/53.1193.F.20230629.0843.002.html (accessed on 15 September 2023).
  27. Su, J.; Ji, D.; Lin, M.; Chen, Y.; Sun, Y.; Huo, S.; Zhu, J.; Xi, B. Developing surface water quality standards in China. Resour. Conserv. Recycl. 2017, 117, 294–303. [Google Scholar] [CrossRef]
  28. Cao, J.; Wen, X.; Luo, D.; Tan, Y. Study on Water Quality Retrieval Model of Dianchi Lake Based on Landsat 8 Data. J. Spectrosc. 2022, 2022, 3341713. [Google Scholar] [CrossRef]
  29. Liang, Y.; Yin, F.; Xie, D.; Liu, L.; Zhang, Y.; Ashraf, T. Retrieval and Monitoring of the TP Concentration in Taihu Lake Using the Landsat-8 and Sentinel-2 Images. Remote Sens. 2022, 14, 6284. [Google Scholar] [CrossRef]
  30. Yao, Y.; Zhu, L.; Wu, C.; Zhang, Y.; Wang, P.; Wang, Y.; Chen, J. Water quality remote sensing monitoring research in China based on the HJ-1 satellite data. In Proceedings of the 2010 IEEE International Geoscience and Remote Sensing Symposium, Honolulu, HI, USA, 25–30 July 2010; pp. 620–623. [Google Scholar]
  31. HJ897-2017; Determination of Chlorophyll a with Spectrophotometry. Ministry of Environmental Protection: Beijing, China, 2017.
  32. GB11893-89; Determination of Total Phosphorus with Ammonium Molybdate Spectrophotometry. State Bureau of Technical Supervision: Beijing, China, 1989.
  33. HJ636-2012; Determination of Total Nitrogen with Alkaline Potassium Persulfate Elimination and Ultraviolet Spectrophotometry. Ministry of Environmental Protection: Beijing, China, 2012.
  34. Zhang, D.; Zeng, S.; He, W. Selection and Quantification of Best Water Quality Indicators Using UAV-Mounted Hyperspectral Data: A Case Focusing on a Local River Network in Suzhou City, China. Sustainability 2022, 14, 16226. [Google Scholar] [CrossRef]
  35. Lü, H.; Ma, W.C.; Zhou, L.G.; Huai, H.Y. Estimation for water quality parameters in dianshan lake based on HJ-1A HSI image. J. Fudan Univ. (Nat. Sci.) 2013, 52, 238–246. [Google Scholar]
  36. Huang, Y.; Chen, X.; Liu, Y.; Sun, M.; Chen, H.; Wang, X. Retrieval of river and lake water quality parameters by UAV hyperspectral imaging technology. Yangtze River 2020, 51, 205–212. [Google Scholar]
  37. Gitelson, A.A.; Gritz, Y.; Merzlyak, M.N. Relationships between leaf chlorophyll content and spectral reflectance and algorithms for non-destructive chlorophyll assessment in higher plant leaves. J. Plant Physiol. 2003, 160, 271–282. [Google Scholar] [CrossRef]
  38. Gurlin, D.; Gitelson, A.A.; Moses, W.J. Remote estimation of chl-a concentration in turbid productive waters—Return to a simple two-band NIR-red model? Remote Sens. Environ. 2011, 115, 3479–3490. [Google Scholar] [CrossRef]
  39. Guo, Y.L.; Li, Y.M.; Li, Y.; Lü, H.; Liu, G.; Wang, X.D.; Zhang, S.M. A three band chlorophyll-a concentration estimation model based on GOCI imagery. Huan Jing Ke Xue Huanjing Kexue 2015, 36, 3175–3185. [Google Scholar] [PubMed]
  40. Dall’Olmo, G.; Gitelson, A.A.; Rundquist, D.C. Towards a unified approach for remote estimation of chlorophyll-a in both terrestrial vegetation and turbid productive waters. Geophys. Res. Lett. 2003, 30, 18. [Google Scholar] [CrossRef]
  41. Chen, J.; Zhang, L.; Zhang, H.; Zhang, L.; Yi, C.; Tong, Q. Comparative study on the hyperspectral estimation models of TP and TN in Baiyangdian water body. Natl. Remote Sens. Bull. 2023, 27, 1642–1652. [Google Scholar]
  42. Liu, J.; Kuang, R.Y.; Li, J.X.; Hu, M. Retrieval model of TN, TP concentration based on measured spectral reflectance data in Poyang Lake. Southwest China J. Agric. Sci. 2020, 33, 2088–2094. [Google Scholar]
  43. Wang, S.; Shen, M.; Liu, W.; Ma, Y.; Shi, H.; Zhang, J.; Liu, D. Developing remote sensing methods for monitoring water quality of alpine rivers on the Tibetan Plateau. GISci. Remote Sens. 2022, 59, 1384–1405. [Google Scholar] [CrossRef]
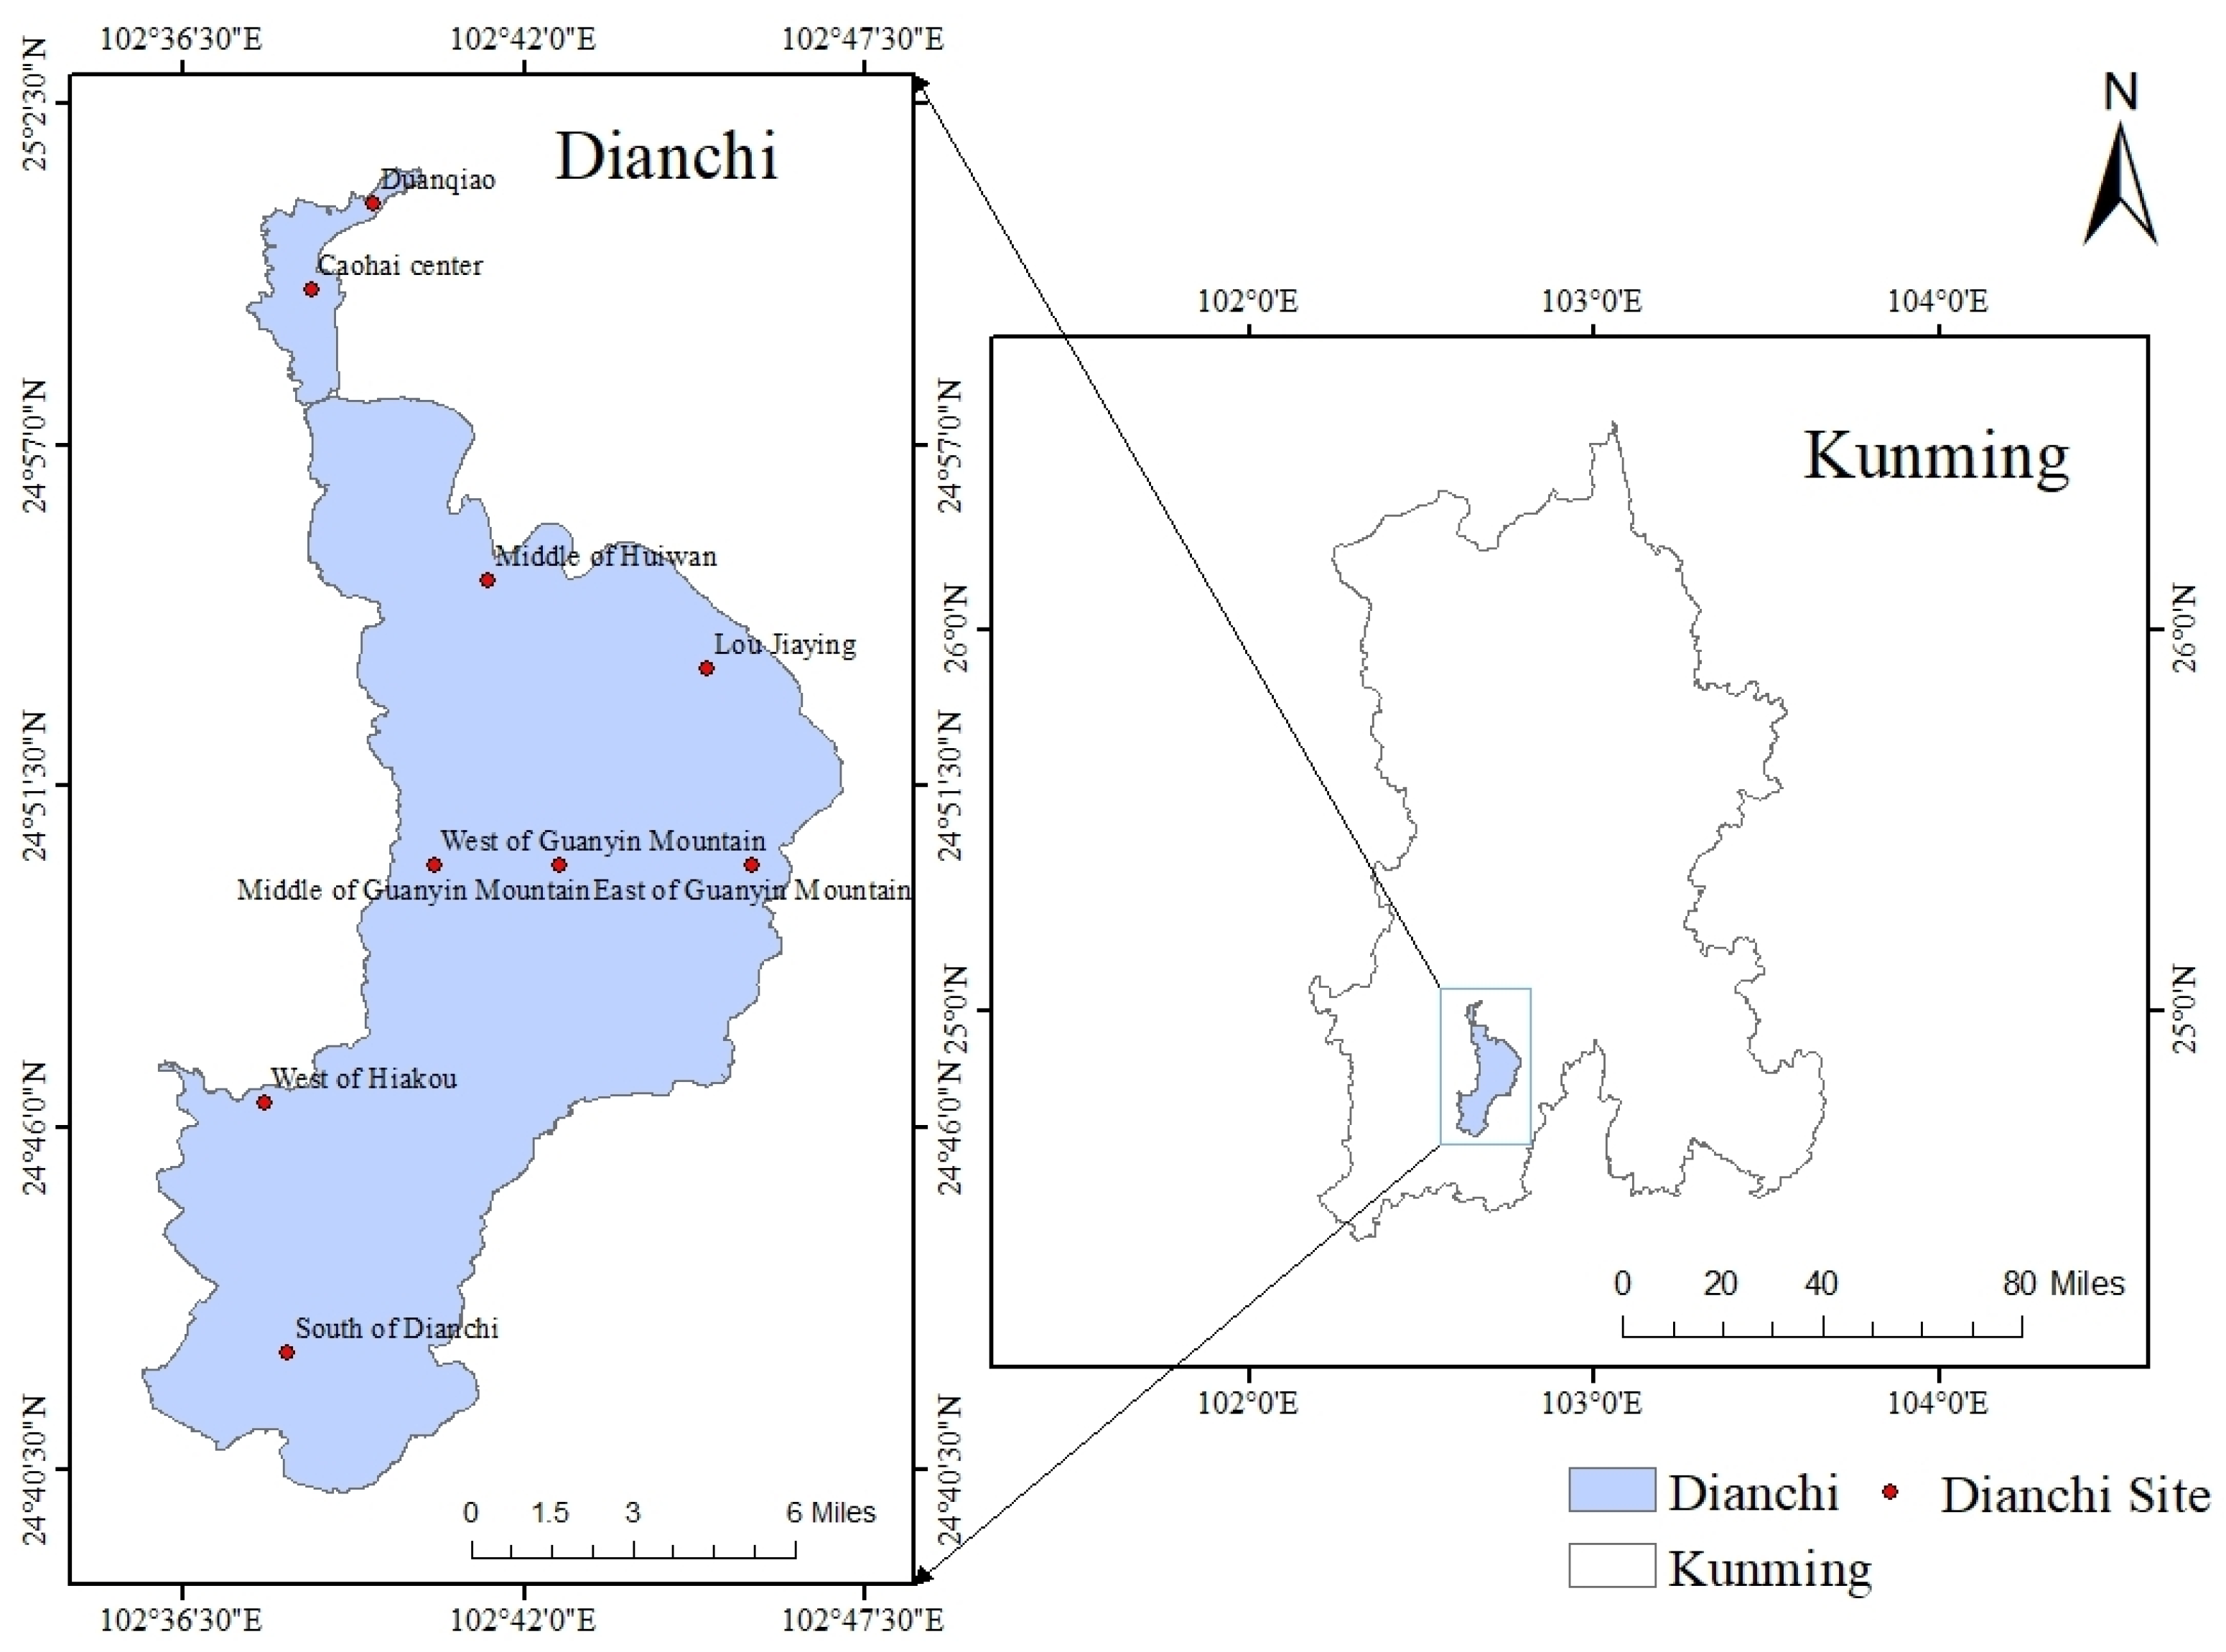
Figure 1. Schematic location of the study area.
Water 16 00225 g001
Figure 2. Comparison of GF-5 satellite images before and after atmospheric correction, where Figure (a) is the original image and Figure (b) is the atmospherically corrected image.
Water 16 00225 g002
Figure 3. Hyperspectral reflectance curves at sites on Dianchi Lake.
Water 16 00225 g003
Figure 4. Correlation coefficients between various water quality parameters and single-band reflectance in Dianchi Lake.
Water 16 00225 g004
Figure 5. Chlorophyll a model diagram based on the three-band method for GF-5 data.
Water 16 00225 g005
Figure 6. Chlorophyll a model diagram of GF-1 data based on the three-band method.
Water 16 00225 g006
Figure 7. Correlation coefficients between specific band reflectance and the total phosphorus and total nitrogen concentrations.
Water 16 00225 g007
Figure 8. Model diagram of total phosphorus and total nitrogen based on the ratio band method for the GF-5 data.
Water 16 00225 g008
Figure 9. Model diagram of total phosphorus and total nitrogen based on the ratio band method for GF-1 data.
Water 16 00225 g009
Figure 10. Spatial distribution of water quality parameter concentrations in the Dianchi Lake watershed.
Water 16 00225 g010
Table 1. Comparison of chlorophyll-a models of GF-5 and GF-1.
SensorsModelsCorrelation CoefficientCoefficient of Determination R2RMSE
GF-5 AHSI y = 28.017 x 5.353 0.9230.8520.460
GF-1 WFV y = 17.415 x + 7.938 0.7930.6292.165
Table 2. Modeling wavelengths and correlation coefficients for total phosphorus and total nitrogen.
Water Quality ParameterMolecular Wavelength (nm)Denominator Wavelength (nm)ModelCorrelation Coefficient
TP621.5664.1 y = 0.454 x + 0.624 0.752
TN895.1942.2 y = 4.547 x 2.676 0.875
Table 3. Comparison of the GF-5 and GF-1 total nitrogen models.
SensorModelCorrelation CoefficientCoefficient of Determination R2RMSE
GF-5 AHSI y = 4.547 x 2.676 0.8750.7650.143
GF-1 WFV y = 3.761 x 1.719 0.6860.4710.465
Table 4. Comparison of GF-5 and GF-1 total phosphorus models.
SensorModelCorrelation CoefficientCoefficient of Determination R2RMSE
GF-5 AHSI y = 0.454 x + 0.624 0.7520.5670.008
GF-1 WFV y = 0.116 x 0.032 0.7270.5310.012
Table 5. Statistical comparison of the accuracy assessment results of the two chlorophyll a models.
SensorsFormulasTest Models Test R 2 Test RMSEMAPE (%)
GF-5 AHSI B 66 1 B 79 1     B 90 y = 28.558 x 5.363 0.9430.2917.658
GF-1 WFV B 3 1 B 1 1     B 2 y = 14.007 x + 7.0036 0.6541.71546.776
Table 6. Statistical comparison of the accuracy assessment results of the two total phosphorus models.
SensorsFormulasTest Models Test R 2 Test RMSEMAPE (%)
GF-5 AHSI B 55 / B 65 y = 0.646 x 0.473 0.8410.0054.511
GF-1 WFV B 3 / B 1 y = 0.111 x 0.026 0.5620.0118.123
Table 7. Statistical comparison of the accuracy assessment results of the two total nitrogen models.
SensorsFormulasTest Models Test R 2 Test RMSEMAPE (%)
GF-5 AHSI B 119 / B 130 y = 0.65 x + 0.182 0.8840.2034.577
GF-1 WFV B 1 / B 4 y = 3.475 x 1.484 0.4630.45424.720
Disclaimer/Publisher’s Note: The statements, opinions and data contained in all publications are solely those of the individual author(s) and contributor(s) and not of MDPI and/or the editor(s). MDPI and/or the editor(s) disclaim responsibility for any injury to people or property resulting from any ideas, methods, instructions or products referred to in the content.