Article

Influence Mechanism of Water Level Variation on Deformation of Steep and Toppling Bedding Rock Slope

1
State Key Laboratory of Geohazard Prevention and Geoenvironment Protection, Chengdu University of Technology, Chengdu 610059, China
2
Chengdu Engineering Corporation Limited, Power China, Chengdu 610072, China
3
Department of Civil Engineering, Panzhihua University, Panzhihua 617000, China
*
Author to whom correspondence should be addressed.
Water 2024, 16(19), 2706; https://doi.org/10.3390/w16192706
Submission received: 20 August 2024 / Revised: 6 September 2024 / Accepted: 10 September 2024 / Published: 24 September 2024

Abstract

:
The construction of major hydropower projects globally is challenged by slope deformation in reservoir areas. The deformation and failure mechanisms of large rock slopes are complex and poorly understood, making prevention and management extremely challenging. In order to explore the influence mechanism of the water level variation on the deformation of steep toppling bedding rock slopes, this paper takes the right bank slope near the dam area of the Longtou Hydropower Station as an example, and field investigations, deformation monitoring, physical simulation tests and numerical analyses are carried out. It is found that the slope deformation response is obvious under the influence of the reservoir water level variation, which is mainly reflected in the change in the slope groundwater level, rock mechanical parameters and seepage field in the slope body. The toe of the slope produces plastic deformation and maximum displacement. With the increase in the reservoir water level, the plastic zone expands and the displacement increases, which leads to the intensification of the slope deformation. This paper puts forward that the deformation and failure modes of the steep and toppling bedding rock slope caused by water level variation are due to shear dislocation, bending deformation and toppling fracture. This study reveals the influence mechanism of the water level variation on the deformation of steep and toppling bedding rock slopes, which can provide theoretical support for the construction of major hydropower projects.

1. Introduction

Toppling is among the most common deformation types in steeply bedded rock slopes. With the construction of high dams in large rivers, various toppling deformations have occurred in reservoir areas, and water level variations have triggered or accelerated deep-seated toppling deformations [1,2]. The phenomenon of toppling deformation and failure is ubiquitous in layered anti-dip rock slopes [3,4,5]. Many scholars have studied the evolutionary mechanism of slope toppling deformation.
Slope toppling deformation is a process of river valley evolution and bank slope formation. The rock layer begins to bend from the front edge of the slope body to the air direction under the action of the maximum principal stress of the parallel slope surface, which gradually develops into the slope, finally causing the rock layer to break at the root and form the toppling deformable body [6,7,8,9,10,11,12,13,14]. In addition, the toppling failure evolution in soft–hard interbedded anti-dip rock slopes shows that the rock layers of one type of lithology are destabilized first, and then the other rock layers begin to fail until the entire slope undergoes flexural toppling [15]. The water level variation is an important factor affecting the stability of bank slope toppling deformation.
Studies have shown that a decrease in the reservoir water level combined with a long weak rainfall is more likely to trigger a landslide, and the influence of rainfall on slope stability is significantly smaller than that of the water level change on the slope stability [5,16]. Finite element software and physical model experiments indicate that the safety factor when the water level drops rapidly is generally slightly lower than the safety factor when the upstream water level rises rapidly [17,18,19,20,21,22,23,24,25,26,27,28]. Studies have also indicated that there is a progressive development to the plastic shear strain zone within the slope as the number of water level variation cycles is increased, and the change in the seepage field is closely related to the water level variation [29,30].
However, these studies did not address the deformation mechanism of steep and toppling bedding rock slopes under water level variation. Therefore, this paper considers the right bank slope near the dam area of the Longtou Hydropower Station as an example, and studies its deformation mechanism through field investigations, deformation monitoring, physical simulation tests and numerical analyses. This paper aims to provide theoretical support for the engineering safety of power stations and enhance the understanding of the toppling deformation mechanism of bedding slopes.

2. Geological Background

The research area is located in the Baishui River basin in western China (Figure 1). The research object is the bank slope at the Longtou Hydropower Station reservoir. The region terrain is high in the northwest and low in the southeast, and the elevation is between 4764 m and 1160 m. The Huya fault is located on the eastern edge of the Tibet Plateau [31], which has a great influence on the regional geological structure, and it was the presumed cause of the “8.8” earthquake in Jiuzhaigou Valley.
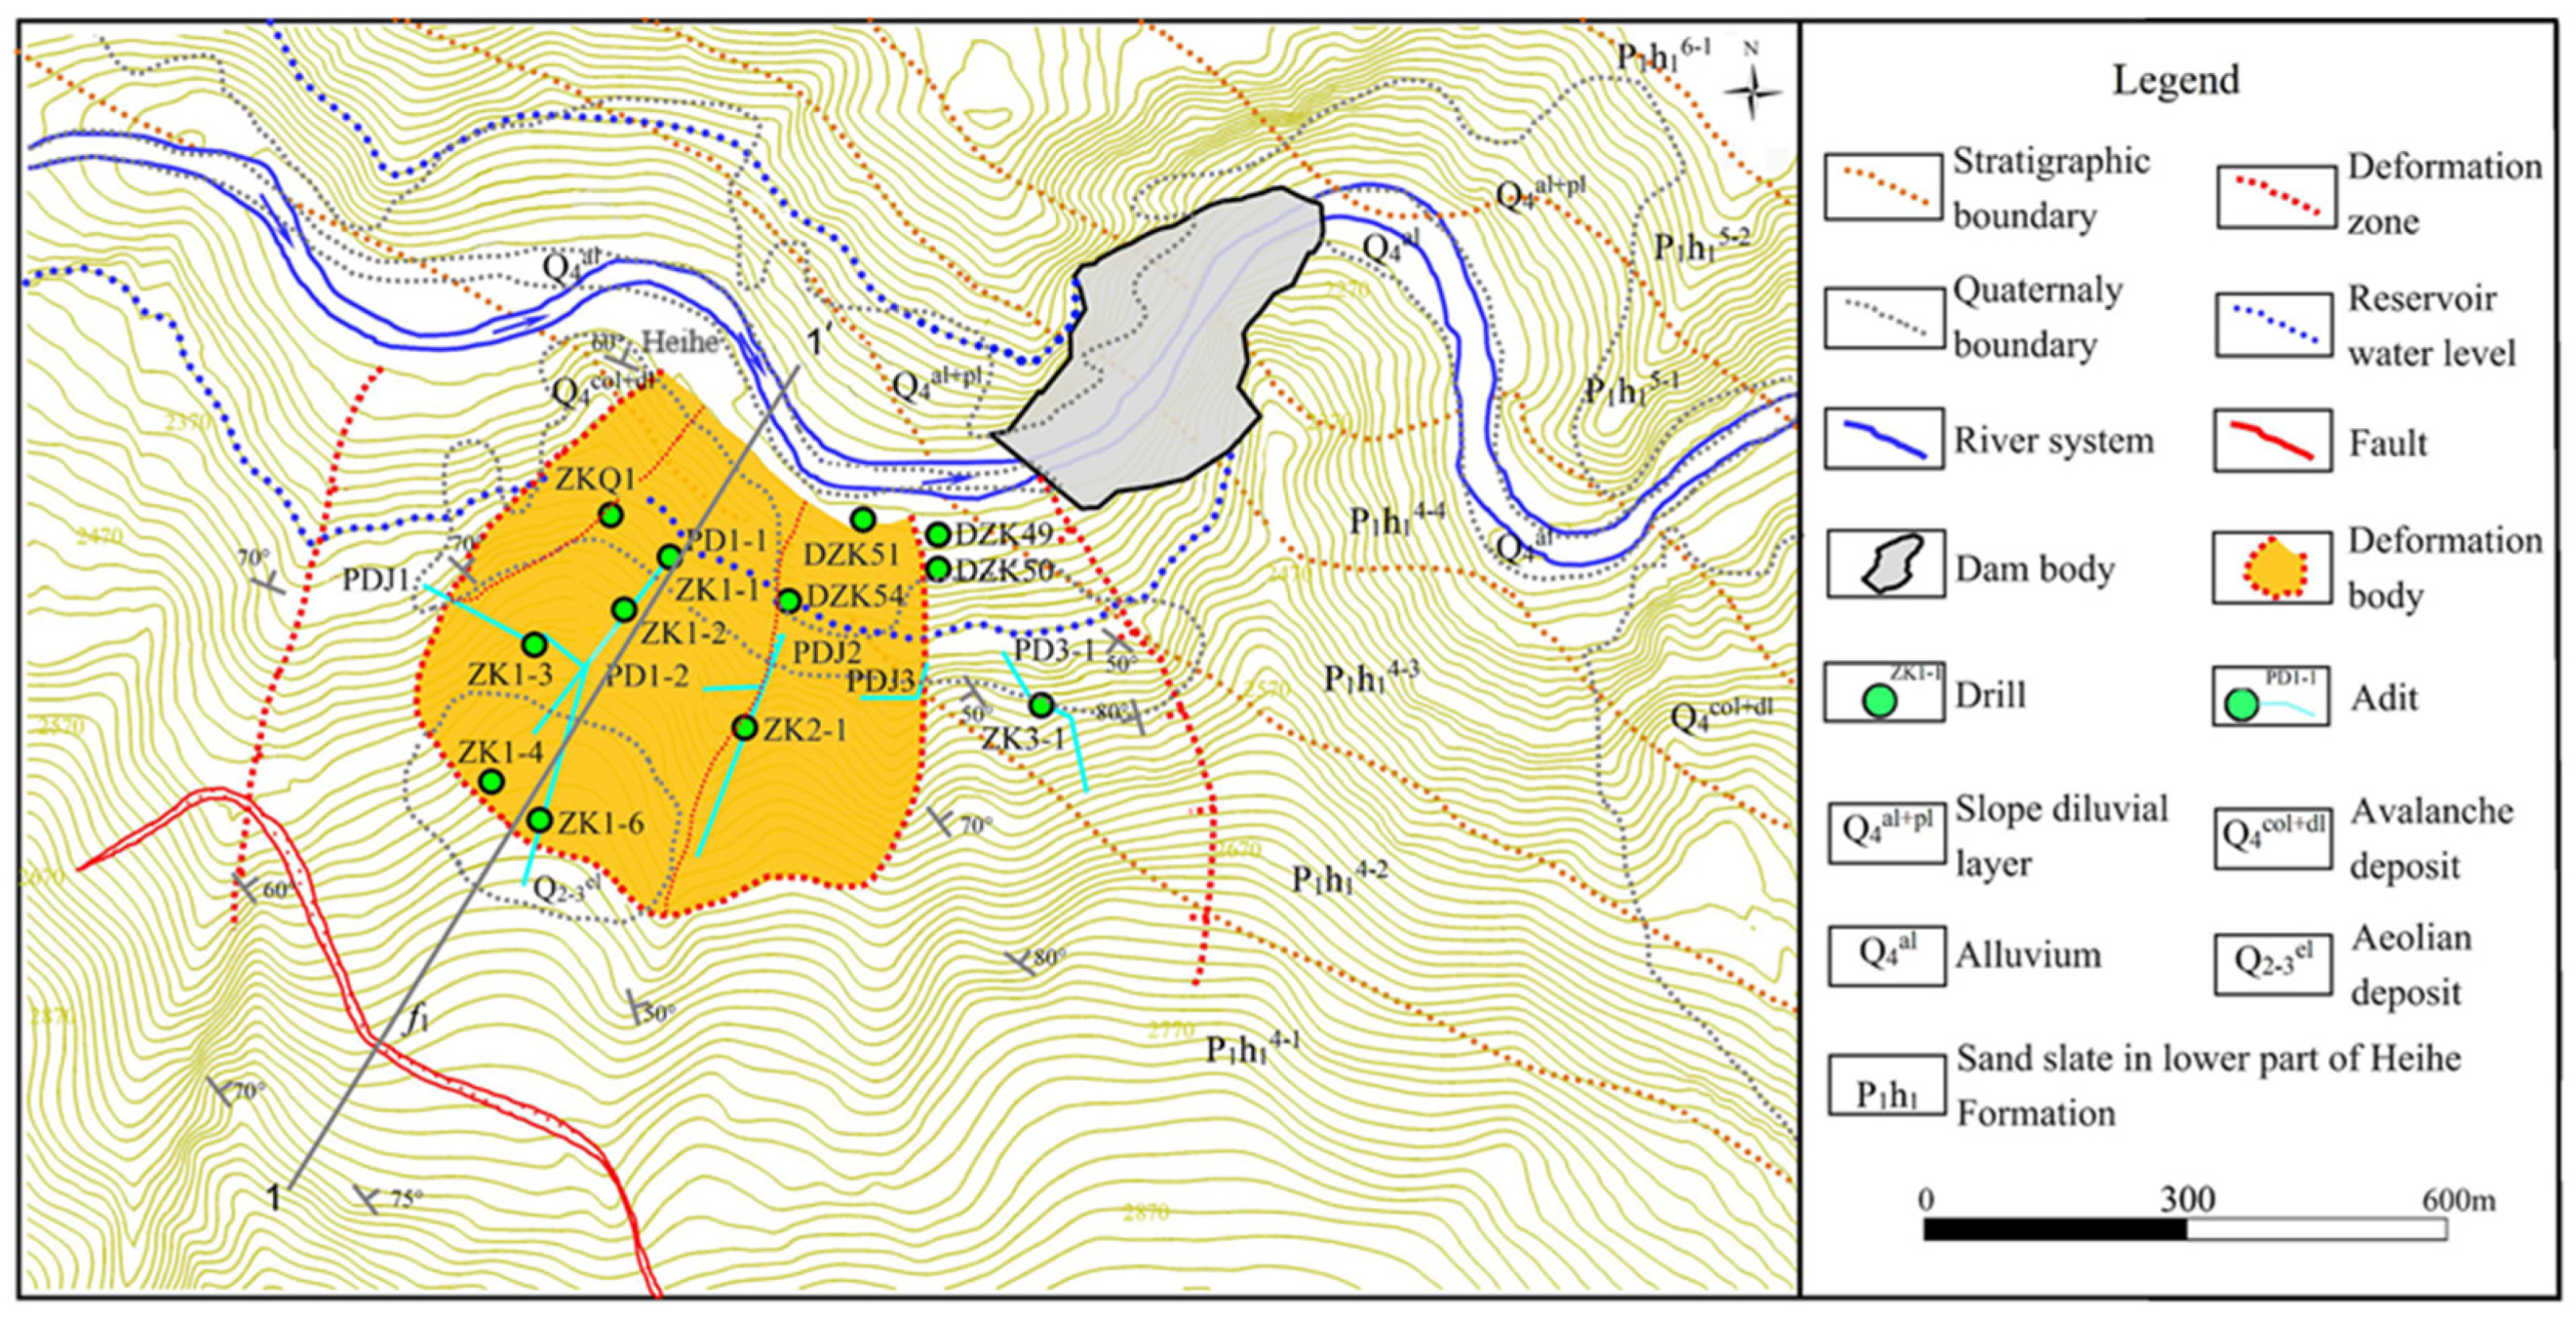
As shown in Figure 2, the surface of the bank slope is the fourth layer (P1h14) of the Lower Permian Heihe Formation. The lithology is gray feldspar quartz sandstone with a small amount of phyllite. The main overlying layers in the research area are alluvium (Q4al) in the riverbed, aeolian loess (Q2-3) in the upper gentle slope and avalanche deposit (Q4col+dl) on the slope. The slope developed 148 interlayer extrusion zones, and they are composed predominantly of mylonite, which exhibits strong weathering and weak properties. These characteristics provide structural conditions conducive to the surface rock mass deformation of the slope.

3. Engineering Geological Zoning

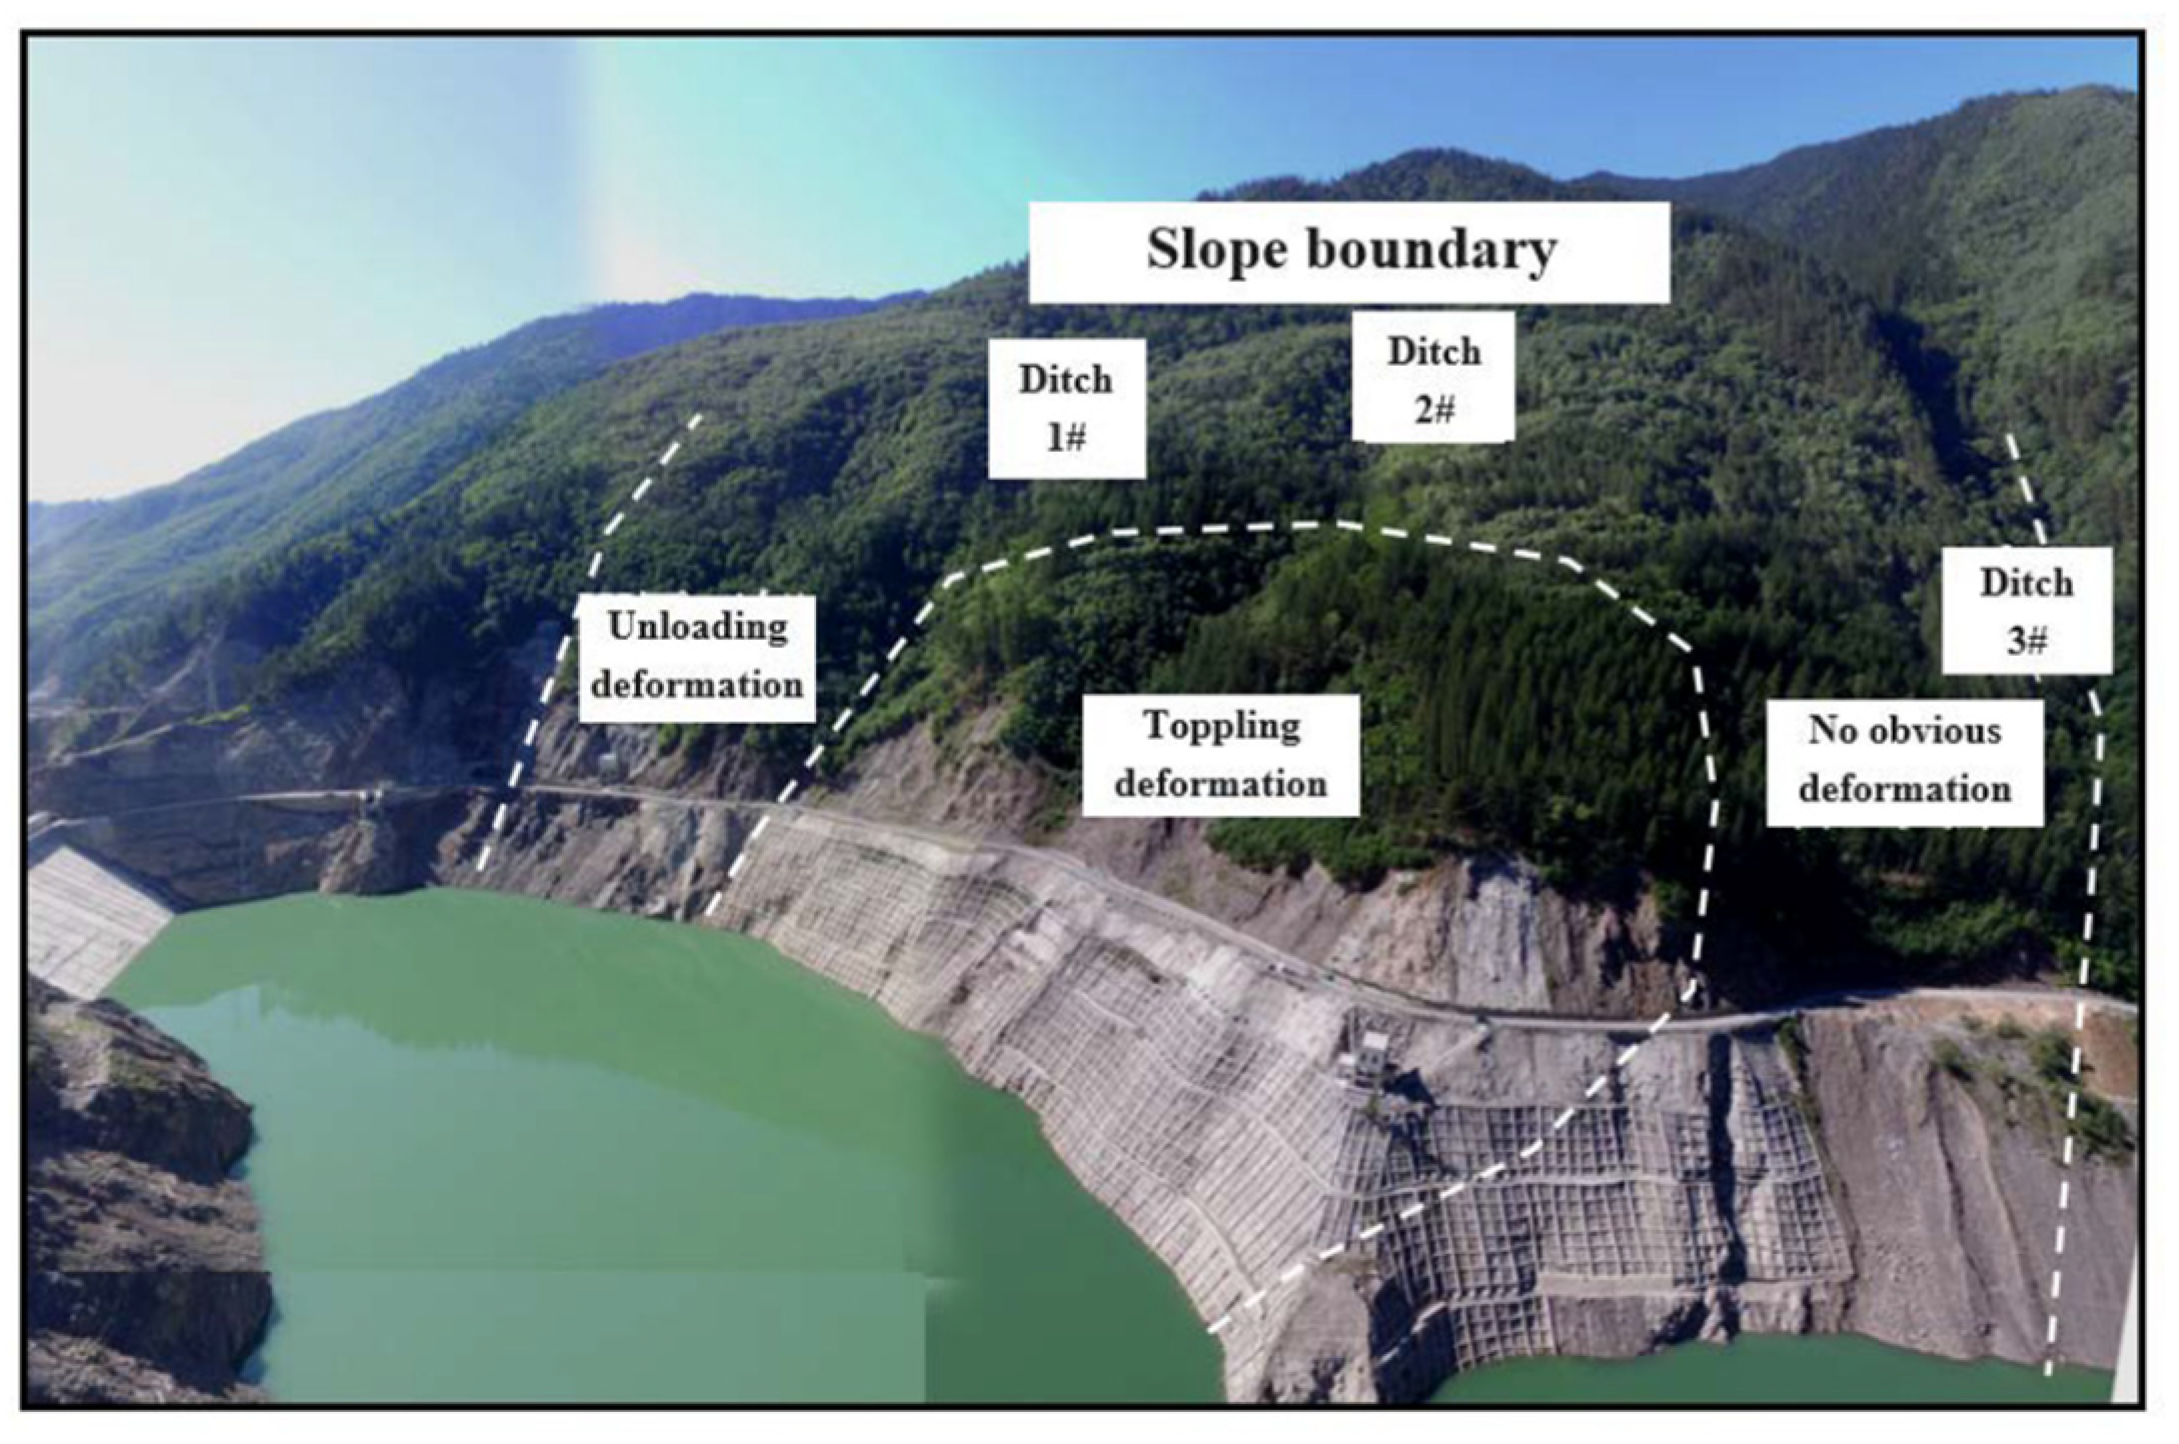
As shown in Figure 3, a toppling bedding slope was developed near the right bank of the dam.
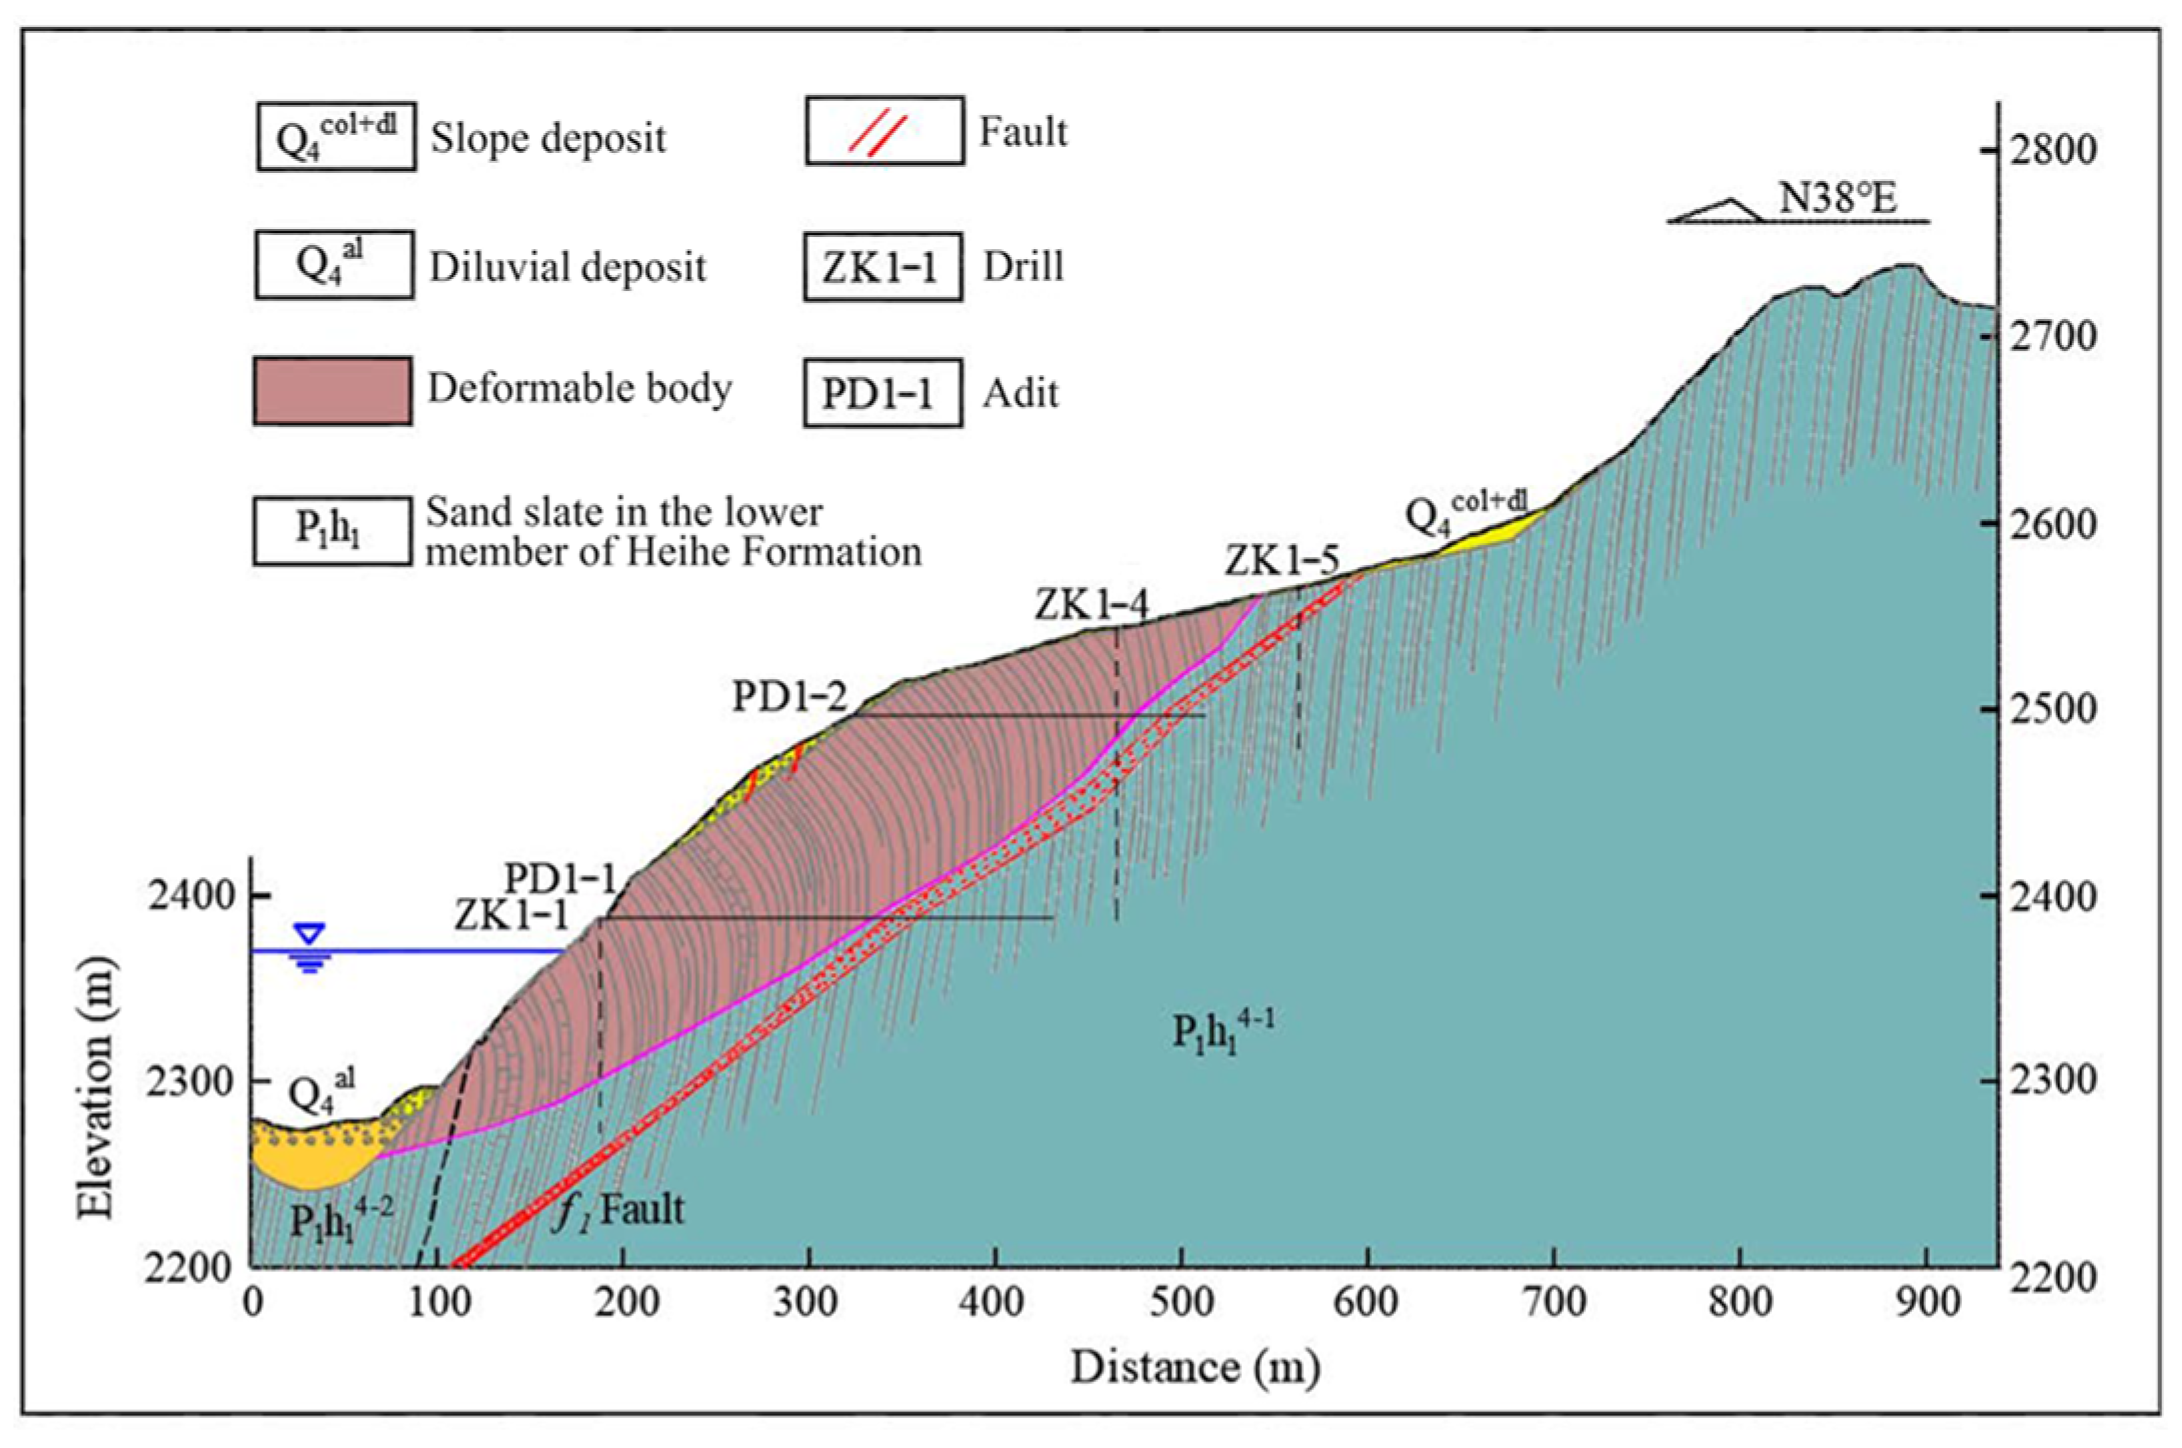
The typical section 1–1’ (Figure 4) reveals that the slope with a width of approximately 420 m upstream along the river, a height of 2580 m at the back edge and 2260 m at the front edge, and a height of approximately 320 m developed toppling deformation at a volume of approximately 7.3 million m3. The rock mass of the slope is composed of thin–medium-thick sandstone. The strike angle between the stratum and the bank slope is 50–70°, and the dip angle is 50–80°. The rock mass structure gradually changes from a stratified–cataclastic structure to a cataclastic–stratified mosaic structure. The right bank is in constant creep deformation.

3.1. Slope Toppling Deformation Characteristics

Seven long cracks had developed in the slope according to the field investigation. Table 1 lists the basic characteristics of the cracks. Most of their shapes are dentation, and a few are wavy; their plane forms vary from straight lines to broken lines to arcs. The crack strike angle is SN–80° NW, and the cracks have a width of 3 × 10⁻³ m–5 × 10⁻¹ m. The bottom settlement formed a platform, and the height of the platform is 1 × 10⁻² m–4 × 10⁻¹ m.
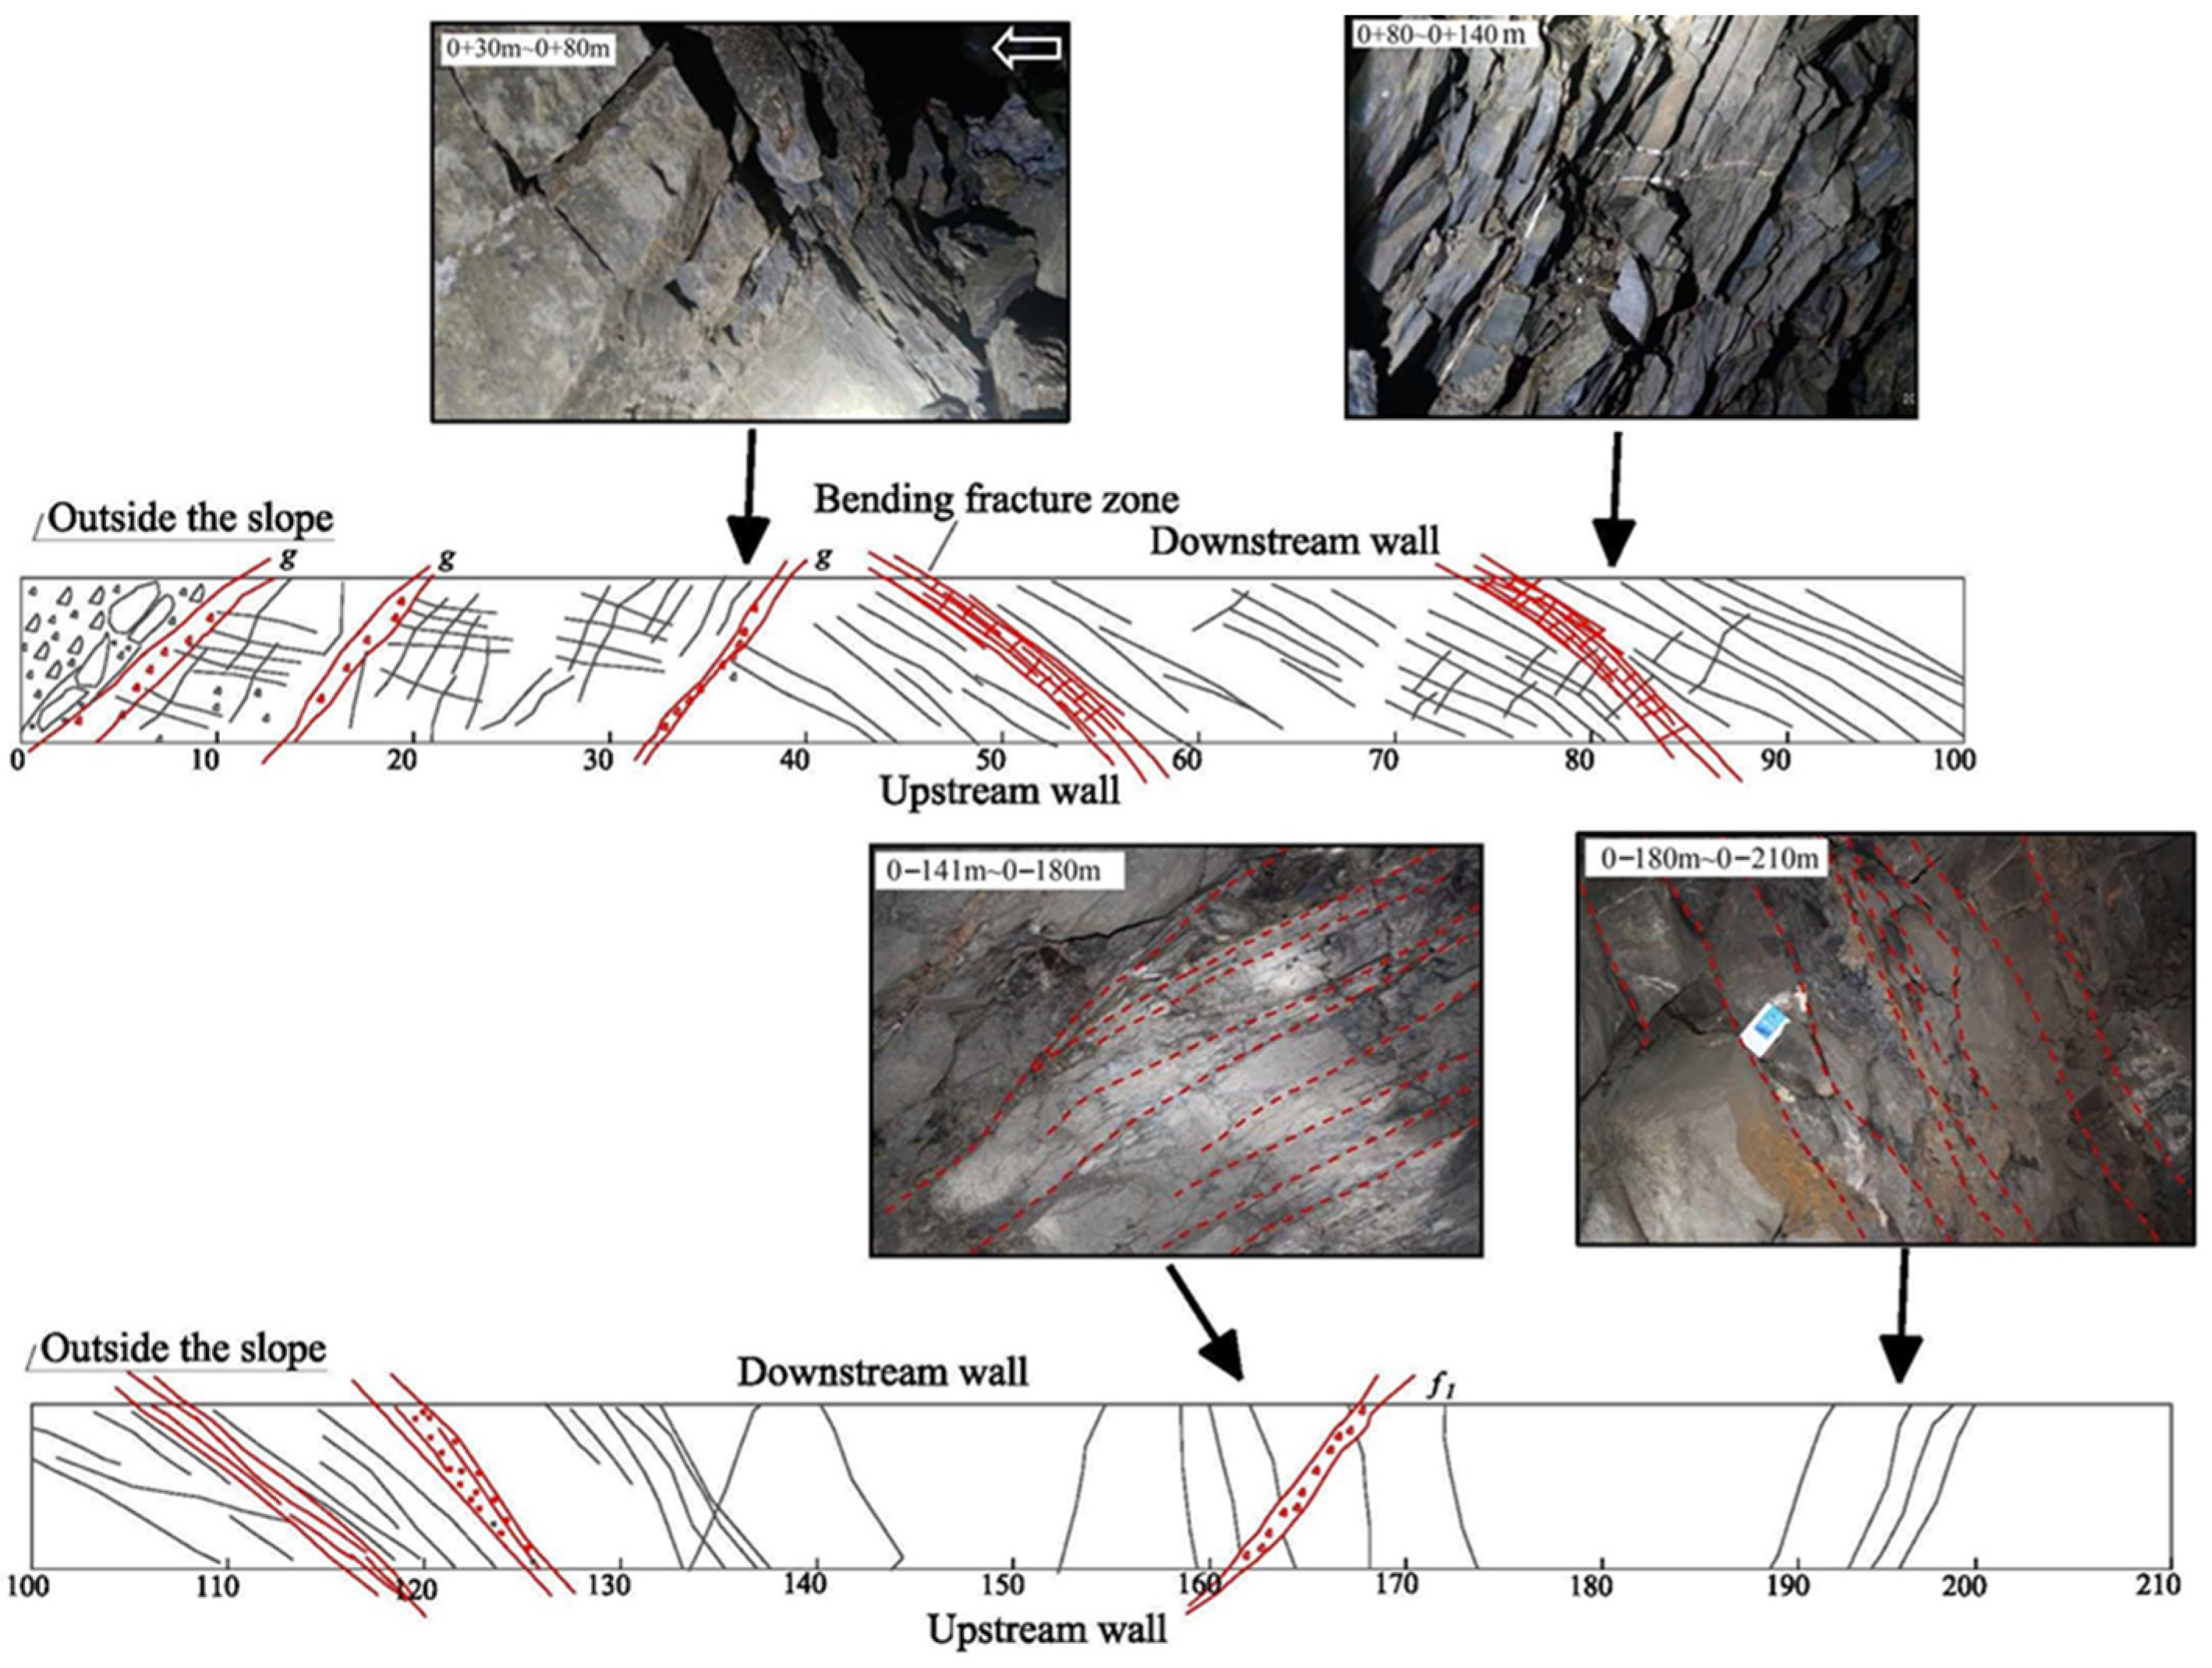
In order to investigate the structure, weathering, unloading and deformation failure characteristics of the rock mass of the slope, and to determine if there is a controlling structural plane or weak zone that affects its stability, we investigated the 1–1 and 1–2 adits.
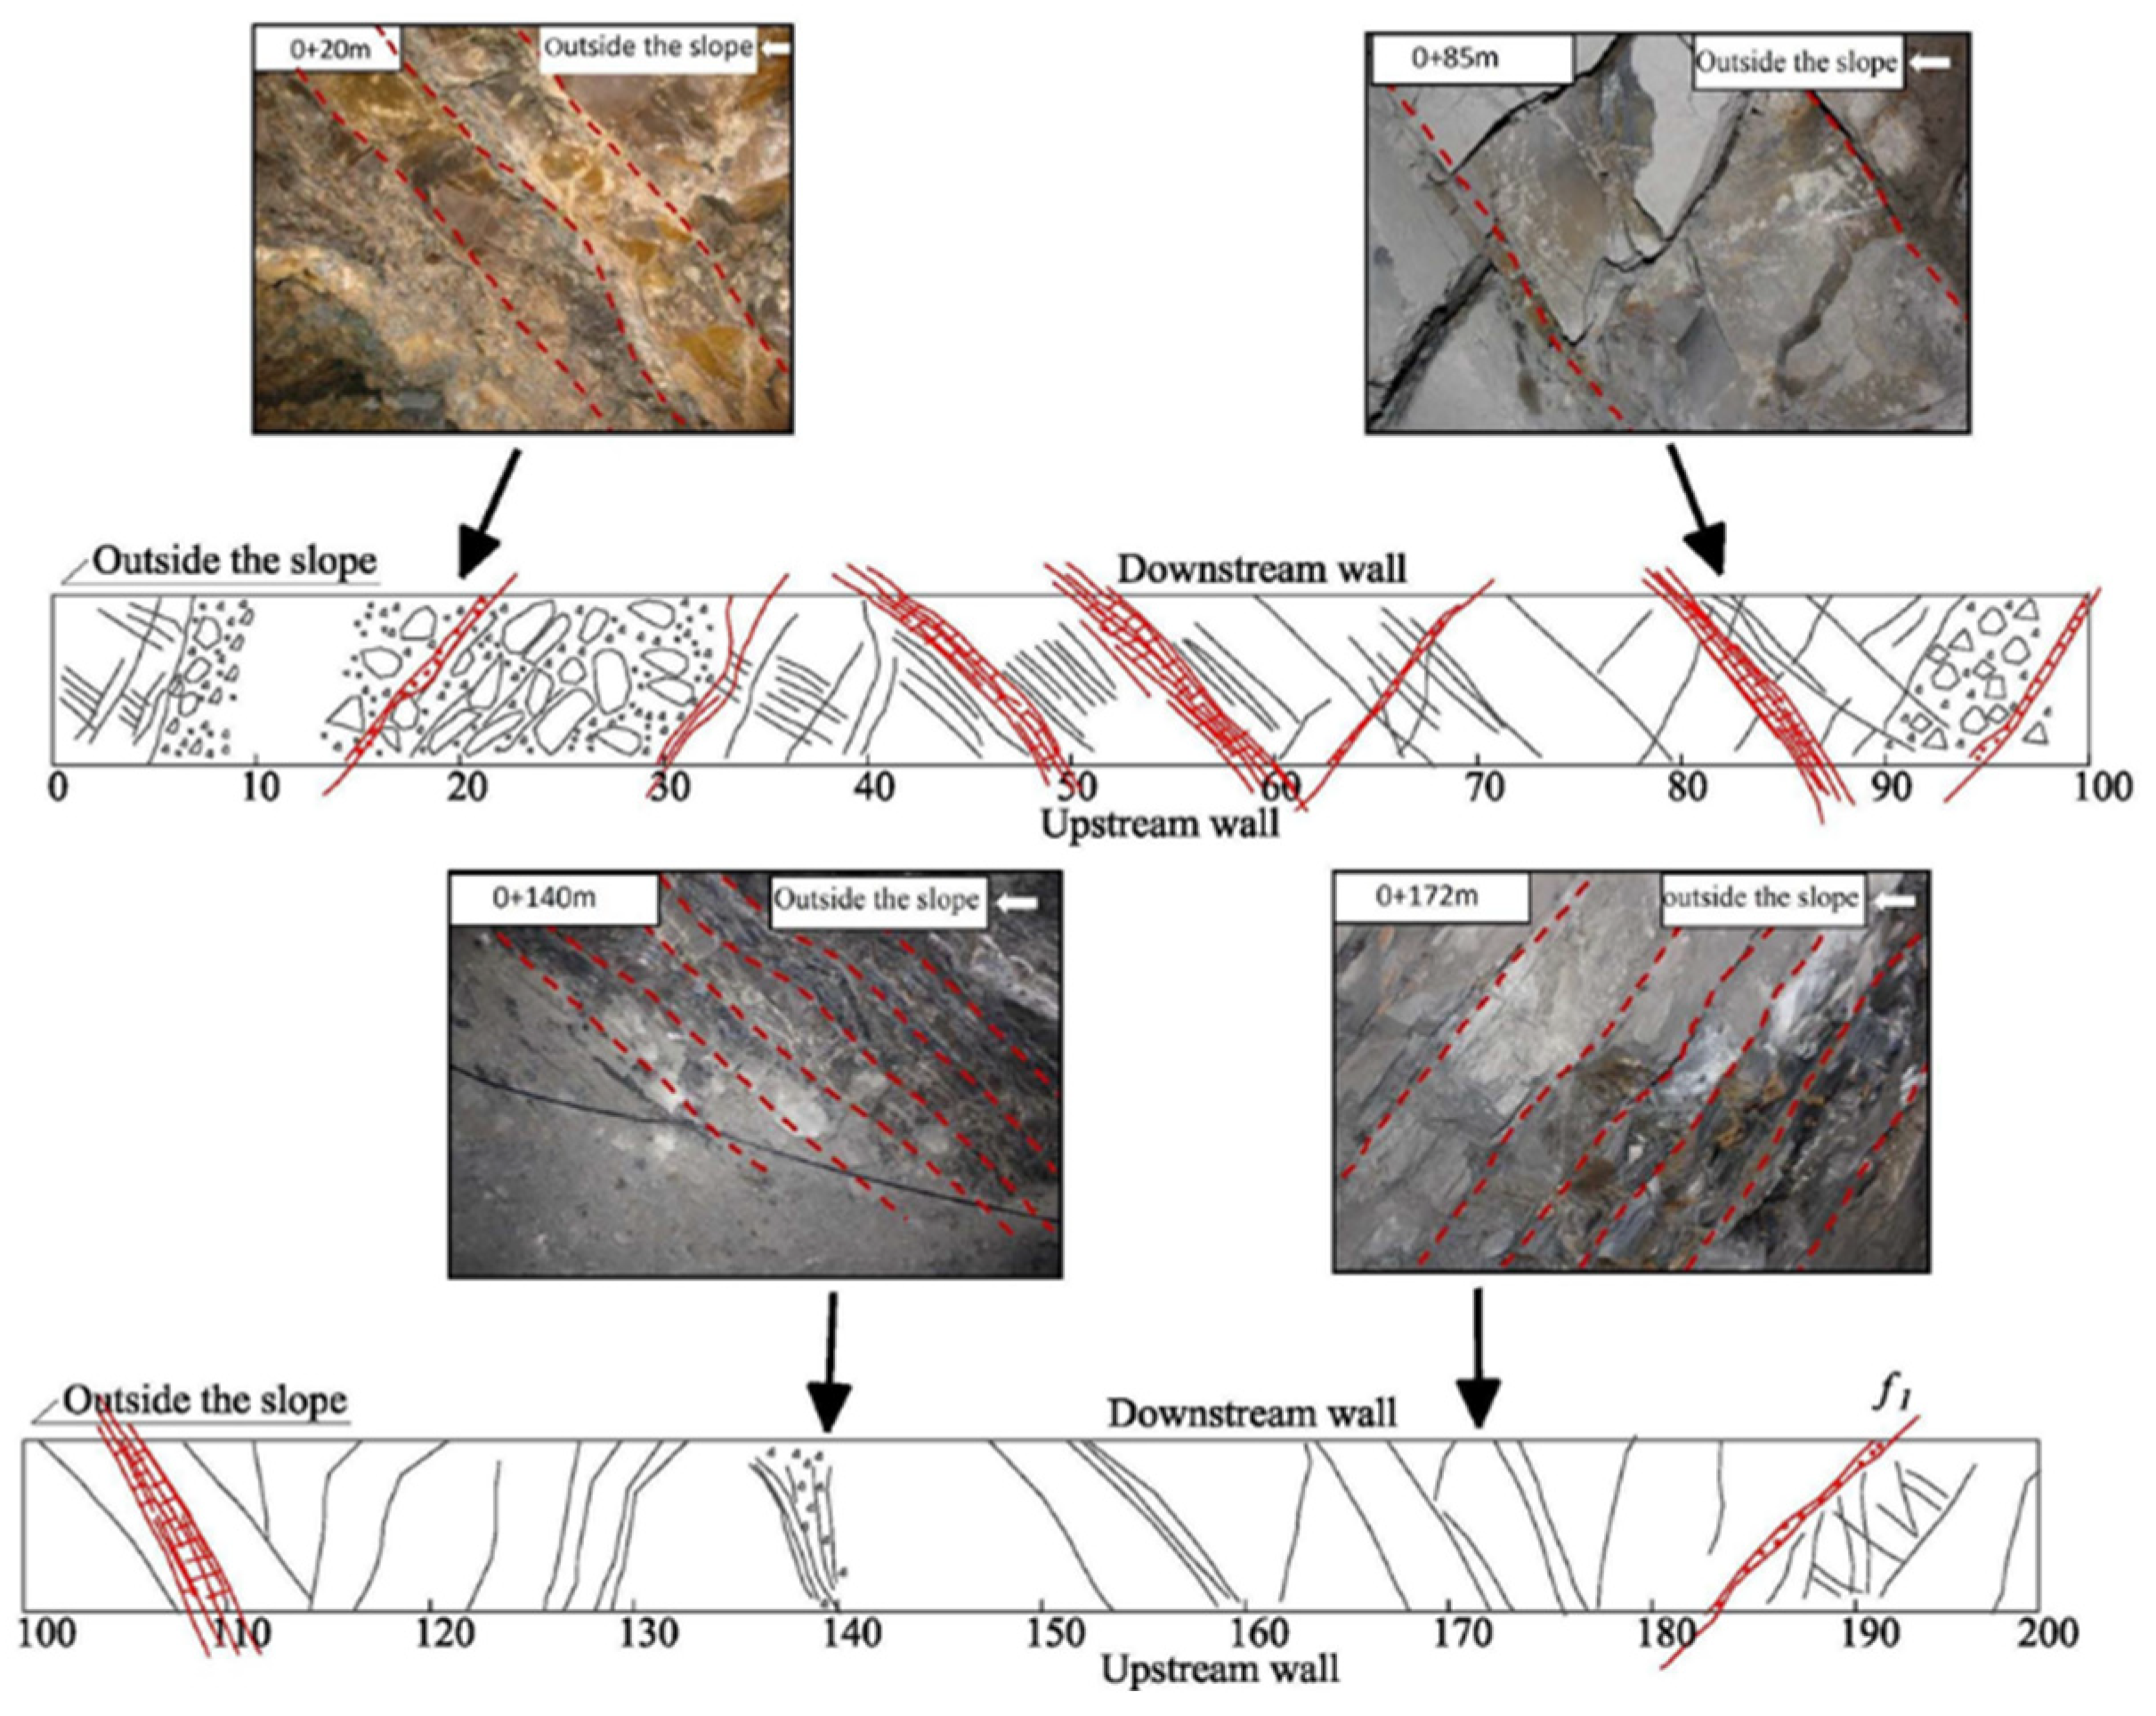
The structural characteristics of the 1–1 adit rock mass are shown in Figure 5. From 0 m to 35 m, the internal rock mass is obviously loose and the unloading fracture and compression zone were also developed. From 35 m to 80 m, the rock mass is mainly cataclastic and the thin-layer rock is broken. From 80 m to 170 m, the rock mass is cataclastic to the thin-layer structure and no continuous tensile cracks or weak interlayers are observed. From 170 m to 200 m, the rock mass has a thin-layer structure with weak weathering and unloading phenomena, and the cave wall is dry.
The structural characteristics of the 1–2 adit rock mass are shown in Figure 6. From 0 m to 30 m, the rock mass is mainly cataclastic, with strong tensile fracture, slack disintegration and an obvious overhead phenomenon. From 30 m to 80 m, the dip angle generally changes from a gentle dip to a moderate dip, and strong tensile deformation occurs. From 80 m to 141 m, the rock mass has a stratified–cataclastic structure, the dip angle generally changes from moderate to steep and the crushing phenomenon of the rock blocks can be seen locally. From 141 m to 180 m, the rock mass is sandstone with a small amount of slate with a thin-layer cataclastic structure.

3.2. Slope Toppling Deformation Zoning

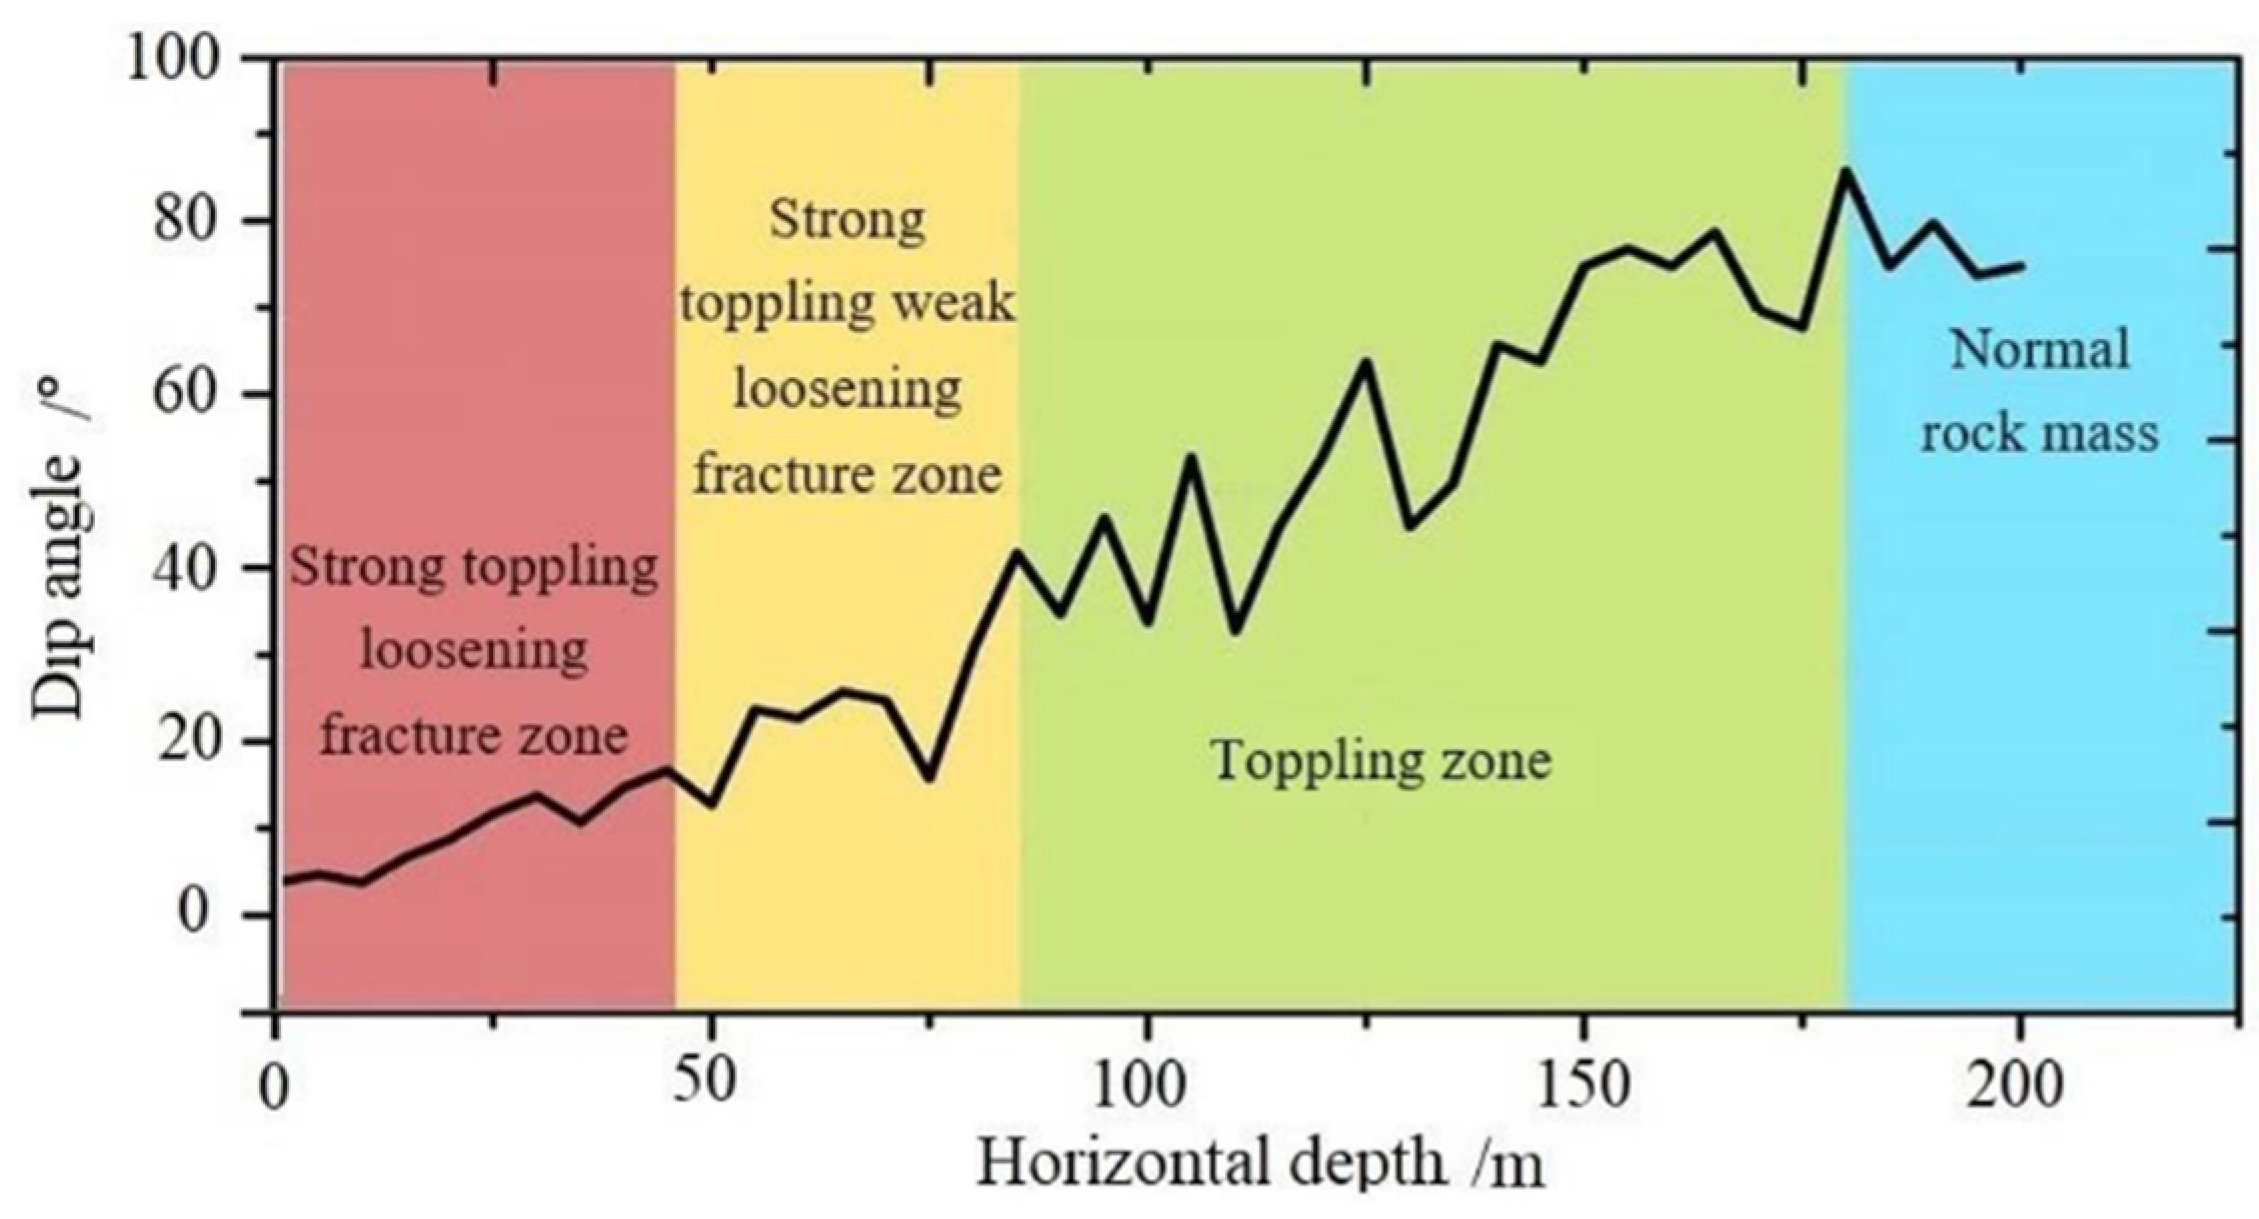
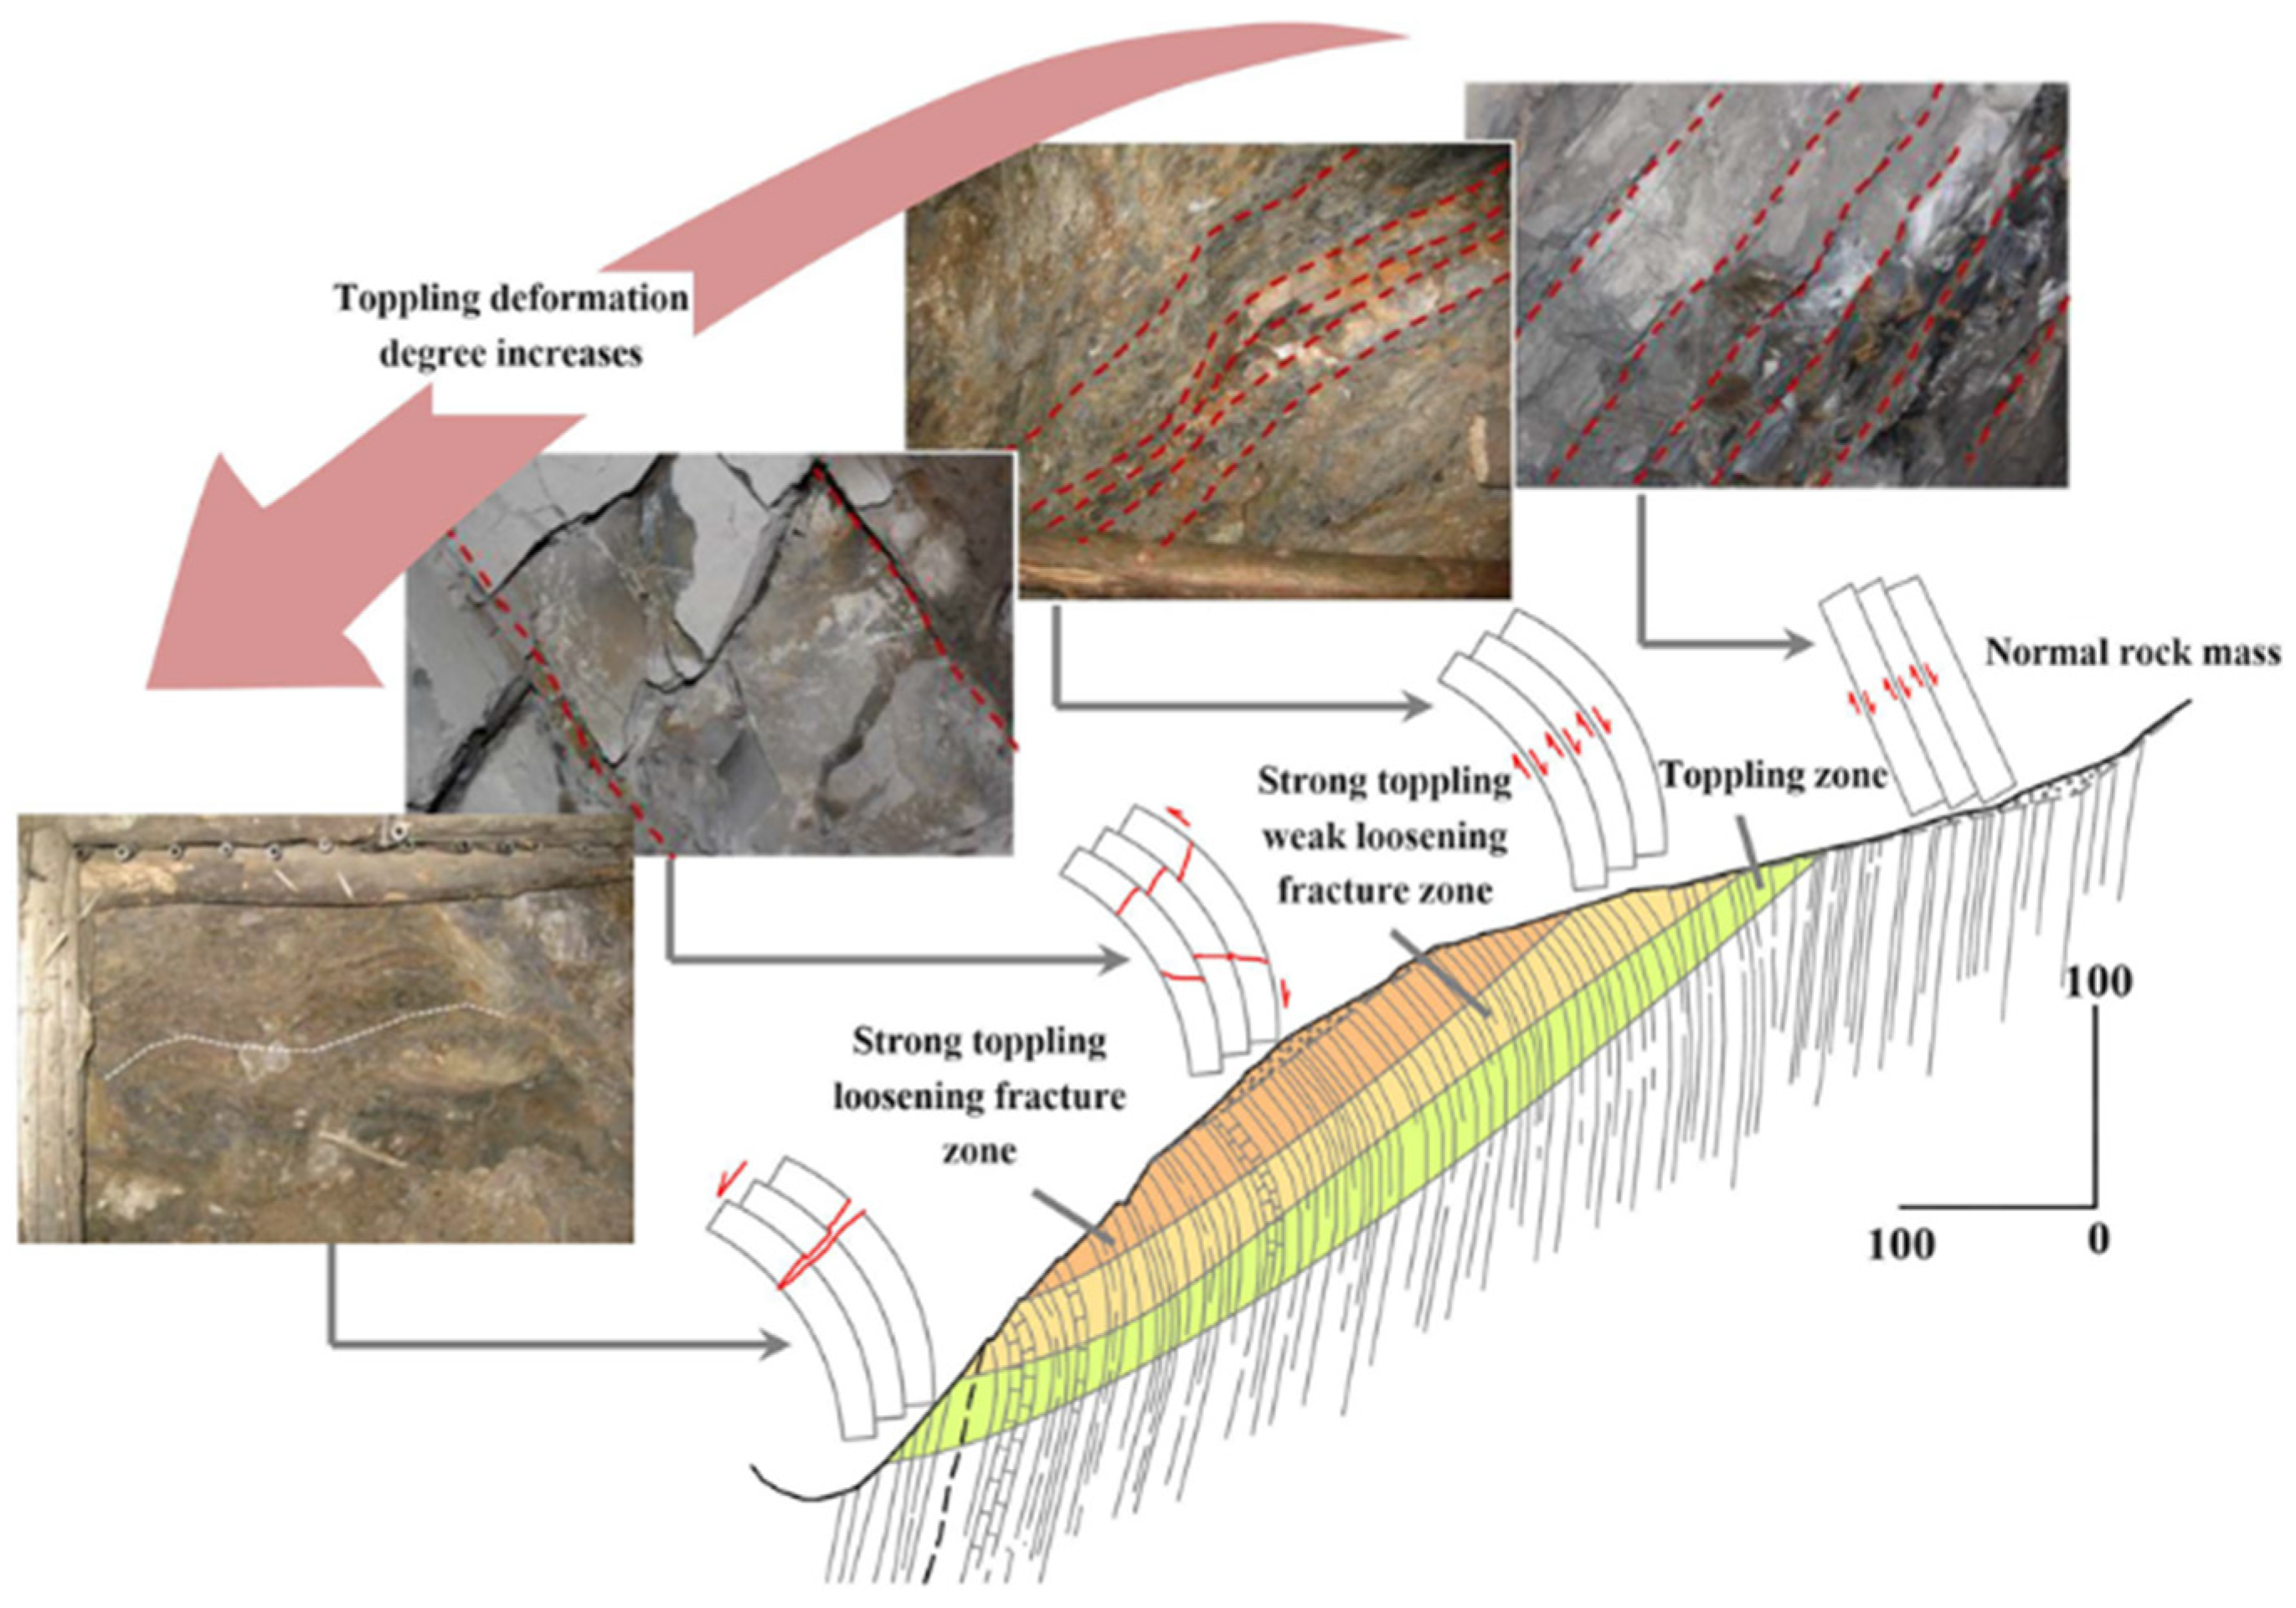
As shown in Figure 7, with the increase in the dip angle of the rock stratum, the deformation is intensified. The degree of the slope rock mass toppling deformation is categorized into “strong toppling–loosening fracture zone”, “strong toppling–weak loosening fracture zone” and “toppling zone” in Figure 8. Through comparative analyses of the rock mass occurrence, weathering, unloading, structural characteristics and signs of toppling deformation, we grasped the distinct deformation and failure characteristics associated with each toppling deformation zone.

3.3. Slope Engineering Geological Zoning

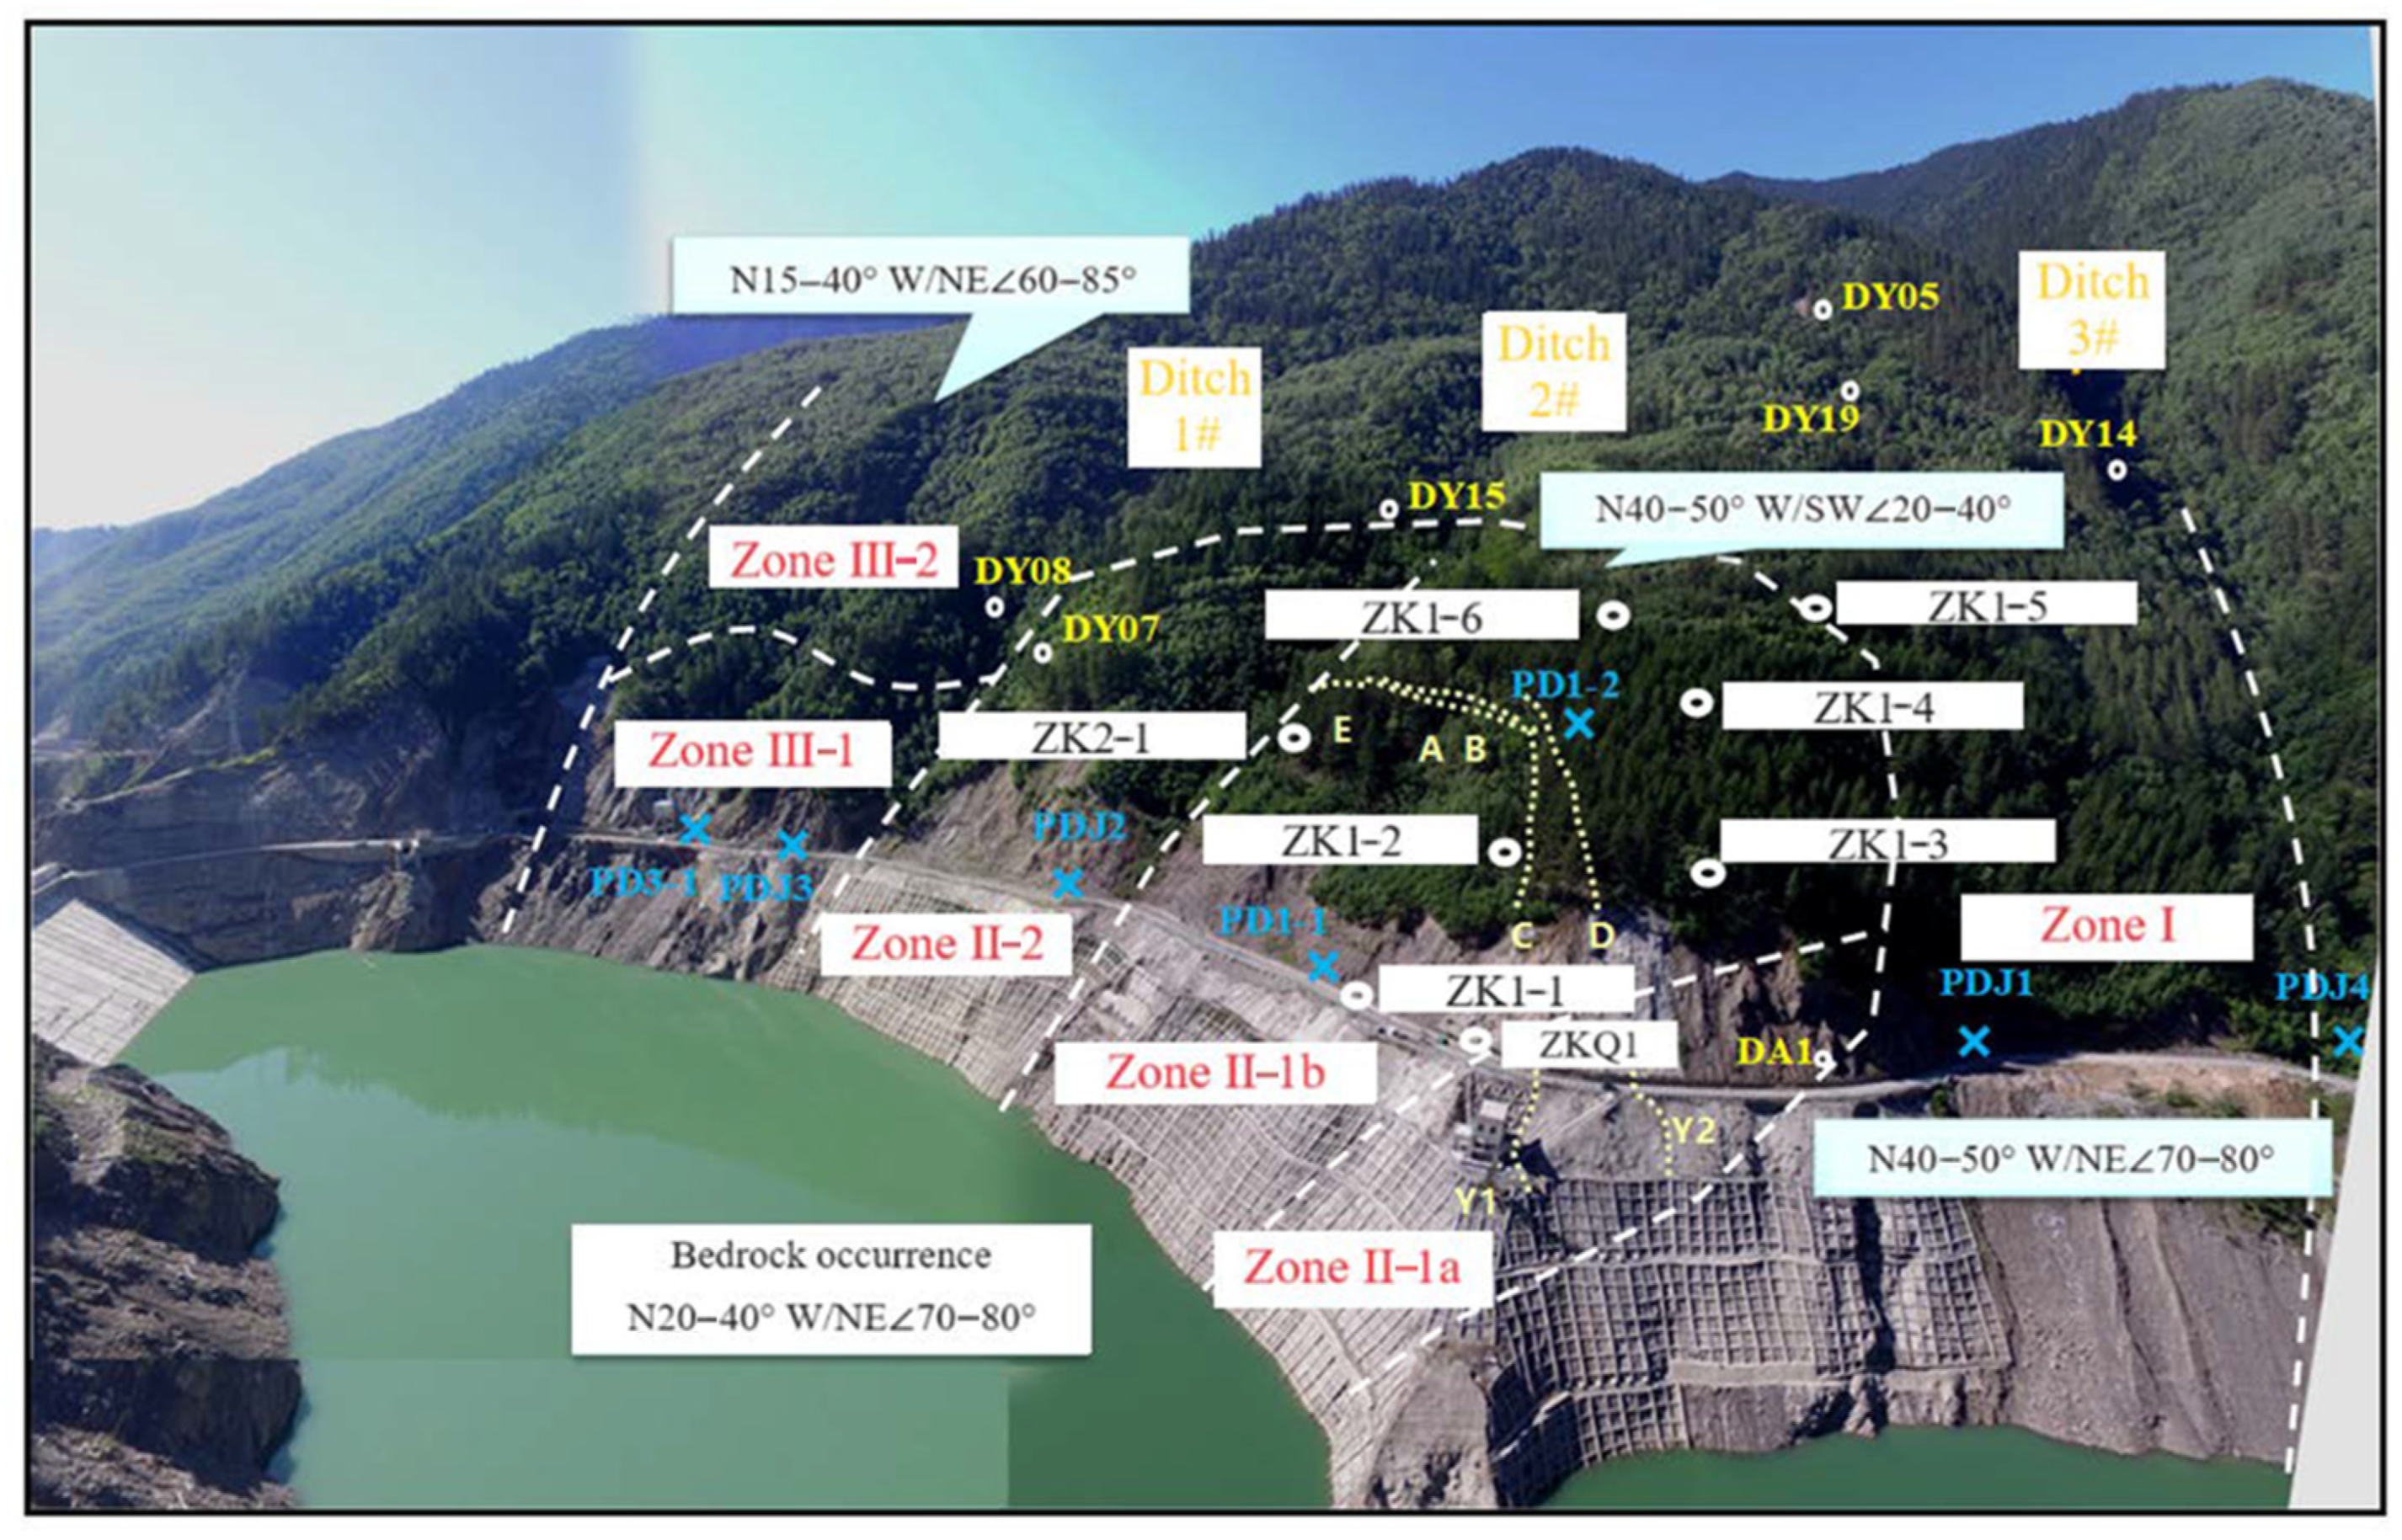
Based on the characteristics of the slope structure, the slope near the right bank of the dam is divided into three areas, as shown in Figure 9.
Zone I is a stratified transverse slope, located from the upper ridge to the No. 3 ditch, and is 200 m long along the rerouted road. Its lithology is mainly sandstone and slate with phyllite, and no deformation signs were observed. Zone II is a stratified dip slope, which can be divided into zone II–1 and zone II–2. The upstream area of zone II–1 is bounded by the topping fracture line, and the downstream boundary is the No. 2 ditch. The length is approximately 300 m, and the lithology is mainly composed of sandstone and slate with phyllite. Zone II–2 is located between the No. 1 ditch and No. 2 ditch, the length is about 200 m, the upper elevation is about 2560 m and the relative height difference is approximately 300 m. The rock mass generally has a cataclastic structure. Zone III is a stratified transverse slope, bounded by the upstream of the No. 1 ditch and extending downstream to the entrance of the rerouted highway tunnel. Its length along the river is approximately 220 m. The lithology is thick sandstone and a small amount of phyllite. The occurrence of rock strata is 15–40° NW ∠60–85° NE, and the intersection angle with the slope is 55–80°. There were no obvious signs of slope deformation above the highway.

4. Deformation Monitoring

4.1. Monitoring Point Arrangement

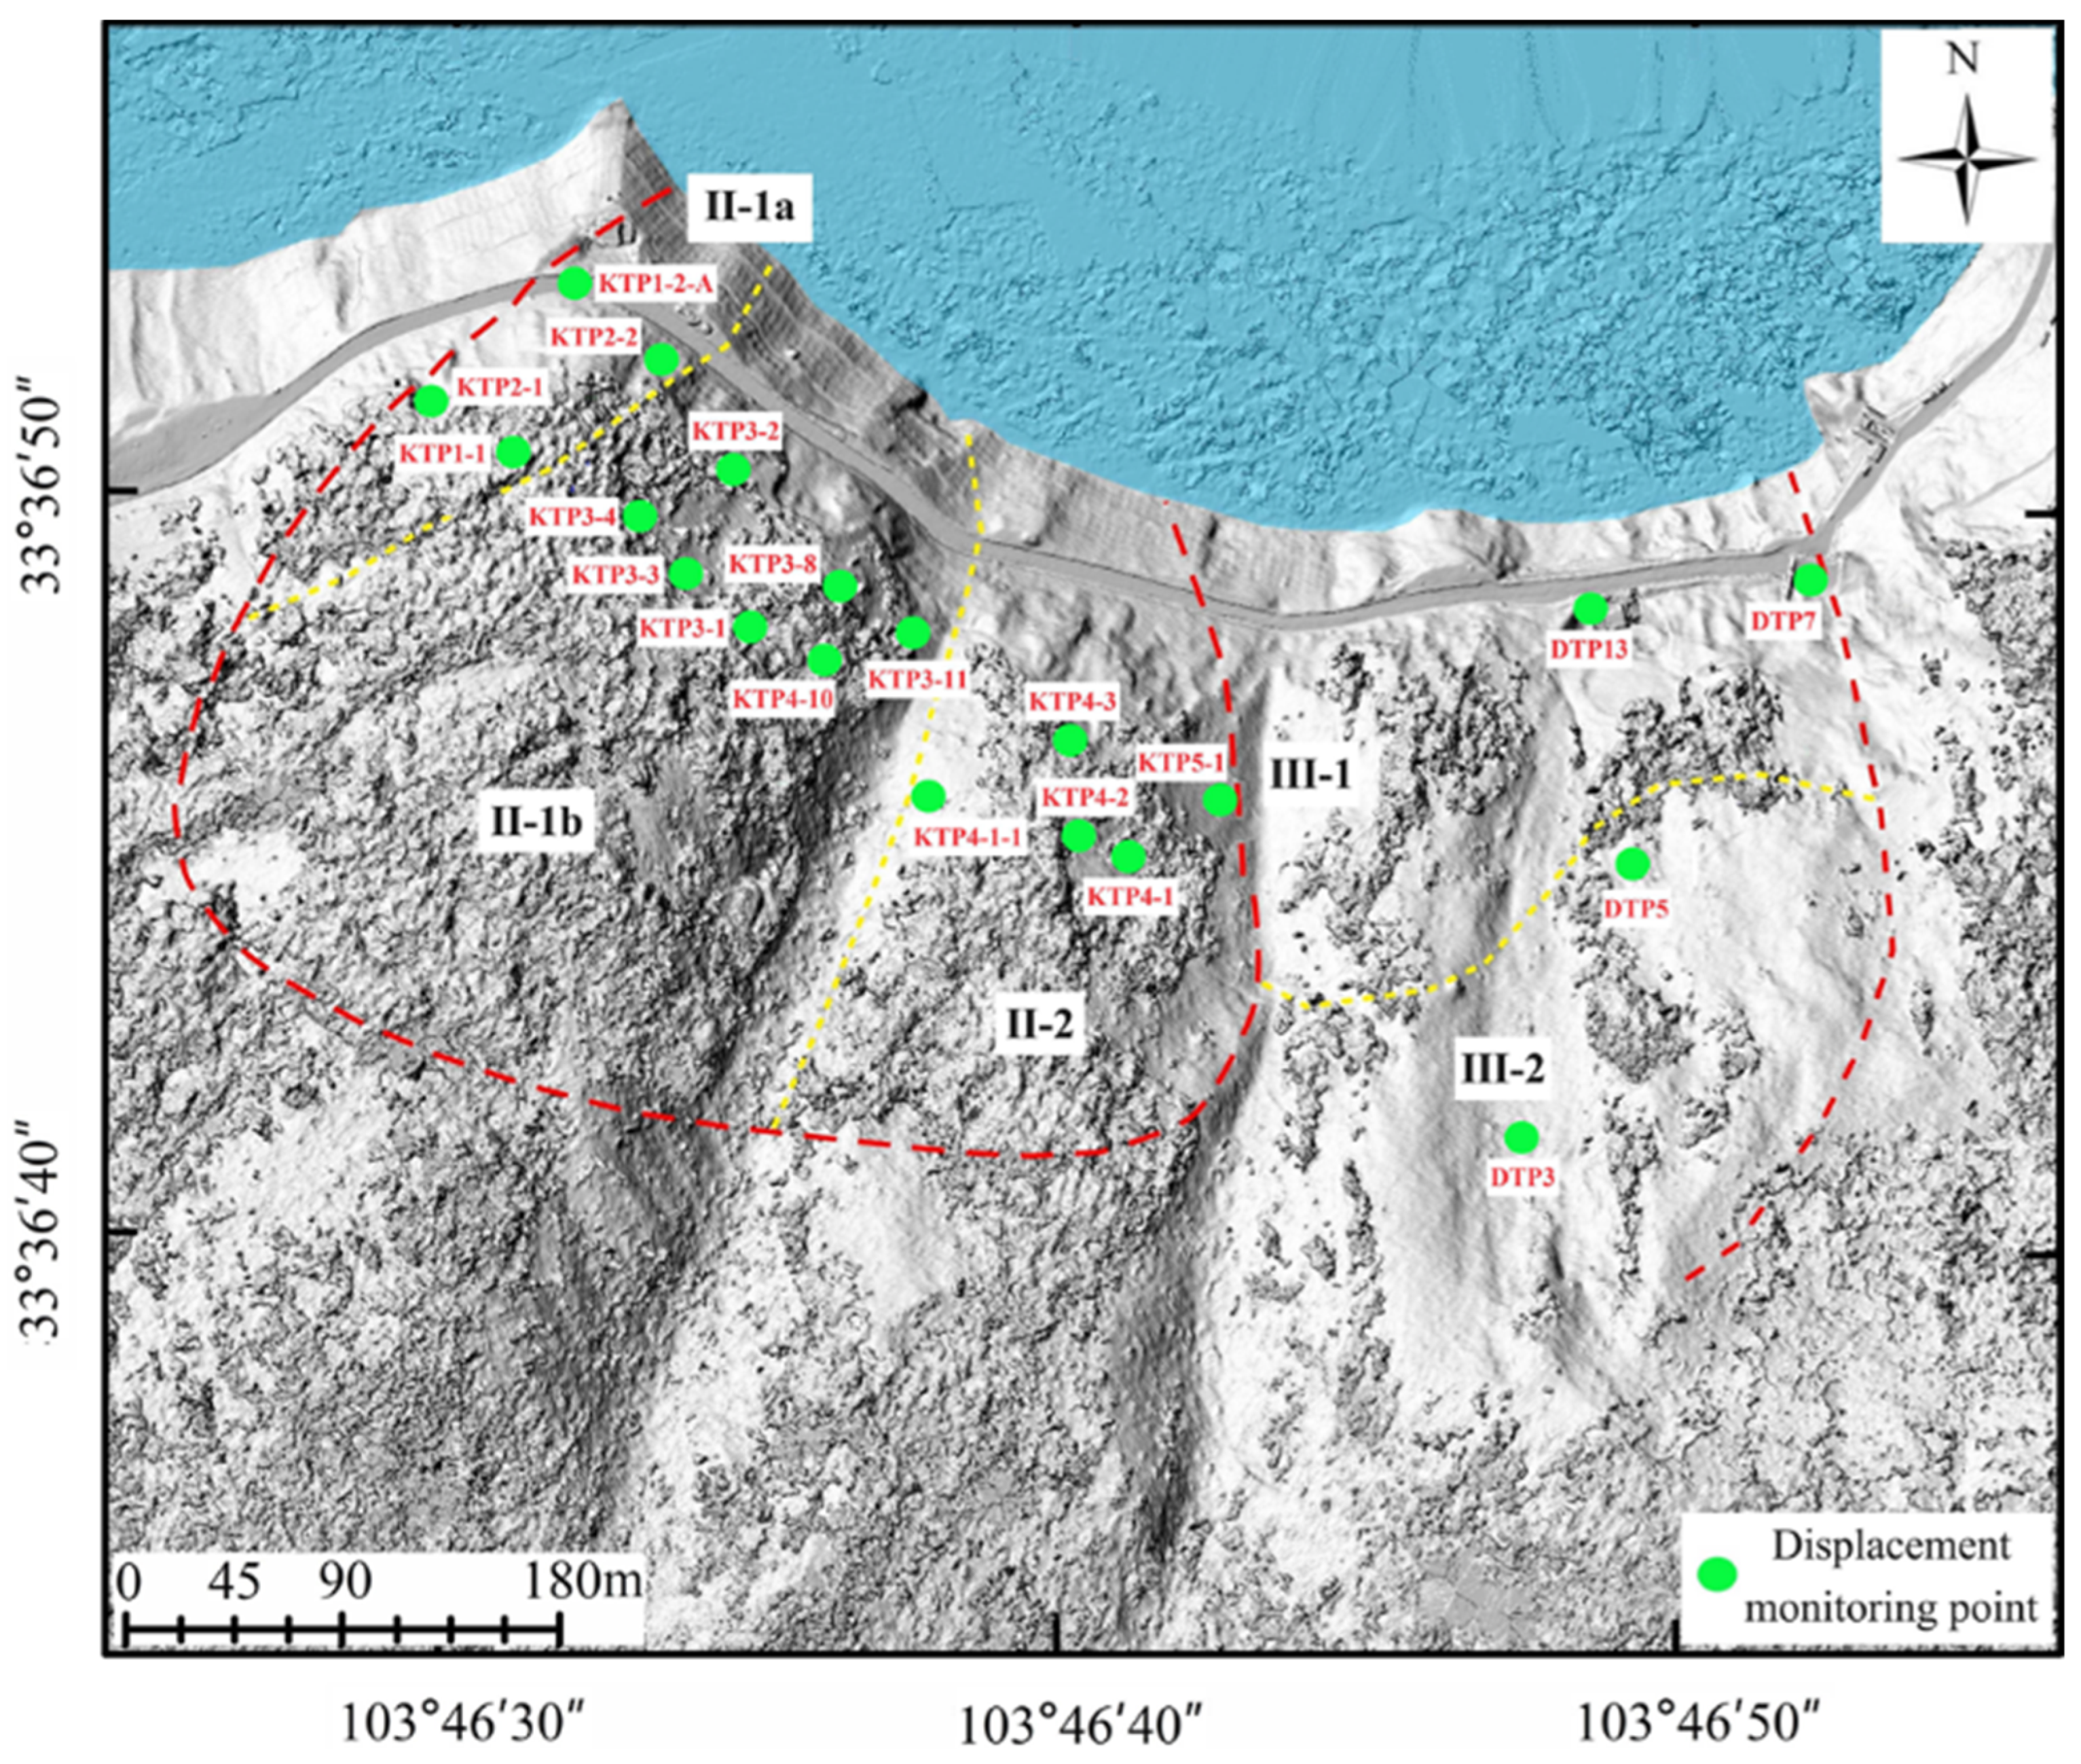
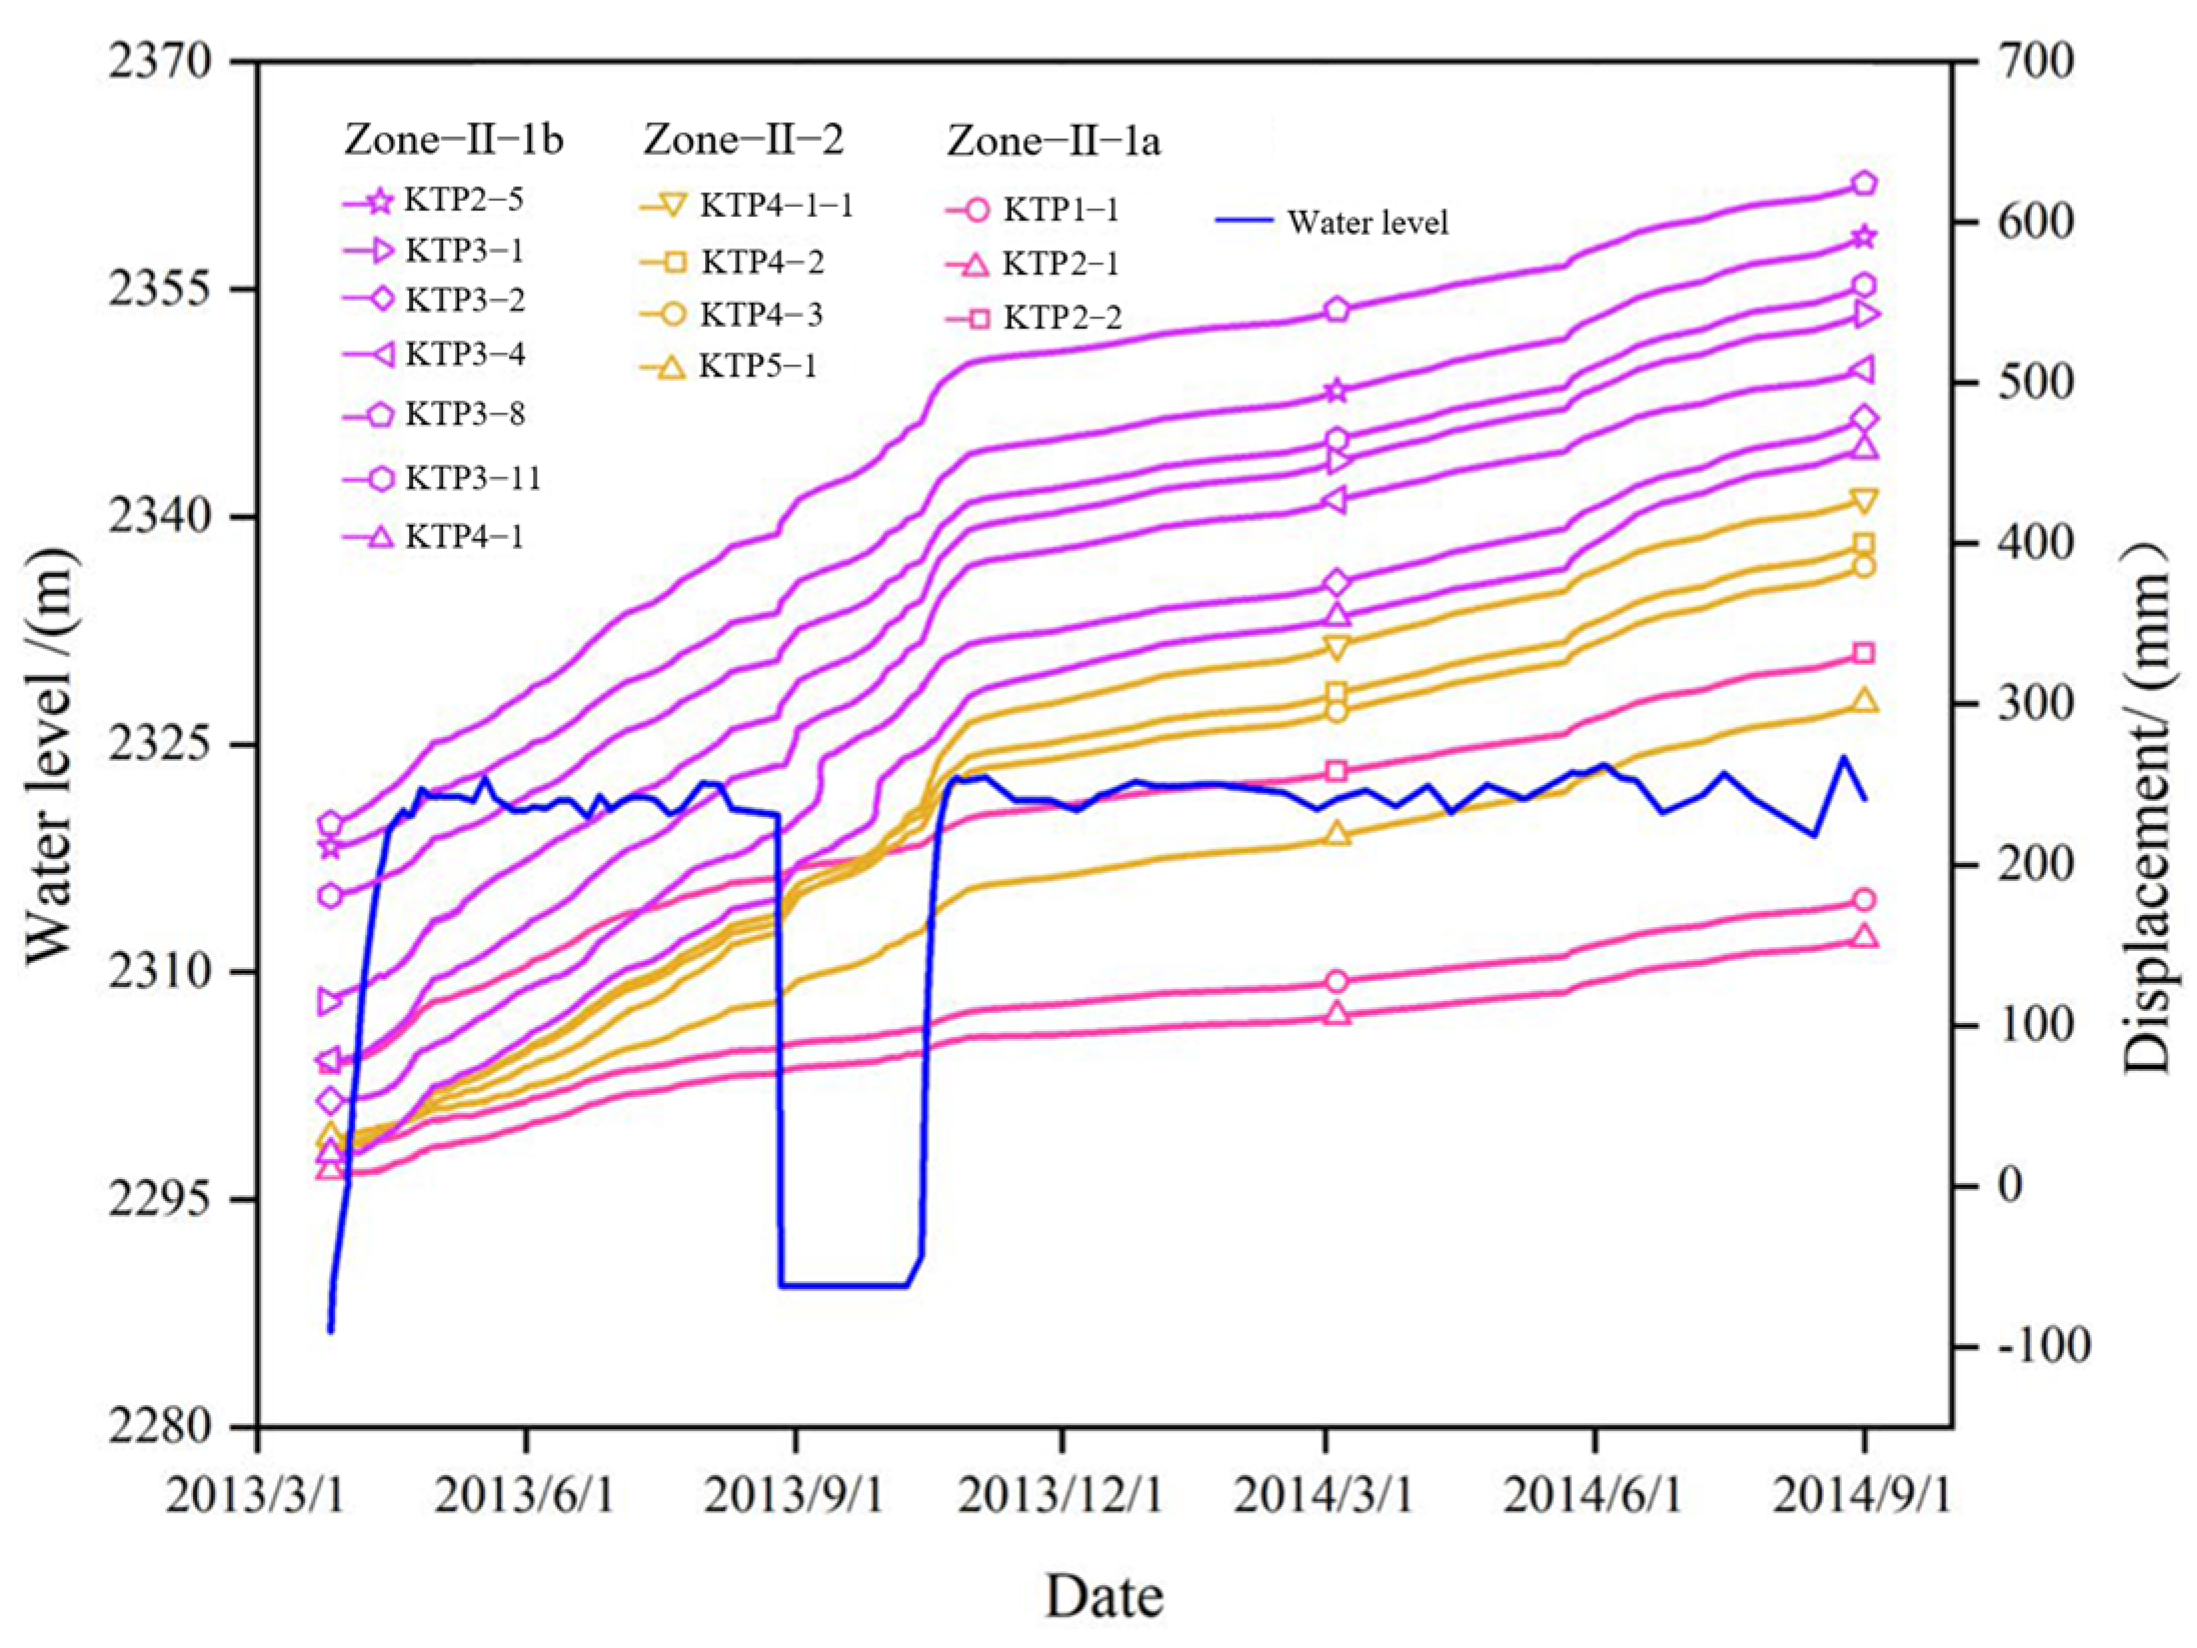
Previous studies have highlighted the importance of monitoring and understanding the impact of changes in reservoir water levels on the stability of reservoir bank landslides [22,25,26]. To monitor the slope deformation, surface displacement monitoring points were assessed on the slope, as shown in Figure 10. The slope experienced reservoir filling and the Jiuzhaigou earthquake, and based on the timeline of these occurrences, the monitoring duration could be divided into two stages. The first stage was from April 2013 to September 2014 and the second stage was from September 2014 to November 2021.

4.2. Monitoring Result Analyses

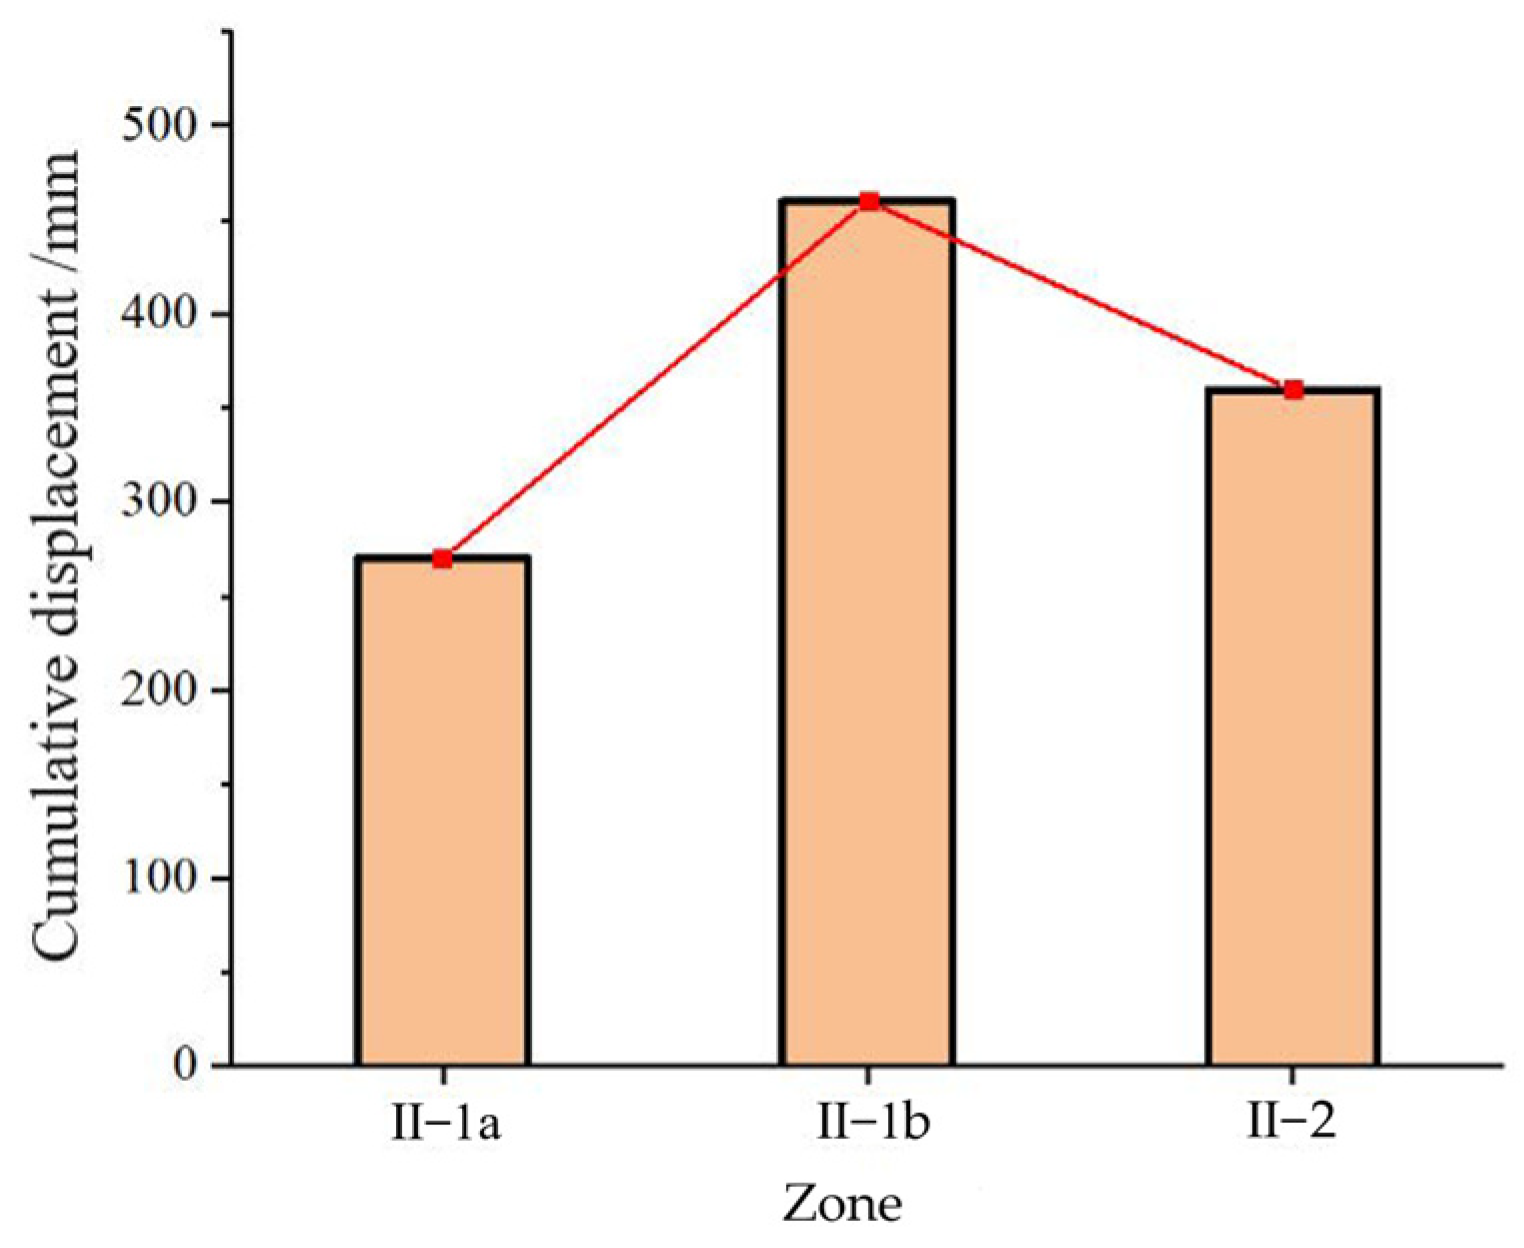
Slope deformation mainly exists in zone II. As shown in Figure 11, at the first stage, zone II-1a was less affected by the water level variation, the deformation degree was relatively slow and the maximum deformation was 183 mm. The deformation response of zone II-1b under the action of the water level variation was more significant, and the maximum deformation was 444 mm. The structural plane of the rock mass in zone II-2 was relatively developed. By September 2014, the maximum deformation was 634 mm and the average value of the deformation increase in each zone was as follows: zone II–1b > zone II–2 > zone II–1a (Figure 12). According to the deformation rate (Figure 13), when the reservoir water level rose, the overall deformation rate of the slope accelerated. In addition, there was a period where the reservoir water level decreased and the deformation rate increased again, and the displacement rate of zone II–1b reached 15 mm/day. Evidently, slope deformation has a certain response to the water level variation. From 24 to 26 August 2013, when the reservoir water level suddenly decreased, the overall slope deformation rate increased. Therefore, the decrease in the water level has a greater impact on the slope deformation, which is in accord with the previous studies [16,17,18,19,20,21,28].
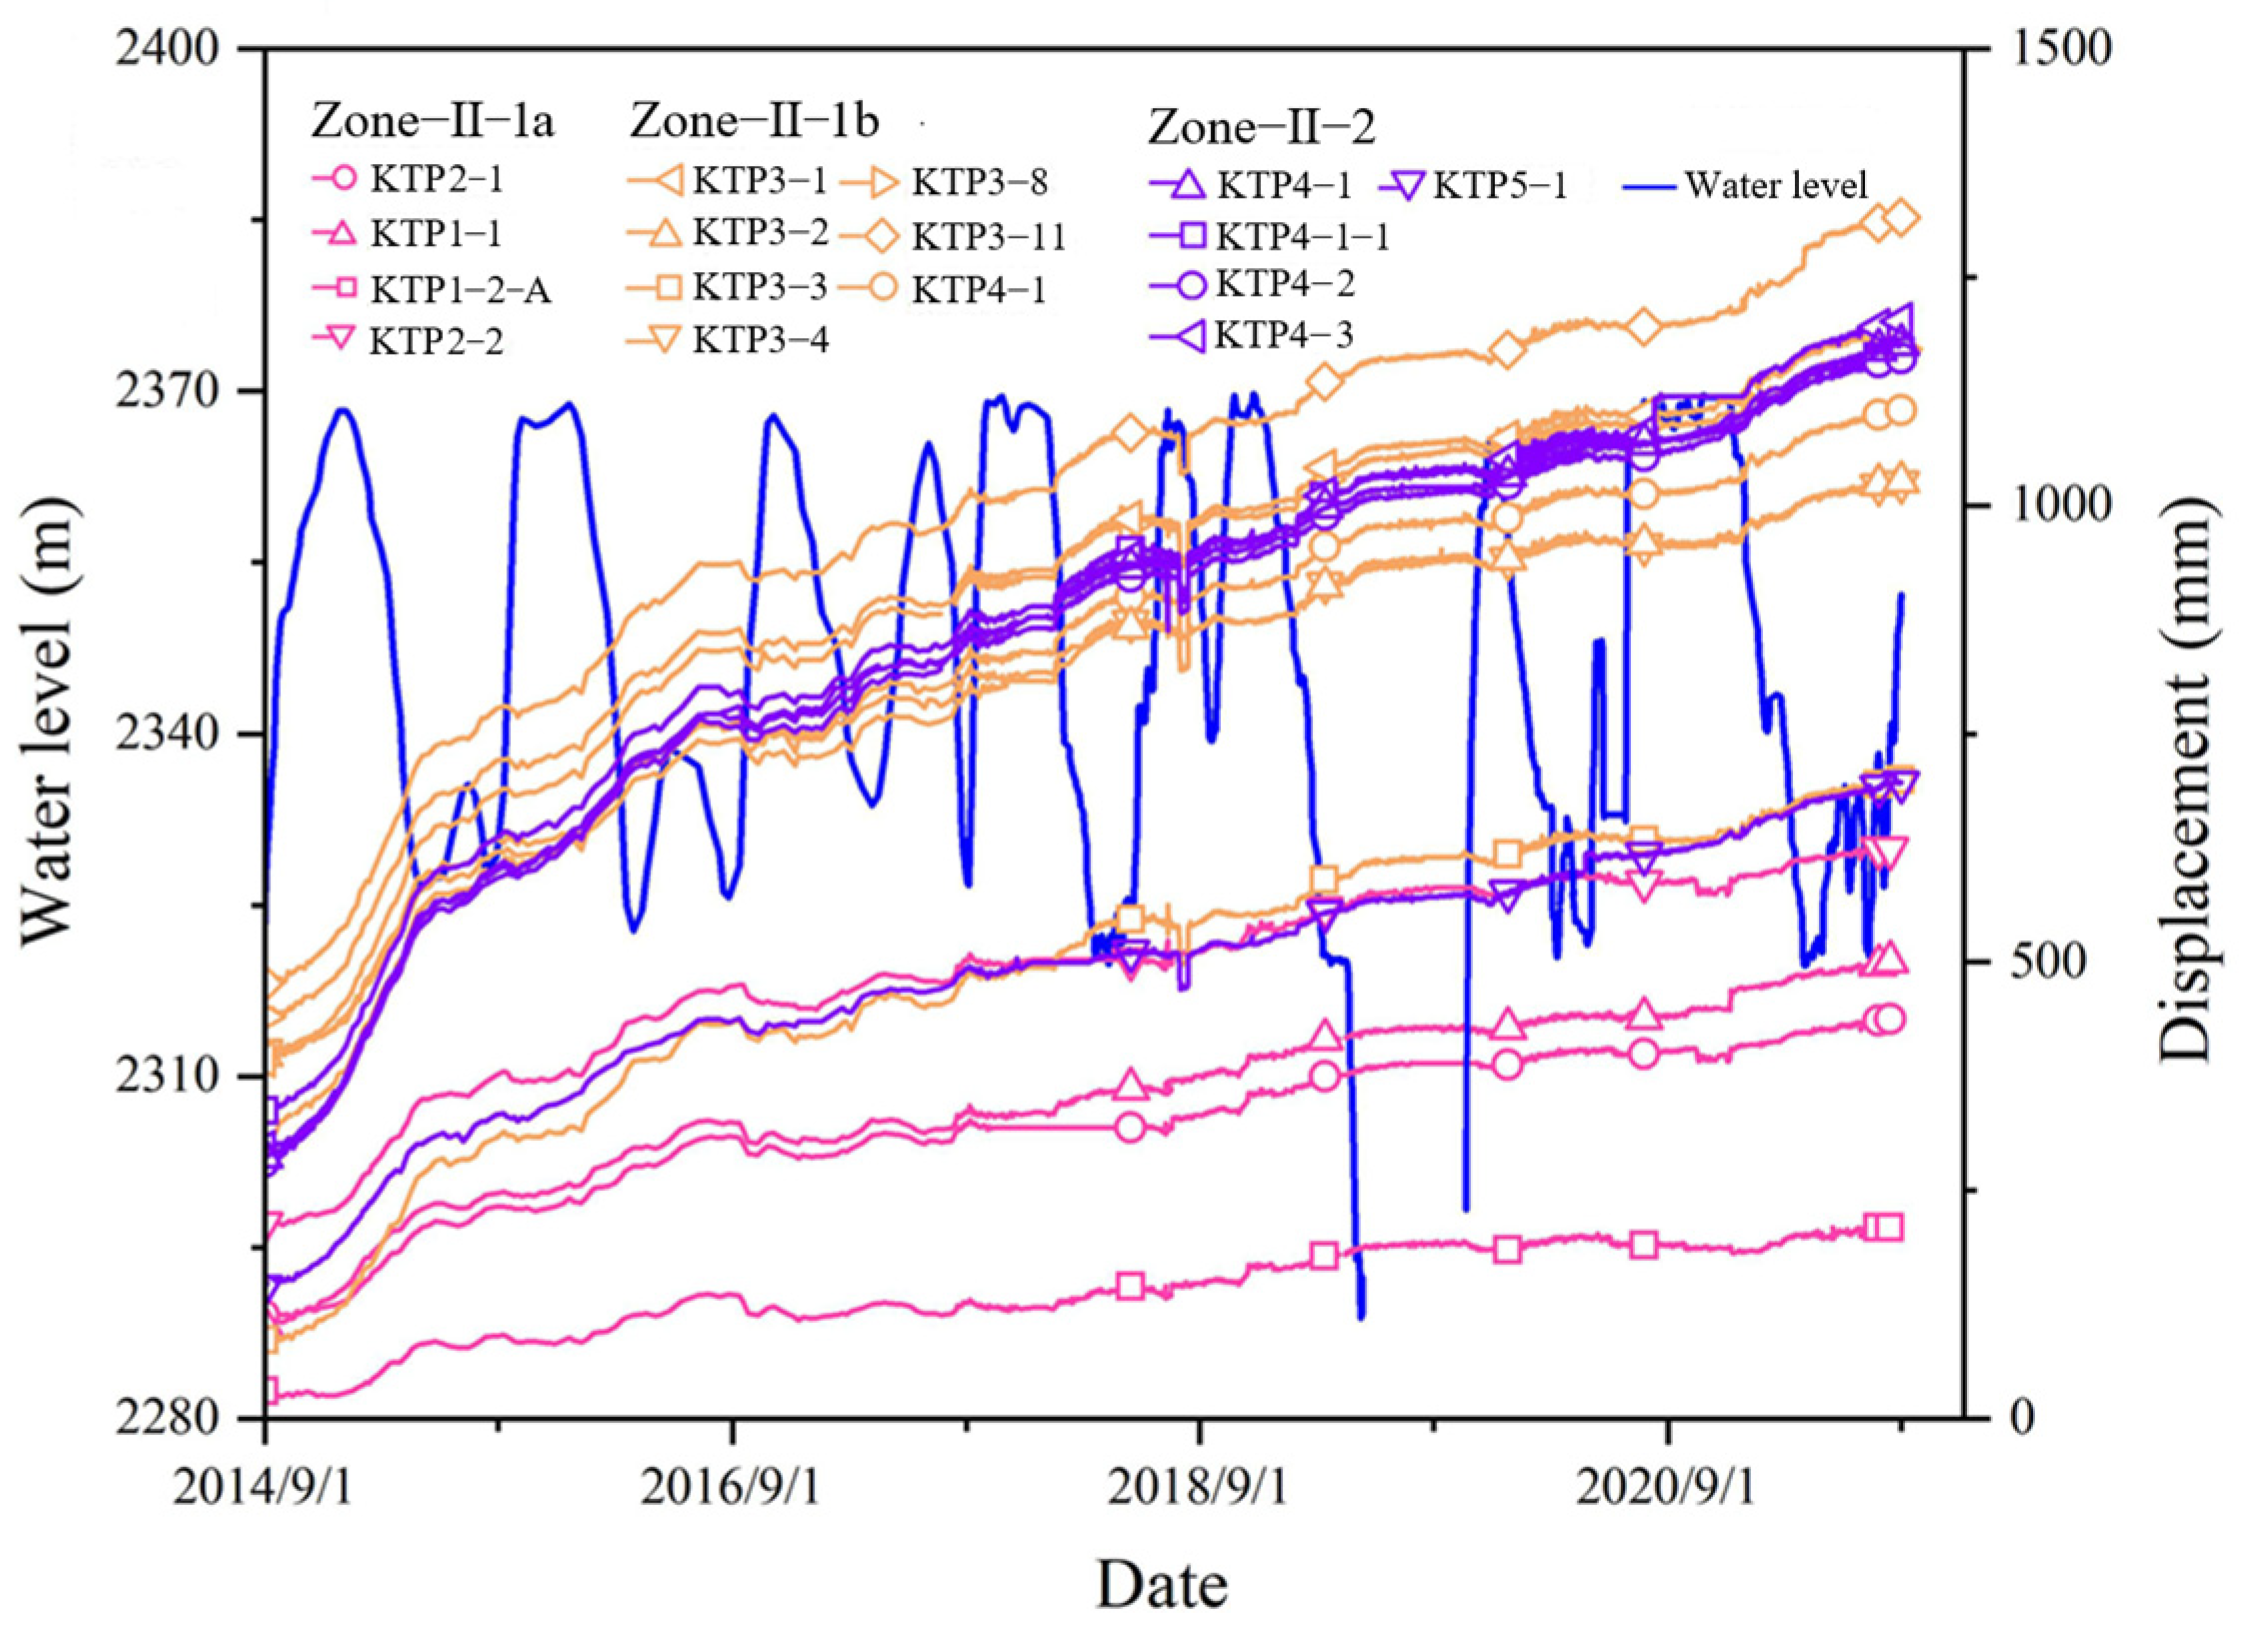
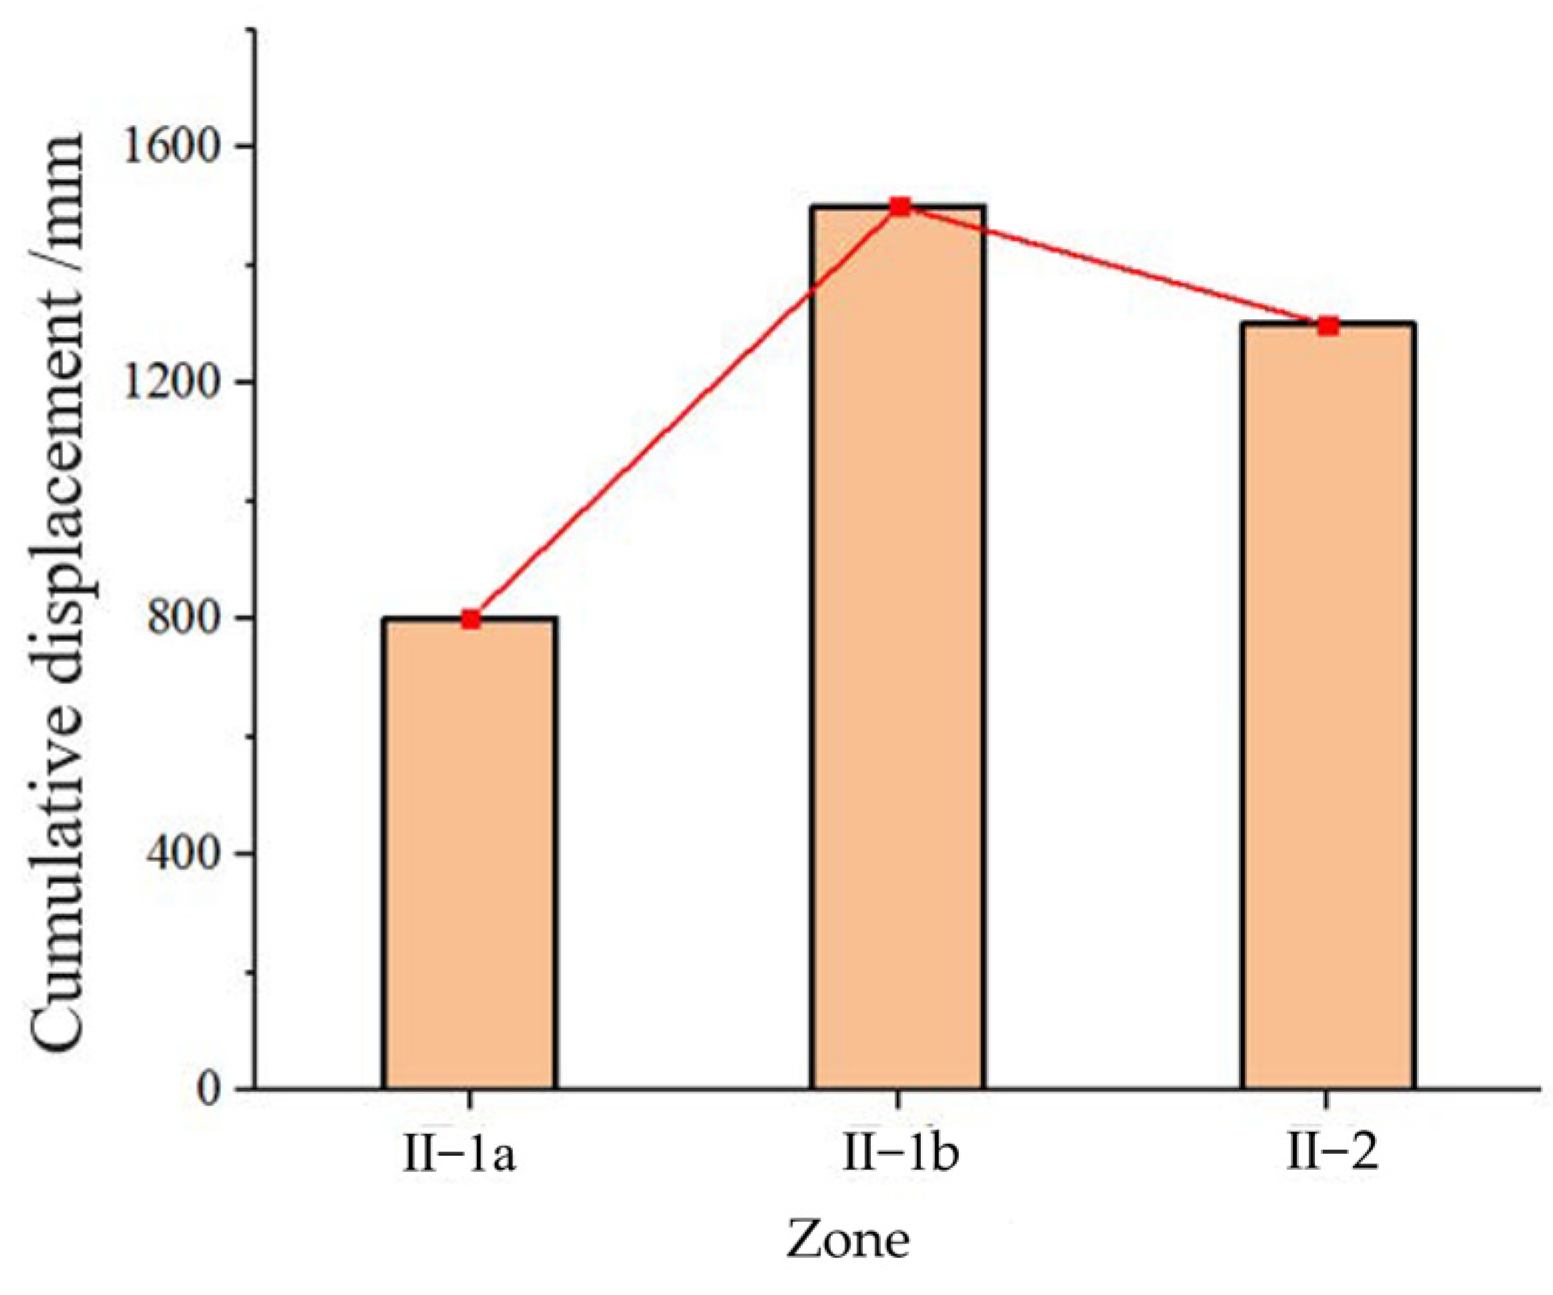
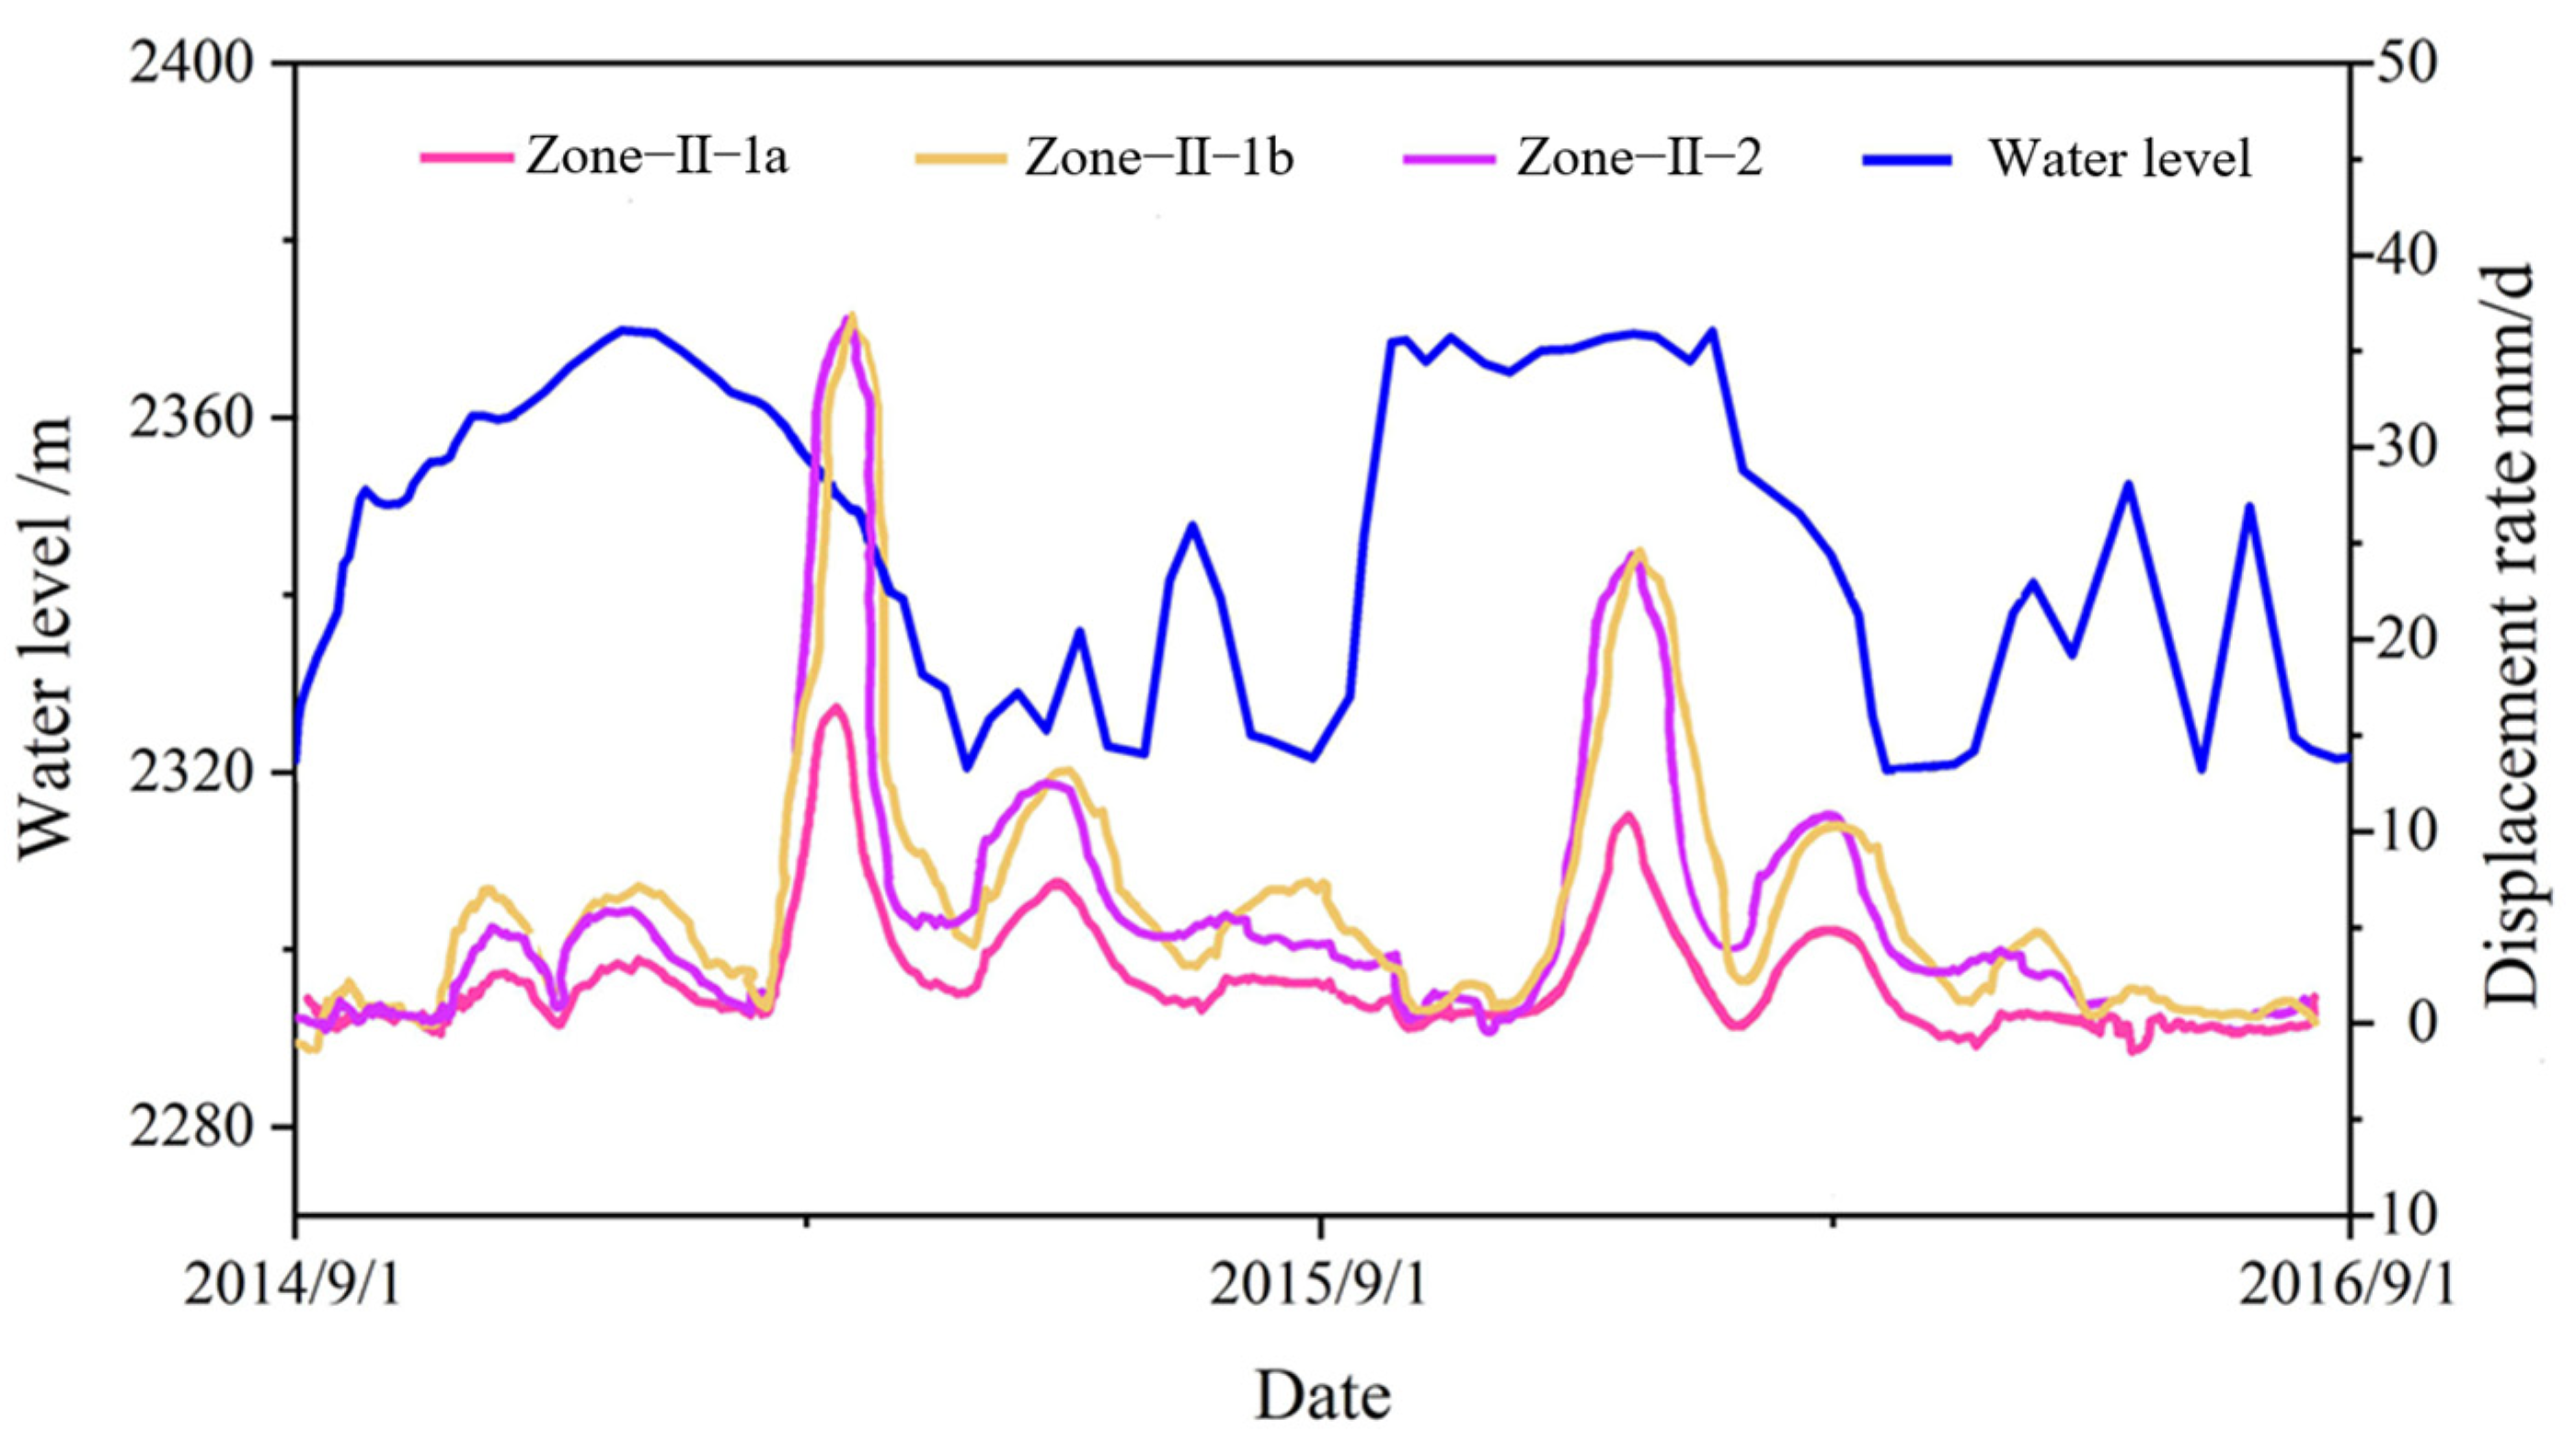
As shown in Figure 14, at the second stage, the maximum deformation of zone II-1a was 630 mm, zone II–1b was 1718 mm and zone II–2 was 1421 mm. Figure 15 shows the average value of the deformation increase in each zone was consistent with the first stage. According to the deformation rate (Figure 16), from September 2014 to September 2015, the water level was from 2320 m to 2370 m and the slope deformation accelerated. The deformation rate of zone II-1b was the highest, followed by zone II–2. Subsequently, the reservoir water level decreased from 2370 m to 2330 m, and the deformation rate remained high. The deformation rate in zone II–1b was 36 mm/day, lagging behind the decrease in the water level. From October 2015 to September 2016, the change in the water level in the second year was the same as that in the first year, and the slope deformation response was basically the same. The deformation response degree was greater when the reservoir water level decreased compared to when the water level rose. In summary, the power station had the greatest influence on the slope deformation in the second stage. Thereafter, although the slope experienced several cycles of reservoir water level variation, the deformation increased gently and no significant displacement mutation was observed.

4.3. Surface Deformation Zoning

Based on the average deformation amount and deformation rate of each region over the monitored period, the slope deformation zone was divided into two large regions, as shown in Figure 17, which is consistent with the engineering geological zoning. The average cumulative deformation of zone II-1a was 1596 mm, that of zone II-1b was 2396 mm, that of zone II–2 was 2037 mm and that of zone III was 788 mm. The cumulative deformation was as follows: zone II–1b > zone II–2 > zone II–1a > zone III. From the analyses of the deformation rate, we found that the deformation rate of zone II–1b was essentially identical to that of zone II–2, and the average deformation rate was 0.32 mm/day to 0.68 mm/day; the average deformation rate of zone II–1a was 0.26 mm/day to 0.44 mm/day. The deformation rate of zone III was 0.08 mm/day to 0.23 mm/day.
Based on the deformation monitoring data, the slope displacement vector was drawn to analyze the deformation evolution characteristics of the slope. The displacement vector direction in zone II-1a was 6–15° NE and tended downstream, and the displacement developed slowly over time (Figure 18a–c). The displacement vector direction of zone II–1b was 10–20° NE and orthogonal to the slope direction, and the displacement developed rapidly, as shown in Figure 18c. The displacement vector direction in zone II–2 changed slightly. At the first stage (Figure 18a), the displacement vector direction was approximately 15° NE. Thereafter, the displacement vector direction of the slope was approximately 10° NE, consistent with the slope direction, and the displacement developed slowly over time. The displacement vector direction of 5–10° NE in zone III was basically consistent with the slope direction, slightly downstream, and the displacement developed rapidly, as shown in Figure 18b,c.
Accordingly, there were minor disparities in the displacement vector direction in each area; however, it basically intersected positively with the slope and was oriented toward the reservoir, indicating deformation in that direction.

5. Influence Mechanism of Water Level Variation

5.1. Deterioration of Rock Mass Caused by Water Level Variation

The samples collected from the toppling deformation area were subjected to a strength test through water saturation and dry–wet cycles. The samples were saturated with water for 8 days, kept in a dryer at a constant temperature of 50 °C to air dry for 1 day and immersed in water for 2 days as a part of a dry and wet cycle. Then, they were formed into a 50 mm diameter and 100 mm high standard sample for the experiment.
Water level variation will soften the rock and soil on the banks and decrease the shear strength of the rock soil on the banks, in turn affecting the landslide stability [19]. The shear strength of the three samples deteriorated to different degrees under water saturation. The cohesion and friction angles both exhibited downward trends, and the reduction in the cohesion was greater than that of the friction angle. After 4 days of water saturation of the samples in the fault fracture zone and the strong topping and loosening fracture zone, the cohesion and friction angle of the fault fracture zone were 47 kPa and 25.7°, and the cohesion and friction angle of the strong topping and loosening fracture zone were 65 kPa and 26.3° (Figure 19a). After 90 days of water saturation of the normal rock mass, the total deterioration degree of the cohesion and friction angle were 47.50% and 12.14%. After 30 days, the deterioration of the shear strength gradually slowed (Figure 19b).
As shown in Figure 20, the deterioration of the friction angle of the sample in the fault fracture zone decreased after two dry–wet cycles, while the cohesion decreased linearly. After two dry and wet cycles, the cohesion and friction angles of the samples in the strong topping and loosening fracture zone were 69 kPa and 26.4°, and the deterioration degree was 9.21% and 3.30% (Figure 20a). The “inflection point” of the deterioration curve of the normal rock mass also appeared after two dry–wet cycles, and its cohesion and friction angle were 10.6 MPa and 37.9° (Figure 20b).

5.2. Influence of Water Level Variation on Seepage Field

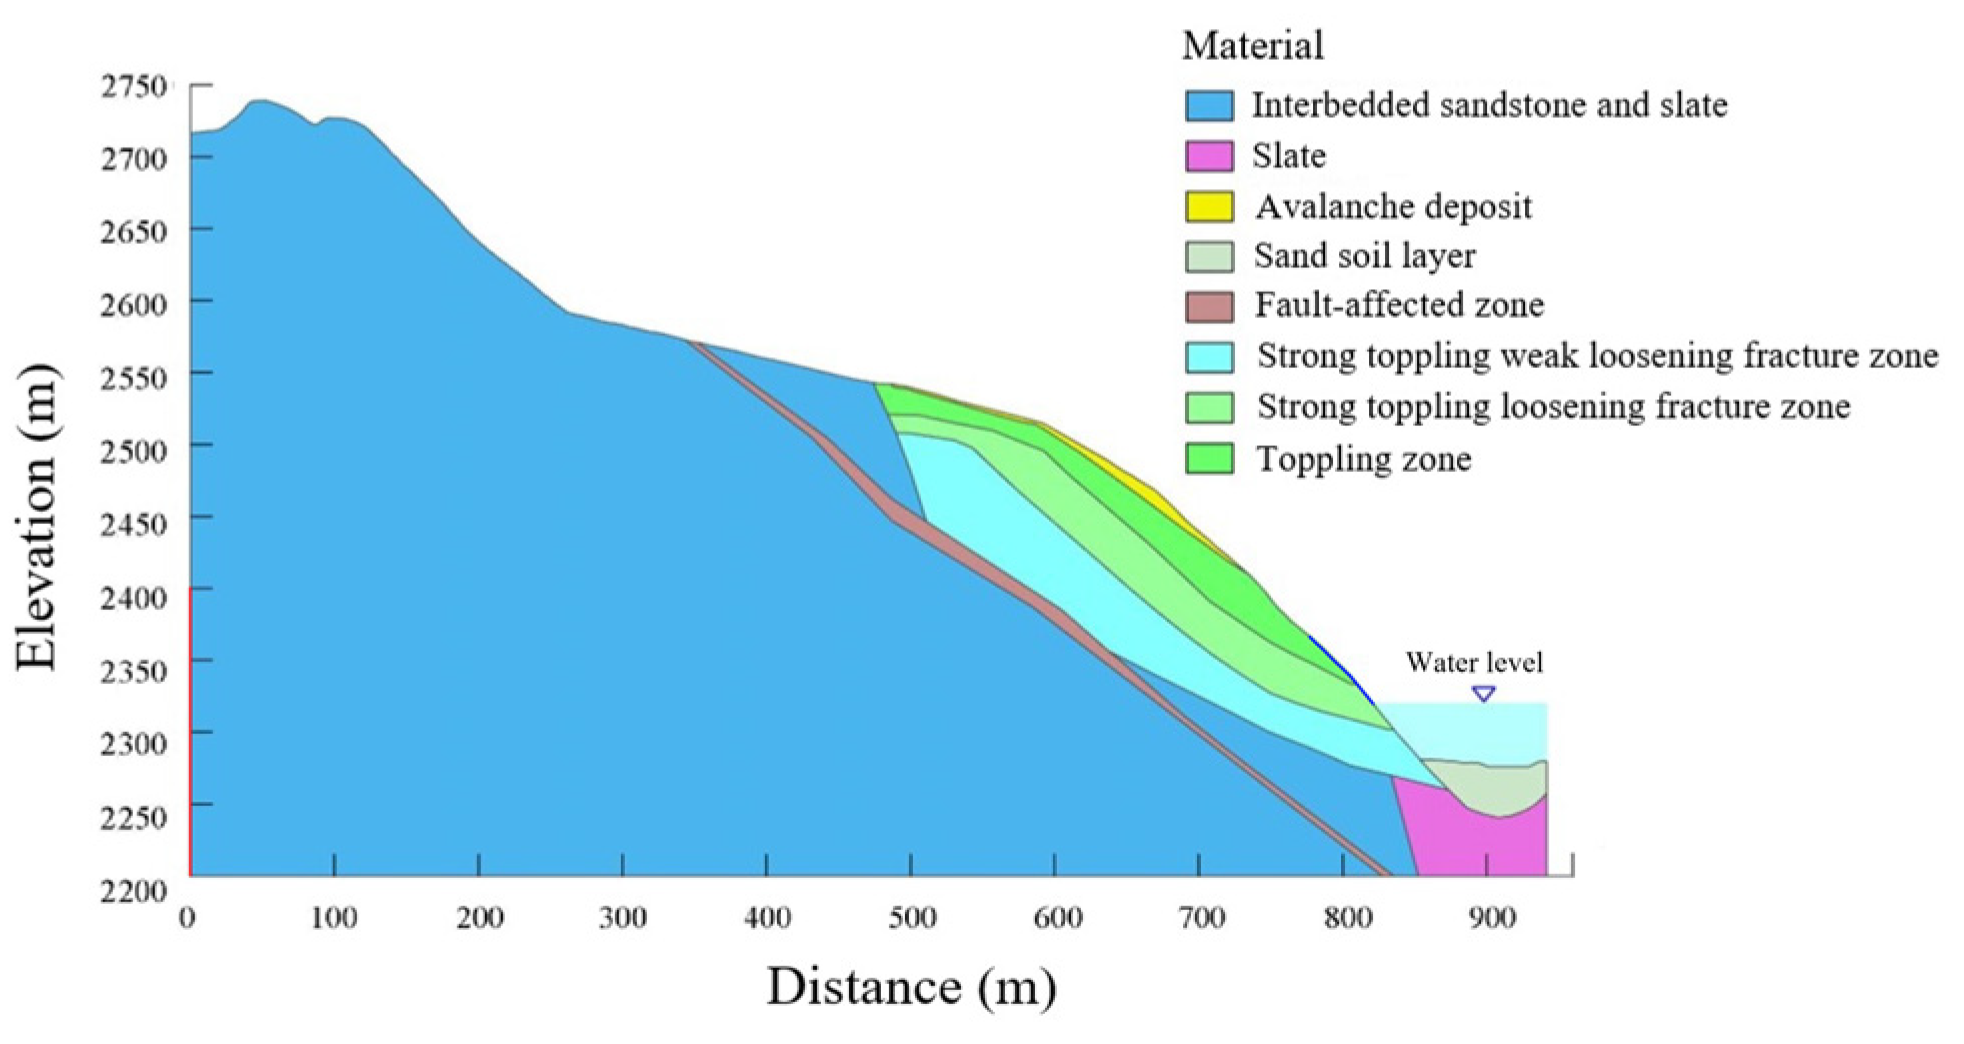
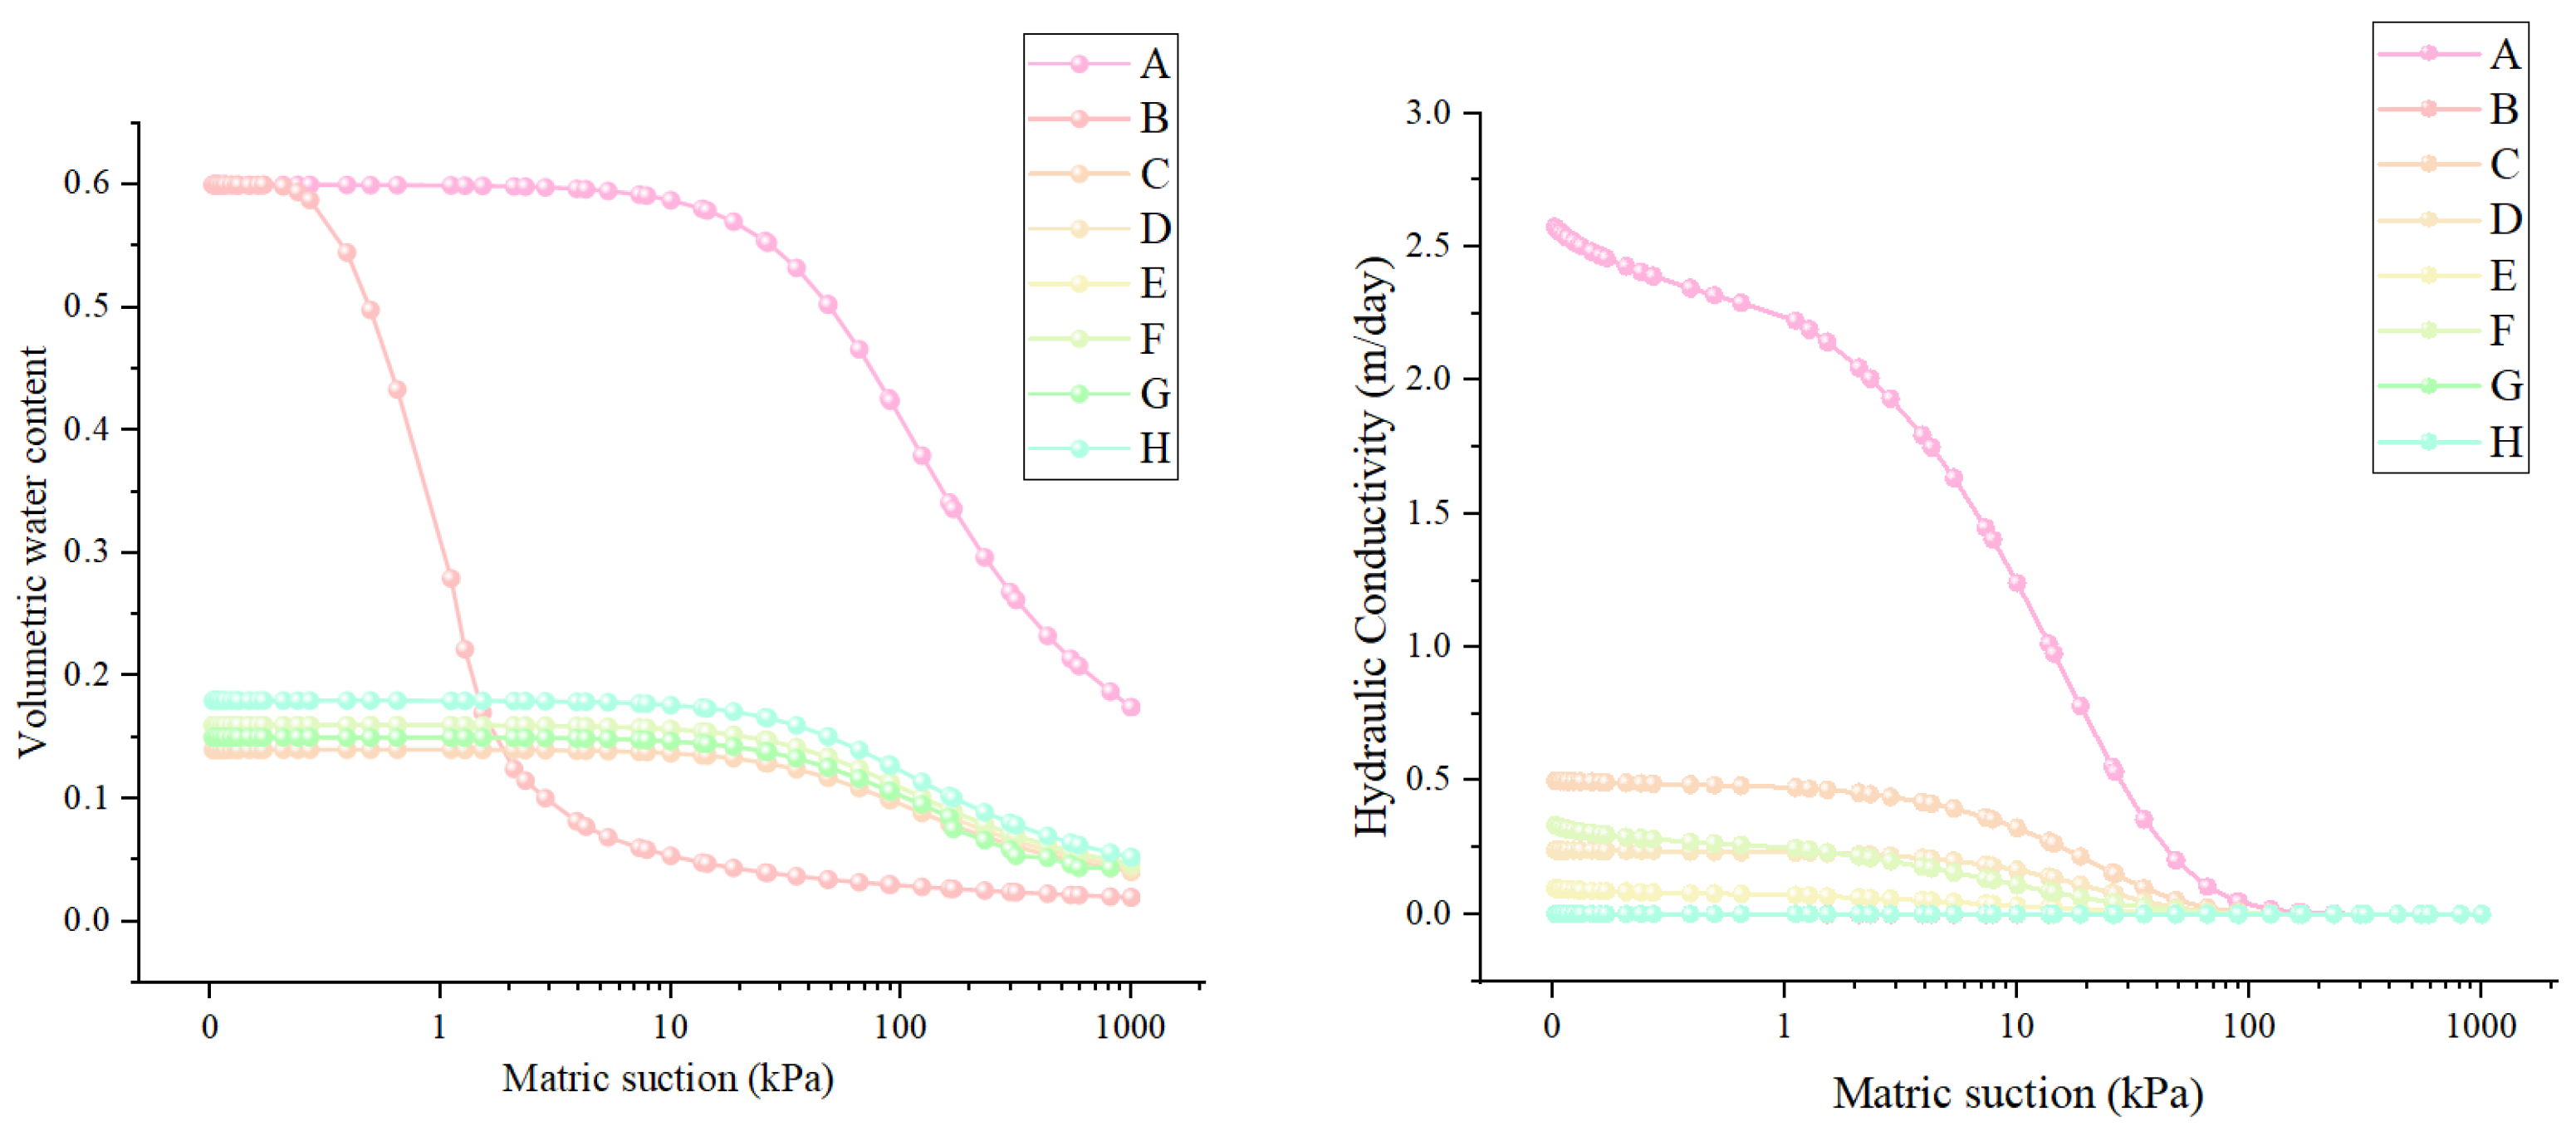
Considering the typical section as the calculation model in Figure 21, the boundary of the variation in the reservoir water level is represented by a blue line in the model and the boundary water level on the left side of model is 2400 m, represented by a red line. The experimental parameters of the rock mass are shown in Table 2 and the volumetric water content and hydraulic conductivity are shown in Figure 22. The water level variation ranges from 2320 m to 2370 m, and the rise and decrease rates are 0.4 m/day, 0.8 m/day and 1.6 m/day (Table 3). The Seep/W module in the Geostudio numerical simulation was used to simulate the dynamic characteristics of the groundwater seepage field under various working conditions.
A study has shown the seepage field inside of the slope subjected to the variation in the reservoir water level [30]. As shown in Figure 23, when the reservoir water level rose, the groundwater level in the slope was affected by the seepage field. The rise in the groundwater level lagged behind the rise in the reservoir water level, resulting in an overall seepage line on the bank slope that exhibited a downward convex shape (Figure 23a–c). The hydraulic gradient (the slope of the seepage line) of the bank slope increased gradually with the increase in the distance, and the hydraulic gradient increased at the same distance with the water level increase rate increasing (Figure 23d).
As shown in Figure 24, when the reservoir water level decreased, the groundwater level in the slope was affected by the seepage field. The decrease in the groundwater level lagged behind the decrease in the reservoir water level, resulting in an overall seepage line on the bank slope that exhibited an upward convex shape (Figure 24a–c). The hydraulic gradient (the slope of the seepage line) of the bank slope increased gradually with the increase in the distance of the bank slope, and the hydraulic gradient increased at the same distance with the water level decrease rate increasing (Figure 24d). Whether the reservoir water level increases or decreases, the groundwater level lags behind the reservoir water level. In a word, the findings indicate a clear time-lag response in the reservoir bank slope deformations to the water level changes [27].

5.3. Slope Deformation Response under Water Level Variation

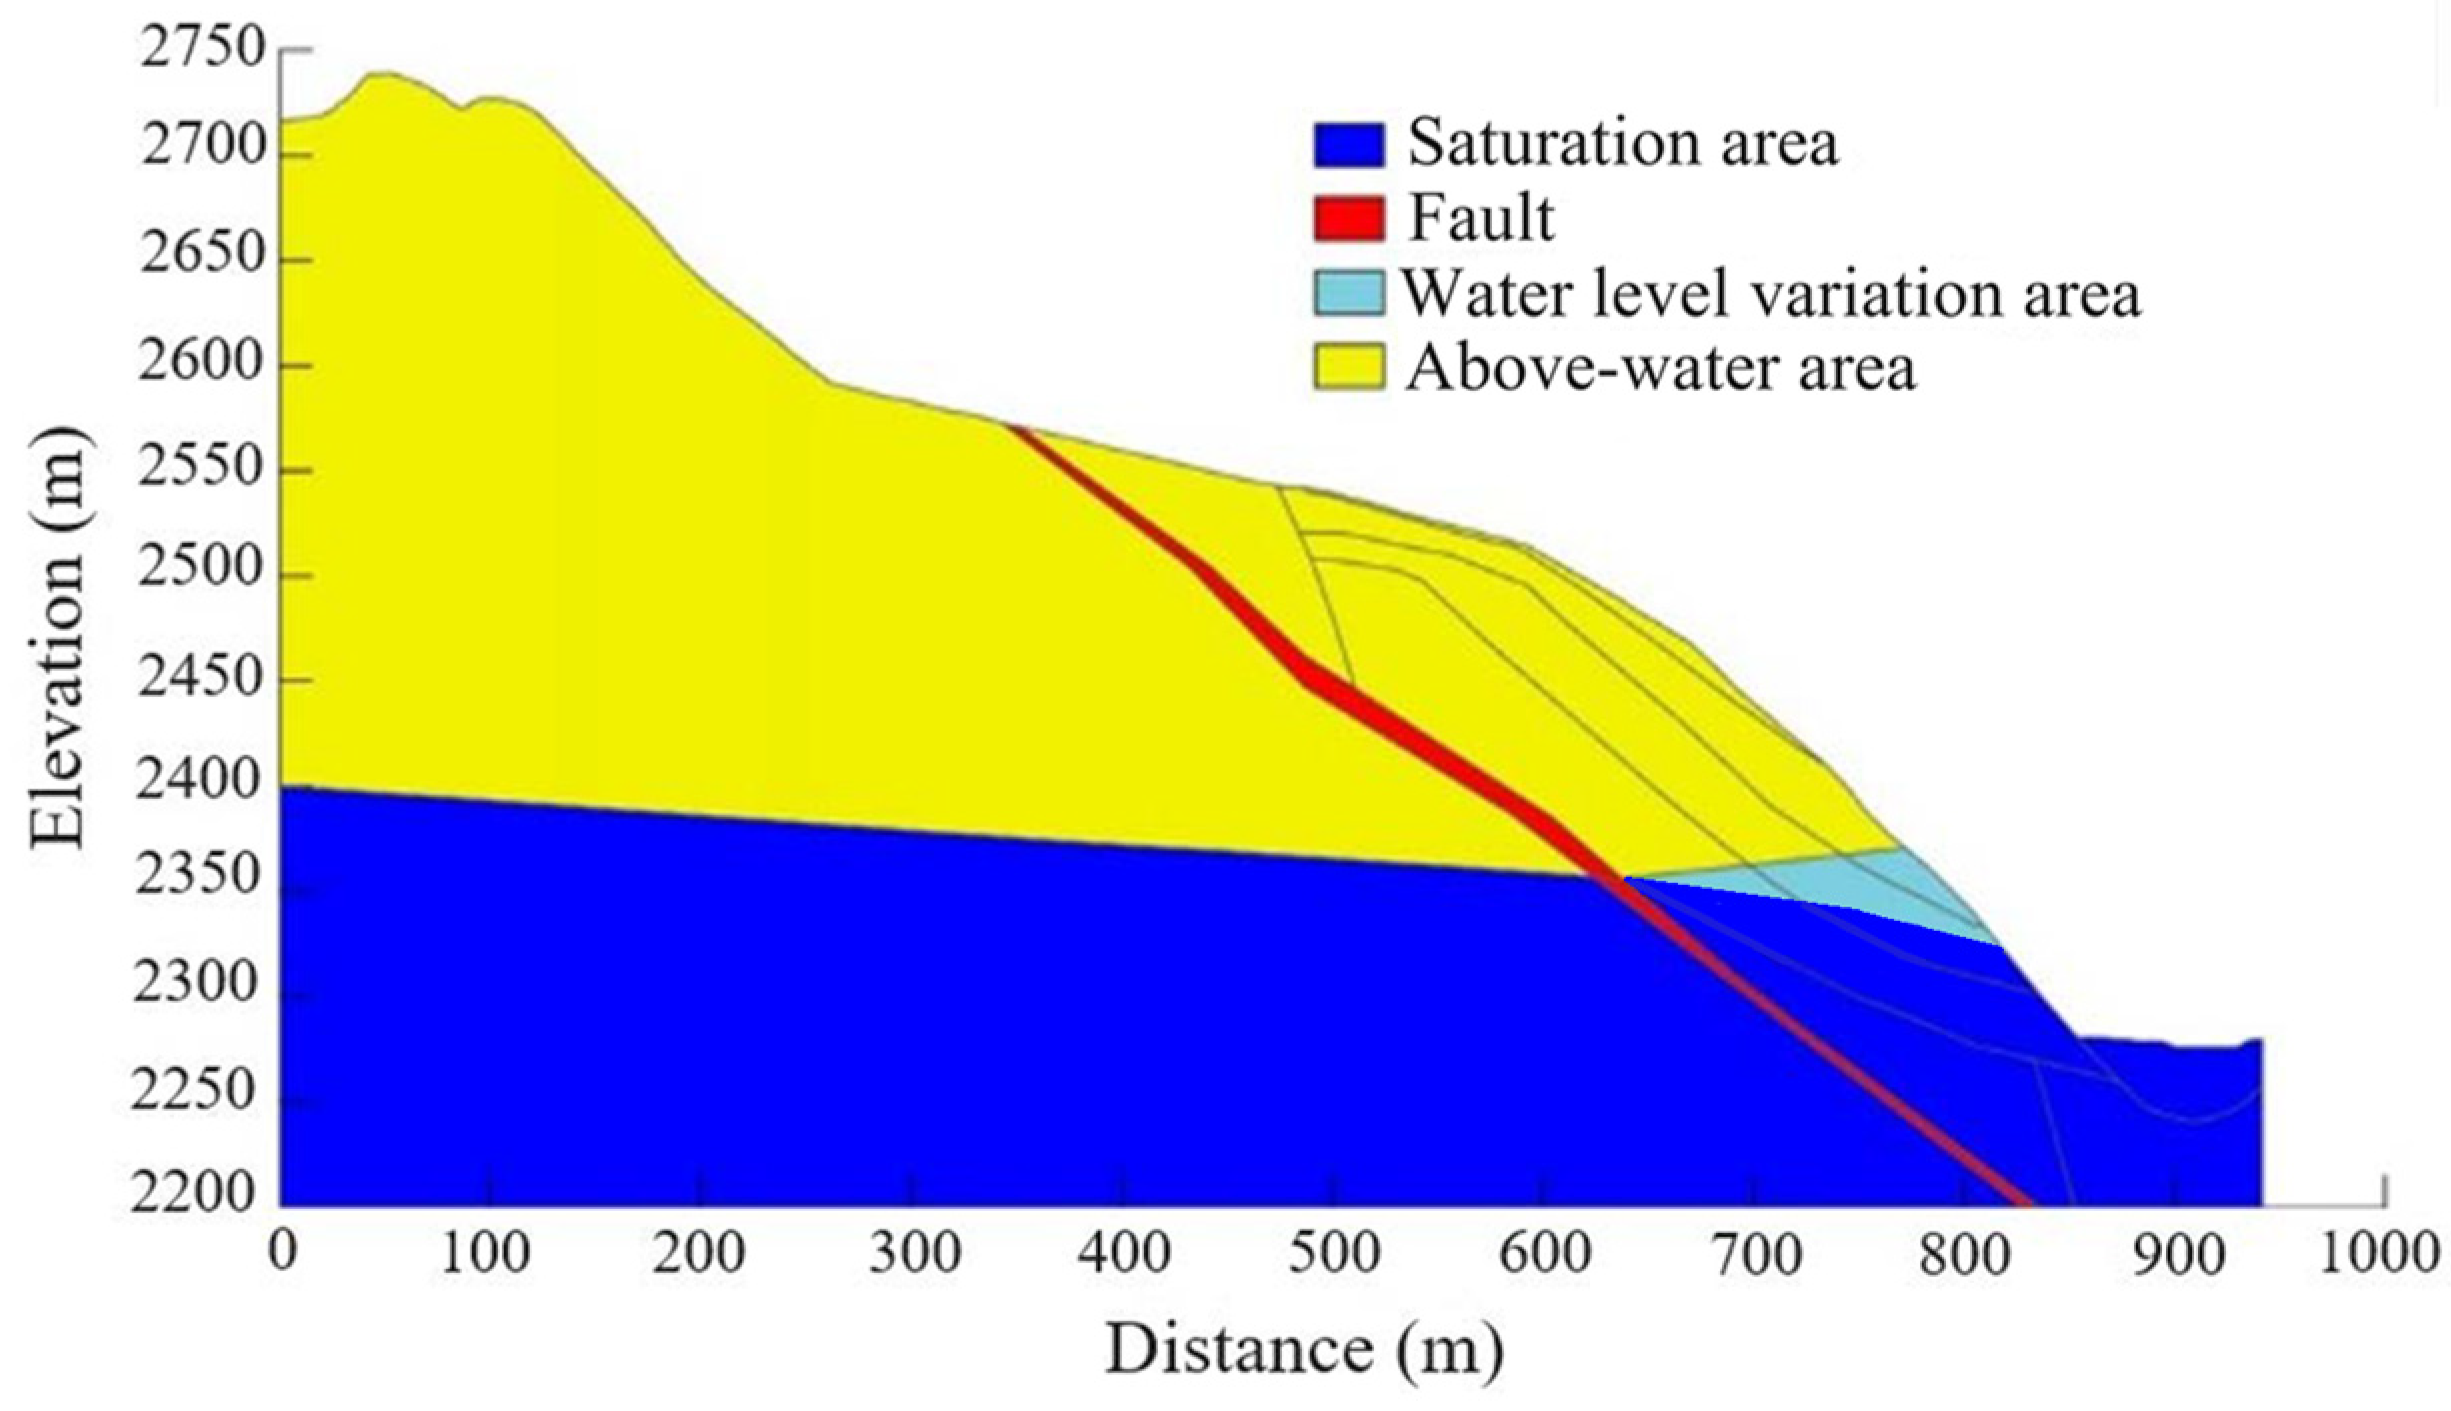
In order to further investigate the deformation response characteristics of the toppling slope influenced by the reservoir water, we analyzed the deformation rule in various sections of the toppling slope under different situations of reservoir water level variations, ranging from one to five times. In addition, according to the reservoir water level variation characteristics, the model was divided into the above-water area, the water-level-variation area and the saturation area (Figure 25). The physical parameters of the rock mass are shown in Table 4 and Table 5.
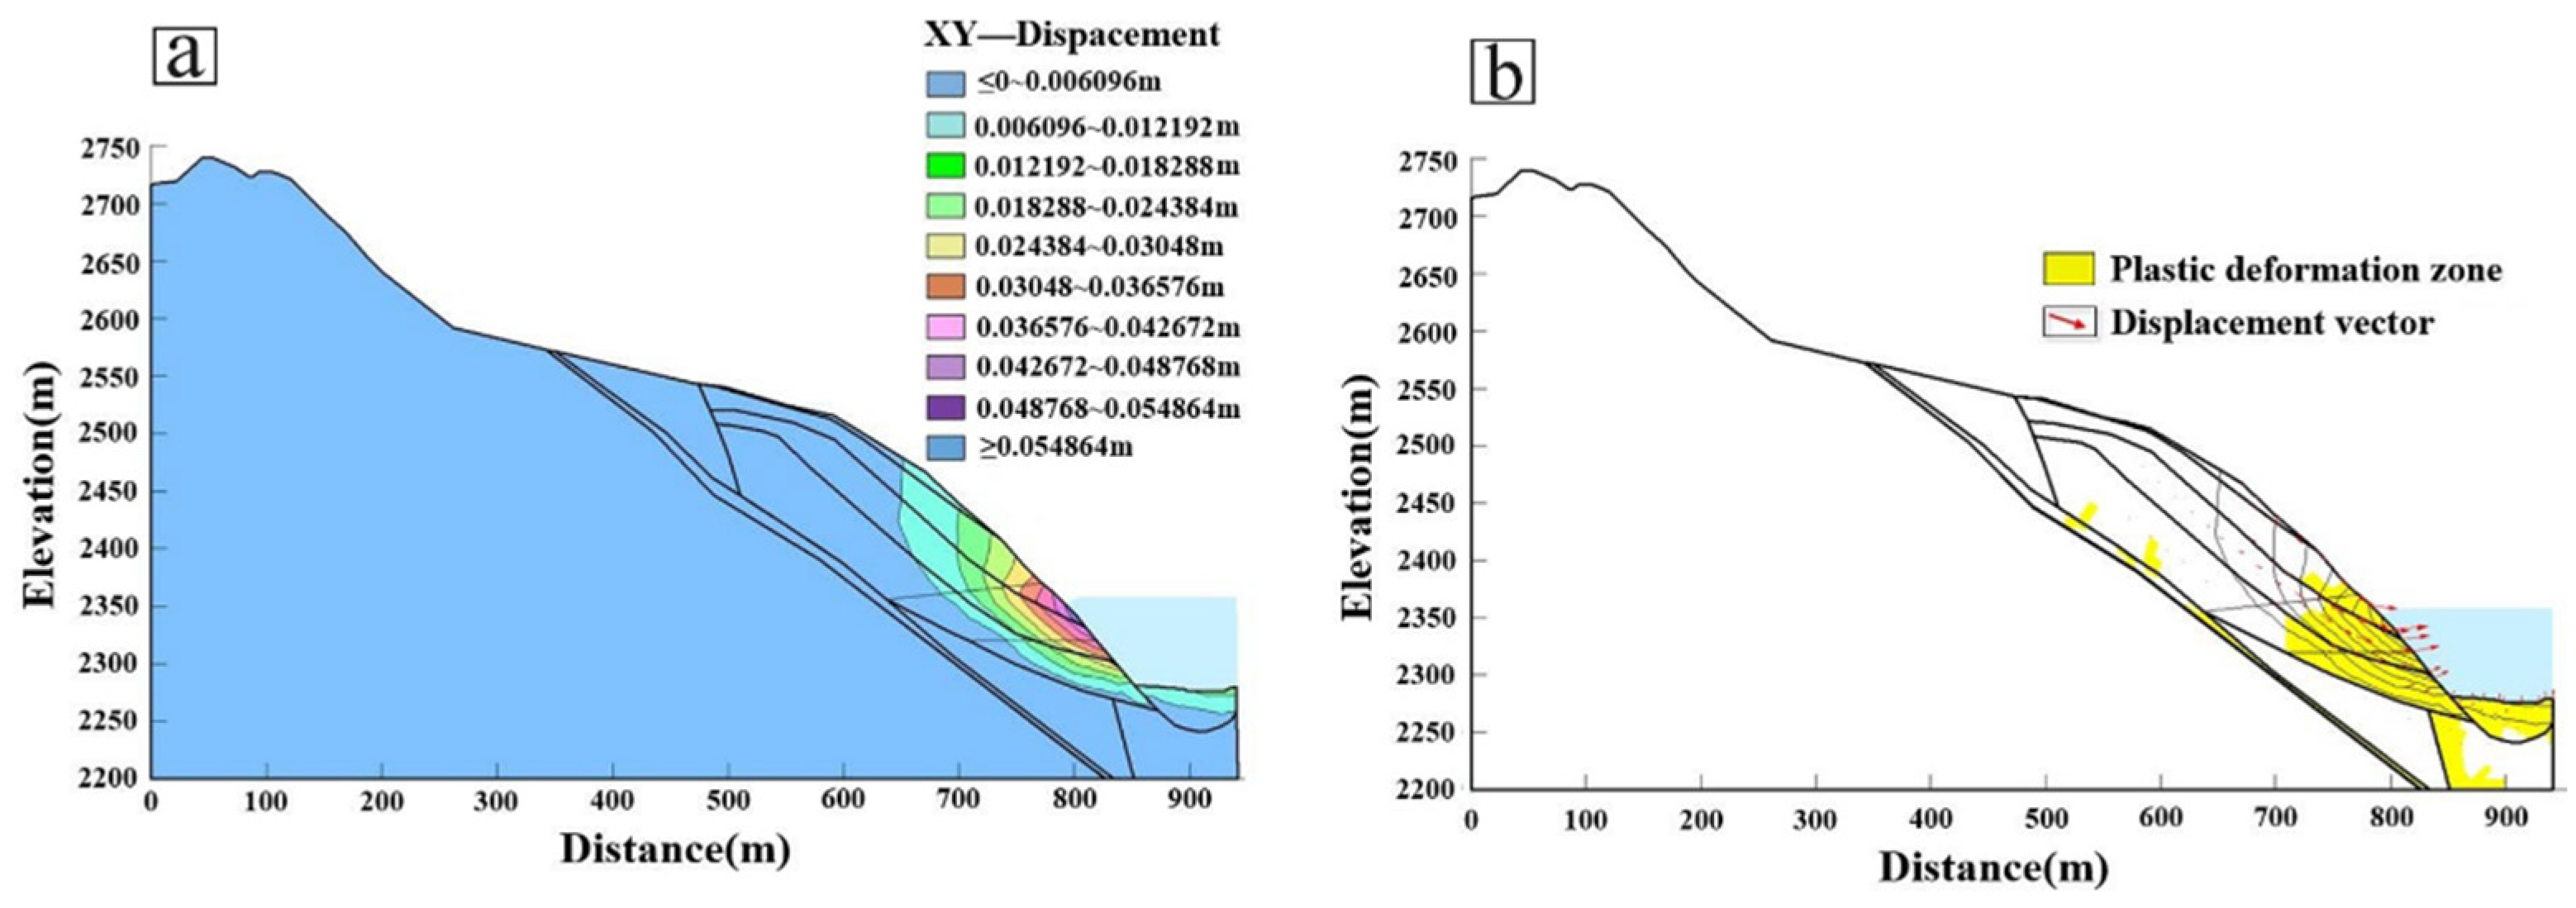
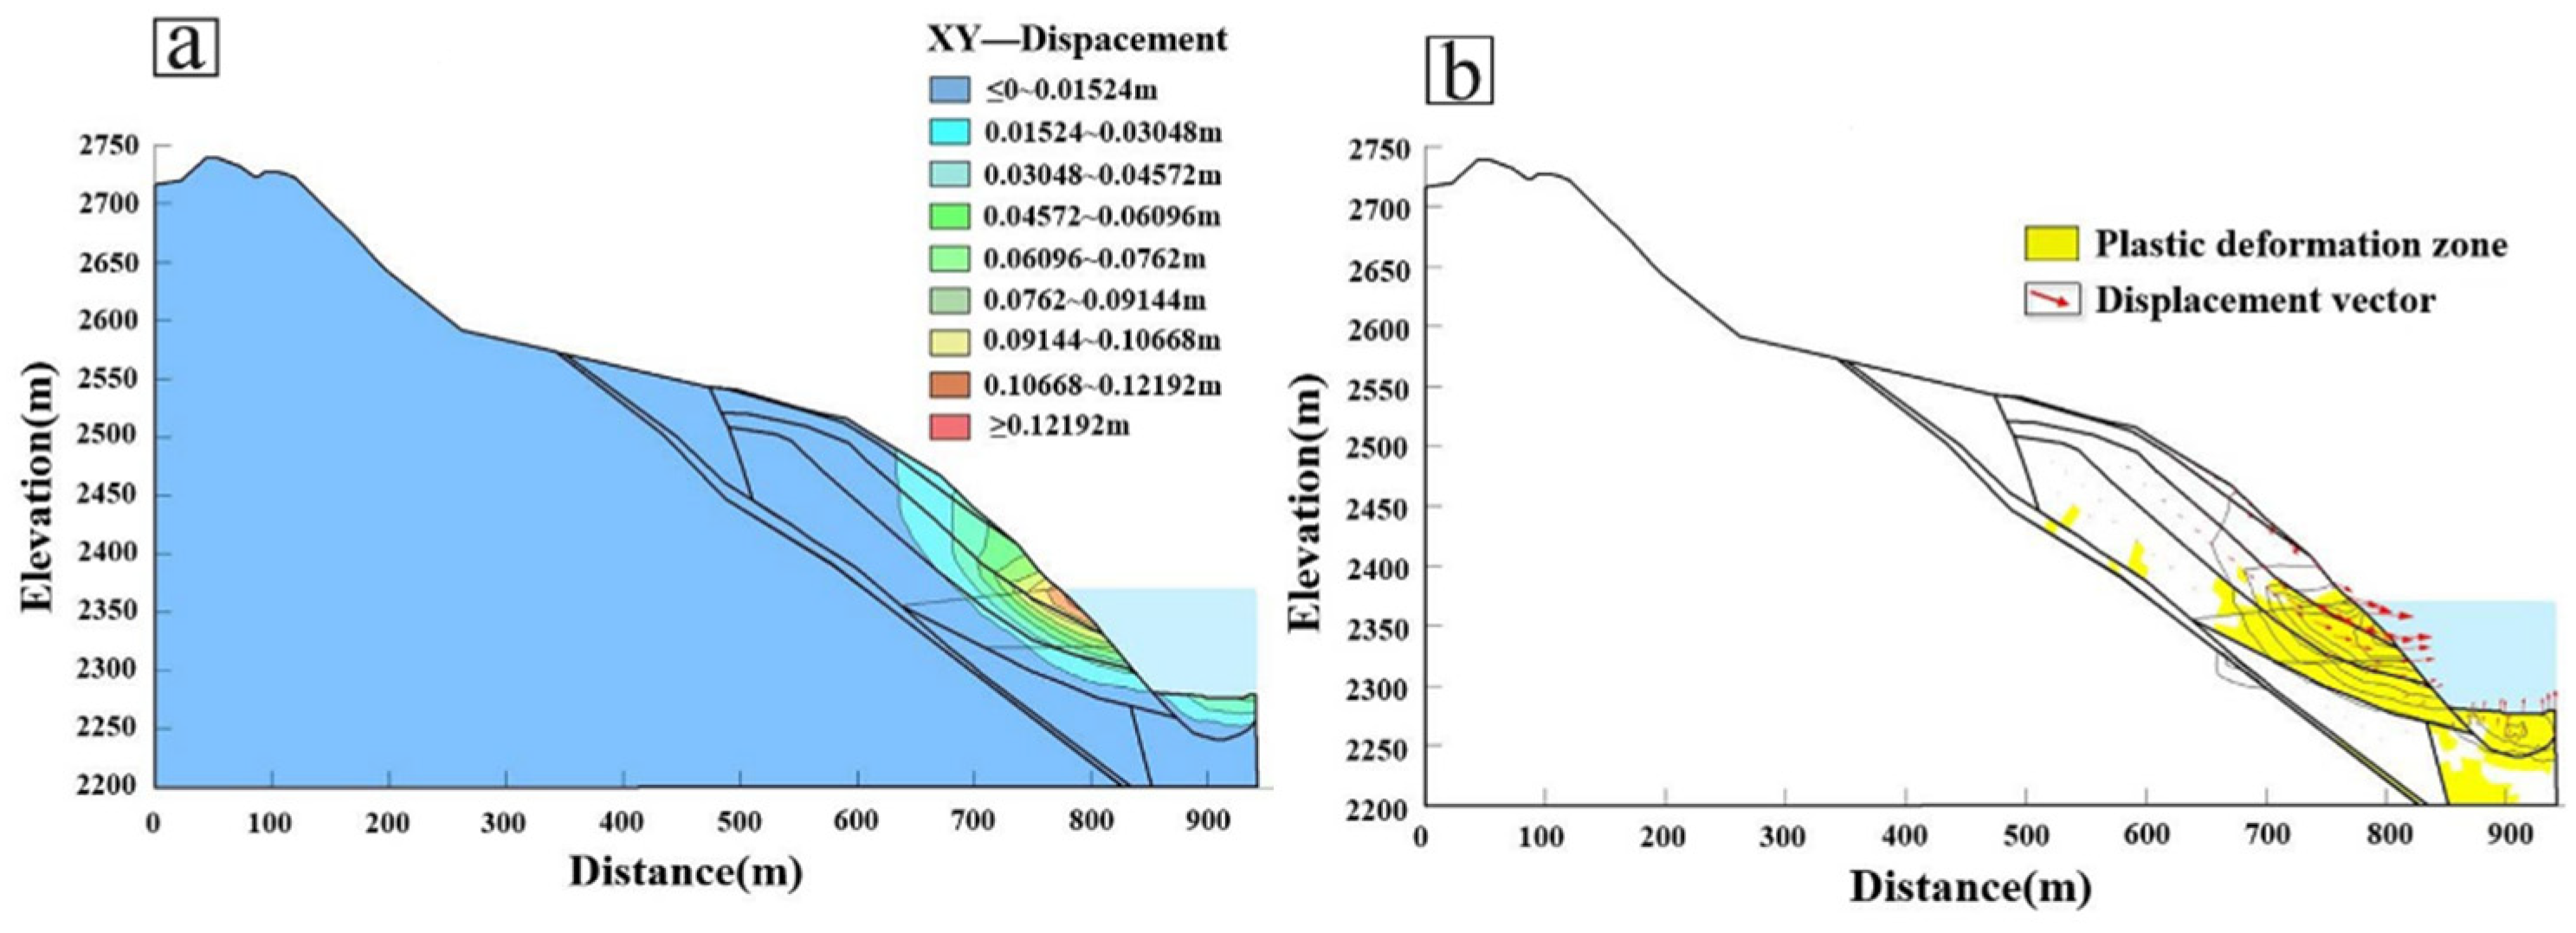
As shown in Figure 26, at the situation of a single time of reservoir water level variation, the plastic zone and deformation of the slope were mainly concentrated at the toe of the slope. The toppling deformable body was located in the plastic deformation zone. The direction of the displacement vector pointed outward from the slope (Figure 26b). The most significant deformation area, with approximately 0.05 m XY direction displacement, was located on the slope surface near the normal storage water level. The deformation degree decreased with the inner extension of the slope. The slope above the storage water level also deformed by 0.012 m to 0.048 m, and the overall deformation was smaller than that of the rock mass in the water-level-variation area and the saturated area (Figure 26a). As shown in Figure 27b, for the situation of five times of reservoir water level variations, the deformation rules of the slope were the same as a single time of reservoir water level variation, and the differences were the XY direction displacement of 0.12 m and the slope deforming by 0.015 m to 0.12 m (Figure 27a).
According to the comparison of the slope deformation characteristics under the two situations, we make the following conclusions: under the two situations, the plastic deformation and the maximum displacement are mainly concentrated at the toe of the slope; under water level variations, the deformation response of the toppling deformable body is intensified, which is mainly manifested as the expansion of the plastic zone and an increase in the displacement with the increase in the variation times [5,28]. These observations are consistent with the monitoring results.

5.4. Discussion

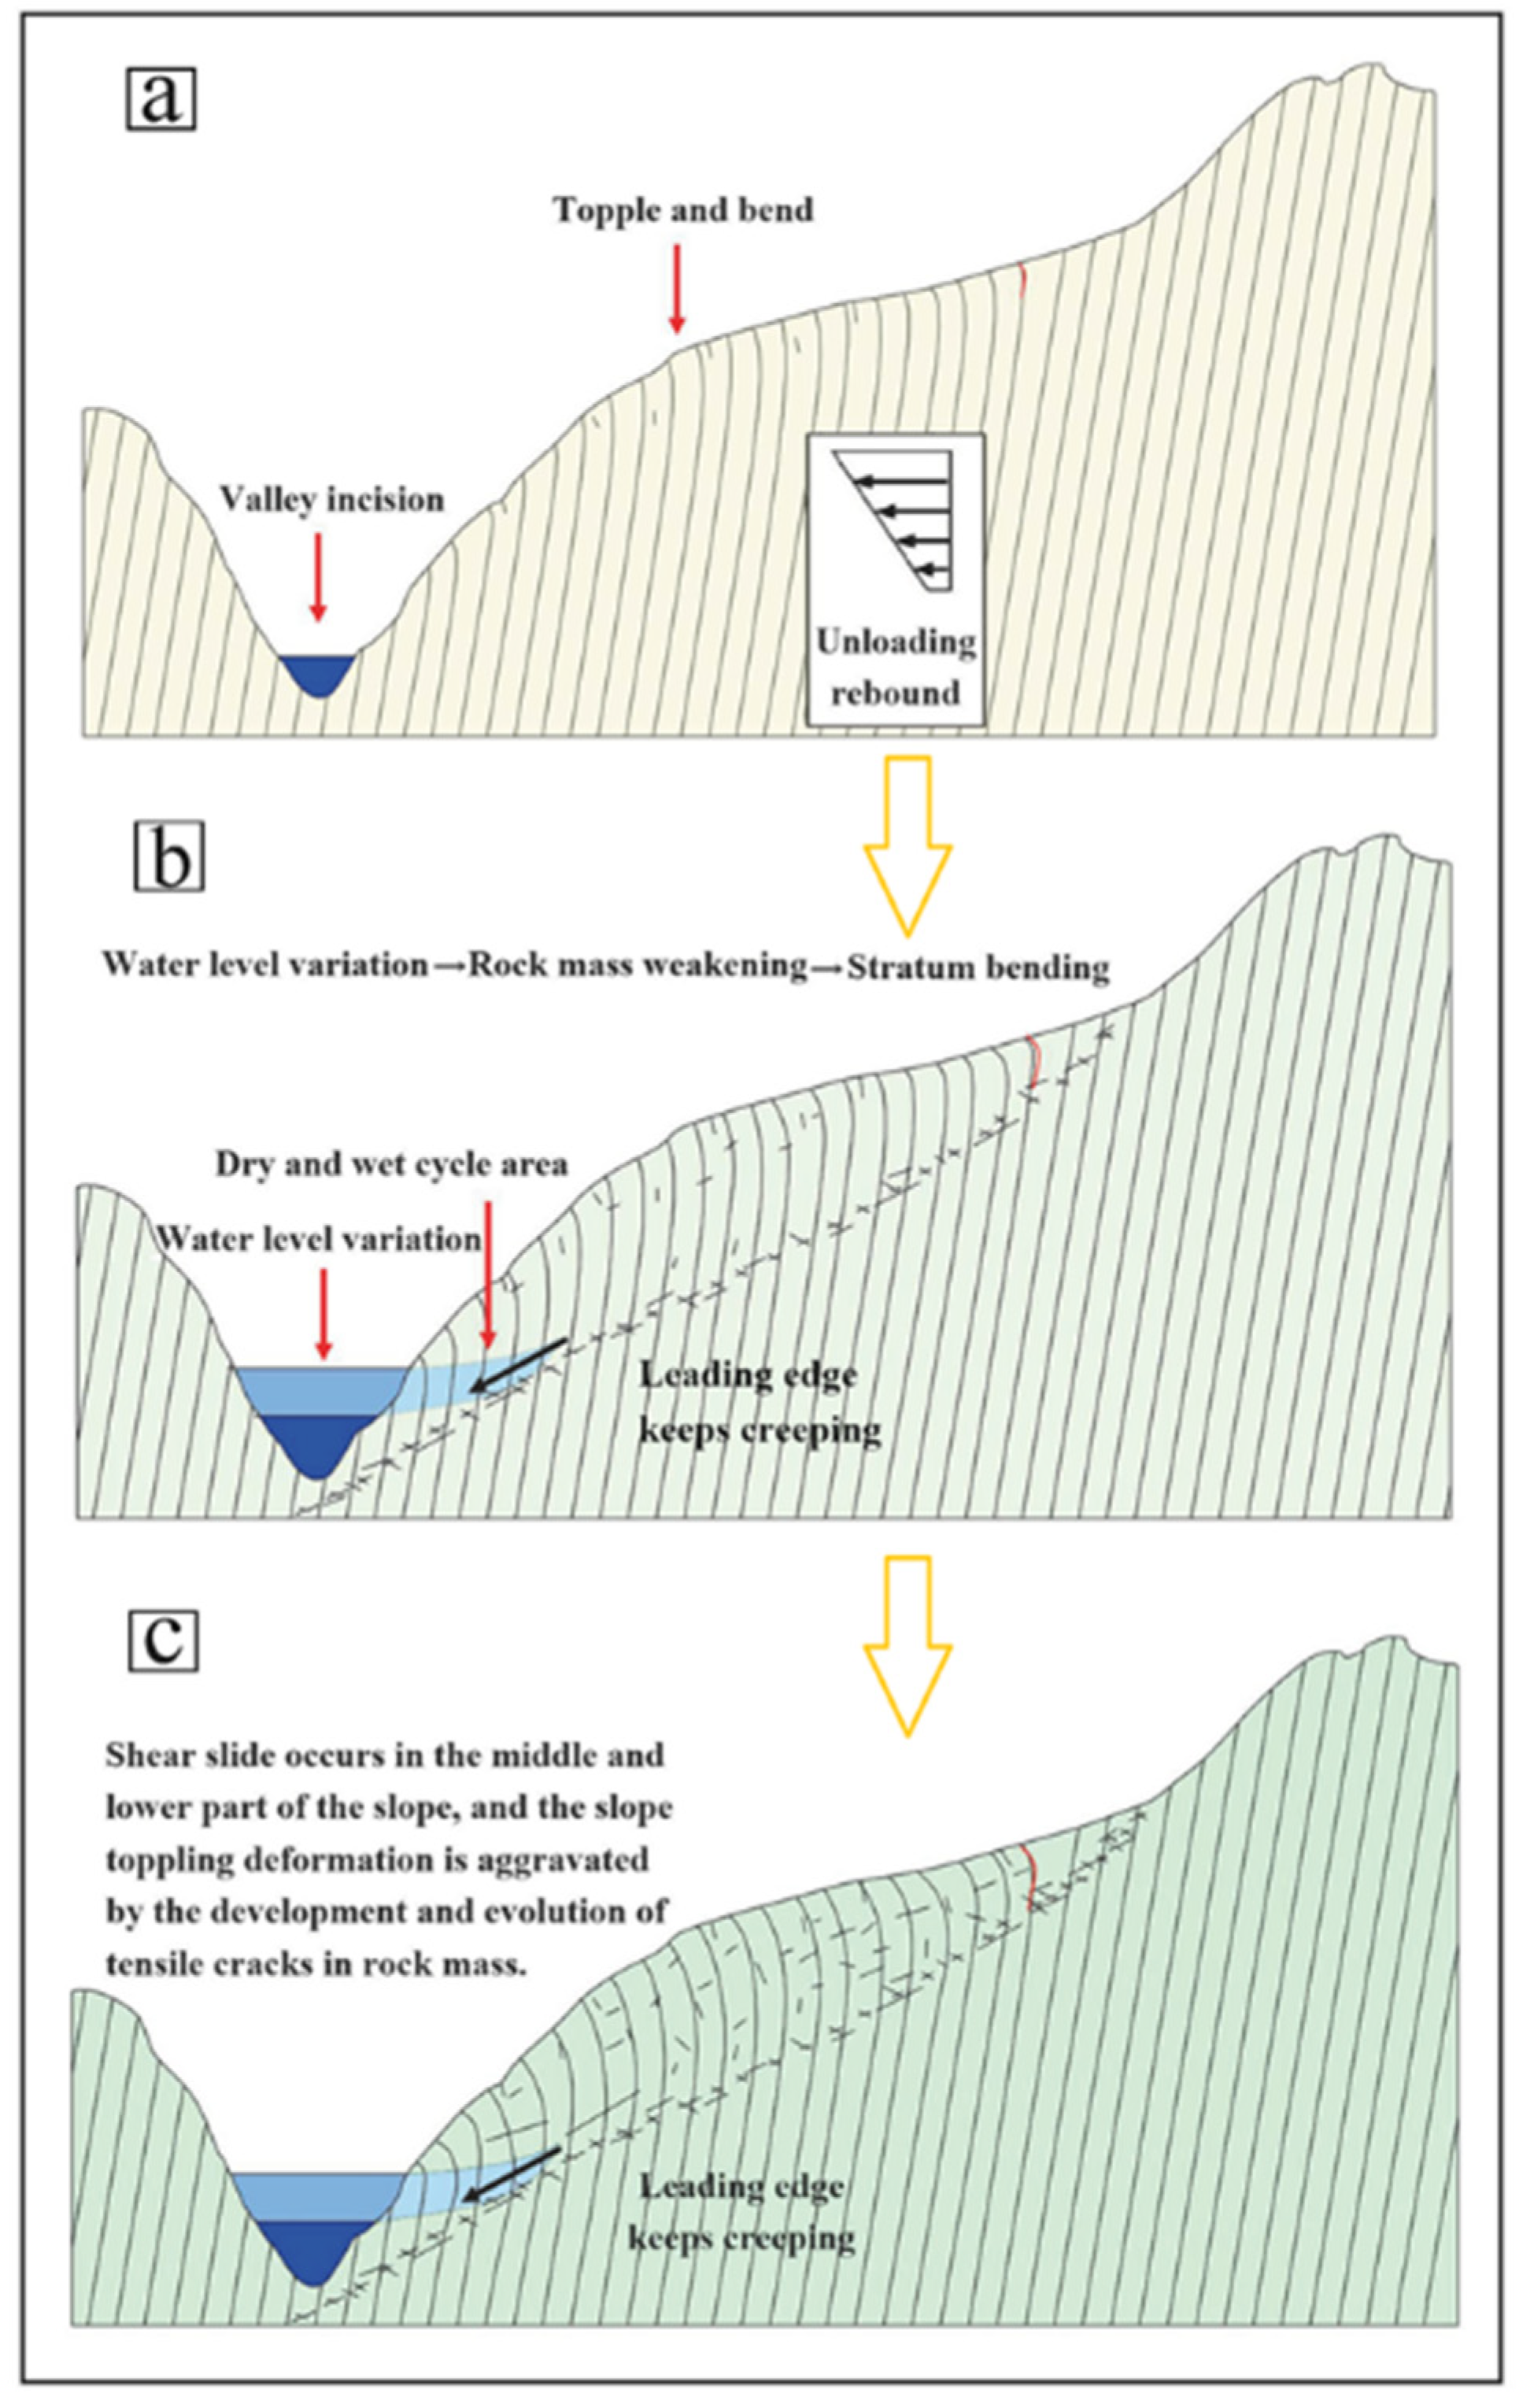
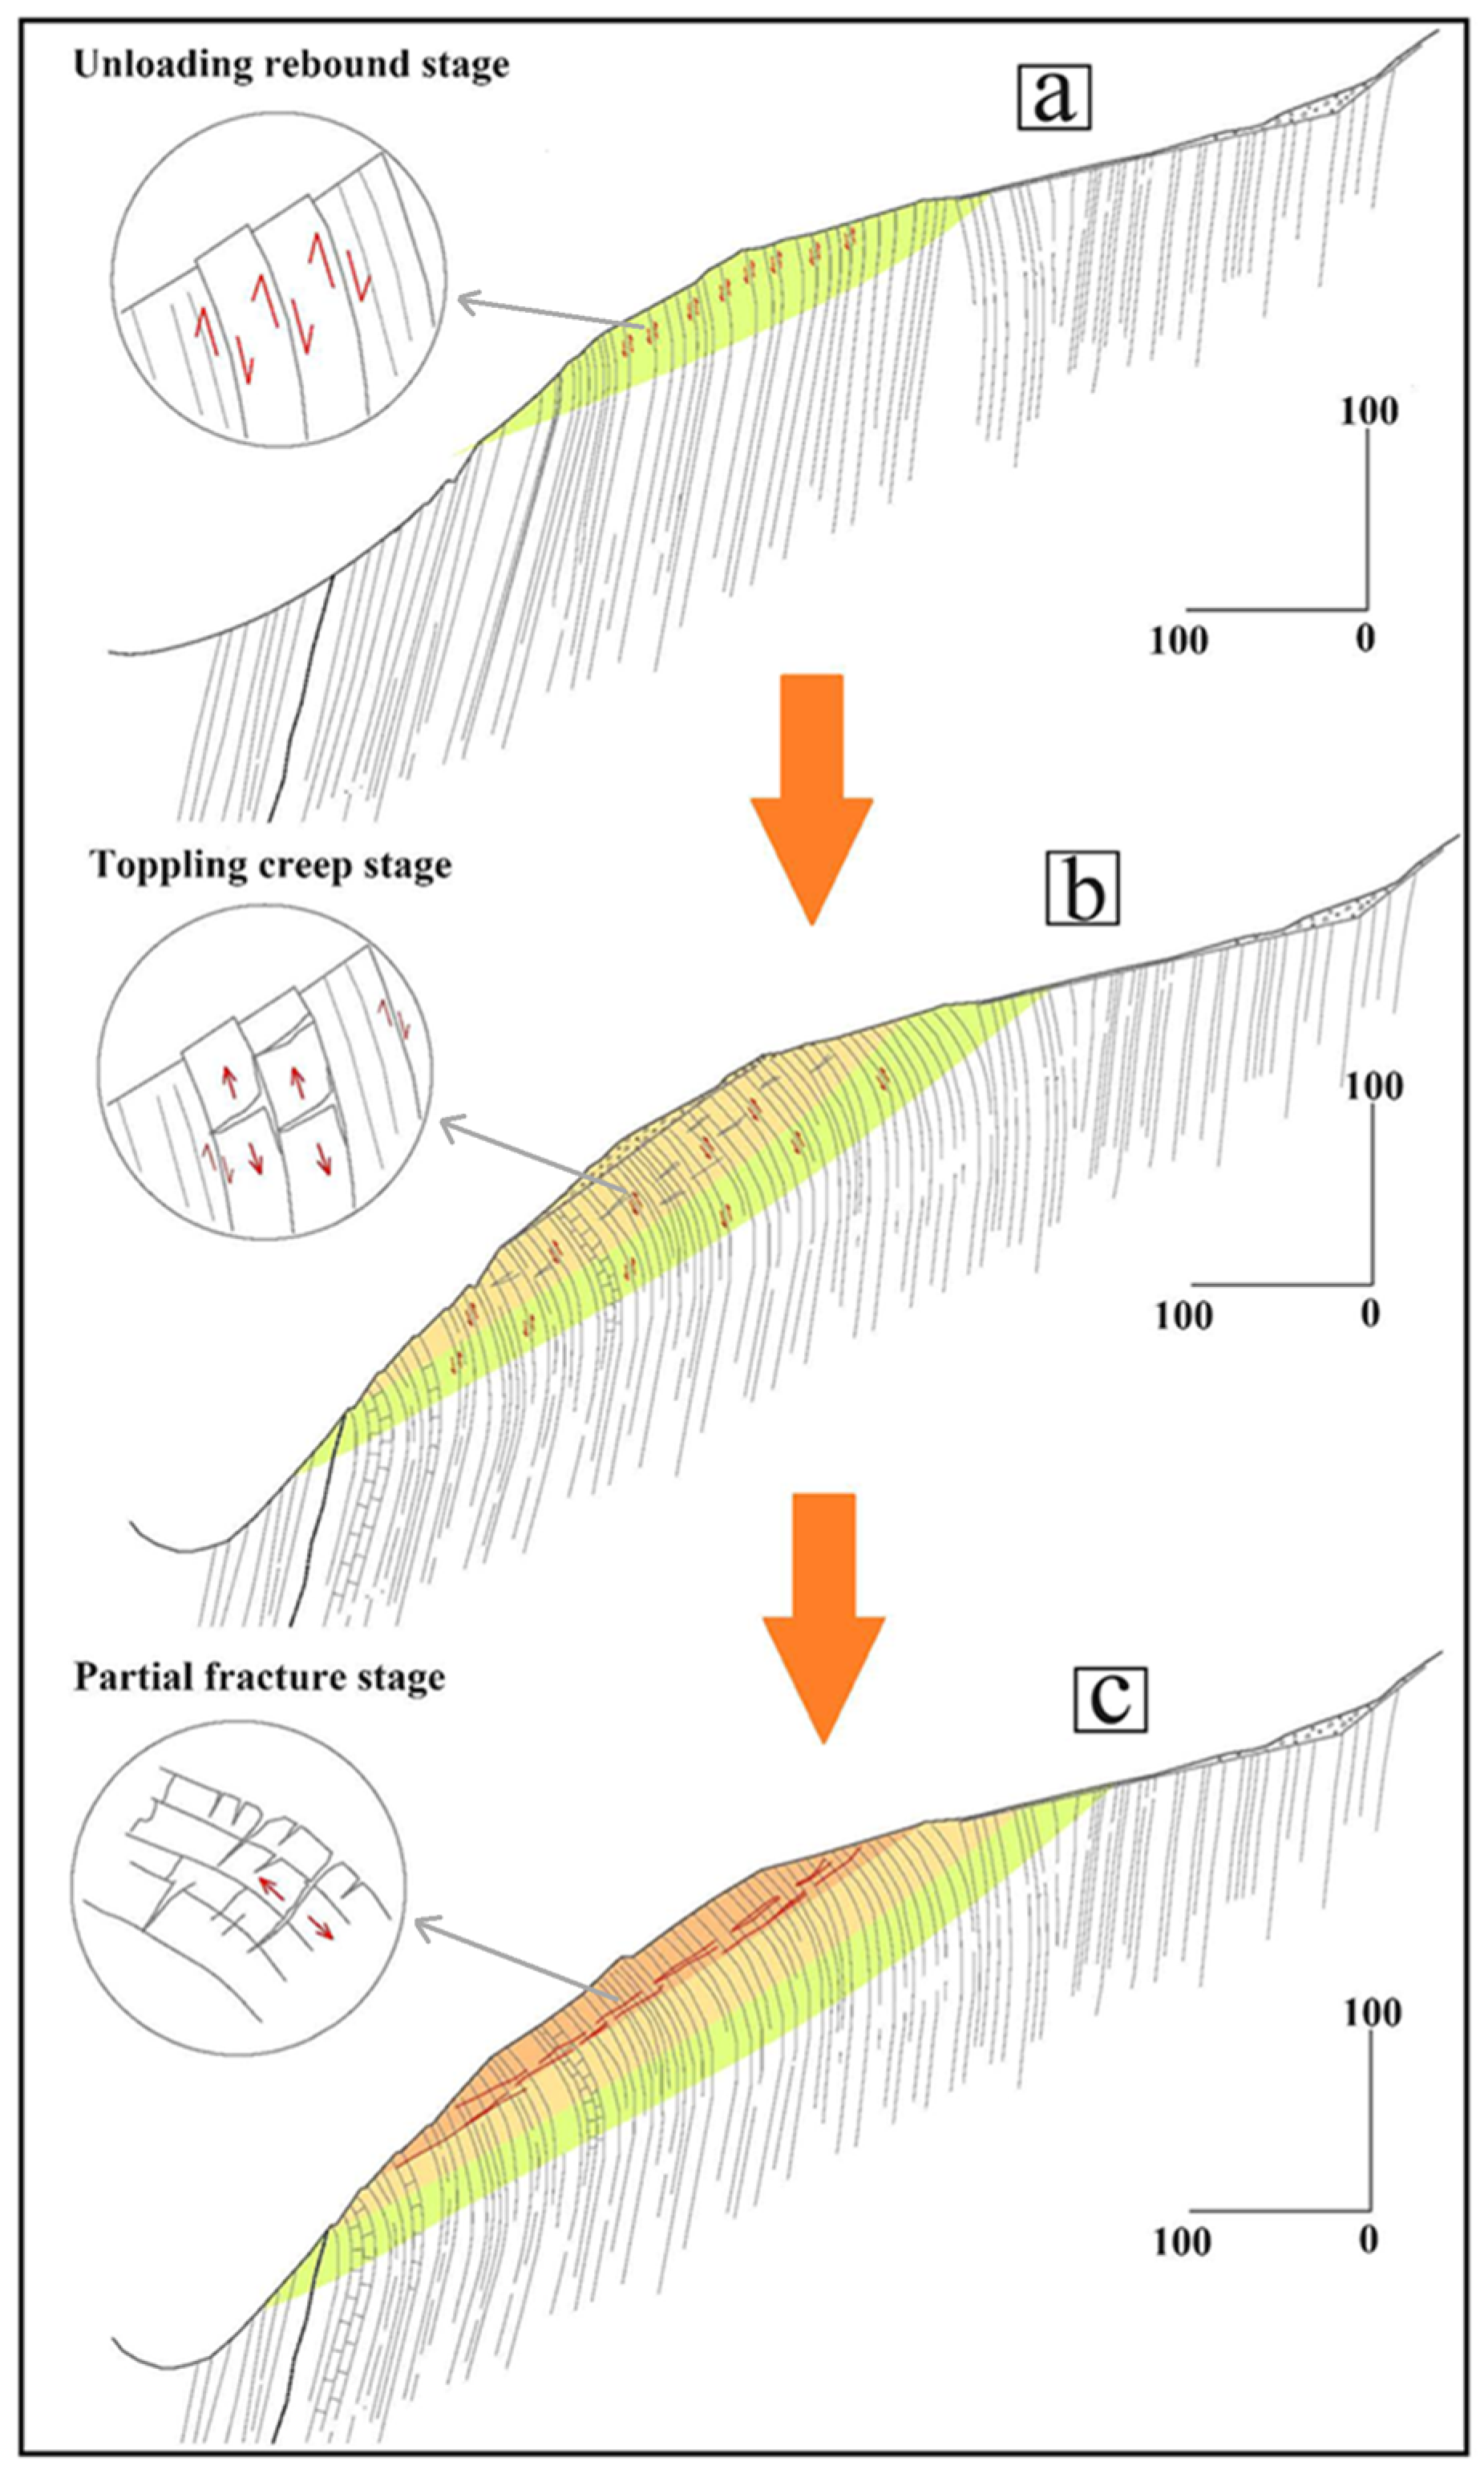
A study has shown that, when the water level decreased, the displacement of the slope front deformable body increased significantly, reaching 0.02 m [1]. In this paper, the numerical analyses showed that the slope above the storage water level deformed by 0.012 m to 0.048 m, which is similar to the study. The water level fluctuation had been leading to the seepage field variation in the bank slopes [10]. Combined with the numerical analysis results of the slope deformation response under the action of the reservoir water, it can be concluded that the variation in the reservoir water changes the seepage field of the underground water inside of the slope; then, the seepage pressure caused by the water level difference can increase the landslide displacement [9], and the dry and wet cycling effect decreases the mechanical strength of the rock mass, causing the front to produce a plastic zone and to continuously expand [5], which ultimately promotes the deformation of the rock mass and accelerates the process of slope creep and toppling. The deformation response process can be divided into the following stages. The steep bedding rock mass will initially topple and deform due to the downward cutting of the valley in the early stage (Figure 28a). Then, the reservoir water level variation leads to the deterioration of the rock mass, the shear strength of rock at the toe of the slope gradually decreases and the rock stratum at the toe of the slope will creep (Figure 28b). Under the continuous gravity action of the upper rock stratum, the rock stratum at the toe of the slope will shear slide, which provides a new movement space for the rear toppling rock mass. With the development and evolution of fractures, the strong toppling rock mass at the rear of the slope further topples and deforms. Moreover, it is also due to the existence of the fault fracture zone in the slope, which has a strong promotion effect on the overall sliding of the toppling deformable zone along the structural plane (Figure 28c).
The main influencing factor of the landslide is the reservoir water level change [17]. In this paper, the evolution of the valley and the water level variation over a long time triggered or accelerated the toppling deformations; then, the slope had a “bending creep” deformation, some of the rock mass had a partial toppling fracture and the surface rock mass in the middle and lower parts of the slope had a shear slide. The formation and development of the deformable body mainly experienced three evolutionary stages of rock mass unloading rebound (Figure 29a), rock mass toppling creep (Figure 29b) and partial fracture (Figure 29c), as shown in Figure 29 below.
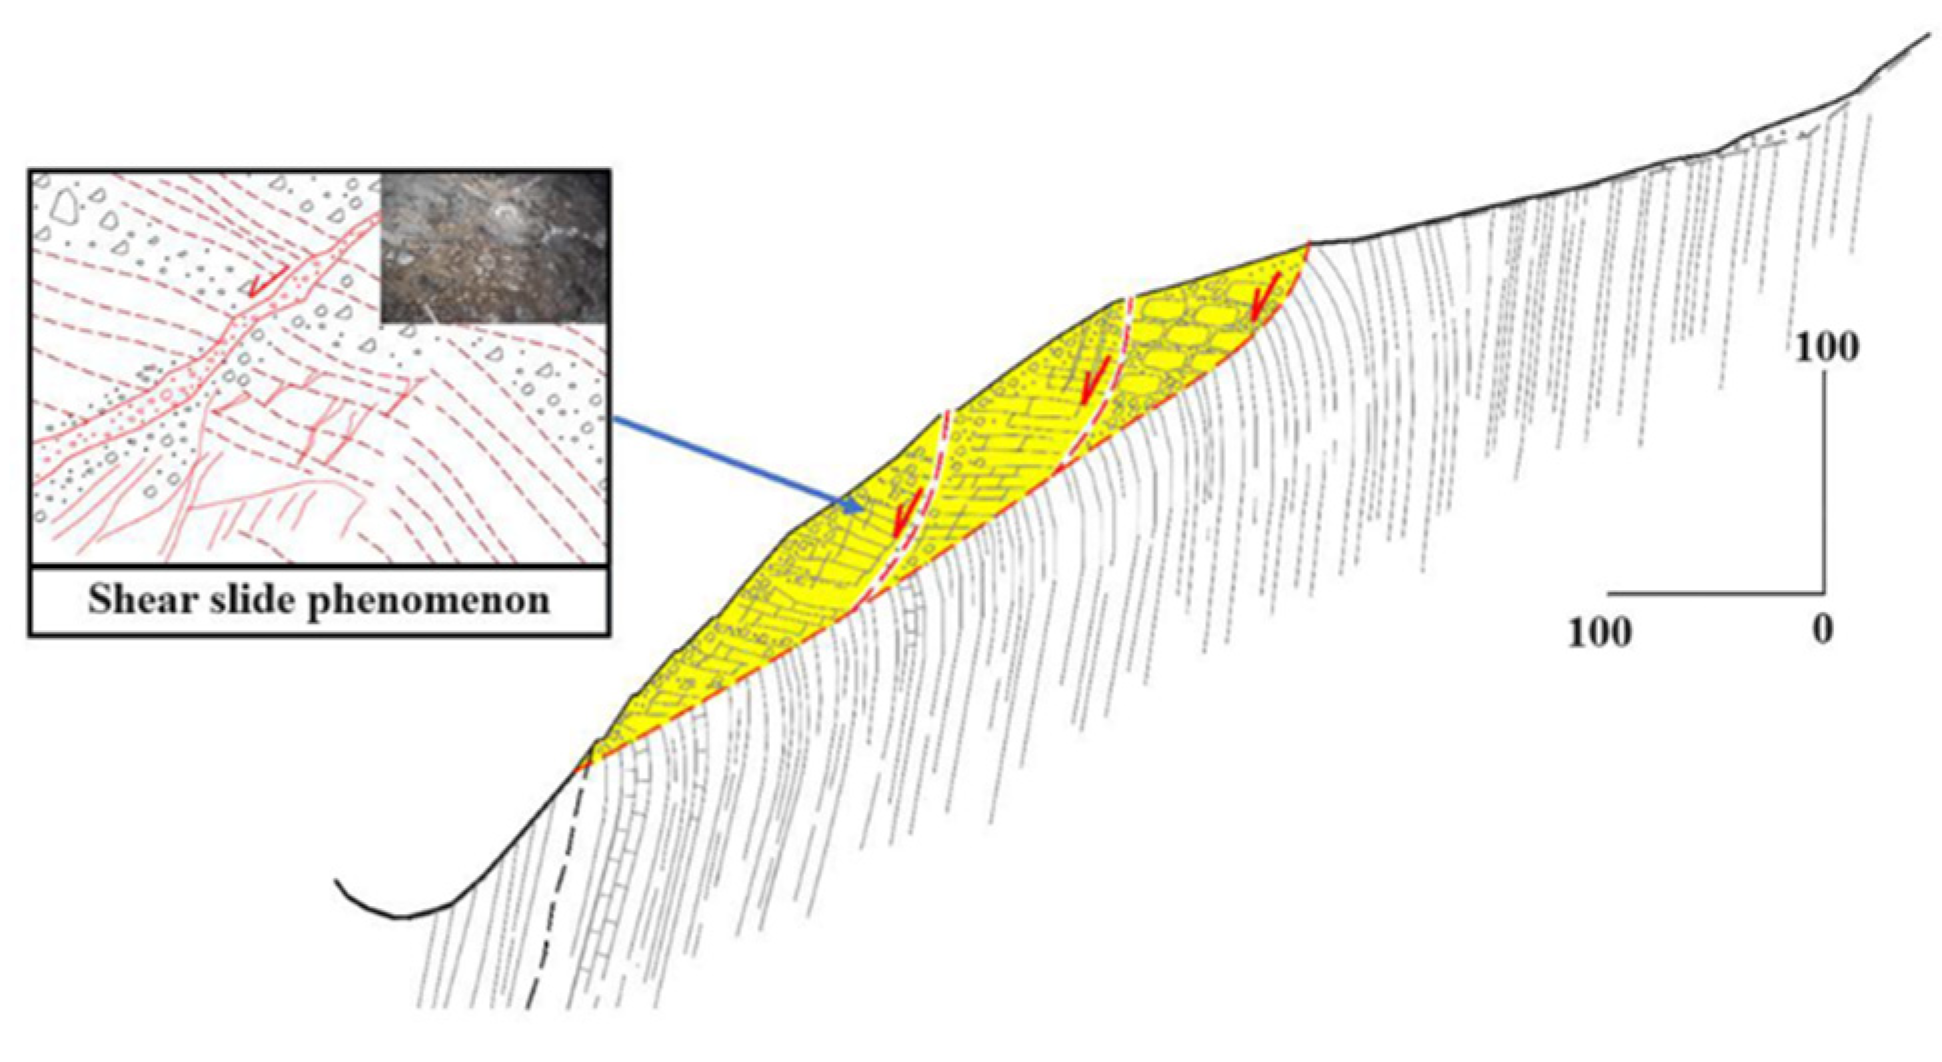
According to the adit investigation, as shown in Figure 30, it is also found that there are slide and fracturing deformation phenomena in a certain range of the slope, forming a toppling deformation failure zone. An early study revealed a “slip-toppling deformation” failure mode in the steep and toppling rock slope [13], but it did not carry out in-depth research. This paper studied the development distribution, boundary conditions, deformation and failure characteristics and rock mass structure of the toppling deformable body, and put forward that the deformation and failure modes of the steep toppling bedding rock slope induced by water level variation are due to shear dislocation, bending deformation and toppling fracture.

6. Conclusions

This research focused on a steep and toppling bedding rock slope near the dam area of the Longtou Hydropower Station in the Baishuijiang River basin. Combining field investigation and monitoring data with Geostudio numerical simulation, we explored the deformation mechanisms under water level variations. The specific conclusions are as follows:
(1)
Water level variation significantly impacts the deformation of the steep toppling bedding rock slope. Regardless of whether the water level increases or decreases, the slope deformation intensifies. Notably, the decrease in the water level has a more pronounced influence on the slope deformation, with a greater increase in the overall deformation and deformation rate.
(2)
By analyzing the dynamic characteristics of the groundwater seepage field, as well as the strength test under saturation and dry and wet cycling under different rise and decrease rates of the reservoir water level, it is revealed that the increase and decrease in the water level change the range of the seepage line and hydraulic gradient in the slope, and deteriorate the strength of the rock mass, which accelerates the process of slope creep fracture and bending and toppling.
(3)
The research shows that the evolution process of slope toppling deformation is divided into the following three stages: the unloading rebound stage, toppling creep stage and partial fracture stage. Based on the analyses of the deformation boundary, rock mass structure and deformation and failure characteristics, the deformation and failure modes are summarized as the shear dislocation, bending deformation fracture and toppling fracture.

Author Contributions

Investigation, S.C., X.L. and M.C.; Methodology, T.L.; Software, J.G.; Supervision, X.P.; Writing—original draft, K.W.; Writing—review and editing, T.L. and W.R. All authors have read and agreed to the published version of the manuscript.

Funding

This research was funded by the National Natural Science Foundation of China (grant number 42377194), the Sichuan Science and Technology Program (grant number 2023NSFSC0282), the Sichuan Province Central Government Guides Local Science and Technology Development Special Project (grant number 2023ZYD0151) and the State Key Laboratory of Geohazard Prevention and Geo-environment Protection Independent Research Project (SKLGP2021Z008). And The APC was funded by the Sichuan Science and Technology Program (grant number 2023NSFSC0282).

Data Availability Statement

Some or all of the data, models or code that support the findings of this study are available from the corresponding author upon reasonable request.

Acknowledgments

The authors would like to express their sincere gratitude to all the fundings for their financial support of this project.

Conflicts of Interest

Author Kaihong Wei was employed by the company Chengdu Engineering Corporation Limited. The remaining authors declare that the research was conducted in the absence of any commercial or financial relationships that could be construed as a potential conflict of interest.

References

  1. Li, W. Study on the influence of water level rise and fall on the stability of dumping deformation based on numerical simulation. Henan Water Conserv. South-North Water Divers. 2022, 51, 86–87. (In Chinese) [Google Scholar]
  2. Miao, F.; Wu, Y.; Török, Á.; Li, L.; Xue, Y. Centrifugal model test on a riverine landslide in the Three Gorges Reservoir induced by rainfall and water level fluctuation. Geosci. Front. 2022, 13, 101378. [Google Scholar] [CrossRef]
  3. Chen, M.; Zheng, G.; Liu, Z.-D.; Liu, J.-J.; Lu, H.-Y. Study on the relationship between dumping deformation pattern and macro deformation characteristics of anti-dip stratiform rocky slope. Eng. Sci. Technol. 2024. (In Chinese) [Google Scholar] [CrossRef]
  4. Dong, M.; Zhang, F.; Lv, J.; Hu, M.; Li, Z. Study on deformation and failure law of soft-hard rock interbedding toppling slope base on similar test. Bull. Eng. Geol. Environ. 2020, 79, 4625–4637. [Google Scholar] [CrossRef]
  5. Hou, T.-S.; Xu, G.-L.; Zhang, D.-Q.; Liu, H.-Y. Stability analysis of Gongjiacun landslide in the three Gorges Reservoir area under the action of reservoir water level fluctuation and rainfall. Nat. Hazards 2022, 114, 1647–1683. [Google Scholar] [CrossRef]
  6. Chen, Q. Numerical Simulation Study on the Failure Mechanism of Dumping Deformation of Steeply Dipping Rocky Slope. Master’s Thesis, Chengdu University of Technology, Chengdu, China, 2011. (In Chinese). [Google Scholar]
  7. Dai, Z.; Zhang, L.; Wang, Y.; Jiang, Z.; Xu, S. Deformation and failure response characteristics and stability analysis of bedding rock slope after underground adverse slope mining. Bull. Eng. Geol. Environ. 2021, 80, 4405–4422. [Google Scholar] [CrossRef]
  8. Chi, E.A.; Tao, T.J.; Zhao, M.S.; Kang, Q. Failure Mode Analysis of Bedding Rock Slope Affected by Rock Mass Structural Plane. Appl. Mech. Mater. 2014, 602–605, 594–597. [Google Scholar] [CrossRef]
  9. Jiang, Z.; Wang, H.; Xie, W. Deformation mechanism of deposit landslide induced by fluctuations of reservoir water level based on physical model tests. Environ. Earth Sci. 2021, 80, 410. [Google Scholar] [CrossRef]
  10. Li, Y.; Wang, S.P.; Zhang, Z.H.; Li, S.J. Study on the Relationship between Factor of Safety and Angle of Dip of Bedding Rock Slope when Exposed to Reservoir Water Level Fluctuation. Adv. Mater. Res. 2012, 446–449, 3894–3899. [Google Scholar] [CrossRef]
  11. Bu, L.; Xu, T.; Zhang, Y.J.; Xu, Q. Stability Analysis of Steep Bedding Rock Slope with Strength Reduction Method. Appl. Mech. Mater. 2014, 501–504, 399–402. [Google Scholar] [CrossRef]
  12. Ren, G.; Xia, M.; Li, G.; Liu, C.; Zhang, F.-R. Study on the deformation and failure characteristics of steeply dipping rocky slopes. Rock Mech. Eng. 2009, 28 (Suppl. 1), 3193–3200. (In Chinese) [Google Scholar]
  13. Ren, G.; Xia, M.; Zeng, Q.; Jia, Y.; Lv, S.-D.; Lu, D.-L.; Liu, R.-Q.; Zhao, H.-Y.; Gou, F.-M. Characteristics and formation mechanism of typical slide-dump landslides in the main stream of Bailongjiang River. J. Chengdu Univ. Technol. (Nat. Sci. Ed.) 2015, 42, 18–25. (In Chinese) [Google Scholar]
  14. Wang, R.; Zheng, Y.; Chen, C.; Zhang, W.; Sun, C. Stability Analysis of Antidip Bedding Rock Slopes with Very Low-Persistent Cross Joints Using a Limit-Equilibrium Model and Fracture Mechanics. Int. J. Geomech. 2023, 23, 04023039. [Google Scholar] [CrossRef]
  15. Wang, R.; Zheng, Y.; Chen, C.; Zhang, W. Theoretical and numerical analysis of flexural toppling failure in soft-hard interbedded anti-dip rock slopes. Eng. Geol. 2023, 312, 106923. [Google Scholar] [CrossRef]
  16. Xiong, X.; Shi, Z.; Xiong, Y.; Peng, M.; Ma, X.; Zhang, F. Unsaturated slope stability around the Three Gorges Reservoir under various combinations of rainfall and water level fluctuation. Eng. Geol. 2019, 261, 105231. [Google Scholar] [CrossRef]
  17. Cao, Z.; Tang, J.; Zhao, X.; Zhang, Y.; Wang, B.; Li, L.; Guo, F. Failure Mechanism of Colluvial Landslide Influenced by the Water Level Change in the Three Gorges Reservoir Area. Geofluids 2021, 2021, 6865129. [Google Scholar] [CrossRef]
  18. Fu, W.; Zhang, J.; Zhan, Y. Study on failure mechanism and stability of soil slope on reservoir bank under water level rise and fall. Subgrade Eng. 2021, 6, 43–47. (In Chinese) [Google Scholar] [CrossRef]
  19. Hu, X.; Tang, H.; Li, C.; Sun, R. Stability of Huangtupo riverside slumping mass II# under water level fluctuation of Three Gorges Reservoir. J. Earth Sci. 2012, 23, 326–334. [Google Scholar] [CrossRef]
  20. Shoaib, M.; Yang, W.; Liang, Y.; Rehman, G. Stability and Deformation Analysis of Landslide under Coupling Effect of Rainfall and Reservoir Drawdown. Civ. Eng. J. 2021, 7, 1098–1111. [Google Scholar] [CrossRef]
  21. Ou, M. Research on the influence of rapid rise and fall of water level on the stability of earth dam. Hydraul. Sci. Cold Zone Eng. 2022, 5, 11–14. (In Chinese) [Google Scholar]
  22. Pang, L.; Li, C.; Liu, D.; Zhang, F.; Chen, B. Response of Guobu Slope Displacement to Rainfall and Reservoir Water Level with Time-Series InSAR and Wavelet Analysis. Appl. Sci. 2023, 13, 5141. [Google Scholar] [CrossRef]
  23. Xu, P.; Chen, J.; Huang, R.; Yan, M. Discussion on the deformation mechanism of Jiefanggou anti-dipping high slope of Jinping Hydropower Station. J. Eng. Geol. 2004, 12, 247–252. (In Chinese) [Google Scholar]
  24. Xu, W.; Wang, L.; Hu, R. Flow-solid interaction characteristics and stability analysis of large soil-rock mixed slope under the action of reservoir water level rise. Chin. J. Rock Mech. Eng. 2009, 28, 1491–1498. (In Chinese) [Google Scholar]
  25. Yang, B.; Yin, K.; Xiao, T.; Chen, L.; Du, J. Annual variation of landslide stability under the effect of water level fluctuation and rainfall in the Three Gorges Reservoir, China. Environ. Earth Sci. 2017, 76, 564. [Google Scholar] [CrossRef]
  26. Yang, H.; Song, K.; Chen, L.; Qu, L. Hysteresis effect and seasonal step-like creep deformation of the Jiuxianping landslide in the Three Gorges Reservoir region. Eng. Geol. 2023, 317, 107089. [Google Scholar] [CrossRef]
  27. Yang, Z.; Xi, W.; Yang, Z.; Shi, Z.; Huang, G.; Guo, J.; Yang, D. Time-Lag Response of Landslide to Reservoir Water Level Fluctuations during the Storage Period: A Case Study of Baihetan Reservoir. Water 2023, 15, 2732. [Google Scholar] [CrossRef]
  28. Zhang, Y.; Zhang, Z.; Xue, S.; Wang, R.; Xiao, M. Stability analysis of a typical landslide mass in the Three Gorges Reservoir under varying reservoir water levels. Environ. Earth Sci. 2020, 79, 243–254. [Google Scholar] [CrossRef]
  29. Jadid, R.; Montoya, B.M.; Bennett, V.; Gabr, M.A. Effect of repeated rise and fall of water level on seepage-induced deformation and related stability analysis of Princeville levee. Eng. Geol. 2020, 266, 105458. [Google Scholar] [CrossRef]
  30. Liao, K.; Wu, Y.; Miao, F. System reliability analysis of landslides subjected to fluctuation of reservoir water level: A case study in the Three Gorges Reservoir area, China. Bull. Eng. Geol. Environ. 2022, 81, 225. [Google Scholar] [CrossRef]
  31. Liu, H.; Li, Y.; Chen, L. Mechanism of difference in motion mode in the northern and southern sections of the Huya fault zone on the eastern margin of the Tibetan Plateau: Constraints from numerical simulation. Chin. J. Geophys. 2023, 66, 2757–2771. (In Chinese) [Google Scholar]
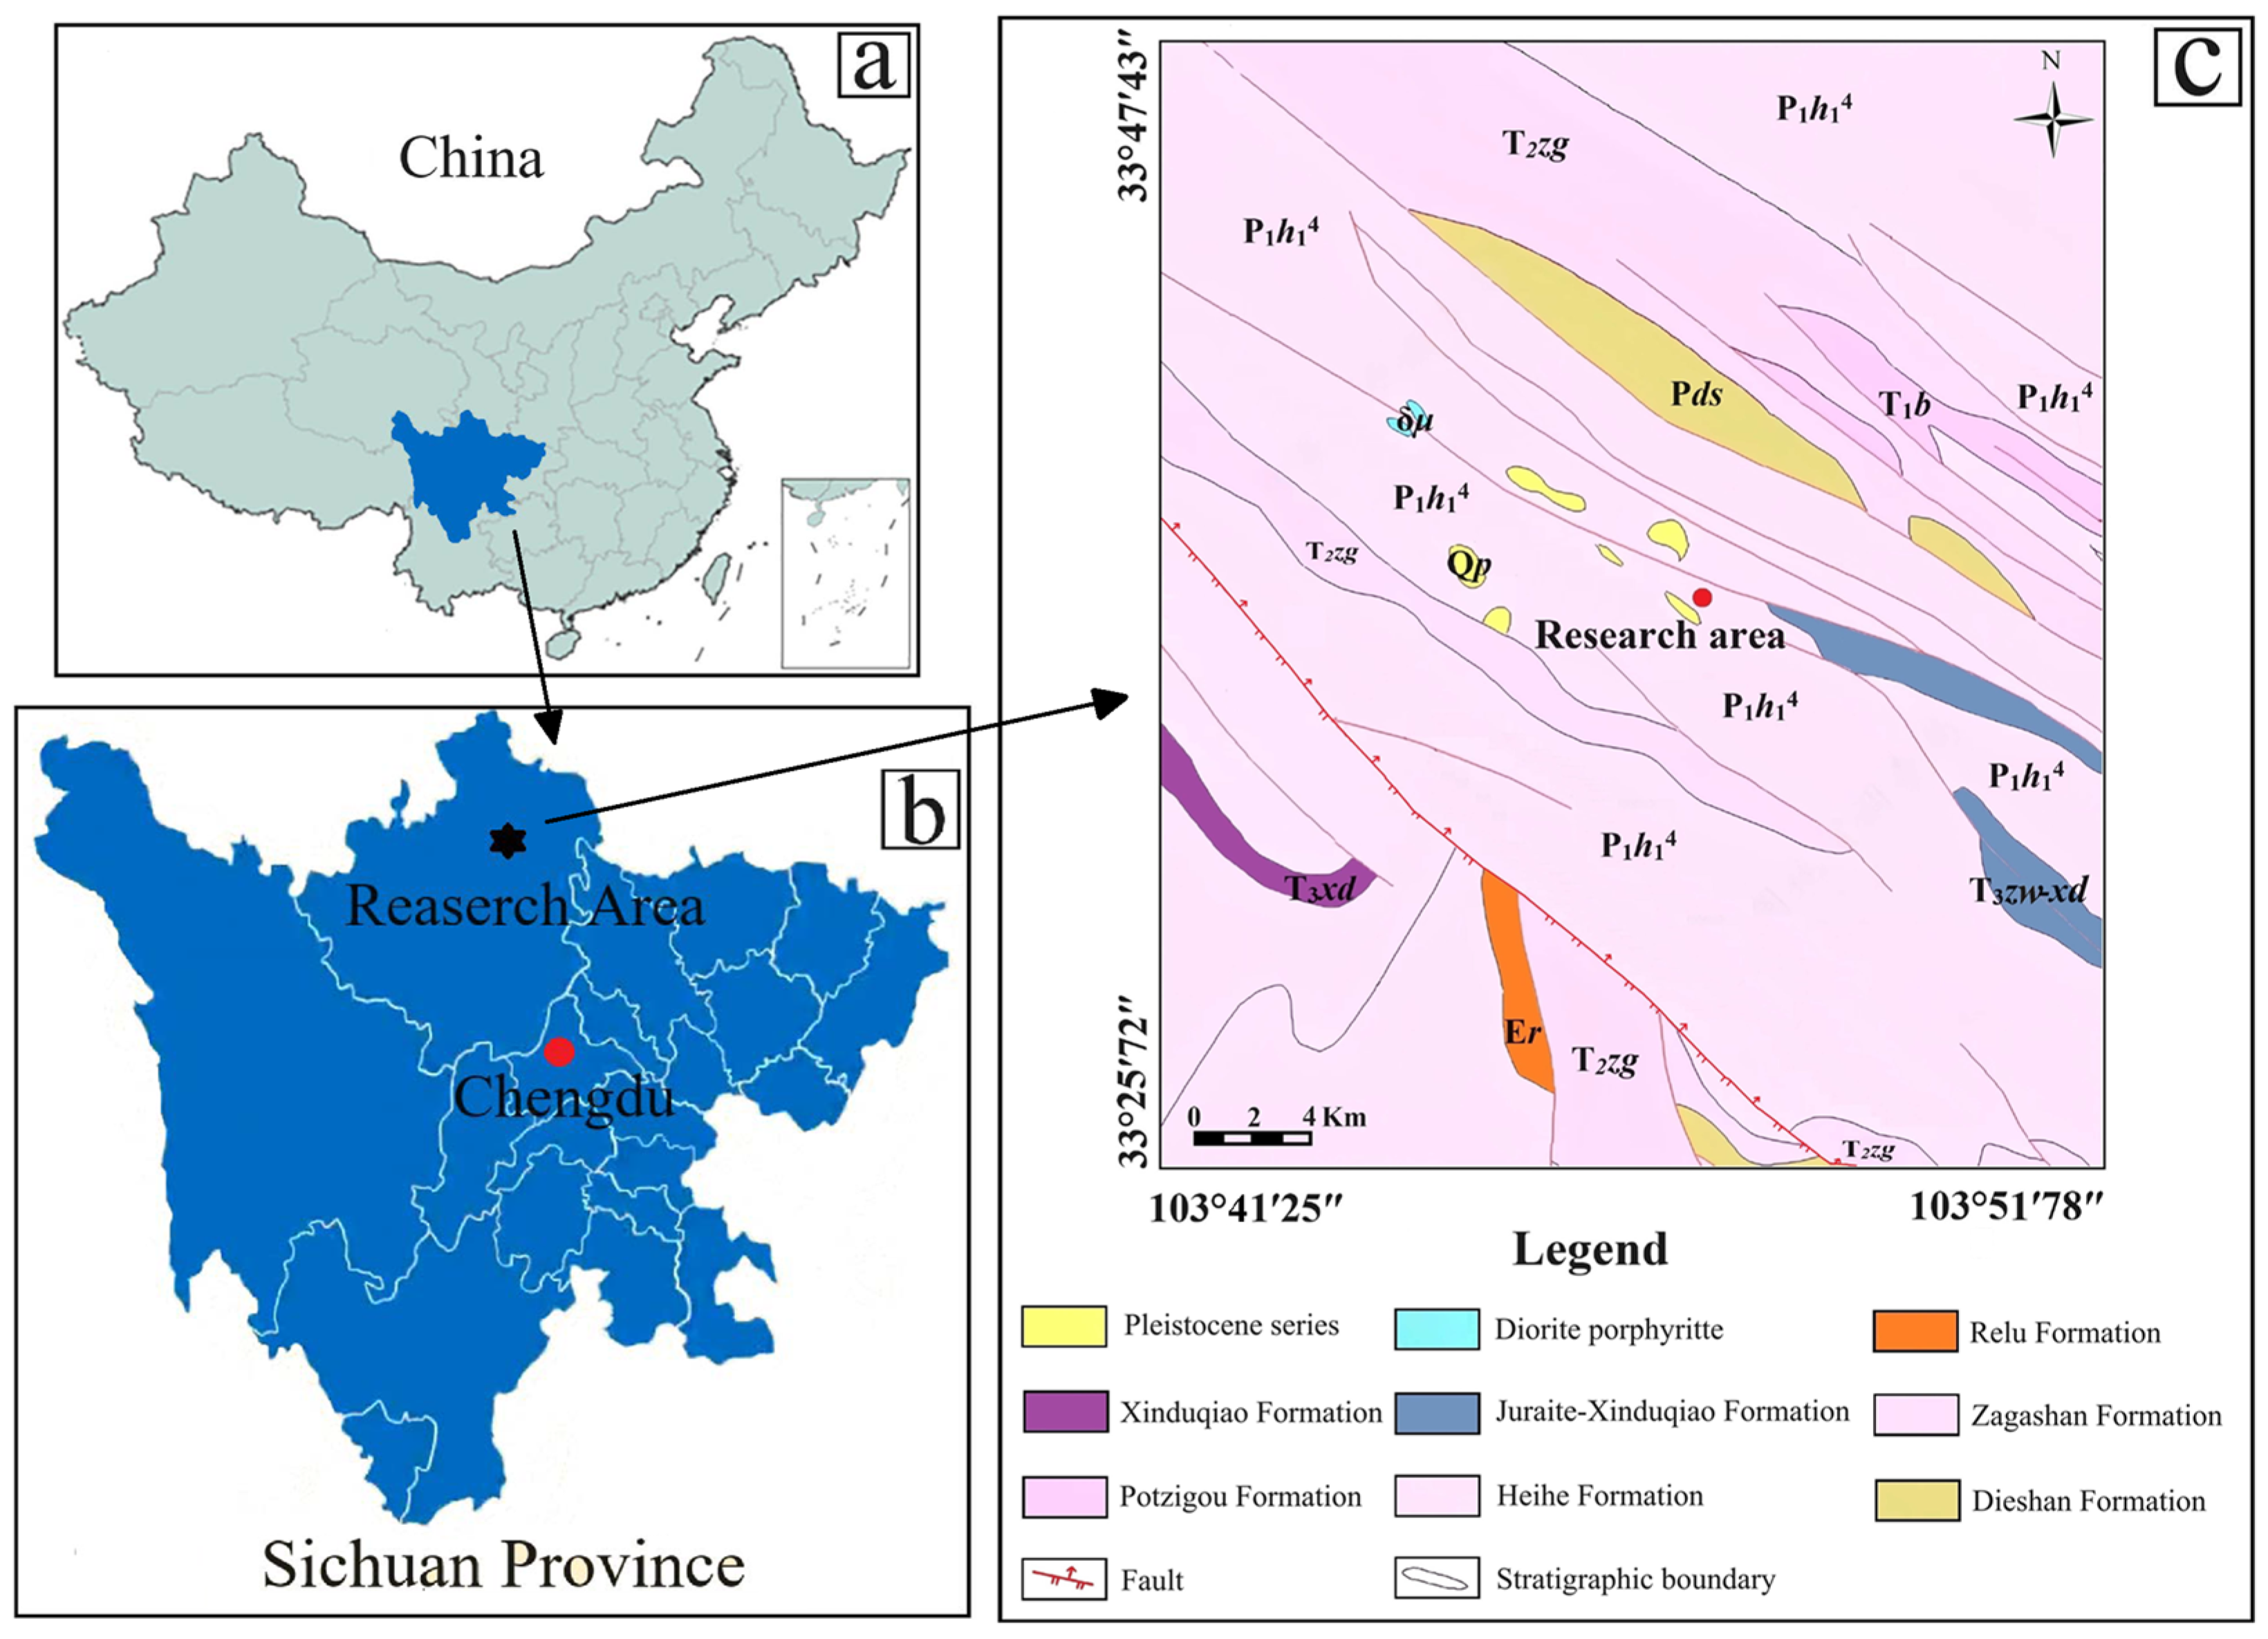
Figure 1. Location and regional geological map of the research area: (a) Map of China; (b) Map of Sichuan Province; (c) The regional geological map.
Water 16 02706 g001
Figure 2. Engineering geological plan.
Water 16 02706 g002
Figure 3. Slope panoramic picture.
Water 16 02706 g003
Figure 4. Engineering geological profile of typical section 1–1’.
Water 16 02706 g004
Figure 5. Sketch of the 1–1 adit.
Water 16 02706 g005
Figure 6. Sketch of the 1–2 adit.
Water 16 02706 g006
Figure 7. Relationship of rock mass toppling deformation with the dip angle and horizontal depth.
Water 16 02706 g007
Figure 8. The toppling deformation degree (with the increase in the toppling deformation degree, the deformable body is divided into the normal rock mass, the toppling zone, the strong toppling–weak loosening fracture zone and the strong toppling–loosening fracture zone).
Water 16 02706 g008
Figure 9. Zoning map of the slope. The slope is divided into 3 zones: zone II has 3 small zones and zone III has 2 small zones.
Water 16 02706 g009
Figure 10. Monitoring point layout.
Water 16 02706 g010
Figure 11. Displacement curve from 1 March 2013 to 1 September 2014.
Water 16 02706 g011
Figure 12. Cumulative displacement from 1 March 2013 to 1 September 2014.
Water 16 02706 g012
Figure 13. Displacement rate from 1 March 2013 to 1 September 2014.
Water 16 02706 g013
Figure 14. Displacement curve from 1 September 2014 to 1 September 2021.
Water 16 02706 g014
Figure 15. Cumulative displacement from 1 September 2014 to 1 September 2021.
Water 16 02706 g015
Figure 16. Displacement rate from 1 September 2014 to 1 September 2016.
Water 16 02706 g016
Figure 17. Slope deformation zone (according to the cumulative displacement, the slope is divided into 5 zones, and they are similar to the engineering geological zoning).
Water 16 02706 g017
Figure 18. Displacement vector: (a) Before the first stage of water storage; (b) Stage I water storage to stage II water storage; (c) After the second stage of water storage. The red arrow means the maximum displacement, and the blue arrow means the minimum displacement.
Water 16 02706 g018
Figure 19. Rock deterioration curve under the saturation state: (a) Cohesion and friction angle of the fault fracture zone and strong toppling–loosening zone; (b) Cohesion and friction angle of the normal rock mass.
Water 16 02706 g019
Figure 20. Rock deterioration curve under the dry–wet cycle state: (a) Cohesion and friction angles of the fault fracture zone and strong toppling–loosening zone; (b) Cohesion and friction angle of the normal rock mass.
Water 16 02706 g020
Figure 21. Computational model.
Water 16 02706 g021
Figure 22. Volumetric water content and hydraulic conductivity: A: avalanche deposit; B: sand soil layer; C: strong toppling–loosening fracture zone; D: strong toppling–weak loosening fracture zone; E: toppling zone; F: fault-affected zone; G: interbedded sandstone and slate; H: slate.
Water 16 02706 g022
Figure 23. Seepage field and seepage curve with different rates of water level increase: (a) Water level increases at a rate of 0.4 m/d; (b) Water level increases at a rate of 0.8 m/d; (c) Water level increases at a rate of 1.6 m/d; (d) Seepage curve at different rates of water level increase.
Water 16 02706 g023
Figure 24. Seepage field and seepage curve with different rates of water level decrease: (a) Water level decreases at a rate of 0.4 m/d; (b) Water level decreases at a rate of 0.8 m/d; (c) Water level decreases at a rate of 1.6 m/d; (d) Seepage curve at different rates of water level decrease.
Water 16 02706 g024
Figure 25. Zones in the model (the model is divided into the saturation area, fault, water-level-variation area and above-water area).
Water 16 02706 g025
Figure 26. Results under a single time of reservoir water level variation: (a) Displacement result; (b) Displacement vector and plastic deformation.
Water 16 02706 g026
Figure 27. Results under five times of reservoir water level variations: (a). Displacement result; (b) Displacement vector and plastic deformation.
Water 16 02706 g027
Figure 28. The deformation response process of the water level variation: (a) The steep bedding rock mass topples and deforms due to the downward cutting of the valley and the unloading rebound in the early stage; (b) The reservoir water level variation leads to the deterioration of the rock mass, and the rock stratum at the toe of the slope will creep; (c) The strong toppling rock mass at the rear of the slope further topples and deforms, and the shear slide occurs in the middle and lower parts of the slope. The slope toppling deformation is aggravated by the development and evolution of tensile cracks in the rock mass.
Water 16 02706 g028
Figure 29. The evolutionary stages of the deformable body: (a). Unloading rebound stage; (b) Toppling creep stage; (c) Partial fracture stage.
Water 16 02706 g029
Figure 30. The slide and fracturing deformation phenomena. The arrows mean the direction of slip.
Water 16 02706 g030
Table 1. Distribution characteristics of the slope cracks.
NumberLength (m)Width (m)Depth (m)Platform Height (m)ShapeStrike Angle
1252 × 10−2
3 × 10⁻²
1 × 10−11 × 10−2
2 × 10⁻²
Dentation10–20° NW
2303 × 10−3
5 × 10⁻³
Les than
1 × 10⁻²
30° NW
3552 × 10−1
3 × 10⁻¹
1–23 × 10−1
4 × 10⁻¹
Dentation50° NW
4110SN-50° NW
5902 × 10−1
3 × 10⁻¹
32 × 10−2
5 × 10⁻²
Dentation and wavy13° NW-SN
61402 × 10−1
5 × 10⁻¹
32 × 10−2
5 × 10⁻²
Dentation
7295 × 10−21 × 10−1
2 × 10⁻¹
50–80° NW
Table 2. Calculation parameters of the slope structural plane: A: avalanche deposit; B: sand soil layer; C: strong toppling–loosening fracture zone; D: strong toppling–weak loosening fracture zone; E: toppling zone; F: fault-affected zone; G: interbedded sandstone and slate; H: slate.
CategoryABCDEFGH
Osmotic
coefficient (m/s)
3 × 10−53 × 10−56 × 10−63 × 10−61 × 10−63 × 10−69 × 10−91 × 10−8
Saturated water content (%)6060141516161518
Density (g/cm3)2.142.517.652.512.52.392.52.39
Poisson’s ratio0.330.250.350.330.330.330.250.24
Cohesion
(×10 kPa)
007.52027104340
Frictional angle (°)2842.526.528.52926.54140
Elasticity modulus (×106 kPa)0.150.350.7510.356.55
Table 3. Analog rate of change (m/day).
Water Level FluctuationV1 (m/day)V2 (m/day)V3 (m/day)
2320–2370 (rise)0.40.81.6
2370–2320 (decrease)0.40.81.6
Table 4. Physical and mechanical parameters: C: strong toppling–loosening fracture zone; D: strong toppling–weak loosening fracture zone; E: toppling zone; F: fault-affected zone; I: river bed deposit; J: strong unloading rock mass; K: weak unloading rock mass; L: normal rock mass.
CategoryDensity
(g/cm3)
Deformation Modulus
(×105 kPa)
Poisson’s RateCohesion
(×10 kPa)
Frictional Angle
(°)
I2.110.35028
C2.353.50.357.526.5
D2.457.50.352028.5
E2.45150.32829
J2.45200.353837
K2.45400.32832
F2.353.50.351026.5
L2.45650.254242
Table 5. Parameters under water level variations: C: strong toppling–loosening fracture zone; D: strong toppling–weak loosening fracture zone; E: toppling zone; F: fault-affected zone; L: normal rock mass.
CategoryWater Level Variation Cycles12345
LElasticity modulus (×106 kPa)6.505.755.405.014.81
Viscoelasticity modulus (×106 kPa)10.899.639.048.408.05
Poisson’s rate0.300.310.310.310.31
Cohesion
(kPa)
252202177160150
Frictional angle
(°)
39.037.937.337.036.8
FElasticity modulus (×106 kPa)0.350.300.290.270.25
Viscoelasticity modulus (×106 kPa)0.590.510.480.460.43
Poisson’s rate0.380.390.390.390.39
Cohesion
(kPa)
6048423836
Frictional angle
(°)
24.223.322.922.722.5
EElasticity modulus (×106 kPa)1.51.321.241.160.63
Viscoelasticity modulus (×106 kPa)2.452.162.031.891.03
Poisson’s rate0.340.350.350.350.35
Cohesion
(kPa)
168134118106100
Frictional angle
(°)
26.525.625.124.924.7
CElasticity modulus (×106 kPa)0.750.670.620.590.55
Viscoelasticity modulus (×106 kPa)1.191.060.980.930.88
Poisson’s rate0.380.390.390.390.39
Cohesion
(kPa)
1501201069589
Frictional angle
(°)
26.025.124.724.524.3
DElasticity modulus (×106 kPa)0.350.300.290.270.25
Viscoelasticity modulus (×106 kPa)0.590.510.480.460.43
Poisson’s rate0.380.390.390.390.39
Cohesion
(kPa)
450360317285268
Frictional angle
(°)
24.223.322.922.722.5
Disclaimer/Publisher’s Note: The statements, opinions and data contained in all publications are solely those of the individual author(s) and contributor(s) and not of MDPI and/or the editor(s). MDPI and/or the editor(s) disclaim responsibility for any injury to people or property resulting from any ideas, methods, instructions or products referred to in the content.