Article

Optimization of Secondary Chlorination in Water Distribution Systems for Enhanced Disinfection and Reduced Chlorine Odor Using Deep Belief Network and NSGA-II

by
Bo Dong
1,2,
Shihu Shu
1 and
Dengxin Li
1,*
1
College of Environmental Science and Engineering, State Environmental Protection Engineering Center for Pollution Treatment and Control in Textile Industry, Donghua University, Shanghai 201620, China
2
Chuzhou Vocational and Technical College, Chuzhou 239000, China
*
Author to whom correspondence should be addressed.
Water 2024, 16(18), 2666; https://doi.org/10.3390/w16182666
Submission received: 13 August 2024 / Revised: 15 September 2024 / Accepted: 18 September 2024 / Published: 19 September 2024
(This article belongs to the Section Urban Water Management)

Abstract

:
This research explores the strategic optimization of secondary chlorination in water distribution systems (WDSs), in order to enhance the efficiency of disinfection while mitigating odor and operational costs and promoting sustainability in water quality management. The methodology integrates EPANET simulations for water hydraulic and quality modeling with a deep belief network (DBN) within the deep learning framework for accurate chloric odor prediction. Utilizing the non-dominated sorting genetic algorithm-II (NSGA-II), this methodology systematically balances the objectives of chloride dosage and chloramine formation. It combines a chloric odor intensity assessment, a multi-component kinetic model, and dual-objective optimization to conduct a comparative analysis of case studies on secondary chlorination strategies. The optimal configuration with five secondary chlorination stations reduced chloric odor intensity to 1.20 at a cost of USD 40,020.77 per year in Network A while, with eight stations, chloric odor intensity was reduced to 0.88 at a cost of USD 71,405.38 per year in Network B. The results demonstrate a balanced trade-off between odor intensity and operational cost on one hand and sustainability on the other hand, highlighting the importance of precise chlorine management to improve both the sensory and safety qualities of drinking water while ensuring the sustainable use and management of water resources.

1. Introduction

Maintaining adequate disinfectant residuals throughout water distribution systems (WDSs) is critical for controlling microbial growth and ensuring safety [1]. Chlorine has been historically significant: it has been applied for over a century due to its potent disinfectant properties. However, both excessive and insufficient chlorine dosing at treatment plants can lead to water quality issues. Overdosing results in uneven residual concentrations, with some areas experiencing elevated disinfectant levels that contribute to unpleasant tastes, odors, and the formation of disinfection by-products (DBPs) [2,3]. Conversely, underdosing leaves some zones with deficient chlorine, increasing the risk of contamination and potential public health concerns. In addition to these challenges, there is a growing emphasis on adopting sustainable practices in water management [4], which are essential for ensuring the availability and quality of water resources while minimizing environmental impacts. These practices involve using water efficiently, reducing waste, and protecting water sources from contamination to maintain a balance between human demands, ecosystem health, and economic viability. A critical aspect of sustainable water management is optimizing secondary chlorination in the actual process, which not only addresses disinfection and odor control but also promotes the efficient use of resources, reduces chemical consumption, and minimizes environmental impact.
In order to balance the chlorine residue concentration against the risk of contamination, ensuring that water remains potable from the treatment facility to the consumer’s tap, secondary chlorination serves as a critical barrier. However, optimizing secondary chlorination dosing and location within WDSs presents a complex challenge, as it requires balancing cost requirements with the formation of DBPs [5,6].
In response to these challenges, a combination of EPANET simulations for water hydraulic and quality modeling, along with multiple objective optimization algorithms, could enhance the efficiency of optimizing secondary chlorination processes. For instance, Goyal et al. integrated EPANET with particle swarm optimization (PSO) algorithms to determine the optimal location and mass rate of chlorine injection at booster stations, where minimizing chlorine dosage and reducing operational costs were presented as objective functions [7]. The method successfully demonstrated a cost reduction of about 30–33% in booster chlorination requirements. Geng et al. have explored the control of maximum water age based on total chlorine decay in secondary water supply systems, offering insights into managing chlorine levels to ensure both efficacy and safety [8]. Tabesh et al. combined EPANET with a genetic algorithm (GA) to optimize the dosage and placement of chlorine injection in WDSs, which minimized chlorine usage while ensuring the best locations were chosen for chlorine injection [9].
However, the odor issue is a critical problem in current water quality research due to increased demand from residents for high-quality drinking water and the risks posed by unpleasant odors. The relationship between residual chlorine concentration and chloric odor has been a significant focus of research, with empirical evidence supporting a positive correlation between them. Chloramines stand as a principal factor contributing to the presence of chloric odors in WDSs, with hypochlorous acid (HOCl) playing a significant role in this phenomenon. Characterized by a bleach-like odor, hypochlorous acid has an odor threshold of 0.28 mg-Cl2/L [10]. Additionally, the predominance of chloramine types is pH-dependent: monochloramine (NH2Cl) takes precedence in water with a pH ranging from 7 to 11; dichloramine (NHCl2) becomes more prevalent as the pH dips to 4.4–7; and trichloramine (NCl3) emerges as the dominant form when pH falls below 4.4. Each type of chloramine imparts a distinct swimming-pool-like odor, with odor thresholds of 0.65, 0.15, and 0.02 mg/L for monochloramine, dichloramine, and trichloramine, respectively, indicating their significant roles in intensifying chloric odors [11].
Monochloramine and dichloramine are usually the main contributors to chloric odor in WDSs, primarily due to the common pH levels in drinking water formed during the chlorination process, and can significantly impact sensory quality, leading to consumer dissatisfaction and potential health concerns. Therefore, developing and implementing an effective secondary chlorination strategy is crucial, as it could mitigate the formation of these odorous compounds, thereby avoiding unpleasant odors and ensuring a high-quality drinking water. Kim et al. discussed a two-component second-order decay model to predict residual chlorine, enabling more effective management of residual chlorine and addressing chloric odor concerns [12]. Ohar et al. have explored the use of booster disinfection to maintain disinfectant residuals at distant locations, which effectively prevents taste and odor problems associated with high disinfectant concentrations near the source and minimizes DBPs [13]. Wang et al. applied a hybrid PSO algorithm to find the optimal locations and maintain free chlorine residuals within a desirable range across WDSs, which mitigated taste and odor issues and prevented the formation of harmful DBPs [14].
The intersection of chloric odor detection and artificial intelligence (AI) is an evolving field that can assist in understanding and predicting odor properties, including those associated with chlorination, chloramines, and chloric odor in WDSs. Loutfi et al. presented a multi-sensing robotic system to discriminate different odors; this system offered insights into how AI can be applied to detect and differentiate between various odors, including potentially chloric odor, by training the system to recognize specific smell profiles [15]. Mao used back propagation (BP) neural networks to simulate odors, demonstrating AI’s potential to create smell profiles to predict various odors [11]. However, existing AI methods for managing chlorine odor in WDSs often fail to effectively balance odor control with the economic aspects of implementing booster chlorination facilities [3], leaving a crucial gap in current optimization strategies. Consequently, there is a need for advanced multi-objective optimization frameworks coupled with AI that can balance the trade-offs between mitigating chloric odor intensity and reducing the capital and operating costs associated with construction and operation of booster chlorination facilities.
Therefore, this study aims to synthesize a new insight from case studies and the existing literature to offer comprehensive guidance for water utilities on optimizing secondary chlorination. A multiple-objective-optimizing secondary chlorination method with EPANET and a deep learning framework that considers residual chlorine concentration and chloric odor and dosing locations are proposed. Our contributions include: (1) a water quality optimization model to balance chloric odor and minimize economic investment is presented; and (2) EPANET and a deep belief network (DBN) are integrated with the NSGA-II algorithm to simulate the distribution of chlorine, chloramines, and chloric odor intensity in WDSs.
The rest of this paper is organized as follows: Section 2 describes the methodology used to assess chloric odor intensity using a deep belief network (DBN) and to optimize secondary chlorination dosage and station placement with the NSGA-II algorithm. Section 3 focuses on detailed applications of the proposed methodology to two specific networks, illustrating the optimization process and the resulting improvements in chloric odor intensity and operational costs. In Section 4, we present the advantages and weaknesses of this method. Finally, in Section 5, conclusions are drawn.

2. Methods

2.1. Chloric Odor Intensity Assessment

Sensory water signature analysis (SWSA) assessment and the DBN model were utilized to determine levels of chloric odor. Initially, the intensity of the chloric odor was categorized into levels ranging from 0 to 8, with each level encompassing a specific range of intensities, as detailed in Table 1. The SWSA was employed to evaluate the intensity of the chloric odor, represented by Equation (1), where a higher SWSA level indicates a more unpleasant odor:
S W S A = i = 1 L l i L
where S W S A is the average odor intensity; l i is the odor intensity assessed by the i th expert; and L is the number of experts.

2.2. Chloric Odor Prediction

Aqueous samples with varying concentrations of chlorine, monochloramine, and dichloramine were prepared for evaluation through the SWSA. Following expert assessments, chloric odor intensity was designated as the output variable, whereas chlorine, monochloramine, and dichloramine were established as input variables. These relationships can be inferred using the DBN model, as discussed in [16]. The DBN was proposed by Hinton, and its concept originates from the restricted Boltzmann machine (RBM) model [17]. A DBN consists of several RBMs layered atop one another, creating a deep network structure, shown in Figure 1.
Before inputting data into the DBN model, it is essential to normalize all data, ensuring their values fall within the range [0, 1]. This normalization is achieved using Equation (2), providing a standardized framework for analysis:
y i = x i x m i n x m a x x m i n
where x i is the i th input variables containing concentrations of chlorine, monochloramine, and dichloramine; and y i is the i th output variable (the chloric odor intensity).
After the normalization process is completed, all the x i and y i variables are used as input and output variables, which are then trained using the DBN model, ultimately predicting the chloric odor levels. The details of the DBN model can be found in the Supplementary Materials.

2.3. Kinetic Models of Multiple Components

A kinetic model is presented to characterize the chemical reactions underpinning the chloramination process, specifically focusing on the formation of monochloramine and dichloramine, as illustrated in Figure 2. The kinetic model is constructed around several core reactions, including, initially, the reaction of ammonia with hypochlorous acid to yield monochloramine, as expressed in Equation (3):
d N H 2 C l d t = k 1 N H 3 H O C l + k 2 N H C l 2 + k 3 N H C l 2 N H 3 [ H ]
where k 1 , k 2 , and k 3 are rate constants for the formation of monochloramine; [ · ] represents the concentration of species.
The conversion of monochloramine to dichloramine upon further reaction with hypochlorous acid is expressed in Equation (4):
d [ N H C l 2 ] d t = k 4 N H 2 C l H O C l + k 5 N H 2 C l 2
where k 4 and k 5 are rate constants for the formation of dichloramine.
Additionally, the decay mechanisms of both chloramines are explored. The mathematical representation of these reactions provides a basis for simulating the behavior of chloramines. Reaction rates are described using a second-order kinetics reaction. The governing equations are Equations (5) and (6):
d N H 2 C l d t = k 4 N H 2 C l H O C L k 5 N H 2 C l 2 k 6 N H 2 C l k 7 N H 2 C l [ N H C l 2 ]
d N H C l 2 d t = k 2 N H C l 2 k 3 N H C l 2 N H 3 H k 7 N H 2 C l [ N H C l 2 ] k 8 N H C l 2 O H
where k 6 , k 7 , and k 8 are decay rates of monochloramine and dichloramine, respectively.
Hypochlorous acid formation and decay in WDSs can generally be modeled through first-order kinetics when considering reactions predominantly with inorganic constituents or simple bimolecular reactions with bulk organics under controlled conditions, expressed as Equation (7):
d H O C l d t = k 1 N H 3 H O C l + k 2 N H C l 2 k 4 N H 2 C l H O C L + k 6 N H 2 C l k b i o H O C l [ T O C ]
where k b i o is the bimolecular reaction rate constant.
The reaction process is represented through a series of ordinary differential equations within the EPANET-MSX modeling framework which are then coupled to the EPANET 2.2 platform to enable EPS simulation of the transport processes occurring across the WDS [18]. The parameter values employed were sourced from relevant experimental studies reported in the available literature [19], as summarized in Table 2.

2.4. Secondary Chlorination Dosage and Station Optimization

Following the prediction of chloric odor levels, the secondary chlorination optimizing process could be implemented. This optimization process encompassed a multi-objective strategy, focusing simultaneously on minimizing the intensity of chloric odor by adjusting chlorine dosages and secondary chlorination stations while minimizing the economic expenditures linked to the operational and maintenance activities of chlorination stations, which not only ensures effective disinfection but also promotes sustainable water management by minimizing chemical usage and reducing the environmental footprint of water treatment processes. The equations are expressed as Equations (8) and (9):
f 1 = i = 1 N t = 1 T I i , t N T
f 2 = M c 1 + c 2 i = 1 M t = 1 T Q i , t t m i , t
where I i , t is the odor intensity for node i at time t; N is the total number of nodes in a WDS; T is the total time during the extended period simulation (EPS) process; Q i , t is the flow rate of i th secondary chlorination station at time t; m i , t is the mass of chlorine dosage for i th secondary chlorination station at time t; M is the total number of secondary chlorination stations; and c 1 and c 2 are the cost of the secondary chlorination station construction and the material per unit of chlorine dosage during the total EPS time, respectively.
Additionally, two constraint conditions should be considered. These are expressed in Equations (10)–(12). It must also be ensured that the equation of continuity and the conservation of energy are obeyed.
m i , m i n m i m i , m a x
M m i n M M m a x
I m i n I i I m a x
where m i , m i n and m i , m a x are the minimum and maximum mass of chlorine dosages for i th secondary chlorination station, respectively; M m i n and M m a x are the minimum and maximum total number of secondary chlorination stations, respectively; and I m i n and I m a x are the minimum and maximum chloric odor intensity for i th secondary chlorination station, respectively.
The non-dominated sorting genetic algorithm-II (NSGA-II) algorithm is particularly suited for the multi-objective optimization problem because (1) it could handle multiple objectives without needing to convert them into a single objective [20]; (2) it is computationally efficient due to its fast non-dominated sorting approach and crowding distance calculation, allowing it to quickly converge [21]; and (3) NSGA-II is highly flexible and can be easily adapted to different types of optimization problems with multiple objectives, decision variables, and constraints, which is crucial for modeling complex systems like WDSs [22,23,24]. Thus, this dual-target optimization model employs the advanced decision-making framework, the NSGA-II, to effectively address this multiple-objective optimization issue [25].
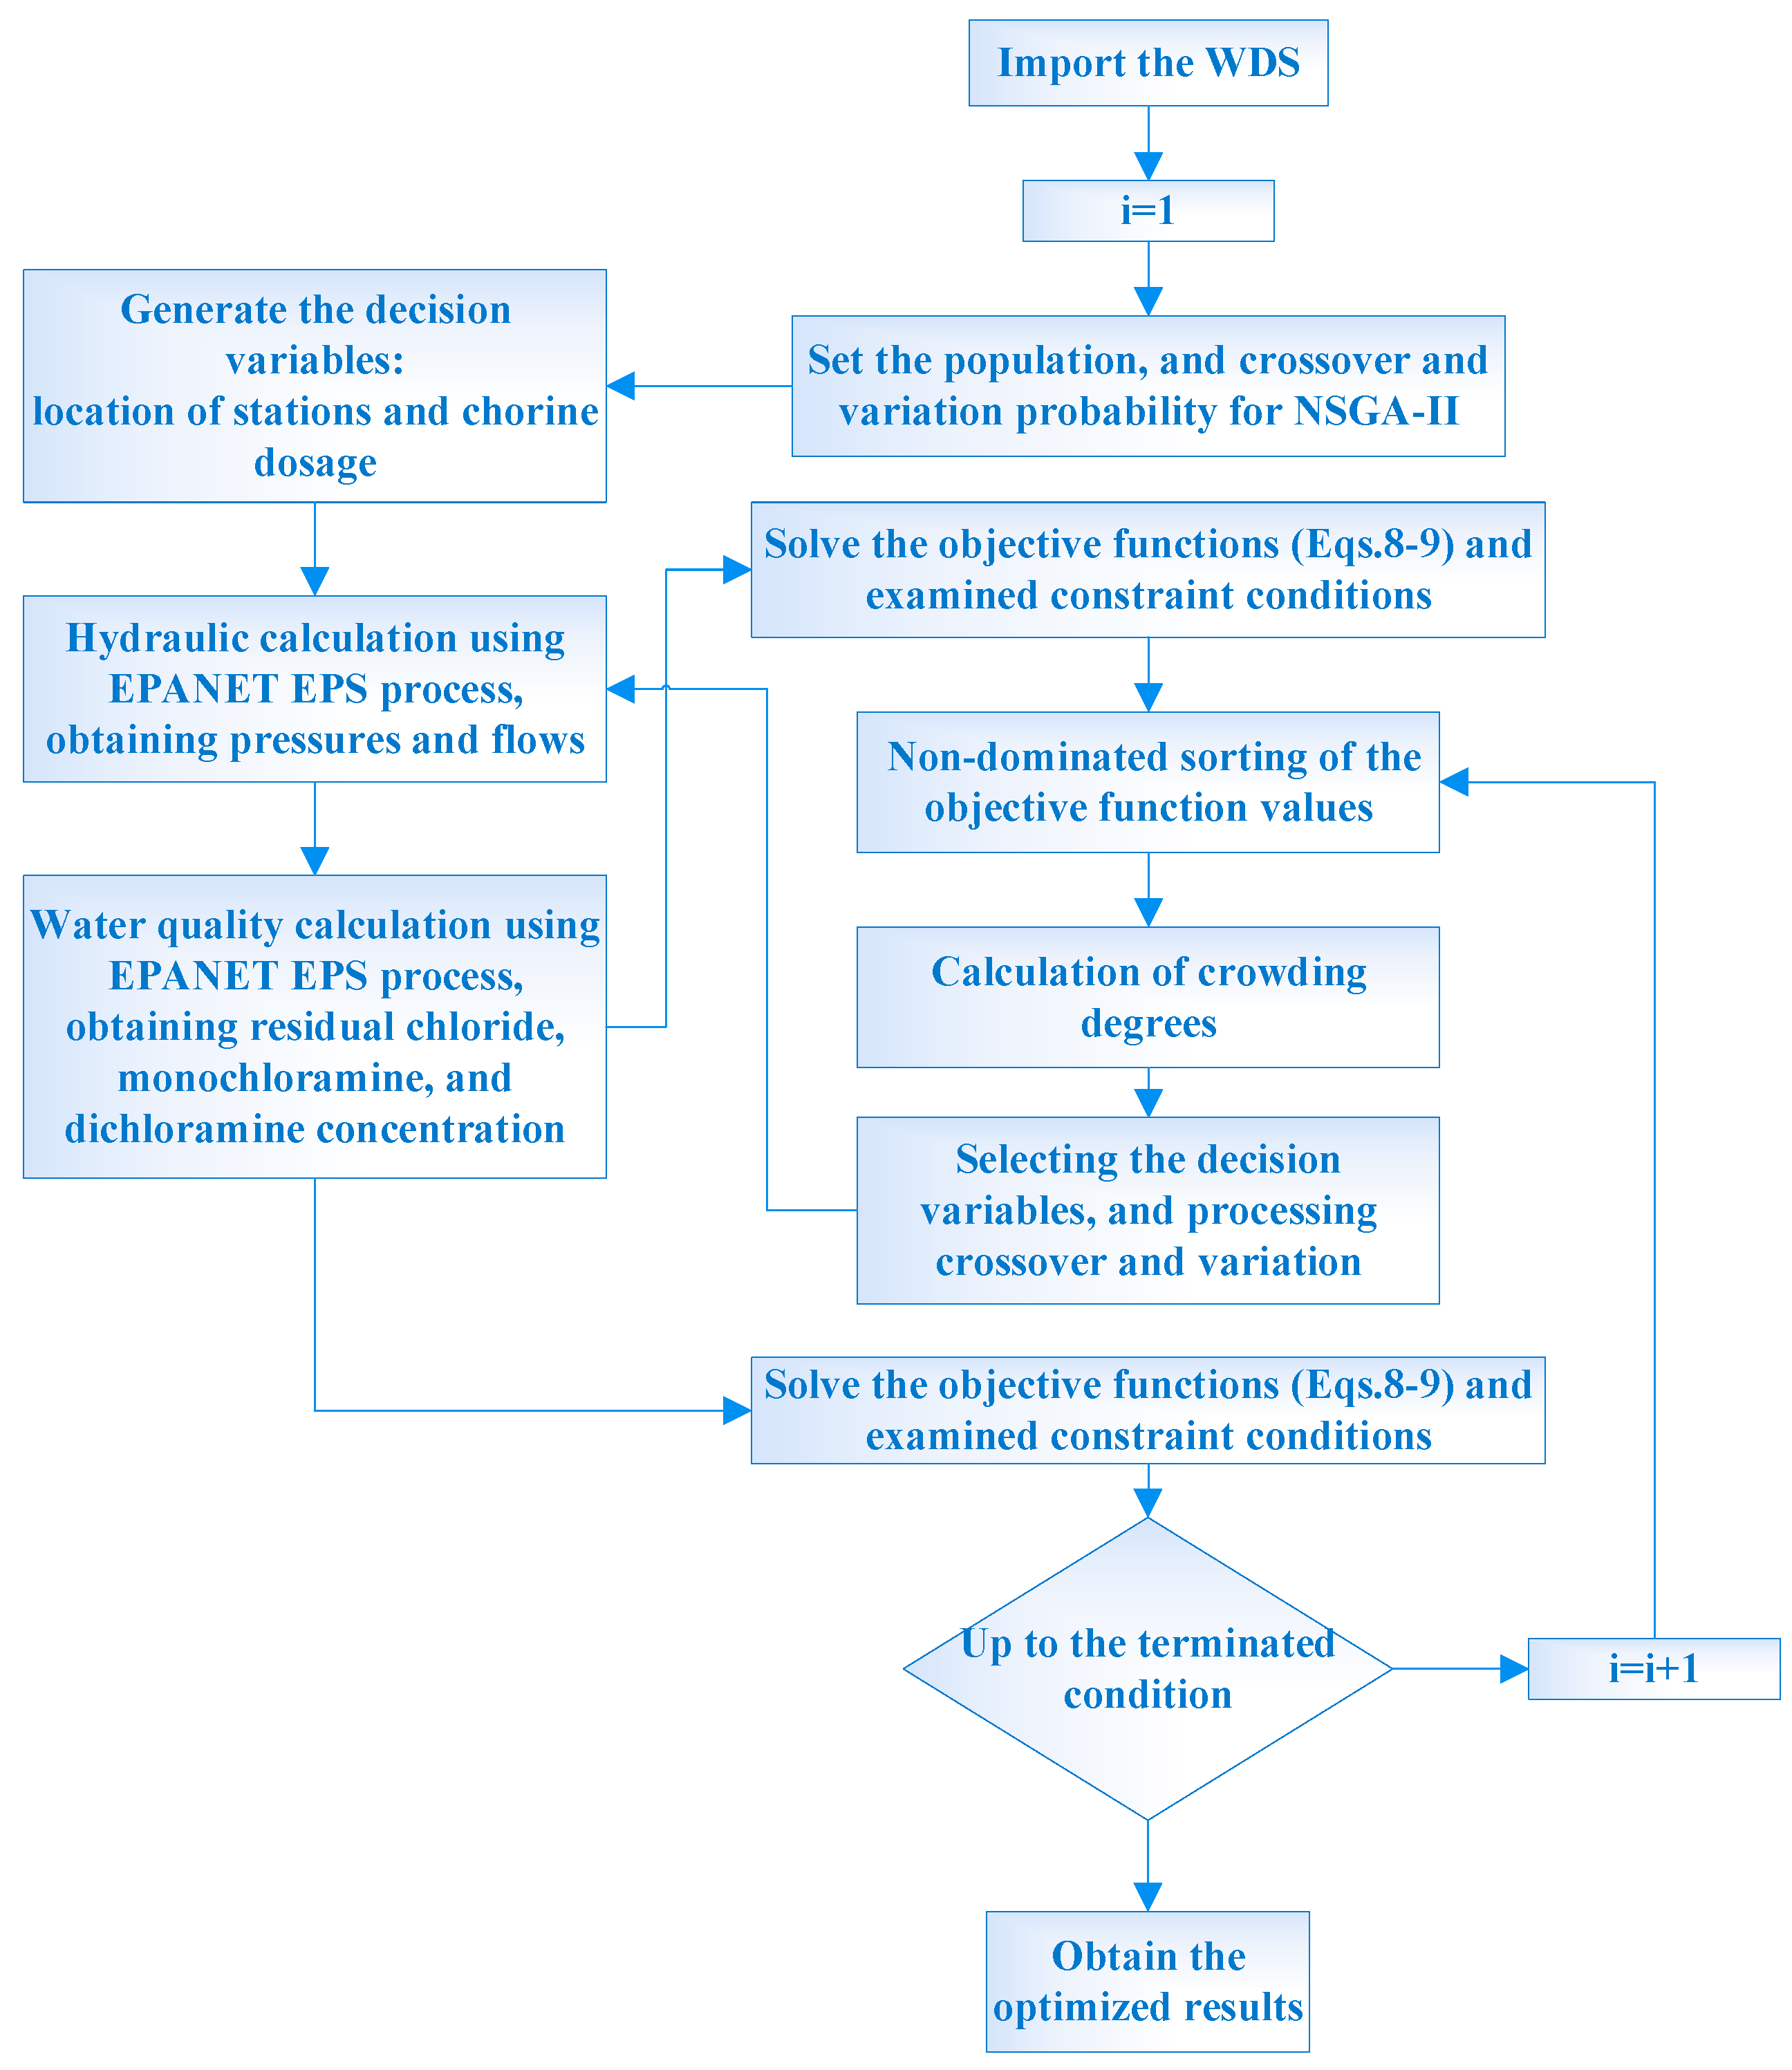
To obtain dual-target optimization functions’ values, the extended period simulation (EPS) is conducted [26] with EPANET. The optimization process is shown in Figure 3. Firstly, the decision variables X are generated, including the location of secondary chlorination stations and the chorine dosages at the secondary chlorination stations. Then, the hydraulic simulation is executed to compute pressures and inlet flows in all nodes. Subsequently, the water quality simulation is executed step by step to acquire the residual chloride, monochloramine, and dichloramine concentration of nodes. Finally, the objective functions (Equations (8) and (9)) are solved. The calculation results are examined under the constraint conditions described in Equations (10)–(12), as well as according to the equation of continuity and the conservation of energy. If the results do not meet the constraint conditions, objective functions are assigned as values of negative infinity. Otherwise, objective functions must continue to be calculated until the global optimum values are achieved.

3. Case Studies

3.1. Chloric Odor Intensity Experiment

For this experiment, sodium hypochlorite solution (NaClO) with an available chlorine content ranging from 4.00% to 4.99%, potassium phosphate monobasic (KH2PO4) with a purity exceeding 99.0%, sodium phosphate dibasic (Na2HPO4) with a purity exceeding 99.0%, and sodium hydroxide (NaOH) with a minimum purity of 98% were sourced from Sinopharm Chemical Reagent Co., Ltd., Shanghai, China. Additionally, N, N-diethyl-p-phenylenediamine (DPD) with a purity above 99.0%, potassium iodide (KI) at 99.0% purity, and ammonium chloride (NH4Cl) at 99.5% purity were acquired from the same supplier. All reagents utilized were confirmed to be of analytical grade to ensure the highest precision in experimental results.
The concentrations of residual chlorine, monochloramine, and dichloramine species is measured using the DPD colorimetric technique [27]. In this process, initial chlorine concentrations are methodically varied between 0.2 and 2.0 mg/L in increments of 0.2 mg/L in each sample. Concurrently, ammonium chloride is added to adjust the Cl/N ratio of chlorine and chloramine compositions. The quantitative analysis of free residual chlorine and chloramines is performed using a UV–visible spectrophotometer (TU1810, PERSEE Company, Beijing, China). These samples are placed in a water bath maintained at 45 °C for 10 min to equilibrate and then are subjected to odor analysis by experts. Five experts are tasked with assessing the chlorine-related odors using SWSA, which categorizes odor intensity on a scale from 0 to 14. The results of the assessment of the intensity of chlorine odors are depicted in Table S1. The results indicate a strong correlation between chlorine dosage and the intensity of odors. As the chlorine concentration increases from 0.2 to 2.0 mg/L, the intensity of the odor detected by the experts rises. For instance, at the chlorine concentration of 0.02 mg/L with 0.07 mg/L monochloramine and 0.03 mg/L dichloramine, the odor intensity is categorized as “None”. At a higher chlorine concentration of 1.52 mg/L, with corresponding monochloramine and dichloramine levels of 0.12 mg/L and 0 mg/L, respectively, the odor intensity is noted as “Mild”.
At the lower chlorine concentrations (0.2 to 0.6 mg/L), the odor intensity is low, generally falling within “None” to “Minimal Detection” in the SWSA. Monochloramine and dichloramine are formed in smaller quantities, where the chloramine levels are not high enough to produce odors that the experts can easily detect. Thus, the chloramines do not significantly contribute to perceptible odors. As chlorine concentrations increase to the mid-range (0.6 to 1.4 mg/L), the odor intensity begins to rise noticeably. Monochloramine levels also increase, contributing to a “Subtle” to “Mild” odor intensity. Monochloramine begins to contribute more noticeably to the overall odor. Dichloramine has an odor threshold that is even lower than that of monochloramine, meaning it can produce noticeable odors. At higher chlorine concentrations, particularly above 1.4 mg/L, the odor intensity increases sharply. At 1.8 mg/L chlorine, the SWSA rating reaches “Mild” to “Intermediate”, indicating that odors are not only detectable but may become unpleasant. Dichloramine formation becomes more likely, contributing to sharper, more intense odors. Thus, the condition could result in water being unpleasant to consume.
The impact of chloramine species on odor can be predicted using models such as a DBN. By understanding how different chloramine levels affect odor intensity, a DBN can optimize their processes to minimize odors, while ensuring effective disinfection, and help in developing strategies that balance operational costs, water quality, and consumer satisfaction.
Then, chlorine, monochloramine, and dichloramine are considered as input variables, whereas the intensity of chloric odor is treated as the output variable. After normalizing these data, the DBN model is employed to train the dataset. The Pytorch v1.13.1 is used in Python 3.9. The DBN model is structured with four layers and a training-to-testing data ratio of 4:1. The first four layers are configured with 3, 128, 64, and 32 neurons, respectively, utilizing the ReLU activation function. The output layer is a fully connected layer with 15 neurons which incorporates a dropout architecture and employs the ReLU activation function, facilitating the model’s effective handling of multi-class classification tasks. Each of the 15 neurons in the output layer corresponds to distinct classifications, representing different levels of odor, such as [0, 0, ..., 0] and [1, 0, ..., 0], to indicate no intensity in a WDS. The framework of the DBN is illustrated in Figure 4. The model optimization is driven by the cross-entropy loss function. The learning rate is set at 0.01, and the training process iterates up to a maximum of 10,000 times to ensure thorough learning and convergence. Additionally, the objective function for the model is the mean squared error (MSE). Finally, a chloric odor prediction model could be obtained.
To verify the effectiveness of the DBN model, two other methods—backpropagation (BP) and linear—are employed as comparisons. For the BP model, it is configured in a similar structure to that of the DBN. The model consists of an input layer that matches the number of three features, followed by three hidden layers with 128, 64, and 32 neurons, respectively, each using the ReLU activation function. The output layer consists of a single neuron with a linear activation function to predict chloric odor intensity. The model is trained using the Adam optimizer with a learning rate of 0.01, which is consistent with the DBN model. The number of iterations is set to a maximum of 10,000. The objective function for the model is the MSE in Equation (S4). For the linear model, a simple linear regression is employed. This model directly maps the input features to the output without any hidden layers, making it a straightforward approach to predict chloric odor intensity. The model is trained using the entire dataset in a single step, with the optimization process aiming to minimize the MSE between the predicted and actual odor intensities. The details of different indicators can be found in the Supplementary Materials.
The evaluations of models are shown in Table 3. The results indicate that the DBN model significantly outperforms both the BP and linear models in predicting chloric odor intensity in WDSs. The DBN emerged as the most robust approach, achieving the highest accuracy, precision, and F1-score (90.00%, 89.29%, and 94.44%, respectively, with an outperform recall of 100.00%). While the BP model demonstrated a strong recall (90.91%), it lagged behind the DBN in accuracy and precision (76.67% and 80.00%, respectively) and achieved a lower F1-score of 85.11%. The linear model performed poorly overall, with an accuracy of 66.67%, a precision of 72.00%, and an F1-score of 78.17%, highlighting its relative ineffectiveness in balancing the trade-off between precision and recall. This difference in performance demonstrates the DBN model’s superior ability to capture and predict the complex relationships between chlorine species and odor intensity, highlighting its effectiveness as a predictive tool in WDSs.

3.2. Simulation Environment

Two cases, A and B, were used to verify this methodology. The water network tool for resilience (WNTR) toolbox was employed for hydraulic simulation [28]. This toolbox is an EPANET Classlib of Python developed by the KIOS Research Center for Intelligent Systems and Networks, University of Cyprus. Meanwhile, the water quality simulation was processed within the EPANET-MSX modeling framework. The system was as follows: the CPU was i7-12700K (Intel, Santa Clara, CA, USA), the RAM was DDR4-32G (Kingston Technology, Fountain Valley, CA, USA), the ROM was 760P SSD-2048G (Intel, Santa Clara, CA, USA), the operating system was Windows 11, and Python 3.9 was used.

3.3. Network A

Network A is based on the Cherry Hill/Brushy Plains area and has a daily demand of 0.90 million gallons per day. Originally used in a chlorine decay study by Rossman [29], this system receives water from the Saltonstall treatment plant via the Cherry Hill pump station, with additional storage at the Brushy Plains Tank. The network model has 35 junctions, 40 pipes, one pump station, and one tank, as shown in Figure 5. The pump station is regarded as a junction with negative demand, which feeds water into the network [30,31]. The time interval of hydraulic calculation is set to one hour during the EPS process via the EPANET-MSX modeling framework and EPANET-WNTR toolbox. The maximum EPS time is set to 56 h. In water quality simulation, the second-order Rosenbrock method is applied for numerical integration. The hydraulic conditions are assumed to be constant or pre-determined, and the water quality model runs independently, without feedback from the water quality results to the hydraulic model. The water quality simulation time step is set to 300 s. The relative tolerance for the water quality solver is specified to be 0.0001, and the absolute tolerance used by the solver is set at 10−8.
The initial chlorine dosage in the pump station is 0.8 mg/L. The station construction cost of the secondary chlorination point was USD 40,000, the secondary chlorination station construction c 1 was set as USD 8000 per year, and the material per unit of chlorine dosage cost c 2 was set as USD 0.17/km3. The minimum and maximum mass of chlorine dosages m i , m i n and m i , m a x were set to 0.1 mg/L and 0.8 mg/L. The minimum and maximum total number of secondary chlorination stations M m i n and M m a x were set to 2 and 10. The minimum and maximum chloric odor intensity I m i n and I m a x were 0 and 4.
Initially, a dose of 0.80 mg/L is added to the pump station (node 1) 56 h before the water source switch. The chlorine levels are illustrated in Figure 6a. Notably, areas with low chlorine levels were predominantly located at the top edge of the topology and at the right of the pump station. In total, 35 junctions exhibited residual chlorine levels below 0.05 mg/L, and all the SWSAs were below 4.0 (subtle). However, the chlorine levels of nodes 10, 21, 22, 28, 29, 33, 34, and 36 were below 0.1 mg/L, which induces biofilm growth and the intrusion of contamination, both of which react with chlorine.
The formation of chloramines, specifically monochloramine and dichloramine, followed the same trend as that of residual chlorines, which are key secondary disinfectants. The concentration of monochloramine varied between 0.04 mg/L and 0.58 mg/L across different nodes, where top areas demonstrated lower chloramine formation due to low residual chlorine, as shown in Figure 7a. Monochloramine is formed when chlorine reacts with ammonia in water and is known for its stability and prolonged disinfecting effect. Meanwhile, the concentration of dichloramine was found to be between 0 mg/L and 0.02 mg/L, where top areas had low chloramine formations, as shown in Figure 7b. The concentrations of monochloramine and dichloramine are indicative of the effectiveness of the chlorination process, but the low residual chlorine in the top area suggests that chloramine formation alone is not sufficient to maintain the desired disinfection levels throughout the network.
Therefore, to address the issue of low residual chlorine at the edge of the WDS, updating or constructing a secondary chlorination station is recommended.
Using NSGA-II, the optimization process integrates hydraulic and water quality simulations to identify the optimal configurations for chlorine injection points and dosages. The algorithm determines a balance between chlorine residuals and DBP formation using Equations (8) and (9), aiming for an optimal trade-off between water safety standards and operational efficiency. In NSGA-II, the population size was set to 50, the maximum number of iterations was 100, the crossover probability was 0.9, and the mutation probability was 0.3.
In the process of secondary chlorination dosage and station optimization, the number of secondary chlorination stations M is selected as the population ( M = 2~10). Then, the NSGA is applied to optimize the location of these stations. The input variables are the index of nodes and the mass of chlorine dosages of each selected node. The algorithm iteratively adjusted the locations and dosages of secondary chlorination stations, evaluating each configuration against the defined objectives and constraints. After 100 iterations, the nodes’ indices and the mass of chlorine dosage could be obtained. The intensity of chloric odor f 1 and the economic expenditures f 2 could be solved with Equations (8) and (9). The results for various numbers of secondary chlorination stations ( M ) are summarized in Table 4, which contains the nodes’ indices, the mass of chlorine dosage, f 1 , and f 2 .
The optimization process determines the best configuration of secondary chlorination stations ( M = 2 to 10) to address low residual chlorine levels in Network A (shown in Table 4). The configuration with M = 5 is optimal as compared to configurations with 2 to 10 stations, excluding 5 (shown in Figure 8a). While M = 2 has the lowest cost (USD 16,020.37 per year), it fails to reduce chloric odor as effectively (intensity of 2.72). Configurations M = 3 and M = 4 improve odor reduction (2.04 and 1.75, respectively) but at increasing costs (USD 24,002.27 and 32,002.81 per year). M = 5 achieves a better balance, with a minimal odor intensity of 1.20 and a moderate cost of USD 40,020.77 per year. Higher configurations ( M = 6 to M = 10) continue to reduce odor (down to 0.66 at M = 10) but incur significantly higher costs (up to USD 80,204.68 per year). For the chloramine formations, shown in Figure 8b, configurations with fewer stations, such as M = 2, 3, and 4, were less effective in maintaining consistent monochloramine levels (0.35~0.68 mg/L, 0.35~0.70, and 0.42~0.70 in M = 2, 3, and 4, respectively) and dichloramine levels (0.01~0.03 mg/L, 0.01~0.04 mg/L, and 0.02~0.04 mg/L in M = 2, 3, and 4, respectively) despite lower costs. More stations, such as M = 6 to 10, provided better chloramine control but a high monochloramine level (0.55~0.75 in M = 6, 0.58~0.79 in M = 7, 0.60~0.81 in M = 8, 0.60~0.84 in M = 9, and 0.64~0.90 in M = 10) and dichloramine level (0.02~0.05 in M = 6, 0.03~0.05 in M = 7 and 8, 0.03~0.06 in M = 9, and 0.04~0.07 in M = 10), but they entailed significantly higher costs. The M = 5 configuration achieved a balanced monochloramine level (0.51~0.72 mg/L) and dichloramine level (0.02~0.05 mg/L), maintained a minimal chloric odor intensity of 1.20, and incurred a reasonable cost. Therefore, the configuration with M = 5 has an excellent balance by achieving these improvements at a moderate cost, effectively reducing the overall cost compared to higher configurations with diminishing returns on odor reduction and chlorine distribution. Thus, it provides the best trade-off between cost efficiency and effective chlorine distribution, making it the most balanced and practical choice.
At M = 5, the selected nodes of the secondary chlorination stations are [21, 27, 10, 22, 32]. The optimal chlorine dosages at the five stations ([1.44, 0.63, 0.33, 0.48, 0.34] mg/L) ensure that the chlorine levels are maintained adequately throughout the WDS, particularly at the edges, where low residual chlorine was previously an issue, as shown in Figure 6b. These nodes are strategically distributed across the network to effectively address areas with low chlorine residuals. Using the kinetic model (Equations (3)–(7)), the chlorine dosages are optimized to ensure no chloric odor while maintaining effective disinfection. Monochloramine levels between 0.51 mg/L and 0.72 mg/L and dichloramine levels between 0.02 mg/L and 0.05 mg/L are used. Therefore, the proposed model is effective for disinfection without causing significant taste or odor issues. The average chloric odor intensity f 1 is 1.20, which is classified as “None” in Table 1. This indicates the lowest level of odor, contributing to better consumer satisfaction without compromising water quality. The economic cost for M = 5 is USD 40,020.77 each year. While this cost is higher than configurations with fewer stations, it is justified by the significant improvement in odor intensity and chlorine distribution.

3.4. Network B

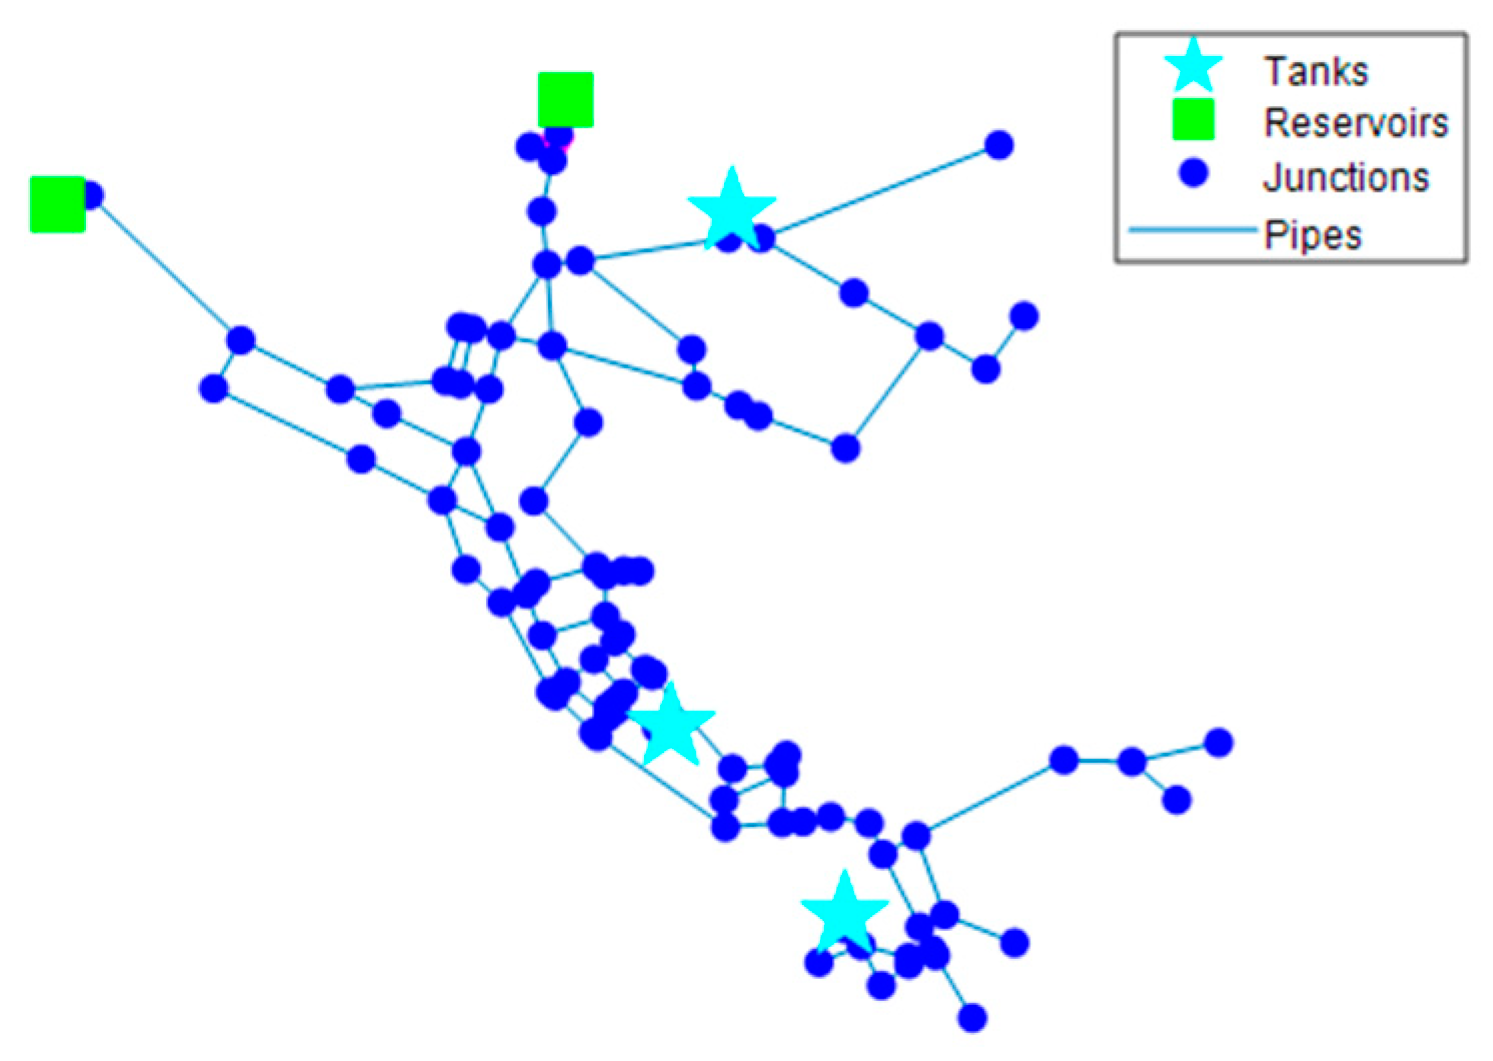
Network B is based on the North Marin Water District in Novato, California, serving a population of approximately 64,000 people over an area of about 100 square miles, with an average demand of 4.9 million gallons per day. The network model developed by the U.S. Environmental Protection Agency has 92 junctions, 117 pipes, two reservoirs (the North Marin Aqueduct and Stafford Lake), two pumps, and three tanks, as shown in Figure 9 [32]. The maximum EPS time is set to 360 h. In a water quality simulation environment, the configurations are the same as those in Network A.
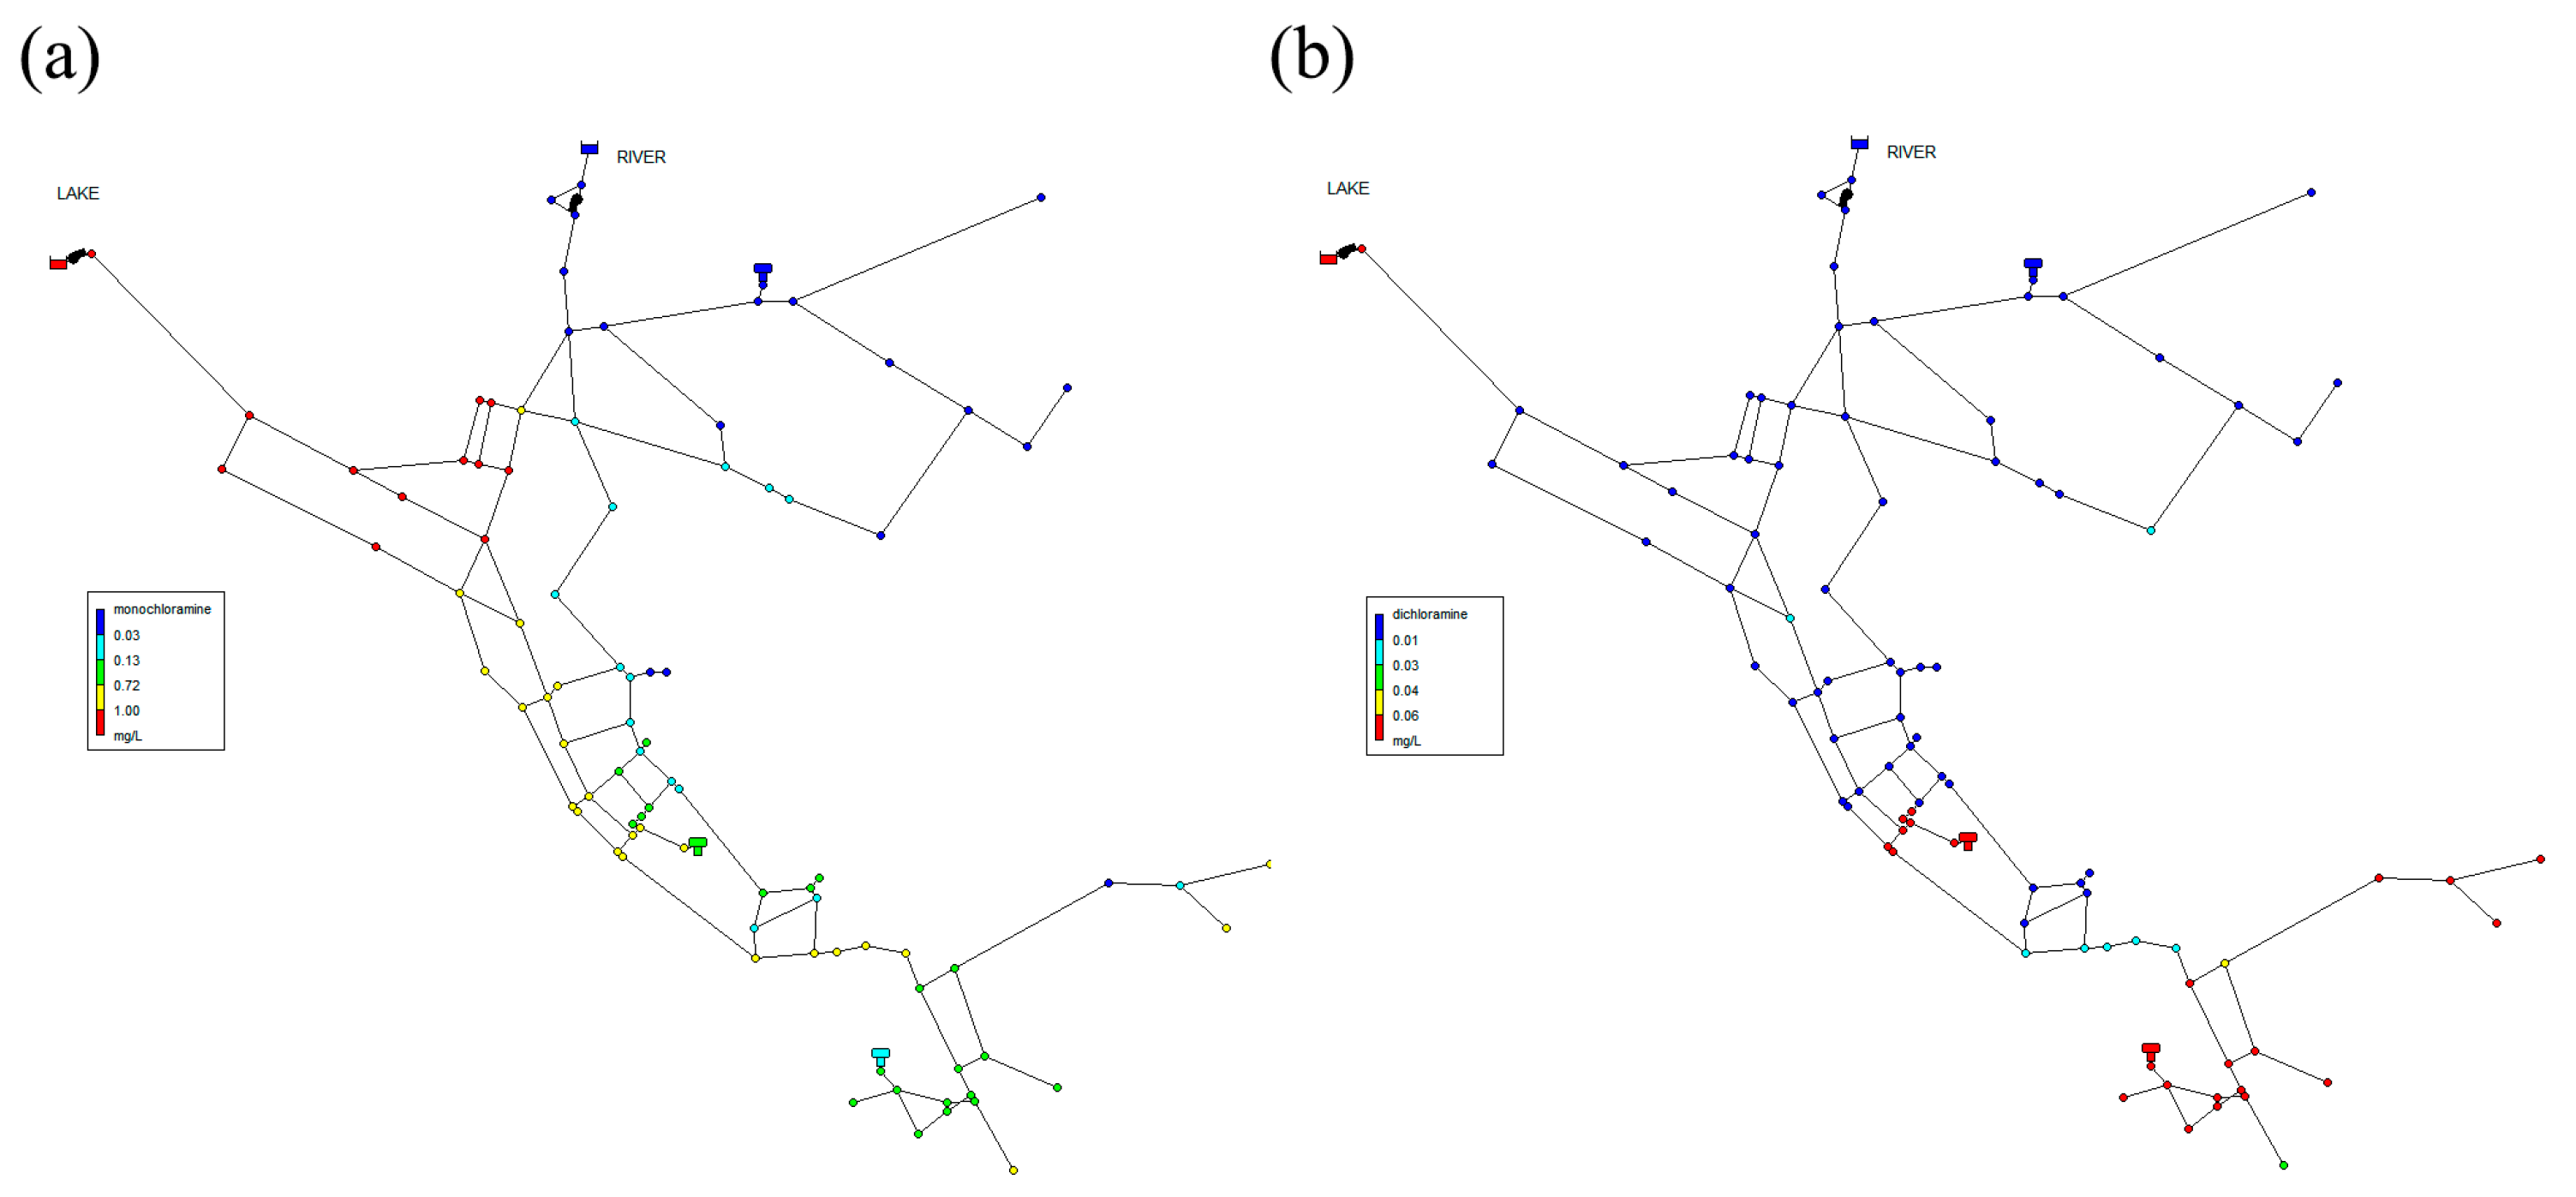
A dosage of 0.80 mg/L was added to the two reservoirs (node 4 and 5) 48 h before the water source switch, as illustrated in Figure 10a. However, many junctions show residual chlorine levels below 0.05 mg/L. The concentration of monochloramine varied between 0.30 mg/L and 1.00 mg/L across different nodes, and dichloramine was found to be between 0.01 mg/L and 0.05 mg/L, as illustrated in Figure 11a,b. This indicates an insufficient distribution of chlorine throughout the network, leading to potential risks of microbial contamination and compromised water quality at the network’s extremities.
Therefore, it is recommended to update or construct additional secondary chlorination stations. These stations would strategically inject chlorine at various nodes within the network, ensuring a more uniform and adequate distribution of disinfectant.
Using the NSGA-II algorithm integrated with EPANET simulations, various configurations of secondary chlorination stations ( M = 2 to 15) were evaluated to determine the optimal effect. The results for various numbers of secondary chlorination stations ( M ) are illustrated in Table 5.
Compared to configurations with fewer stations ( M = 2 to 7), M = 8 offers superior odor control and chlorine distribution, as shown in Table 5. With M = 2 to 15, secondary chlorination stations revealed varying levels of monochloramine and dichloramine formation, chloric odor intensity, and economic costs. Configurations with fewer stations ( M = 2 to 4) are cost-effective but less effective in chloramine control, with monochloramine levels ranging from 0.31 to 0.64 mg/L and dichloramine levels ranging from 0.01 to 0.04 mg/L. Intermediate configurations ( M = 5 to 7) showed improved chloramine control, with monochloramine levels from 0.41 to 0.71 mg/L and dichloramine levels ranging from 0.02 to 0.05 mg/L, balancing effectiveness and cost. The M = 8 configuration emerged as the optimal solution, achieving monochloramine levels between 0.48 mg/L and 0.75 mg/L and dichloramine levels between 0.02 and 0.06 mg/L, with a chloric odor intensity of 0.88 (“Subtle”) and a cost of USD 71405.38 each year. Higher configurations ( M = 9 to 15) provided excellent chloramine control, with monochloramine levels up to 0.92 mg/L and dichloramine levels up to 0.11 mg/L, but at significantly higher costs, ranging from USD 81,225.14 per year to USD 135,375.76 per year, making them less cost-effective compared to M = 8. Thus, M = 8 is the best balance between cost efficiency and effective chlorination, making it the most practical and optimal choice for Network B, as illustrated in Figure 12a,b.
At M = 8, the chloric odor intensity is 0.88 (“None”). This level is low enough to ensure consumer satisfaction. The cost for M = 8 is USD 71405.38 per year. Although this is higher than configurations with fewer stations, it is an improvement in odor control and chlorine distribution. The optimized chlorine dosages [0.02, 0.03, 0.04, 0.05, 0.06, 0.08, 0.10, 0.12 mg/L] ensure consistent chlorine levels throughout the network, addressing low residual areas effectively, as shown in Figure 10b. Monochloramine levels between 0.48 mg/L and 0.75 mg/L and dichloramine levels between 0.02 mg/L and 0.06 mg/L are effective for disinfection without causing significant taste or odor issues.

4. Discussion

We carried out an in-depth analysis of the innovative and optimal secondary chlorination method in WDSs to enhance disinfection efficiency and reduce chlorine odor using a deep learning framework and NSGA-II. The approach integrates EPANET simulations for water hydraulic and quality modeling combined with multi-objective optimization algorithms. The progressive strides and the inherent limitations of this advanced method offer a balanced perspective on its implications in the field of water resource management.
Based on the aforementioned method, a degree of progress can be achieved, as follows:
(1)
The NSGA-II algorithm allows for a cost-effective approach to secondary chlorination. Through optimizing the locations and dosages of secondary chlorination stations, it ensures that adequate disinfectant residuals are maintained throughout the network, which is crucial for sustainable water management, while balancing economic investment with the need for effective disinfection and odor control. Thereby, the algorithm can help to maintain high water quality standards, underscoring its potential as a sustainable solution for water utilities;
(2)
The proposed method leverages advanced algorithms, including EPANET-MSX simulations for water hydraulic and quality modeling and the DBN in deep learning frameworks. This combination enhances the accuracy of chloric odor predictions and optimizes chlorination strategies;
(3)
The proposed method significantly improves the distribution and effectiveness of chlorine in WDSs. Through carefully balancing the levels of chlorine, monochloramine, and dichloramine, the method mitigates unpleasant odors without compromising disinfection efficacy. This leads to an improved sensory quality of drinking water.
Despite these advancements, the method faces certain limitations:
(1)
The training intensity of the DBN network poses a challenge in terms of the availability of extensive and accurate data. The data from chloric odor intensity experiments are only produced in the laboratory. Thus, while the method is effective in specific conditions, such as cases A and B, adapting it to larger or more complex network systems may present challenges related to scalability;
(2)
The accuracy of this method could be influenced by variations in input parameters such as chlorine decay rates, temperature, and flow dynamics. Sensitivity to these parameters necessitates careful calibration and validation using sensors in real WDSs to ensure that reliable results are obtained;
(3)
The integration of deep learning models and multi-objective optimization algorithms requires substantial computational resources. This can be a limiting factor, especially for utilities with limited access to high-performance computing facilities.
Therefore, the method offers a scalable and environmentally friendly approach to improving water quality management in WDSs, balancing disinfection efficiency, odor control, and economic considerations. However, it also presents challenges related to data availability, computational demands, and influence factors in water quality.

5. Conclusions

This study presented an advanced method for optimizing secondary chlorination in WDSs using a deep learning framework and NSGA-II. The method integrates EPANET simulations for hydraulic and water quality modeling, combined with a DBN for accurate chloric odor prediction. Validation through two case studies demonstrated significant improvements, ensuring consistent chlorine levels and addressing potential microbial contamination risks. In Network A, the optimal configuration with five secondary chlorination stations reduced chloric odor intensity to 1.20 (classified as “None”) at a cost of USD 40,020.77 per year while, in Network B, the optimal configuration with eight stations reduced chloric odor intensity to 0.88 (classified as “None”) at a cost of USD 71,405.38 per year.
By achieving a balance between cost efficiency and effective disinfection, the findings contribute to improved consumer satisfaction and public health protection. The optimized chlorination strategies reduce chemical usage and operational costs while maintaining high water quality standards, promoting sustainable water resource management.
Despite challenges such as data requirements and computational complexity, this method offers a comprehensive, scalable solution for enhancing water resource management in WDSs. The case studies demonstrate its effectiveness in achieving optimal trade-offs between cost and water quality, making it a valuable tool for water utilities.

Supplementary Materials

The following supporting information can be downloaded at: https://www.mdpi.com/article/10.3390/w16182666/s1, Table S1: Chlorine odor intensity simulation sample.

Author Contributions

B.D.: Formal analysis, Conceptualization, Methodology, Software, Visualization, Writing—Original Draft; S.S.: Methodology, Software, Visualization; D.L.: Investigation, Data Curation, Project administration, Funding acquisition, Resources, Validation, Supervision. All authors have read and agreed to the published version of the manuscript.

Funding

This work was supported by the National Key Research and Development Program: Key Projects of International Scientific and Technological Innovation Cooperation Between Governments (2022YFE0120600), and the crossing research project of Shanghai Youli Environmental Technology Co., Ltd. (CZZY-HX-2022-24), and the study on the preparation of organic liquid fertilizer based on the resource heat of livestock and poultry manure (ZKZ-2024-4).

Data Availability Statement

The data that support the findings of this study are available from the corresponding author upon reasonable request.

Conflicts of Interest

The authors declare that they have no known competing financial interests or personal relationships that could have appeared to influence the work reported in this paper.

References

  1. Zhang, Q.; Zheng, F.; Jia, Y.; Savic, D.; Kapelan, Z. Real-time foul sewer hydraulic modelling driven by water consumption data from water distribution systems. Water Res. 2021, 188, 116544. [Google Scholar] [CrossRef]
  2. Kennedy, A.; Flint, L.; Aligata, A.; Hoffman, C.; Arias-Paić, M. Regulated disinfection byproduct formation over long residence times. Water Res. 2021, 188, 116523. [Google Scholar] [CrossRef]
  3. Zhou, X.; Zhang, K.; Zhang, T.; Li, C.; Mao, X. An ignored and potential source of taste and odor (T&O) issues—Biofilms in drinking water distribution system (DWDS). Appl. Microbiol. Biotechnol. 2017, 101, 3537–3550. [Google Scholar]
  4. Liu, M.; Graham, N.; Wang, W.; Zhao, R.; Lu, Y.; Elimelech, M.; Yu, W. Spatial assessment of tap-water safety in China. Nat. Sustain. 2022, 5, 689–698. [Google Scholar] [CrossRef]
  5. Doederer, K.; Gernjak, W.; Weinberg, H.S.; Farré, M.J. Factors affecting the formation of disinfection by-products during chlorination and chloramination of secondary effluent for the production of high quality recycled water. Water Res. 2014, 48, 218–228. [Google Scholar] [CrossRef]
  6. Lee, W.H.; Wahman, D.G.; Bishop, P.L.; Pressman, J.G. Free chlorine and monochloramine application to nitrifying biofilm: Comparison of biofilm penetration, activity, and viability. Environ. Sci. Technol. 2011, 45, 1412–1419. [Google Scholar] [CrossRef]
  7. Goyal, R.V.; Patel, H.M. Optimal location and scheduling of booster chlorination stations using EPANET and PSO for drinking water distribution system. ISH J. Hydraul. Eng. 2018, 24, 157–164. [Google Scholar] [CrossRef]
  8. Geng, B.; Fan, J.; Shi, M.; Zhang, S.; Li, J. Control of maximum water age based on total chlorine decay in secondary water supply system. Chemosphere 2022, 287, 132198. [Google Scholar] [CrossRef]
  9. Tabesh, M.; Azadi, B.; Roozbahani, A. Quality management of water distribution networks by optimizing dosage and location of chlorine injection. Int. J. Environ. Res. 2011, 5, 321–332. [Google Scholar]
  10. Shen, L.; Wu, J.-Y.; Lin, G.-F.; Shen, J.-H.; Westendorf, J.; Huehnerfuss, H. The mutagenic potentials of tap water samples in Shanghai. Chemosphere 2003, 52, 1641–1646. [Google Scholar] [CrossRef]
  11. Mao, R.; Zhang, K.; Zhang, Q.; Xu, J.; Cen, C.; Pan, R.; Zhang, T. Joint majorization of waterworks and secondary chlorination points considering the chloric odor and economic investment in the DWDS using machine learning and optimization algorithms. Water Res. 2022, 220, 118595. [Google Scholar] [CrossRef]
  12. Kim, Y.H.; Kweon, J.H.; Kim, D.I. Prediction of residual chlorine using two-component second-order decay model in water distribution network. J. Korean Soc. Water Wastewater 2014, 28, 287–297. [Google Scholar] [CrossRef]
  13. Ohar, Z.; Ostfeld, A. Alternative formulation for DBP’s minimization by optimal design of booster chlorination stations. In World Environmental and Water Resources Congress 2010: Challenges of Change; American Society of Civil Engineers: Reston, VA, USA, 2010; pp. 4260–4269. [Google Scholar]
  14. Wang, H.; Guo, W.; Xu, J.; Gu, H. A Hybrid PSO for Optimizing Locations of Booster Chlorination Stations in Water Distribution Systems. In Proceedings of the 2010 International Conference on Intelligent Computation Technology and Automation, Changsha, China, 11–12 May 2010; pp. 126–129. [Google Scholar]
  15. Loutfi, A.; Coradeschi, S. Smell, think and act: A cognitive robot discriminating odours. Auton. Robot. 2006, 20, 239–249. [Google Scholar] [CrossRef]
  16. Wu, Z.Y.; Rahman, A. Optimized Deep Learning Framework for Water Distribution Data-Driven Modeling. Procedia Eng. 2017, 186, 261–268. [Google Scholar] [CrossRef]
  17. Hinton, G.E.; Osindero, S.; Teh, Y.-W. A Fast Learning Algorithm for Deep Belief Nets. Neural Comput. 2006, 18, 1527–1554. [Google Scholar] [CrossRef]
  18. Rossman, L.A. EPANET 2.0: Users Manual; Water Supply and Water Resources Division, National Risk management Laboratory, USEPA: Cincinnati, OH, USA, 2000. [Google Scholar]
  19. Maheshwari, A.; Abokifa, A.; Gudi, R.D.; Biswas, P. Optimization of disinfectant dosage for simultaneous control of lead and disinfection-byproducts in water distribution networks. J. Environ. Manag. 2020, 276, 111186. [Google Scholar] [CrossRef]
  20. Ramani, K.; Rudraswamy, G.K.; Umamahesh, N.V. Optimal Design of Intermittent Water Distribution Network Considering Network Resilience and Equity in Water Supply. Water 2023, 15, 3265. [Google Scholar] [CrossRef]
  21. Xu, J.; Bai, D. Multi-Objective Optimal Operation of the Inter-Basin Water Transfer Project Considering the Unknown Shapes of Pareto Fronts. Water 2019, 11, 2644. [Google Scholar] [CrossRef]
  22. Mu, T.; Huang, M.; Tang, S.; Zhang, R.; Chen, G.; Jiang, B. Sensor Partitioning Placements via Random Walk and Water Quality and Leakage Detection Models within Water Distribution Systems. Water Resour. Manag. 2022, 36, 5297–5311. [Google Scholar] [CrossRef]
  23. Mu, T.; Lu, Y.; Tan, H.; Zhang, H.; Zheng, C. Random Walks Partitioning and Network Reliability Assessing in Water Distribution System. Water Resour. Manag. 2021, 35, 2325–2341. [Google Scholar] [CrossRef]
  24. Sirsant, S.; Reddy, M.J. Assessing the Performance of Surrogate Measures for Water Distribution Network Reliability. J. Water Resour. Plan. Manag. 2020, 146, 04020048. [Google Scholar] [CrossRef]
  25. Deb, K.; Pratap, A.; Agarwal, S.; Meyarivan, T. A fast and elitist multiobjective genetic algorithm: NSGA-II. IEEE Trans. Evol. Comput. 2002, 6, 182–197. [Google Scholar] [CrossRef]
  26. Mu, T.; Huang, M.; Tan, H.; Chen, G.; Zhang, R. Pressure and Water Quality Integrated Sensor Placement Considering Leakage and Contamination Intrusion within Water Distribution Systems. ACS ES&T Water 2021, 1, 2348–2358. [Google Scholar] [CrossRef]
  27. Zheng, S.; Lin, T.; Chen, H.; Zhang, X.; Jiang, F. Impact of changes in biofilm composition response following chlorine and chloramine disinfection on nitrogenous disinfection byproduct formation and toxicity risk in drinking water distribution systems. Water Res. 2024, 253, 121331. [Google Scholar] [CrossRef]
  28. Bryant EMcDonnell, S.E.; Uber, J.; Klise, K. Open Water Analytics (OWA); KIOS Research Center for Intelligent Systems and Networks of the University of Cyprus: Nicosia, Cyprus, 2007. [Google Scholar]
  29. Rossman, L.A.; Clark, R.M.; Grayman, W.M. Modeling Chlorine Residuals in Drinking-Water Distribution Systems. J. Environ. Eng. 1994, 120, 803–820. [Google Scholar] [CrossRef]
  30. Ostfeld, A.; Uber James, G.; Salomons, E.; Berry Jonathan, W.; Hart William, E.; Phillips Cindy, A.; Watson, J.-P.; Dorini, G.; Jonkergouw, P.; Kapelan, Z.; et al. The Battle of the Water Sensor Networks (BWSN): A Design Challenge for Engineers and Algorithms. J. Water Resour. Plan. Manag. 2008, 134, 556–568. [Google Scholar] [CrossRef]
  31. Ostfeld, A.; Salomons, E.; Ormsbee, L.; Uber, J.G.; Bros, C.M.; Kalungi, P.; Burd, R.; Zazula-Coetzee, B.; Belrain, T.; Kang, D. Battle of the water calibration networks. J. Water Resour. Plan. Manag. 2012, 138, 523–532. [Google Scholar] [CrossRef]
  32. Hwang, H.; Lansey, K. Water Distribution System Classification Using System Characteristics and Graph-Theory Metrics. J. Water Resour. Plan. Manag. 2017, 143, 04017071. [Google Scholar] [CrossRef]
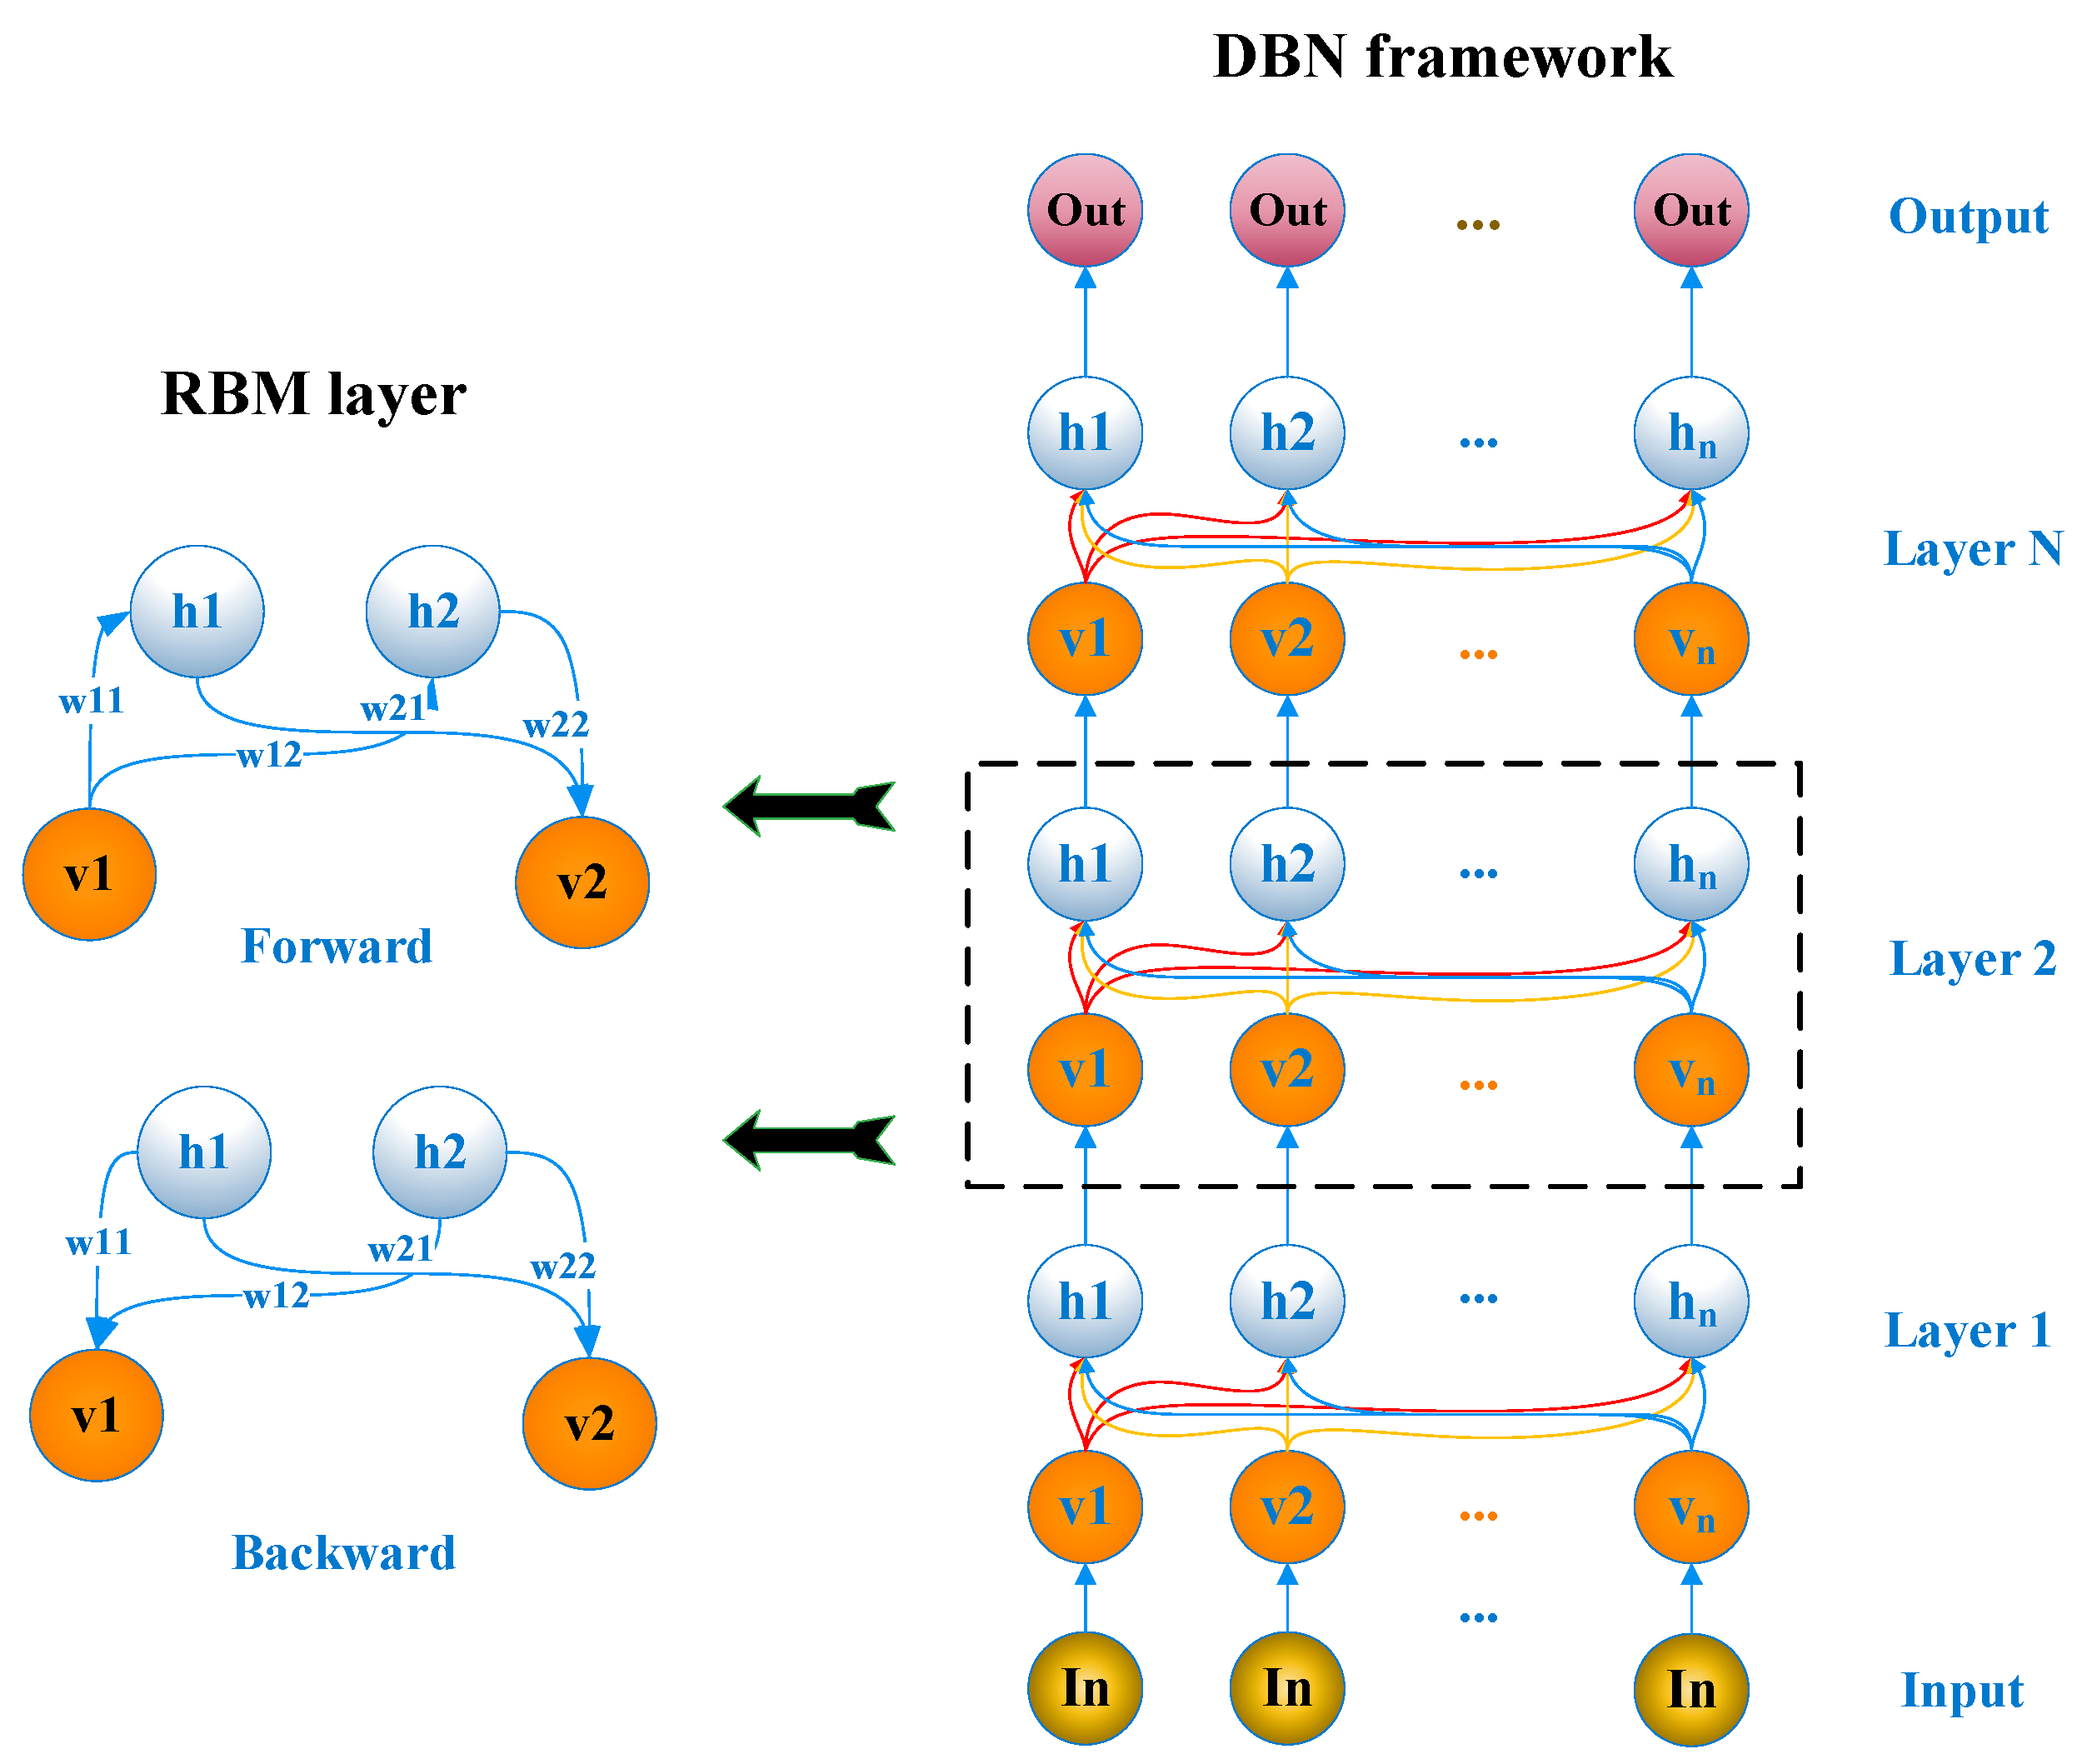
Figure 1. A detailed depiction of the DBN model.
Water 16 02666 g001
Figure 2. The flowchart of the chlorination process.
Water 16 02666 g002
Figure 3. Flowchart of the optimization process.
Water 16 02666 g003
Figure 4. The framework of the DBN model analyzing chlorine, monochloramine, and dichloramine odors.
Water 16 02666 g004
Figure 5. Layout of Network A.
Water 16 02666 g005
Figure 6. The average chlorine distribution in Network A: (a) dosage of 0.80 mg/L of chlorine in pump station; (b) dosage in secondary chlorination stations ( M = 5).
Water 16 02666 g006
Figure 7. The concentration distributions of (a) monochloramine and (b) dichloramine in Network A.
Water 16 02666 g007
Figure 8. Comparative analysis of efficacy and cost across the secondary chlorination stations in Network A: (a) odor intensity and cost; (b) monochloramine and dichloramine levels. The red dot represents the best optimal solution.
Water 16 02666 g008
Figure 9. Layout of Network B.
Water 16 02666 g009
Figure 10. The average chlorine distribution in Network B: (a) dosage of 0.80 mg/L chlorine in reservoirs; (b) dosing in secondary chlorination stations ( M = 8).
Water 16 02666 g010
Figure 11. The concentration distributions of (a) monochloramine and (b) dichloramine in Network B.
Water 16 02666 g011
Figure 12. Comparative analysis of efficacy and cost across the secondary chlorination stations in Network B: (a) odor intensity and cost; (b) monochloramine and dichloramine levels. The red dot represents the best optimal solution.
Water 16 02666 g012
Table 1. The SWSA degrees and relevant chloric odor intensity.
IntensitiesLevels of Odor
[0, 2)None
[2, 4)Minimal detection
[4, 6)Subtle
[6, 8)Mild
[8, 10)Mild to intermediate
[10, 12)Intermediate
[12, 14)Intermediate to pronounced
14Pronounced
Table 2. The parameters used in kinetic models of multiple components.
ParametersValues L/(mg·h)
k 1 1.5 × 10¹⁰
k 2 2.3 × 10⁻³
k 3 2.2 × 10⁸
k 4 1.0 × 10⁶
k 5 1.0
k 6 7.6 × 10⁻²
k 7 55.0
k 8 4.0 × 10⁵
k b i o 6.5 × 10⁵
Table 3. The evaluation of the DBN model.
ModelsAccuracy %Precision %Recall %F1-Score %
DBN96.6796.67100.0098.33
BP76.6780.0090.9185.11
Linear66.6772.0085.7178.17
Table 4. The results of the process of secondary chlorination dosage and station optimization where M = 2 ~ 10 in Network A.
M Index of NodeChlorine Dosage (mg/L) f 1 f 2
(USD/Year)
2[26, 32][0.15, 0.24]2.7216,020.37
3[33, 27, 35][0.13, 0.32, 0.33]2.0424,002.27
4[33, 26, 22, 31][0.25, 2.96, 1.07, 0.30]1.7532,002.81
5[21, 27, 10, 22, 32][1.44, 0.63, 0.33, 0.48, 0.34]1.2040,020.77
6[14, 18, 28, 30, 31, 10][0.50, 1.40, 0.63, 1.49, 1.25, 0.20]1.0848,172.92
7[18, 31, 35, 32, 28, 8, 10][2.60, 1.43, 0.86, 1.08, 0.53, 0.61, 1.88]0.9456,035.67
8[34, 3, 21, 20, 26, 31, 30, 22][0.68, 0.94, 0.57, 1.00, 0.77, 1.96, 1.68, 0.79]0.8564,109.10
9[27, 21, 22, 10, 28, 17, 32, 36, 33][1.30, 2.02, 0.83, 0.47, 0.36, 1.38, 2.58, 2.29, 1.50]0.7272,154.92
10[26, 29, 36, 35, 18, 32, 16, 10, 3, 19][2.03, 0.53, 0.46, 2.22, 0.91, 0.58, 1.25, 1.45 0.72, 2.82]0.6680,204.68
Table 5. The results of the process of secondary chlorination dosage and station optimization where M = 2 ~ 15 in Network B.
M Index of NodeChlorine Dosage (mg/L)Monochloramine (mg/L)Dichloramine (mg/L) f 1 f 2
(USD/Year)
2[17, 38][0.10, 0.12]0.31–0.540.01–0.031.8518,050.87
3[2, 38, 68][0.08, 0.10, 0.12]0.33–0.590.01–0.041.6027,075.81
4[2, 17, 40, 68][0.06, 0.08, 0.10, 0.12]0.33–0.640.01–0.041.4236,100.41
5[17, 38, 34, 45, 68][0.05, 0.06, 0.08, 0.10, 0.12]0.41–0.660.01–0.051.2545,125.68
6[17, 26, 29, 34, 40, 68][0.04, 0.05, 0.06, 0.08, 0.10, 0.12]0.40–0.700.02–0.051.1054,150.93
7[2, 29, 34, 40, 45, 68, 77][0.03, 0.04, 0.05, 0.06, 0.08, 0.10, 0.12]0.44–0.710.02–0.050.9863,175.59
8[2, 17, 34, 38, 40, 45, 68, 77][0.02, 0.03, 0.04, 0.05, 0.06, 0.08, 0.10, 0.12]0.48–0.750.02–0.060.8871,405.38
9[17, 34, 20, 26, 40, 48, 59, 71, 77][0.02, 0.02, 0.03, 0.04, 0.05, 0.06, 0.08, 0.10, 0.12]0.46–0.770.03–0.060.8081,225.14
10[2, 17, 26, 29, 34, 40, 45, 48, 71, 77][0.01, 0.02, 0.02, 0.03, 0.04, 0.05, 0.06, 0.08, 0.10, 0.12]0.51–0.790.03–0.060.7290,250.65
11[2, 16, 26, 29, 34, 40, 45, 59, 68, 71, 77][0.01, 0.02, 0.02, 0.03, 0.04, 0.05, 0.06, 0.08, 0.10, 0.12, 0.12]0.55–0.820.03–0.060.6599,275.54
12[2, 17, 20, 26, 29, 34, 40, 45, 59, 65, 68, 77][0.01, 0.01, 0.02, 0.02, 0.03, 0.04, 0.05, 0.06, 0.08, 0.10, 0.12, 0.12]0.56–0.850.04–0.070.59108,300.22
13[2, 16, 20, 26, 29, 34, 40, 45, 48, 59, 68, 71, 77][0.01, 0.01, 0.02, 0.02, 0.03, 0.04, 0.05, 0.06, 0.08, 0.10, 0.12, 0.12, 0.13]0.62–0.890.04–0.080.54117,325.21
14[2, 16,17, 20, 26, 29, 40, 45, 48, 59, 65, 68, 71, 77][0.01, 0.01, 0.02, 0.02, 0.03, 0.04, 0.05, 0.06, 0.08, 0.10, 0.12, 0.12, 0.13, 0.13]0.65–0.870.05–0.090.49126,350.76
15[2, 17,20, 21, 26, 29, 40, 45, 48, 59, 65, 68, 70, 71, 77][0.01, 0.01, 0.02, 0.02, 0.03, 0.04, 0.05, 0.06, 0.08, 0.10, 0.12, 0.12, 0.13, 0.13, 0.14]0.65–0.920.05–0.110.45135,375.00
Disclaimer/Publisher’s Note: The statements, opinions and data contained in all publications are solely those of the individual author(s) and contributor(s) and not of MDPI and/or the editor(s). MDPI and/or the editor(s) disclaim responsibility for any injury to people or property resulting from any ideas, methods, instructions or products referred to in the content.