Article

Land-Use Pattern-Based Spatial Variation of Physicochemical Parameters and Efficacy of Safe Drinking Water Supply along the Mahaweli River, Sri Lanka

by
Pulwansha Amandi Thilakarathna
1,
Fazla Fareed
1,2,
Madhubhashini Makehelwala
2,
Sujithra K. Weragoda
2,
Ruchika Fernando
3,
Thejani Premachandra
2,
Mangala Rajapakse
4,
Yuansong Wei
5,
Min Yang
5 and
S. H. P. Parakrama Karunaratne
6,*
1
Postgraduate Institute of Science, University of Peradeniya, Peradeniya 20400, Sri Lanka
2
China-Sri Lanka Joint Research and Demonstration Centre for Water Technology, Meewathura, Peradeniya 20400, Sri Lanka
3
Department of Veterinary Public Health and Pharmacology, Faculty of Veterinary Medicine & Animal Science, University of Peradeniya, Peradeniya 20400, Sri Lanka
4
National Water Supply and Drainage Board, Kandy 20000, Sri Lanka
5
Research Center for Eco-Environmental Sciences, Chinese Academy of Sciences, Beijing 100085, China
6
Department of Zoology, Faculty of Science, University of Peradeniya, Peradeniya 20400, Sri Lanka
*
Author to whom correspondence should be addressed.
Water 2024, 16(18), 2644; https://doi.org/10.3390/w16182644
Submission received: 16 August 2024 / Revised: 5 September 2024 / Accepted: 14 September 2024 / Published: 18 September 2024
(This article belongs to the Section Urban Water Management)

Abstract

:
Exploration of the pollution status of river-based water sources is important to ensure quality and safe drinking water supply for the public. The present study investigated physicochemical parameters of surface water in the upper segment of River Mahaweli, which provides drinking water to the Nuwara Eliya and Kandy districts of Sri Lanka. River surface water from 15 intakes and treated water from 14 Water Treatment Plants (WTPs) were tested for pH, water temperature, turbidity, EC, COD, 6 anions, 21 cations, 3 pesticides, and 30 antibiotics once every 3 months from June 2022 to July 2023. Except for turbidity and iron concentrations, all other parameters were within the permissible range as per the Sri Lanka Standard Specification for Potable Water (SLS 614:2013). The uppermost Kotagala WTP raw water had a high concentration of iron due to runoff from areas with abundant iron-bearing minerals. Turbidity increased as the river flowed downstream, reaching its highest value of 13.43 NTU at the lowermost Haragama. Four intakes had raw surface water suitable for drinking as per the Water Quality Index (WQI). Pollution increased gradually towards downstream mainly due to agricultural runoff, industrial effluents, and urbanization. Poor water quality at the upstream Thalawakale-Nanuoya intake was due to highly contaminated effluent water coming from Lake Gregory in Nuwara Eliya. Cluster analysis categorized WTP locations in the river segment into 3 clusters as low, moderate, and high based on contaminations. Principal component analysis revealed that the significance of the 41.56% variance of the raw water was due to the pH and the presence of heavy metals V, Cr, Ni, Rb, Co, Sr, and As. All treated water from 15 WTPs had very good to excellent quality. In general, heavy metal contamination was low as indicated by the heavy metal pollution index (HPI) and heavy metal evaluation index (HEI). The treatment process could remove up to 94.7% of the turbidity. This is the first attempt to cluster the river catchment of the Mahaweli River based on physicochemical parameters of river water. We present here the land-use pattern-based pollution of the river and efficacy of the water treatment process using the Mahaweli River Basin as a case study. Regular monitoring and treatment adjustments at identified points are recommended to maintain the delivery of safe drinking water.

1. Introduction

Overpopulation, extensive industrialization, accelerated urbanization, and lack of sanitation have significantly escalated the challenge of ensuring consistent safe drinking water supply [1,2]. Uncontrollable human activities, municipal waste disposal, and industrial effluents have been identified as the most common causes of river water pollution, which affects river water-based drinking water supply schemes throughout the world [3]. Restoring contaminated river systems could be achieved by effective management of domestic and industrial solid waste and wastewater, unbiased government involvement, effective policy enforcement, and implementation of innovative urban development plans [4,5]. Ensuring safe and hygienic water supply requires continuous quality measurement of source water [6], and it is critical to comprehend spatio-temporal patterns of water quality, which offer vital information for controlling water pollution [7]. In this context, different parameters including pH, turbidity, color, electroconductivity, water temperature, salinity, total dissolved solids, chemical oxygen demand (COD), biological oxygen demand (BOD), anions, cations, and heavy metals are analyzed as common physicochemical water parameters in source water [8,9].
It is important to elicit the overall water quality rather than expressing its single-parameter variations to esteem the water quality or the degree of pollution [10]. Various indices integrating different physicochemical water quality parameters can be calculated for this purpose. Water quality index (WQI), heavy metal pollution index (HPI), and heavy metal evaluation index (HEI) have been successfully used to illustrate the overall quality of water used for drinking purposes [5,11,12,13]. These indices are used to predict the water quality status by assigning grades related to the calculated value based on the permissible ranges of universal or country-specific water quality standards or guidelines. Multivariate statistical techniques, i.e., principal component analysis (PCA) and cluster analysis (CA), are useful for evaluating diverse data sets, determining the types of pollution sources, and comprehending spatio-temporal fluctuations in water quality in order to safeguard and restore water resources [7].
River surface water is one of the major drinking water sources in Sri Lanka [14]. Major rivers provide drinking water to communities after being treated appropriately at the water treatment plants (WTPs) [15]. Various studies on the pollution status of Sri Lankan river systems including Kalu River, Kelani River, Deduru Oya, and Badulu Oya, etc., have been conducted to ensure safe supply of drinking water to consumers [16,17,18,19,20]. Kelani River, the main source of water supply to the capital city Colombo, is severely polluted due to industrial pollution. The water quality was influenced by industrial effluents, particularly the downstream of the river catchment being situated within major industrial zones [17,18]. Accumulation of contaminants has also been observed along the downstream of Deduru Oya [19]. The impact of catchment disturbances, i.e., agricultural and urban activities, significantly degraded the water quality of Badulu Oya by altering parameters such as electrical conductivity, total solids, and dissolved oxygen [20]. These studies based on WQI of Sri Lanka Rivers highlighted the need for continuous monitoring and urgent interventions to manage and improve water quality in river basins. Among the 103 river basins in Sri Lanka, the Mahaweli River is the longest with the largest catchment area, making it crucial to the nation’s ecology, agriculture, health, and socioeconomic growth. The upper segment of the Mahaweli River is the main drinking water source for the Nuwara Eliya and Kandy districts, and the lower segment of the same is the major source for various irrigation systems of the dry zone [21,22]. The total extraction volume from the river between Kotmale and Victoria reservoirs of the upper segment of the Mahaweli River is about 165,392 m3/day, which is expected to be expanded up to 340,000 m3/day within the next 5 years [23].
Mahaweli River water is exposed to multiple pollution sources, such as agricultural runoff containing pesticides and fertilizers, hospital and farm effluents, domestic sewage, industrial effluents, solid waste disposals, and erosions from deforested areas. A study has shown that water pollution in the upper Mahaweli River escalates with increased urban/forest ratio [24]. Since the upper segment of the Mahaweli River contributes to considerable drinking water supply, it is important to analyze the river water pollution. To date, no comprehensive study has been conducted systematically on the physicochemical parameters of Mahaweli River water and its treated water to ensure safe delivery of quality drinking water. Therefore, the present study was undertaken to investigate physical and chemical water quality parameters, including pesticides and antibiotics, of the river surface water (raw) of intakes and treated river water from WTPs located in the upper catchment area of the Mahaweli River between Kotmale and Victoria reservoirs.

2. Materials and Methods

2.1. Description of the Study Area

A segment of the Mahaweli River (about 60 km) between Kotmale and Victoria reservoirs (6°95′ N 80°59′ E and 7°32′ N 80°72′ E, respectively) was considered for the study (Figure 1). The area belongs to the wet zone of Sri Lanka with 2000–3000 mm annual average rainfall and 17.5–22.5 °C average temperature as per available data at the National Meteorological Centre (NMC), Department of Meteorology, Sri Lanka.
Raw water samples were collected from 15 raw water intakes of 14 WTPs belonging to the National Water Supply and Drainage Board (NWSDB) of Sri Lanka, and treated water from the same WTPs (Table S1, Figure 1). Four of the selected sampling locations, i.e., Kotagala (KG), Thalawakelle-Galkanda (TW-G), Thalawakelle-Nanuoya (TW-N) (Thalawakelle (TW) WTP had two water intakes; TW-G and TW-N), and Pundaluoya (PU), are located in the Nuwara Eliya district, and the rest, i.e., Nawalapitiya (NP), Ulapane (UL), Paradeka (PD), Elpitiya (EL), Nillambe (NL), University Plant (UP), Kandy South (KS), Greater Kandy (GK), Polgolla (PO), Haragama (HA), and Balagolla (BA), are in the Kandy district. A conventional water treatment process has been implemented at these WTPs to eliminate chemical and bacterial contaminants and to improve the aesthetic quality of water, which is important for acceptance by consumers. The process includes several conventional treatment operations and procedures between extraction and distribution of treated water, i.e., pre-screening, pre-settling, coagulation and rapid mixing, flocculation and sedimentation, filtration, and disinfection. Depending on the level of pollution of the intake water, the process is adjusted (e.g., disinfection was the only step needed for water treatment at the Kotalaga WTP) [11].

2.2. Sampling and Water Quality Analysis

Surface river water samples and treated water samples were collected from the 15 inlets of WTPs and 14 WTP outlets once every 3 months from June 2022 to July 2023. As rainfall patterns were not regular and unpredictable, the sampling frequency was designed as once in three months. Sampling, transportation, and storage of the water samples were done according to American Public Health Association (APHA) Standard Methods for the Examination of Water and Wastewater [25]. The physical parameters, i.e., pH, water temperature, turbidity, and EC, were measured at the point of sample collection. Samples were collected into polyethylene bottles (for COD, anions, and cations) or amber color glass bottles (for pesticides and antibiotics) and transported in ice (4 °C) to the laboratory of China-Sri Lanka Joint Research and Demonstration Centre for Water Technology (JRDC), Peradeniya, Sri Lanka for chemical analysis. Samples were tested for 32 physicochemical water quality parameters, 3 commonly used pesticides, and 30 antibiotics. Water samples for testing pesticides were collected only once from selected high-usage locations (commonly used pesticides and heavily used locations were determined after a field survey as mentioned in Figure S2). These parameters, except antibiotics, together with their units and permissible ranges as recommended by the Sri Lanka Standard (SLS) 614:2013 [26], World Health Organization (WHO) Guidelines—2017 [27], and Bureau of Indian Standards (BIS) IS 10500:2012 for drinking water quality [28], are summarized in Table 1. In cases where the SLS guideline was not defined for the particular parameter, the standard values given in WHO or BIS (only for EC) were considered. The tested antibiotics were tetracyclines (tetracycline, oxytetracycline, chlortetracycline, doxycycline, and demeclocycline), beta lactams (penicillin G, amoxicillin, cloxacillin, ampicillin, cefalexin, cefoperazone, and penicillin V), fluoroquinolones (ciprofloxacin, enrofloxacin, norfloxacin, and flumequine), and sulfonamides (sulfamethazine, sulfamerazine, sulfacholopyridazine, sulfadiazine, sulfadimethoxine, sulfadimidine, sulfadoxin, sulfamethizole, sulfamethoxazole, sulfamethoxypyridazine, sulfapyridine, sulfaquinoxaline, sulfathiazole, and dapsone). These antibiotics were selected based on the national usage and previous detection in aqua systems of Sri Lanka [29,30].
pH, water temperature, turbidity, and EC were measured onsite using calibrated field probes (LIHERO LFWCS-2008, Changsha, China). CODMn was tested with LIHERO LFS-2002 (CODMn) (Changsha, China). Samples were filtered using 0.45 µm membrane filters before the analysis of chemical parameters. Analysis of anions was performed using ion chromatography (Metrohm ECO IC, Herisau, Switzerland) according to USEPA 300.6 guidelines. Heavy metals were analyzed using inductively coupled plasma mass spectrometry (iCAP RQ ICP-MS, Thermo Fisher Scientific, Waltham, MA, USA) as guided in USEPA 200.8.
Detection of pesticides was conducted by solid-phase extraction method according to the manufacturer’s instructions. Raw water samples (each 5 L) were concentrated using C18 cartridges (5 cm, Hypersep C18, Thermo Fisher Scientific, Rockwood TN, USA) and analyzed using high-performance liquid chromatography—ultraviolet detector (HPLC/UV, Thermo Fisher Scientific, Waltham, MA, USA). To analyze the presence of antibiotics, water samples (40 mL) were concentrated below a volume of 5 mL using a CHRIST ALPHA 1-4 LD Plus Freeze-dryer (Martin Christ Freeze Dryers, Osterode, Germany), and the final volume and concentration of formic acid in the sample were adjusted to 5.0 mL and 0.1%, respectively. Each sample was then filtered through a 0.22 μm nylon syringe filter, transferred to an auto sampler vial, and injected (10.0 µL) to Nexera-X2 Ultra High-Performance Liquid Chromatograph (Shimadzu, Kyoto, Japan) coupled with a Shimadzu 8040 LC-MS/MS. The injected samples were sent through a Shimadzu Shim-pack HR-ODS (3.0 × 150 mm; particle size 3 µm) analytical column with the mobile phase of 0.1% formic acid (LC/MS grade) in water and 0.1% formic acid in methanol at the flow rate of 0.4 mL/min. Water samples spiked at 5 ppb were used as recovery controls, and the Limits of Detection (LoDs) and Limits of Quantification (LoQs) of the method were lower than 5 ppb.

2.3. Data Analysis

2.3.1. Calculation of Water Quality Index (WQI)

Water Quality Index (WQI) was used as an evaluation tool to summarize the overall quality of the water [31] using the tested water quality parameters [16,17,32,33,34] The weighted arithmetic WQI could be calculated by the following Equation (1) as described by [35] using seven to twelve water quality parameters. In the current study, nine water quality parameters, i.e., pH, EC, TEMP, TUR, CODMn, Cl, NO3, SO42−, and F, were used in calculating WQI.
W Q I = W i q i W i
where Wi is the corresponding weightage of the ith water quality parameter, and qi is the quality rating of the ith water quality parameter. The corresponding weightage of a parameter (Wi) was calculated by using Equation (2).
W i = 1 ( 1 S i ) S i
where Si is the recommended permissible value of the ith parameter. Sri Lankan water quality standards (SLS) 614:2013 [26] and BIS IS 10500:2012 [28] guidelines (for EC) for drinking water were used to assign the Si of each chemical parameter (Table 1). The quality rating (qi) of the ith parameter was calculated by Equation (3).
q i = 100 ( V i V 0 ) ( S i V 0 )
Vi represents the actual value of the ith parameter. V0 is the ideal value of the parameter since always V0 = 0 except for the pH where V0 (pH) = 7. WQI values initiated from 0 were scaled into five categories as in Table 2 to express the suitability for drinking [17,32].

2.3.2. Calculation of Heavy Metal Pollution Index (HPI) and Heavy Metal Evaluation Index (HEI)

Heavy metal pollution index (HPI) and heavy metal evaluation index (HEI) are used to esteem the water quality in terms of heavy metal contamination and their health risk [36]. These indices were calculated by using Equations (4) and (6) mentioned below [37,38,39].
H P I = i = n n ( W i Q i ) i = n n W i
where Wi and Qi are the corresponding weightage ( W i = 1 S i ) and quality rating of the ith tested heavy metal, respectively.
Q i = M i S i × 100
H E I = n = i n M i S i
The quality rating of the ith tested heavy metal (Qi) was calculated by Equation (5), where Mi was the actual value of the tested heavy metal concentration. Si is the recommended permissible value of the ith heavy metal (Si) from Sri Lankan water quality standards SLS 614:2013 or WHO guidelines as mentioned in Table 1.
The HPI and HEI were calculated using the tested eleven heavy metals with recommended permissible values mentioned in Table 1. Pollution of heavy metals in water can be evaluated using both HPI and HEI values, i.e., HPI and HEI values of <15 and <10, respectively, indicate a low level, and ≥30 and ≥20, respectively, indicate a high level of heavy metal contamination [39].

2.3.3. Statistical Analysis

Descriptive and statistical data analysis was conducted using SPSS 25 software and ORIGIN PRO 2024 software. Multivariate statistical analysis was conducted by following cluster analysis (CA) and principal component analysis (PCA) on normalized data of the tested parameters. CA was used to cluster 15 sampling locations based on the similarities of all tested physicochemical parameters. It was important in predicting the water quality of river segments. PCA predicted patterns and relationships in multivariate data, creating new components by considering eigenvalues, which represented the amount of variance explained by each principal component [40].

2.3.4. Mapping of Spatial Variation of Water Quality Parameters

Sampling area and spatial geographic maps prepared using ESRI (ArcGIS 10.8.2 software Inc., Redlands, CA, USA) were used to describe the spatial variation of water quality parameters, WQI, and land-use patterns. To predict the possible ways of contamination, the land-use pattern related to the catchment (5 km radius of the raw water intake) of the selected Mahaweli River segment was utilized using maps purchased from the Land-use Policy Planning Department, Kandy, Sri Lanka.

2.3.5. Efficiency of Water Treatment Plants

The contaminant removal efficiency of water treatment plants was calculated using Equation (7).
R e m o v a l   e f f i c i e n c y   % = C R C T C R × 100
whereas CR and CT are the concentrations of the particular parameter in raw water and treated water, respectively.

3. Results and Discussion

3.1. Analysis of Physicochemical Water Quality Parameters and WQI of Raw and Treated Water

The descriptive statistics of 32 physicochemical water quality parameters of raw and treated water are summarized in Table 3. For each parameter, values obtained during the four field visits were not significantly different from each other and, therefore, the average values are presented in Table 3.
The pH of intake raw river water samples ranged from 6.6 (from Thalawakelle-Nanuoya, Nawalapitiya, Ulapane, Elpitiya, Greater Kandy, Haragama, and Balagolla) to 7.3 (Kotagala), whereas that of treated water samples ranged from 6.5 (Polgolla) to 6.9 (Haragama). All the pH values in both raw and treated water samples were within the recommended permissible pH range (6.5–8.5) for drinking water. The process of coagulation–flocculation treatment is done to reduce the turbidity of the water. The coagulants “aluminum sulfate” or “polyaluminum chloride” are responsible for the slightly lower pH observed in the treated water compared to the raw water due to the action of alum in aqueous media as a weak acid [41]. Temperature varied from 20.2 °C to 24.5 °C in raw water samples, and for treated water samples, the variation was from 19.3 °C to 24.0 °C (Table 3). It has been reported that, for tropical regions, river water temperature is usually greater than 20 °C and can fluctuate in a narrow range of 1–4 °C [42]. Water temperature can influence other physicochemical parameters of water [43].
Turbidity of the river grew as the river moved downstream due to the accumulation of suspended solids [44] and reached its comparatively highest value of 13.43 NTU during the time of measurements at Haragama, where a reservoir was formed. A comparatively higher turbidity was observed at Thalawakelle-Nanuoya, possibly due to heavy anthropogenic activities in the area, i.e., soil erosion of the hillside due to disturbance caused by urbanization, farming and agriculture, polluted water discharges from industries, and tourism and recreational activities in Nuwara Eliya city. In the treatment process, pre-settling, coagulation, flocculation, and sedimentation work together to remove all settable and suspended solids present in raw water before supplying treated water [45]. Therefore, the turbidity of all treated water samples was below the permissible value of 2.0 NTU mentioned in SLS 614:2013 [26]. The turbidity removal efficiencies of water treatment plants were calculated using Equation (7), and in most WTPs (11 out of 14), the treatment process removed 63.4–94.7% of turbidity. The lowest average turbidity removal efficiency (7.0%) was seen at Kotagala WTP, where the treatment process was limited only to disinfection. Thalawakelle and Pundaluoya WTPs also had significantly low efficiencies in removal of turbidity (32.2% and 39.3%, respectively) due to the improved quality of raw water samples of these intakes. These lower turbidity removal efficiencies did not have any significant effect on treated water because of the lower turbidity (less than 1.73 NTU) present in the raw water at these WTPs. Recommended permissible EC values were not available either in SLS 614:2013 [26] or in WHO guidelines [27]; therefore, the BIS IS 10500:2012 [28] recommended maximum value of 400 µs/cm was used for data interpretation. The EC predicts the presence of inorganic impurities in water samples. All the raw and treated water samples had EC values below the BIS maximum permissible value. The maximum EC values in raw and treated water were 175.8 µs/cm and 152.6 µs/cm, respectively, in University Plant. The mass concentration of oxygen consumed by dissolved and suspended materials in water is referred to as COD. None of the raw or treated water samples exceeded the SLS 614:2013 maximum permissible level of 10 mg/L. The maximum CODMn value reported for raw water was 9.1 mg/L from Haragama.
For all raw and treated water samples, concentrations of all tested anions were within the permissible level. Based on the average values (mg/L), the anionic dominance pattern followed the order Cl > NO3 > SO42− > F in raw water and Cl > SO42− > NO3 > F in treated water. Addition of aluminum sulphate during the treatment process must have slightly increased the concentration of SO42− in treated water (3.98 mg/L average) compared to the raw water (2.28 mg/L average). Addition of chlorine at the disinfection step forms HOCl and OCl ions, which release Cl into water while reacting with organic matter. Therefore, the concentration of Cl in treated water (7.99 mg/L average) was comparatively higher than that in raw water (5.72 mg/L average). Concentrations of Br and PO43− in raw and treated water samples were below the analytical sensitivity levels (0.004 mg/L and 0.002 mg/L, respectively) of the testing procedure. In raw water samples, heavy metal contamination had the pattern Fe > Sr > Ba > V > Zn > Al > Ni > Cr > Mn > Rb > Cu > Co > Li > As > Cd = Ag > Cs > Bi > Tl = Be > In. The maximum permissible limits were available only for Fe, Mn, Cu, Al, Ni, Zn, As, Cd, Cr, Ba, and Ag, and only the Fe average concentration exceeded the maximum permissible limit (300 µg/L), and the highest Fe concentration was from Kotagala raw water (575.7 µg/L). Since the Kotagala intake is in the uppermost catchment area of the river, interference of anthropogenic activities is expected to be minimal in this area. Runoff from soil rich in iron, especially from areas with abundant iron-bearing minerals, can be a reason for high Fe concentrations in the river surface water [46].
The concentration of Al had a significant difference (p = 0.0010) between raw and treated water, where treated water had comparatively higher concentrations due to the residual Al from coagulants, i.e., aluminum sulphate and poly aluminum chloride used for the treatment process [47]. The dose of the coagulant is increased with the high turbidity of raw water to remove all suspended solids. Therefore, higher turbidity in GK, PO, HA, and BA raw water (ranged from 10.0 to 13.4 NTU) has resulted elevated in Al concentrations in their treated water (33.7 to 126.2 µg/L). Even though the turbidity was low (4.5 NTU) in intake water, treated water from Paradeka and Nillambe reported higher Al concentrations (78.6 µg/L and 109.8 µg/L, respectively), probably due to the use of overdoses of coagulants. Therefore, it is important to adjust the dose of coagulants properly with the level of raw water turbidity.
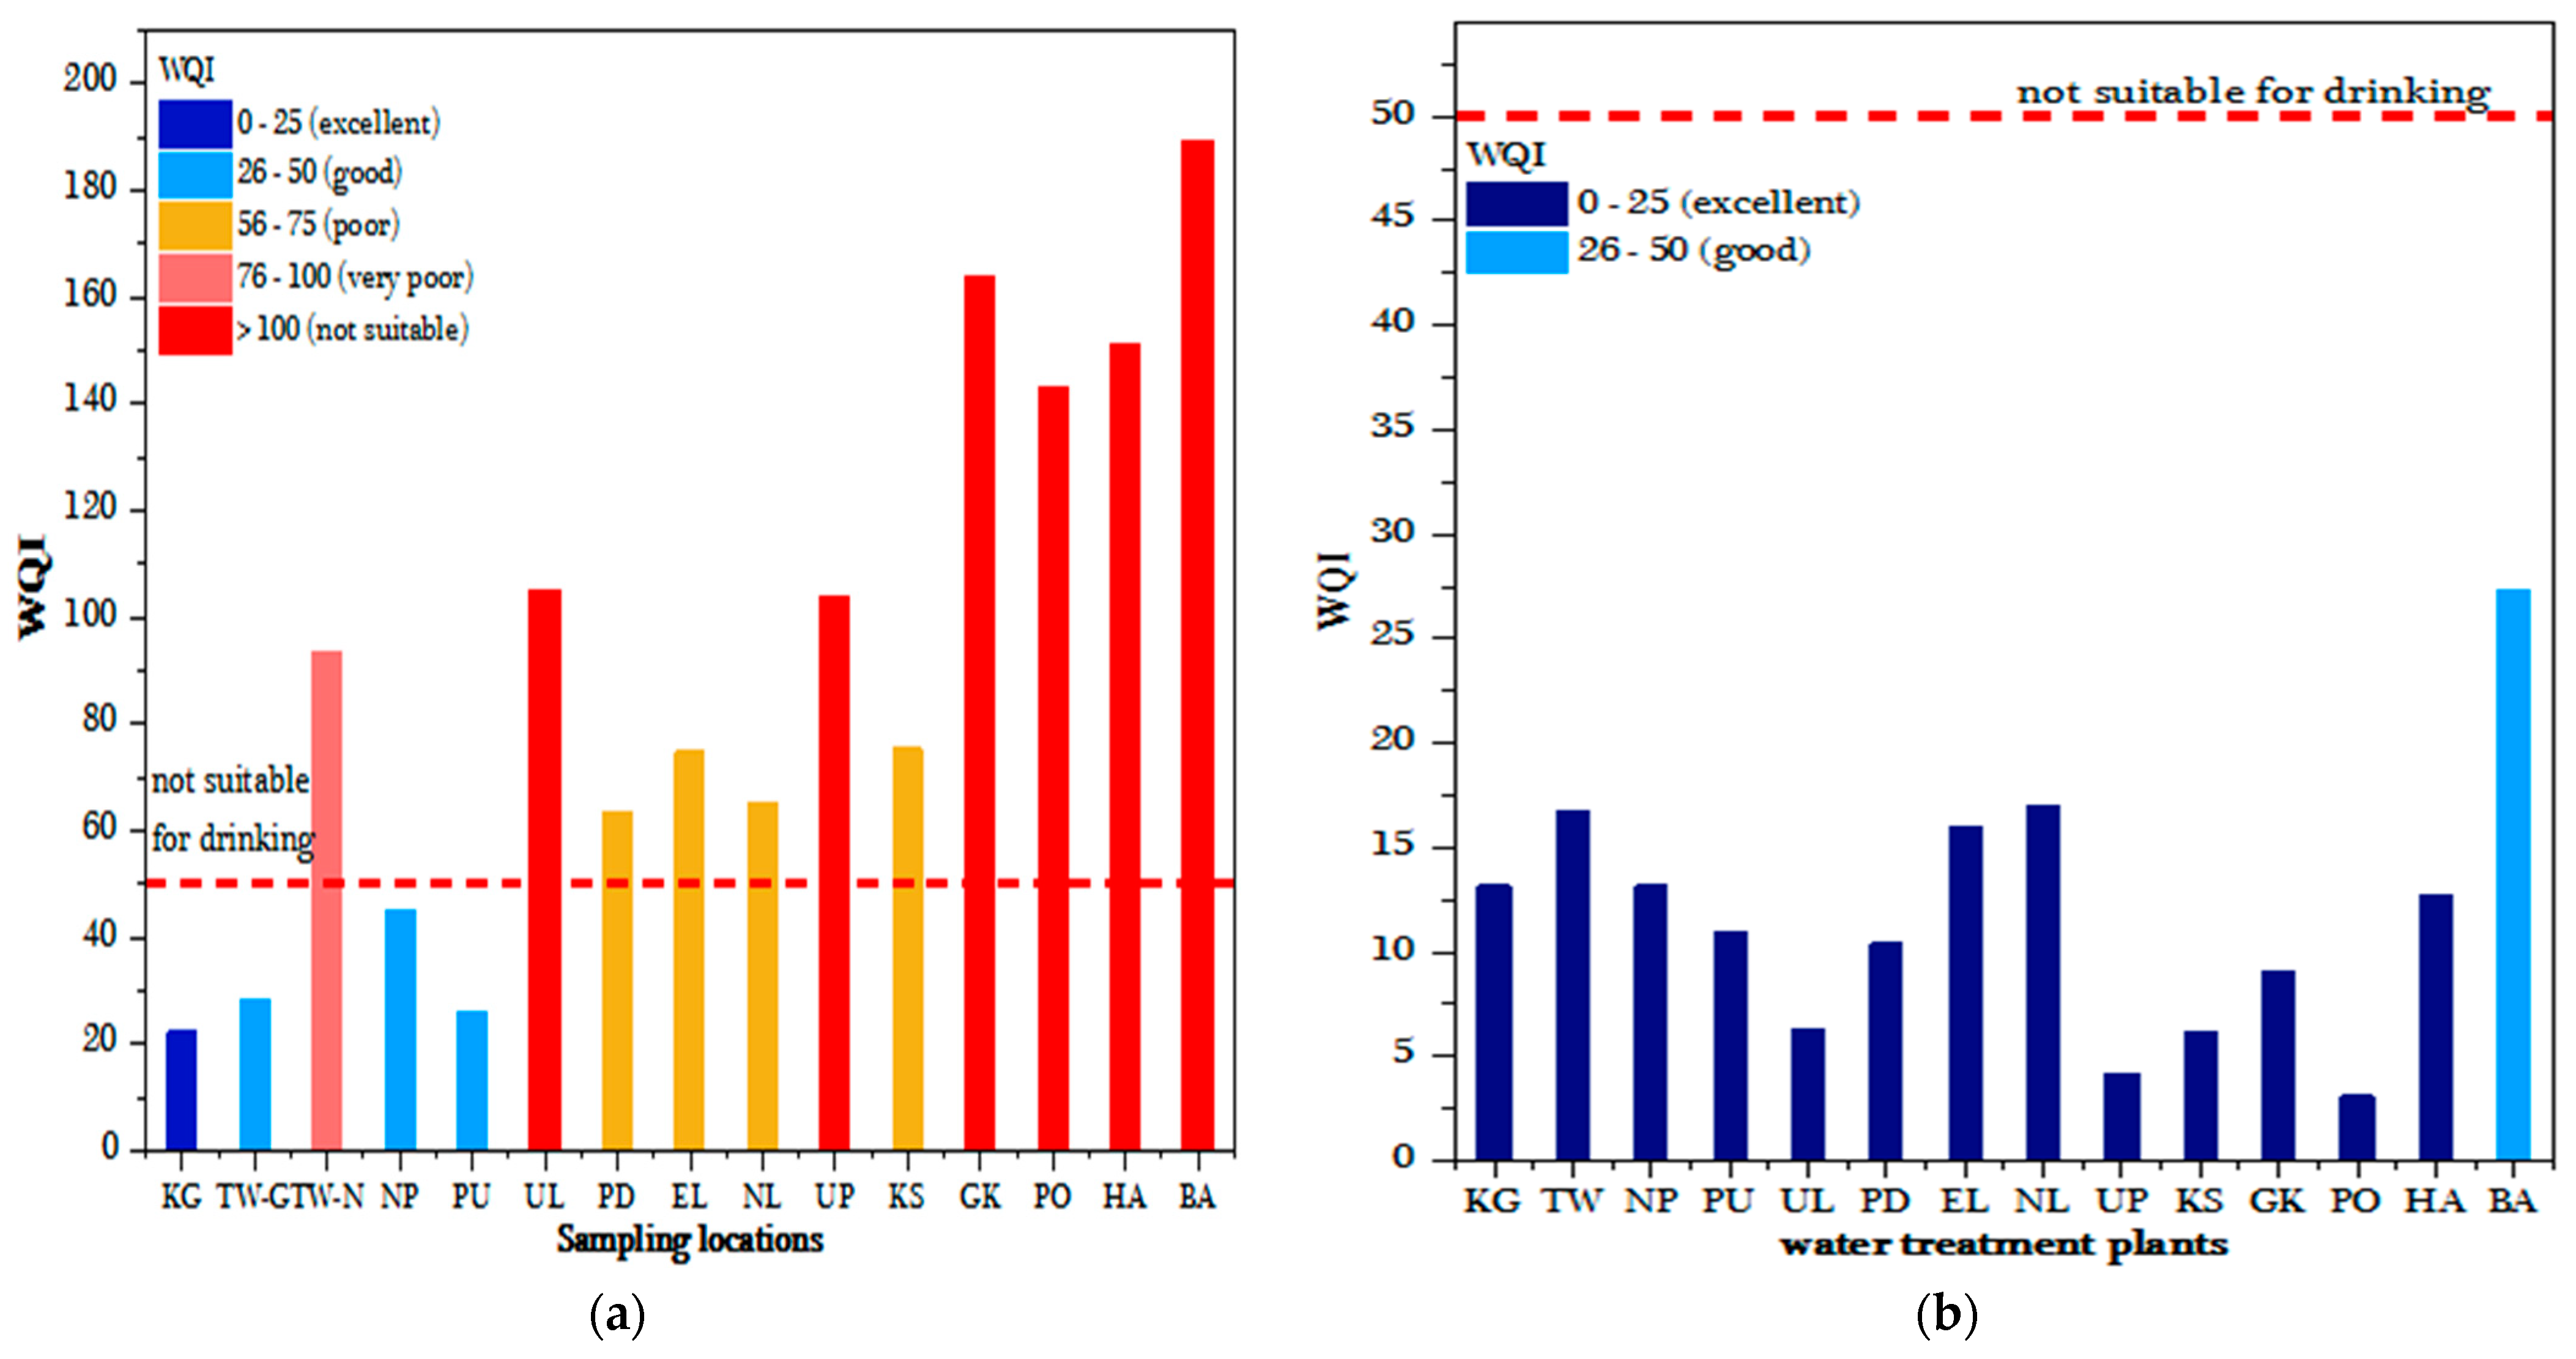
Figure 2 shows the WQIs calculated to estimate the overall water quality of river surface water (raw water) and treated water. Figure 2b shows the WQIs calculated to estimate the overall water quality of the treated water at the WTPs. All treated water samples were ‘Excellent’ in water quality in terms of the WQIs based on physical and chemical water quality parameters, except for Balagolla, where it was ranked as ‘Good’.
About 73.3% of raw water samples had WQI values in the range categorized as unsuitable for drinking purposes (Figure 2a). Only 4 locations (Kotagala, Thalawakelle-Galkanda, Nawalapitiya, and Pundaluoya) had raw water with an acceptable range of WQI (excellent or good) for drinking purposes. Kotagala WTP is the uppermost WTP in the Mahaweli river catchment area and had “excellent” water quality for drinking. Although Thalawakelle-Nanuoya is also in the upper area, it showed a high WQI value indicating “very poor” water quality. This is mainly due to the contaminated effluent water it receives from Lake Gregory, where many anthropogenic activities including tourism and recreational activities, take place. Lake Gregory is situated in the municipal limits of the Nuwara Eliya city, which is the capital of the district Nuwara Eliya. Thalawakelle WTP receives water from both Thalawakelle-Nanuoya and Thalawakelle-Galkanda intakes. In contrast to the Thalawakelle-Nanuoya intake, the Thalawakelle-Galkanda intake exhibits “good” water quality based on WQI because it receives water from a forested hilly area with natural fountains. The management of the Thalawakelle WTP needs to be aware of the water quality difference of the two different intakes and should take appropriate remedial measures where necessary to deliver quality drinking water.
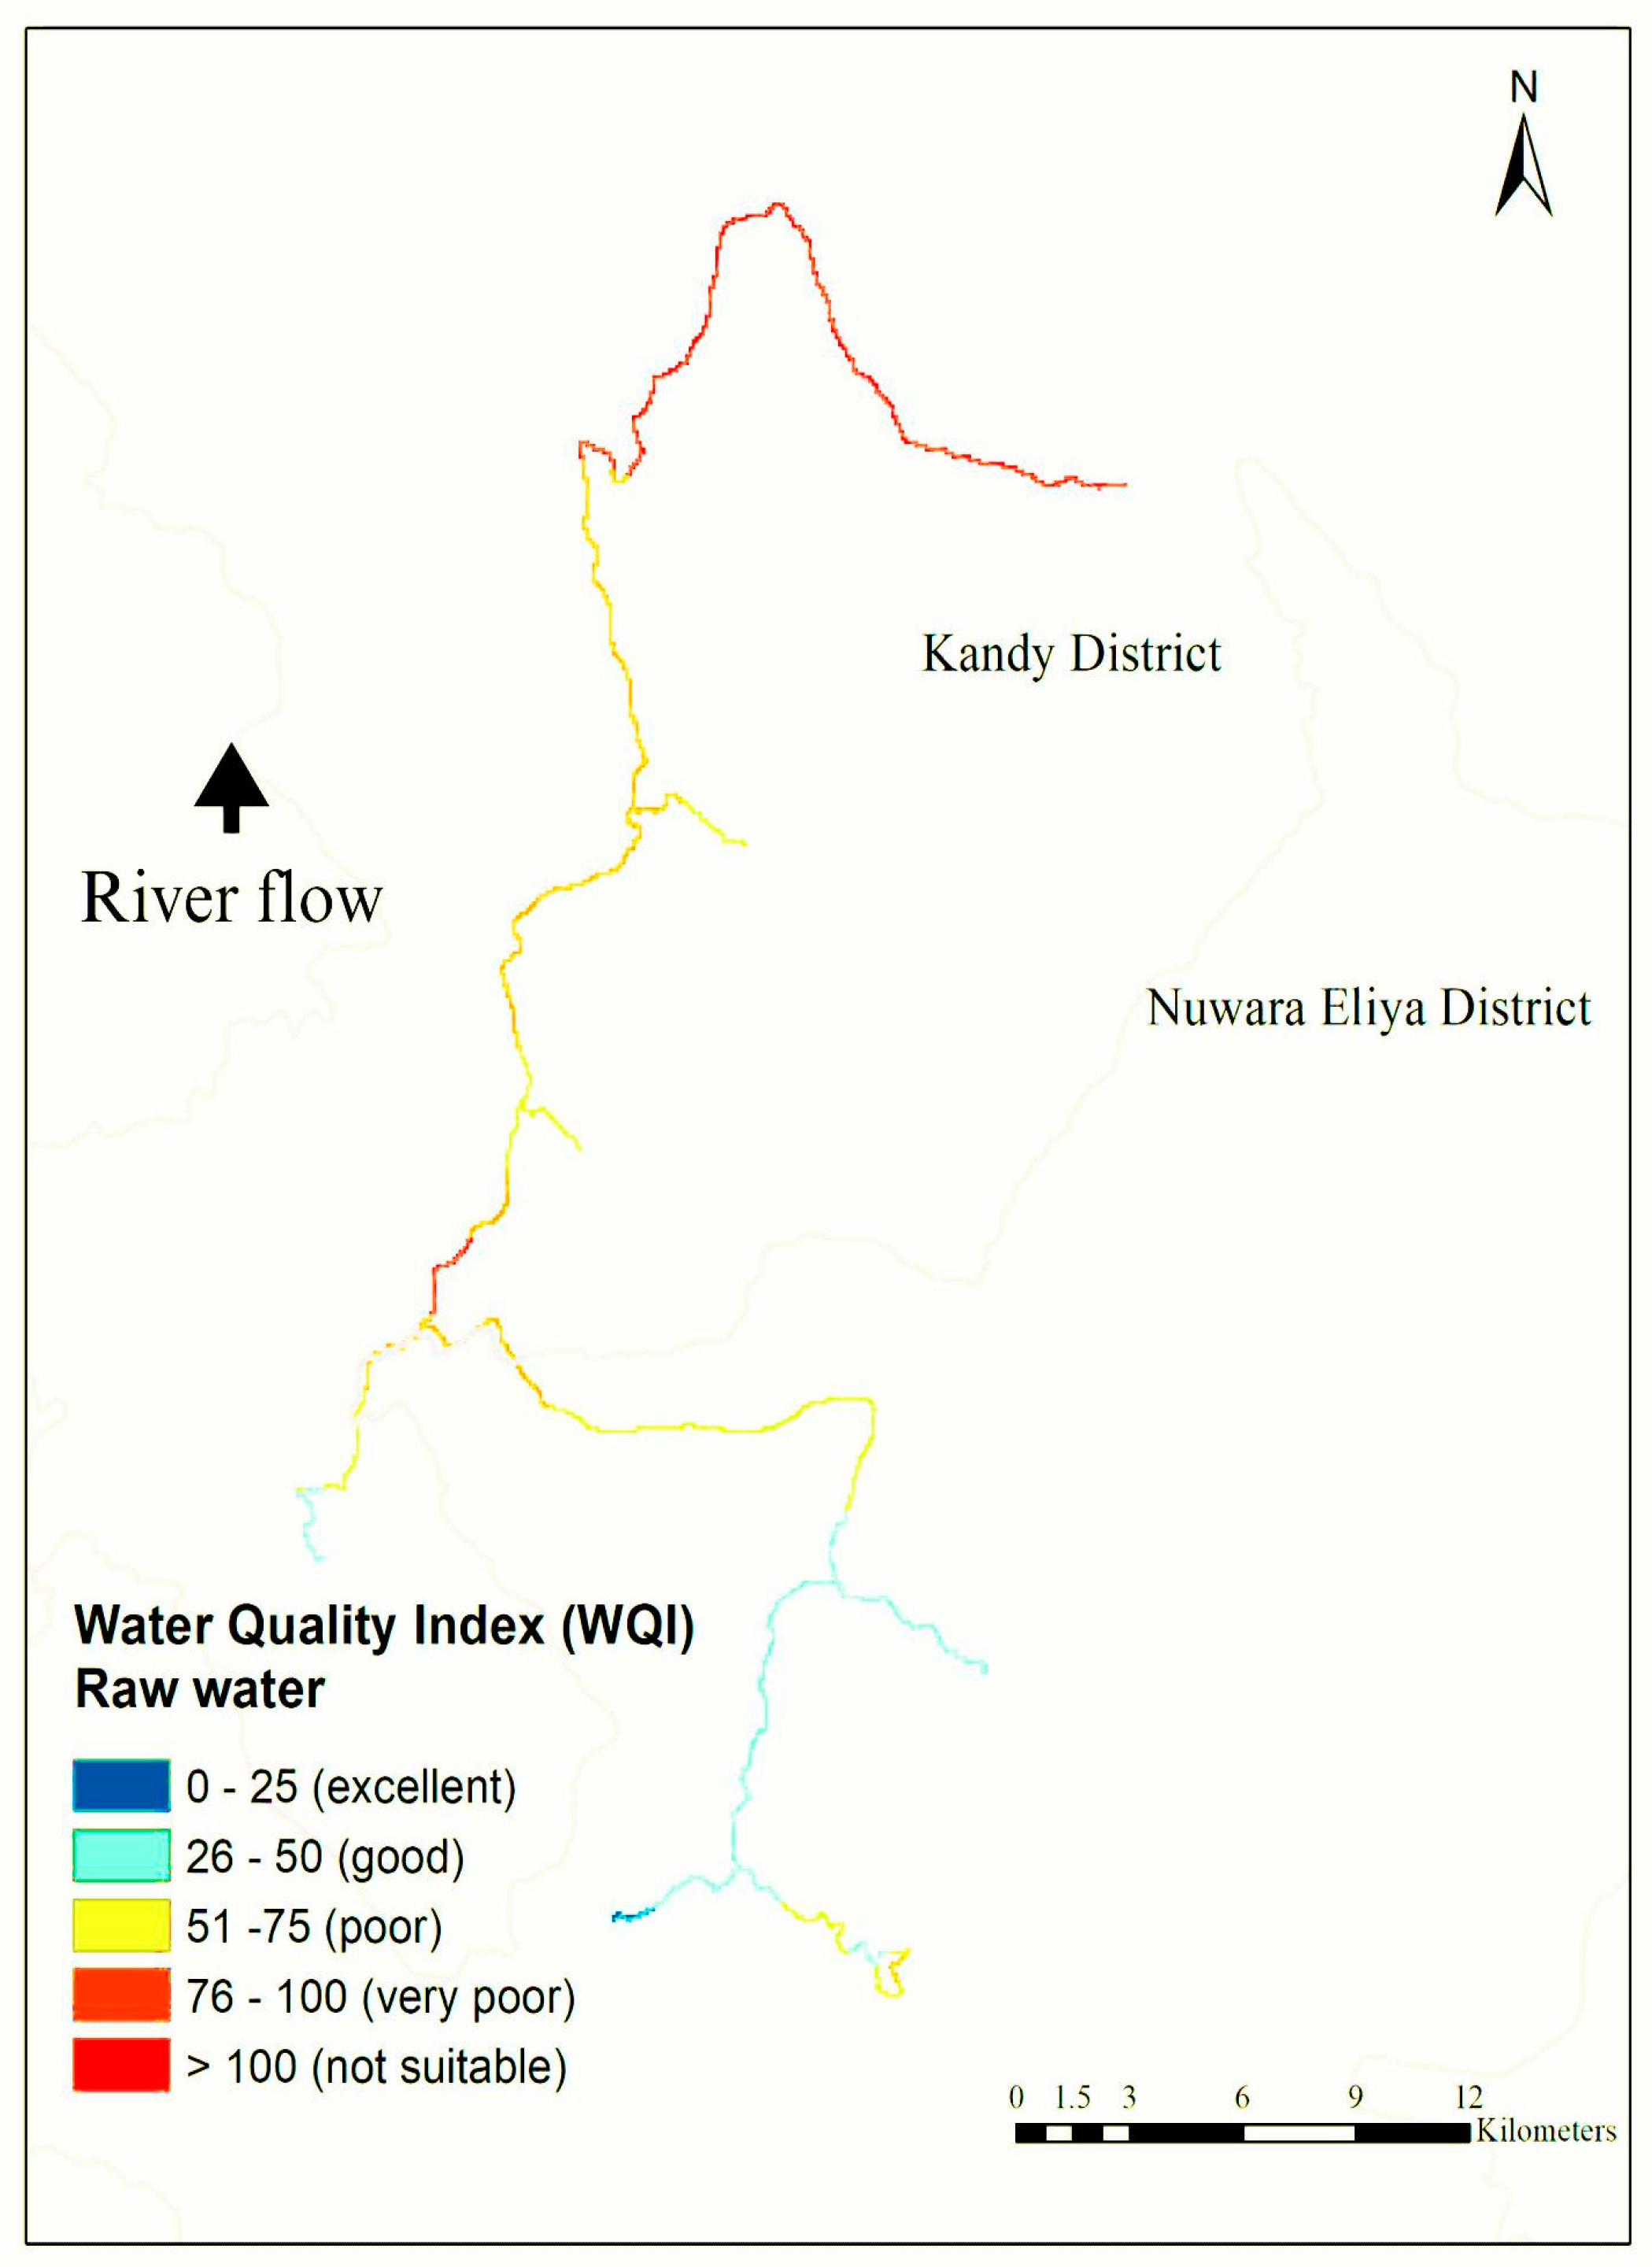
WQIs gradually increased as the river travels from Kotagala to Balagolla, showing gradual water quality deterioration (Figure 2a). WQIs of intakes of Paradeka, Elpitiya, Nillambe, and Kandy South were in the range of 56–75, showing “poor” water quality. A significant percentage (40%) of the sampling locations WQIs had above 100 (‘not suitable’ for drinking). Balagolla reported the poorest water quality (WQI = 180). The Kandy-South sampling location showed a prominent drop in the increasing trend of WQI due to a high dilution effect created by a weir structure built across the river next to the intake of the water treatment plant. The spatial variation of WQI in the raw water of the river is illustrated in Figure 3 using mapping techniques of ArcGIS 10.8.2 software. The water quality of the river decreased with increased urbanization of sampling locations of the selected Mahaweli River segment.
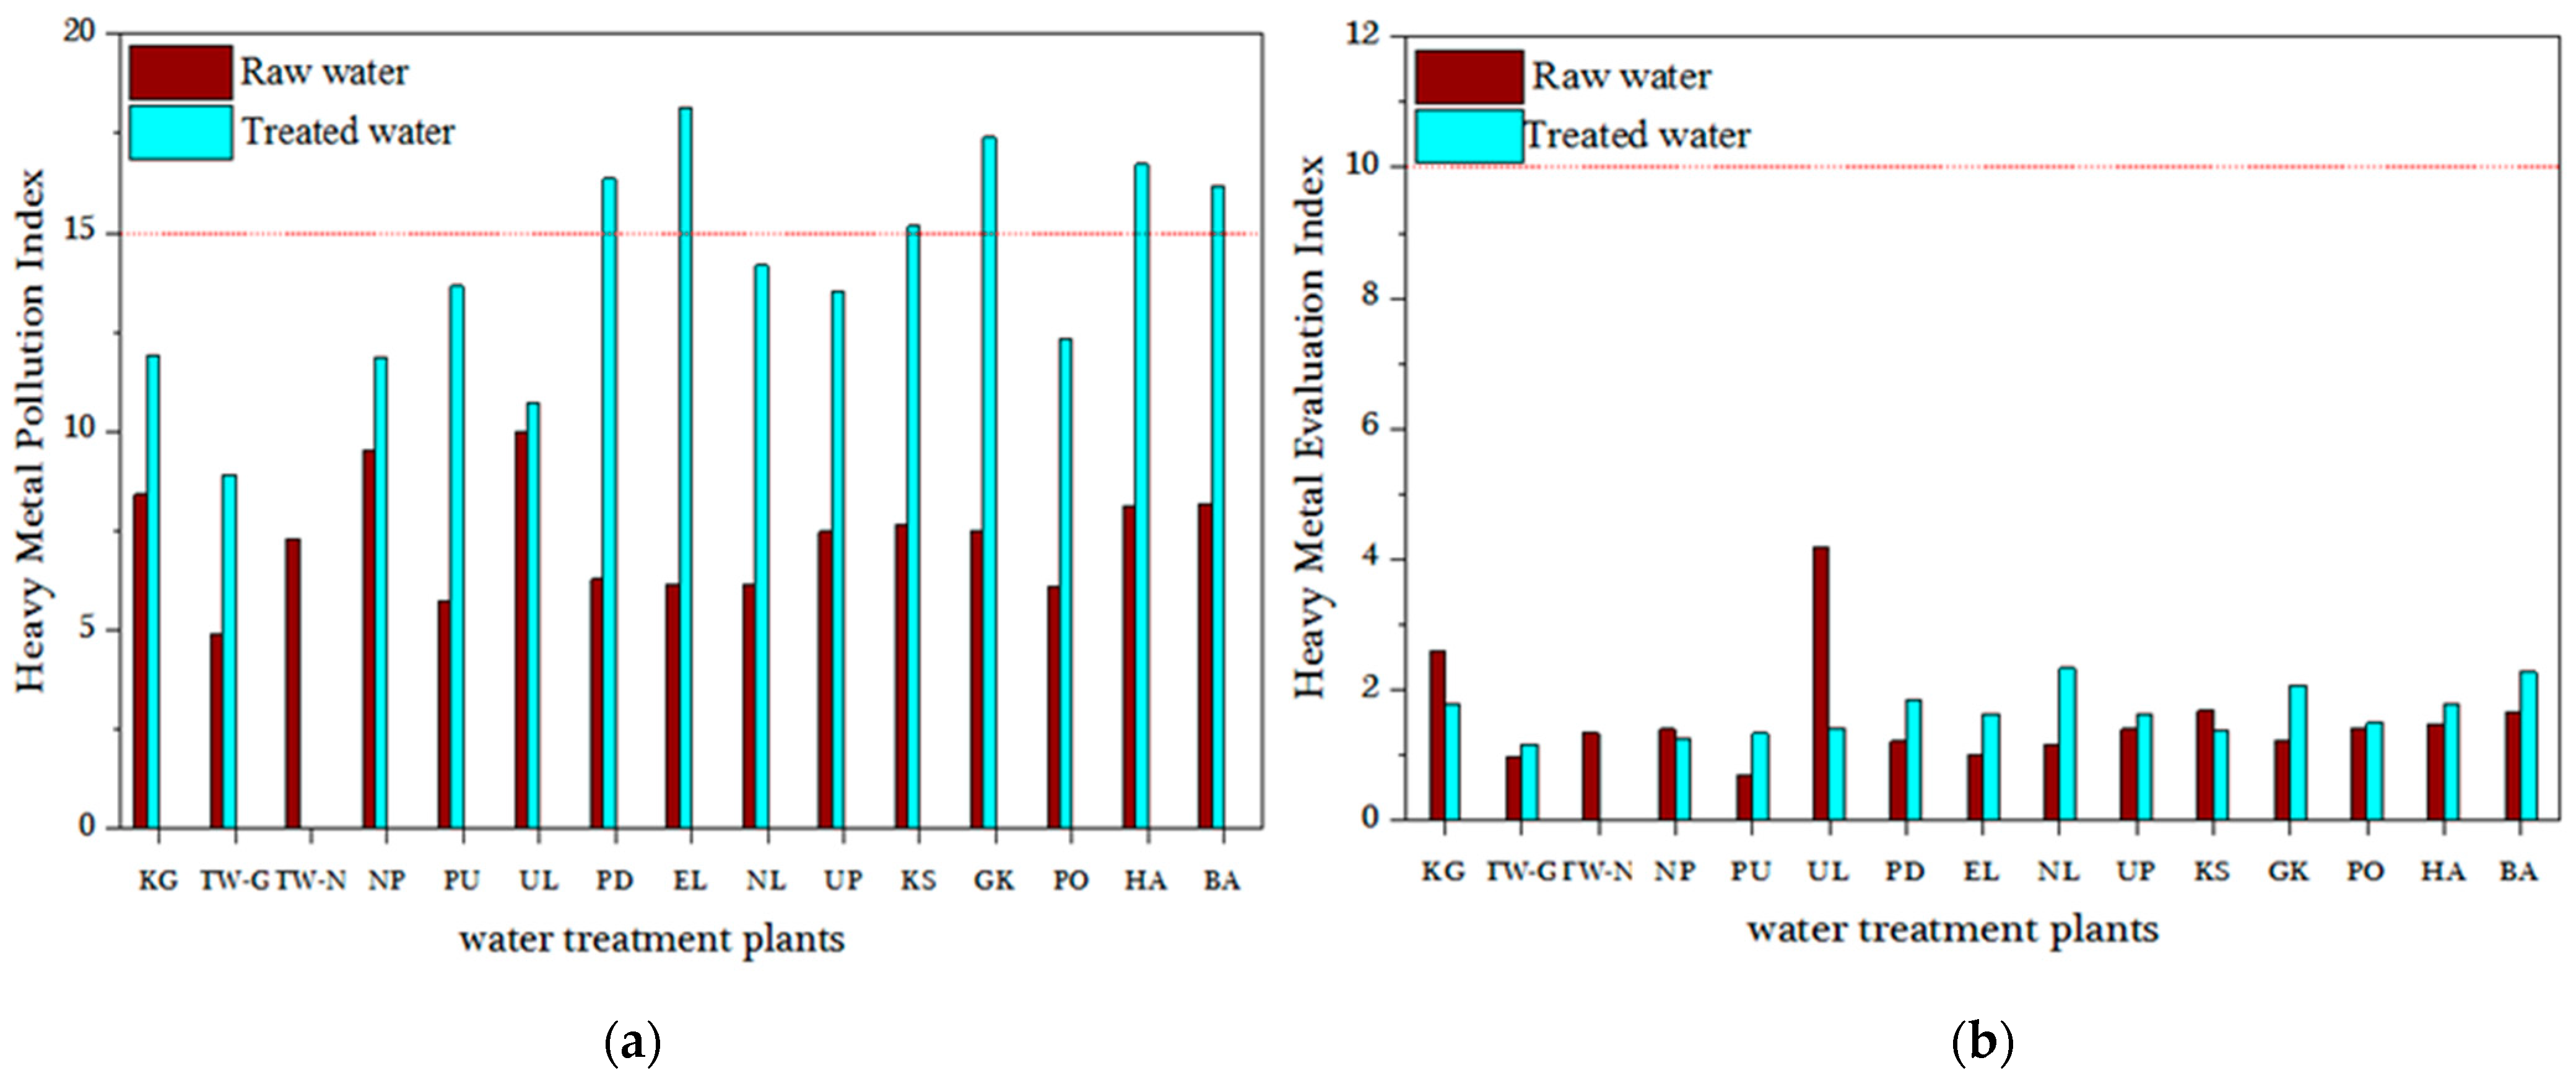
Heavy metal pollution indices (HPIs) and heavy metal evaluation indices (HEIs) of raw and treated water samples are shown in Figure 4. The level of contamination is considered as the combined effect of both HPI and HEI. Heavy metal pollution index (HPI) indicates the overall effect of the contamination, whereas HEI indicates relative contamination with respect to a standard value [48]. For the raw water samples, HPIs were in the range of 4.9–10.0, and HEIs were in the range of 0.7–4.2. These were below the discriminating reference lines for contamination, i.e., 15 for HPI and 10 for HEI, showing the low level of heavy metal contamination of raw water (Figure 5). For the treated water, HPI and HEI value ranges were 8.9–18.1 and 1.2–2.3, respectively. Even though all HEI values of treated water samples were less than 10, HPI values of Paradeka (16.4), Elpitiya (18.1), Kandy South (15.2), Greater Kandy (17.4), Haragama (16.7), and Balagolla (16.2) were above the discriminating HPI value of 15.

3.2. Cluster Analysis and Spatial Variation of Water Quality Parameters

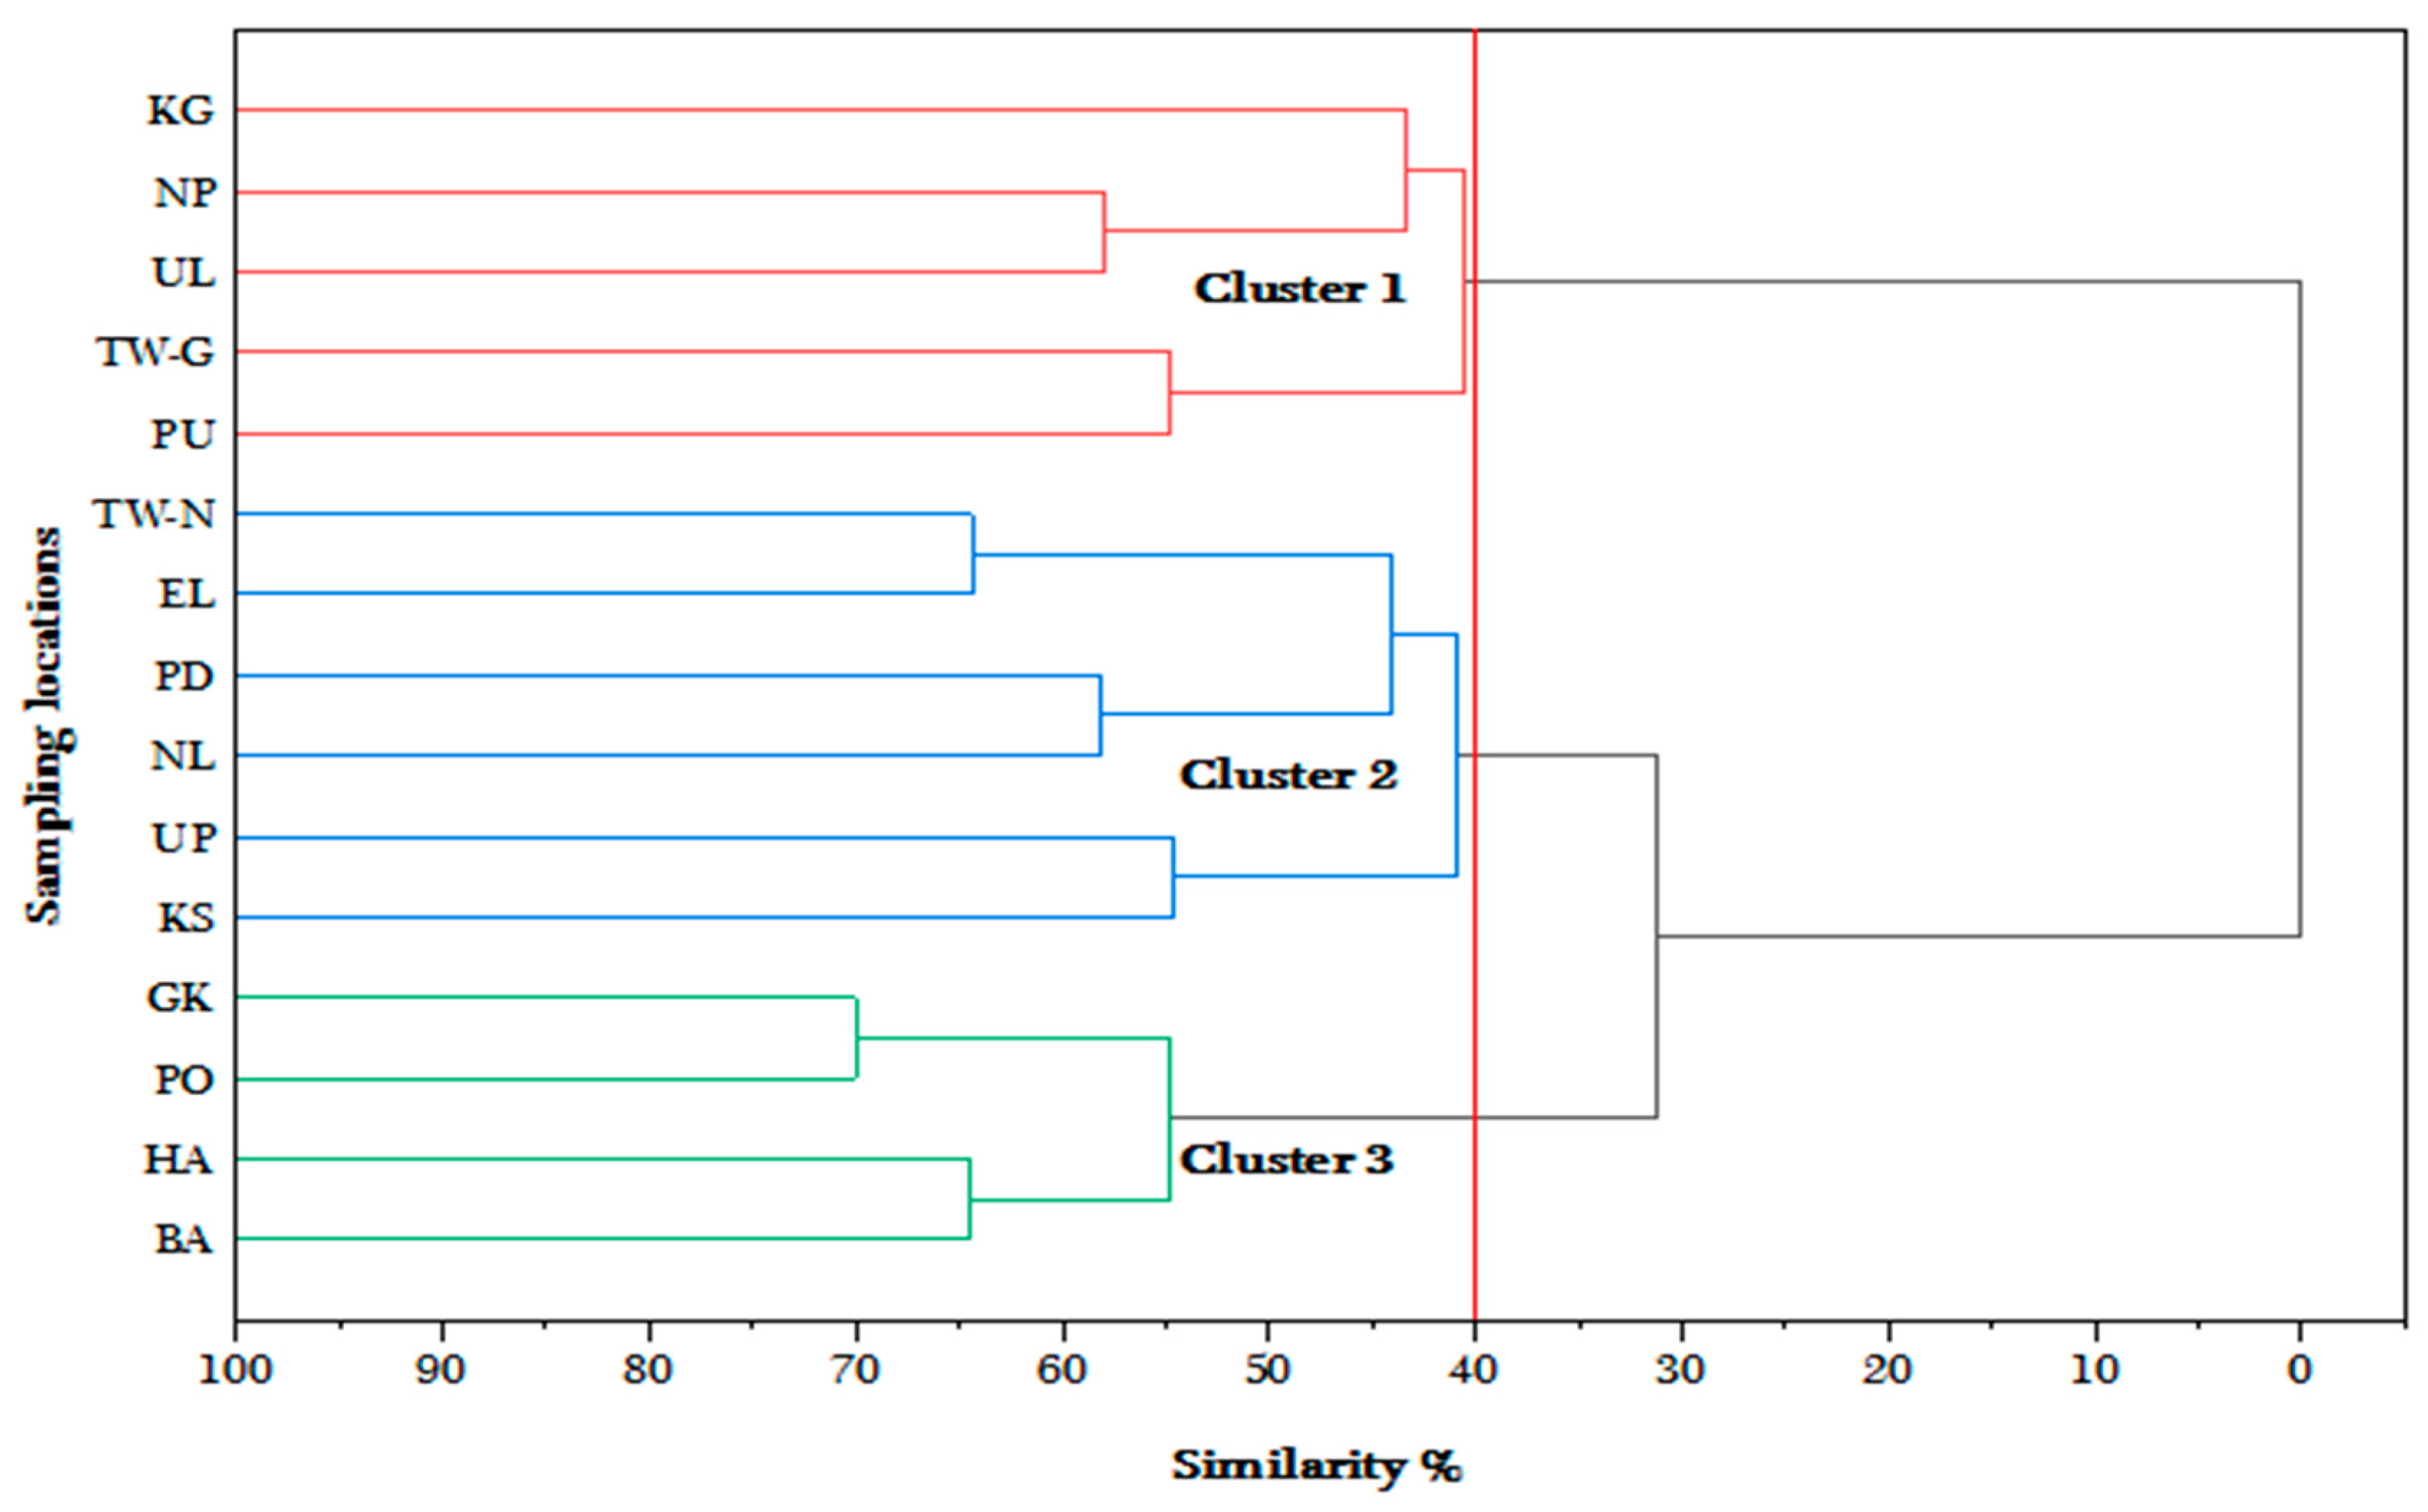
The cluster analysis generated a spatial dendrogram based on physical properties, anion, and cation concentrations of raw river waters, dividing the 15 raw water sampling locations into 3 clusters with a similarity percentage at >40% (Figure 5).
Cluster 1 included Kotagala, Thalawakelle-Galkanda, Nawalapitiya, Ulapane, and Pundaluoya, whereas Thalawakelle-Nanuoya, Elpitiya, Paradeka, Nillambe, University Plant, and Kandy South were in cluster 2. The remaining four sampling locations (Greater Kandy, Polgolla, Haragama, and Balagolla) were in cluster 3. Clustering coincided with the WQI values of the sampling locations, and cluster 1 had the least contamination levels with WQI suitable for drinking purposes. The sampling locations in cluster 3 had the highest WQI values, illustrating a higher contamination level than the other two clusters. Cluster 2 could be categorized as the medium level of contamination.
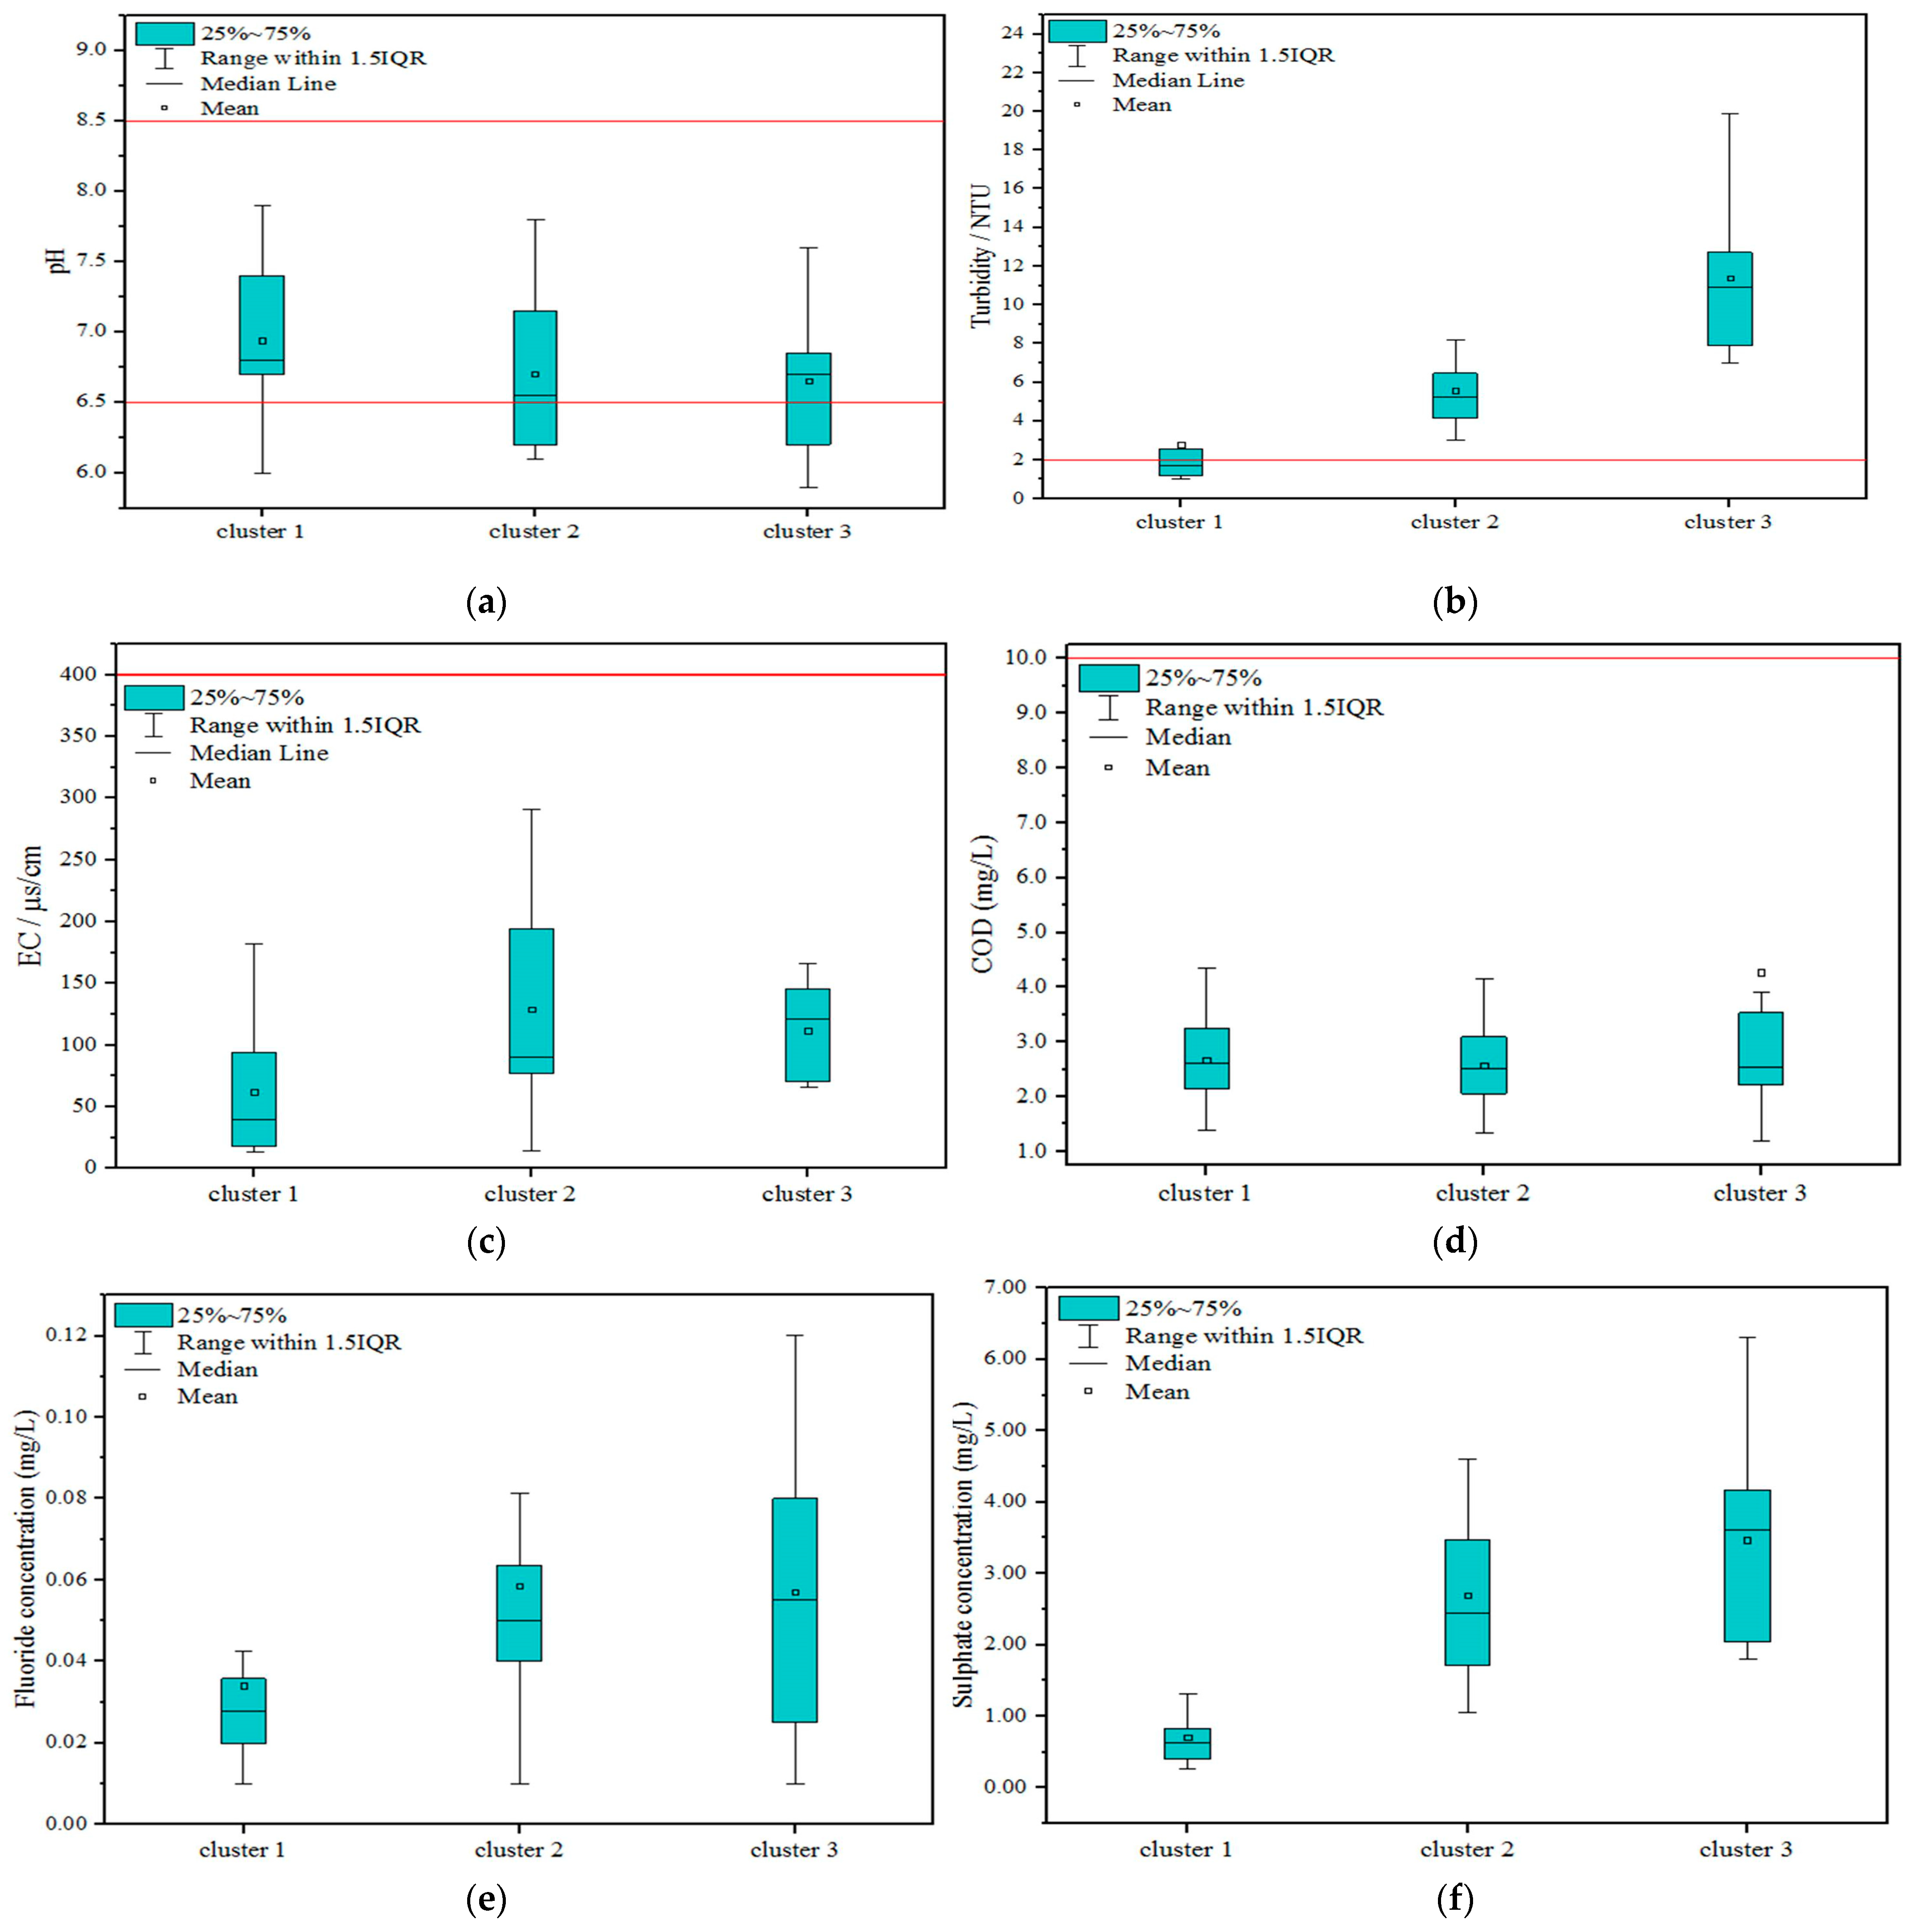
The variability of tested physical parameters and anions is illustrated as box and whisker plots in Figure 6. A significant difference was shown in turbidity between clusters. When the river flows downstream, the turbidity of raw water increased significantly.

3.3. Principal Component Analysis and Identification of Contamination Sources

In the present study, Principal Component Analysis (PCA) could explain 87.20% of the variance of the data set by six principal components (PCs) with eigenvalues > 1 (Figure S1). The factor loadings of tested 32 parameters were shown for initial three PCs in Figure S2 and for initial six PCs in Table 4. The high loading was considered at >0.7.
Principal component 1 (PC1) was significant for the 41.56% variance of the data set, giving comparatively high loading values to pH, V, Cr, Ni, Rb, Co and As. This must be mainly due to the contamination with sources releasing heavy metals by industrial waste discharge [49]. The presence of Sr and Rb could also be influenced by the geological composition of the area [50]. Therefore, PC1 can be interpreted as the sources of “industrial pollution and mineralization”.
About 17.40%, 9.43%, 7.16%, 6.38%, and 5.28% of the variance of the data set were explained by PC2, PC3, PC4, PC5, and PC6, respectively. In PC2, high positive loadings were given by chloride and Ba, indicating that the sources of contaminations are natural sources like mineral deposits or industrial waste contaminations [51,52]. Hence, PC2 also indicates the variance due to “industrial pollution and mineralization”. PC3 had high positive loadings to turbidity and water temperature, indicating the environmental and human physical activities. Giving comparatively highest positive loadings to Mn and Zn indicates the variability of PC4. Mn is released mainly from soil sources, and Zn also has an industrial source [53]. PC5 and PC6 had high positive loading to Li and EC, respectively. According to PCA, the variance of water quality parameters among sampling locations was due to industrial pollution and natural sources such as mineralization and soil erosion in the sampling area.

3.4. Contamination of Pesticides and Antibiotics

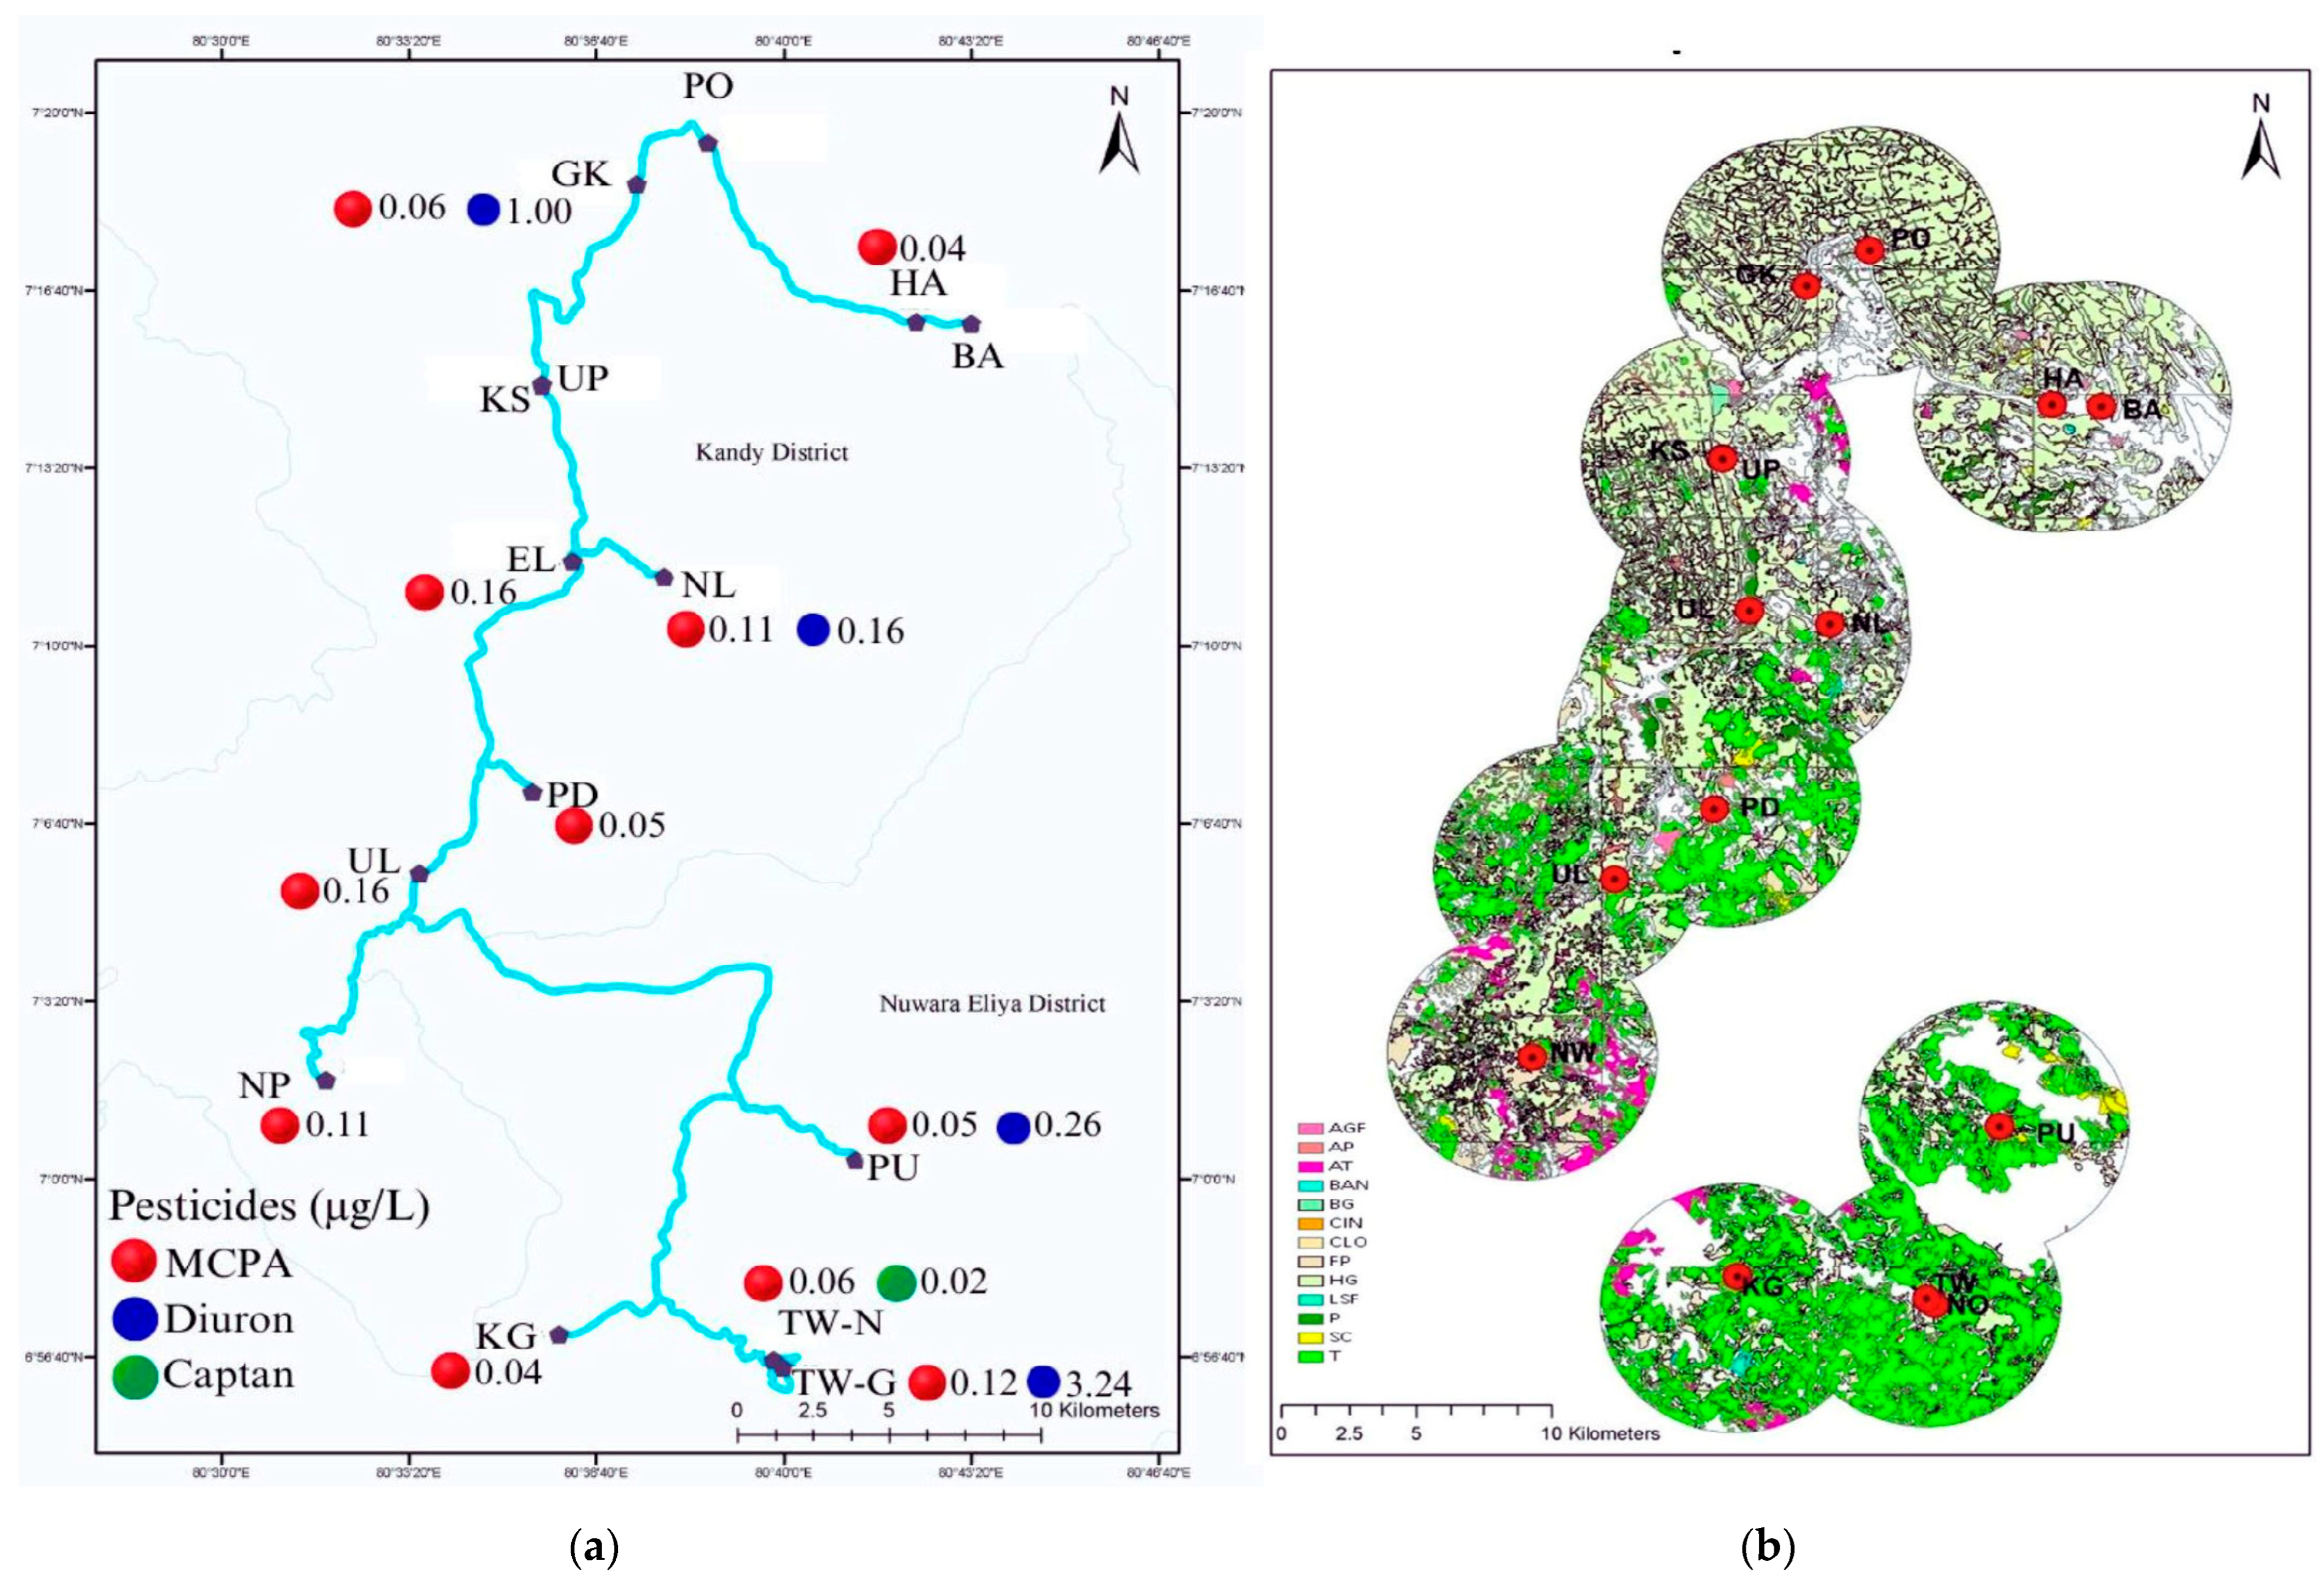
Thirty different antimicrobials belonging to sulfonamides, tetracyclines, fluoroquinolones, and beta-lactams were tested and not detected in water samples (LOQs ≤ 5 ppb). The contamination of pesticides in the selected river segment was screened by analyzing three chemicals widely used in the study area. MCPA (2-methyl-4-chlorophenoxyacetic acid) is a phenoxyalkanoic acid herbicide, one of the commonly detected agrochemicals in water sources [54]. Diuron (1,1-dimethyl, 3-(3′,4′-dichlorophenyl) urea) is also a broad-spectrum herbicide, and captan (N-trichloromethylthio-4-cyclohexane-1,2-dicarboximide) is used to control the fungi growth of plants (fungicide) [55]. River contaminations with MCPA, diuron, and captan are shown in Figure 7a.
Pesticides were detected mainly in the upstream of the river where agricultural activities are intense. The use of land for agricultural purposes is described by the land use map of 5 km radius of each selected sampling location (Figure 7b). The detection frequencies of MCPA, diuron, and captan were 73.3%, 26.7%, and 6.7%, respectively. After the ban of use on the glyphosate in Sri Lanka in 2014, MCPA and Diuron were used as alternatives in the tea plantation sector [56,57]. MCPA was the most common and predominant in the upstream (Kotagala to Elpitiya) and detected in eleven raw water samples in concentrations of 0.04 to 0.16 µg/L. However, it was present in the lower stream WTPs Greater Kandy (0.06 µg/L) and Haragama (0.04 µg/L) raw water intakes, probably due to point source contaminations by the runoff from Guhagoda dumping yard located near Greater Kandy intake, and extensive agricultural farming at Open Prison, Pallekele close to Haragama intake, respectively. Captan contamination was detected only at Thalawakelle-Nanuoya raw water (0.02 µg/L). Diuron was detected only from Thalawakelle-Galkanda (3.24 µg/L), Pundaluoya (0.26 µg/L), Nillambe (0.16 µg/L), and Greater Kandy (1.00 µg/L) raw water intakes.

4. Conclusions

The Mahaweli River segment between Kotmale and Victoria reservoirs had a gradient of contamination of surface water from upstream to downstream due to geographical variations, industrial effluents, natural environmental factors, and human physical activities.
  • Kotagala, the uppermost WTP, had intake water ‘Excellent’ for drinking, and the lower-most Balagolla WTP intake water was ‘not suitable for consumption’. ‘Very poor’ upstream Thalawakale-Nanuoya intake water was due to the effluent water from Lake Gregory of Nuwara Eliya;
  • Treated water from all 15 WTPs had ‘Excellent’ drinking water quality except for Balagolla, which had ‘Very good’;
  • The present study represents the first attempt at clustering the upper Mahaweli River segment based on physicochemical water quality. Cluster analysis categorized the selected river segment into three clusters based on contamination: low (Kotagala, Thalawakelle-Galkanda, Nawalapitiya, Ulapane, and Pundaluoya); moderate (Thalawakelle-Nanuoya, Elpitiya, Paradeka, Nillambe, University Plant, and Kandy South); and high (Greater Kandy, Polgolla, Haragama, and Balagolla);
  • Mahaweli River surface water was contaminated with MCPA, diuron, and captan in the areas with predominant agricultural activities.
It is recommended to intensify the treatment process of WTPs in the high contamination cluster to maintain high-quality drinking water.

5. Limitations and Recommendations

The present study had to be limited to a one-year period, and it is recommended to repeat similar investigations to monitor water quality at regular intervals. Also, a detailed study on pollution sources of the river catchment area will be important to improve waste management and thereby to minimize river pollution, ensuring sustainable quality drinking water supply to Kandy and Nuwara Eliya districts.

Supplementary Materials

The following supporting information can be downloaded at: https://www.mdpi.com/article/10.3390/w16182644/s1, Table S1: Sampling locations of the selected Mahaweli River segment and the abbreviations used for water treatment plants; Table S2: The use of pesticides in the upper Mahaweli area as per the survey conducted from 3 pesticides vendor shops; Figure S1: Scree plot of principal component analysis based on water quality data of raw river water samples of the selected Mahaweli River segment; Figure S2: 3D loading plot of principal component analysis based on water quality data of raw river water samples of the selected Mahaweli River segment.

Author Contributions

Conceptualization, S.H.P.P.K., S.K.W., R.F., Y.W. and M.Y.; methodology, M.M., M.R. and T.P.; software, P.A.T., F.F. and M.R.; validation, M.M. and T.P.; formal analysis, P.A.T. and M.R.; investigation, P.A.T., F.F., M.M. and T.P.; resources, S.H.P.P.K., S.K.W., R.F. and Y.W.; data curation, P.A.T. and S.H.P.P.K.; writing—original draft preparation, P.A.T.; writing—review and editing, all authors; supervision, S.H.P.P.K., S.K.W., M.M. and R.F.; project administration, S.H.P.P.K. and M.Y.; funding acquisition, S.H.P.P.K. and Y.W. All authors have read and agreed to the published version of the manuscript.

Funding

This project was funded by the University of Peradeniya, Sri Lanka (University Research Council Grant No. MDG: 2022-280). P.A.T. was supported by a research assistantship from the Postgraduate Institute of Science, Peradeniya, Sri Lanka. S.H.P.P.K. was supported by a PIFI Research Award (2022VBA0011) from the Chinese Academy of Sciences (CAS). The APC was funded by CAS through the programs listed under Acknowledgement.

Data Availability Statement

All data that support the findings of this study are included within the article and its Supplementary Materials.

Acknowledgments

The authors gratefully acknowledge the financial support from Alliance of International Science Organizations Strategic Consulting Project (ANSO-SBA-2023-01); Program of the Comprehensive Studies on Sri Lanka (059GJHZ2023104MI); the Program of China-Sri Lanka Joint Center for Water Technology Research and Demonstration by the Chinese Academy of Sciences (CAS); China–Sri Lanka Joint Center for Education and Research by the CAS.

Conflicts of Interest

The authors declare no conflicts of interest.

References

  1. Liyanage, C.; Yamada, K. Impact of Population Growth on the Water Quality of Natural Water Bodies. Sustainability 2017, 9, 1405. [Google Scholar] [CrossRef]
  2. Heidari, H.; Arabi, M.; Warziniack, T.; Sharvelle, S. Effects of Urban Development Patterns on Municipal Water Shortage. Front. Water 2021, 3, 694817. [Google Scholar] [CrossRef]
  3. Khan, M.; Omer, T.; Ellahi, A.; Rahman, Z.U.; Niaz, R.; Lone, S.A. Monitoring and Assessment of Heavy Metal Contamination in Surface Water of Selected Rivers. Geocarto Int. 2023, 38, 2256313. [Google Scholar] [CrossRef]
  4. Yapabandara, I.; Wei, Y.; Ranathunga, B.; Indika, S.; Jinadasa, K.B.S.N.; Weragoda, S.K.; Weerasooriya, R.; Makehelwala, M. Impact of Lockdown on the Surface Water Quality in Kelani River, Sri Lanka. Water 2023, 15, 3785. [Google Scholar] [CrossRef]
  5. Uddin, M.G.; Jackson, A.Y.; Nash, S.; Rahman, A.; Olbert, A.I. Comparison between the WFD Approaches and Newly Developed Water Quality Model for Monitoring Transitional and Coastal Water Quality in Northern Ireland. Sci. Total Environ. 2023, 901, 165960. [Google Scholar] [CrossRef]
  6. Kumar, L.; Kumari, R.; Kumar, A.; Tunio, I.A.; Sassanelli, C. Water Quality Assessment and Monitoring in Pakistan: A Comprehensive Review. Sustainability 2023, 15, 6246. [Google Scholar] [CrossRef]
  7. Zhang, Z.-M.; Zhang, F.; Du, J.-L.; Chen, D.-C. Surface Water Quality Assessment and Contamination Source Identification Using Multivariate Statistical Techniques: A Case Study of the Nanxi River in the Taihu Watershed, China. Water 2022, 14, 778. [Google Scholar] [CrossRef]
  8. Sur, I.M.; Moldovan, A.; Micle, V.; Polyak, E.T. Assessment of Surface Water Quality in the Baia Mare Area, Romania. Water 2022, 14, 3118. [Google Scholar] [CrossRef]
  9. Azhari, H.E.; Cherif, E.K.; Sarti, O.; Azzirgue, E.M.; Dakak, H.; Yachou, H.; Joaquim, C.G.; Salmoun, F.; da Silva, E. Assessment of Surface Water Quality Using the Water Quality Index (IWQ), Multivariate Statistical Analysis (MSA) and Geographic Information System (GIS) in Oued Laou Mediterranean Watershed, Morocco. Water 2022, 15, 130. [Google Scholar] [CrossRef]
  10. Wu, H.; Yang, W.; Yao, R.; Zhao, Y.; Zhao, Y.; Zhang, Y.; Yuan, Q.; Lin, A. Evaluating Surface Water Quality Using Water Quality Index in Beiyun River, China. Environ. Sci. Pollut. Res. 2020, 27, 35449–35458. [Google Scholar] [CrossRef] [PubMed]
  11. Appiah-Opong, R.; Ofori, A.; Ofosuhene, M.; Ofori-Attah, E.; Nunoo, F.K.E.; Tuffour, I.; Gordon, C.; Arhinful, D.K.; Nyarko, A.K.; Fosu-Mensah, B.Y. Heavy Metals Concentration and Pollution Index (HPI) in Drinking Water along the Southwest Coast of Ghana. Appl. Water Sci. 2021, 11, 57. [Google Scholar] [CrossRef]
  12. Chen, S.S.; Kimirei, I.A.; Yu, C.; Shen, Q.; Gao, Q. Assessment of Urban River Water Pollution with Urbanization in East Africa. Environ. Sci. Pollut. Res. 2022, 29, 40812–40825. [Google Scholar] [CrossRef] [PubMed]
  13. Hemachandra, S.C.S.M.; Sewwandi, B.G.N. Application of Water Pollution and Heavy Metal Pollution Indices to Evaluate the Water Quality in St. Sebastian Canal, Colombo, Sri Lanka. Environ. Nanotechnol. Monit. Manag. 2023, 20, 100790. [Google Scholar] [CrossRef]
  14. Chandrasekara, S.S.K.; Chandrasekara, S.K.; Gamini, P.H.S.; Obeysekera, J.; Manthrithilake, H.; Kwon, H.-H.; Vithanage, M. A Review on Water Governance in Sri Lanka: The Lessons Learnt for Future Water Policy Formulation. Water Policy 2021, 23, 255–273. [Google Scholar] [CrossRef]
  15. Preethika, D.; Arachchige, U. Drinking Water Treatment Plant Process Optimization: A Case Study of Kalu River Basin, Sri Lanka. J. Res. Technol. Eng. 2021, 2, 47–59. [Google Scholar]
  16. Siriwardhana, K.D.; Jayaneththi, D.I.; Herath, R.D.; Makumbura, R.K.; Jayasinghe, H.; Gunathilake, M.B.; Azamathulla, H.M.; Tota-Maharaj, K.; Rathnayake, U. A Simplified Equation for Calculating the Water Quality Index (WQI), Kalu River, Sri Lanka. Sustainability 2023, 15, 12012. [Google Scholar] [CrossRef]
  17. Makubura, R.; Meddage, D.P.P.; Azamathulla, H.M.; Pandey, M.; Rathnayake, U. A Simplified Mathematical Formulation for Water Quality Index (WQI): A Case Study in the Kelani River Basin, Sri Lanka. Fluids 2022, 7, 147. [Google Scholar] [CrossRef]
  18. Abeysinghe, N.M.D.E.A.; Samarakoon, M.B. Analysis of Variation of Water Quality in Kelani River, Sri Lanka. Int. J. Environ. Agric. Biotechnol. 2017, 2, 2770–2775. [Google Scholar] [CrossRef]
  19. Jayasiri, M.M.J.G.C.N.; Yadav, S.; Dayawansa, N.D.K.; Propper, C.R.; Kumar, V.; Singleton, G.R. Spatio-Temporal Analysis of Water Quality for Pesticides and Other Agricultural Pollutants in Deduru Oya River Basin of Sri Lanka. J. Clean. Prod. 2022, 330, 129897. [Google Scholar] [CrossRef]
  20. Gunawardhana, W.D.T.M.; Jayawardhana, J.M.C.K.; Udayakumara, E.P.N.; Malavipathirana, S. Spatio-Temporal Variation of Water Quality and Bio Indicators of the Badulu Oya in Sri Lanka due to Catchment Disturbances. J. Natl. Sci. Found. Sri Lanka 2018, 46, 51–67. [Google Scholar] [CrossRef]
  21. Diyabalanage, S.; Abekoon, S.; Watanabe, I.; Watai, C.; Ono, Y.; Wijesekara, S.; Guruge, K.S.; Chandrajith, R. Has Irrigated Water from Mahaweli River Contributed to the Kidney Disease of Uncertain Etiology in the Dry Zone of Sri Lanka? Environ. Geochem. Health 2015, 38, 679–690. [Google Scholar] [CrossRef] [PubMed]
  22. Thilakarathna, P.T.A.; Fareed, F.; Athukorala, S.; Premachandra, T.N.; Noordeen, F.; Makehelwela, M.; Fernando, R.; Gamage, C.; Rajapakse, M.; Weragoda, S.K.; et al. Monitoring Coliform Contamination at Mahaweli River Water Intakes to Ensure Safe Drinking Water Supply. Sri Lankan J. Infect. Dis. 2023, 13, 15. [Google Scholar] [CrossRef]
  23. Bandara, H.R.L.C.; Weerasekara, W.B.M.L.I.; Weragoda, S.K. Potential for Formation of Trihalomethane in Diverted and Non-Diverted Areas of Mahaweli River in Sri Lanka. In International Conference on Sustainable Built Environment-2018; Dissanayake, R., Mendis, P., Eds.; Lecture Notes in Civil Engineering; Springer: Singapore, 2019; pp. 131–136. [Google Scholar]
  24. Kodikara, K.A.S.; Lewandowski, S.; De Silva, P.M.C.S.; Gunarathna, S.D.; Madarasinghe, S.K.; Ranasinghe, P.; Jayatissa, L.P.; Dahdouh-Guebas, F. Heavy Metal Pollution in Selected Upland Tributaries of Sri Lanka: Comprehension towards the Localization of Sources of Pollution. J. Water Health 2022, 20, 505–517. [Google Scholar] [CrossRef] [PubMed]
  25. APHA. Standard Methods for the Examination of Water and Wastewater; American Public Health Association: Washington, DC, USA, 2012. [Google Scholar]
  26. SLS 614:2013; Sri Lanka Standard Specification for Potable Water. Sri Lanka Standards Institution: Colombo, Sri Lanka, 2013.
  27. WHO. Guidelines for Drinking-Water Quality, 4th ed.; World Health Organization: Geneva, Switzerland, 2017; Available online: https://www.who.int/publications/i/item/9789241549950 (accessed on 10 August 2024).
  28. IS 10500:2012; Indian Standard Drinking Water—Specification (Second Revision). Bureau of Indian Standards: New Delhi, India, 2012.
  29. Sri Ranganathan, S.; Wanigatunge, C.; Senadheera, G.P.S.G.; Beneragama, B.V.S.H. A National Survey of Antibacterial Consumption in Sri Lanka. PLoS ONE 2021, 16, e0257424. [Google Scholar] [CrossRef] [PubMed]
  30. Samaraweera, D.N.D.; Liu, X.; Zhong, G.; Priyadarshana, T.; Naseem Malik, R.; Zhang, G.; Khorram, M.S.; Zhu, Z.; Peng, X. Antibiotics in Two Municipal Sewage Treatment Plants in Sri Lanka: Occurrence, Consumption and Removal Efficiency. Emerg. Contam. 2019, 5, 272–278. [Google Scholar] [CrossRef]
  31. Chidiac, S.; El Najjar, P.; Ouaini, N.; El Rayess, Y.; El Azzi, D. A Comprehensive Review of Water Quality Indices (WQIs): History, Models, Attempts and Perspectives. Rev. Environ. Sci. Bio/Technol. 2023, 22, 349–395. [Google Scholar] [CrossRef]
  32. Addisie, M.B. Evaluating Drinking Water Quality Using Water Quality Parameters and Esthetic Attributes. Air Soil Water Res. 2022, 15. [Google Scholar] [CrossRef]
  33. Nizar, F.S.R. Assessment of River Water Quality Using Water Quality Index (Wqi) and Residential Areas in Kelantan River. [Undergraduate Final Project Report]. 2021. Available online: http://discol.umk.edu.my/id/eprint/11638 (accessed on 14 June 2024).
  34. Yan, C.A.; Zhang, W.; Zhang, Z.; Liu, Y.; Deng, C.; Nie, N. Assessment of Water Quality and Identification of Polluted Risky Regions Based on Field Observations & GIS in the Honghe River Watershed, China. PLoS ONE 2015, 10, e0119130. [Google Scholar] [CrossRef]
  35. Brown, R.M.; McClelland, N.I.; Deininger, R.A.; Tozer, R.G. A Water Quality Index—Do We Dare? Water Sew. Works 1970, 117, 339–343. [Google Scholar]
  36. Badeenezhad, A.; Soleimani, H.; Shahsavani, S.; Parseh, I.; Mohammadpour, A.; Azadbakht, O.; Javanmardi, P.; Faraji, H.; Babakrpur Nalosi, K. Comprehensive Health Risk Analysis of Heavy Metal Pollution Using Water Quality Indices and Monte Carlo Simulation in R Software. Sci. Rep. 2023, 13, 15817. [Google Scholar] [CrossRef]
  37. Moldovan, A.; Török, A.I.; Kovacs, E.; Cadar, O.; Mirea, I.C.; Micle, V. Metal Contents and Pollution Indices Assessment of Surface Water, Soil, and Sediment from the Arieș River Basin Mining Area, Romania. Sustainability 2022, 14, 8024. [Google Scholar] [CrossRef]
  38. Afonne, O.J.; Chukwuka, J.U.; Ifediba, E.C. Evaluation of Drinking Water Quality Using Heavy Metal Pollution Indexing Models in an Agrarian, Non-Industrialised Area of South-East Nigeria. J. Environ. Sci. Health Part A 2020, 55, 1406–1414. [Google Scholar] [CrossRef] [PubMed]
  39. Dippong, T.; Resz, M.-A. Chemical Assessment of Drinking Water Quality and Associated Human Health Risk of Heavy Metals in Gutai Mountains, Romania. Toxics 2024, 12, 168. [Google Scholar] [CrossRef] [PubMed]
  40. Jolliffe, I.T.; Cadima, J. Principal Component Analysis: A Review and Recent Developments. Philos. Trans. R. Soc. A Math. Phys. Eng. Sci. 2016, 374, 20150202. [Google Scholar] [CrossRef] [PubMed]
  41. Tahraoui, H.; Toumi, S.; Boudoukhani, M.; Touzout, N.; Sid, A.N.E.H.; Amrane, A.; Belhadj, A.-E.; Hadjadj, M.; Laichi, Y.; Aboumustapha, M.; et al. Evaluating the Effectiveness of Coagulation–Flocculation Treatment Using Aluminum Sulfate on a Polluted Surface Water Source: A Year-Long Study. Water 2024, 16, 400. [Google Scholar] [CrossRef]
  42. Syvitski, J.; Cohen, S.; Miara, A.; Best, J. River Temperature and the Thermal-Dynamic Transport of Sediment. Glob. Planet. Chang. 2019, 178, 168–183. [Google Scholar] [CrossRef]
  43. Agudelo-Vera, C.; Avvedimento, S.; Boxall, J.; Creaco, E.; de Kater, H.; Di Nardo, A.; Djukic, A.; Douterelo, I.; Fish, K.E.; Iglesias Rey, P.L.; et al. Drinking Water Temperature around the Globe: Understanding, Policies, Challenges and Opportunities. Water 2020, 12, 1049. [Google Scholar] [CrossRef]
  44. Ling, T.-Y.; Soo, C.-L.; Heng, T.L.-E.; Nyanti, L.; Sim, S.-F.; Grinang, J. Physicochemical Characteristics of River Water Downstream of a Large Tropical Hydroelectric Dam. J. Chem. 2016, 2016, e7895234. [Google Scholar] [CrossRef]
  45. Wulff, L.M. Management of Disinfection Byproduct Production in Small Drinking Water Systems. Ph.D. Thesis, University of Missouri, Columbia, CO, USA, 2018. [Google Scholar]
  46. Ekström, S.M.; Regnell, O.; Reader, H.E.; Nilsson, P.A.; Löfgren, S.; Kritzberg, E.S. Increasing Concentrations of Iron in Surface Waters as a Consequence of Reducing Conditions in the Catchment Area. J. Geophys. Res. Biogeosci. 2016, 121, 479–493. [Google Scholar] [CrossRef]
  47. Krupińska, I. Aluminium Drinking Water Treatment Residuals and Their Toxic Impact on Human Health. Molecules 2020, 25, 641. [Google Scholar] [CrossRef]
  48. Dippong, T.; Hoaghia, M.-A.; Senila, M. Appraisal of Heavy Metal Pollution in Alluvial Aquifers. Study Case on the Protected Area of Ronișoara Forest, Romania. Ecol. Indic. 2022, 143, 109347. [Google Scholar] [CrossRef]
  49. Moyo, A.; Parbhakar-Fox, A.; Meffre, S.; Cooke, D.R. Alkaline Industrial Wastes—Characteristics, Environmental Risks, and Potential for Mine Waste Management. Environ. Pollut. 2023, 323, 121292. [Google Scholar] [CrossRef] [PubMed]
  50. Morales-Arredondo, J.I.; Hernández, M.A.A.; Cuellar-Ramírez, E.; Morton-Bermea, O.; Ortega-Gutiérrez, J.E. Hydrogeochemical Behavior of Ba, B, Rb, and Sr in an Urban Aquifer Located in Central Mexico and Its Environmental Implications. J. S. Am. Earth Sci. 2022, 116, 103870. [Google Scholar] [CrossRef]
  51. Lv, J.; Liu, Y.; Zhang, Z.; Zhou, R.; Zhu, Y. Distinguishing Anthropogenic and Natural Sources of Trace Elements in Soils Undergoing Recent 10-Year Rapid Urbanization: A Case of Donggang, Eastern China. Environ. Sci. Pollut. Res. 2015, 22, 10539–10550. [Google Scholar] [CrossRef] [PubMed]
  52. Spahić, M.P.; Sakan, S.; Cvetković, Ž.; Tančić, P.; Trifković, J.; Nikić, Z.; Manojlović, D. Assessment of Contamination, Environmental Risk, and Origin of Heavy Metals in Soils Surrounding Industrial Facilities in Vojvodina, Serbia. Environ. Monit. Assess. 2018, 190, 208. [Google Scholar] [CrossRef]
  53. Han, Y.; Du, P.; Cao, J.; Posmentier, E.S. Multivariate Analysis of Heavy Metal Contamination in Urban Dusts of Xi’an, Central China. Sci. Total Environ. 2006, 355, 176–186. [Google Scholar] [CrossRef]
  54. Morton, P.A.; Fennell, C.; Cassidy, R.; Doody, D.; Fenton, O.; Mellander, P.; Jordan, P. A Review of the Pesticide MCPA in the Land-Water Environment and Emerging Research Needs. WIREs Water 2019, 7, e1402. [Google Scholar] [CrossRef]
  55. Phopin, K.; Ruankham, W.; Prachayasittikul, S.; Prachayasittikul, V.; Tantimongcolwat, T. Revealing the Mechanistic Interactions of Profenofos and Captan Pesticides with Serum Protein via Biophysical and Computational Investigations. Sci. Rep. 2024, 14, 1788. [Google Scholar] [CrossRef]
  56. Marambe, B.; Herath, S. Banning of Herbicides and the Impact on Agriculture: The Case of Glyphosate in Sri Lanka. Weed Sci. 2019, 68, 246–252. [Google Scholar] [CrossRef]
  57. De Silva, M.; Liyanage, M.; Wijesekera, S.; Prematunga, E.; Pushpakumari, W. An Update on Herbicide Screening and Potential Alternatives. In Proceedings of the 235th Experiments and Extension Forum for Corporate Sector ‘New Pesticides for Integrated Pest Management in Tea; Tea Research Institute of Sri Lanka: Talawakelle, Sri Lanka, 2018; Available online: https://www.tri.lk/userfiles/file/235%20E&E%20Jan%202018/03_235_E&E_26Jan2018_Paper_II_Dr(Mrs)MSDLDeSilva.pdf (accessed on 5 April 2019).
Figure 1. Sampling locations at water treatment plants situated along the Mahaweli River between Kotmale and Victoria reservoirs, Sri Lanka. KG: Kotagala, TW-G: Thalawakelle-Galkanda, TW-N: Thalawakelle-Nanuoya, NP: Nawalapitiya, PU: Pundaluoya, UL: Ulapane, PD: Paradeka, EL: Elpitiya, NL: Nillambe, UP: University plant, KS: Kandy South, GK: Greater Kandy, PO: Polgolla, HA: Haragama, BA: Balagolla. The river flow direction is from KG to BA.
Water 16 02644 g001
Figure 2. Water Quality Indices of water samples listed as: (a) raw water; (b) treated water. (The horizontal line shows the cutoff of suitability of water for drinking. The abbreviations of water intakes are mentioned in Figure 1).
Water 16 02644 g002
Figure 3. Spatial variation of water quality index along the Mahaweli River segment. ArcGIS extracted river is colored as per the water quality of raw water samples.
Water 16 02644 g003
Figure 4. Heavy metal indices of raw and treated water samples listed as (a) heavy metal pollution index (HPI); (b) heavy metal evaluation index (HEI). Dotted lines show the reference lines for recommended maximum values of indices of heavy metal pollution (i.e., >15 HPI and >10 HEI) as per [36]. The abbreviations of water intakes are mentioned in Figure 1.
Water 16 02644 g004
Figure 5. Dendrogram showing the clustering of sample locations on spatial similarities (refer to Figure 1 for details of sampling locations) with respect to physical properties, anion, and cation concentrations of raw river water along the Mahaweli River. The red solid line shows 40% similarity within its cluster.
Water 16 02644 g005
Figure 6. Variation of physical properties and anion concentrations in the clusters of raw waters along the Mahaweli River (Cluster 1: KG, TW-G, NP, UL, PU; Cluster 2: TW-N, EL, PD, NL, UP, KS; Cluster 3: GK, PO, HA, BA) (refer to Figure 1 for the details of water intakes) listed as (a) pH; (b) turbidity; (c) EC; (d) COD; (e) fluoride concentration; (f) sulphate concentration; (g) chloride concentration; (h) nitrate concentration. The solid lines show permissible ranges as recommended by SLS 614:2013 [26] and (BIS) IS 10500:2012 [28] (for EC only). Fluoride, sulphate, chloride, and nitrate concentrations were below the maximum standard values (i.e., 1, 250, 250, and 50 mg/L, respectively, as per SLS 614:2013).
Water 16 02644 g006aWater 16 02644 g006b
Figure 7. Detection of pesticides and the land use listed as (a) Contamination of MCPA, diuron and captan in raw river water of Mahaweli River in between Kotmale to Victoria reservoirs. The abbreviations of water intakes are mentioned in Figure 1; (b) land use pattern of the river basin of 5 km of the raw water intakes of water treatment plants of Mahaweli River in between Kotmale to Victoria reservoirs. (AGF—Agricultural farms; AP—Abandoned paddy; AT—Abandoned Tea; BAN—Banana; BG—Botanical gardens; CIN—Cinnamon; CLO—Clove; FP—Forest Plantation; HG—Homesteads/Home gardens; LSF—Live Stock Farms; P—Paddy; SC—Seasonal Crops; T—Tea).
Water 16 02644 g007
Table 1. Permissible limits of the parameters tested for the water samples collected from inlets and outlets of water treatment plants situated along the Mahaweli River segment between Kotmale and Victoria reservoirs.
ParametersAbbreviationsUnitsAs per Sri Lanka StandardAs per WHO GuidelinesAs per BIS
Physical parameters:
pHpH-6.5–8.56.5–8.56.5–8.5
electrical conductivityECµs/cm--400
turbidityTURNTU2.00.21.0
water temperatureTEMP°C---
chemical oxygen demand CODMnmg/L10--
Anions:
chlorideClmg/L250250250
bromideBrmg/L---
phosphatePO43−mg/L2--
nitrateNO3mg/L505045
sulphateSO42−mg/L250250200
fluorideFmg/L1.01.51.0
Heavy metals:
IronFeµg/L300300300
ManganeseMnµg/L100100100
CopperCuµg/L1000200050
AluminiumAlµg/L20020030
Nickel Niµg/L207020
ZincZnµg/L30003000500
ArsenicAsµg/L101010
CadmiumCdµg/L333
ChromiumCrµg/L505050
BariumBaµg/L-1300700
SilverAgµg/L-100100
StrontiumSrµg/L---
VanadiumVµg/L---
RubidiumRbµg/L---
CobaltCoµg/L---
LithiumLiµg/L---
CaesiumCsµg/L---
ThalliumTlµg/L---
BismuthBiµg/L---
BerylliumBeµg/L---
IndiumInµg/L---
Pesticides:
2-methyl-4-chlorophenoxyacetic acidMCPAµg/L---
3-(3,4-Dichlorophenul) 1,1-dimethylureaDiuronµg/L---
N-trichloromethylthio-4-cyclohexane-1,2-dicarboximideCaptanµg/L---
Table 2. Classification of water quality status based on WQI.
WQI ValueStatus of the Water QualitySuitability for Drinking
0–25excellentsuitable
26–50goodsuitable
51–75poornot suitable
76–100very poornot suitable
>100not suitable for consumptionnot suitable
Table 3. Descriptive statistics of physicochemical water quality parameters obtained for the raw river water and treated water from water treatment plants along the Mahaweli River segment between Kotmale and Victoria reservoirs.
Water Quality ParameterUnitsRaw WaterTreated Water
Average
(n = 60)
MinimumMaximumAverage
(n = 56)
MinimumMaximum
pH-6.86.67.36.86.56.9
ECµs/cm103.419.5175.887.624.7152.6
TURNTU6.311.0913.430.840.301.49
TEMP°C23.020.224.523.019.324.4
CODMnmg/L3.12.49.12.21.53.6
Clmg/L5.721.1011.617.992.5014.79
NO3mg/L3.750.1117.503.750.2115.45
SO42−mg/L2.280.266.323.980.2716.87
Fmg/L0.050.010.150.050.010.12
Feµg/L373.7027.001117.4050.30ND123.80
Mnµg/L13.735.3299.8810.964.5041.16
Cuµg/L1.530.553.031.530.464.14
Alµg/L15.675.8726.7551.428.47126.18
Niµg/L15.4011.9420.9016.0811.7021.64
Znµg/L17.535.1679.3124.1213.2545.92
Asµg/L0.300.090.660.300.120.55
Cdµg/L0.080.010.170.220.090.41
Crµg/L14.0512.4917.7713.9712.8315.20
Baµg/L61.3916.5693.4763.0117.2199.53
Agµg/L0.080.030.170.300.080.77
Srµg/L65.8715.60124.5967.9723.93136.80
Vµg/L19.548.0531.2122.9011.2330.5
Rbµg/L10.042.8114.2310.772.8815.19
Coµg/L1.370.382.711.490.362.94
Liµg/L0.690.361.210.640.361.27
Csµg/L0.050.020.080.050.020.07
Tlµg/L0.020.010.030.02ND *0.03
Biµg/L0.04ND *0.09ND *ND *ND *
Beµg/L0.02ND *0.02ND *ND *ND *
Inµg/L0.01ND *0.010.01ND *0.01
* ND—Not Detected.
Table 4. Rotated loadings of 32 tested water quality parameters of the raw river water samples after factor analysis in initial five principal components (PC) of principal component analysis (PCA). The cells with high factor loadings are highlighted.
ParameterPC1PC2PC3PC4PC5PC6
pH−0.80854−0.19515−0.01224−0.00861−0.24041−0.16839
Turbidity0.065570.108850.777100.08223−0.219030.00669
EC−0.05617−0.007990.568770.138640.585470.92427
Temperature0.034910.178790.81550−0.077370.065400.47621
COD0.58366−0.006490.13375−0.19822−0.48527−0.06788
Cl0.280710.796190.26800−0.077030.142660.06071
SO42−0.348060.464470.632940.20546−0.082040.07219
NO30.293900.68281−0.188410.205490.434910.02388
F0.134100.654840.04849−0.22562−0.27499−0.01833
Fe0.05176−0.59976−0.26017−0.161430.14460−0.19862
Sr0.778550.490250.228360.12515−0.20549−0.12181
Ba0.586720.734240.186870.08491−0.00192−0.05039
Mn0.14499−0.002930.007200.911080.066930.11773
Zn0.266740.04261−0.080860.892230.164750.10807
Al0.30058−0.13039−0.672220.544630.02124−0.36035
V0.912020.19480−0.095360.192420.09634−0.12519
Cr0.89041−0.00615−0.299730.249690.10963−0.09784
Ni0.917310.09590−0.196900.275130.09536−0.07943
Rb0.842600.352140.193500.196350.151210.14016
Co0.863340.343680.153340.25709−0.08742−0.07578
Cu0.434530.135950.326840.70498−0.22774−0.09698
Li0.48790−0.20844−0.25224−0.059360.741870.39872
As0.881250.024790.249070.23634−0.117510.12222
Ag−0.01618−0.105660.15624−0.301380.153270.14700
Cd−0.021360.104290.18061−0.038110.25463−0.24782
Cs0.083480.385880.11274−0.22997−0.09801−0.17852
Tl0.224800.12095−0.07666−0.118840.156020.07458
Bi0.19650−0.293580.19884−0.01034−0.065980.05236
Disclaimer/Publisher’s Note: The statements, opinions and data contained in all publications are solely those of the individual author(s) and contributor(s) and not of MDPI and/or the editor(s). MDPI and/or the editor(s) disclaim responsibility for any injury to people or property resulting from any ideas, methods, instructions or products referred to in the content.