A Spatial–Seasonal Study on the Danube River in the Adjacent Danube Delta Area: Case Study—Monitored Heavy Metals
Abstract
1. Introduction
- -
- -
- Biodiversity loss: the Delta is home to many rare and endangered species of plants and animals [8], but these are threatened by habitat loss [5], fragmentation, degradation, invasive species, overfishing [13], hunting and climate change. Some of the species at risk include the sturgeon [27], pelican, pygmy cormorant and red-breasted goose [28].
- -
- Land use transformations: the Delta has been altered by human activities such as drainage, irrigation, rehabilitation, deforestation and urbanization [5], which have reduced natural wetlands [8] and floodplains and increased the risk of erosion [29], salinization and desertification. These changes have also affected the livelihoods and culture of local communities that depend on the Delta’s resources [19].
- -
- Organic pollution and microplastics: the Danube River and its Delta are polluted with various organic contaminants [24,28], such as pesticides [6], pharmaceuticals, hormones and personal care products, which can have negative effects on the health of organisms and the ecosystem [27]. In addition, the river and Delta are also contaminated with microplastics [28], which are small plastic particles that can accumulate in the environment and food chain and pose a threat to wildlife and human health [6].
2. Materials and Methods
2.1. Data Collection
2.2. Methodology
2.2.1. Water and Sediment Sampling Methodology
2.2.2. Methodology for Statistical Analysis
2.2.3. Methodology for Numerical Analysis
- Step 1:
- A definition of the parameters that describe the distribution of pollution sources—the initial distribution—is made.
- Step 2:
- A monitoring point is considered—starting with the first upstream point and continuing successively downstream.
- Step 3:
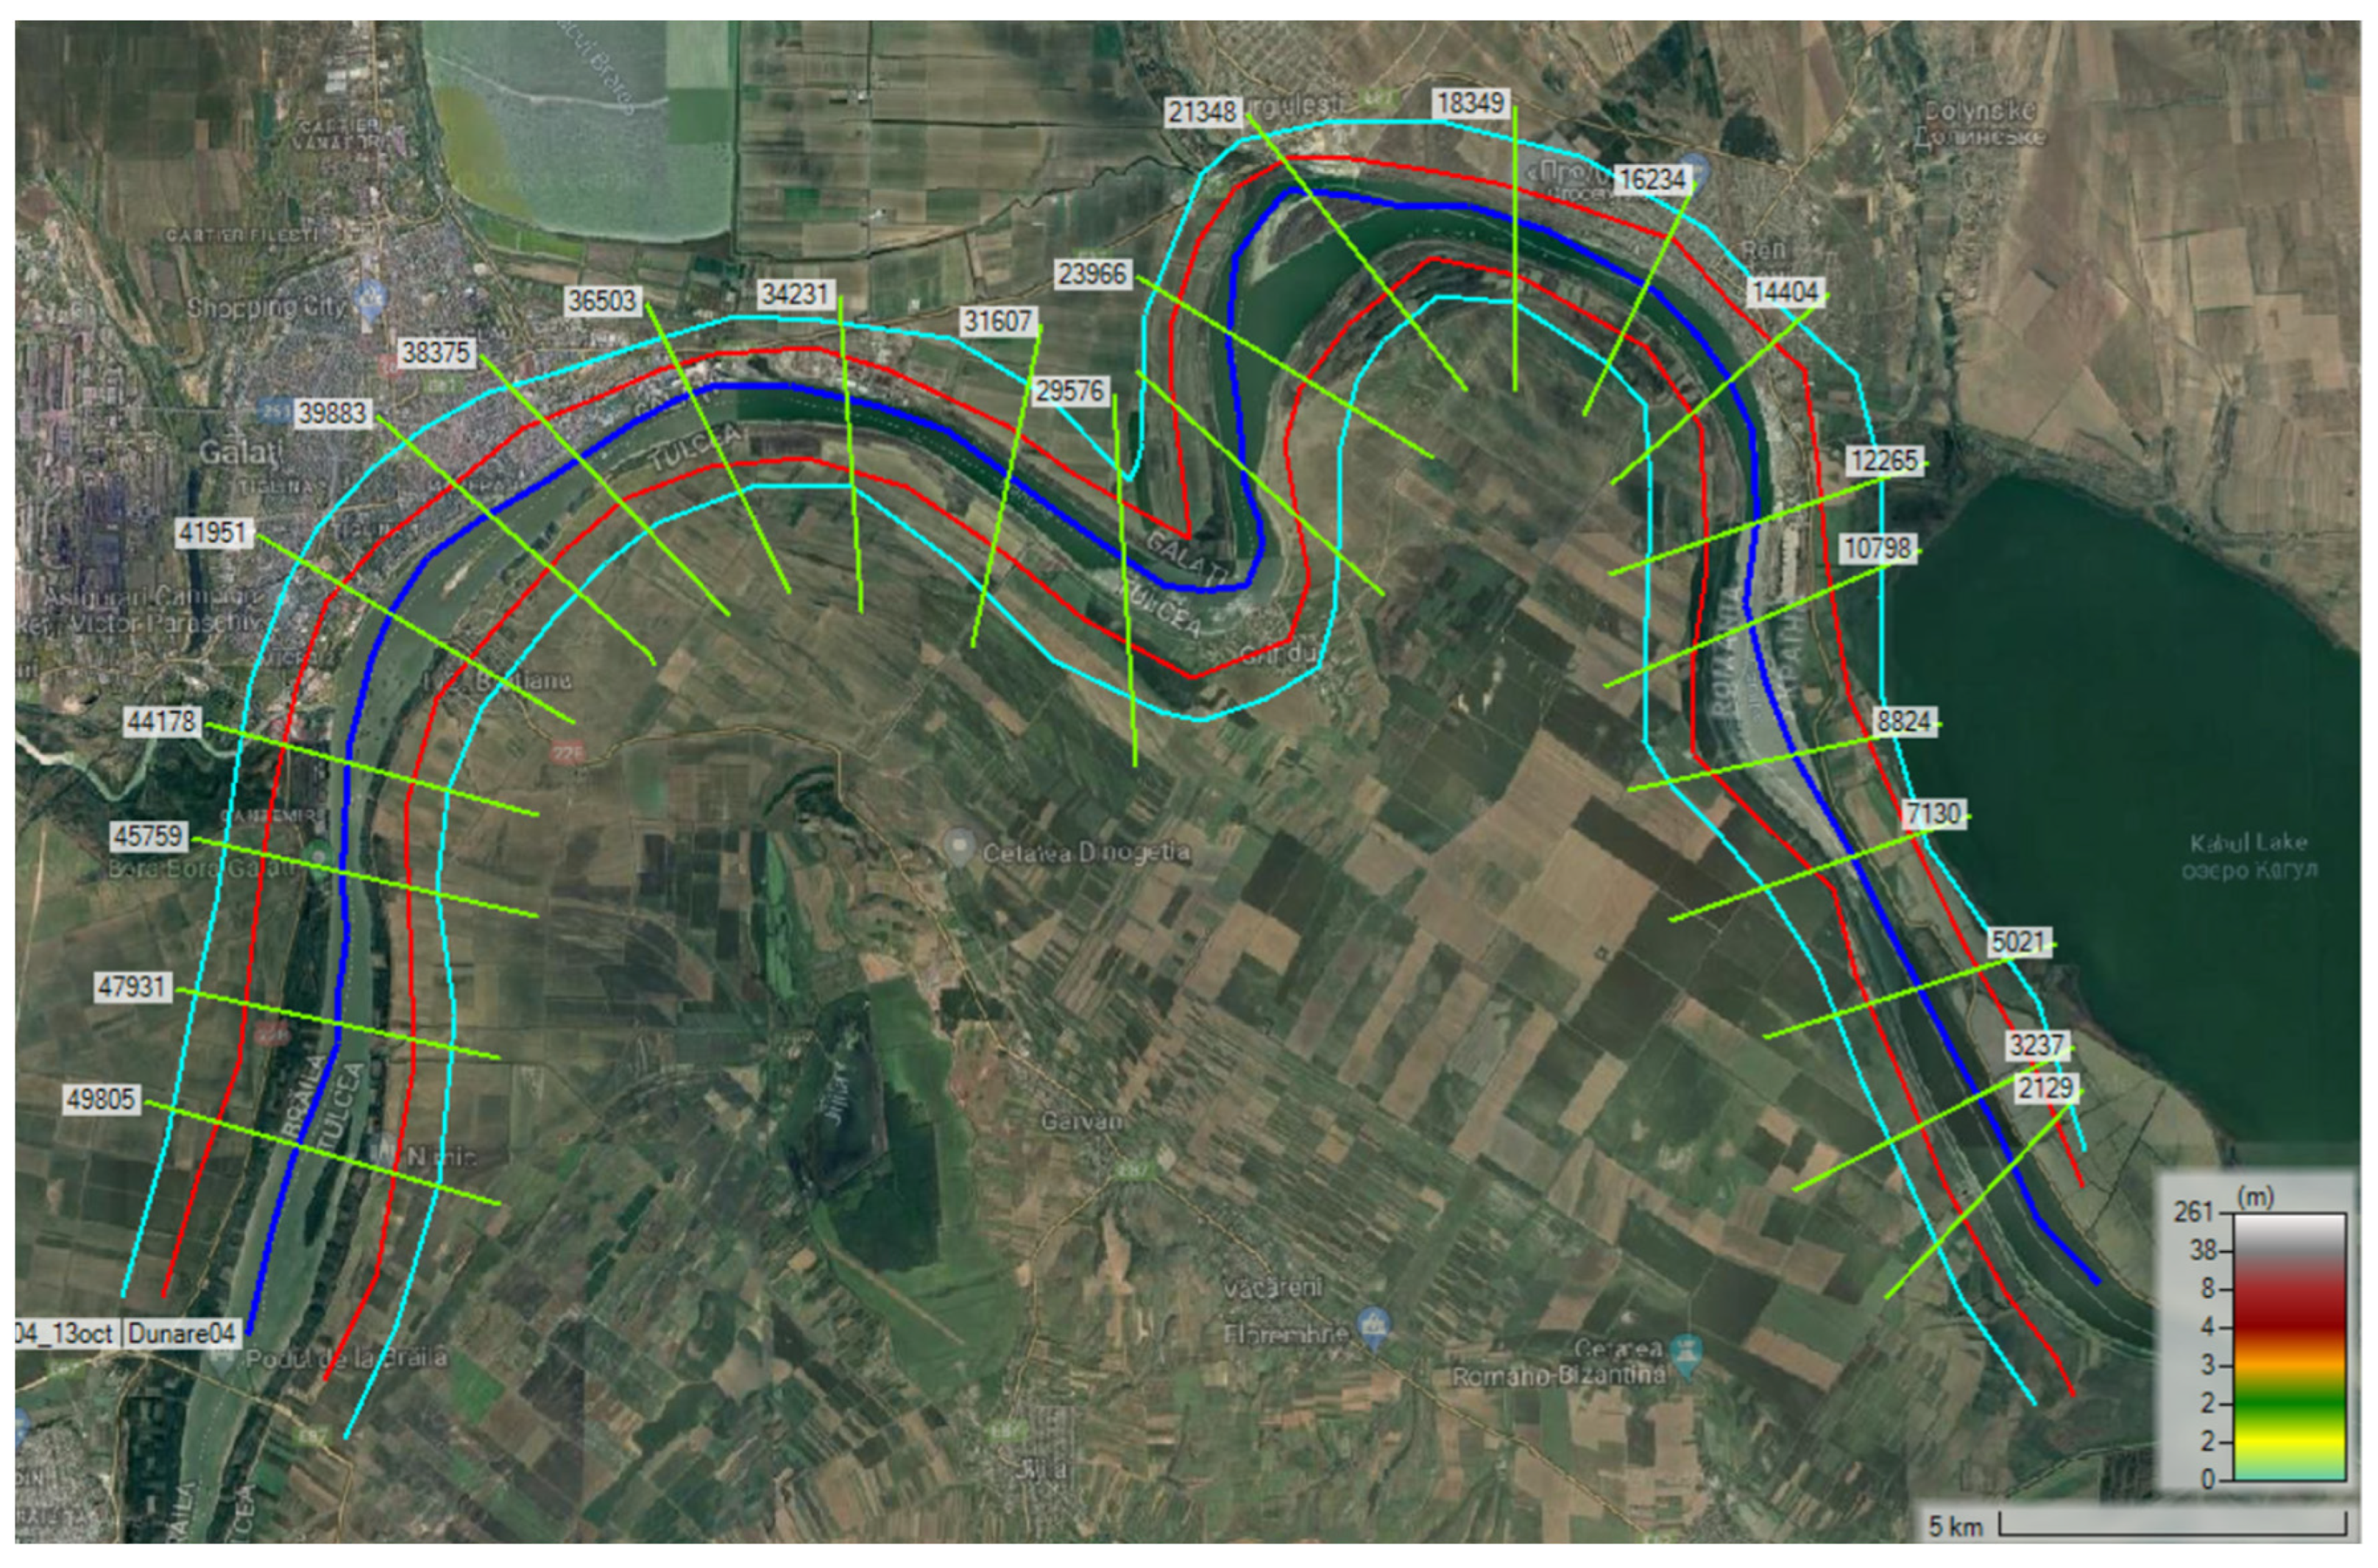
- Enter the parameters related to the local sources and perform the numerical simulation—HEC—RAS two-dimensional.
- Step 4:
- The downstream concentrations are evaluated, and the comparison is made with the measured ones, determining the quantities to be applied for correction.
- Step 5:
- Change the concentrations from the upstream points to adjust the difference and repeat step 3.
3. Results
3.1. Data Analysis
3.2. Statistical Approach
Descriptive Statistics
3.3. PCA Method Analysis
3.4. Cluster Method Analysis
3.5. PCA Method Analysis for Metals Samples
3.6. Numerical Analysis
4. Discussion
4.1. PCA Method Analysis
4.2. Numerical Approach
- -
- A complex analysis of the bioavailability of heavy metals in sediments using high-performance analytical methods such as inductively coupled plasma–mass spectrometry (ICP-MS) or atomic absorption spectroscopy (AAS) from our laboratory.
- -
- An assessment of factors influencing the sorption and mobility of heavy metals in soils and their mechanisms of accumulation.
- -
- A comparison of different technologies for the remediation of soils polluted with heavy metals, such as in situ or ex situ physico-chemical processes, or bioremediation using microorganisms or plants.
5. Conclusions
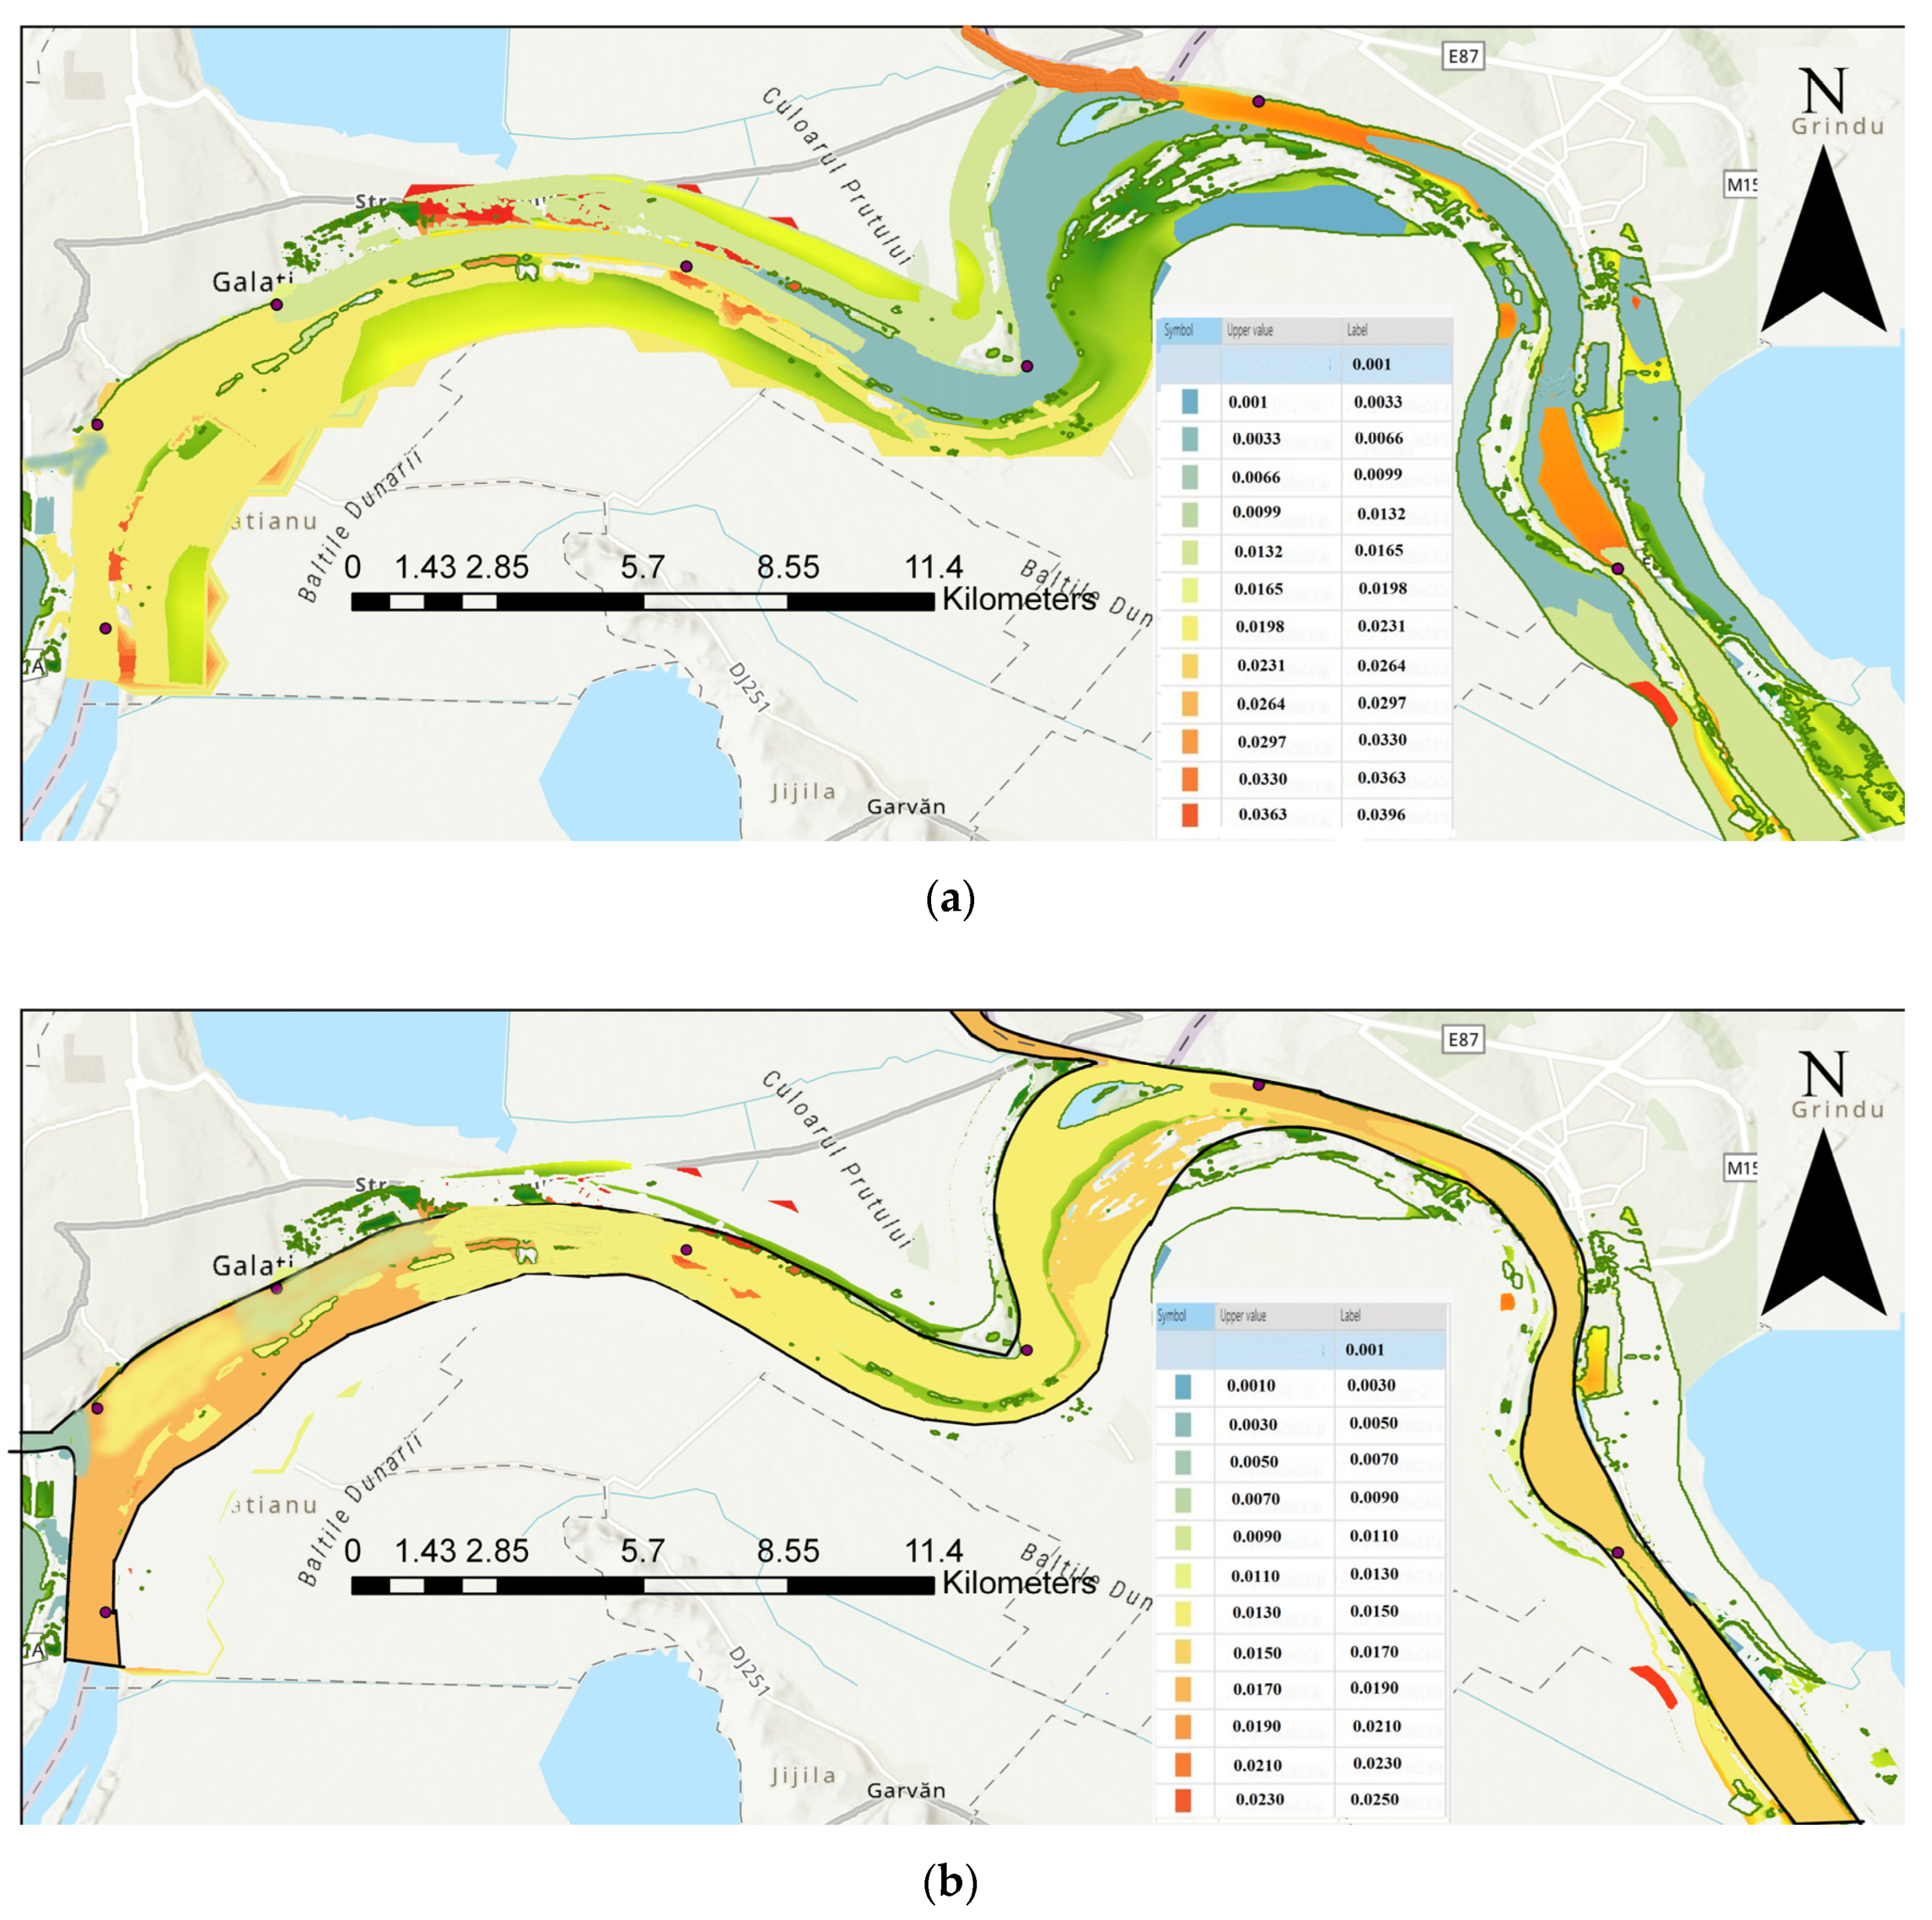
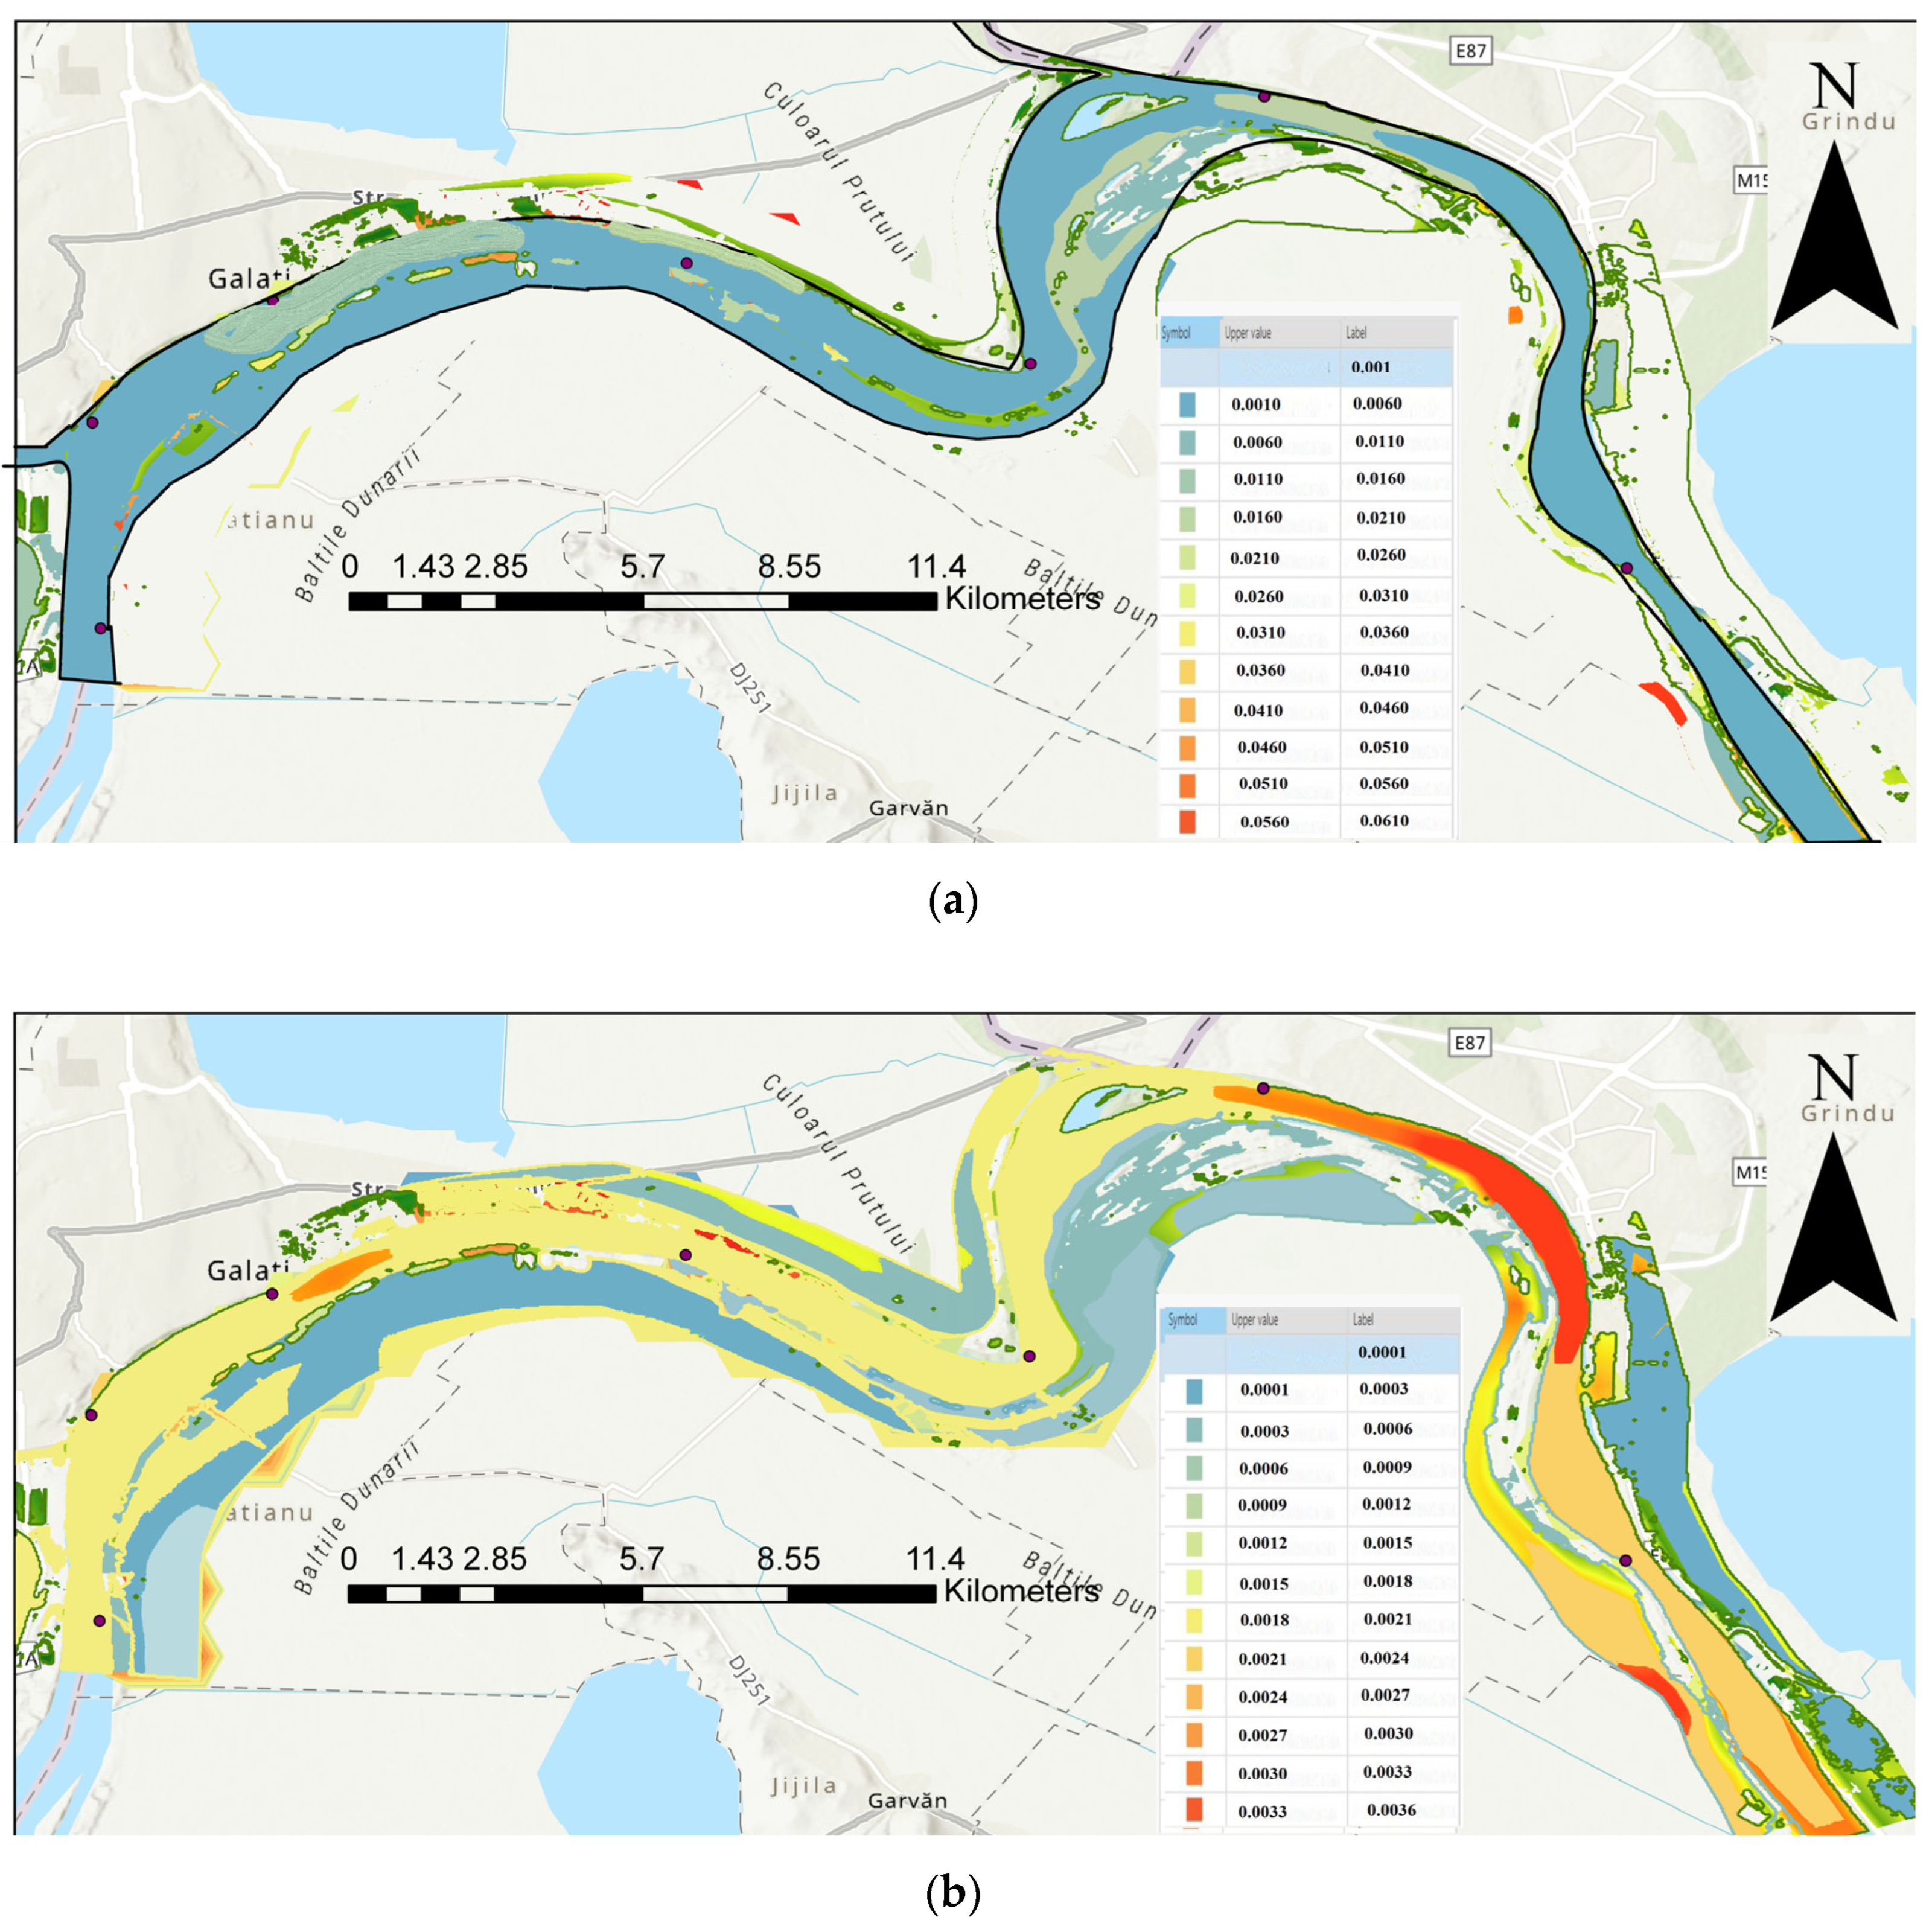
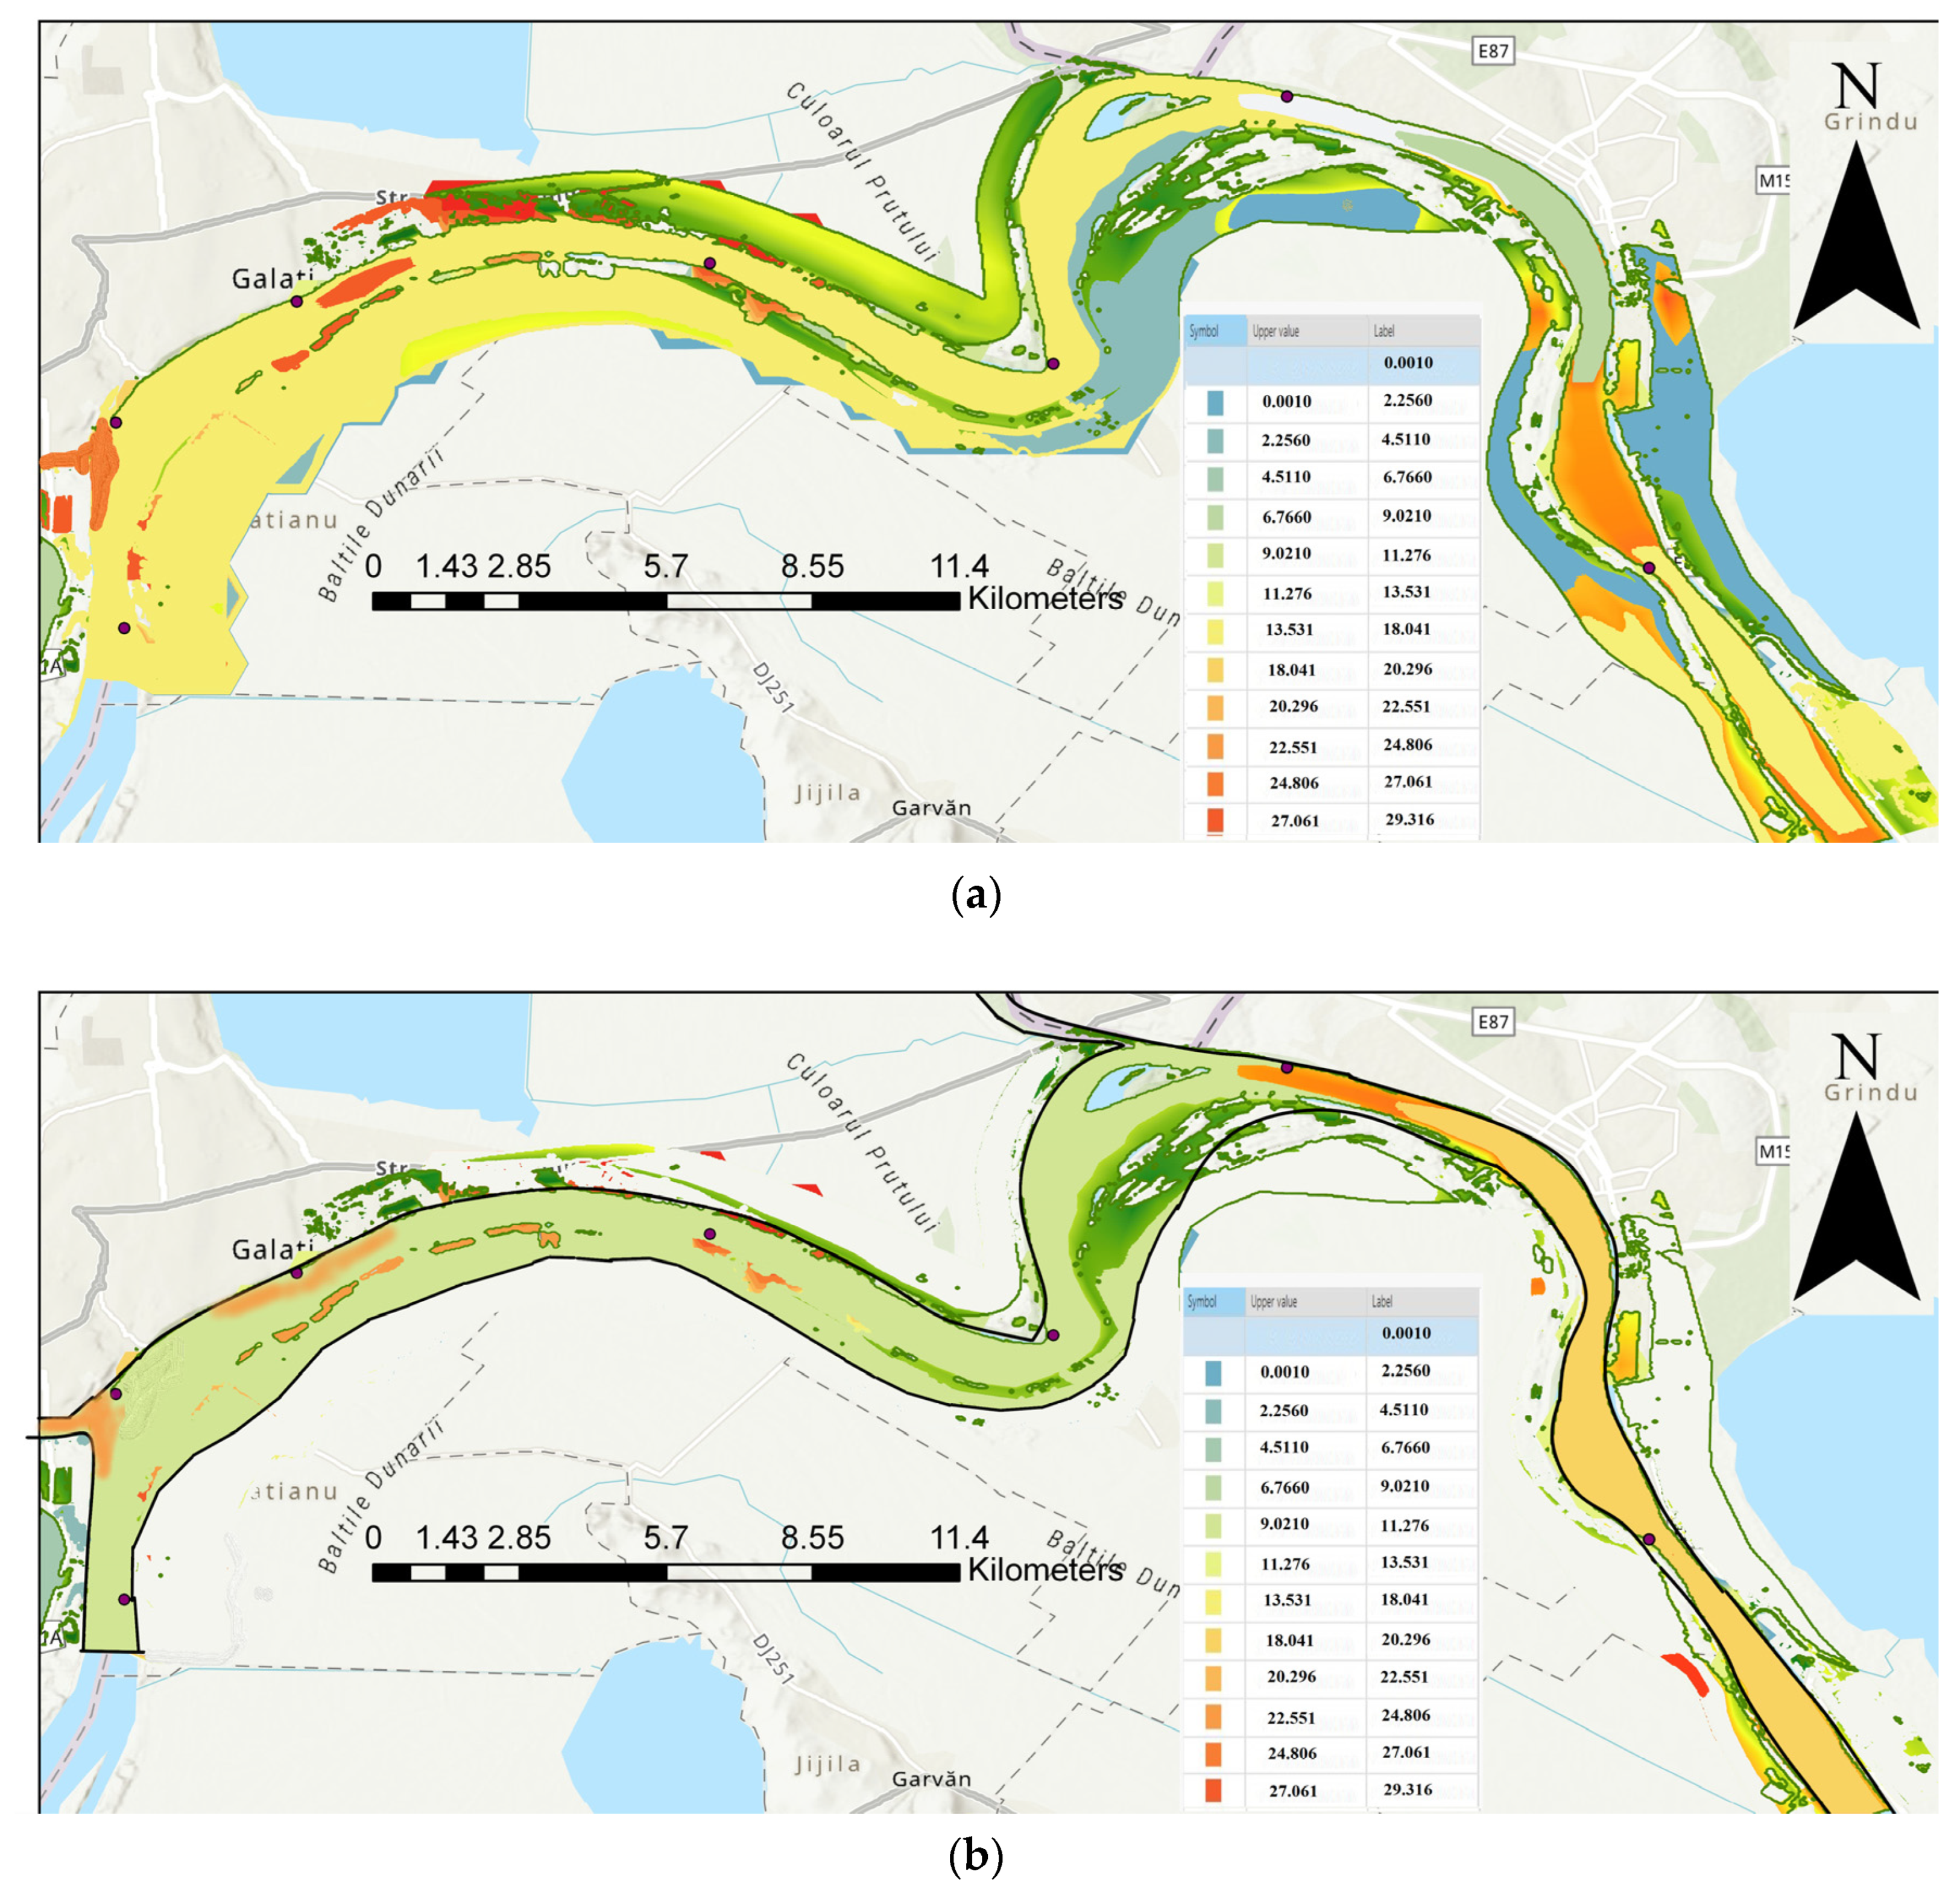
- In conclusion, the present paper presents the possibility of modeling the distribution of heavy metal concentrations over a much greater distance than in previous cases.
- It was possible to identify some locations of point pollution sources, and the existence of a downstream mitigation phenomenon could be highlighted.
- It was possible to highlight the self-purification capacity of the Danube, which was also demonstrated in the studies carried out 15 years ago.
- An evaluation of the coefficients for reducing the concentrations of polluting factors could be carried out.
Author Contributions
Funding
Data Availability Statement
Conflicts of Interest
References
- Popescu, F.; Trumić, M.; Cioabla, A.E.; Vujić, B.; Stoica, V.; Trumić, M.; Opris, C.; Bogdanović, G.; Trif-Tordai, G. Analysis of Surface Water Quality and Sediments Content on Danube Basin in Djerdap—Iron Gate Protected Areas. Water 2022, 14, 2991. [Google Scholar] [CrossRef]
- Popa, P.; Murariu, G.; Timofti, M.; Georgescu, L.P. Multivariate Statistical Analyses of Danube River Water Quality at Galati, Romania. Environ. Eng. Manag. J. 2018, 17, 1249–1266. [Google Scholar] [CrossRef]
- Fang, T.; Lu, W.; Cui, K.; Li, J.; Yang, K.; Zhao, X.; Liang, Y.; Li, H. Distribution, Bioaccumulation and Trophic Transfer of Trace Metals in the Food Web of Chaohu Lake, Anhui, China. Chemosphere 2019, 218, 1122–1130. [Google Scholar] [CrossRef] [PubMed]
- Hakanson, L. An Ecological Risk Index for Aquatic Pollution Control.a Sedimentological Approach. Water Res. 1980, 14, 975–1001. [Google Scholar] [CrossRef]
- Simionov, I.-A.; Călmuc, M.; Iticescu, C.; Călmuc, V.; Georgescu, P.-L.; Faggio, C.; Petrea, Ş.-M. Human Health Risk Assessment of Potentially Toxic Elements and Microplastics Accumulation in Products from the Danube River Basin Fish Market. Environ. Toxicol. Pharmacol. 2023, 104, 104307. [Google Scholar] [CrossRef]
- Teodorof, L.; Ene, A.; Burada, A.; Despina, C.; Seceleanu-Odor, D.; Trifanov, C.; Ibram, O.; Bratfanof, E.; Tudor, M.-I.; Tudor, M.; et al. Integrated Assessment of Surface Water Quality in Danube River Chilia Branch. Appl. Sci. 2021, 11, 9172. [Google Scholar] [CrossRef]
- Cordeli, A.N.; Oprea, L.; Crețu, M.; Dediu, L.; Coadă, M.T.; Mînzală, D.-N. Bioaccumulation of Metals in Some Fish Species from the Romanian Danube River: A Review. Fishes 2023, 8, 387. [Google Scholar] [CrossRef]
- Matache, M.L.; Marin, C.; Rozylowicz, L.; Tudorache, A. Plants Accumulating Heavy Metals in the Danube River Wetlands. J. Environ. Health Sci. Eng. 2013, 11, 39. [Google Scholar] [CrossRef]
- Georgescu, P.-L.; Moldovanu, S.; Iticescu, C.; Calmuc, M.; Calmuc, V.; Topa, C.; Moraru, L. Assessing and Forecasting Water Quality in the Danube River by Using Neural Network Approaches. Sci. Total Environ. 2023, 879, 162998. [Google Scholar] [CrossRef]
- Bąk, Ł.; Szeląg, B.; Sałata, A.; Studziński, J. Modeling of Heavy Metal (Ni, Mn, Co, Zn, Cu, Pb, and Fe) and PAH Content in Stormwater Sediments Based on Weather and Physico-Geographical Characteristics of the Catchment-Data-Mining Approach. Water 2019, 11, 626. [Google Scholar] [CrossRef]
- Iticescu, C.; Georgescu, P.-L.; Arseni, M.; Rosu, A.; Timofti, M.; Carp, G.; Cioca, L.-I. Optimal Solutions for the Use of Sewage Sludge on Agricultural Lands. Water 2021, 13, 585. [Google Scholar] [CrossRef]
- Sun, C.; Zhang, Z.; Cao, H.; Xu, M.; Xu, L. Concentrations, Speciation, and Ecological Risk of Heavy Metals in the Sediment of the Songhua River in an Urban Area with Petrochemical Industries. Chemosphere 2019, 219, 538–545. [Google Scholar] [CrossRef] [PubMed]
- Simionov, I.-A.; Cristea, D.S.; Petrea, Ș.-M.; Mogodan, A.; Jijie, R.; Ciornea, E.; Nicoară, M.; Turek Rahoveanu, M.M.; Cristea, V. Predictive Innovative Methods for Aquatic Heavy Metals Pollution Based on Bioindicators in Support of Blue Economy in the Danube River Basin. Sustainability 2021, 13, 8936. [Google Scholar] [CrossRef]
- Calmuc, M.; Calmuc, V.; Arseni, M.; Topa, C.; Timofti, M.; Georgescu, L.P.; Iticescu, C. A Comparative Approach to a Series of Physico-Chemical Quality Indices Used in Assessing Water Quality in the Lower Danube. Water 2020, 12, 3239. [Google Scholar] [CrossRef]
- Dong, D.; Zhao, X.; Hua, X.; Liu, J.; Gao, M. Investigation of the Potential Mobility of Pb, Cd and Cr(VI) from Moderately Contaminated Farmland Soil to Groundwater in Northeast, China. J. Hazard. Mater. 2009, 162, 1261–1268. [Google Scholar] [CrossRef]
- Liu, Y.; Xu, Z.; Hu, X.; Zhang, N.; Chen, T.; Ding, Z. Sorption of Pb(II) and Cu(II) on the Colloid of Black Soil, Red Soil and Fine Powder Kaolinite: Effects of pH, Ionic Strength and Organic Matter. Environ. Pollut. Bioavailab. 2019, 31, 85–93. [Google Scholar] [CrossRef]
- Resz, M.-A.; Roman, C.; Senila, M.; Török, A.I.; Kovacs, E. A Comprehensive Approach to the Chemistry, Pollution Impact and Risk Assessment of Drinking Water Sources in a Former Industrialized Area of Romania. Water 2023, 15, 1180. [Google Scholar] [CrossRef]
- Takić, L.; Mladenović-Ranisavljević, I.; Vasović, D.; Đorđević, L. The Assessment of the Danube River Water Pollution in Serbia. Water Air Soil Pollut 2017, 228, 380. [Google Scholar] [CrossRef]
- Banescu, A.; Arseni, M.; Georgescu, L.P.; Rusu, E.; Iticescu, C. Evaluation of Different Simulation Methods for Analyzing Flood Scenarios in the Danube Delta. Appl. Sci. 2020, 10, 8327. [Google Scholar] [CrossRef]
- Zhang, W.; Long, J.; Zhang, X.; Shen, W.; Wei, Z. Pollution and Ecological Risk Evaluation of Heavy Metals in the Soil and Sediment around the HTM Tailings Pond, Northeastern China. Int. J. Environ. Res. Public Health 2020, 17, 7072. [Google Scholar] [CrossRef]
- Da Silva Júnior, R.O.; Almeida, H.P.; Da Silva, M.S.; França, A.C.; Balleroni, E.; Dos Santos, N.; Vilela, P.H.; De Melo, A.M.Q.; Guimarães, J.T.F. Methodological Approach for an Online Water Quality Monitoring System in an Iron Ore Tailing Dam. Water 2023, 15, 3663. [Google Scholar] [CrossRef]
- Pham Van, C.; Chua, V. Numerical Simulation of Hydrodynamic Characteristics and Bedload Transport in Cross Sections of Two Gravel-Bed Rivers Based on One-Dimensional Lateral Distribution Method. Int. J. Sediment Res. 2020, 35, 203–216. [Google Scholar] [CrossRef]
- Wang, H.; Yuan, W.; Zeng, Y.; Liang, D.; Deng, Y.; Zhang, X.; Li, Y. How Does Three Gorges Dam Regulate Heavy Metal Footprints in the Largest Freshwater Lake of China. Environ. Pollut. 2022, 292, 118313. [Google Scholar] [CrossRef] [PubMed]
- Calmuc, V.A.; Calmuc, M.; Arseni, M.; Topa, C.M.; Timofti, M.; Burada, A.; Iticescu, C.; Georgescu, L.P. Assessment of Heavy Metal Pollution Levels in Sediments and of Ecological Risk by Quality Indices, Applying a Case Study: The Lower Danube River, Romania. Water 2021, 13, 1801. [Google Scholar] [CrossRef]
- Iticescu, C.; Georgescu, L.P.; Murariu, G.; Topa, C.; Timofti, M.; Pintilie, V.; Arseni, M. Lower Danube Water Quality Quantified through WQI and Multivariate Analysis. Water 2019, 11, 1305. [Google Scholar] [CrossRef]
- Saeed, O.; Székács, A.; Jordán, G.; Mörtl, M.; Abukhadra, M.R.; Eid, M.H. Investigating the Impacts of Heavy Metal (Loid)s on Ecology and Human Health in the Lower Basin of Hungary’s Danube River: A Python and Monte Carlo Simulation-Based Study. Environ. Geochem. Health 2023, 45, 9757–9784. [Google Scholar] [CrossRef]
- Murariu, G.; Timofti, M.; Savinuta, I.; Murariu, A.; Iticescu, C.; Gerogescu, L.; Tudor, M.; Mocanu, G.D. Seasonal Statistical Analysis on the Quality of Underwater Supplies in South-Eastern Romania. Rev. Chim. 2019, 70, 820–827. [Google Scholar] [CrossRef]
- Drasovean, R.; Murariu, G.; Constantinescu, G.; Circiumaru, A. Assessment of Surface Water Quality of Danube River in Terms of Usual Parameters and Correlation Analyses. Rev. Chim. 2019, 70, 398–406. [Google Scholar] [CrossRef]
- Arseni, M.; Roșu, A.; Murariu, G.; Georgescu, L.P.; Iticescu, C.; Calmuc, M.; Calmuc, V.-A. The Role of River Channel Roughness for Water Level Modeling during the 2005 Year Flood on Siret River Using HEC-RAS Model. Ann. Dunarea Univ. Galati. Fascicle II Math. Phys. Theor. Mech. 2019, 42, 68–76. [Google Scholar] [CrossRef]
- Water Directive. Available online: https://environment.ec.europa.eu/topics/water/water-framework-directive_en (accessed on 27 October 2023).
- Barrero-Moreno, M.C.; Diaz-Vargas, C.A.; Restrepo-Parra, E. Computational Simulation of Filters Used in the Removal of Heavy Metals Using Rice Husks. Agriculture 2021, 11, 146. [Google Scholar] [CrossRef]
- Zolghadr, M.; Rafiee, M.R.; Esmaeilmanesh, F.; Fathi, A.; Tripathi, R.P.; Rathnayake, U.; Gunakala, S.R.; Azamathulla, H.M. Computation of Time of Concentration Based on Two-Dimensional Hydraulic Simulation. Water 2022, 14, 3155. [Google Scholar] [CrossRef]
- Mocanu, G.D.; Murariu, G.; Georgescu, L.; Sandu, I. Investigating the Attitudes of First-Year Students of the Faculty of Physical Education and Sports of Galati towards Online Teaching Activities during the COVID-19 Pandemic. Appl. Sci. 2021, 11, 6328. [Google Scholar] [CrossRef]
- Mocanu, G.D.; Murariu, G.; Iordan, D.A.; Sandu, I. Analysis of the Influence of Age Stages on Static Plantar Pressure Indicators for Karate Do Practitioners (Preliminary Report). Appl. Sci. 2021, 11, 7320. [Google Scholar] [CrossRef]
- Maxim, C.; Filote, C.; Cojocaru, D.C. Comparative Study of Physical Indicators and Those of Their Regime of Oxygen, on Water Quality of the Great Ùomuzu River, in the Year 2009. Arch. Environ. Prot. 2011, 42, 41–48. [Google Scholar]
- Mocanu, G.D.; Murariu, G.; Iordan, D.A.; Sandu, I.; Munteanu, M.O.A. The Perception of the Online Teaching Process during the COVID-19 Pandemic for the Students of the Physical Education and Sports Domain. Appl. Sci. 2021, 11, 5558. [Google Scholar] [CrossRef]
- Crişan, V.-E.; Dincă, L.; Bragă, C.; Murariu, G.; Tupu, E.; Mocanu, G.D.; Drasovean, R. The Configuration of Romanian Carpathians Landscape Controls the Volume Diversity of Picea Abies (L.) Stands. Land 2023, 12, 406. [Google Scholar] [CrossRef]
- Murariu, G.; Dinca, L.; Tudose, N.; Crisan, V.; Georgescu, L.; Munteanu, D.; Dragu, M.D.; Rosu, B.; Mocanu, G.D. Structural Characteristics of the Main Resinous Stands from Southern Carpathians, Romania. Forests 2021, 12, 1029. [Google Scholar] [CrossRef]
- Jin, Y.; Zhou, Q.; Wang, X.; Zhang, H.; Yang, G.; Lei, T.; Mei, S.; Yang, H.; Liu, L.; Yang, H.; et al. Heavy Metals in the Mainstream Water of the Yangtze River Downstream: Distribution, Sources and Health Risk Assessment. Int. J. Environ. Res. Public Health 2022, 19, 6204. [Google Scholar] [CrossRef]
- Costabile, P.; Costanzo, C.; Ferraro, D.; Macchione, F.; Petaccia, G. Performances of the New HEC-RAS Version 5 for 2-D Hydrodynamic-Based Rainfall-Runoff Simulations at Basin Scale: Comparison with a State-of-the Art Model. Water 2020, 12, 2326. [Google Scholar] [CrossRef]
- Luo, K.; Liu, H.; Yu, E.; Tu, Y.; Gu, X.; Xu, M. Distribution and Release Mechanism of Heavy Metals in Sediments of Yelang Lake by DGT. Stoch. Env. Res. Risk Assess. 2020, 34, 793–805. [Google Scholar] [CrossRef]
- Ha, M.; Schleiger, R. Environmental Science. Available online: https://bio.libretexts.org/Bookshelves/Ecology/Environmental_Science_(Ha_and_Schleiger) (accessed on 23 March 2022).
- Githaiga, K.B.; Njuguna, S.M.; Gituru, R.W.; Yan, X. Water Quality Assessment, Multivariate Analysis and Human Health Risks of Heavy Metals in Eight Major Lakes in Kenya. J. Environ. Manag. 2021, 297, 113410. [Google Scholar] [CrossRef]
- Feng, W.; Wang, T.; Zhu, Y.; Sun, F.; Giesy, J.P.; Wu, F. Chemical Composition, Sources, and Ecological Effect of Organic Phosphorus in Water Ecosystems: A Review. Carbon. Res. 2023, 2, 12. [Google Scholar] [CrossRef]
- Xu, M.; Wang, R.; Yang, X.; Yang, H. Spatial Distribution and Ecological Risk Assessment of Heavy Metal Pollution in Surface Sediments from Shallow Lakes in East China. J. Geochem. Explor. 2020, 213, 106490. [Google Scholar] [CrossRef]
- Murariu, G.; Iticescu, C.; Murariu, A.; Rosu, B.; Munteanu, D.; Buruiana, D.L. Assessment of Water Quality State Dynamics Using Adaptive Filtering Methods and Neural Networks Approaching. Case study—Danube River in Galati area. Rev. Chim. 2019, 70, 1914–1919. [Google Scholar] [CrossRef]
- Pavel, A.; Durisch-Kaiser, E.; Balan, S.; Radan, S.; Sobek, S.; Wehrli, B. Sources and Emission of Greenhouse Gases in Danube Delta Lakes. Environ. Sci. Pollut. Res. 2009, 16, 86–91. [Google Scholar] [CrossRef] [PubMed]
- Mocanu, G.D.; Murariu, G.; Munteanu, D. The Influence of Socio-Demographic Factors on the Forms of Leisure for the Students at the Faculty of Physical Education and Sports. Int. J. Environ. Res. Public Health 2021, 18, 12577. [Google Scholar] [CrossRef]
- Bărbulescu, A.; Barbeş, L.; Dani, A. Statistical Analysis of the Quality Indicators of the Danube River Water (in Romania). In Frontiers in Water-Energy-Nexus—Nature-Based Solutions, Advanced Technologies and Best Practices for Environmental Sustainability; Naddeo, V., Balakrishnan, M., Choo, K.-H., Eds.; Advances in Science, Technology & Innovation; Springer International Publishing: Cham, Italy, 2020; pp. 277–279. ISBN 978-3-030-13067-1. [Google Scholar]
- Mocanu, G.D.; Murariu, G.; Munteanu, D. Common Issues and Differences in Motivational Support and the Effects of Rugby for the U-15 and U-16 National Teams. Sustainability 2022, 14, 4535. [Google Scholar] [CrossRef]
- Ultsch, A.; Lötsch, J. Euclidean Distance-Optimized Data Transformation for Cluster Analysis in Biomedical Data (EDOtrans). BMC Bioinform. 2022, 23, 233. [Google Scholar] [CrossRef]
- Hemming, K.; Eldridge, S.; Forbes, G.; Weijer, C.; Taljaard, M. How to Design Efficient Cluster Randomised Trials. BMJ 2017, 358, j3064. [Google Scholar] [CrossRef]
- Staples, L.; Ring, J.; Fontana, S.; Stradwick, C.; DeMaio, J.; Ray, H.; Zhang, Y.; Zhang, X. Reproducible Clustering with Non-Euclidean Distances: A Simulation and Case Study. Int. J. Data Sci. Anal. 2023. [Google Scholar] [CrossRef]
- Feio, M.J.; Hughes, R.M.; Callisto, M.; Nichols, S.J.; Odume, O.N.; Quintella, B.R.; Kuemmerlen, M.; Aguiar, F.C.; Almeida, S.F.P.; Alonso-EguíaLis, P.; et al. The Biological Assessment and Rehabilitation of the World’s Rivers: An Overview. Water 2021, 13, 371. [Google Scholar] [CrossRef]
- Mocanu, G.D.; Murariu, G. The Association of Gender and Body Mass Index on the Values of Static and Dynamic Balance of University Students (A Cross-Sectional Design Study). Appl. Sci. 2022, 12, 3770. [Google Scholar] [CrossRef]
- Brunner, G. Hec-Ras—Verification and Validation Tests; US Army Corps of Engineers, Hydrologic Engineering Center: Davis, CA, USA, 1994.
- Antohi, V.M.; Ionescu, R.V.; Zlati, M.L.; Iticescu, C.; Georgescu, P.L.; Calmuc, M. Regional Regression Correlation Model of Microplastic Water Pollution Control Using Circular Economy Tools. Int. J. Environ. Res. Public Health 2023, 20, 4014. [Google Scholar] [CrossRef] [PubMed]
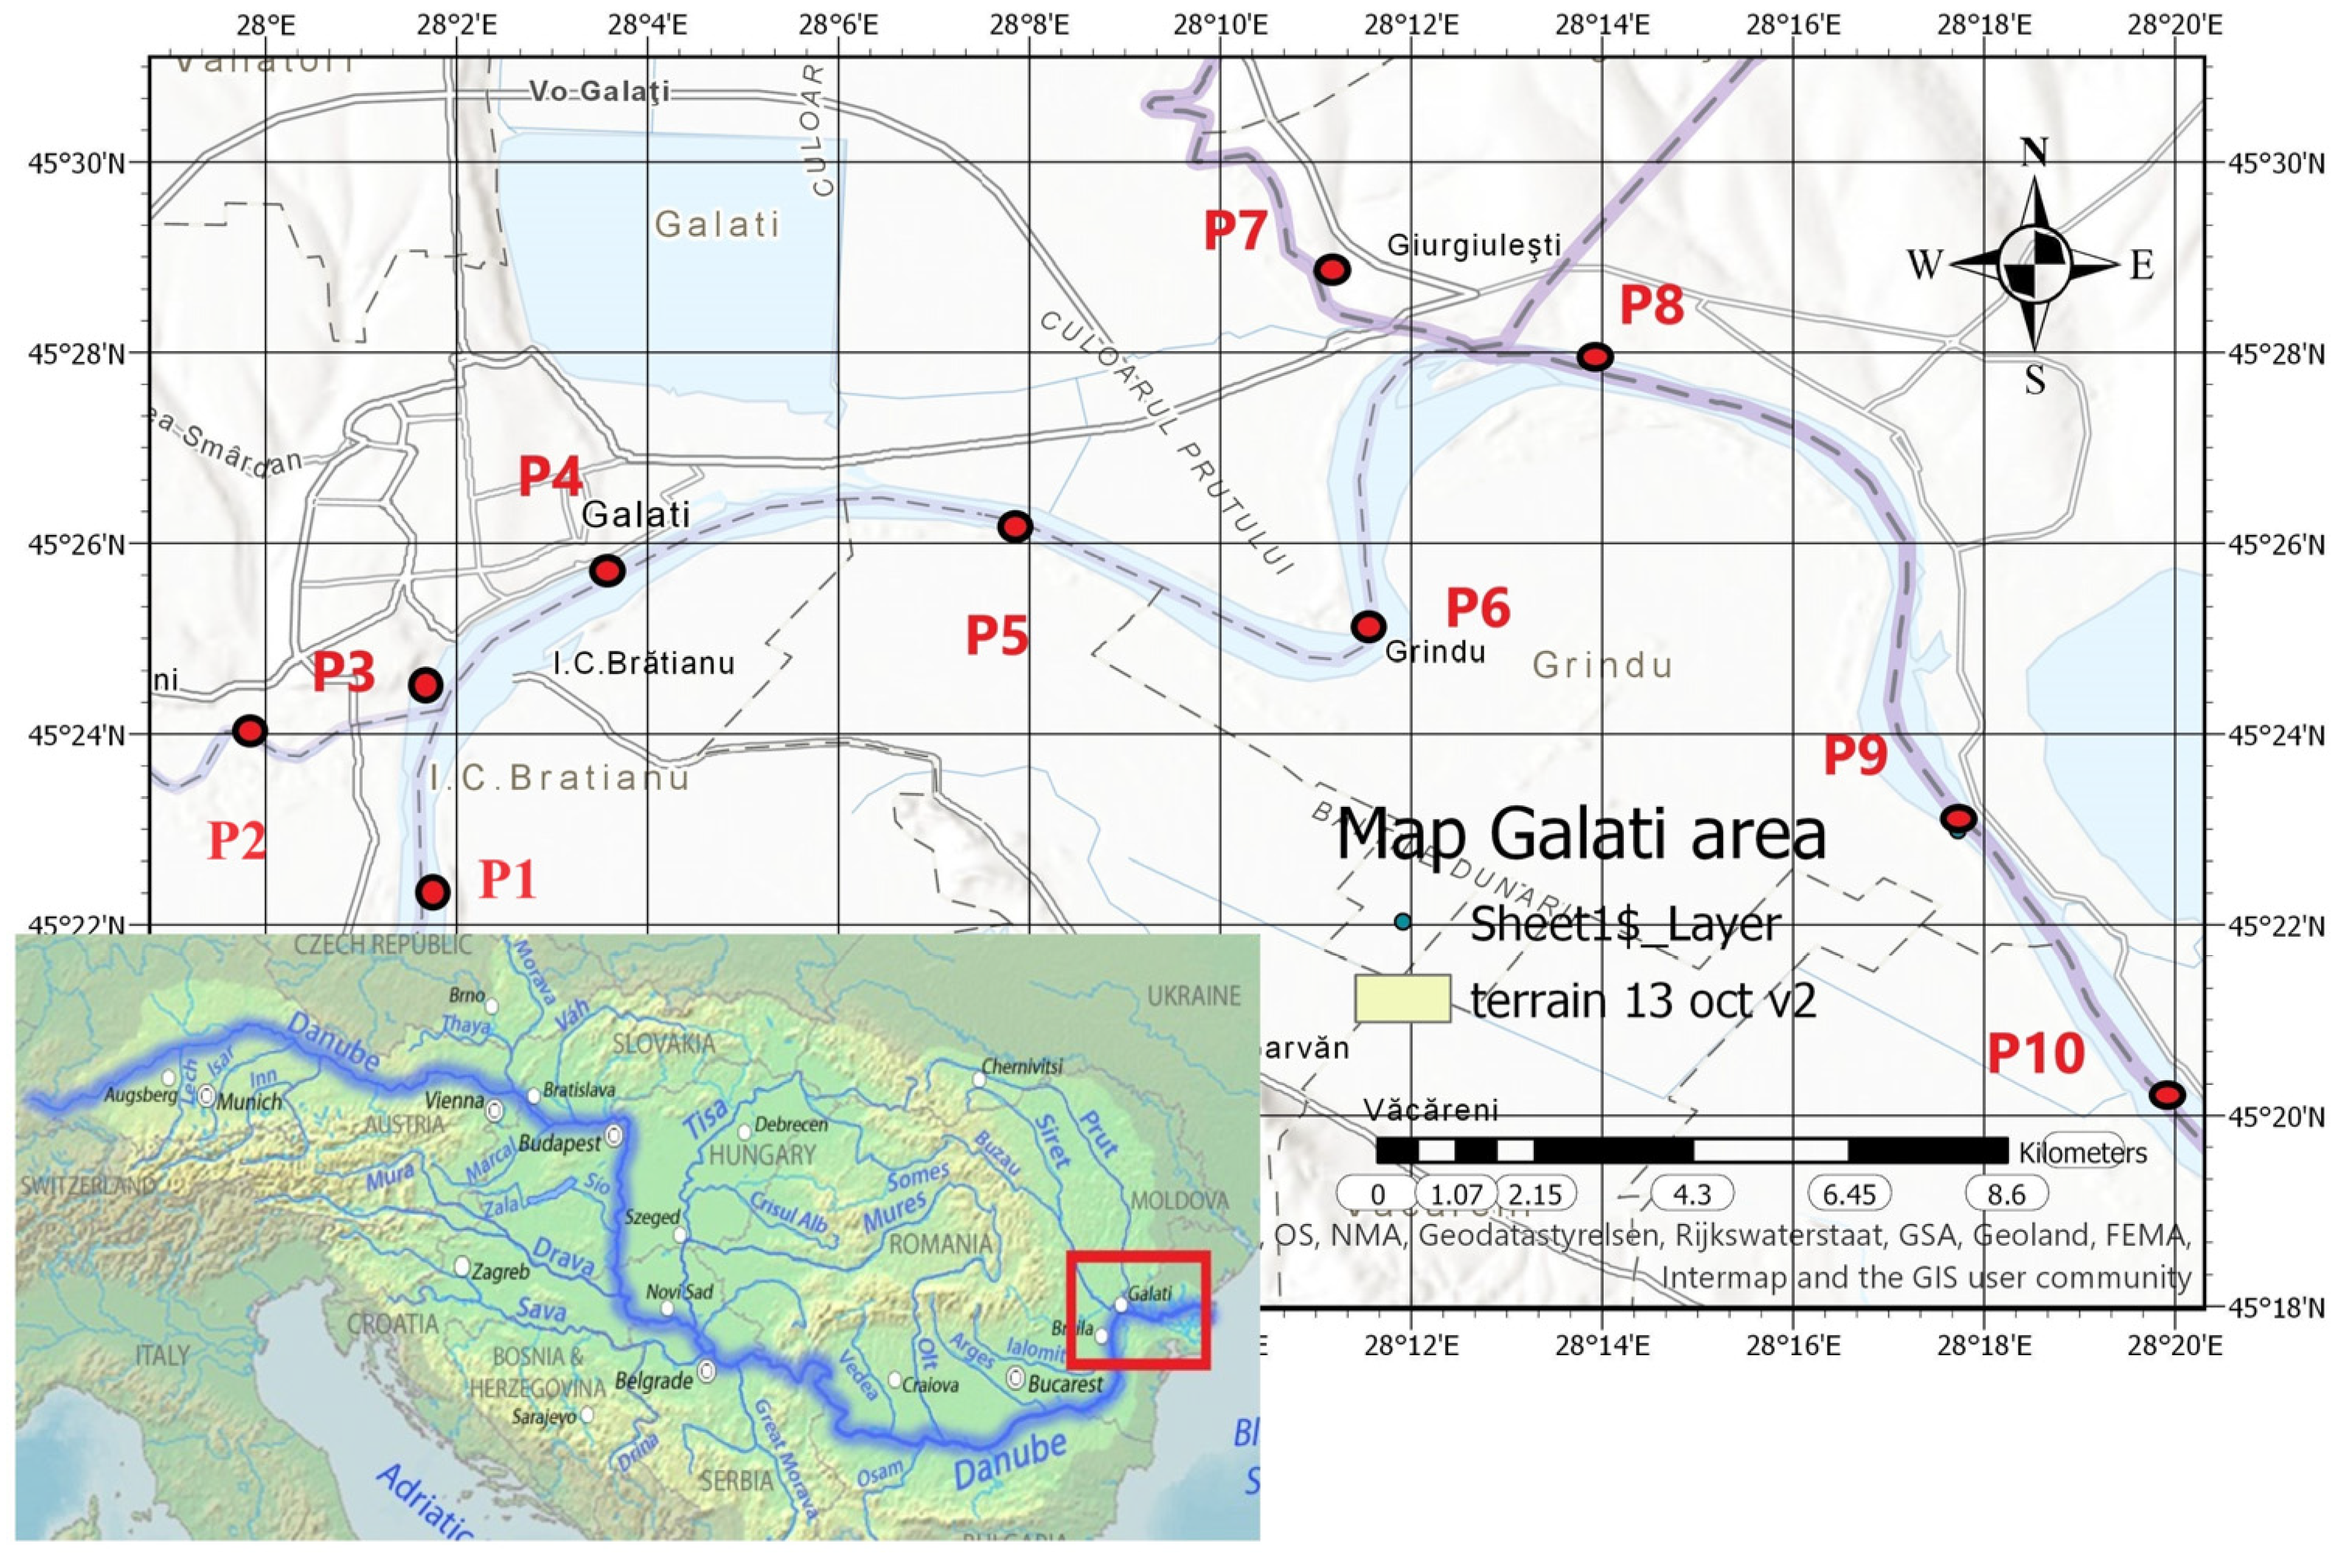

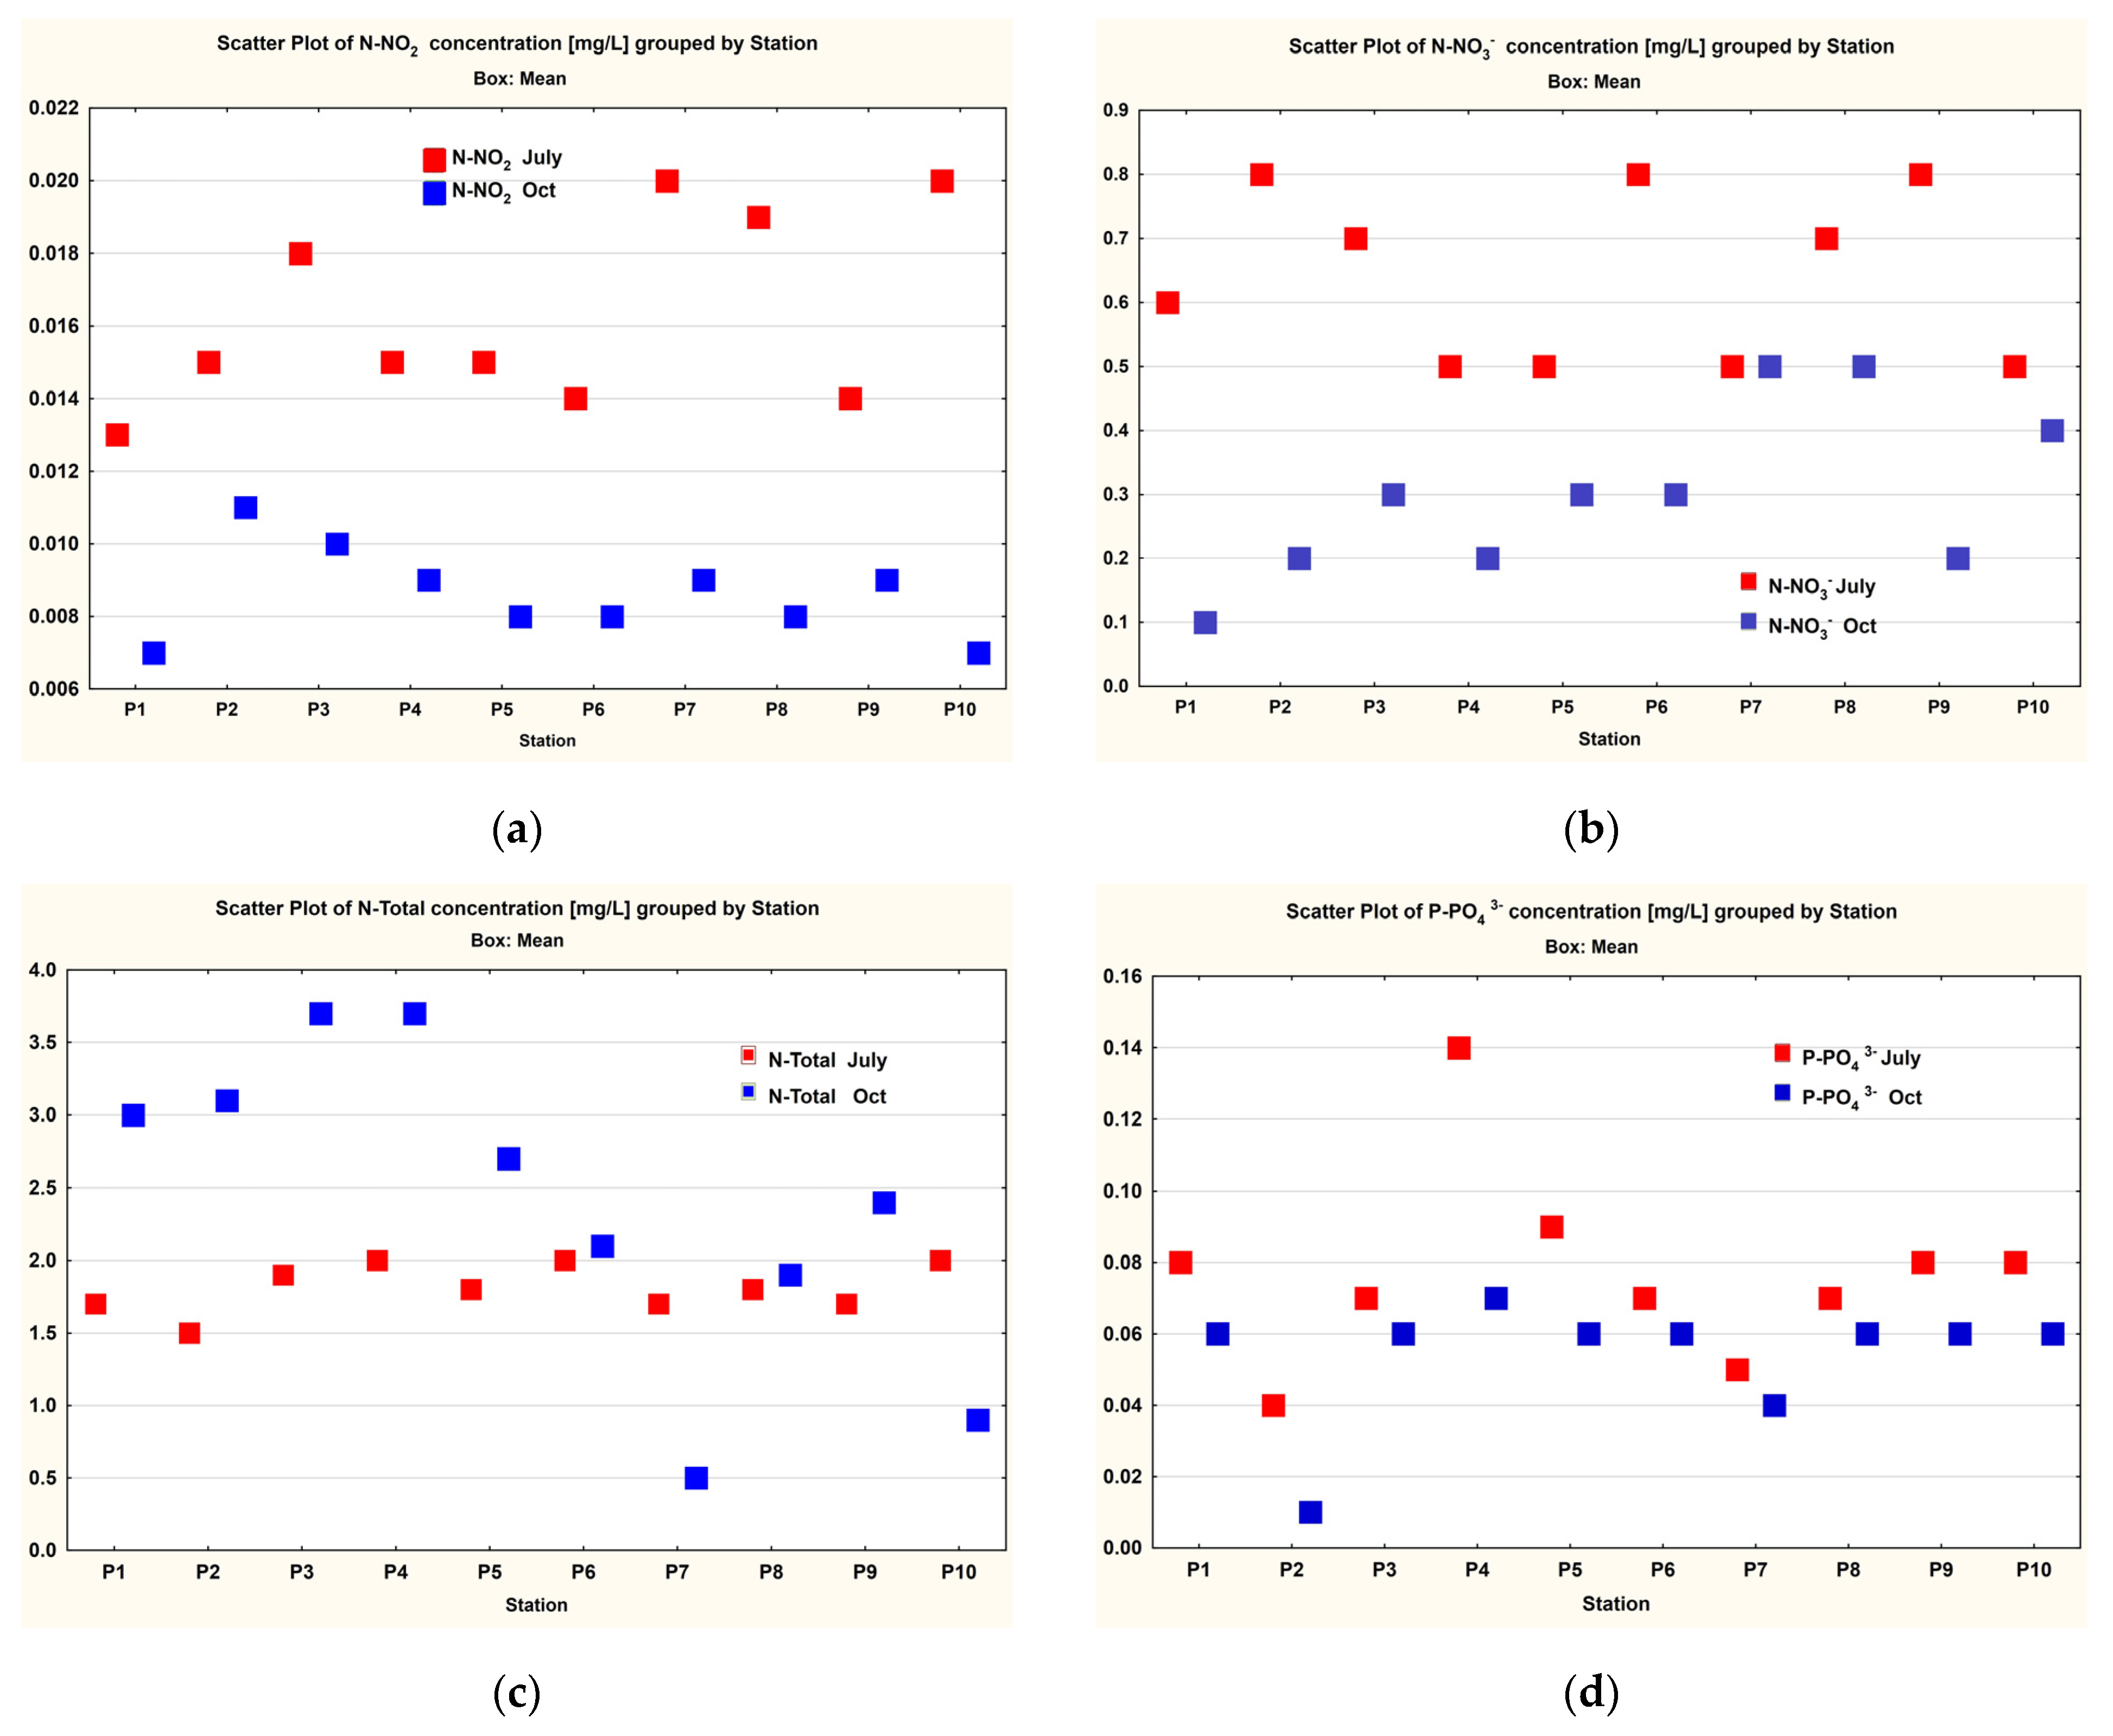


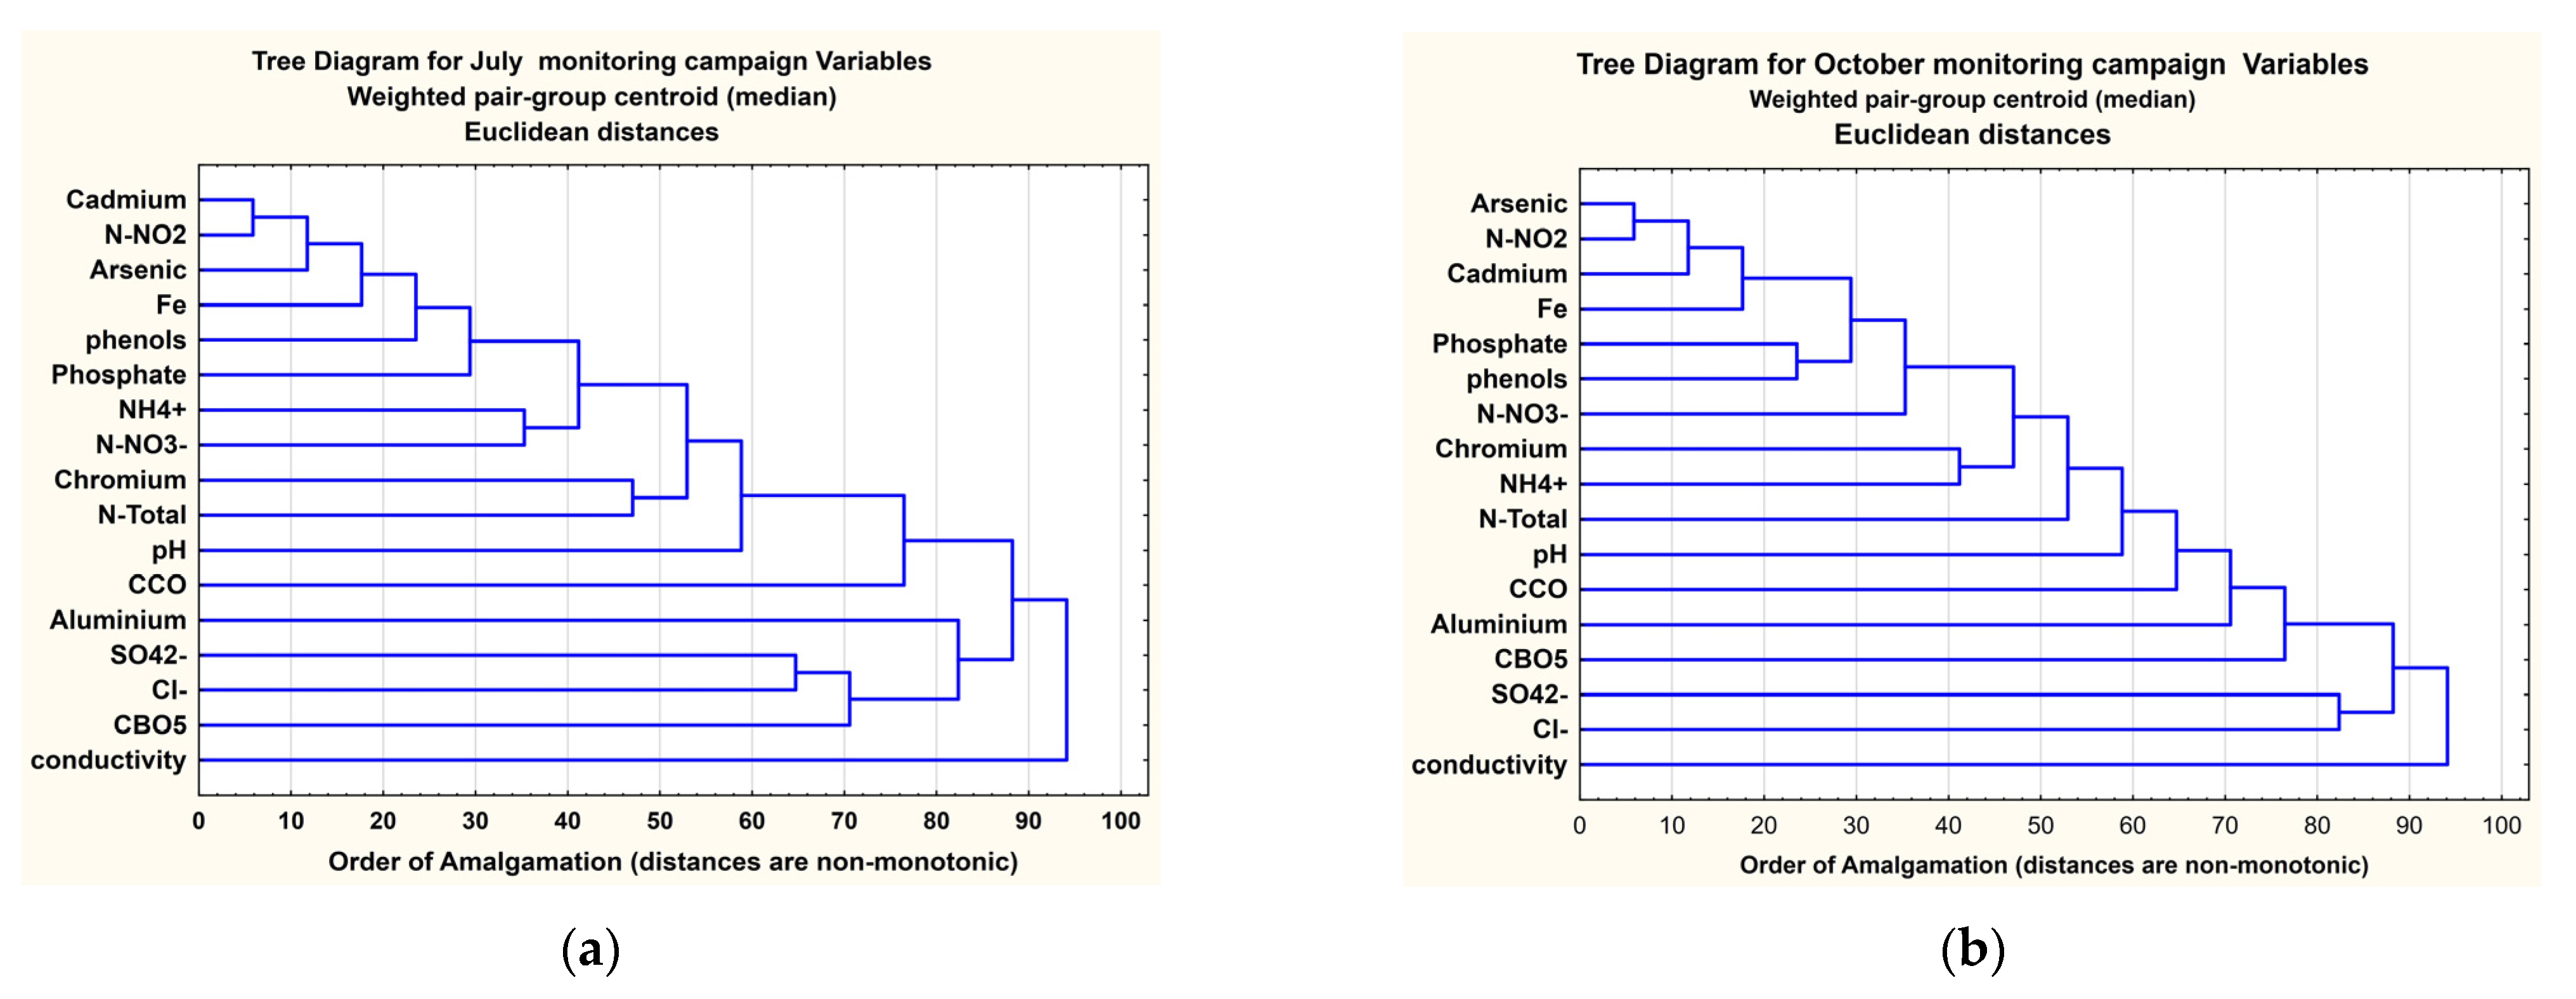
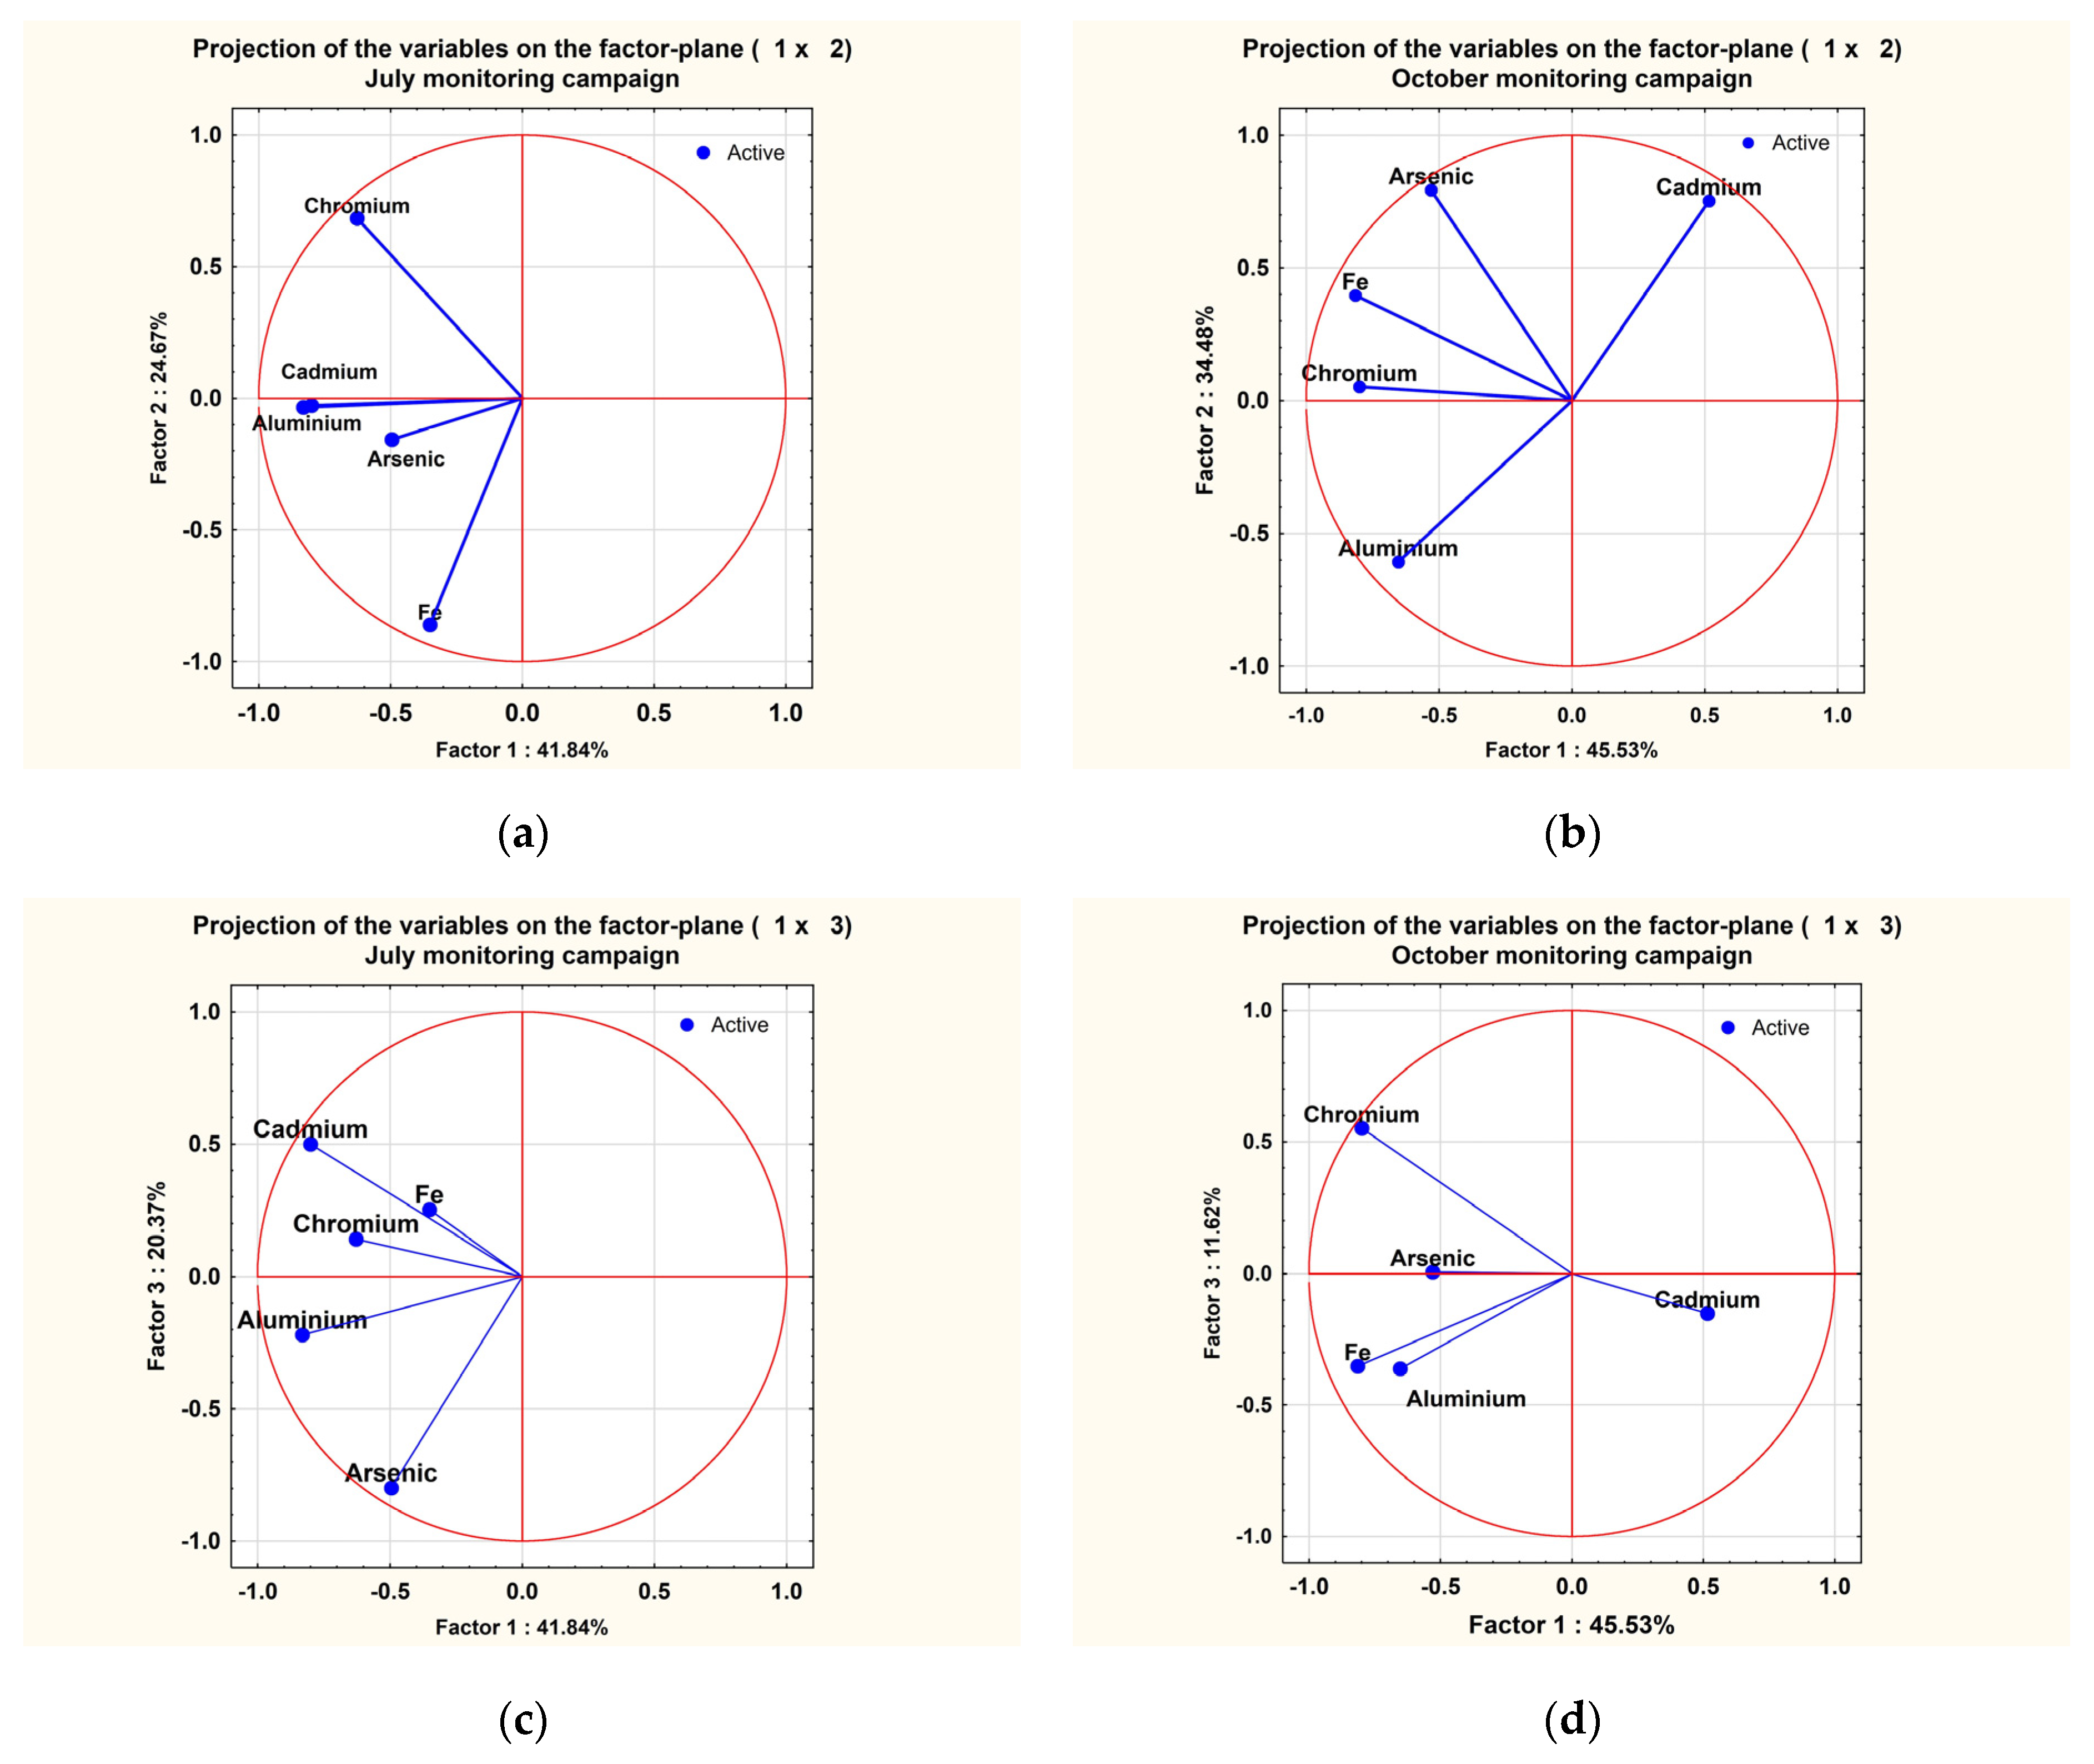

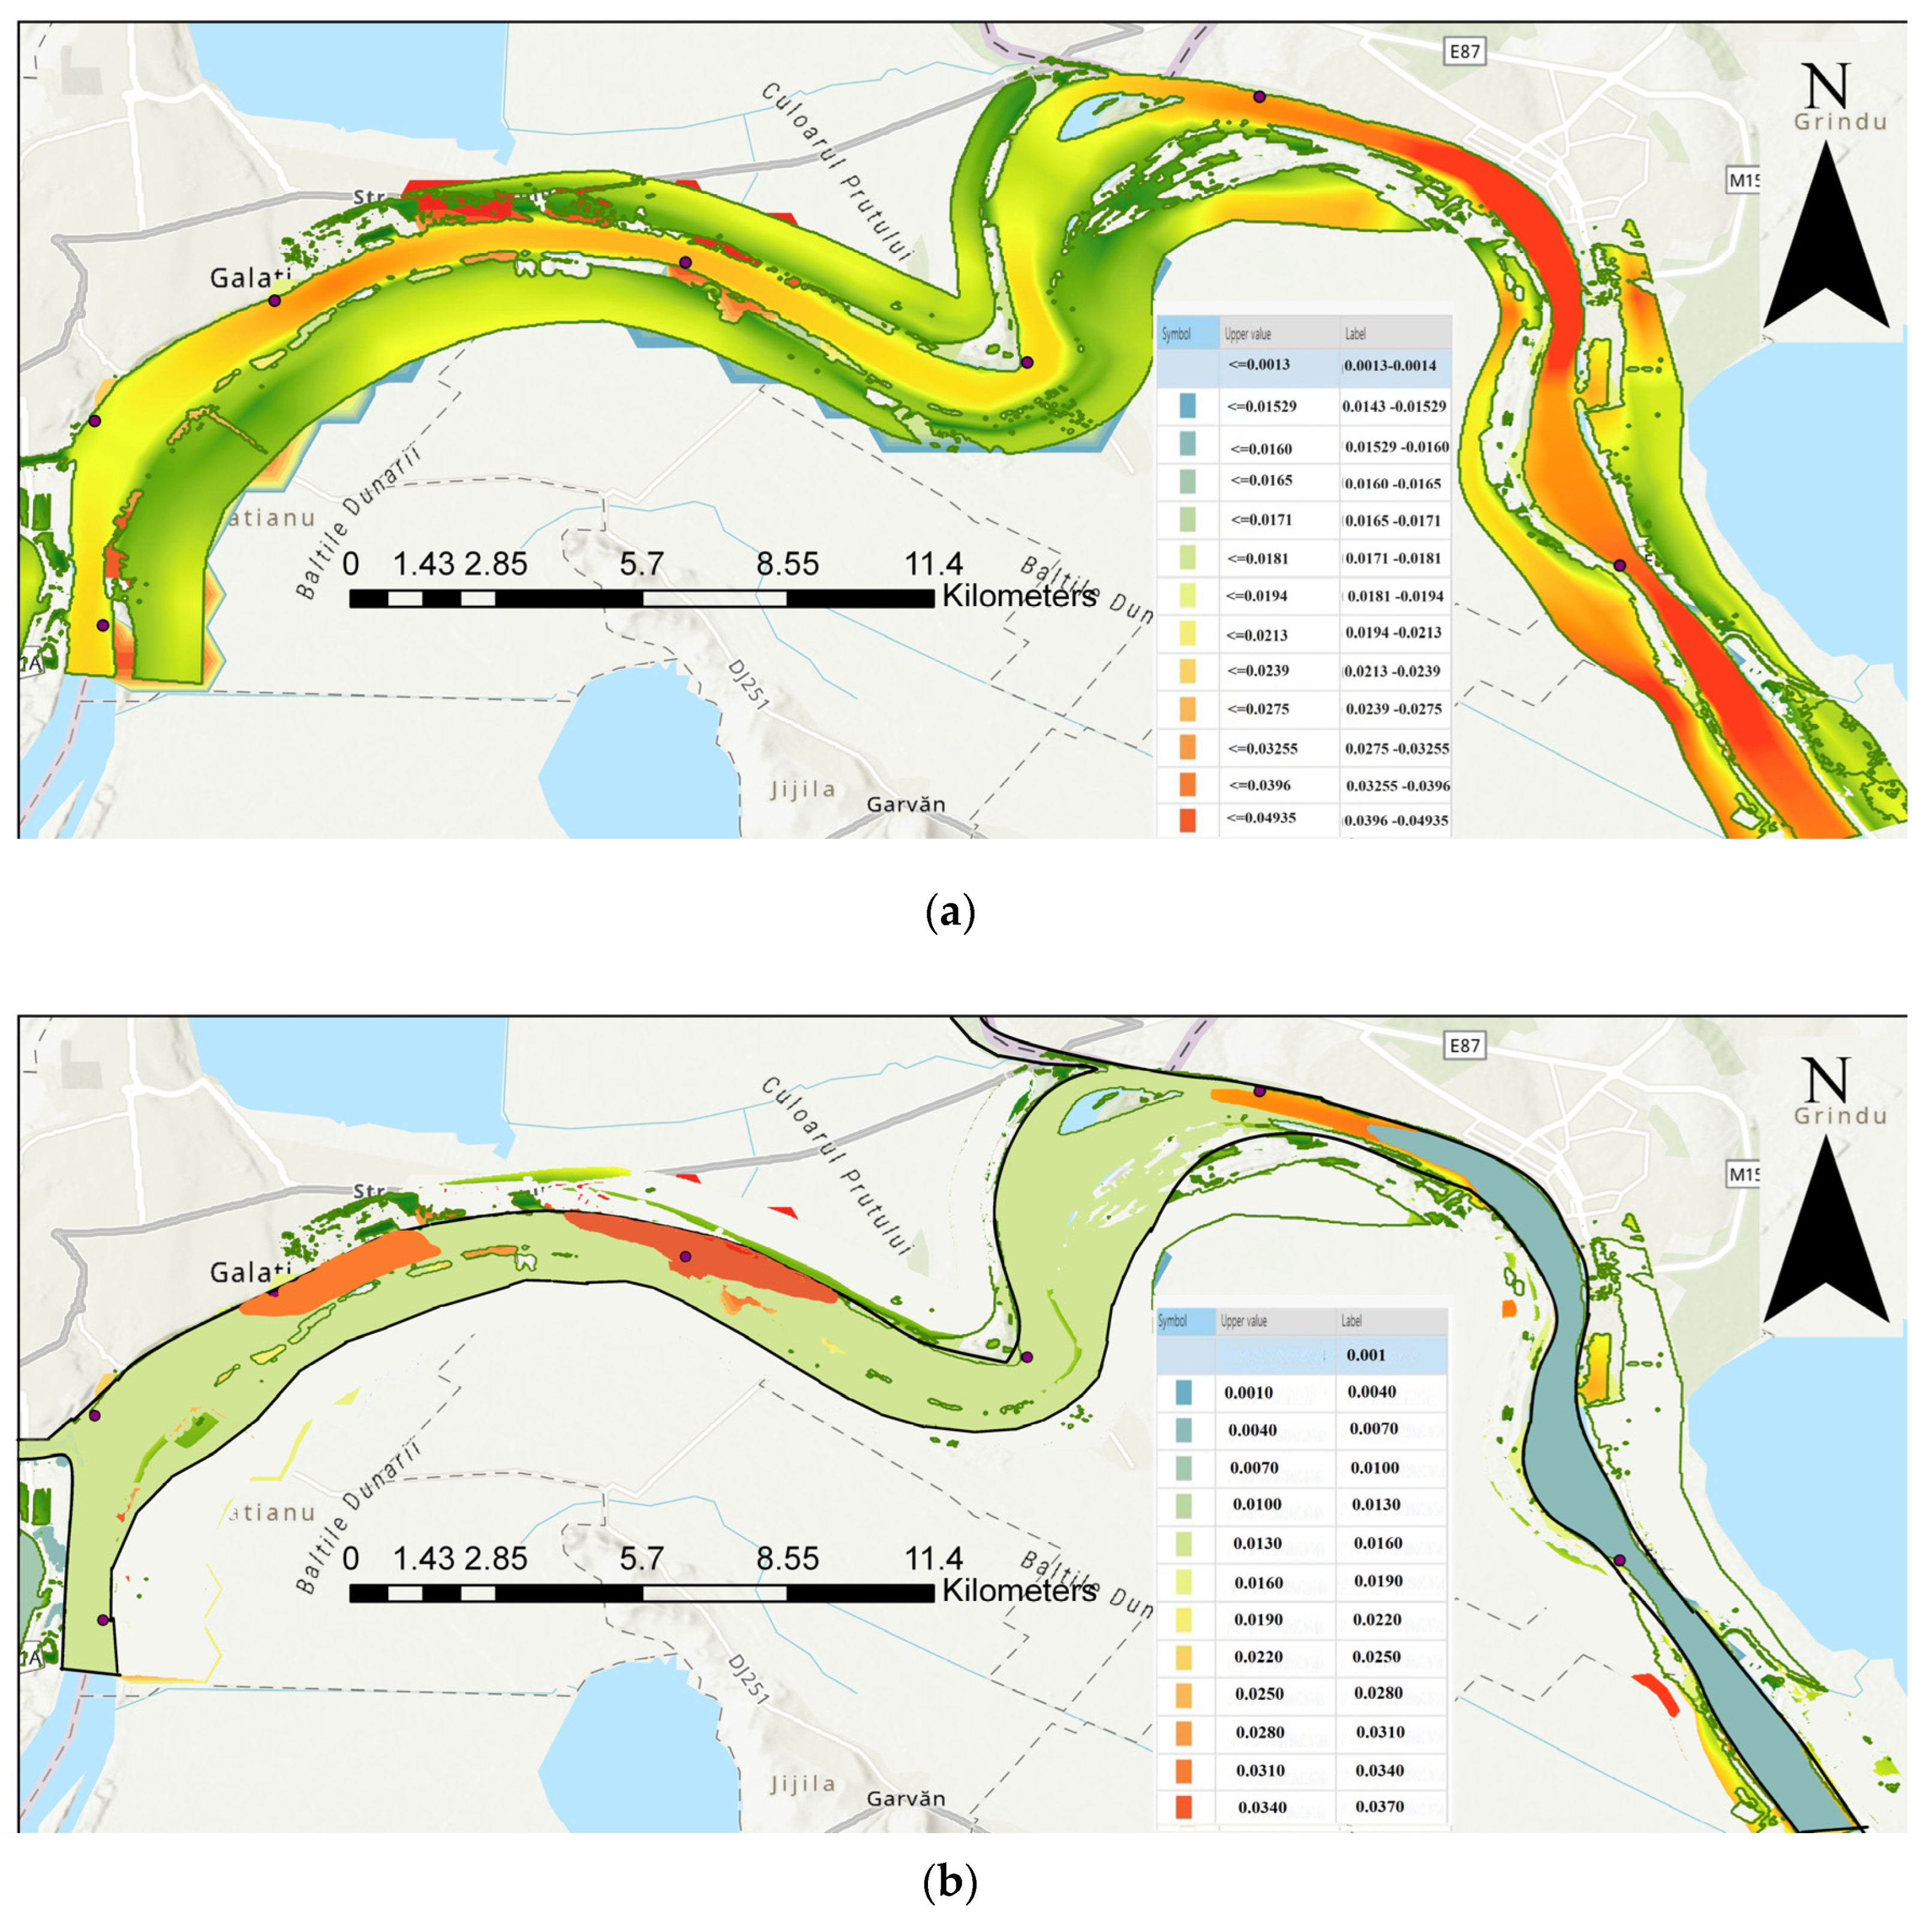

| Code/Name | Station | GPS Coordinates [d.d.] |
|---|---|---|
| P1 | City water Danube Pump Station—on the Danube course—upstream of the mineral port of the steel complex | 45.37261173; 28.02879381 |
| P2 | Siret River monitoring point—on the Siret River upstream course | 45.40016436; 27.9973168 |
| P3 | Siret River confluence with Danube River monitoring point | 45.40848419; 28.027358 |
| P4 | Libertatea restaurant monitoring point—on the Danube course—next to the municipal tourist area | 45.42957954; 28.05900221 |
| P5 | Damen Shipyard downstream monitoring point—on the Danube course | 45.43628888; 28.13124235 |
| P6 | Cotul Pisicii recreation area monitoring point—on the Danube course | 45.41873878; 28.19135779 |
| P7 | Prut River—Giurgiulesti monitoring point—on the Prut River upstream course | 45.48016; 28.185536 |
| P8 | Prut River confluence with Danube River monitoring point | 45.46528806; 28.23220795 |
| P9 | Ukrainian shipyard Reni monitoring point—on the Danube course | 45.38315546; 28.29554717 |
| P10 | Ukrainian passing border Isaccea monitoring point—on the Danube course | 45.28405785; 28.45693996 |
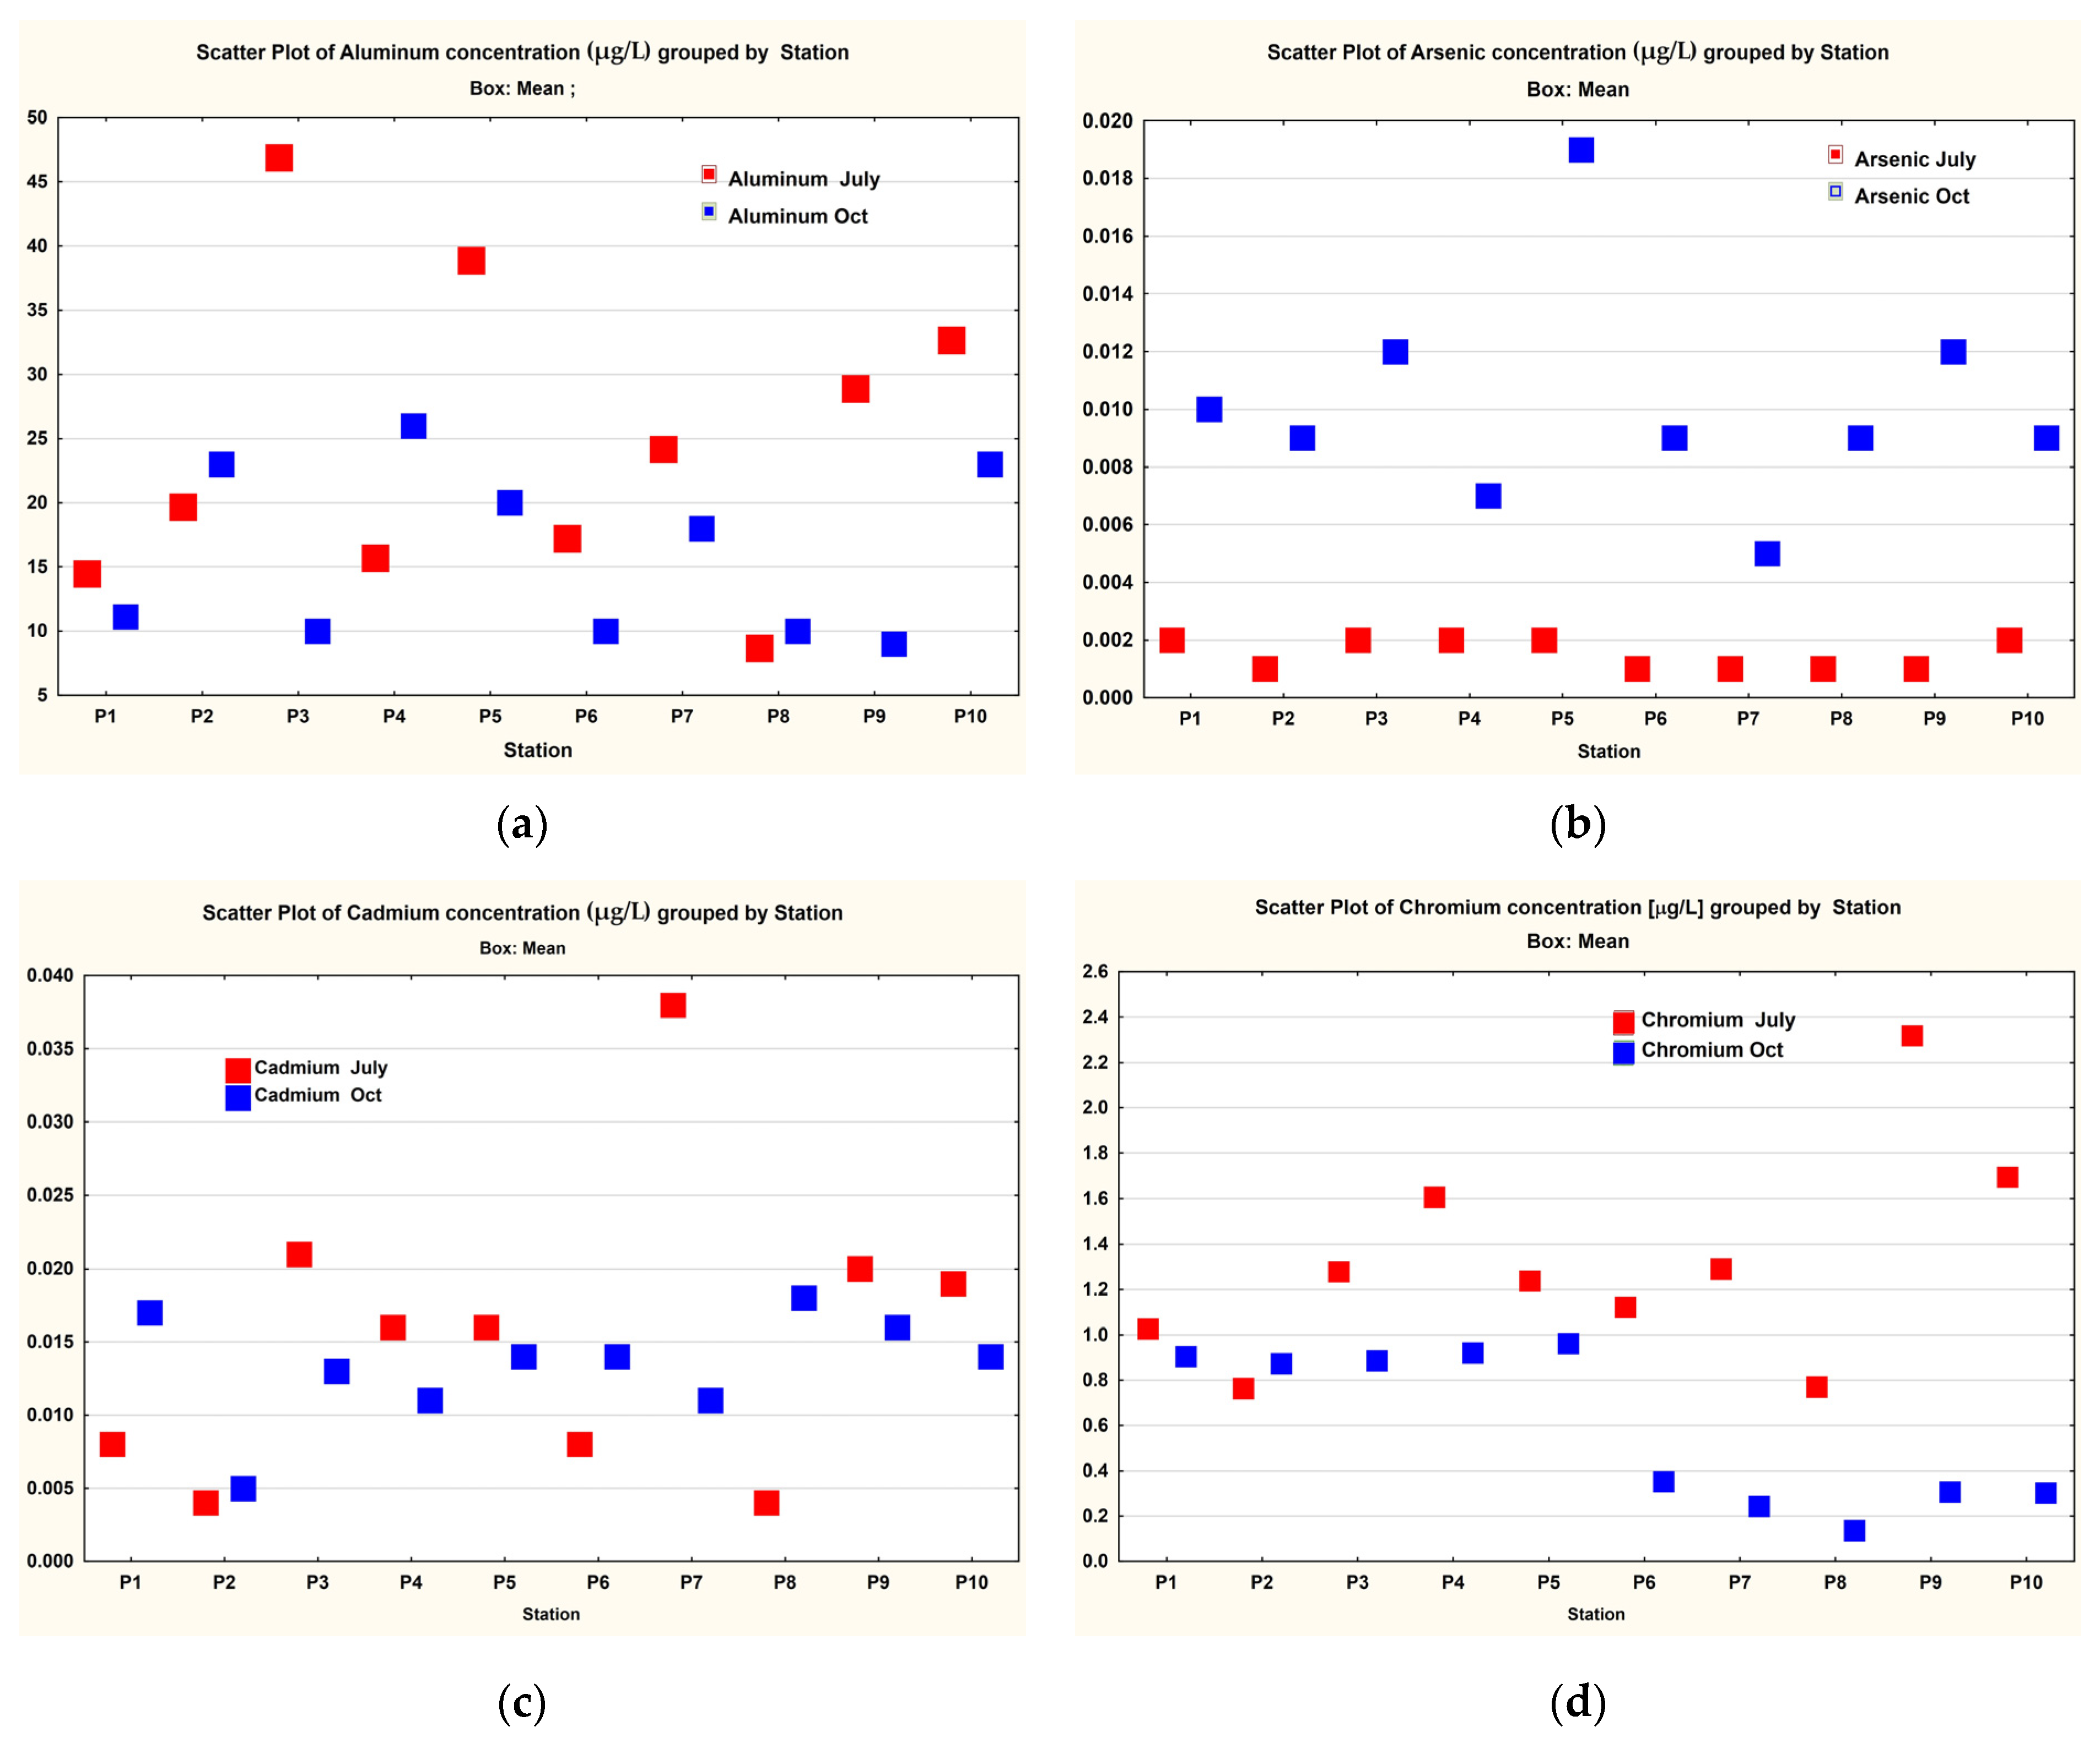
| Station | Aluminum (µg/L) | Arsenic (µg/L) | Beryllium (µg/L) | Cadmium (µg/L) | Chromium (µg/L) | Phosphate—P-PO4 (mg/L) |
|---|---|---|---|---|---|---|
| P1 | 14.468 | 0.002 | <LOD (<0.5 ng/L) | 0.008 | 1.027 | 0.080 |
| P2 | 19.670 | 0.001 | <LOD (<0.5 ng/L) | 0.004 | 0.764 | 0.040 |
| P3 | 46.890 | 0.002 | <LOD (<0.5 ng/L) | 0.021 | 1.280 | 0.070 |
| P4 | 15.704 | 0.002 | <LOD (<0.5 ng/L) | 0.016 | 1.605 | 0.140 |
| P5 | 38.868 | 0.002 | <LOD (<0.5 ng/L) | 0.016 | 1.239 | 0.090 |
| P6 | 17.214 | 0.001 | <LOD (<0.5 ng/L) | 0.008 | 1.123 | 0.070 |
| P7 | 24.168 | 0.001 | <LOD (<0.5 ng/L) | 0.038 | 1.291 | 0.050 |
| P8 | 8.665 | 0.001 | <LOD (<0.5 ng/L) | 0.004 | 0.771 | 0.070 |
| P9 | 28.889 | 0.001 | <LOD (<0.5 ng/L) | 0.020 | 2.318 | 0.080 |
| P10 | 32.650 | 0.002 | <LOD (<0.5 ng/L) | 0.019 | 1.694 | 0.080 |
| July Database | October Database | ||||||||||||
|---|---|---|---|---|---|---|---|---|---|---|---|---|---|
| Variable | Valid N | Mean | Median | Min. | Max. | Std. Dev. | Std. Error | Mean | Median | Min. | Max. | Std. Dev. | Std. Error |
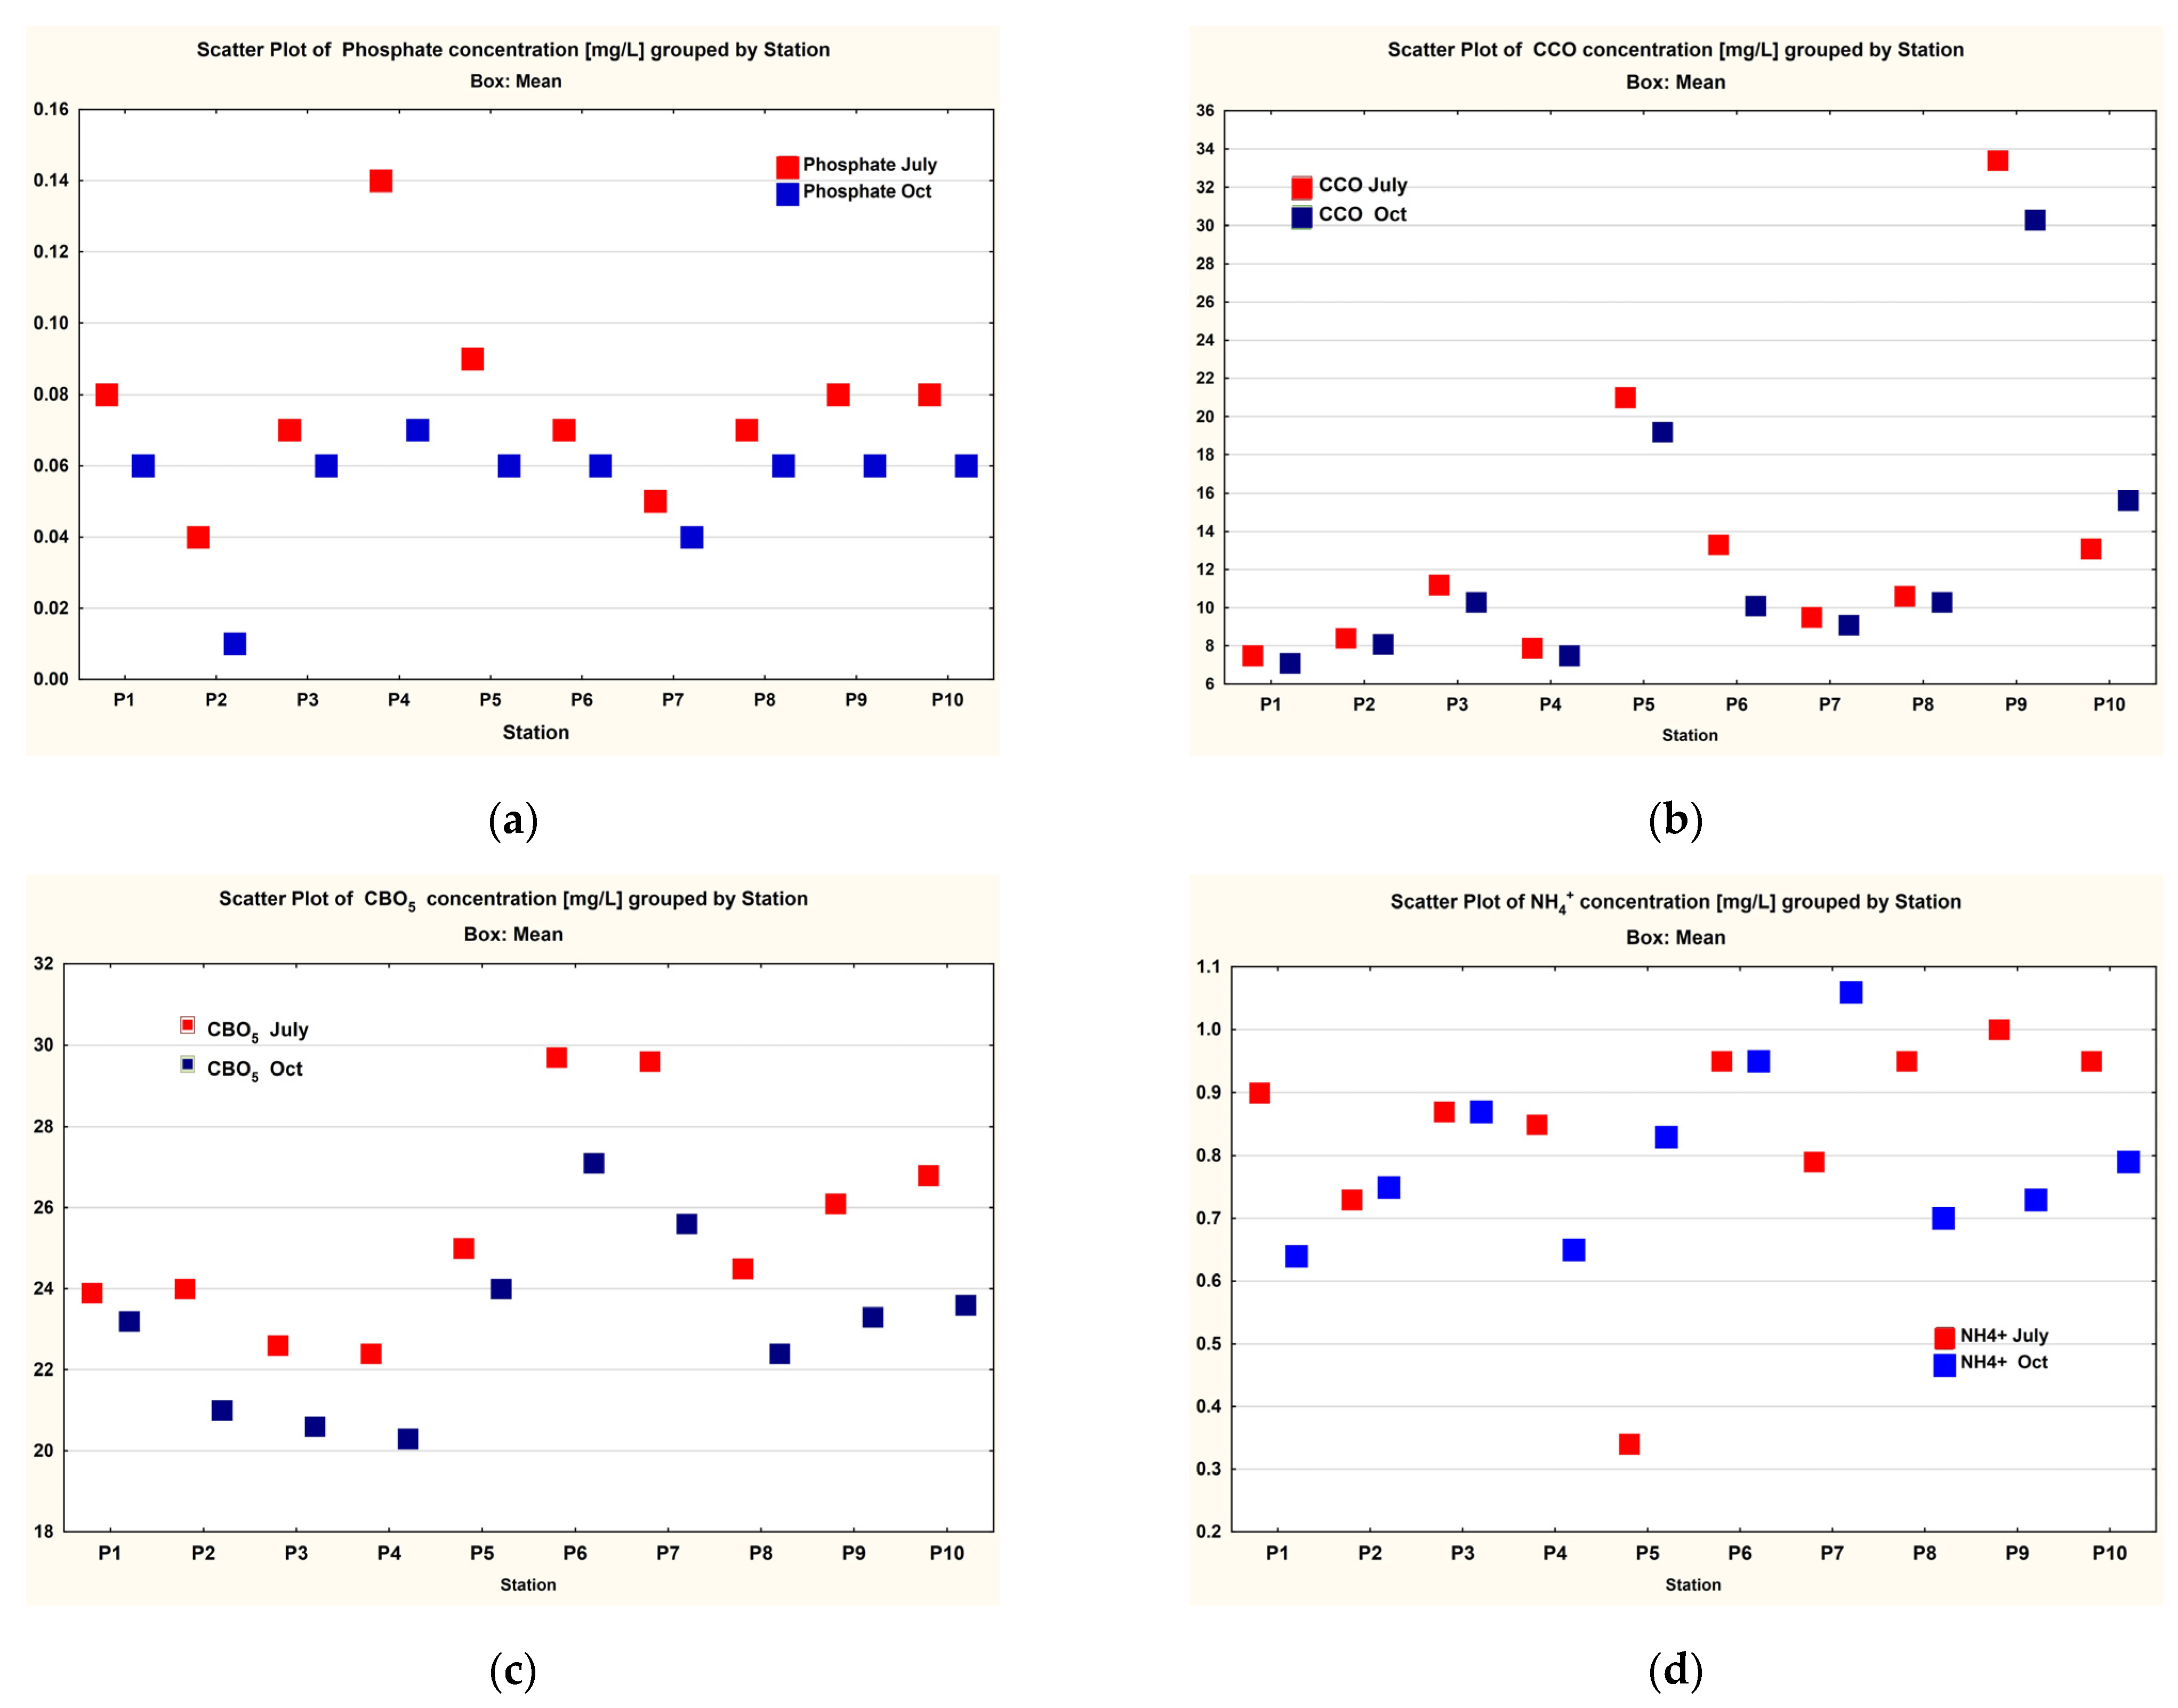
| Phosphate | 10 | 0.07700 | 0.07500 | 0.0400 | 0.14000 | 0.02669 | 0.008439 | 0.05400 | 0.0600 | 0.0100 | 0.070 | 0.01713 | 0.005416 |
| CCO | 10 | 13.59000 | 10.9000 | 7.5000 | 33.40000 | 7.99617 | 2.528612 | 12.76000 | 10.200 | 7.1000 | 30.300 | 7.23559 | 2.288095 |
| CBO5 | 10 | 25.46000 | 24.7500 | 22.400 | 29.70000 | 2.59410 | 0.820325 | 23.11000 | 23.2500 | 20.300 | 27.100 | 2.16920 | 0.685962 |
| NH4+ | 10 | 0.83300 | 0.88500 | 0.340 | 1.00000 | 0.19166 | 0.060609 | 0.79700 | 0.7700 | 0.6400 | 1.060 | 0.13392 | 0.042349 |
| N-NO2 | 10 | 0.01630 | 0.01500 | 0.0130 | 0.02000 | 0.00267 | 0.000844 | 0.00860 | 0.0085 | 0.0070 | 0.0110 | 0.00126 | 0.000400 |
| N-NO3− | 10 | 0.64000 | 0.65000 | 0.500 | 0.80000 | 0.13499 | 0.042687 | 0.30000 | 0.3000 | 0.1000 | 0.500 | 0.13333 | 0.042164 |
| N-Total | 10 | 1.81000 | 1.80000 | 1.500 | 2.00000 | 0.16633 | 0.052599 | 2.40000 | 2.5500 | 0.5000 | 3.700 | 1.08115 | 0.341890 |
| P-PO4 3− | 10 | 0.07700 | 0.07500 | 0.040 | 0.14000 | 0.02669 | 0.008439 | 0.05400 | 0.0600 | 0.0100 | 0.070 | 0.01713 | 0.005416 |
| SO42− | 10 | 27.40000 | 21.0000 | 19.000 | 61.00000 | 14.04121 | 4.440220 | 44.70000 | 41.000 | 38.000 | 71.00 | 9.91127 | 3.134220 |
| Cl− | 10 | 28.70000 | 25.0000 | 22.000 | 57.00000 | 10.45679 | 3.306727 | 39.90000 | 41.500 | 22.000 | 57.000 | 10.26807 | 3.247050 |
| phenols | 10 | 0.03600 | 0.03000 | 0.030 | 0.08000 | 0.01578 | 0.004989 | 0.05800 | 0.060 | 0.010 | 0.100 | 0.02741 | 0.008667 |
| Group 1—July vs. Group 2—Oct | Mean Group 1 | Mean Group 2 | t-Value | df | p | t Separ. Var. Est. | df | P 2-Sided | Std. Dev. Group 1 | Std. Dev. Group 2 | F-Ratio Variances | p Variances |
|---|---|---|---|---|---|---|---|---|---|---|---|---|
| Phosphate July–Phosphate Oct | 0.07700 | 0.05400 | 2.2936 | 18 | 0.034064 | 2.2936 | 15.33828 | 0.036325 | 0.02669 | 0.01713 | 2 | 0.202485 |
| CCO July vs. CCO Oct | 13.59000 | 12.76000 | 0.2434 | 18 | 0.810456 | 0.2434 | 17.82312 | 0.810483 | 7.99617 | 7.23559 | 1 | 0.770730 |
| CBO5 July vs. CBO5 Oct | 25.46000 | 23.11000 | 2.1976 | 18 | 0.041303 | 2.1976 | 17.45324 | 0.041738 | 2.59410 | 2.16920 | 1 | 0.602631 |
| NH4+ July vs. NH4+ Oct | 0.83300 | 0.79700 | 0.4869 | 18 | 0.632211 | 0.4869 | 16.09645 | 0.632899 | 0.19166 | 0.13392 | 2 | 0.300431 |
| N-NO2 July vs. N-NO2 Oct | 0.01630 | 0.00860 | 8.2447 | 18 | 0.000000 | 8.2447 | 12.84941 | 0.000002 | 0.00267 | 0.00126 | 4 | 0.036529 |
| N-NO3− July vs. N-NO3− Oct | 0.64000 | 0.30000 | 5.6667 | 18 | 0.000022 | 5.6667 | 17.99726 | 0.000022 | 0.13499 | 0.13333 | 1 | 0.971262 |
| N-Total July vs. N-Total Oct | 1.81000 | 2.40000 | −1.7056 | 18 | 0.105272 | −1.7056 | 9.42581 | 0.120742 | 0.16633 | 1.08115 | 42 | 0.000005 |
| P-PO4 3− July vs. P-PO4 3− Oct | 0.07700 | 0.05400 | 2.2936 | 18 | 0.034064 | 2.2936 | 15.33828 | 0.036325 | 0.02669 | 0.01713 | 2 | 0.202485 |
| SO42− July vs. SO42− Oct | 27.40000 | 44.70000 | −3.1831 | 18 | 0.005150 | −3.1831 | 16.18487 | 0.005713 | 14.04121 | 9.91127 | 2 | 0.314085 |
| Cl− July vs. Cl− Oct | 28.70000 | 39.90000 | −2.4167 | 18 | 0.026502 | −2.4167 | 17.99403 | 0.026505 | 10.45679 | 10.26807 | 1 | 0.957620 |
| phenols July vs. phenols Oct | 0.03600 | 0.05800 | −2.2000 | 18 | 0.041109 | −2.2000 | 14.37439 | 0.044629 | 0.01578 | 0.02741 | 3 | 0.115426 |
| July Database | October Database | ||||||||||||
|---|---|---|---|---|---|---|---|---|---|---|---|---|---|
| Variable | Valid N | Mean | Median | Minim. | Maxim. | Std. Dev. | Std. Error | Mean | Median | Minim. | Maxim. | Std. Dev. | Std. Error |
| Al | 10 | 24.71860 | 21.91900 | 8.665000 | 46.89000 | 12.01038 | 3.798014 | 16.01210 | 14.56050 | 9.000000 | 26.00000 | 6.656686 | 2.105029 |
| As | 10 | 0.00150 | 0.00150 | 0.001000 | 0.00200 | 0.00053 | 0.000167 | 0.01010 | 0.00900 | 0.005000 | 0.01900 | 0.003755 | 0.001187 |
| Cd | 10 | 0.01540 | 0.01600 | 0.004000 | 0.03800 | 0.01025 | 0.003243 | 0.01330 | 0.01400 | 0.005000 | 0.01800 | 0.003713 | 0.001174 |
| Cr | 10 | 1.31120 | 1.25950 | 0.764000 | 2.31800 | 0.46673 | 0.147593 | 0.58920 | 0.61350 | 0.137000 | 0.96200 | 0.343044 | 0.108480 |
| Fe | 10 | 0.030000 | 0.021500 | 0.013000 | 0.063000 | 0.018203 | 0.020600 | 0.013000 | 0.006000 | 0.082000 | 0.022751 | 0.007194 | 0.020600 |
| Group 1 vs. Group 2 | Mean Group 1 | Mean Group 2 | t-Value | df | p | t Separ. Var. Est. | df | p 2-Sided | Std. Dev. Group 1 | Std. Dev. Group 2 | F-Ratio Variances | p Variances |
|---|---|---|---|---|---|---|---|---|---|---|---|---|
| Al. Jul vs. Al. Oct | 24.71860 | 16.01210 | 2.005017 | 18 | 0.060237 | 2.005017 | 14.05258 | 0.064618 | 12.01038 | 6.656686 | 3.255346 | 0.093547 |
| As Jul vs. As Oct | 0.001500 | 0.010100 | −7.17220 | 18 | 0.000001 | −7.17220 | 9.354472 | 0.000043 | 0.000527 | 0.003755 | 50.76000 | 0.000002 |
| Cd. Jul vs. Cd Oct | 0.015400 | 0.013300 | 0.608902 | 18 | 0.550198 | 0.608902 | 11.32041 | 0.554612 | 0.010255 | 0.003713 | 7.626108 | 0.005756 |
| Cr Jul. vs. Cr oct | 1.311200 | 0.589200 | 3.941673 | 18 | 0.000956 | 3.941673 | 16.52723 | 0.001104 | 0.466729 | 0.343044 | 1.851099 | 0.372571 |
| Fe Jul vs. Fe Oct | 0.030000 | 0.020600 | 1.020213 | 18 | 0.321144 | 1.020213 | 17.17325 | 0.321785 | 10 | 10 | 0.018203 | 0.022751 |
| Phosphate Jul vs. Phosphate Oct | 0.07700 | 0.05400 | 2.2936 | 18 | 0.034064 | 2.2936 | 15.33828 | 0.036325 | 0.02669 | 0.01713 | 2 | 0.202485 |
| Variable | Al | As | Cd | Cr | Fe | CCO | CBO5 | NH4+ | N-NO2 | N-NO3− | N-Total | P-PO4 3− | SO42− | Cl− | Phenols |
|---|---|---|---|---|---|---|---|---|---|---|---|---|---|---|---|
| Al | 1.0000 | 0.4386 | 0.4822 | 0.3696 | 0.2077 | 0.3736 | −0.0869 | −0.3660 | 0.2185 | −0.1587 | 0.1489 | −0.0579 | −0.1131 | −0.1075 | 0.3626 |
| p = --- | p = 0.0205 | p = 0.158 | p = 0.293 | p = 0.565 | p = 0.288 | p = 0.811 | p = 0.298 | p = 0.544 | p = 0.661 | p = 0.681 | p = 0.874 | p = 0.0756 | p = 0.768 | p = 0.303 | |
| As | 0.4386 | 1.0000 | 0.0617 | 0.1305 | 0.1274 | −0.1911 | −0.5364 | −0.2805 | −0.0395 | −0.6247 | 0.4436 | 0.5925 | −0.4805 | −0.4335 | 0.4009 |
| p = 0.205 | p = --- | p = 0.866 | p = 0.719 | p = 0.726 | p = 0.597 | p = 0.110 | p = 0.432 | p = 0.914 | p = 0.053 | p = 0.199 | p = 0.071 | p = 0.160 | p = 0.211 | p = 0.251 | |
| Cd | 0.4822 | 0.0617 | 10.0000 | 0.4969 | 0.3720 | 0.1694 | 0.3799 | −0.0781 | 0.4864 | −0.4944 | 0.0886 | −0.0195 | 0.4834 | −0.1407 | 0.1621 |
| p = 0.158 | p = 0.866 | p = --- | p = 0.144 | p = 0.290 | p = 0.640 | p = 0.279 | p = 0.830 | p = 0.154 | p = 0.146 | p = 0.808 | p = 0.957 | p = 0.157 | p = 0.698 | p = 0.655 | |
| Cr | 0.3696 | 0.1305 | 0.4969 | 1.0000 | −0.2396 | 0.7130 | 0.1156 | 0.2550 | −0.0617 | −0.1081 | 0.2698 | 0.4192 | −0.2223 | −0.3824 | 0.2841 |
| p = 0.293 | p = 0.719 | p = 0.144 | p = --- | p = 0.505 | p = 0.021 | p = 0.750 | p = 0.477 | p = 0.866 | p = 0.766 | p = 0.451 | p = 0.228 | p = 0.537 | p = 0.276 | p = 0.426 | |
| Fe | 0.2077 | 0.1274 | 0.3720 | −0.2396 | 1.0000 | −0.0137 | 0.1610 | −0.7392 | −0.0526 | −0.4477 | −0.4184 | −0.2059 | 0.4286 | 0.1185 | −0.3521 |
| p = 0.565 | p = 0.726 | p = 0.290 | p = 0.505 | p = --- | p = 0.970 | p = 0.657 | p = 0.015 | p = 0.885 | p = 0.195 | p = 0.229 | p = 0.568 | p = 0.216 | p = 0.744 | p = 0.318 | |
| CCO | 0.3736 | −0.1911 | 0.1694 | 0.7130 | −0.0137 | 1.0000 | 0.1856 | −0.0485 | −0.2571 | 0.2691 | −0.0784 | 0.0623 | −0.2814 | −0.2178 | −0.0426 |
| p = 0.288 | p = 0.597 | p = 0.640 | p = 0.021 | p = 0.970 | p = --- | p = 0.608 | p = 0.894 | p = 0.473 | p = 0.452 | p = 0.829 | p = 0.864 | p = 0.431 | p = 0.545 | p = 0.907 | |
| CBO5 | −0.0869 | −0.5364 | 0.3799 | 0.1156 | 0.1610 | 0.1856 | 1.0000 | 0.1306 | 0.2122 | 0.0336 | 0.0860 | −0.4144 | 0.4239 | −0.0132 | 0.1043 |
| p = 0.811 | p = 0.110 | p = 0.279 | p = 0.750 | p = 0.657 | p = 0.608 | p = --- | p = 0.719 | p = 0.556 | p = 0.927 | p = 0.813 | p = 0.234 | p = 0.222 | p = 0.971 | p = 0.774 | |
| NH4+ | −0.3660 | −0.2805 | −0.0781 | 0.2550 | −0.7392 | −0.0485 | 0.1306 | 1.0000 | 0.1153 | 0.3942 | 0.2290 | −0.0263 | −0.1665 | −0.2850 | 0.2286 |
| p = 0.298 | p = 0.432 | p = 0.830 | p = 0.477 | p = 0.015 | p = 0.894 | p = 0.719 | p = --- | p = 0.751 | p = 0.260 | p = 0.525 | p = 0.943 | p = 0.646 | p = 0.425 | p = 0.525 | |
| N-NO2 | 0.2185 | −0.0395 | 0.4864 | −0.0617 | −0.0526 | −0.2571 | 0.2122 | 0.1153 | 1.0000 | −0.3763 | 0.1927 | −0.2668 | 0.3582 | −0.0362 | 0.5331 |
| p = 0.544 | p = 0.914 | p = 0.154 | p = 0.866 | p = 0.885 | p = 0.473 | p = 0.556 | p = 0.751 | p = --- | p = 0.284 | p = 0.594 | p = 0.456 | p = 0.309 | p = 0.921 | p = 0.113 | |
| N-NO3− | −0.1587 | −0.6247 | −0.4944 | −0.1081 | −0.4477 | 0.2691 | 0.0336 | 0.3942 | −0.3763 | 1.0000 | −0.3167 | −0.4565 | −0.1266 | 0.2928 | −0.3339 |
| p = 0.661 | p = 0.053 | p = 0.146 | p = 0.766 | p = 0.195 | p = 0.452 | p = 0.927 | p = 0.260 | p = 0.284 | p = --- | p = 0.373 | p = 0.185 | p = 0.727 | p = 0.412 | p = 0.346 | |
| N-Total | 0.1489 | 0.4436 | 0.0886 | 0.2698 | −0.4184 | −0.0784 | 0.0860 | 0.2290 | 0.1927 | −0.3167 | 1.0000 | 0.6082 | −0.5538 | −0.6944 | 0.4404 |
| p = 0.681 | p = 0.199 | p = 0.808 | p = 0.451 | p = 0.229 | p = 0.829 | p = 0.813 | p = 0.525 | p = 0.594 | p = 0.373 | p = --- | p = 0.062 | p = 0.097 | p = 0.026 | p = 0.203 | |
| P-PO4 3− | −0.0579 | 0.5925 | −0.0195 | 0.4192 | −0.2059 | 0.0623 | −0.4144 | −0.0263 | −0.2668 | −0.4565 | 0.6082 | 1.0000 | −0.5776 | −0.5570 | 0.0211 |
| p = 0.874 | p = 0.071 | p = 0.957 | p = 0.228 | p = 0.568 | p = 0.864 | p = 0.234 | p = 0.943 | p = 0.456 | p = 0.185 | p = 0.062 | p = --- | p = 0.080 | p = 0.094 | p = 0.954 | |
| SO4 2− | −0.1131 | −0.4805 | 0.4834 | −0.2223 | 0.4286 | −0.2814 | 0.4239 | −0.1665 | 0.3582 | −0.1266 | −0.5538 | −0.5776 | 1.0000 | 0.6744 | −0.1525 |
| p = 0.756 | p = 0.160 | p = 0.157 | p = 0.537 | p = 0.216 | p = 0.431 | p = 0.222 | p = 0.646 | p = 0.309 | p = 0.727 | p = 0.097 | p = 0.080 | p = --- | p = 0.032 | p = 0.674 | |
| Cl− | −0.1075 | −0.4335 | −0.1407 | −0.3824 | 0.1185 | −0.2178 | −0.0132 | −0.2850 | −0.0362 | 0.2928 | −0.6944 | −0.5570 | 0.6744 | 1.0000 | −0.1899 |
| p = 0.768 | p = 0.211 | p = 0.698 | p = 0.276 | p = 0.744 | p = 0.545 | p = 0.971 | p = 0.425 | p = 0.921 | p = 0.412 | p = 0.026 | p = 0.094 | p = 0.032 | p = --- | p = 0.599 | |
| phenols | 0.3626 | 0.4009 | 0.1621 | 0.2841 | −0.3521 | −0.0426 | 0.1043 | 0.2286 | 0.5331 | −0.3339 | 0.4404 | 0.0211 | −0.1525 | −0.1899 | 1.0000 |
| p = 0.303 | p = 0.251 | p = 0.655 | p = 0.426 | p = 0.318 | p = 0.907 | p = 0.774 | p = 0.525 | p = 0.113 | p = 0.346 | p = 0.203 | p = 0.954 | p = 0.674 | p = 0.599 | p = --- |
| Variable | Al | As | Cd | Cr | Fe | CCO | CBO5 | NH4+ | N-NO2 | N-NO3− | N-Total | P-PO4 3− | SO4 2− | Cl− | Phenols |
|---|---|---|---|---|---|---|---|---|---|---|---|---|---|---|---|
| Al | 1.0000 | −0.1423 | −0.6543 | 0.3350 | 0.3737 | −0.2228 | −0.2869 | −0.0909 | 0.1558 | −0.0155 | −0.0174 | −0.2819 | 0.1452 | 0.4777 | 0.2096 |
| p = --- | p = 0.695 | p = 0.040 | p = 0.344 | p = 0.287 | p = 0.536 | p = 0.422 | p = 0.803 | p = 0.667 | p = 0.966 | p = 0.962 | p = 0.430 | p = 0.689 | p = 0.163 | p = 0.561 | |
| As | −0.1423 | 1.0000 | 0.2526 | 0.4151 | 0.6964 | 0.5281 | −0.0315 | −0.1253 | −0.1076 | −0.2441 | 0.3421 | 0.2177 | −0.5693 | −0.2475 | 0.1641 |
| p = 0.695 | p = --- | p = 0.481 | p = 0.233 | p = 0.025 | p = 0.117 | p = 0.931 | p = 0.730 | p = 0.767 | p = 0.497 | p = 0.333 | p = 0.546 | p = 0.086 | p = 0.490 | p = 0.651 | |
| Cd | −0.6543 | 0.2526 | 1.0000 | −0.3699 | −0.0839 | 0.3284 | 0.2796 | −0.2214 | −0.7522 | 0.1346 | −0.1661 | 0.7652 | −0.4501 | −0.5557 | −0.5284 |
| p = 0.040 | p = 0.481 | p = --- | p = 0.293 | p = 0.818 | p = 0.354 | p = 0.434 | p = 0.539 | p = 0.012 | p = 0.711 | p = 0.647 | p = 0.010 | p = 0.192 | p = 0.095 | p = 0.116 | |
| Cr | 0.3350 | 0.4151 | −0.3699 | 1.0000 | 0.4802 | −0.2653 | −0.5368 | −0.3392 | 0.2875 | −0.6923 | 0.8094 | −0.0756 | −0.3728 | −0.3436 | 0.1409 |
| p = 0.344 | p = 0.233 | p = 0.293 | p = --- | p = 0.160 | p = 0.459 | p = 0.110 | p = 0.338 | p = 0.421 | p = 0.027 | p = 0.005 | p = 0.836 | p = 0.289 | p = 0.331 | p = 0.698 | |
| Fe | 0.3737 | 0.6964 | −0.0839 | 0.4802 | 1.0000 | 0.1544 | 0.0260 | 0.1082 | −0.0448 | 0.0037 | 0.1974 | 0.1528 | −0.1647 | −0.0506 | 0.0752 |
| p = 0.287 | p = 0.025 | p = 0.818 | p = 0.160 | p = --- | p = 0.670 | p = 0.943 | p = 0.766 | p = 0.902 | p = 0.992 | p = 0.585 | p = 0.673 | p = 0.649 | p = 0.890 | p = 0.836 | |
| CCO | −0.2228 | 0.5281 | 0.3284 | −0.2653 | 0.1544 | 1.0000 | 0.1611 | −0.0473 | −0.0906 | −0.0656 | −0.1426 | 0.2274 | −0.2014 | 0.1353 | 0.1732 |
| p = 0.536 | p = 0.117 | p = 0.354 | p = 0.459 | p = 0.670 | p = --- | p = 0.657 | p = 0.897 | p = 0.804 | p = 0.857 | p = 0.694 | p = 0.528 | p = 0.577 | p = 0.709 | p = 0.632 | |
| CBO5 | −0.2869 | −0.0315 | 0.2796 | −0.5368 | 0.0260 | 0.1611 | 1.0000 | 0.6358 | −0.4884 | 0.3304 | −0.6813 | 0.0825 | 0.3676 | 0.1288 | −0.1230 |
| p = 0.422 | p = 0.931 | p = 0.434 | p = 0.110 | p = 0.943 | p = 0.657 | p = --- | p = 0.048 | p = 0.152 | p = 0.351 | p = 0.030 | p = 0.821 | p = 0.296 | p = 0.723 | p = 0.735 | |
| NH4+ | −0.0909 | −0.1253 | −0.2214 | −0.3392 | 0.1082 | −0.0473 | 0.6358 | 1.0000 | 0.1430 | 0.5600 | −0.5372 | −0.2122 | 0.6907 | 0.1290 | 0.4220 |
| p = 0.803 | p = 0.730 | p = 0.539 | p = 0.338 | p = 0.766 | p = 0.897 | p = 0.048 | p = --- | p = 0.694 | p = 0.092 | p = 0.109 | p = 0.556 | p = 0.027 | p = 0.722 | p = 0.224 | |
| N-NO2 | 0.1558 | −0.1076 | −0.7522 | 0.2875 | −0.0448 | −0.0906 | −0.4884 | 0.1430 | 1.0000 | −0.1318 | 0.4062 | −0.6360 | 0.3439 | 0.3217 | 0.5192 |
| p = 0.667 | p = 0.767 | p = 0.012 | p = 0.421 | p = 0.902 | p = 0.804 | p = 0.152 | p = 0.694 | p = --- | p = 0.717 | p = 0.244 | p = 0.048 | p = 0.331 | p = 0.365 | p = 0.124 | |
| N-NO3− | −0.0155 | −0.2441 | 0.1346 | −0.6923 | 0.0037 | −0.0656 | 0.3304 | 0.5600 | −0.1318 | 1.0000 | −0.7322 | −0.0000 | 0.4540 | 0.2191 | 0.0304 |
| p = 0.966 | p = 0.497 | p = 0.711 | p = 0.027 | p = 0.992 | p = 0.857 | p = 0.351 | p = 0.092 | p = 0.717 | p = --- | p = 0.016 | p = 10.00 | p = 0.187 | p = 0.543 | p = 0.934 | |
| N-Total | −0.0174 | 0.3421 | −0.1661 | 0.8094 | 0.1974 | −0.1426 | −0.6813 | −0.5372 | 0.4062 | −0.7322 | 1.0000 | 0.0960 | −0.5641 | −0.3383 | 0.1087 |
| p = 0.962 | p = 0.333 | p = 0.647 | p = 0.005 | p = 0.585 | p = 0.694 | p = 0.030 | p = 0.109 | p = 0.244 | p = 0.016 | p = --- | p = 0.792 | p = 0.089 | p = 0.339 | p = 0.765 | |
| P-PO4 3− | −0.2819 | 0.2177 | 0.7652 | −0.0756 | 0.1528 | 0.2274 | 0.0825 | −0.2122 | −0.6360 | −0.0000 | 0.0960 | 1.0000 | −0.5420 | −0.5598 | −0.2414 |
| p = 0.430 | p = 0.546 | p = 0.010 | p = 0.836 | p = 0.673 | p = 0.528 | p = 0.821 | p = 0.556 | p = 0.048 | p = 10.00 | p = 0.792 | p = --- | p = 0.106 | p = 0.092 | p = 0.502 | |
| SO42− | 0.1452 | −0.5693 | −0.4501 | −0.3728 | −0.1647 | −0.2014 | 0.3676 | 0.6907 | 0.3439 | 0.4540 | −0.5641 | −0.5420 | 1.0000 | 0.3414 | 0.0344 |
| p = 0.689 | p = 0.086 | p = 0.192 | p = 0.289 | p = 0.649 | p = 0.577 | p = 0.296 | p = 0.027 | p = 0.331 | p = 0.187 | p = 0.089 | p = 0.106 | p = --- | p = 0.334 | p = 0.925 | |
| Cl− | 0.4777 | −0.2475 | −0.5557 | −0.3436 | −0.0506 | 0.1353 | 0.1288 | 0.1290 | 0.3217 | 0.2191 | −0.3383 | −0.5598 | 0.3414 | 1.0000 | 0.2756 |
| p = 0.163 | p = 0.490 | p = 0.095 | p = 0.331 | p = 0.890 | p = 0.709 | p = 0.723 | p = 0.722 | p = 0.365 | p = 0.543 | p = 0.339 | p = 0.092 | p = 0.334 | p = --- | p = 0.441 | |
| phenols | 0.2096 | 0.1641 | −0.5284 | 0.1409 | 0.0752 | 0.1732 | −0.1230 | 0.4220 | 0.5192 | 0.0304 | 0.1087 | −0.2414 | 0.0344 | 0.2756 | 1.0000 |
| p = 0.561 | p = 0.651 | p = 0.116 | p = 0.698 | p = 0.836 | p = 0.632 | p = 0.735 | p = 0.224 | p = 0.124 | p = 0.934 | p = 0.765 | p = 0.502 | p = 0.925 | p = 0.441 | p = --- |
| July Monitoring Campaign | October Monitoring Campaign | |||||||
|---|---|---|---|---|---|---|---|---|
| Value Number | Eigenvalue | % Total Variance | Cumulative Eigenvalue | Cumulative % | Eigenvalue | % Total variance | Cumulative Eigenvalue | Cumulative % |
| 1 | 6.204681 * | 34.47045 | 6.20468 | 34.4705 | 5.628626 * | 31.27015 | 5.62863 | 31.2701 |
| 2 | 3.07987 * | 17.11041 | 9.28455 | 51.5809 | 4.444705 * | 24.69281 | 10.07333 | 55.9630 |
| 3 | 2.625296 * | 14.58498 | 11.90985 | 66.1658 | 2.093713 * | 11.63174 | 12.16705 | 67.5947 |
| 4 | 2.063760 * | 11.46534 | 13.97361 | 77.6312 | 1.828940 * | 10.16078 | 13.99599 | 77.7555 |
| 5 | 1.401129 * | 7.78405 | 15.37474 | 85.4152 | 1.312745 * | 7.29303 | 15.30873 | 85.0485 |
| 6 | 1.153074 * | 6.40597 | 16.52781 | 91.8212 | 1.198617 * | 6.65898 | 16.50735 | 91.7075 |
| 7 | 0.603383 | 3.35213 | 17.13120 | 95.1733 | 0.687419 | 3.81899 | 17.19477 | 95.5265 |
| 8 | 0.460789 | 2.55994 | 17.59199 | 97.7333 | 0.469000 | 2.60556 | 17.66377 | 98.1320 |
| 9 | 0.408013 | 2.26674 | 18.00000 | 100.0000 | 0.336233 | 1.86796 | 18.00000 | 100.0000 |
| July Monitoring Campaign | October Monitoring Campaign | |||||||
|---|---|---|---|---|---|---|---|---|
| Value number | Eigenvalue | % Total Variance | Cumulative Eigenvalue | Cumulative % | Eigenvalue | % Total Variance | Cumulative Eigenvalue | Cumulative % |
| 1 | 2.091981 * | 41.83961 | 2.091981 | 41.8396 | 2.276505 * | 45.53009 | 2.276505 | 45.5301 |
| 2 | 1.233531 * | 24.67062 | 3.325512 | 66.5102 | 1.724148 * | 34.48295 | 4.000652 | 80.0130 |
| 3 | 1.018576 * | 20.37151 | 4.344087 | 86.8817 | 0.581033 | 11.62066 | 4.581685 | 91.6337 |
| 4 | 0.423145 | 8.46291 | 4.767233 | 95.3447 | 0.282902 | 5.65804 | 4.864587 | 97.2917 |
| 5 | 0.232767 | 4.65535 | 5.000000 | 100.0000 | 0.135413 | 2.70825 | 5.000000 | 100.0000 |
Disclaimer/Publisher’s Note: The statements, opinions and data contained in all publications are solely those of the individual author(s) and contributor(s) and not of MDPI and/or the editor(s). MDPI and/or the editor(s) disclaim responsibility for any injury to people or property resulting from any ideas, methods, instructions or products referred to in the content. |
© 2024 by the authors. Licensee MDPI, Basel, Switzerland. This article is an open access article distributed under the terms and conditions of the Creative Commons Attribution (CC BY) license (https://creativecommons.org/licenses/by/4.0/).
Share and Cite
Topa, C.; Murariu, G.; Calmuc, V.; Calmuc, M.; Arseni, M.; Serban, C.; Chitescu, C.; Georgescu, L. A Spatial–Seasonal Study on the Danube River in the Adjacent Danube Delta Area: Case Study—Monitored Heavy Metals. Water 2024, 16, 2490. https://doi.org/10.3390/w16172490
Topa C, Murariu G, Calmuc V, Calmuc M, Arseni M, Serban C, Chitescu C, Georgescu L. A Spatial–Seasonal Study on the Danube River in the Adjacent Danube Delta Area: Case Study—Monitored Heavy Metals. Water. 2024; 16(17):2490. https://doi.org/10.3390/w16172490
Chicago/Turabian StyleTopa, Catalina, Gabriel Murariu, Valentina Calmuc, Madalina Calmuc, Maxim Arseni, Cecila Serban, Carmen Chitescu, and Lucian Georgescu. 2024. "A Spatial–Seasonal Study on the Danube River in the Adjacent Danube Delta Area: Case Study—Monitored Heavy Metals" Water 16, no. 17: 2490. https://doi.org/10.3390/w16172490
APA StyleTopa, C., Murariu, G., Calmuc, V., Calmuc, M., Arseni, M., Serban, C., Chitescu, C., & Georgescu, L. (2024). A Spatial–Seasonal Study on the Danube River in the Adjacent Danube Delta Area: Case Study—Monitored Heavy Metals. Water, 16(17), 2490. https://doi.org/10.3390/w16172490


