Article

Investigation of Used Water Sediments from Ceramic Tile Fabrication

by
Simona Elena Avram
1,*,
Bianca Violeta Birle
1,
Lucian Barbu Tudoran
2,3,
Gheorghe Borodi
3 and
Ioan Petean
4,*
1
Faculty of Materials and Environmental Engineering, Technical University of Cluj-Napoca, 103–105 Muncii Bd., 400641 Cluj-Napoca, Romania
2
Faculty of Biology and Geology, Babes-Bolyai University, 44 Gheorghe Bilaşcu Street, 400015 Cluj-Napoca, Romania
3
National Institute for Research and Development of Isotopic and Molecular Technologies, 65-103 Donath Street, 400293 Cluj-Napoca, Romania
4
Faculty of Chemistry and Chemical Engineering, Babes-Bolyai University, 11 Arany Janos Street, 400028 Cluj-Napoca, Romania
*
Authors to whom correspondence should be addressed.
Water 2024, 16(7), 1027; https://doi.org/10.3390/w16071027
Submission received: 7 March 2024 / Revised: 28 March 2024 / Accepted: 30 March 2024 / Published: 2 April 2024

Abstract

:
Used water treatment is one of the most important aspects of environmental protection regarding industrial processes. Particulate matter dispersions affect water parameters; for example, increased pH values such as 10.21 are found for used floor tile water, and values of 10.84 are found for used wall tile water. However, pH decreases to about 9.42 after the sediment filtration process. This influences water turbidity, which is higher for used wall tile water due to its finer suspensions, and it is considerably decreased after the filtration process. Thus, the main aim of the present research is to investigate particulate matter dispersion into the water flows that are involved in ceramic tile technological processes before and after treatment at used water treatment facilities. X-ray diffraction (XRD) coupled with mineralogical optical microscopy (MOM) reveals that waters from wall tiles and floor tiles have similar mineral dispersions, containing mineral particles of quartz (5–50 μm), kaolinite (1–30 μm), and mullite (5–125 μm). Glass particles (having a dark appearance at MOM investigation) were also found in both samples in a size range of 20–55 μm. High-resolution SEM imaging coupled with the EDS elemental analysis confirms the XRD and MOM observations. Water samples collected after treatment at the treatment facility reveal a significant reduction in the particulate matter MOM, evidencing only small traces of quartz, kaolinite, and mullite in a size range of 1–15 μm, with most of the particles being attached to the filters, as confirmed by XRD. Atomic force microscopy (AFM) effectuated on this sample reveals the presence of kaolinite nanoparticles with a tabular–lamellar aspect and sizes ranging from 40 to 90 nm. The obtained results prove the efficacy of the filtering system regarding targeted particulate matters, ensuring water recirculation into the technological processes. The sludge resulting from the filtration process presents with a dense grainy structure of sediment particles containing quartz, mullite, and kaolinite, along with traces of iron hydroxide crystallized as goethite. Therefore, it cannot be reused in the technological flux, as the iron causes glaze staining; but the observed microstructure, along with the mineralogical composition, indicates that it could be used for other applications, such as ecological bricks or plasters, which will be further investigated.

1. Introduction

Ceramic tile fabrication involves various mineral powders such as quartz and clay, and vitreous materials such as broken glass [1,2]. Some of these particulate matters pass into the water used during the technological process and must be properly filtered out at water treatment facilities [3].
Used water is collected from all working places on the floor and wall tile facilities of ceramic factories. Therefore, particulate matters originating in both the raw material and the intermediary sub-products might be found in suspension in the used water [4,5].
Both floor and wall tiles are produced by molding a conditioned ceramic paste into metallic dies to obtain crude ceramic biscuits. Ceramic paste preparation and the washing of metallic dies induce a lot of raw material particles. Biscuit firing and their manipulation can also generate particulate matters that gather in the water used, and this can occur after the glazing process and the final firing. Tile-production facilities have tanks that collect used water from all the mentioned sources. Therefore, it was decided to establish an analysis of water within these tanks in floor tile and wall tile facilities. The sampling procedures and sample preservation and transport approaches used in this study are further described in the Materials and Methods Section.
The most important raw materials in tile production are clays with a controlled purity grade. The purity grade is related to the prevalence of kaolinite and possibly muscovite particles in the clay, which often are found as small fractions [6,7]. Some research regarding clay particles has indicated that kaolinite has nanostructured fractions [8,9].
Another important raw material is quartz sand, which also has a controlled purity grade; this strongly depends on the exploitation point. Generally, local sources are preferred for economic reasons. Thus, the sand deposits situated in the Transylvanian Basin are of great interest; here, large halite deposits [10,11] which are intercalated with sedimentary areas might alter the properties of the raw materials. However, this possibility will lead to the need for Cl management within the ceramic mass, which should be investigated through the elemental analysis of collected samples.
Besides clays and quartz, Ziman et al. show that the raw materials involved in this process might contain various amounts of calcite and feldspars, such as orthose, which also might be found as suspended matters in the used water [4]. Some of the ceramic tiles’ technological processes use broken glass as a melting mediator, identifying particles that could contain small traces of chloride [12,13]. Tile biscuits which have defects after firing are ground and recirculated within the raw material in different proportions according to charge prescriptions [14,15]. This includes mullite particles among the particulate matter, which originates from the raw materials, and ceramic paste which is used for molding.
Used water, resulting from the ceramic industry’s technological processes, is mainly generated by the wet cleaning of the molding dies with water jets (without cleaning agents) rather than from raw material preparation. The clay material, along with glaze and pigment particles, is washed away, becoming suspended particles in the used water. Such dispersed materials might be valuable if they are recycled in a smart manner. However, certain challenges arise due to the details of the technological processes.
Particulate matter suspensions within used water are required, as they allow fast sedimentation to occur during the decantation process in the collecting tanks; however, the current practice proves that this process requires a very long time to be carried out, which is not economically feasible. Therefore, these particles are removed from the used water through a physical filtration system, generating ceramic sludge. Theoretically, this contains most of the raw material particles, and would thus be great for recirculation. Unfortunately, it has been observed that the collected sludge contains various amounts of iron contamination, which compromises its potential for use as a recirculation material. Data in the literature show that iron contamination in the ceramic raw material induces brown stains over the glaze layer [16,17].
The aim of the present study is to investigate the sediment formed by dispersed particles within the used water collected from floor and wall tile facilities and to compare it with the sludge collected after the filtration process at a water treatment station; this will enable us to figure out the best ecological strategy for the management of such waste. The technological process requirements regarding raw materials and processing parameters are significantly different for floor and wall tiles. Thus, we expect to find significant variations regarding used water parameters and the subsequent sediments that might influence the formation of slurry. Water pretreatment for suspended particle filtration is of great interest in the current study for two reasons: water flow recirculation into the technological process and pressed slurry formation.
There is a lack of studies in the literature addressing the sediment found in used water from ceramic tile production and there is an urgent need to diminish the amount of waste produced in these processes; this lack represents an important gap in the research surrounding the operation of the ceramic industry. The novelty of the current research lies in the presented advanced approach that enables slurry to be transformed from a potentially dangerous and harmful waste into a raw material that is potentially useful for certain suitable applications, such as ecological bricks or plasters. The presented investigations of water properties and detailed physicochemical characterizations of the pressed slurry (made possible through mineralogical investigations coupled with advanced scanning electron microscopy (SEM) and ultra-structural observations, performed using atomic force microscopy (AFM)) are expected to provide practitioners in the field with important and useful information regarding the possibilities of slurry recycling.

2. Materials and Methods

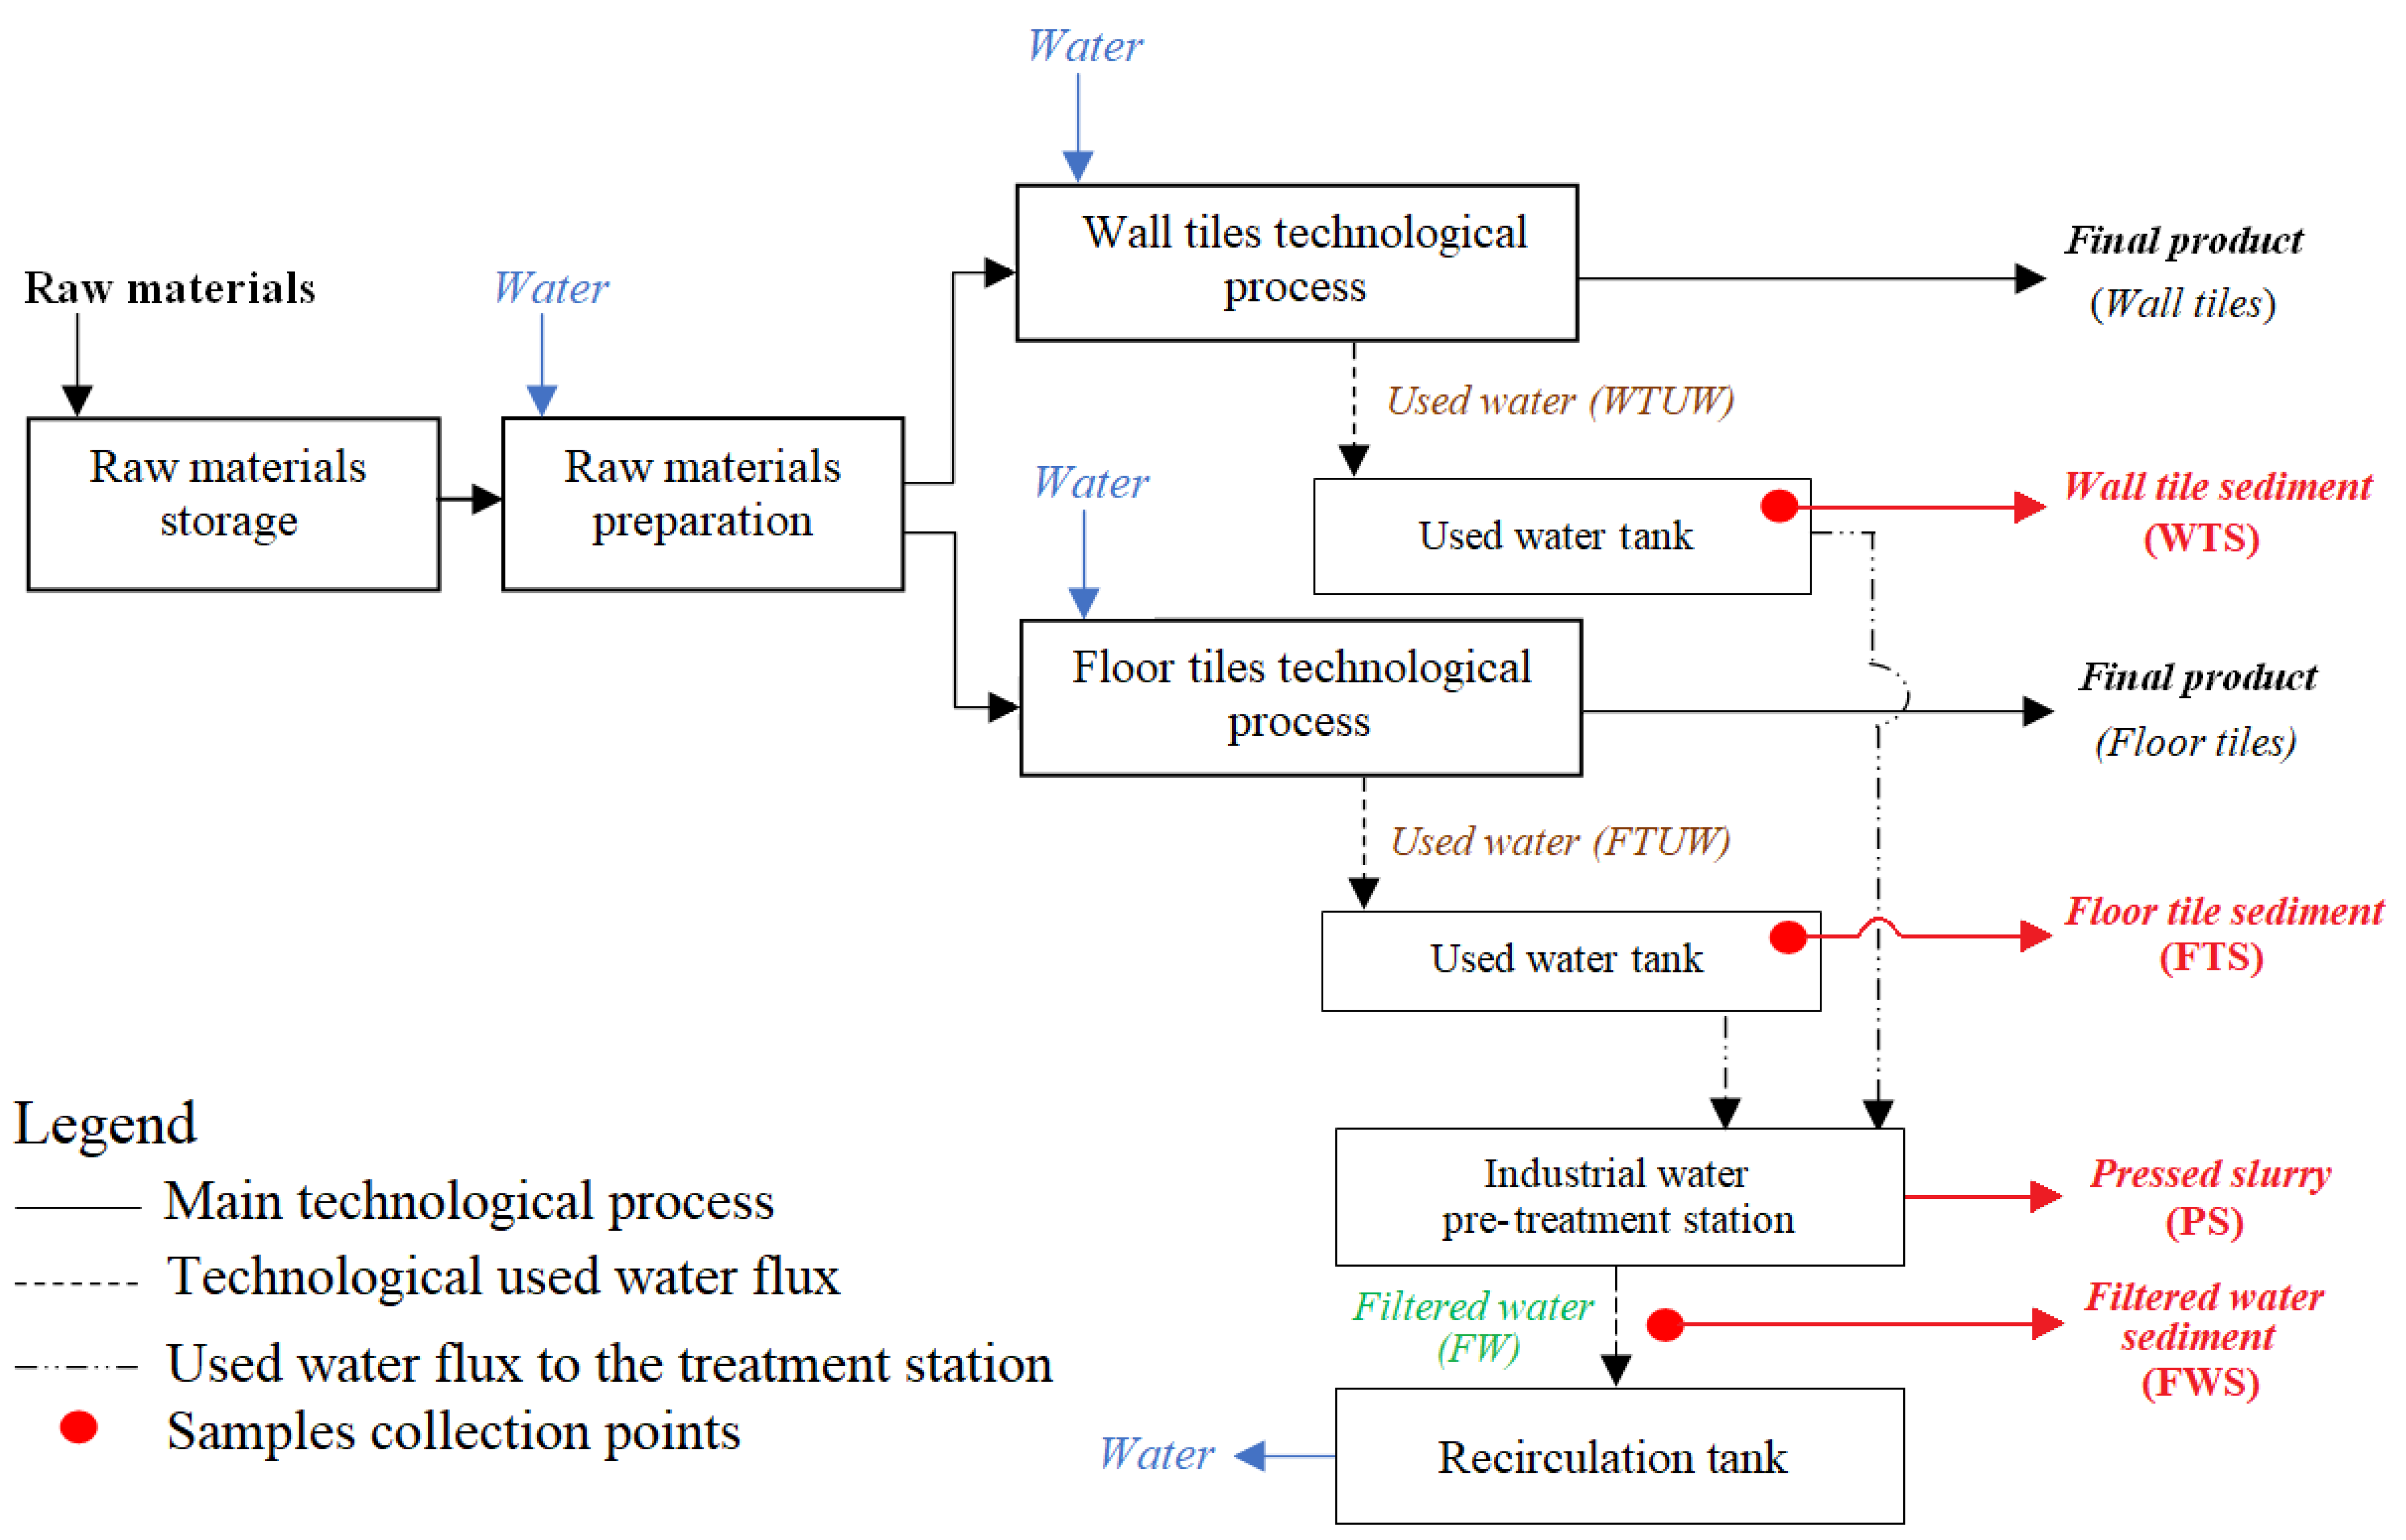
2.1. Samples Collection and Storage

The current investigation was conducted using samples collected from an industrial facility that produces floor and wall ceramic tiles in Cluj County, Romania (the company name is kept anonymous for economic reasons). The water circuit for the technological processes of the floor and wall tiles was analyzed, and the sample collection points are identified in Figure 1. The on-site monitoring was effectuated by weekly measurements for two months. The water parameters were measured and mean values were established.
The used water resulting from each technological process was collected in a storage tank and then was directed to the pretreatment station for the filtration process, as described in Figure 1. We collected samples from the used water tanks from the floor tile (FTUW) process, from the tanks from the wall tile (WTUW) process, and from the treatment facility after the filtration (FW).
The water samples were extracted from the tanks with a manual pump and deposited into glass vials, which were properly labeled for easy identification. The sample vials were transported to the laboratory in a cooled container at 4 °C and further stored in a refrigerator at the same temperature. The measurements were effectuated within 24 hours of collection to prevent sample alterations. The sediment samples were collected from the bottom of each used water storage vial and merged onto an average representative sample for each of the following: floor tile sediment (FTS), wall tile sediment (WTS), and filtered water sediment (FWS).
The procedures were repeated weekly for two months, and the samples were analyzed in the laboratory; the obtained results were centralized and statistically processed.

2.2. Experimental Methods

2.2.1. Water Properties Measurement Method

The water properties—such as pH, electrical conductivity, resistivity, total dissolved solids, salinity, and temperature—were measured using a multi-parameter device, HANNA HI 9829, with a GPS positioning system, produced by Hanna Instruments Co., Bedforshire, UK. The measurements were effectuated according to the device instructions and the obtained values were properly centralized.
Their evolution was statistically analyzed by an ANOVA test with a significance level of p = 0.05; this was followed by a Tukey post hoc test using Origin software version 2019b, produced by Microcal Company, Northampton, MA, USA.

2.2.2. Mineralogical Investigations

Mineralogical microscopy was effectuated in cross-polarized light using a Laboval 2 Microscope, Carl Zeiss, Jena, Germany, equipped with digital photo system, Samsung 10 megapixels. The sediment particles were spread on the glass lamella to reveal both small and bigger particle sizes.
X-ray diffraction (XRD) was effectuated with a Bruker D8 Advance diffractometer using monochromatic radiation Cu Kα1 (λ = 1.54056 Å) at room temperature. All patterns were registered in the 2 theta range of 10–80 degrees at a speed of 1 degree/minute. The mineral phase identification was performed with Match 1.0 software and PDF 2.0 database, Crystal Impact Company, Bonn, Germany. The PDF files used for the minerals’ identification are as follows: quartz—PDF 89-8936; kaolinite—PDF 01-0527; mullite—PDF 02-0428; lepidocrocite—PDF 76-2301.

2.2.3. Microstructural Investigations

The sediments’ morphologies and elemental compositions were investigated with a Hitachi SU8230 scanning electron microscope (SEM) equipped with an energy-dispersive spectroscopy (EDS) detector, X-Max 1160 EDX (Oxford Instruments). The investigation was effectuated in the high-vacuum mode with the electron beam acceleration voltage of 40 kV. All samples were metalized with a thin gold layer to assure their electrical conductivity, which was necessary for the high-resolution view. The gold component was subtracted from the elemental analysis.
The atomic force microscopy investigation was effectuated with a Jeol JSPM 4210 Scanning Probe Microscope (JEOL, Tokyo, Japan), operated in tapping mode. The sample surface was probed with an NSC 15 cantilever produced by MikroMasch Co., Sofia, Bulgaria, with a resonant frequency of 325 kHz and a force constant of 40 N/m. The scanning rate was in the range of 1–3 Hz, depending on the scanned area. The obtained images were processed with Win SPM 2.0 processing soft (JEOL, Tokyo, Japan), measuring the particle diameters and local heights. At least 3 different macroscopic sites on the sample surface were investigated for proper statistical relevance.

3. Results

The current section is organized starting with the investigation of the collected water samples and the measurement of their physical values, followed by an investigation of the dispersed particles up to the final slurry formation.

3.1. Water Samples Properties

The properties of used water are strongly influenced by the particularities of a given technological process and, especially, by the induced dispersed particles. The micro dispersoids might release ions and might be partly dissolved into used water, altering its properties. The mean values of water properties, with their standard deviations, are presented in Figure 2.
The pH variation in Figure 2a shows that all water samples are alkaline, with mean values of 10.21 for the used floor tile water (FTUW) and 10.84 for the used wall tile water (WTUW). There are strong statistical similarities between these samples, so they form a statistical group. The pretreated water has a mean pH of about 9.42 after the filtration process, evidencing a significant decrease in alkalinity; this fact is supported by the statistical analysis. The p value is lower than the significance level of 0.05, indicating that the filtered water (FW) forms a different statistical group than the used water. The pH value did not decrease to the NTPA 002 prescriptions (i.e., Romanian regulations regarding used water quality) of 6.5–8.5 due to the removal of dispersoids through the filtration process; thus, it requires further water neutralization to be discharged, or it could be collected in the recirculation tank and reused in the technological process. The pH values are strongly influenced by the dissolved solids and salts and less influenced by the mineral dispersions. The significant decrease in pH in the FW sample indicates that some salt traces might be kept on the slurry after the pressing filtration process. It will be useful to find these traces in the elemental analysis.
The electrical properties of the water samples are represented by the conductivity (see Figure 2b) and the resistivity (see Figure 2c). These two properties are antagonistic and strongly depend on the dispersed particles and dissolved solids. The results show that FTUW presents with low conductivity and high resistivity; meanwhile, WTUV has high conductivity and low resistivity. The statistical analysis reveals significant differences between FTUW and WTUW, indicating that they are distinct statistical populations. The statistical results show that the conductivity and resistivity of the FW sample belong to the WTUW statistical population. This means that FW is more influenced by the WTUW than it is by the FTUW.
This fact is explained by the low amount of total dissolved solids (TDS) and salinity of FTUW (see Figure 2d,e); meanwhile, WTUW has a significant level of TDS and increased salinity. The gross difference between the used water samples is supported by the statistical analysis (p < 0.05). FTUW and WTUW, when collecting in the used water tanks, hold mixtures of both used water and TDS; salinity slightly decreases due to the partial dilution. This is the situation that was observed for the FW sample. The statistical analysis shows that WTUW and FW form a statistical population (p > 0.05) and proves that WTUW has a greater influence on FW than FTUW does (p < 0.05).
The turbidity directly reflects the number of dispersed particles in the used water. The WTUW sample is more turbid immediately after sampling; this is followed by FTUW. Meanwhile, the filtered water has low turbidity as a consequence of the removal of micro-dispersions in the filtration process (see Figure 2f). Turbidity significantly decreases after 1 day, as a consequence of micro-particle sedimentation; this is visible mostly in FTUW and FW, and is less evident in WTUW (after 1 day, its turbidity is slightly higher than the initial value for FTUW). The turbidity after 30 days is very low for FTUW and 0 for FW; meanwhile, for WTUW, it is still higher. The statistical analysis reveals good similarities in the turbidity behavior of FTUW and FW, with a significant difference shown by WTUW. This indicates the presence of ultrafine particles in the WTUW sample, which requires further advanced investigations.

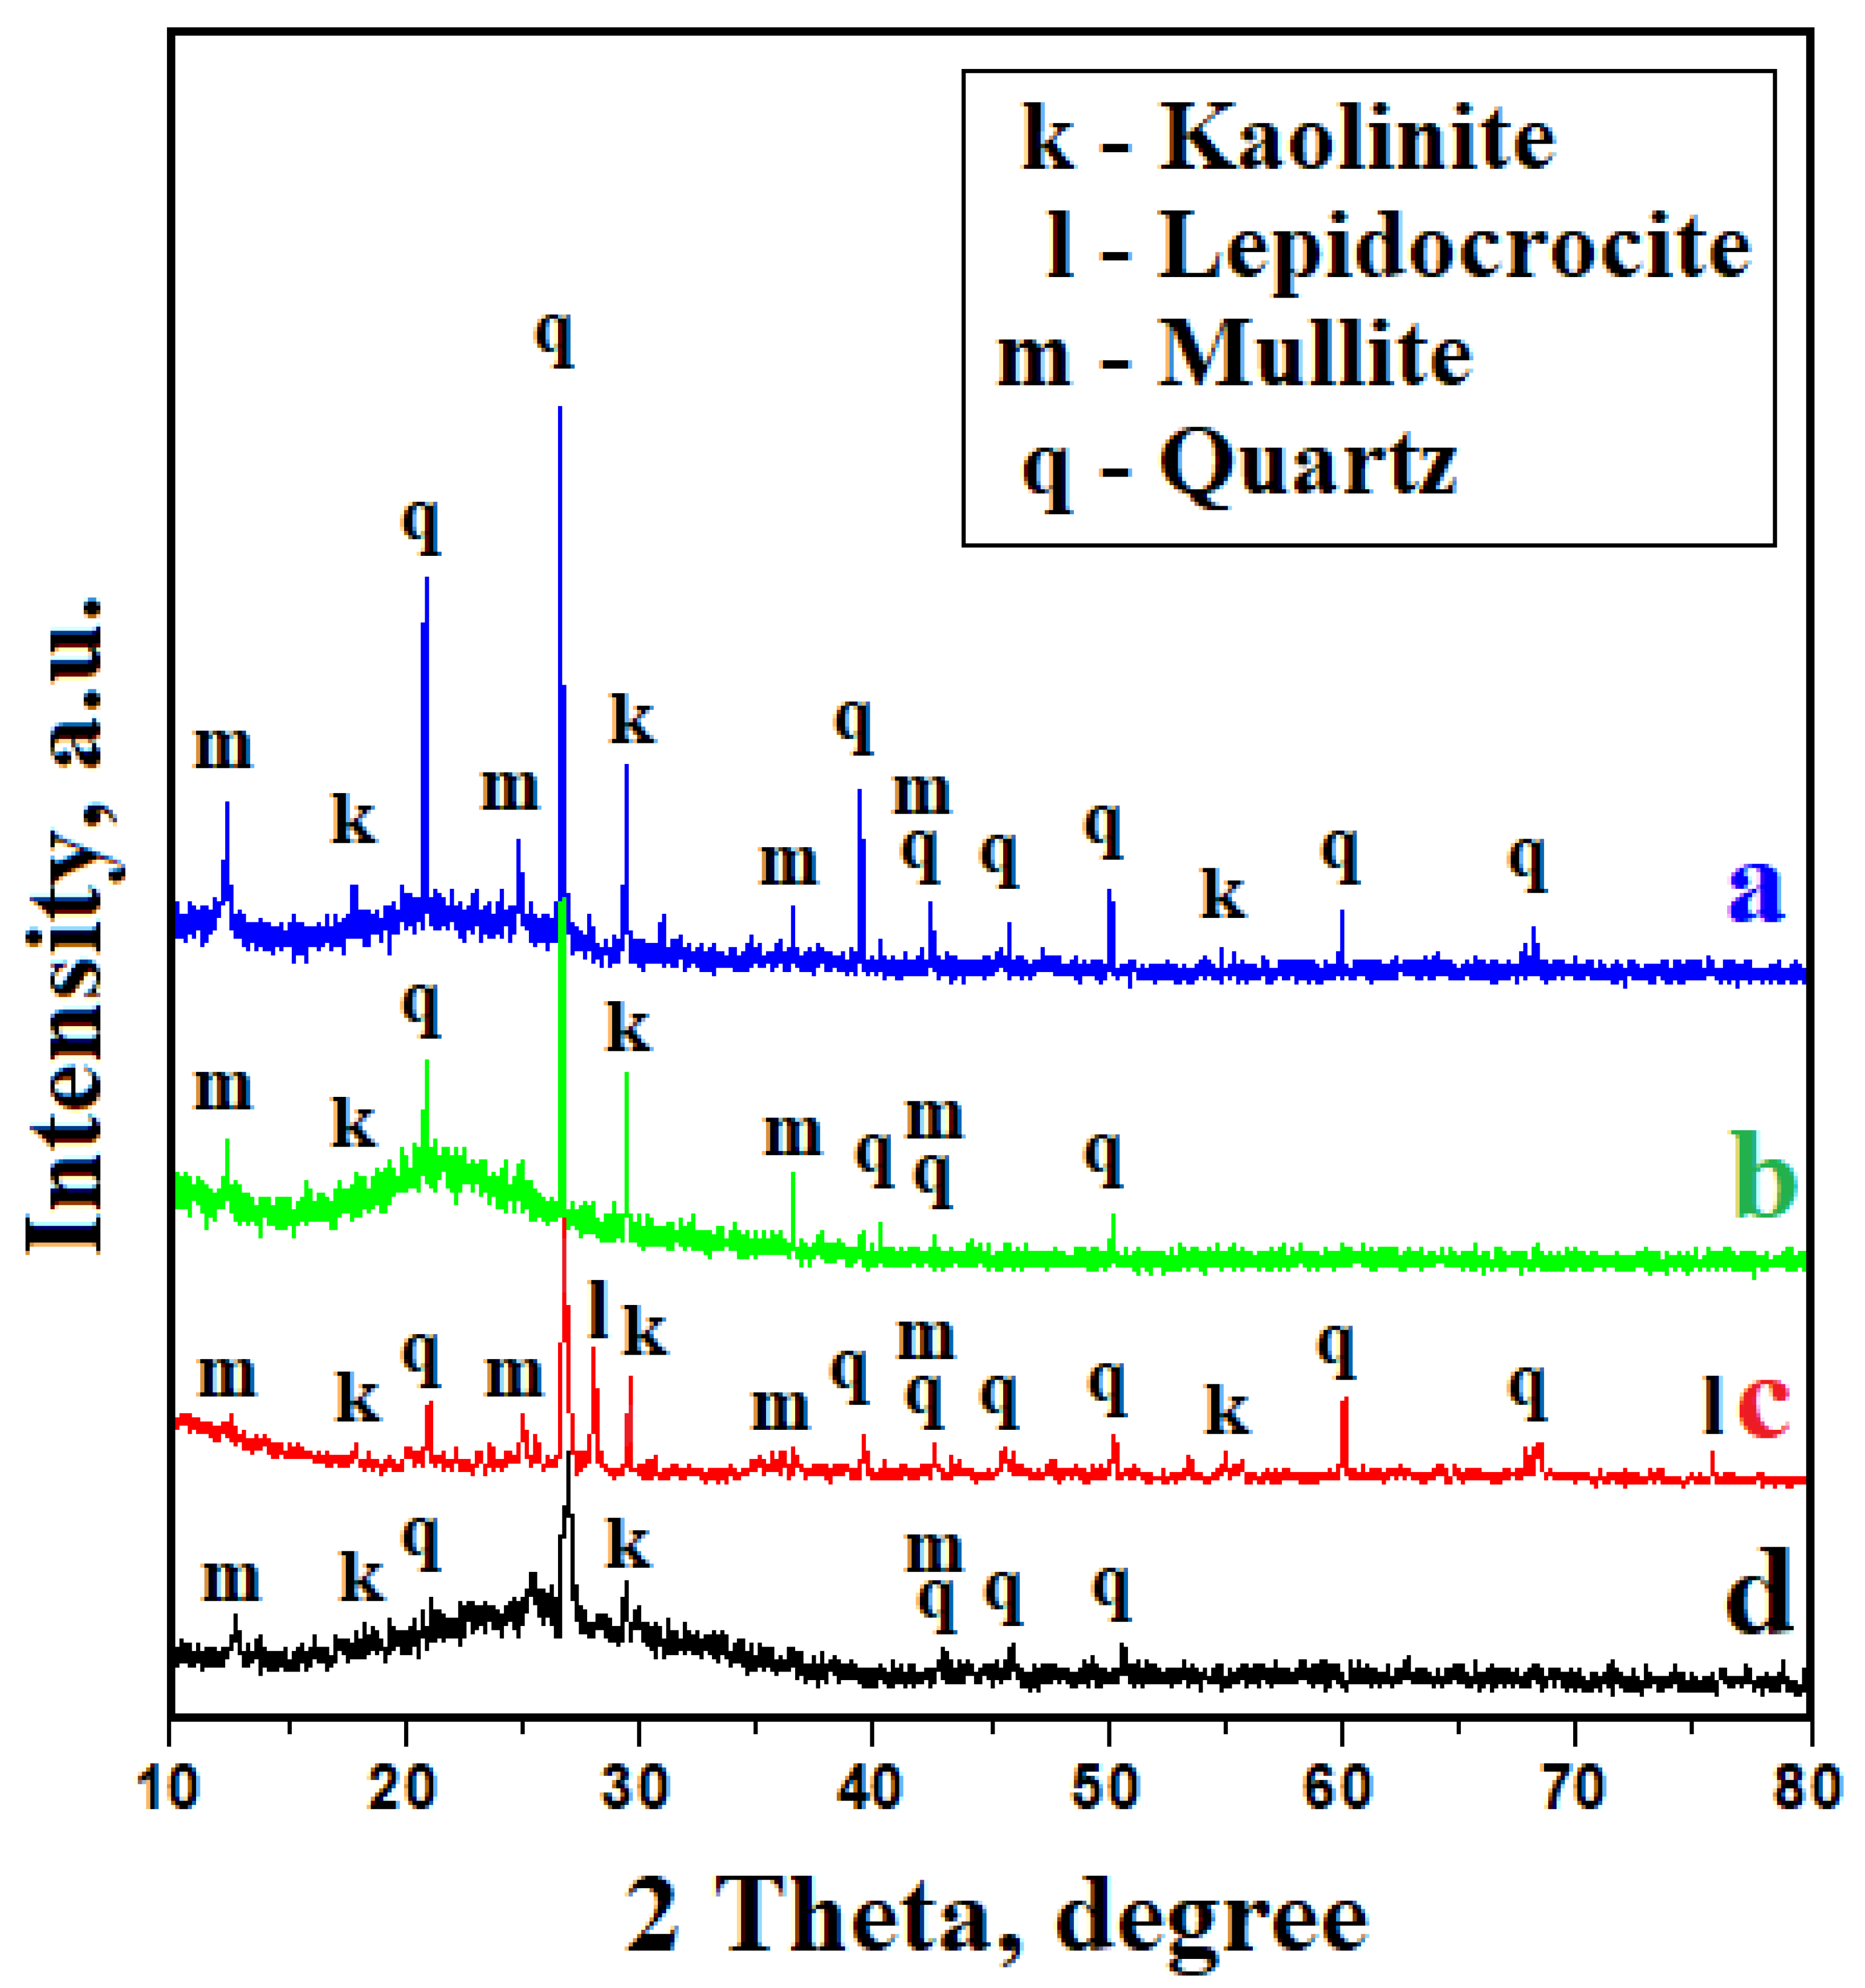
3.2. Mineral Constituents Assessment

The variation in the properties of the water samples indicates a strong dependence on mineral dispersions; this fact is supported by the XRD patterns found for the investigated sediments (see Figure 3). All the obtained patterns present with crystalline features but they have particularities depending on the sample.
The floor tile sediment (FTS) sample presents with an XRD pattern with narrow and very intense peaks, proving that the sample has high crystallinity (see Figure 3a). The tile floor water sediment contains quartz as a dominant mineral, which is followed by mullite and kaolinite. We note the heterogeneity in the kaolinite peaks: some of them are intense and narrow at 29.46 degrees; meanwhile, the peak at 17.92 is broadened and less intense. This means that the FTS sample contains some large kaolinite particles which are preferentially oriented; meanwhile, smaller fractions are randomly oriented. Applying the Scherrer formula on the broadened peak of kaolinite results in an average crystallite size of 41 nm.
The wall tile sediment (WTS) sample, shown in Figure 3b, has an XRD pattern with narrow and intense peaks, which are related to the high crystallinity of the sample; but the patterns also show wide baseline noise, which is related to the presence of very small particles. This fact is in good agreement with the increased values of the turbidity, which is related to the dispersion of the finest particles. The composition is dominated by quartz and kaolinite, with only some mullite. Some of the kaolinite peaks in the WTS sample are broadened (e.g., for example to 15.62 degrees) due to the presence of ultrafine particles. Their average size, calculated with the Scherrer formula, is about 39 nm.
The pressed slurry sample (PS) has increased crystallinity, as evidenced by the XRD pattern shown in Figure 3c; here, we can see well-developed diffraction peaks with a narrow allure. This result shows that quartz is the dominant mineral, followed closely by kaolinite and mullite. Both forms of kaolinite particles—large and small—are observed according to the height and full width at half maximum (FWHM) of the relevant peaks. A great discovery is the presence of lepidocrocite. It is an iron hydroxide γ-FeO(OH) crystallized in the orthorhombic system. It has been widely reported as component of environmental particulate matter samples [18,19].
The sediment collected from the filtered water (after the treatment facility) presents with an XRD pattern with a profound nanocrystalline characteristic (see Figure 3d); this is due to the amorphous baseline of the pattern and due to the presence of less intense and more broadened diffraction peaks of quartz, kaolinite, and mullite. The Scherer formula was applied to the most relevant peaks; as a consequence, we derive results showing an average crystallite of 35 nm for kaolinite, 75 nm for mullite, and 85 nm for quartz.
The weight amount of each mineral fraction in the samples was evaluated by the RIR (reference intensity ratio) method. This method assumes that, if there are two phases in the sample, then we have Equation (1):
I a I b = x a x b f a f b .
where Ia is the intensity for the most intense diffraction peak from phase a; Ib is the intensity for the most intense diffraction peak from phase b; xa and xb are the mass percentage concentrations for the two phases; fa and fb are the Corundum factors for the a and b phases.
If a third mineral fraction occurs, noted with c, then the relation can be written as follows:
I a I c = x a x c f a f c .
Considering that
x a + x b + x c = 100 % ,
Thus, the mass concentrations of the three phases in the samples can be determined. The results of the phase analysis performed by this method are presented in Table 1.
Mineralogical optical microscopy, shown in Figure 4, evidences the mineral particles within the sediment samples. Each of the identified minerals has its own nuanced color: quartz—green-gray; kaolinite—predominantly white; mullite—brownish-red; glass particles have dark nuance due to the lack of crystallinity.
The floor tile sediment is dominated by large mullite and quartz particles, surrounded by fine particles (see Figure 4a). Larger kaolinite particles are seen to have a polyhedral aspect with a tabular shape and sizes between 30 and 100 µm; the finest fractions appear as small white dots with sizes below 30 µm (see Figure 4a′). It results are in good agreement with the XRD observations. The high-magnification image shown in Figure 4a′ reveals the presence of small fractions of mullite (red, dotted particles). The particles size ranges measured from the MOM images are summarized in Table 1, along with their corresponding XRD results.
The WTS sample is more refined due to the atomization process that develops during the preparation of the raw materials; consequently, it contains less mullite. Thus, the bigger particle class is dominated by quartz (see Figure 4b). Fine kaolinite particles overwhelm the bigger ones (which do not exceed size of 30 µm) and surround the bigger particles of the WTS sample, giving a heterogeneous aspect. This is in correspondence with the aspect of the XRD pattern which showed the presence of fine particles in the sediment composition. The refinement of the particles is better evidenced in the higher-magnification image shown in Figure 4b′, because of the atomization process. All the finest fractions have a deeply milled aspect and small sizes; the values of these are shown in Table 1.
All the dispersed particles within FTS and WTS were collected into the pressed slurry through the filtration process. Therefore, PS has a dense aspect under MOM observation, with larger particles of quartz and mullite that are strongly bonded onto the finer Kaolinite particle matrix. The kaolinite matrix is so dense that it has a yellow shade instead of bright white (see Figure 4c). However, the high-magnification images in Figure 4c′ clearly evidence some bigger kaolinite particles with a bright-white nuance. The lepidocrocite presence (reddish-brown nuance) in the FS sample is one of the most important MOM findings in this sample, and is in good agreement with the XRD observations shown in Figure 3c.
The sediment from the filtered water (FWS) contained only finer particles, which were equivalent to atmospheric PM 1, PM 2.5, and PM 10 (see Figure 4d). The higher-magnification images in Figure 4d′ allow a better view of the few fine quartz and mullite particles, surrounded by ultrafine kaolinite fractions.

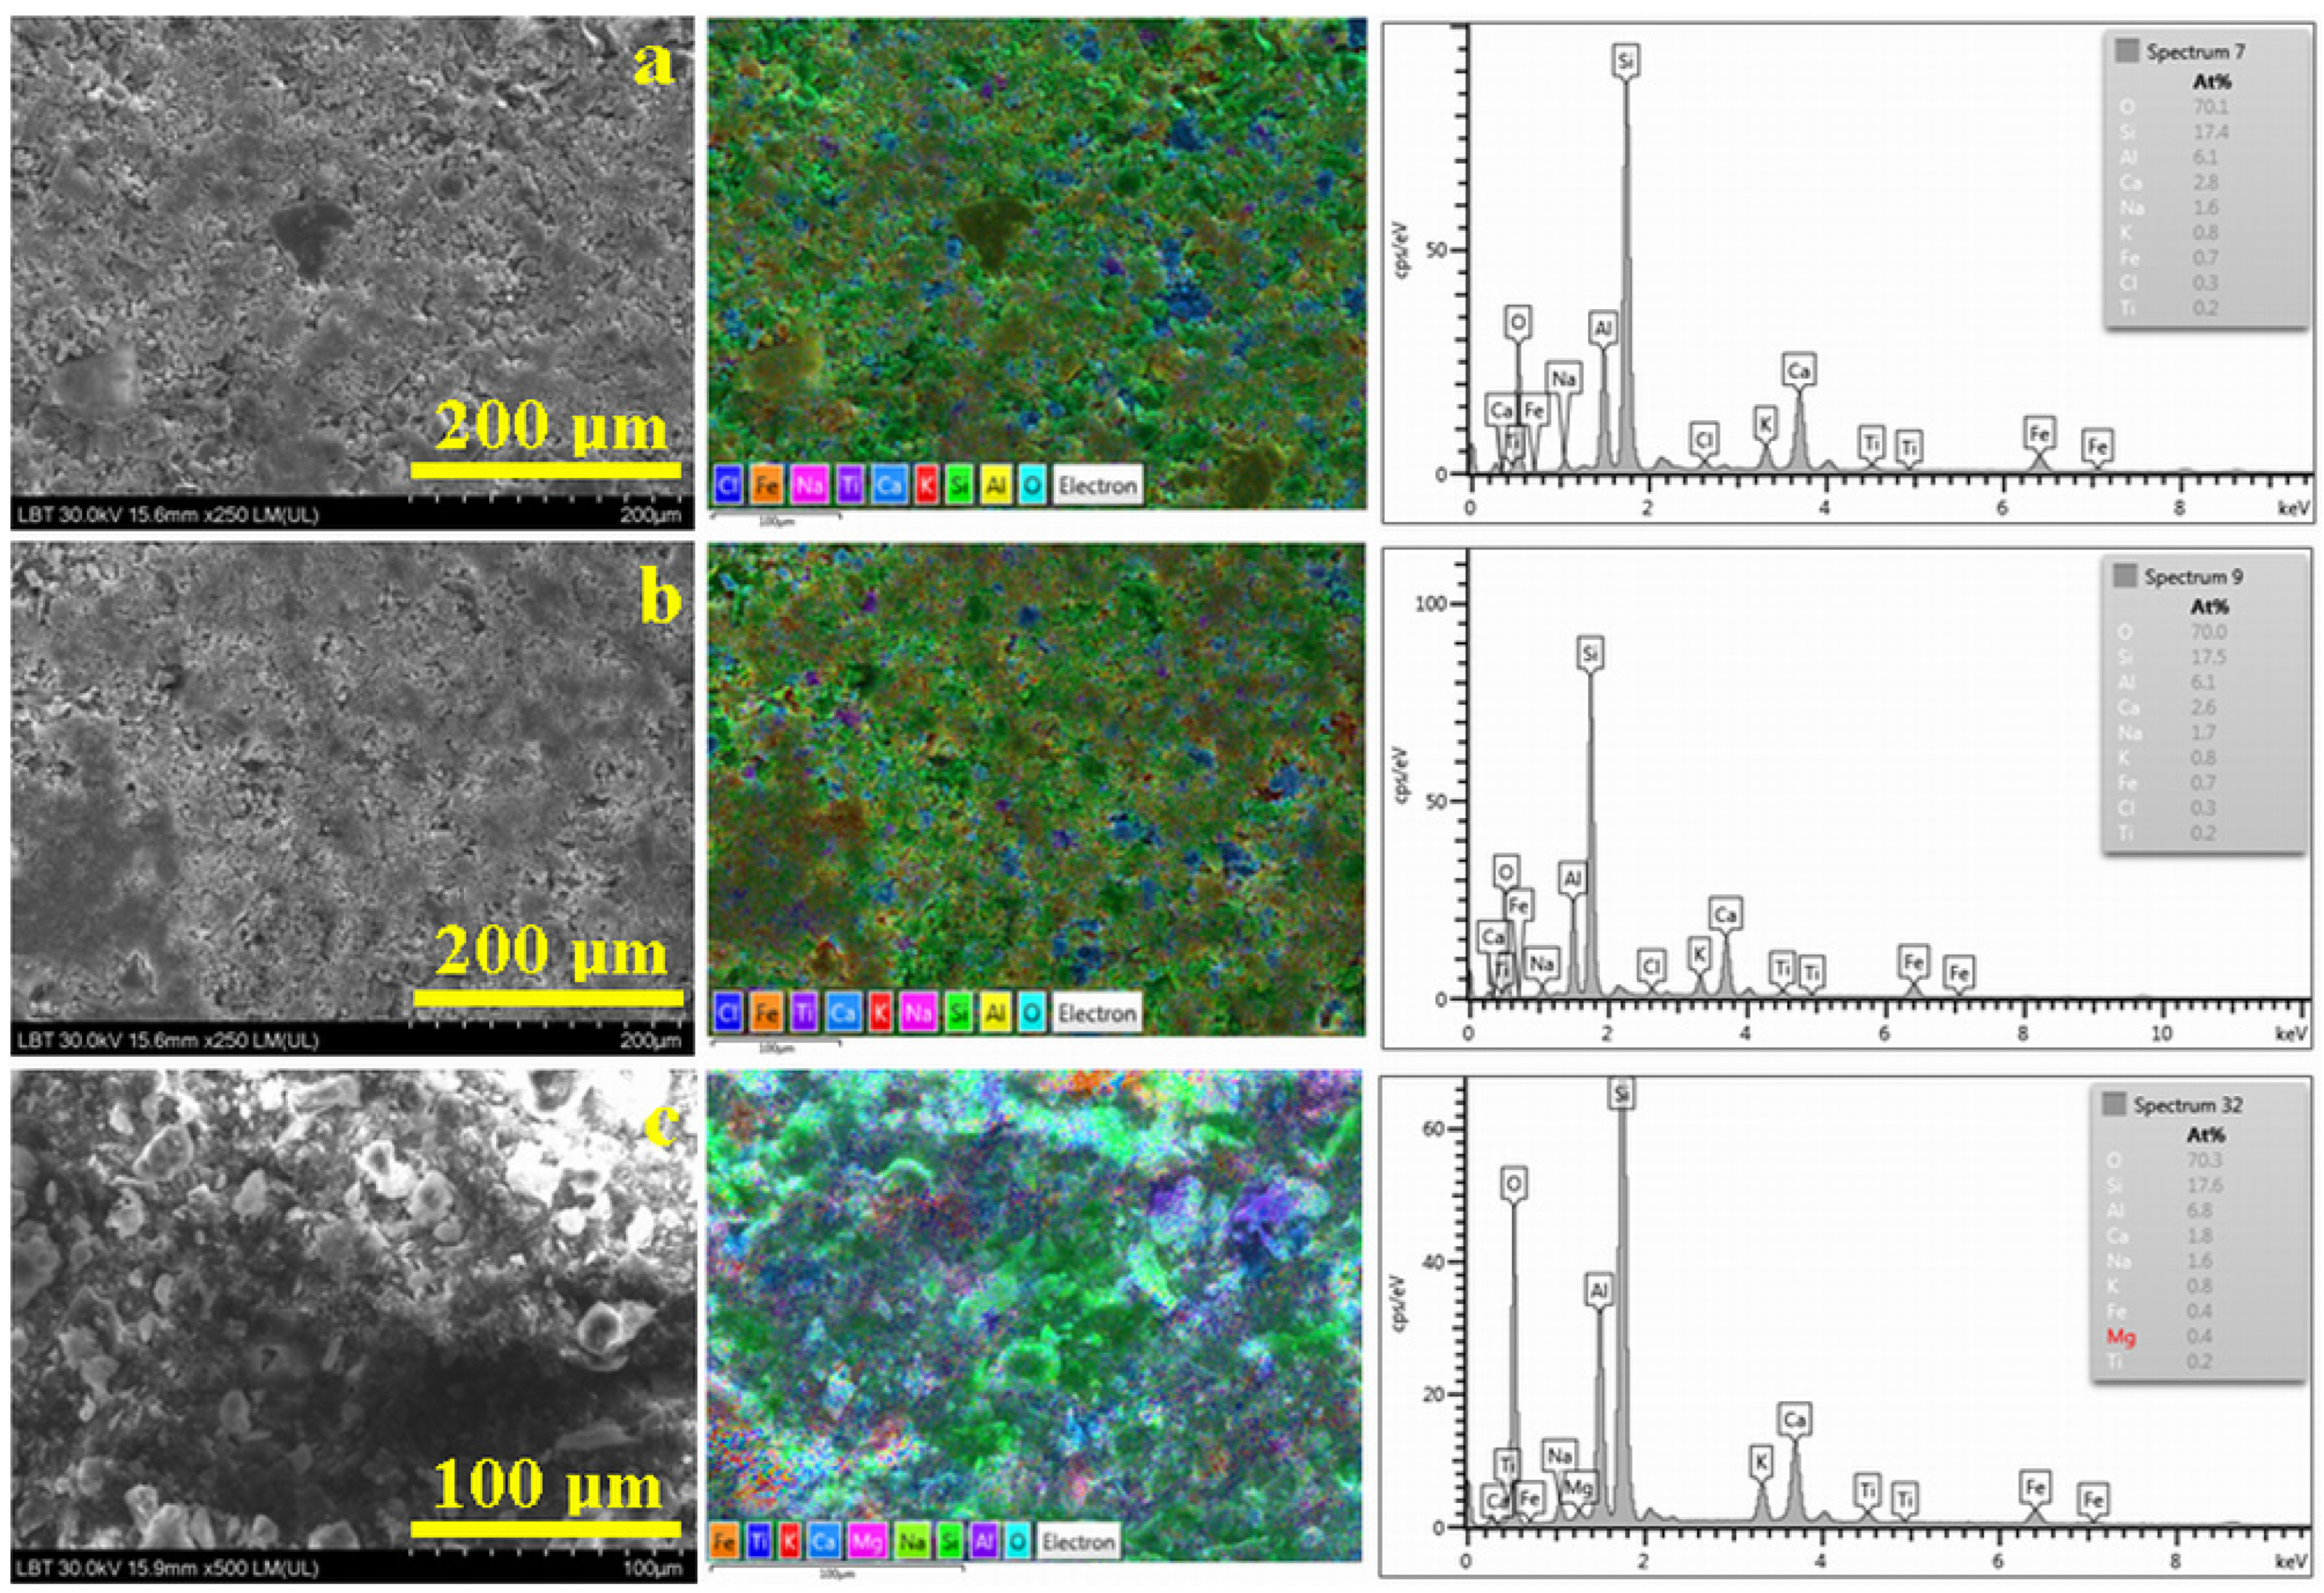
3.3. Microstructural Observation and Elemental Spectroscopy

The sediment sample microstructures were investigated with high-resolution scanning electron microscopy imaging; a corresponding elements distribution map was made for each investigated site, along with the EDS spectrum (see Figure 5).
The SEM backscattered electron image (BSE) derived for the floor tile sample (Figure 5a) reveals a view that is complementary to the MOM image in Figure 4a. The corresponding elemental distribution map and the EDX spectrum are presented beside the EDS map. Oxygen is the dominant element due to the oxide nature of the mineral compounds within the sample; this is followed by Si, which is found in all involved minerals (see Table 2). The aluminum amount of 6.1 at. % belongs to both the kaolinite Al2Si2O5(OH)4 and the mullite Al6Si2O13.
Glass is an amorphous material, described by the following chemical formula: 6SiO2‧CaO‧Na2O. Thus, the amounts of Ca and Na found in the elemental composition can be explained by the glass particles. On the other hand, the amount found of Na might be a trace influence from the water’s total dissolved solids and salts. This fact is supported by the pink spots that are randomly spread out on the elemental maps (not only on the glass particles) shown in Figure 5a,b; additionally, see the pale-green spots on the map in Figure 5c.
However, the data in the literature specify that glass might contain traces of Cl, which becomes more evident when one looks at recycled glass [20,21]. The other elements that were found, such as K, Fe, and Ti, are present in low amounts, which indicates their occurrence as natural traces from the used raw materials; the data in the literature show that clays might contain these elements [22,23]. Otherwise, it might be a mild contamination from the metallic parts of the devices in the technological flux. The correlation between the morphological aspect in the BSE image and the elemental map clearly evidences that quartz particles with rounded corners are present, with a size range of 5–80 μm; these have an intense green color. Additionally, mullite is present, with a light-green nuance (caused by the traces of K, Fe, and Ti), and is surrounded by fine fractions of kaolinite; these are situated between 1 and 10 μm and are also colored with a light-green nuance. The glass particles have a blue nuance due to the presence of Ca and Na with the chloride traces. Their shapes are irregular because they were broken during the technological process.
The SEM–BSE images obtained for the wall tile sediment (see Figure 5b) provide evidence for smaller particle sizes compared to those from the floor tile sediment, but the elemental compositions and distribution maps for the two are similar. Thus, the boulder-like particles with rounded corners around 5–45 μm belong to quartz; meanwhile, the mullite rounded shapes that are present have diameters of around 90 nm. They are surrounded by finer kaolinite particles with a size range of 1–30 μm. The glass particles are well distributed among the other constituents and have sizes of around 20–40 μm; this finding is in good agreement with the MOM investigation. Some minor differences were observed in the elemental map in Figure 5b: there are some brown segregations, which indicates that there are some kaolinite particles containing more Fe impurities than those observed for the floor tile sediment; some glass particles present with a violet nuance due to an increased presence of Na.
The SEM investigations of the solidified sludge samples (shown in Figure 5c) revealed the presence of well-defined particles ranging between 5 and 90 μm in size, with two typical morphologies: boulders with some blunted edges, related to quartz, and rounded boulders, related to mullite. These are surrounded by a compact mass corresponding to the kaolinite, which ensures the good cohesion of the microstructure due to its binding ability. Therefore, the fine kaolinite particles, ranging from 1 to 10 μm in size, are less visible in Figure 5c. The ceramic sludge elemental composition is dominated by 70.3% O; this is followed by 17.6% Si and 6.8% Al. These belong to the quartz, kaolinite, and mullite. Moderate amounts of 1.8% Ca and 0.8% K are related to the presence of the glass particles; these are in good agreement with the elemental compositions of the FTS and WTS sediments, but are significantly lower. The sludge accumulation from many different ceramic tiles charges explains this variation. The iron amount of 0.4% is related to the presence of lepidocrocite particles, confirming the XRD results. The elemental map within Figure 5c shows the quartz particles in bright green; this is due to the presence of O and Si; additionally, mullite particles have a violet shade due to their Al content. The kaolinite binding effect is proven in the elemental map by the formation of violet “clouds”, which are caused by the fine distribution of Al atoms within the kaolinite particles. The lepidocrocite particles appear to be colored with an orange nuance, with some turquoise dots due to the presence of iron and oxygen. The disposal mode indicates that iron hydroxide crystallizes during the relative water evaporation from sludge over the deposit dump. This fact is supported by their small sizes of about 15–20 μm and confirms the data in the literature [16,17].

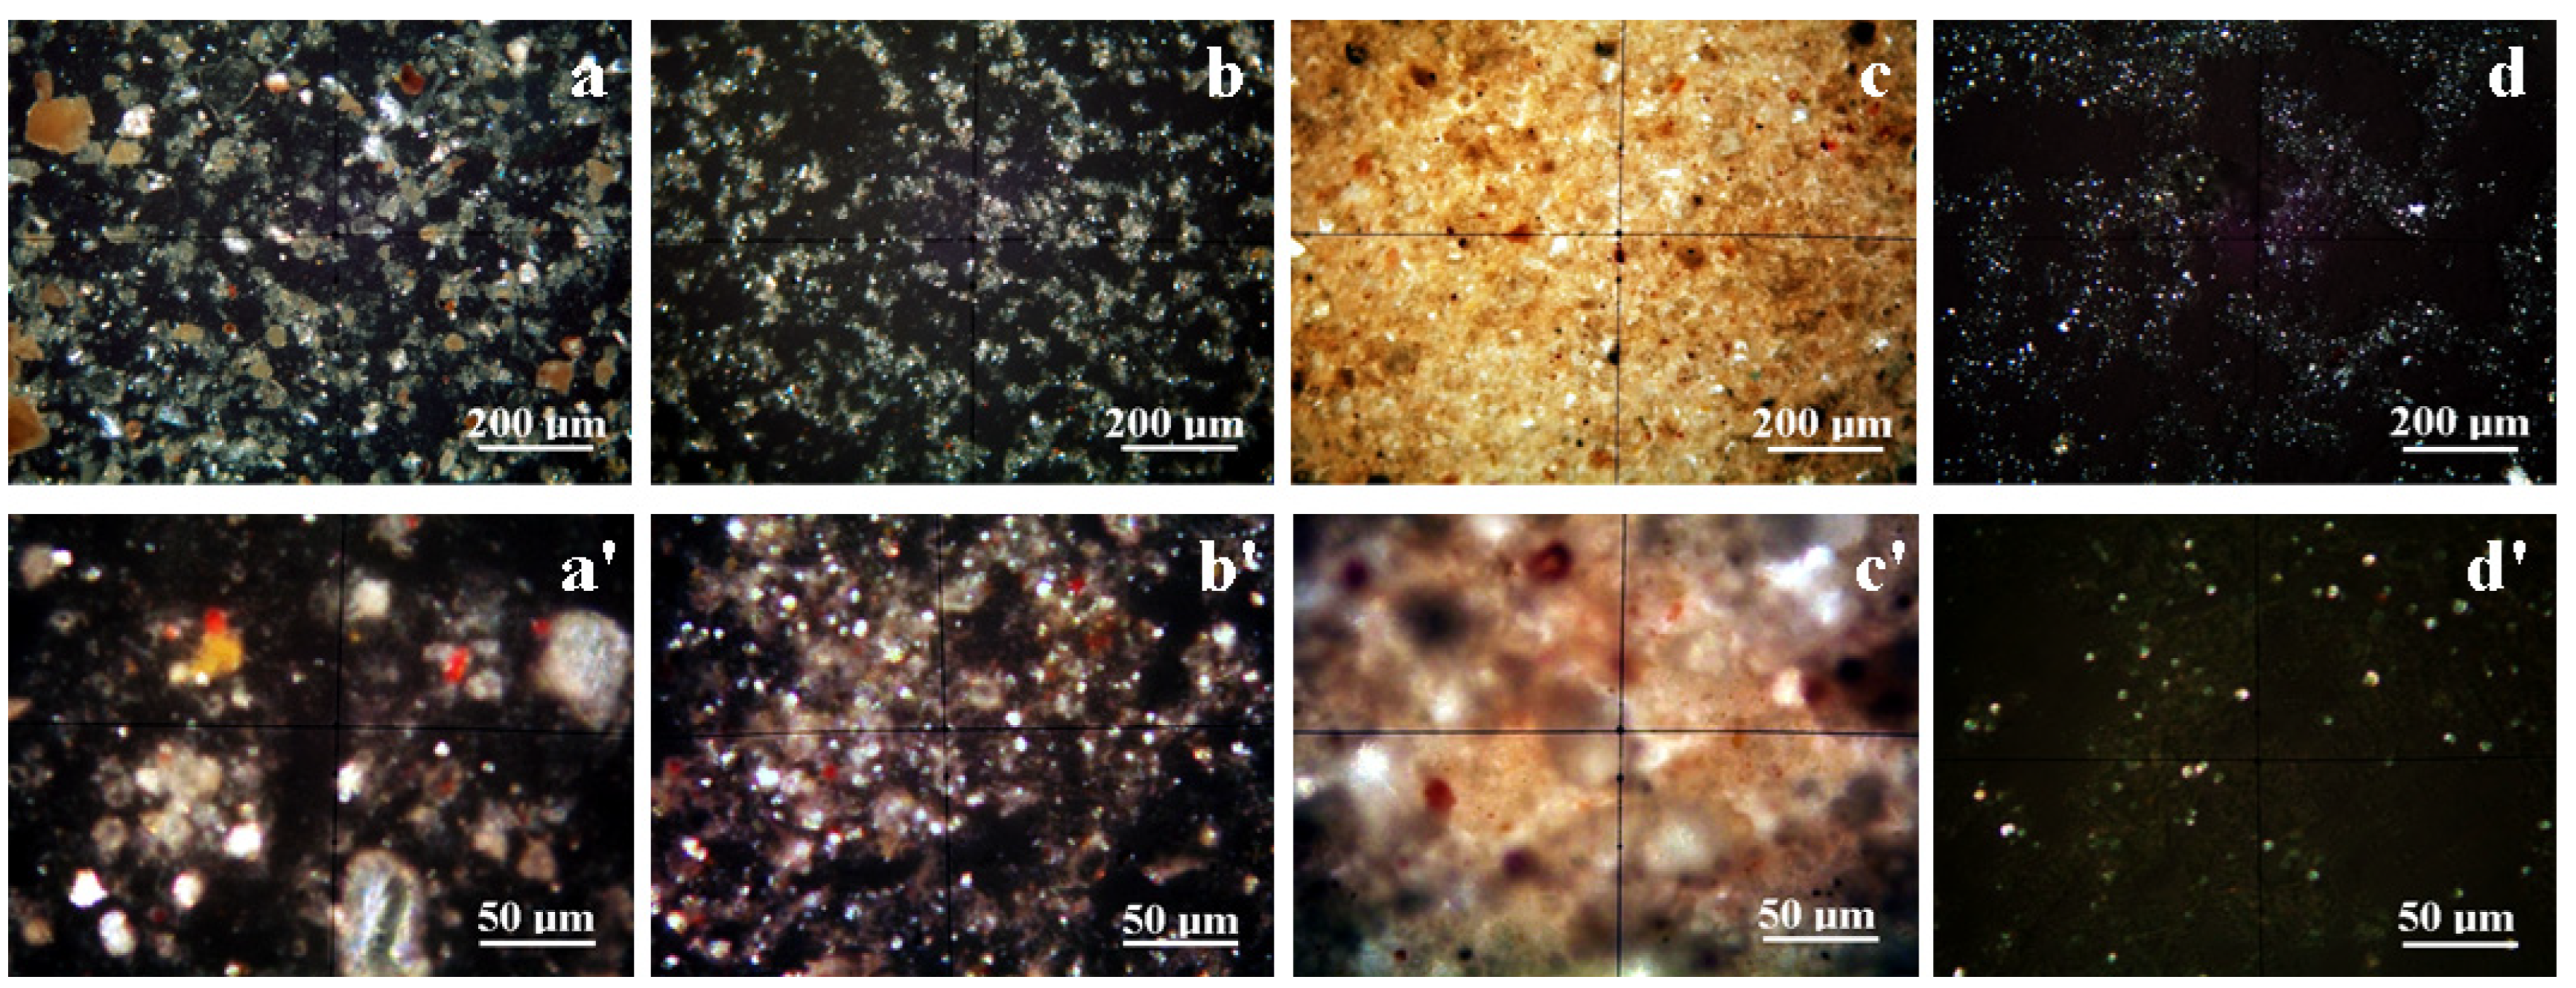
3.4. Ultra-Structure Observation

The samples’ ultra-structures are formed by the submicron and nanodomains, requiring high-magnification, high-resolution imaging. Therefore, the ultra-structural aspects were investigated by atomic force microscopy (AFM). This approach presents the benefit of topographical investigation in addition to the simple visualization of the finest details.
The self-assembly of the FTS sample on the glass substrate generates a thin film of submicron particles with boulder shapes (see Figure 6a), ranging from 250 to 800 nm; these mostly belong to the quartz and mullite fine fractions. The upper-left section of Figure 6a reveals the end of a bigger kaolinite particle, evidencing parallel layers. The topographical arrangements of the particles lead to a local height of 425 nm, enabling the uniformity of the thin film. All submicron features are covered with kaolinite nanoplatelets, ensuring the base of the microstructural cohesion within the FTS sample.
Similar disposal of the boulder submicron particles is observed for the WTS sample, shown in Figure 6b, but the kaolinite nanoparticles are more numerous and lead to a more compact, uniform topography. This fact is supported by the local height of 231 nm.
The PS sample collects particles from FTS and WTS during the pressing filtration process. This technological process does not allow for the self-assembly of the particles to occur, but it forces the kaolinite nanoplatelets to exert a supplementary binding of the quartz and mullite submicron particles; this generates a compact, fine microstructure, as depicted in Figure 6c. The rough intercalation of the boulder-shaped submicron particles into the compact arrangements leads to an increased local height of 541 nm. After pressing filtration, water is completely free of submicron particles, but it features several nanoparticles that are self-assembled on a very thin film (see Figure 6d). There are two main kinds of nano-structural features: some bigger nanoparticles randomly spread out, with significant distances between them, surrounded by fine ones. These arrangements require further investigation.
The nano-structural aspect was observed with a scanned area of 1 µm2, revealing the organization of kaolinite nanoplatelets. The FTS sample presents a significant amount of kaolinite nanoplatelets, which are adsorbed randomly onto the surface of the submicron particles (see Figure 6e). Their average size is about 60 nm; this is in good agreement with the crystallite size calculated by the Scherrer formula from the XRD pattern. The local height of the nano-arrangements is 220 nm, as observed in the three-dimensional profiles. The WTS sample features a denser adsorption of kaolinite nanoplatelets onto the submicron particle surface (see Figure 6f). The nanoplatelet size is about 40 nm and is disposed in parallel rows, ensuring the optimal and compact binding of the self-assembled thin film. This fact is also illustrated by the low local height of about 159 nm.
The pressed slurry nanostructure provide evidence for the presence of kaolinite nanoplatelets in the range of 40–60 nm; these are very well attached onto the small submicron particles, ensuring a dense formation (see Figure 6g). The borders of the nanoplatelets are more visible on the three-dimensional profile than they are on the topographic image, due to the spatial view. The compact nano-structuring of the pressed slurry leads to a local height of about 202 nm. Finally, the FWS topography in Figure 6h reveals a high-magnification view of the nanoparticles that are left in the water after filtration. The bigger particles have sizes of about 80–90 nm; this corroborates the XRD observations for mullite and quartz. These are surrounded by the finest nanoparticles, measuring about 40 nm, corresponding to the kaolinite crystallites.

4. Discussion

Used industrial water is a cause of great environmental concern due to the high associated pollution risk. The neutralization of this water requires complex physicochemical processes before the water can be released into the public water system [24,25]. Data in the literature shows that the used water from the ceramic industry is more affected by the mineral particle dispersions that are derived from raw materials and the additives used; the water is not affected by the contamination caused by organic compounds [26,27].
Our findings show that both the floor and wall tiles contain the same minerals as raw materials: quartz and kaolinite mixed up with mullite particles, originating from the recirculation of the broken fired biscuits. The main differences consist in the particle size range, which is partly coarse for the floor tile and very fine for the wall tile. The kaolinite/quartz ratio is also greater in the wall tile mixture than in the floor tile mixture. Therefore, the resulting used water from each has different physicochemical properties (see Figure 2). FTUW has fewer dissolved solids and lower salinity; these features are associated with a coarse particle distribution, implying a relatively lower electrical conductivity (increased electrical resistivity). This is reflected in the alkaline pH and the average turbidity. On the other hand, WTUW has a significant amount of dissolved solids and increased salinity, facilitating electrical conductivity (and low electrical resistivity).
As observed, the pH values are strongly influenced by the total dissolved solids in the used water. We found unusual sodium traces in both FTS and WTS, that were related mainly to the presence of glass particles. But the EDS maps clearly show some Na spots outside of the glass particles. Consequently, these Na traces are related to the dissolved salts in the water. The data in the literature reveal that sodium ions induce an alkaline pH that keeps fine kaolinite particles suspended for long periods of time [28,29]. Consequently, the high amount of dispersed fine particles is conducive to higher turbidity values. The sedimentation process is merely influenced by the dispersion of the finest particles; thus, the process takes longer, as was observed for the WTUW sample after 30 days (see Figure 2f).
The detailed ultra-structural observation shows that the filtration process eliminates all coarse particles and most of the fine fractions from the used water. Consequently, the filtered water (FW) is clear, with no turbidity after 30 days and a slightly reduced pH value. On the other hand, the pressed slurry (PS) is a complex mixture of coarse particles, containing quartz and mullite mixed up with fine fractions of kaolinite. The filtration process is optimally described by Equation (4):
F T U W ( l ) + W T U W ( l ) f i l t r a t i o n P S ( S ) + F W ( l )
The FW sample is collected into the recirculation tank, where the FWS particles can become a sediment on the bottom of the tank, and the water is able to be recirculated in the technological process. This step is appropriate and in accordance with the concept of a circular economy [30]; moreover, it certainly reduces the neutralization costs and increases the efficiency of ceramic tiles production facilities regarding used water [31].
Lepidocrocite is one of the most important discoveries regarding pressed slurry. It did not appear in the used water sediments or in the filtered water sediments. Iron’s fuzzy elemental distribution in the PS sample is related to the kaolinite particles. The literature mentions the occasional contamination of kaolinite with iron oxides [16,17], but our findings show that the raw kaolinite used here did not contain iron traces. The intense use of the water for the cleaning of the metallic molds leads to the removal of mineral particles; also, it might dissolve iron hydroxides from some rusted parts. Thus, the lepidocrocite (α FeOOH) is crystallized from the remnant liquid during the pressing procedure; this is in agreement with the data in the literature [9,32]. Its presence in the PS sample leads to its inability to be recirculated as raw material because of the glaze-staining risk [13,16]; this transforms the pressed slurry into a problematic waste as related to the production of ceramic tile; thus, it is supposed to be dumped [13,16]. It cannot be used for ceramic tile production, similarly to the red mud that results from the alumina Bayer process, because of the glaze requirement [33,34].
Lepidocrocite recrystallization, during the pressing process, might occur with increases in slurry concentration along with the water removal; on the other hand, the literature shows that iron hydroxides have a solubility of about 1 × 10⁻⁹ mol/L; this is independent of the pH value [35]. This suggests that small lepidocrocite nanoparticles, randomly dispersed in the used water, are kept trapped in the pressed slurry; here, they coalesces with each other, forming submicron clusters; this fact is supported by the EDS elemental distribution map shown in Figure 5c. We wonder whether a selective magnetic separation of these lepidocrocite clusters would be effective for their removal, enabling the further reutilization of the pressed slurry as a recirculated material in the main technological process. Some of the data in the literature indicate that the liquid magnetic separation of the iron hydroxide fine microscopic particles is possible [19,36]. Thus, water treatment could be improved with the intercalation of a magnetic selector at the pretreatment station. This is a challenge for future developments in the ceramic industry and the way in which used water is treated.
Our findings prove that both FTUW and WTUW samples contain significant amounts of kaolinite nanoplatelets; these strongly bind with the surrounding submicron and micro particles. The binding effect of those nanoplatelets is enhanced by the pressing process; this proves that the pressed slurry might be useful material for applications in which an amount of 8% wt. lepidocrocite does not affect the utilization. Some of our preliminary studies proved that the compressive strength of the pressed slurry can be increased by a proper compaction of the microstructure [37]. The study must be continued, and an investigation of the effect of the conditioning of the kaolinite matrix on the flexural strength of the pressed samples would be valuable. There are two prospective development pathways regarding the production of ecological bricks by low-temperature firing or geopolymer development; this is because of the high amount of alkaline fine particles [38,39] and the blending of pressed slurry, with an ecological stabilizing agent that can be used to promote spatial reticulation within the mineral structure [40] to achieve plaster for ecological buildings.

5. Conclusions

The obtained results were discussed in relation to the data in the literature; these discussions allow us to draw several important conclusions. These may be valuable for practitioners in ceramic research and industry.
  • Both FTS and WTS sediments contain quartz, mullite, and kaolinite; FTS is slightly rich in mullite and WTS is rich in kaolinite. Traces of Fe were found in the FTS and WTS sediments, but there was no proof of crystallization.
  • The efficacy of the filtering system was proven on the basis of the targeted particulate matters; these ensure the recirculation of water into technological processes. The sludge that is obtained after the filtration process presents with a dense grainy structure of sediment particles. These contain quartz, mullite, and kaolinite, along with traces of iron hydroxide crystallized as lepidocrocite.
  • The pressed slurry cannot be reused in the technological flux because of the presence of iron hydroxide, which causes glaze staining; however, the observed microstructure, along with the mineralogical composition, indicates that it could be used for other applications, like ecological bricks or plasters. These potential applications will be investigated further.
  • The liquid magnetic selective removal of the observed lepidocrocite clusters could offer a significant improvement in the process of used water pretreatment; this will allow the direct recirculation of pressed slurry into the main technological process.

Author Contributions

Conceptualization, S.E.A. and I.P.; methodology, S.E.A. and I.P.; software, G.B.; validation, S.E.A. and I.P.; formal analysis, B.V.B.; investigation, S.E.A., L.B.T., G.B., B.V.B. and I.P.; resources, S.E.A. and B.V.B.; data curation, I.P.; writing—original draft preparation, S.E.A. and I.P.; writing—review and editing, I.P.; visualization, L.B.T. and I.P.; supervision, S.E.A. and I.P.; project administration, S.E.A. and I.P. All authors have read and agreed to the published version of the manuscript.

Funding

The XRD diffractometer maintenance which was supported by the Ministry of Research, Innovation, and Digitization through Program 1-Development of the National Research and Development System, Subprogram 1.2-Institutional Performance-Funding Projects for Excellence in RDI, Contract No. 37PFE/30.12.2021.

Data Availability Statement

Data are available on request from the corresponding author.

Conflicts of Interest

The authors declare no conflicts of interest.

References

  1. Vieira, A.V.; Rosso, L.S.; Demarch, A.; Pasini, P.; Ruzza, S.P.; Arcaro, S.; Ribeiro, M.J.; Angioletto, E. Life cycle assessment in the ceramic tile industry: A review. J. Mater. Res. Technol. 2023, 23, 3904–3915. [Google Scholar] [CrossRef]
  2. Manikandan, K.P.; Nanthakumar, P.; Balachandar, M.; Gowri Shankar, D.; Vijayakumari, G. Partial replacement of aggregate with ceramic tile in concrete. Mater. Today Proc. 2023, in press. [Google Scholar] [CrossRef]
  3. Zanelli, C.; Conte, S.; Molinari, C.; Soldati, R.; Dondi, M. Waste recycling in ceramic tiles: A technological outlook. Resour. Conserv. Recycl. 2012, 168, 105289. [Google Scholar] [CrossRef]
  4. Ziman, N. Contributions on Wall Tiles Technology with Implications in the Quality and Prices. Ph.D. Thesis, Romanian, University “Politehnica” of Timisoara, Timisoara, Romania, 2006. [Google Scholar]
  5. Baricza, A.; Bajnóczi, B.; Máté, S.; Tóth, M.; Bendő, Z.; Szabo, C. Deterioration of glazed architectural ceramics due to environmental factors: A comparative study of two buildings in Budapest. Carpathian J. Earth Environ. Sci. 2016, 11, 449–462. [Google Scholar]
  6. Balint, R.; Calotescu, L.G.; Boero, V.; Ajmone-Marsan, F. Clay minerals-clinoptilolite assemblages in two romanian tuffs. Carpathian J. Earth Environ. Sci. 2015, 10, 27–39. [Google Scholar]
  7. Ilyina, V.; Klimovskaya, E.; Bubnova, T. Ceramic Materials Based on Clay and Soapstone Waste: Thermo-Mechanical Properties and Application. Minerals 2023, 13, 1376. [Google Scholar] [CrossRef]
  8. Hosu Prack, G.A.; Petean, I.; Arghir, G.; Bobos, L.D.; Tomoaia-Cotisel, M. Nano-scale particulate matters found in urban street dust in Cluj–Napoca, Romania. Carpathian J. Earth Environ. Sci. 2016, 11, 539–546. [Google Scholar]
  9. Avram, S.E.; Filip, M.R.; Barbu Tudoran, L.; Borodi, G.; Petean, I. Investigation of ferrous conglomerate particles found in carwashslurry and their environmental implications. Stud. UBB Chem. 2023, 68, 57–70. [Google Scholar] [CrossRef]
  10. Rus, L.; Avram, S.E.; Micle, V. Determination and assessments of physicochemical parameters of the water from anthropo-saline lakes located in the protected area “Salina Turda”, Romania. Stud. UBB Chem. 2020, 65, 257–268. [Google Scholar] [CrossRef]
  11. Avram, S.E.; Rus, L.; Micle, V.; Hola, S.S. Evaluation and Evolution of the Physico-Chemical Parameters of Ocnei and Rotund Lakes Located near the “Salina Turda” Mine, Romania. Water 2022, 14, 2366. [Google Scholar] [CrossRef]
  12. Mohd, H.I.; Mohd, I.M.; Anis, N.I.; Syarifah, A.I.; Nabihah, O. Development of porous glass-ceramic using silica sand for wall tiles application. Mater. Today Proc. 2023, in press. [Google Scholar] [CrossRef]
  13. Mourou, C.; Zamorano, M.; Ruiz, D.P.; Martín-Morales, M. Characterization of ceramic tiles coated with recycled waste glass particles to be used for cool roof applications. Constr. Build. Mater. 2023, 398, 132489. [Google Scholar] [CrossRef]
  14. Alves, C.L.; Skorych, V.; De Noni, A.; Hotza, D.; Gómez González, S.Y.; Heinrich, S.; Dosta, M. Improving the sustainability of porcelain tile manufacture by flowsheet simulation. Ceram. Int. 2023, 49, 24581–24597. [Google Scholar] [CrossRef]
  15. Contini, G.; Peruzzini, M.; Bulgarelli, S.; Bosi, G. Developing key performance indicators for monitoring sustainability in the ceramic industry: The role of digitalization and industry 4.0 technologies. J. Clean. Prod. 2023, 414, 137664. [Google Scholar] [CrossRef]
  16. Wang, Y.; Yu, S.; Chu, J.; Chen, D.; Chen, J. Study on the copper and iron coexisted coloring glaze and the mechanism of the fambe. J. Eur. Ceram. Soc. 2018, 38, 3681–3688. [Google Scholar] [CrossRef]
  17. Gol, F.; Saritas, Z.G.; Cıbuk, S.; Ture, C.; Kacar, E.; Yilmaz, Y.; Arslan, M.; Sen, F. Coloring effect of iron oxide content on ceramic glazes and their comparison with the similar waste containing materials. Ceram. Int. 2022, 48, 2241–2249. [Google Scholar] [CrossRef]
  18. Muntean, D.F.; Ristoiu, D.; Arghir, G.; Campean, R.F.; Petean, I. Iron hydroxides occurrence in winter air particulate matters suspensions in Cluj–Napoca, Romania. Carpathian J. Earth Environ. Sci. 2012, 7, 175–182. [Google Scholar]
  19. Muntean, D.F.; Ivan, I.; Muresan, L. Environmental Implications Concerning the Chemical Composition and Particle Distribution of Anti–Skid Material. Stud. UBB Chem. 2015, 60, 207–218. [Google Scholar]
  20. Caulfield, J.T.; Tomlinson, E.L.; Chew, D.M.; Marks, M.A.V.; McKenna, C.A.; Ubide, T.; Smith, V.C. Microanalysis of Cl, Br and I in apatite, scapolite and silicate glass by LA-ICP-MS. Chem. Geol. 2020, 557, 119854. [Google Scholar] [CrossRef]
  21. Kim, J.M.; Kim, H.S. Glass-ceramic produced from a municipal waste incinerator fly ash with high Cl content. J. Eur. Ceram. Soc. 2004, 24, 2373–2382. [Google Scholar] [CrossRef]
  22. Ramaswamy, S.; Raghavan, P. Significance of Impurity Mineral Identification in the Value Addition of Kaolin—A Case Study with Reference to an Acidic Kaolin from India. J. Miner. Mater. Charact. Eng. 2011, 10, 1007–1025. [Google Scholar] [CrossRef]
  23. Segura, J.C.F.; Reyes Cruz, V.E.; Jesús Pérez Bueno, J.; Lozada Ascencio, E.M.; García, F.L. Characterization and electrochemical treatment of a kaolin. Appl. Clay Sci. 2017, 146, 264–269. [Google Scholar] [CrossRef]
  24. Wang, Y.; Shi, Y.; Xu, X.; Zhu, Y. A Study on the Efficiency of Green Technology Innovation in Listed Chinese Water Environment Treatment Companies. Water 2024, 16, 510. [Google Scholar] [CrossRef]
  25. Santos, A.B.d.; Giacobbo, A.; Rodrigues, M.A.S.; Bernardes, A.M. Electrodeionization for Wastewater Reuse in Petrochemical Plants. Water 2024, 16, 401. [Google Scholar] [CrossRef]
  26. Boschi, G.; Bonvicini, G.; Masi, G.; Bignozzi, M.C. Recycling insight into the ceramic tile manufacturing industry. Open Ceram. 2023, 16, 100471. [Google Scholar] [CrossRef]
  27. Ding, K.; Li, A.; Lv, J.; Gu, F. Decarbonizing ceramic industry: Technological routes and cost assessment. J. Clean. Prod. 2023, 419, 138278. [Google Scholar] [CrossRef]
  28. Rao, F.; Ramirez-Acosta, F.J.; Sanchez-Leija, R.J.; Song, S.; Lopez-Valdivieso, A. Stability of kaolinite dispersions in the presence of sodium and aluminum ions. Appl. Clay Sci. 2011, 51, 38–42. [Google Scholar] [CrossRef]
  29. Dwari, R.K.; Mishra, B.K. Evaluation of flocculation characteristics of kaolinite dispersion system using guar gum: A green flocculant. Int. J. Min. Sci. Technol. 2019, 29, 745–755. [Google Scholar] [CrossRef]
  30. Markowski, Ł.; Kotliński, K.; Ostrowska, A. Sustainable Consumption and Production in the European Union—An Attempt to Assess Changes and Convergence from the Perspective of Central and Eastern European Countries. Sustainability 2023, 15, 16485. [Google Scholar] [CrossRef]
  31. Alresheedi, M.T.; Haider, H.; Albuaymi, A.M.; AlSaleem, S.S.; Shafiquzzaman, M.; Alharbi, A.; Ahsan, A. Sustainability of a Low-Cost Decentralized Treatment System for Wastewater Reuse: Resident Perception-Based Evaluation for Arid Regions. Water 2023, 15, 3458. [Google Scholar] [CrossRef]
  32. Chen, D.; Yen, M.; Lin, P.; Groff, S.; Lampo, R.; McInerney, M.; Ryan, J. A Corrosion Sensor for Monitoring the Early-Stage Environmental Corrosion of A36 Carbon Steel. Materials 2014, 7, 5746–5760. [Google Scholar] [CrossRef] [PubMed]
  33. Xu, X.; Song, J.; Li, Y.; Wu, J.; Liu, X.; Zhang, C. The microstructure and properties of ceramic tiles from solid wastes of Bayer red muds. Constr. Build. Mater. 2019, 212, 266–274. [Google Scholar] [CrossRef]
  34. Pérez-Villarejo, L.; Corpas-Iglesias, F.A.; Martínez-Martínez, S.; Artiaga, R.; Pascual-Cosp, J. Manufacturing new ceramic materials from clay and red mud derived from the aluminium industry. Constr. Build. Mater. 2012, 35, 656–665. [Google Scholar] [CrossRef]
  35. Kuma, K.; Suzuki, Y.; Matsunaga, K. Solubility and dissolution rate of colloidal γ-FeOOH in seawater. Water Res. 1993, 27, 651–657. [Google Scholar] [CrossRef]
  36. Arghir, G.; Petean, I.; Munteanu, D.F.; Muresan, L.; Suciu, C. Raw material for powder metallurgy obtained from environmental iron hydroxides. Powder Metall. Prog. 2011, 3–4, 340–346. [Google Scholar]
  37. Avram, S.E.; Barbu Tudoran, L.; Cuc, S.; Borodi, G.; Birle, B.V.; Petean, I. Microstructural Investigations Regarding Sustainable Recycling of Ceramic Slurry Collected from Industrial Waste Waters. Sustainability 2024, 16, 1123. [Google Scholar] [CrossRef]
  38. Romero Quidel, G.; Soto Acuña, M.J.; Rojas Herrera, C.J.; Rodríguez Neira, K.; Cárdenas-Ramírez, J.P. Assessment of Modular Construction System Made with Low Environmental Impact Construction Materials for Achieving Sustainable Housing Projects. Sustainability 2023, 15, 8386. [Google Scholar] [CrossRef]
  39. Horabik, J.; Jozefaciuk, G. Structure and strength of kaolinite–soil silt aggregates: Measurements and modeling. Geoderma 2021, 382, 114687. [Google Scholar] [CrossRef]
  40. Kaminskas, R.; Savickaite, B. Expanded Clay Production Waste as Supplementary Cementitious Material. Sustainability 2023, 15, 11850. [Google Scholar] [CrossRef]
Figure 1. Ceramic tiles facility technological scheme with used water circuit and sampling sites.
Water 16 01027 g001
Figure 2. Mean values of water samples properties: (a) pH, (b) electrical conductivity, (c) electrical resistivity, (d) total dissolved solids, (e) salinity, and (f) turbidity. The error bars within the graphs represent the standard deviation.
Water 16 01027 g002
Figure 3. XRD patterns for the investigated samples: (a) FTS, (b) WTS, (c) PS, and (d) FWS.
Water 16 01027 g003
Figure 4. MOM images of the investigated samples observed at 300× magnification: (a) FTS, (b) WTS, (c) PS, and (d) FWS. At 1200× magnification: (a′) FTS, (b′) WTS, (c′) PS, and (d′) FWS.
Water 16 01027 g004
Figure 5. XRD patterns for the investigated samples: (a) FTS, (b) WTS, and (c) PS.
Water 16 01027 g005
Figure 6. AFM topographic images the samples fine microstructure of: (a) FTS, (b) WTS, (c) PS, and (d) FWS. Nanostructures: (e) FTS, (f) WTS, (g) PS, and (h) FWS. Three-dimensional profiles are given below each topographic image.
Water 16 01027 g006
Table 1. Minerals distribution within investigated samples as results of XRD and MOM investigation.
ComponentKaoliniteMulliteQuartzLepidocrociteGlass
FormulaAl2Si2O5(OH)4Al6Si2O13SiO2γFeO(OH)6SiO2‧CaO‧Na2O
Color nuancesWhite-blueRed-orangeGreen-grayRedish-brownBlack
FTS
Amount, wt. %1432540*
Particle size, μm1–10010–1805–70-10–30
WTS
Amount, wt. %3721430*
Particle size, μm1–303–351–35-20–55
FS
Amount, wt. %4132198*
Particle size, μm1–1001–1801–703–2010–60
FWS
Amount, wt. %686260*
Particle size, μm1–2.51–101–15--
Note: * undetectable due to the amorphous structure.
Table 2. Samples elemental composition.
ElementElemental Composition, At. %
FTSWTSPS
O70.170.070.3
Si14.717.517.6
Al6.16.16.8
Ca2.82.61.8
Na1.61.71.6
K0.80.80.8
Fe0.70.70.4
Cl0.30.3-
Mg--0.4
Ti0.20.20.2
Disclaimer/Publisher’s Note: The statements, opinions and data contained in all publications are solely those of the individual author(s) and contributor(s) and not of MDPI and/or the editor(s). MDPI and/or the editor(s) disclaim responsibility for any injury to people or property resulting from any ideas, methods, instructions or products referred to in the content.

