Article

Impact of Utilizing High-Resolution PlanetScope Imagery on the Accuracy of LULC Mapping and Hydrological Modeling in an Arid Region

by
Chithrika Alawathugoda
1,
Gilbert Hinge
2,
Mohamed Elkollaly
1,3 and
Mohamed A. Hamouda
1,4,*
1
Department of Civil and Environmental Engineering, Faculty of Engineering, United Arab Emirates University, Al-Ain P.O. Box 15551, United Arab Emirates
2
Department of Civil Engineering, National Institute of Technology Durgapur, Durgapur 713209, India
3
Department of Civil Engineering, Irrigation and Hydraulics Engineering, Faculty of Engineering, Tanta University, Tanta 31733, Egypt
4
National Water and Energy Center, United Arab Emirates University, Al-Ain P.O. Box 15551, United Arab Emirates
*
Author to whom correspondence should be addressed.
Water 2024, 16(16), 2356; https://doi.org/10.3390/w16162356
Submission received: 24 July 2024 / Revised: 17 August 2024 / Accepted: 19 August 2024 / Published: 22 August 2024
(This article belongs to the Special Issue Remote Sensing for Hydrology)

Abstract

:
Accurate land-use and land-cover (LULC) mapping is crucial for effective watershed management and hydrological modeling in arid regions. This study examines the use of high-resolution PlanetScope imagery for LULC mapping, change detection, and hydrological modeling in the Wadi Ham watershed, Fujairah, UAE. The authors compared LULC maps derived from Sentinel-2 and PlanetScope imagery using maximum likelihood (ML) and random forest (RF) classifiers. Results indicated that the RF classifier applied to PlanetScope 8-band imagery achieved the highest overall accuracy of 97.27%. Change detection analysis from 2017 to 2022 revealed significant transformations, including a decrease in vegetation from 3.371 km2 to 1.557 km2 and an increase in built-up areas from 3.634 km2 to 6.227 km2. Hydrological modeling using the WMS-GSSHA model demonstrated the impact of LULC map accuracy on simulated runoff responses, with the most accurate LULC dataset showing a peak discharge of 1160 CMS at 930 min. In contrast, less accurate maps showed variations in peak discharge timings and magnitudes. The 2022 simulations, reflecting urbanization, exhibited increased runoff and earlier peak flow compared to 2017. These findings emphasize the importance of high-resolution, accurate LULC data for reliable hydrological modeling and effective watershed management. The study supports UAE’s 2030 vision for resilient communities and aligns with UN Sustainability Goals 11 (Sustainable Cities and Communities) and 13 (Climate Action), highlighting its broader relevance and impact.

1. Introduction

Over the past few decades, unprecedented urbanization, driven by population growth, economic development, and technological progress, has led to significant changes in land use and land cover (LULC) worldwide [1]. If these changes are not correctly mapped, classified, and managed, they can exacerbate the drivers and impacts of climate change [1,2]. Monitoring and mapping the dynamics of these changes is crucial for sustainable urban development. Urbanization has resulted in the loss of natural cover, such as forests and croplands, and an increase in impervious surfaces, which impact local hydrological processes and potentially increase the severity of flood events [2].
Land-use and land-cover (LULC) change detection is a crucial aspect of environmental management and hydrological modeling. Human activities, such as urbanization and deforestation, have significantly altered LULC patterns, impacting hydrological processes and watershed responses [3,4]. Detecting and predicting these changes over time is essential for effective water resource management, particularly in arid regions where data scarcity poses additional challenges [5,6]. Studies utilizing advanced techniques like refined open-source data and machine learning classifications provide valuable insights into LULC dynamics and their effects on hydrology [4]. Incorporating such approaches can improve the accuracy and reliability of hydrological models, aiding in flood risk assessment and sustainable land-use planning [5]. Moreover, advanced methodologies such as soft computing-based approaches have proven effective in flash flood susceptibility modeling, providing valuable frameworks for future research and practical applications [7].
Quantitative research has long established that changes in surface runoff are positively correlated with increases in impervious land. Hu et al. (2020) [8] identified urbanized impervious land use as a predominant factor in increased surface runoff. Similarly, Du et al. (2019) [9], using GIS, remote sensing data, and hydrological models, found that urbanization and land-use changes increased peak flood flow and volume. Their study highlighted the complex interactions between land-use changes and flood response at the sub-catchment scale, influenced by factors such as the characteristics of the underlying surface and the nature of precipitation events.
Efforts to mitigate the impact of LULC changes on flood peak discharge include reforestation and afforestation and implementing low-impact development (LID) and best management practices (BMPs). These initiatives have significantly reduced flood peaks [10,11]. Recent studies have emphasized the critical role of accurate precipitation data and GIS-based methodologies in assessing flood risks in arid regions [12]. Research in the UAE [12,13], Saudi Arabia [14], and the United States [15] has underscored the importance of integrating geospatial data with hydrological models to enhance flood risk assessment and management strategies. These studies emphasized the need for robust datasets and standardized methodologies to improve flood mitigation efforts globally.
Recent advancements in remote sensing technology have provided high-quality data with various spectral, spatial, and temporal resolutions. Commonly used satellite data for LULC mapping include Landsat and Sentinel, which are freely available [16]. Researchers have used these images to map and classify LULC using various machine learning-based classifiers, achieving accuracies ranging from 60% to over 90%, depending on the data source and algorithm used [10,16]. For instance, S. Archaki (2022) [16] provided a comparative analysis of PlanetScope, Sentinel-2, and Landsat-8 imagery for land-use and land-cover (LULC) mapping. The study highlighted the strengths and limitations of each source in terms of spatial, spectral, and temporal resolution, offering insights into their applicability in different LULC classification scenarios [17]. Furthermore, Ghayour et al. (2021) [18] found that Sentinel-2 had slightly better accuracy than Landsat-8 in classifying LULC.
Recently, high-resolution optical satellites such as QuickBird, WorldView, and PlanetScope have been explored for LULC mapping [15]. Despite these advancements, limited research has focused on using newer satellites like PlanetScope for LULC mapping in arid regions, particularly the United Arab Emirates (UAE). Different classifiers, including supervised techniques like support vector machine (SVM), random forest (RF), and maximum likelihood classifier (MLC) or unsupervised techniques like K-means algorithms, affinity propagation (AP), and cluster algorithms, are suited to varying geographic areas [18]. The classifier that is best suited for a given geographic area may vary depending on the location and its setting [18]. The accuracy of LULC mapping depends on both temporal and spatial factors, emphasizing the need for region-specific investigations to refine LULC mapping techniques.
In the United Arab Emirates, LULC mapping and analysis have been employed in several studies. For instance, the impact of urban expansion on potential flooding was explored from 1976 to 2016. During this time, urban areas in the UAE rapidly expanded, with built areas increasing fourfold and the population growing tenfold. This expansion of built-up areas led to a significant rise in the percentage of impervious land, runoff coefficient, and potential runoff while simultaneously decreasing the maximum potential storage and minimum rainfall required to generate runoff [19,20]. Despite these findings, no study has investigated the effectiveness and accuracy of new remote sensing data, such as PlanetScope imagery, for LULC mapping in the UAE.
Hydrological modeling of watersheds in arid regions is a difficult endeavor. Zoccatelli et al. (2020) [21] provided valuable insights into the challenges and methods of hydrological modeling in arid regions. The study highlighted that hydrological models often perform less effectively in arid areas than other climates due to scale issues, specific processes, and inadequate measurements. The study underscores the complexities and necessary considerations for improving hydrological model accuracy in arid regions [21].
The need to accurately replicate surface water flows in watersheds with diverse runoff production mechanisms has led to the development of the Gridded Surface Subsurface Hydrologic Analysis (GSSHA). It is a physically based hydrologic model developed by the U.S. Army Engineer Research and Development Center (ERDC), Hydrologic Modeling Branch, within the Coastal and Hydraulics Laboratory. GSSHA is an enhancement of the two-dimensional CASC2D model, capable of simulating streamflow from various sources, including runoff from infiltration excess, saturated source areas and seeps, and direct interactions between streams and saturated groundwater. GSSHA ensures a cohesive mass balance among hydrologic components by using mass-conserving solutions for partial differential equations. GSSHA has been applied to numerous projects, demonstrating its effectiveness in analyzing hydrologic and sedimentation processes. It provides critical information for engineered systems, offering insights into the potential impacts of projects, land-use changes, environmental restoration, best management practices, and climate change [22].
The GSSHA (Gridded Surface Subsurface Hydrologic Analysis) model has been widely recognized for its versatility in simulating diverse hydrological processes across various environments. A study by Fattahi et al. (2023) [23] presented the application of the GSSHA model for flood analysis in large watersheds, focusing on the impact of DEM accuracy, grid size, and stream density. The results demonstrated that higher-resolution DEMs significantly enhance flood prediction accuracy, optimal grid sizes improve model performance, and increased stream density leads to more accurate simulations of surface and subsurface hydrology. Similarly, Downer and Ogden (2002) [24] highlighted GSSHA’s strength in integrating overland flow, infiltration, groundwater interactions, and channel routing within a unified framework, making it particularly valuable for complex hydrological modeling tasks. In addition to its application in large watershed flood analysis, the GSSHA model has also been effectively employed in urban watershed contexts. Sharif et al. (2004) [25] demonstrated the model’s ability to simulate flood dynamics within a watershed characterized by rapid urbanization; GSSHA successfully managed the complexities of surface runoff and channel routing processes, emphasizing the importance of detailed terrain and land use data for accurate flood prediction. This application underscores GSSHA’s versatility in handling both natural and anthropogenic influences on hydrological systems, making it highly relevant for urban watershed management and flood risk mitigation. These studies underscore the importance of using a robust model like GSSHA to effectively address the challenges of hydrological modeling in diverse environments, particularly in arid regions, where hydrological responses are influenced by intricate surface and subsurface interactions.
Rainfall-runoff modeling in arid areas remains an understudied domain, presenting significant challenges yet to be fully resolved. Optimal parameter sets for hydrological simulations in these regions often vary between flood events, primarily due to the high data inconsistency and uncertainty arising from the small spatial and temporal scales of the hydro-meteorological processes involved [21]. Significant advancements have been made in hydrological modeling in desert areas, including the integration of remote sensing data, the development of advanced algorithms for rainfall-runoff modeling, and improvements in the parameterization of arid land surfaces. However, a gap persists in understanding the specific impacts of varying land-use/land-cover (LULC) classifications on hydrological model accuracy. This study addresses this gap by evaluating the effects of different LULC maps on hydraulic modeling outcomes, focusing on LULC-associated roughness coefficients and their influence on hydrographs.
In this context, the present study aims to test the applicability of new remote sensing data to identify and map changes in land use/land cover with different classifiers. It intends to identify the most appropriate machine learning LULC classifier, particularly for arid morphoclimatic conditions, to develop highly accurate LULC maps. The resulting high-accuracy LULC maps will serve as input for urban hydrological models developed using the Gridded Surface/Subsurface Hydrologic Analysis (GSSHA) software tool included in the Watershed Modeling System (WMS) V11.1, Aquaveo LLC, Provo, UT, USA to analyze the implications of accurate LULC representation for hydrological modeling. Understanding how hydrological responses evolve over time in reaction to shifting LULC patterns is crucial for effective flood management and mitigation strategies. The present study also examines the temporal variations in watershed hydraulic responses related to LULC change detection from 2017 to 2022 in the Wadi Ham watershed.
This research showcases how advanced remote sensing technologies can bolster urban resilience and sustainability efforts. Aligned with the UAE Ministry of Climate Change and Environment’s National Climate Change Adaptation Program (NCCAP 2017–2050), aimed at enhancing the UAE’s climate resilience globally, the present study advocates for prompt action and the development of robust adaptation measures. These efforts are essential to mitigate risks to infrastructure and the environment, fostering climate resilience in line with the goals outlined in NCCAP 2020. Moreover, in recent years, the global community has prioritized sustainable development, as articulated in the United Nations Sustainable Development Goals (SDGs). This study specifically addresses Goal 11: Sustainable Cities and Communities and Goal 13: Climate Action by examining the impacts of LULC changes on extreme events (flash floods) for urban planning and resilience. The specific research objectives include the following: (1) to assess the capability and effectiveness of newly available remote sensing data, PlanetScope’s new generation imagery, in improving the accuracy of LULC mapping and classification in the designated study area; (2) to evaluate and compare the performance of widely employed classification algorithms within the selected environmental setting, specifically the maximum likelihood classifier (MLC) and random forest (RF) classifier; and (3) to explore the implications of accurately representing LULC on outputs of a hydrological model of a watershed in an arid region.

2. Study Area

The study area is the Wadi Ham watershed (Figure 1), a seasonal watercourse located in the Hajar Mountains of Fujairah and Ras Al Khaimah in the United Arab Emirates. This watershed spans between the latitudes of 25°18′54″ N to 25°04′12″ N and the longitudes of 56°08′ E to 56°21′ E. It stretches from Masafi towards Fujairah City, eventually reaching the Wadi Ham Dam and the Gulf of Oman. Wadi Ham is notable for being the largest and longest wadi in the UAE. It extends over a length of 30 km from Masafi in the northwest to the Wadi Ham Dam near Fujairah City in the southeast. Each year, the northern and northeastern parts of the UAE experience flash floods that originate from the Al Hajar Mountains and drain through the wadi.

3. Materials and Methods

The methodological framework utilized in this study is illustrated in Figure 2 and detailed in the subsequent sections. The framework was developed to address the specific research objectives.

3.1. Land-Use/Land-Cover Classification in QGIS

3.1.1. Dataset Used

For land-use/land-cover (LULC) classification, the present study utilized Sentinel-2 and PlanetScope imagery, each offering distinct advantages and specifications tailored to the study’s needs. Below are details of the datasets used.
Sentinel-2 data: To conduct the analysis, bands 2, 3, 4, 5, 6, 7, 8, 8A, 11, and 12 were selected, omitting the shortwave infrared IR1 and IR2 as well as thermal bands, which are less relevant for LULC classification purposes [26]. The imagery from 22 June 2022 through 15 December 2017 with low cloud cover was selected. These data were sourced directly from the Copernicus open-access hub [27] using the SCP plugin in QGIS V3.28. The selected Sentinel-2 imagery provides multispectral coverage suitable for detailed land-cover classification.
PlanetScope Data: PlanetScope Analytic Ortho Scene products consist of calibrated and orthorectified multispectral imagery optimized for quantitative analysis. Surface Reflectance 8-band multispectral imagery was accessed from the Planet Explorer website. Daily PlanetScope imagery within the specified date range, namely 30 June 2022 through 10 December 2017, was ordered and downloaded through the Planet Explorer platform. The study area was defined using a shapefile, and the ordered images were clipped accordingly to match the study area’s boundaries.
Table 1 summarizes the spectral characteristics of both PlanetScope and Sentinel-2 datasets used in the LULC classification. The selection of these datasets was based on their spectral resolution and suitability for distinguishing various land-cover types within the study area.

3.1.2. Pre-Processing

To evaluate the watershed’s hydrology, single-date PlanetScope imagery was acquired for a date closest to an extreme flood event. The PlanetScope scenes covering the study area were downloaded from the Planet Explorer website. The spectral bands are radiometrically, geometrically, and atmospherically corrected to surface reflectance, and the image scenes are clipped to the specified area of interest by Planet Explorer before they are made available to the user.
For Sentinel-2 Imagery, level 2A products with low cloud cover (Less than 5%) were selected for generating the LULC map. Level 1C products required atmospheric correction during the pre-processing stage. The pixel values, initially indicated as digital numbers, were converted to reflectance values using the SCP plugin. The converted raster bands were subsequently clipped to the defined area of interest.

3.1.3. Classification Algorithms

The random forest classifier (RF) algorithm, a supervised classification method, combines the decision tree approach with the aggregation approach. Three parameters were selected for RF: Ntree (number of trees to grow), Mtry (number of variables to split at each node), and variable importance (impact of each variable/band on model performance). An iterative approach determines the optimal Ntree and Mtry by minimizing the mean square errors (MSE), given in Equation (1).
MSE = i = 1 n 1 n Y i X i 2
where Yi is the observed value, and Xi is the predicted value.
Random forest classification was carried out in QGIS V3.28 using the Dzetsaka Plugin. Dzetsaka is a strong classification plugin for QGIS V3.28. This plugin created by Nicolas Karasiak was initially based on the Gaussian mixture model classifier developed by Mathieu Fauvel (it now supports random forest, KNN, and SVM). This classification tool runs with the Sci-py library.
Maximum likelihood classification (MLC) is a supervised classification method that assumes the statistics for each class in each band are normally distributed. It calculates the probability that a given pixel belongs to a specific class, based on Bayes’ classification. In this classification, pixels are assigned to a class according to their probability of belonging to a particular class. This classifier is advantageous since it considers shape, size, and navigation as well as location. A posteriori distribution P(i|ω), i.e., the probability of a pixel with feature vector ω belonging to class i, is given by Equation (2).
P C i | x = P x | C i × P C i P x
where P(Ci|x)—testing most probability; P(x|Ci)—conditional probability; P(Ci)—prior probability, i.e., the probability that i is observed; P(x)—the probability of pixel for any class; Ci—that class; x—pixel.

3.1.4. Land-Use/Land-Cover Classification

Each object or feature on the earth’s surface has its unique spectral signature: the plot of reflectance as a function of the wavelength across the electromagnetic spectrum. Energy reflected by various features of the earth’s surface over various wavelengths is used to build a spectral response of the feature that is useful for its identification. Image classification is the process in which pixels of satellite imagery are grouped as per their spectral characteristics and assigned land-cover classes. In this study, the classification of acquired imagery was carried out using QGIS V3.28 long-term release.
The Scikit-learn library and Dzetsaka plugin were used to supervise the classification of Sentinel-2 and PlanetScope imagery using the RF classifier. PlanetScope imagery raster layers were imported into QGIS V3.28. Training data were created to classify the images, and the RF classifier was used to classify them.
In the supervised classification of Sentinel-2 Data using MLC, the training input is defined using information from Google satellite data. The training samples are created to be well distributed over the entire image and capture enough spectral variability of a particular class. The training input is provided through the SCP-doc training input tab. The MLC algorithm, available in the SCP plugin, was then used to classify the pixels based on the training sites, assigning them to LULC classes.

3.1.5. Accuracy Assessment

Errors can occur during the mapping process due to confusion at the categorical transitions that may occur while placing spatially and categorically continuous conditions into discrete classes. The changes in the mapping processes, data used, and analyst biases may also contribute to errors in a map made from remotely sensed data. An accuracy assessment identifies the classification errors and quantitatively determines the map quality.
The accuracy assessment was carried out using the confusion matrix or the error matrix. Different statistical parameters, namely overall accuracy (OA), producer accuracy (precision, P), user accuracy (recall, R), and Fscore, were evaluated for all classified maps. The error matrix organizes labels allocated by classification against the labels depicted in the reference data in rows and columns. The correct classifications are presented in the main diagonal of the error matrix, while omission and commission errors are presented in the off-diagonal elements. If Pij in the error matrix represents the proportion of area for the population with map class i and reference class j, for a population of q classes, overall accuracy is the ratio of correctly classified samples to that of the total sample space.
O A = j = 1 q P j j
O A = j = 1 q x j j x
where xjj is the diagonal elements in the error matrix, and x is the total number of samples in the error matrix.
In addition to overall accuracy, user accuracy or recall and producer accuracy or precision were determined. User accuracy considers inclusion or commission errors and indicates the probability that a classified class represents the same category. Producer accuracy involves exclusion or omission errors and indicates the probability that a given class has been correctly classified according to the training data.
U s e r   A c c u r a c y   R = T P T P + F N
P r o d u c e r   A c c u r a c y   P = T P T P + F P
where true positive (TP) is the pixels that were correctly identified by the classifier, false positive (FP) is the pixels that were classified incorrectly, and false negative (FN) is the pixels that belonged to the class and were not classified correctly (false negative).
F-Score is the relationship between producer and user accuracy, and it helps evaluate the suitability of the classifier by class [22,28,29]
F S c o r e = 2 × P R P + R
Furthermore, LULC changes were analyzed using cross-classification in QGIS V3.28 to produce change detection maps for the Wadi Ham watershed from 2017 to 2022. The maps illustrate the transformation in LULC categories over this period. Finally, the GSSHA model was utilized to simulate the hydrological effects of LULC changes using the 2017 and 2022 LULC maps as detailed in the next section. This helped identify how these changes impact watershed hydraulic responses over time.

3.2. WMS-GSSHA Modelling Using Hydrologic Modelling Wizard

The Watershed Modeling System (WMS), V11.1, Aquaveo LLC, Provo, UT, USA, coupled with the Gridded Surface Subsurface Hydrologic Analysis (GSSHA), is a robust hydrological and hydraulic modeling tool, enabling detailed analysis of watershed behavior under various scenarios. The steps involved in modeling the Wadi Ham watershed in Fujairah, UAE, using land-use/land-cover (LULC) maps of varying accuracies and soil parameters to demonstrate their impact on hydraulic modeling results, are as follows (Figure 3).

3.2.1. Data Acquisition and Preparation

Remote sensing data including Sentinel-2 and PlanetScope imagery were acquired and processed using supervised machine learning techniques—maximum likelihood classification and random forest classification—within QGIS V3.28. To ensure comprehensive coverage of the study area, the selected images were chosen with less than 5% cloud cover and were captured as close as possible to an extreme flood event. For accurate comparison between the two datasets, images from PlanetScope and Sentinel-2 were taken as close in time as possible, assuming negligible land-use and land-cover (LULC) changes.
For change detection analysis, imagery from 2017 and 2022 was selected to assess urbanization and corresponding LULC changes over a five-year period. The classification accuracy was verified through an accuracy assessment. The term “high-resolution imagery” in this study refers to different aspects of resolution depending on the dataset. PlanetScope imagery, known for its high spatial resolution, provides detailed land-cover classifications and frequent temporal resolution, making it ideal for monitoring changes over time. In contrast, Sentinel-2 imagery, while slightly lower in spatial resolution, offers superior spectral resolution with 13 bands compared to PlanetScope’s 4 or 8 bands. This makes Sentinel-2 particularly effective in distinguishing between different land-cover types based on spectral signatures.
By leveraging the strengths of both spatial detail and spectral richness from these datasets, the study enhances the accuracy of LULC classification and subsequent hydrological modeling.
Soil texture and hydraulic properties for the Wadi Ham watershed were determined using a soil-cover map and supported by literature sources [30,31,32,33].These properties are critical for accurate hydrological modeling and include hydraulic conductivity, wilting point, field capacity, initial moisture, capillary head, porosity, pore distribution index, and residual saturation. These parameters were refined through regional studies specific to the arid environment of the Wadi Ham region, as summarized in Table 2.
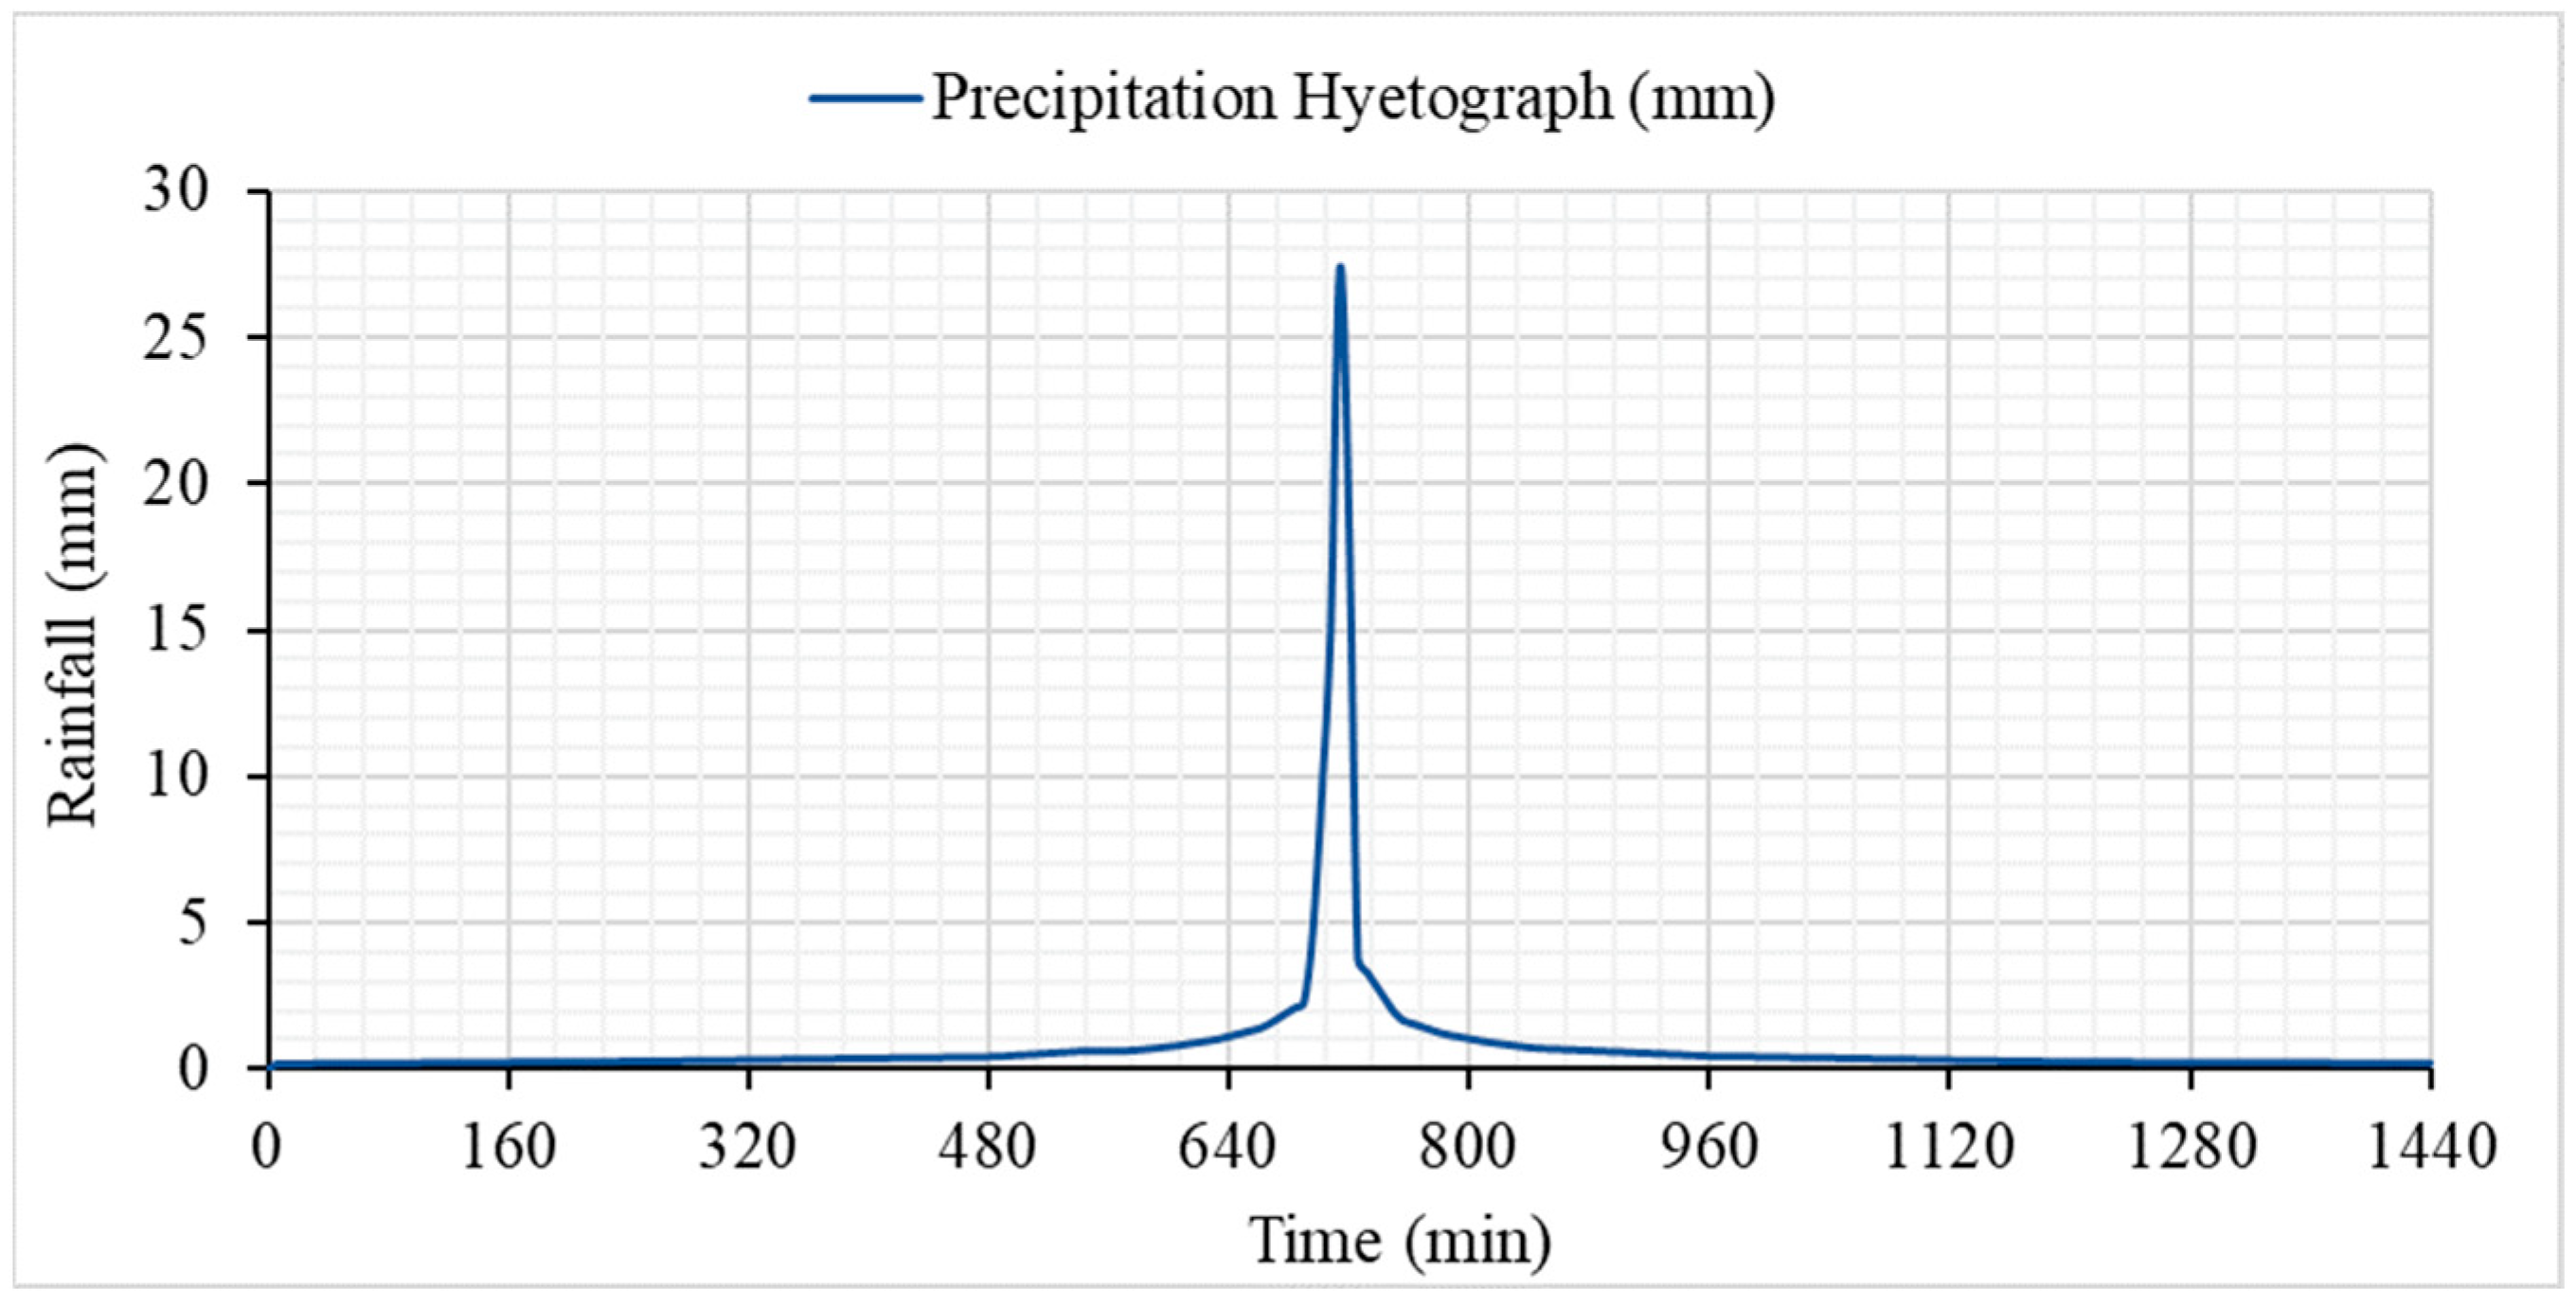
The model applied a synthetic rainfall storm, characterized by a 200 mm precipitation event following the SCS Type II distribution over a 24 h duration, as illustrated in Figure 4. This simulated rainfall event is typical for the study area, reflecting the intense storm patterns often observed. The hyetograph, sourced from the study by Sherif et al. (2009) [34], presents the temporal distribution of the rainfall intensity, with a sharp peak indicating a high-intensity, short-duration storm typical of the region. This 200 mm rainfall event corresponds to the 100-year return period for the Wadi Ham watershed, as reported by Sherif et al. (2009) [34]. The SCS Type II distribution is commonly used in hydrological modeling for arid regions, representing a moderately intense storm with a relatively uniform rainfall distribution over time [35]. The application of this synthetic storm ensures that the model accurately reflects the hydrological response of the watershed to extreme precipitation events.
Figure 5, Figure 6, Figure 7 and Figure 8 present the physiographic datasets essential for hydrological modeling in the study area. These datasets include the Digital Elevation Model (DEM), soil-cover map, and land-use/land-cover (LULC) maps.
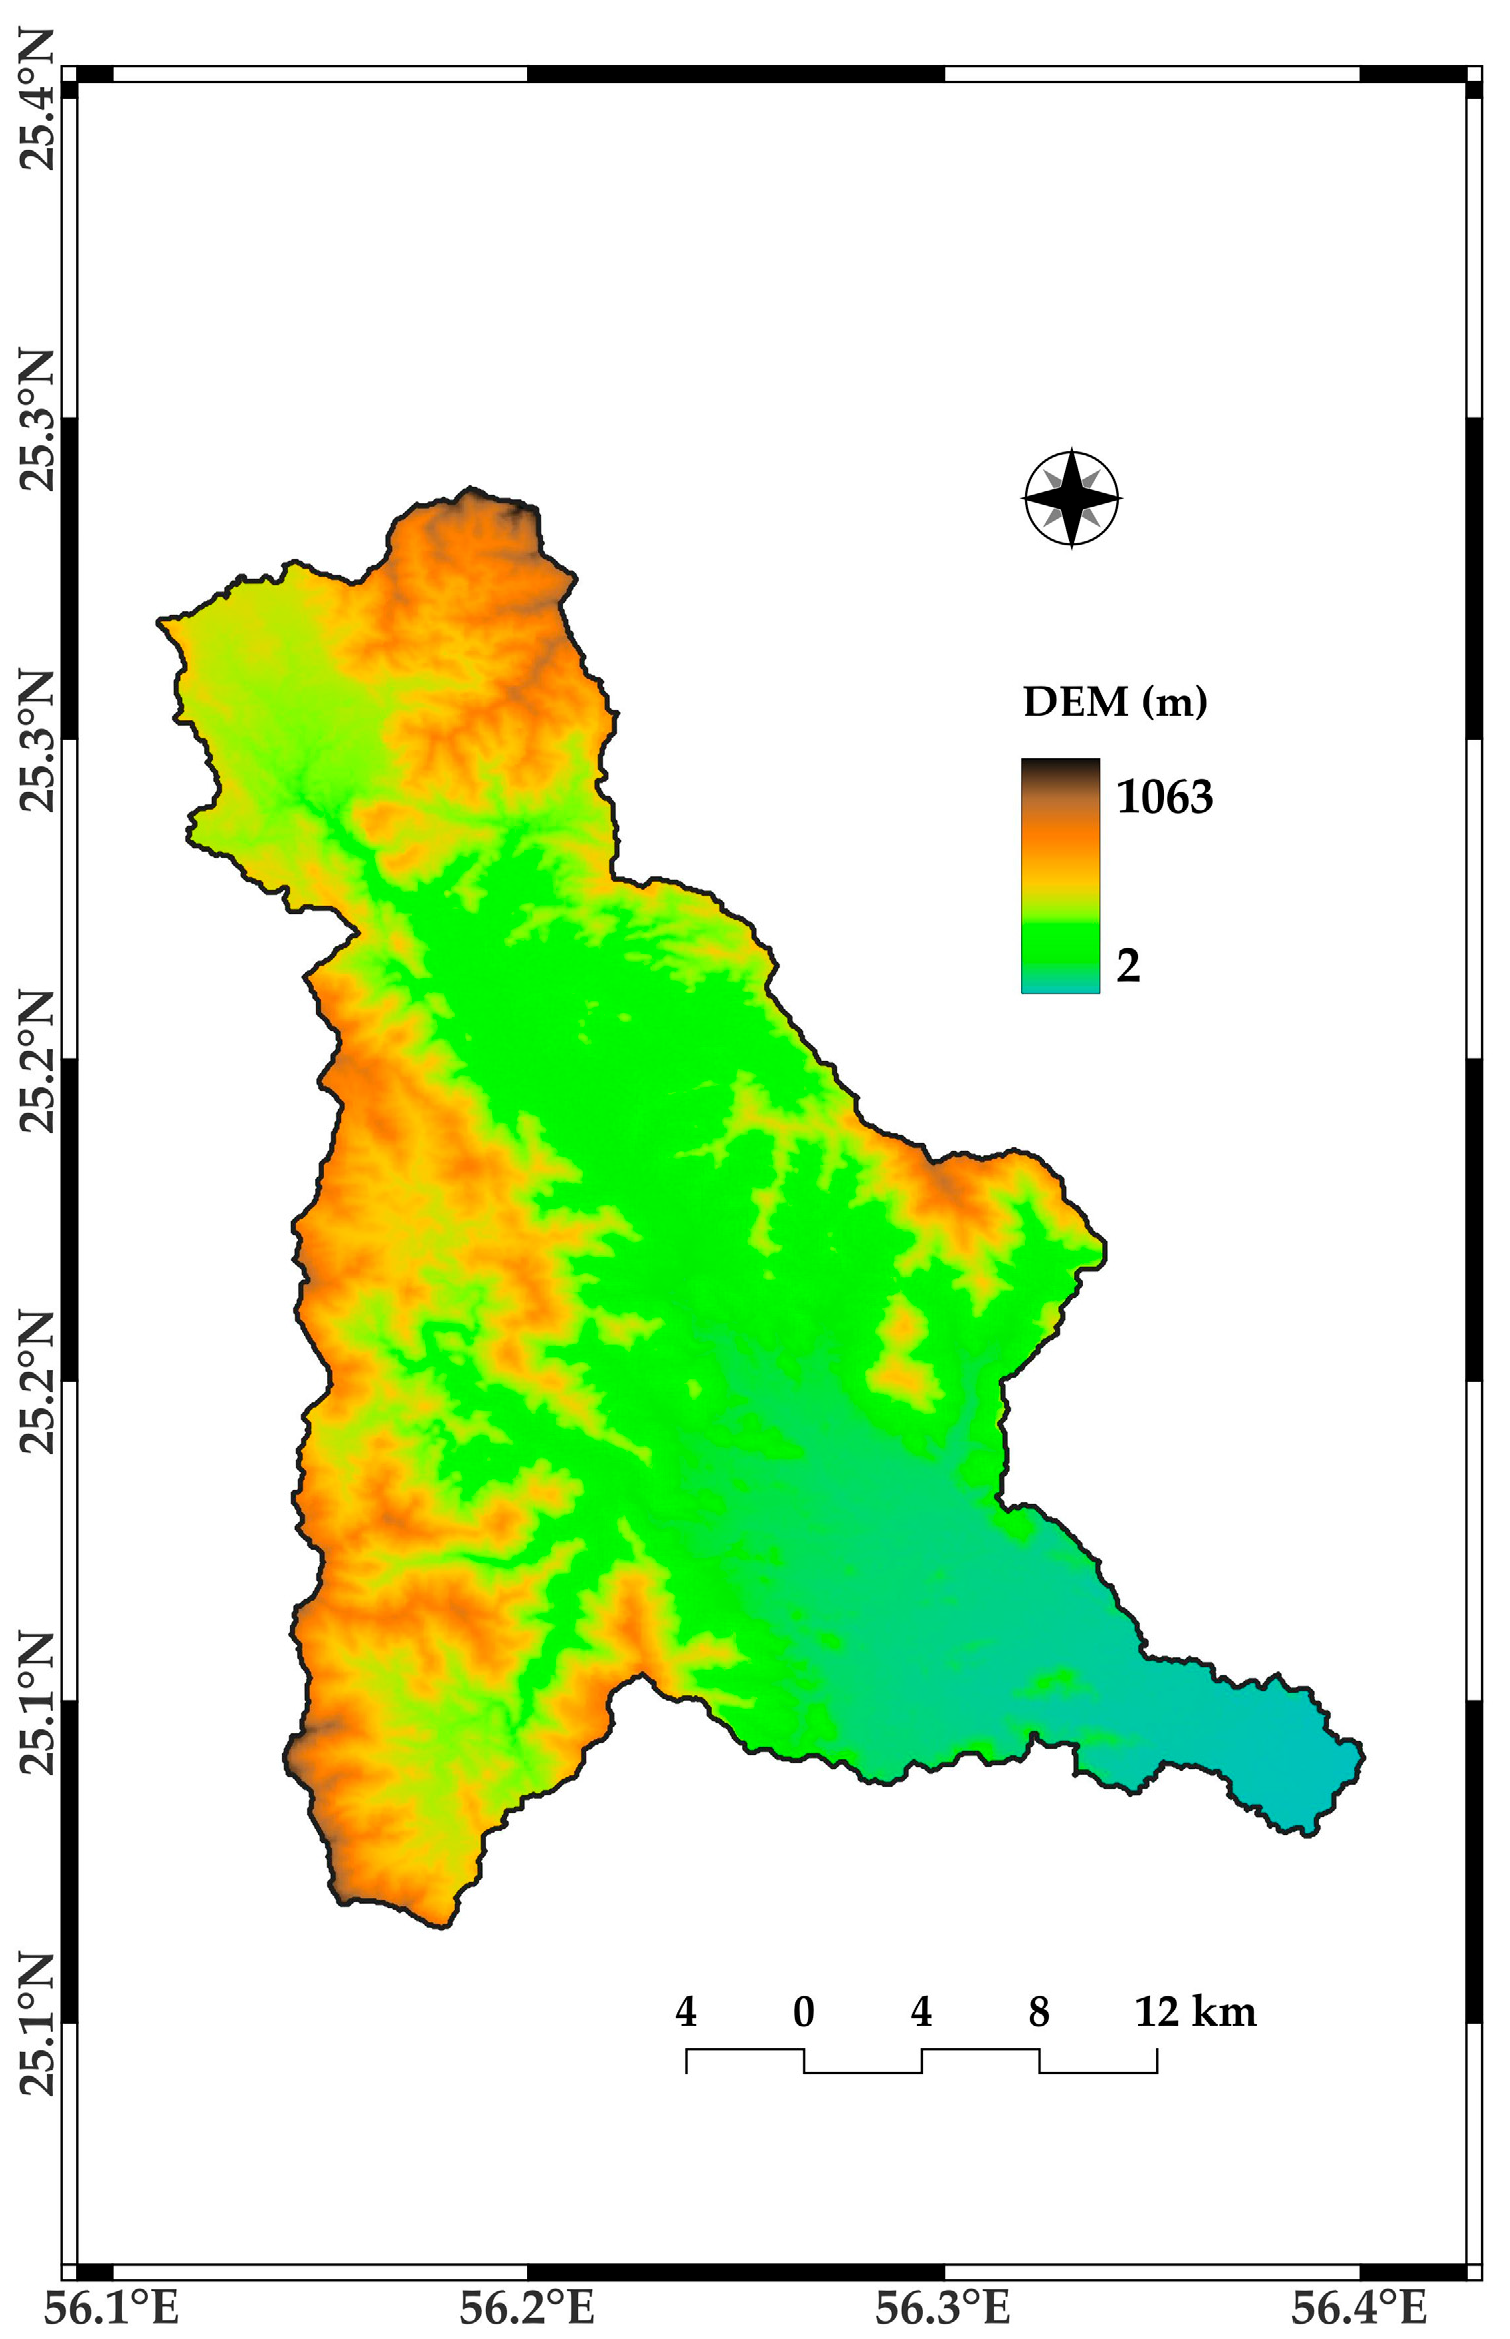
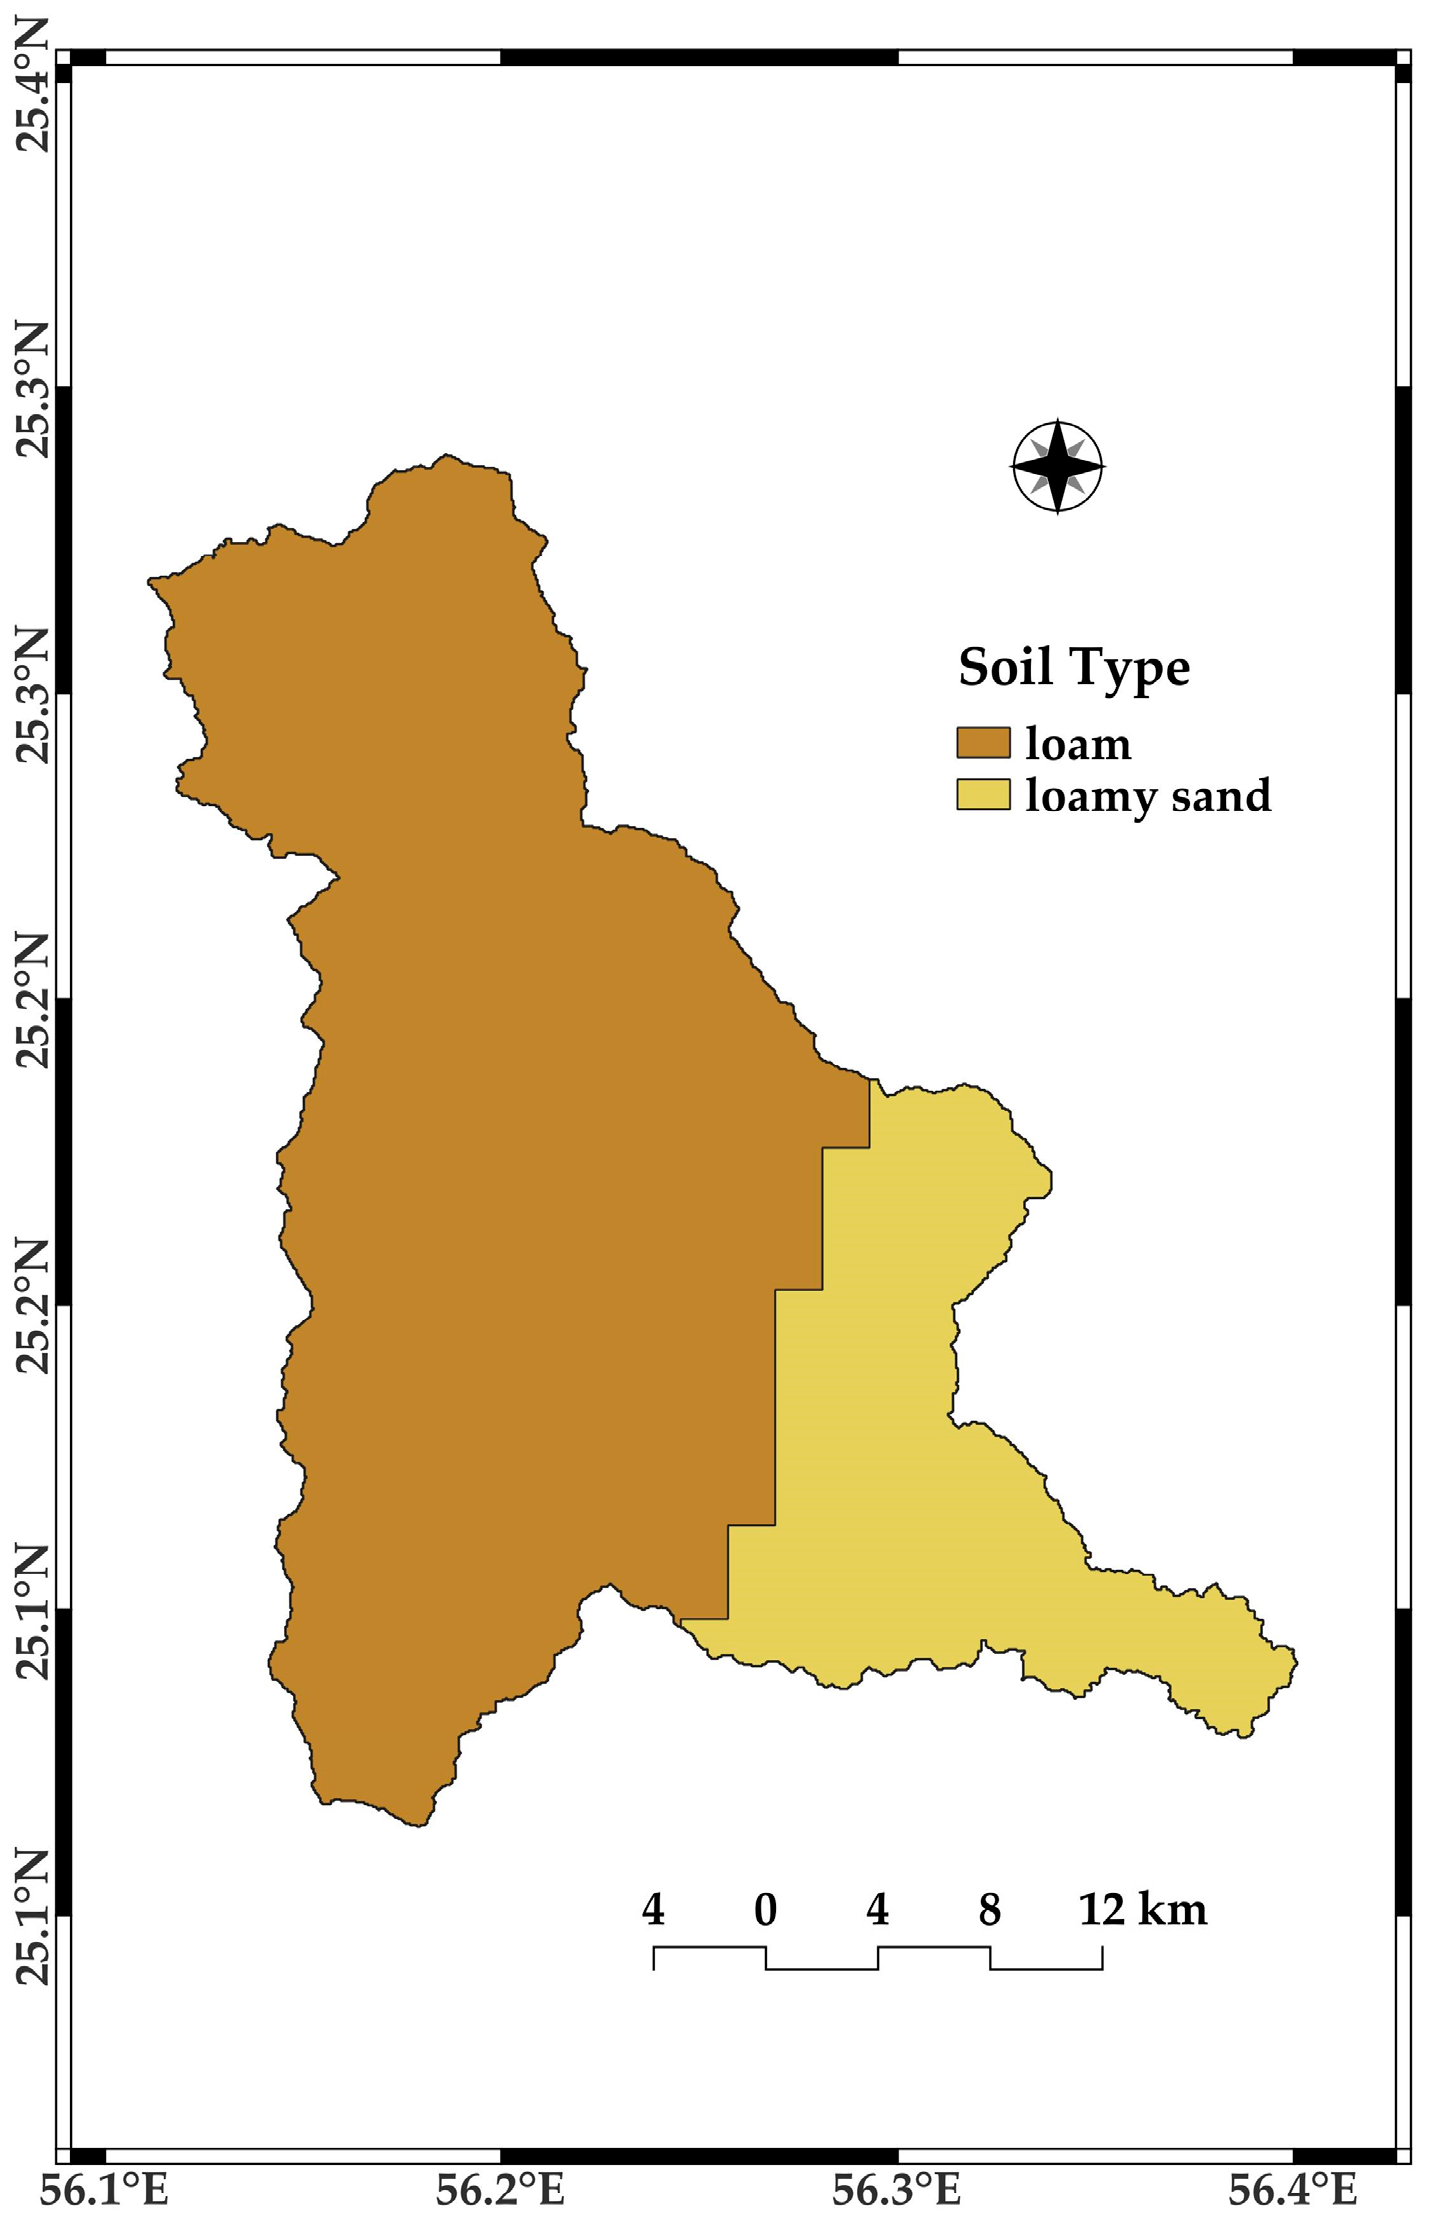
The Digital Elevation Model (DEM) used in this study was sourced from the Shuttle Radar Topography Mission (SRTM) with a 30 m resolution and was acquired from the United States Geological Survey (USGS) (Figure 5). The Digital Soil Map of the World (DSMW) was utilized in this study to provide essential soil cover data for GSSHA modeling (Figure 6).
In examining the land-use/land-cover (LULC) maps presented in Figure 7, differences in LULC classes can be observed depending on the data sources and classification schemes used. Figure 7A,B are based on high-resolution imagery from PlanetScope and Sentinel-2, which allow for more detailed analysis and finer categorization of land-cover types, resulting in a greater number of LULC classes. This level of detail can be particularly important for accurate hydrological modeling in the study area, as it captures subtle landscape variations.
Conversely, Figure 7C,D utilize LULC maps from the ESA Data User Element and ESRI, which are global datasets. These maps tend to have fewer classes because they are designed for broad, global applicability rather than being tailored to specific regions. As a result, they may be less accurate in representing local conditions compared to user-defined classifications, which can be customized to the specific characteristics of a region. In this study, LULC maps from the ESA Data User Element and ESRI were used to compare with the user-generated maps, as these global datasets are commonly used in hydrological modeling. The comparison was essential to assess how differences in data sources and classification schemes impact hydrological modeling results. However, the limitations of these global datasets, including their lower accuracy and fewer classes, have been acknowledged and critically assessed. By comparing high-resolution, user-defined classifications with these broader global datasets, this study highlights the variability in hydrological outcomes based on the level of LULC detail available.
Building on this comparison, Figure 8 illustrates the land-use/land-cover (LULC) maps used for change detection over the Wadi Ham watershed. Figure 8A depicts the LULC map for 2022, created using PlanetScope’s 8-band imagery from 30 June 2022 and classified with the random forest (RF) method, achieving 97% accuracy. Figure 8B presents the LULC map for 2017, developed using PlanetScope’s 4-band imagery from 20 December 2017 and also classified with the RF method, reaching 96% accuracy. These maps were essential for identifying and quantifying LULC changes between 2017 and 2022, particularly in relation to urban expansion and its hydrological impacts.

3.2.2. GSSHA Model Setup

The DEM, LULC, and soil data were imported into WMS to initiate the modeling process. A new GSSHA project was set up, defining the watershed boundary based on the DEM data. Manning’s roughness coefficients and other hydraulic parameters were assigned to each LULC class, informed by the relevant literature [26,30,33,36] and refined using regional studies specific to the Wadi Ham watershed, as shown in Table 3.
The Hydraulic Modeling Wizard in WMS facilitated a streamlined setup of the simulation, specifying the period, grid resolution, and key hydrological processes such as infiltration, overland flow, and channel routing. Soil hydraulic properties (hydraulic conductivity, capillary head, porosity, pore distribution index, residual saturation, field capacity, wilting point, and initial moisture content) specific to loam and loamy sand soils were meticulously defined. Rainfall input was configured for a synthetic storm scenario, and the model was initialized with current soil moisture conditions. The GSSHA model was executed to simulate the hydrological dynamics of the watershed.

4. Results

4.1. Accuracy of LULC Maps

The study assessed the accuracy of land-use and land-cover (LULC) maps derived from Sentinel-2 and PlanetScope imagery using maximum likelihood (ML) and random forest (RF) classification methods. Table 4 provides an overview of the overall accuracies achieved through these classifications, while Figure 9, Figure 10, Figure 11 and Figure 12 illustrate the corresponding LULC maps generated by these classifications. The random forest classifier applied to PlanetScope imagery achieved the highest overall accuracy of 97.27%, showcasing its effectiveness in accurately distinguishing various land-cover types.
The results demonstrate that the random forest classifier applied to PlanetScope imagery achieved the highest overall accuracy of 97.27%, highlighting its superior effectiveness in precisely distinguishing various land-cover types. For Sentinel-2 imagery, both maximum likelihood and random forest classifiers demonstrated notable accuracies, with random forest consistently outperforming maximum likelihood across different acquisition dates. The consistent performance of the random forest classifier across different datasets and acquisition dates emphasizes its reliability and suitability for high-precision LULC mapping.
These findings highlight the importance of selecting appropriate classification methods tailored to the characteristics of satellite imagery, thereby enhancing the accuracy and reliability of LULC maps for various applications.

4.2. GSSHA Model Simulation Output

Figure 13 shows the hydrographs generated by the WMS-GSSHA model for the Wadi Ham watershed in Fujairah, UAE, using different land-use/land-cover (LULC) maps. These hydrographs illustrate simulated runoff responses under varying accuracies of LULC data, highlighting variations in the temporal distribution of runoff, peak discharge, time to peak, and total runoff volume. Each hydrograph corresponds to a specific LULC dataset: The hydrograph of Model A represents PS-RF classification (PlanetScope imagery with random forest classification with 97.27% accuracy), while the hydrograph of Model C displays LULC from ESA Data User Element. The hydrograph of Model D shows Sentinel-2 imagery with maximum likelihood classification with 85.73% accuracy, and the hydrograph of Model E shows the ESRI downloaded LULC Map.
These hydrographs enable a detailed analysis of how LULC map accuracy influences hydrological modeling outcomes. For instance, hydrograph 1 shows a peak discharge at approximately 1150 min, with a maximum value of 750 CMS. The time to peak is around 1000 min. Hydrograph 2 shows a peak discharge at approximately 865 min, with a maximum value of 1600 CMS. Hydrograph 3 shows a peak discharge at approximately 965 min, with a maximum value of 950 CMS, and hydrograph 4 shows a peak discharge at approximately 900 min, with a maximum value of 1600 CMS.
This analysis emphasizes the crucial role of accurate LULC information in enhancing the reliability of hydrological models, which is crucial for effective watershed management and flood risk assessment.

4.3. LULC Change Detection Results

The change detection analysis conducted for the Wadi Ham watershed between 2017 and 2022 revealed significant transformations in land-use and land-cover patterns, as summarized in Table 5. Over this period, there were notable conversions from natural vegetation to built-up areas and expansions in road networks and water bodies.
Figure 14 and Figure 15 illustrate the land-cover changes in the Wadi Ham watershed between 2017 and 2022. The map highlights various cross-classes of land-cover transitions, including built-up areas, vegetation, water bodies, roads, and rock formations. Notable changes are observed in the transition from vegetation to built-up areas, which is predominant in the southern region of the watershed and evident as urban growth and infrastructure developments. The color-coded legend provides a detailed classification of the transitions, demonstrating the dynamic nature of the land cover of the area over the five years. The analysis underscores the dynamic nature of land cover within the watershed and emphasizes the importance of monitoring and managing these changes for sustainable resource planning and environmental conservation efforts.
Table 5 quantitatively summarizes the area (in square kilometers) of various land-use and land-cover (LULC) categories that have changed between 2017 and 2022 in the Wadi Ham watershed. While the total area of the watershed has remained constant at 244.309 square kilometers over the years, significant shifts in LULC classes are observed. The rows represent the initial LULC categories in 2017, while the columns indicate the LULC categories in 2022. The diagonal of the table represents areas of LULC classes that remained unchanged over the five years. These data provide a comprehensive view of the transformation of different land cover types over the five years. The area of water bodies in Wadi Ham has decreased from approximately 0.243 square kilometers in 2017 to 0.060 square kilometers in 2022. This decline can be attributed to several factors, including the implementation of more efficient water management practices, decreased rainfall or prolonged droughts, and the construction of infrastructure such as dams and reservoirs. Additionally, increased urbanization and land-use changes, climate change affecting precipitation patterns and evaporation rates, and excessive groundwater extraction have all likely contributed to the reduction in surface water availability. There has been a substantial decrease in vegetation cover, dropping from 3.371 square kilometers in 2017 to 1.557 square kilometers in 2022. This reduction is likely due to urban expansion, agricultural development, or deforestation activities. The area of barren land decreased from 12.350 square kilometers in 2017 to 8.324 square kilometers in 2022. This decrease suggests that previously barren areas have been repurposed for other land uses, such as built-up areas or agricultural land. The built-up area has seen a notable increase, expanding from 3.371 square kilometers in 2017 to 6.227 square kilometers in 2022. This growth reflects the rapid urbanization and infrastructural development occurring in the region. The change detection analysis highlights significant land-cover transitions, such as the conversion of barren land to built-up areas. These shifts underscore the dynamic nature of the Wadi Ham watershed’s landscape and the need for strategic urban planning and sustainable land management practices. Understanding these changes is crucial for addressing environmental challenges, managing natural resources, and planning for future development in the region.

4.4. Hydrological Simulation of LULC Changes

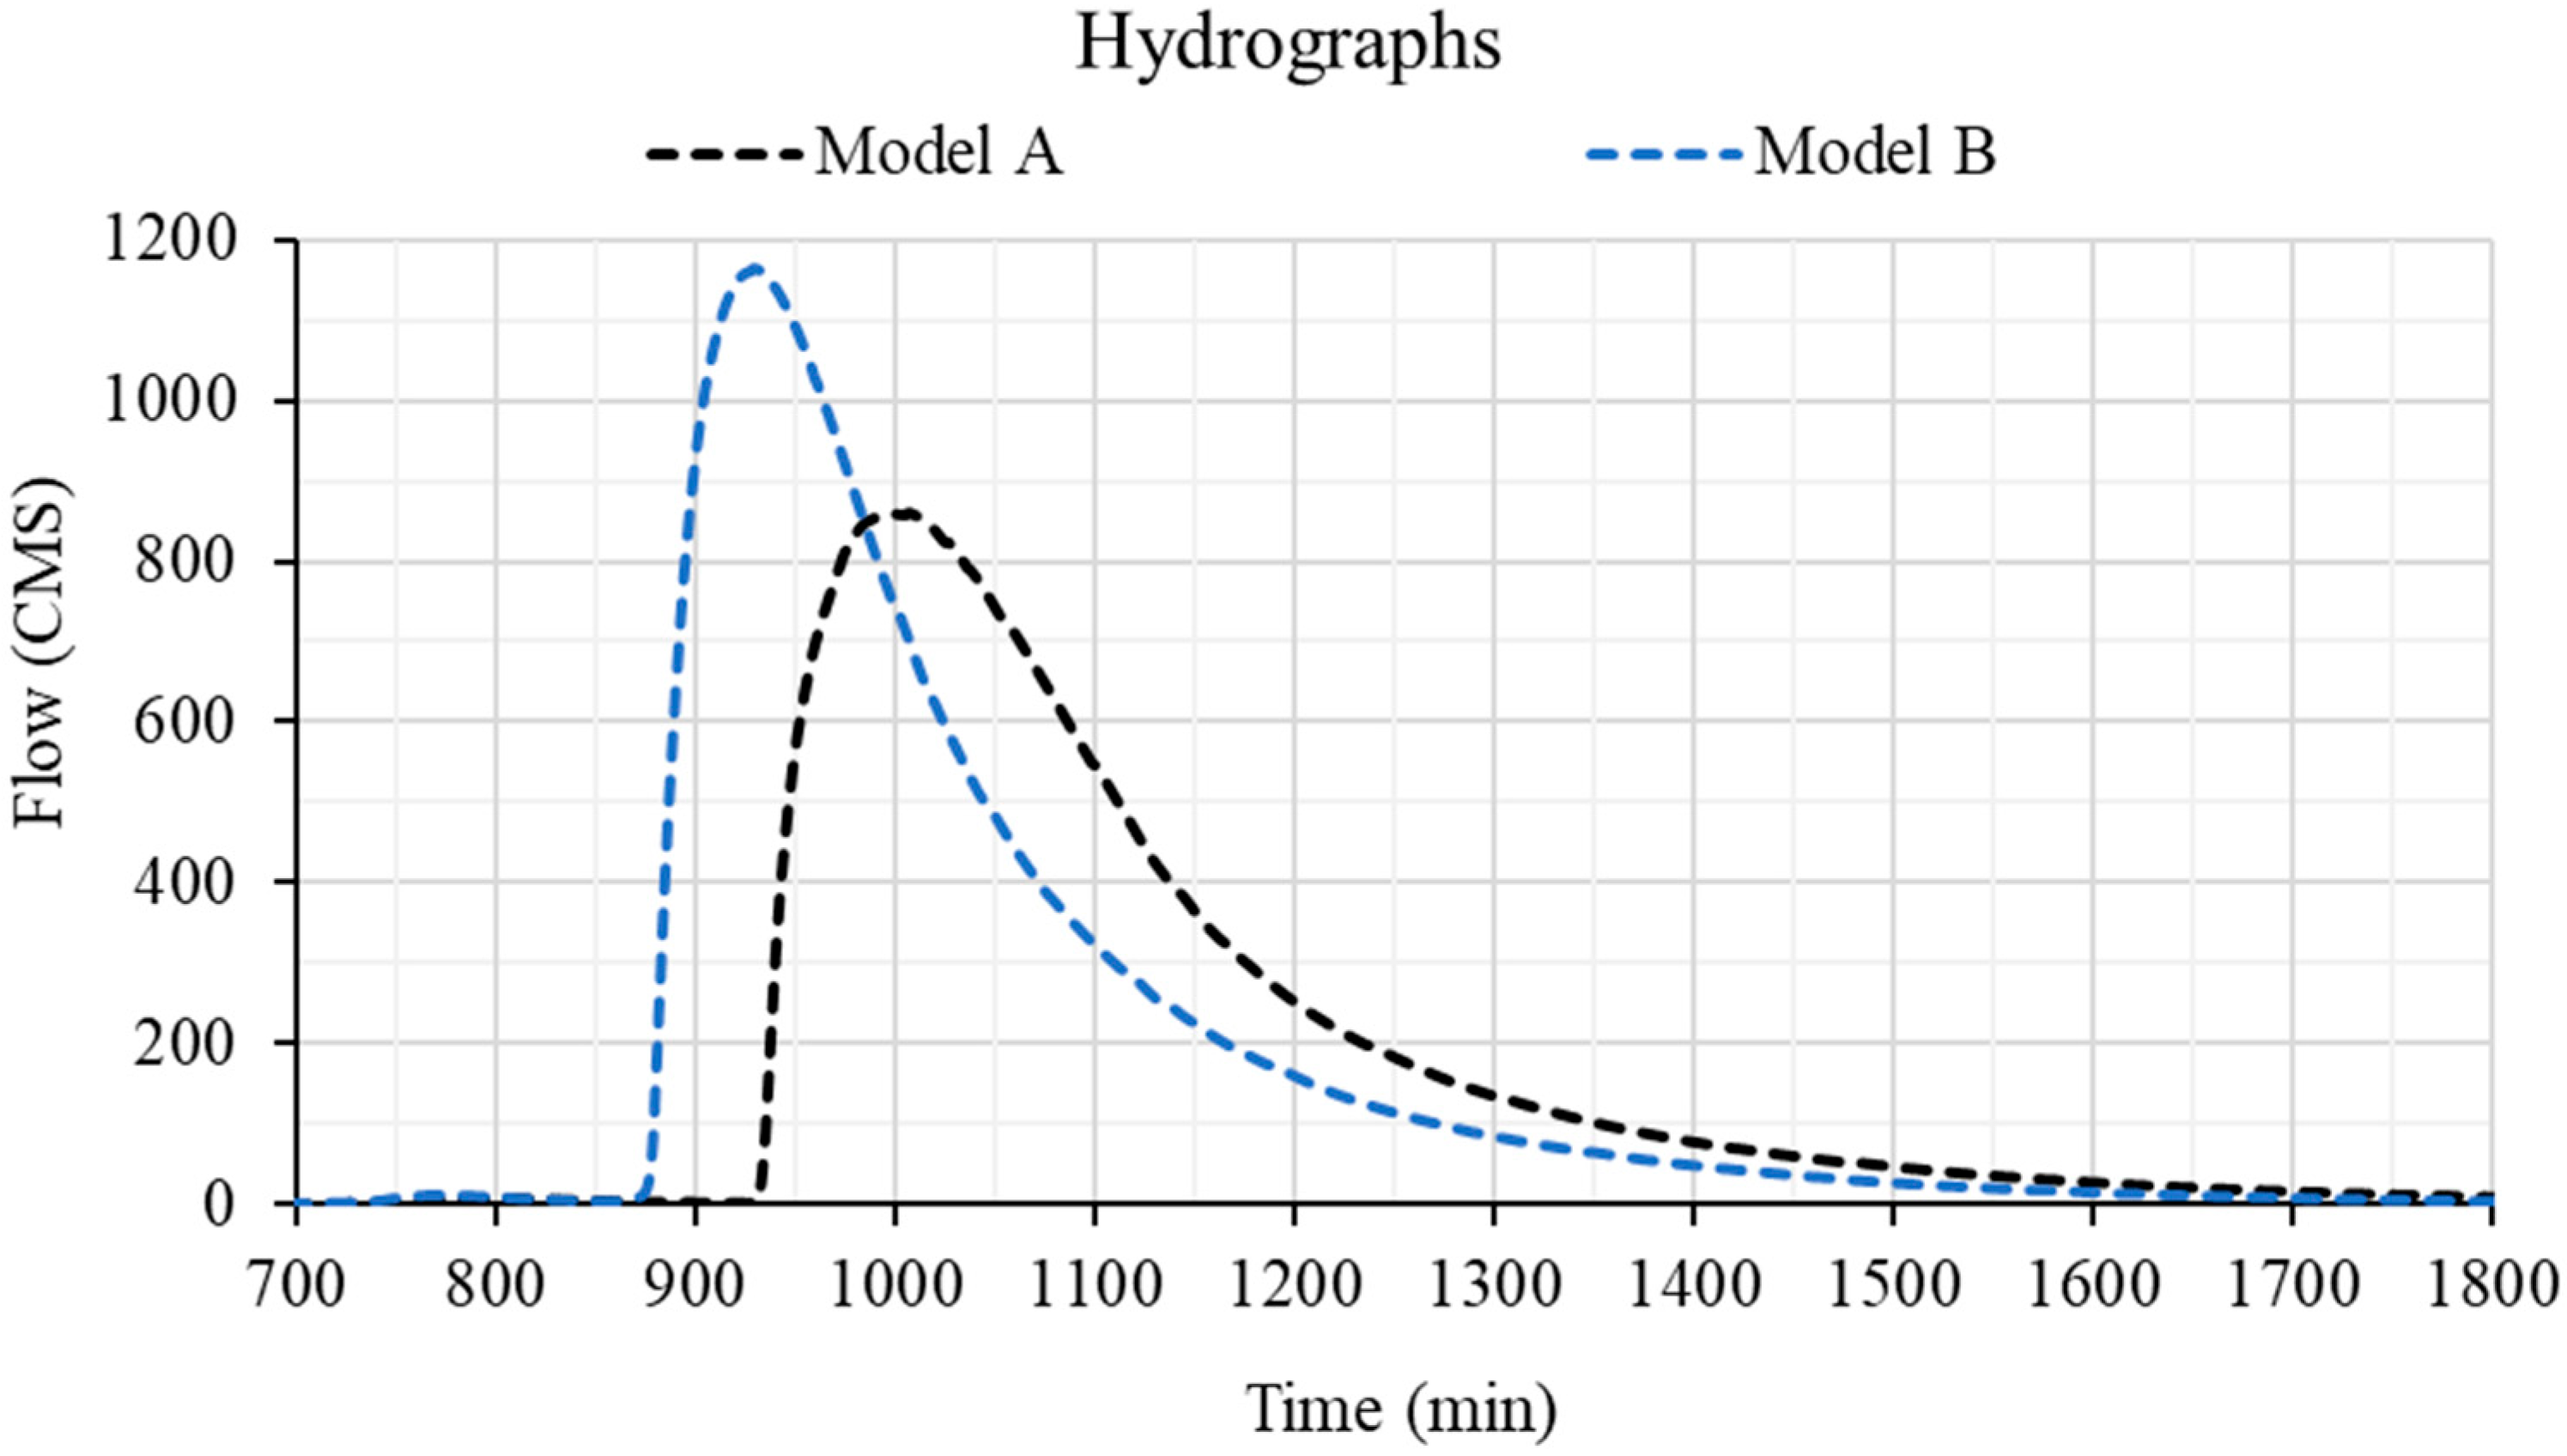
The GSSHA model simulations indicate varying hydrological responses due to LULC changes. The results illustrate increased runoff and altered flood patterns in areas with significant LULC transformations. Figure 16 shows the hydrographs obtained from the two simulations, which highlight the differences in peak flow and the timing of the peak.
In Figure 16, the hydrographs at the outlet provide a visualization of how temporal changes in LULC affect hydrological responses in the Wadi Ham watershed. The Hydrograph of Model A represents the LULC conditions in 2017 (before urbanization), and the hydrograph of Model B represents the LULC conditions in 2022 (after urbanization). The following differences can be observed when examining the hydrographs:
  • The peak flow in 2022 is significantly higher at approximately 1160 CMS compared to 860 CMS in 2017. This increase is indicative of reduced infiltration and higher surface runoff due to urbanization and the proliferation of impervious surfaces;
  • Considering the timing of peak flow, the peak flow in 2022 occurred earlier, at around 930 min, compared to around 1000 min in 2017. This shift suggests quicker runoff and reduced lag time, characteristic of urbanized areas where stormwater is rapidly channeled into drainage systems;
  • The recession limb of the hydrograph in 2022 is steeper compared to 2017. The more gradual recession limb in 2017 suggests a landscape with higher water-retention capacity, likely due to vegetation and pervious surfaces. In contrast, the steeper recession limb in 2022 indicates quicker runoff, reduced infiltration, and faster drainage, all typical of urbanized areas with smoother surfaces;
  • The initial loss refers to the initial abstraction of rainfall by interception, infiltration, and surface storage. The initial loss in 2017 is higher, indicating more opportunities for water to be absorbed or stored initially, leading to slower runoff. The presence of vegetation and other pervious surfaces contributes to higher initial losses, enhancing the watershed’s ability to intercept and infiltrate rainfall. Conversely, the lower initial losses in 2022 indicate more impervious surfaces. Urbanization reduces the ability of the landscape to absorb and store water initially, leading to quicker and higher runoff. Reduced surface roughness due to urban development results in smoother surfaces and faster runoff, contributing to the observed higher peak flow and steeper recession limb.
The differences in hydrographs between 2017 and 2022 highlight the impact of urbanization on watershed hydrology. Understanding these changes is crucial for flood management, as urbanization leads to increased runoff and flood risks, emphasizing the need for strategic urban planning and sustainable infrastructure development practices to mitigate flood risks.
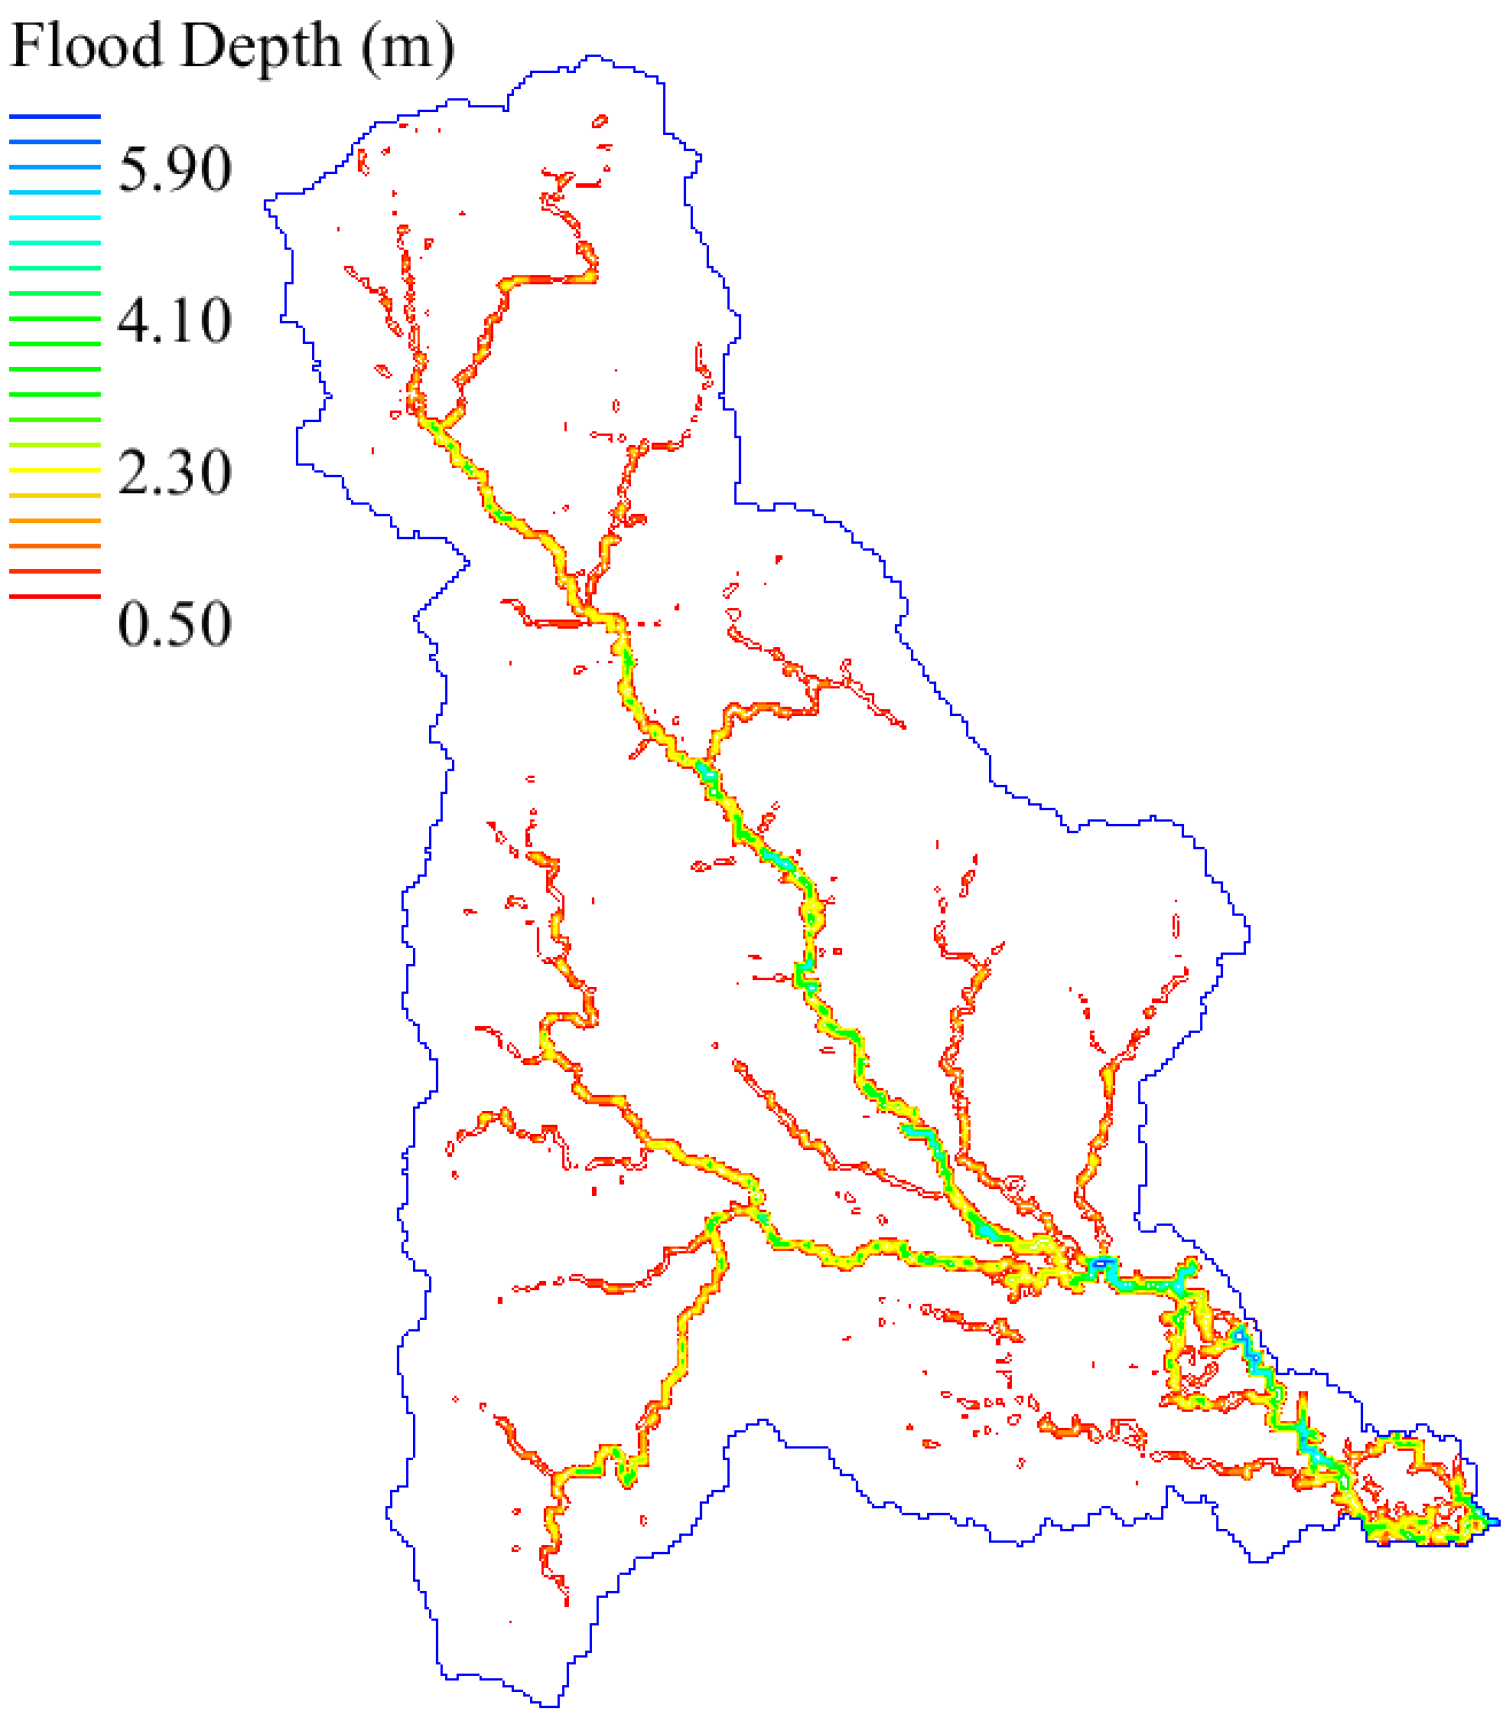
The temporal variations in watershed hydraulic responses to LULC changes are further illustrated using flood grid outputs from GSSHA model simulations for 2017 (Figure 17) and 2022 (Figure 18). The flood grid outputs from the GSSHA model simulations for the Wadi Ham watershed illustrate the flood extents and depths for the years 2017 and 2022. The color gradient represents the flood depths, with blue indicating the highest depths and red the lowest. In 2017, the flood extents and depths were relatively lower compared to 2022. This difference is evident from the greater area covered by higher flood depths (blue and green shades) in 2022, indicating an increase in flooding severity. The changes in flood patterns and their extent between the two years highlight the impact of urbanization and land-use changes in the watershed.

5. Discussion

This study highlights the utility of newly accessible satellite imagery like PlanetScope (PS) in generating accurate and realistic land-use/land-cover (LULC) maps. The findings from the present study align with S. Archaki’s (2022) [16] work in Morocco, where PlanetScope imagery, combined with the random forest (RF) classifier, yielded high map accuracies. By applying these methods to the arid environments of the Wadi Ham watershed in Fujairah, UAE, the robustness of RF as a machine-learning classifier was confirmed, particularly in handling complex spectral data and diverse land-cover types. This result is consistent with other studies emphasizing RF’s performance, particularly in challenging environments.
The findings underscore the critical role of LULC map accuracy in hydrological modeling. The varying resolutions of LULC data directly impacted model outputs, including peak discharge, time to peak, and runoff volume. This reinforces findings by Viana et al. (2019) [3], who highlighted the enhancement of LULC classification accuracy through high-resolution imagery, which subsequently improves hydrological modeling, especially in rural settings. Similarly, the need for accurate LULC data for reliable flood prediction in arid regions, as noted by Ngondo et al. (2019) [4], aligns with the results of the present study’s. The study further emphasizes the importance of detailed temporal LULC data for effective flood management, which is crucial for addressing climate change impacts.
Temporal LULC changes significantly impact hydrological responses, particularly in rapidly urbanizing areas. The comparison of 2017 and 2022 hydrographs in this study illustrates how urbanization, through the expansion of impervious surfaces, increases peak flow and alters flood patterns. These findings parallel those of Twisa and Buchroithner (2019) [5], who observed similar impacts of urbanization on hydrological dynamics in Tanzania.
This study contributes to the growing literature emphasizing high-resolution, region-specific LULC data’s importance for hydrological models. The focus on arid environments, characterized by sparse vegetation and complex soil conditions, demonstrates the need for precise LULC representations. Previous research on the GSSHA model’s capability to incorporate a wide range of hydrological processes, such as overland flow, infiltration, groundwater interactions, and channel routing, into a unified framework has proven invaluable, as demonstrated in urban watershed studies by Downer and Ogden (2002) [24]. The study by Sharif et al. (2004) [25] demonstrated the effectiveness of the GSSHA model in accurately simulating urban flood events by capturing spatial variability in rainfall and land use. The study highlighted the model’s value in flood prediction and its relevance for urbanized watersheds, aligning with the objectives of this research. Additionally, research by Tesfaye et al. (2023) [6] on the Muger watershed, Upper Blue Nile River Basin, Ethiopia, also highlighted the significant impact of land-cover changes on watershed hydrology, with implications for surface runoff, sediment yield, and water availability.
The practical implications of these findings are substantial. Accurate LULC mapping is essential for effective flood management and urban planning. Integrating advanced modeling techniques from this study into drainage infrastructure design is particularly crucial in regions vulnerable to extreme climate change effects. Recent extreme weather events, such as the record rainfall in Al Ain city in 2024, further emphasize the need for precise LULC data to inform infrastructure planning and disaster preparedness. The methodology adopted in this study, comparing the impact of pre-and post-urbanization scenarios, offers a robust basis for identifying the hydrological responses to relative LULC changes.
This study does, however, have certain limitations. The absence of ground-truth data for model calibration presents challenges for advancing hydrological research. Nevertheless, the focus on analyzing relative changes in place of absolute values in runoff patterns provides valuable insights into the impacts of LULC dynamics despite the absence of direct calibration. Although unconventional, this methodology is justified by the consistent patterns observed in the input data and the significant hydrological insights garnered, particularly regarding urbanization effects. While calibration and validation are emphasized in hydrological studies to ensure accuracy, analyzing relative changes in contexts where specific calibration data are lacking can still yield valuable insights, highlighting potential trends and the impacts of urbanization on watershed hydrology.
Future research should incorporate emerging data sources for model calibration and validation, refining the hydrological model’s predictive accuracy. Such efforts would not only confirm the authors’ inferred impacts but also refine the predictive accuracy of hydrological models under similar constraints. Future research should build on these findings into hydraulic modeling of watersheds prone to flash floods in humid environmental settings using the Gridded Surface Subsurface Hydrologic Analysis (GSSHA) model within the Watershed Modeling System (WMS). The comprehensive groundwater—surface water interaction capability of GSSHA enables basin modeling in diverse environments. Additionally, further research should consider developing soil-cover maps tailored to specific study areas, particularly in arid regions, to further improve modeling accuracy and support sustainable water resource management.

6. Conclusions

In conclusion, this study demonstrates the potential of the random forest (RF) classifier and PlanetScope data in producing precise LULC maps essential for watershed hydrology analysis. The findings highlight that generalized LULC maps may not capture the nuanced variations in land cover present in arid regions. The significant discrepancies in hydrological parameters observed among different LULC maps underscore the critical need for locally specific and high-resolution data to ensure accurate hydrological modeling in these environments. Additionally, this study highlights the critical role of temporal LULC changes in influencing watershed hydrological responses. Such insights are vital for effective flood management and mitigation strategies, supporting UAE’s 2030 vision for resilient communities and aligning with UN Sustainability Goals 11 (Sustainable Cities and Communities) and 13 (Climate Action).
Future work should reinforce the use of relative comparisons like “change detection” in hydrological modeling when ground-truth data are unavailable. Expanding on this study, research could explore hydraulic modeling in humid environments using the GSSHA model, leveraging its groundwater–surface water interaction capabilities. Additionally, developing soil-cover maps specific to arid regions would improve modeling accuracy and support sustainable water management. Integrating these advanced techniques into infrastructure design is crucial for regions facing extreme climate change effects.

Author Contributions

Conceptualization, M.A.H. and G.H.; methodology, M.A.H., G.H., C.A. and M.E.; software, C.A., G.H. and M.E.; validation, G.H. and C.A.; formal analysis, C.A. and M.E.; investigation, C.A. and M.E.; resources, M.A.H.; data curation, C.A. and M.E.; writing—original draft preparation, C.A.; writing—review and editing, M.A.H., G.H. and M.E.; visualization, C.A. and M.E.; supervision, M.A.H. and G.H.; project administration, M.A.H.; funding acquisition, M.A.H. All authors have read and agreed to the published version of the manuscript.

Funding

No funding was provided for this study.

Data Availability Statement

The raw data supporting the conclusions of this article will be made available by the authors on request.

Acknowledgments

The authors gratefully acknowledge Planet Labs for providing technical support and granting access to PlanetScope imagery and express appreciation to the European Space Agency (ESA) for the Sentinel-2 data.

Conflicts of Interest

The authors declare no conflicts of interest.

References

  1. Wu, Y.; Li, S.; Yu, S. Monitoring urban expansion and its effects on land use and land cover changes in Guangzhou city, China. Environ. Monit. Assess. 2016, 188, 54. [Google Scholar] [CrossRef] [PubMed]
  2. Yin, J.; Yin, Z.; Zhong, H.; Xu, S.; Hu, X.; Wang, J.; Wu, J. Monitoring urban expansion and land use/land cover changes of Shanghai metropolitan area during the transitional economy (1979–2009) in China. Environ. Monit. Assess. 2011, 177, 609–621. [Google Scholar] [CrossRef] [PubMed]
  3. Viana, C.M.; Girão, I.; Rocha, J. Long-term satellite image time-series for land use/land cover change detection using refined open source data in a rural region. Remote. Sens. 2019, 11, 1104. [Google Scholar] [CrossRef]
  4. Ngondo, J.; Mango, J.; Liu, R.; Nobert, J.; Dubi, A.; Cheng, H. Land-use and land-cover (Lulc) change detection and the implications for coastal water resource management in the wami–ruvu basin, tanzania. Sustainability 2021, 13, 4092. [Google Scholar] [CrossRef]
  5. Twisa, S.; Buchroithner, M.F. Land-use and land-cover (LULC) change detection in Wami river basin, Tanzania. Land 2019, 8, 136. [Google Scholar] [CrossRef]
  6. Teshome, D.S.; Leta, M.K.; Taddese, H.; Moshe, A.; Tolessa, T.; Ayele, G.T.; You, S. Watershed Hydrological Responses to Land Cover Changes at Muger Watershed, Upper Blue Nile River Basin, Ethiopia. Water 2023, 15, 2533. [Google Scholar] [CrossRef]
  7. Hinge, G.; Hamouda, M.A.; Mohamed, M.M. Flash Flood Susceptibility Modelling Using Soft Computing-Based Approaches: From Bibliometric to Meta-Data Analysis and Future Research Directions. Water 2024, 16, 173. [Google Scholar] [CrossRef]
  8. Hu, S.; Fan, Y.; Zhang, T. Assessing the effect of land use change on surface runoff in a rapidly Urbanized City: A case study of the central area of Beijing. Land 2020, 9, 17. [Google Scholar] [CrossRef]
  9. Du, J.; Cheng, L.; Zhang, Q.; Yang, Y.; Xu, W. Different Flooding Behaviors Due to Varied Urbanization Levels within River Basin: A Case Study from the Xiang River Basin, China. Int. J. Disaster Risk Sci. 2019, 10, 89–102. [Google Scholar] [CrossRef]
  10. Kabeja, C.; Li, R.; Guo, J.; Rwatangabo, D.E.R.; Manyifika, M.; Gao, Z.; Wang, Y.; Zhang, Y. The impact of reforestation induced land cover change (1990–2017) on flood peak discharge using HEC-HMS hydrological model and satellite observations: A study in two mountain Basins, China. Water 2020, 12, 1347. [Google Scholar] [CrossRef]
  11. Hussein, K.; Alkaabi, K.; Ghebreyesus, D.; Liaqat, M.U.; Sharif, H.O. Land use/land cover change along the Eastern Coast of the UAE and its impact on flooding risk. Geomatics Nat. Hazards Risk 2020, 11, 112–130. [Google Scholar] [CrossRef]
  12. Hamouda, M.A.; Hinge, G.; Yemane, H.S.; Al Mosteka, H.; Makki, M.; Mohamed, M.M. Reliability of GPM IMERG Satellite Precipitation Data for Modelling Flash Flood Events in Selected Watersheds in the UAE. Remote Sens. 2023, 15, 3991. [Google Scholar] [CrossRef]
  13. Subraelu, P.; Ahmed, A.; Ebraheem, A.A.; Sherif, M.; Mirza, S.B.; Ridouane, F.L.; Sefelnasr, A. Risk Assessment and Mapping of Flash Flood Vulnerable Zones in Arid Region, Fujairah City, UAE-Using Remote Sensing and GIS-Based Analysis. Water 2023, 15, 2802. [Google Scholar] [CrossRef]
  14. AlAli, A.M.; Salih, A.; Hassaballa, A. Geospatial-Based Analytical Hierarchy Process (AHP) and Weighted Product Model (WPM) Techniques for Mapping and Assessing Flood Susceptibility in the Wadi Hanifah Drainage Basin, Riyadh Region, Saudi Arabia. Water 2023, 15, 1943. [Google Scholar] [CrossRef]
  15. Soliman, M.; Morsy, M.M.; Radwan, H.G. Assessment of Implementing Land Use/Land Cover LULC 2020-ESRI Global Maps in 2D Flood Modeling Application. Water 2022, 14, 3963. [Google Scholar] [CrossRef]
  16. Acharki, S. PlanetScope contributions compared to Sentinel-2, and Landsat-8 for LULC mapping. Remote. Sens. Appl. Soc. Environ. 2022, 27, 100774. [Google Scholar] [CrossRef]
  17. Andrade, J.; Cunha, J.; Silva, J.; Rufino, I.; Galvão, C. Evaluating single and multi-date Landsat classifications of land-cover in a seasonally dry tropical forest. Remote. Sens. Appl. Soc. Environ. 2021, 22, 100515. [Google Scholar] [CrossRef]
  18. Ghayour, L.; Neshat, A.; Paryani, S.; Shahabi, H.; Shirzadi, A.; Chen, W.; Al-Ansari, N.; Geertsema, M.; Amiri, M.P.; Gholamnia, M.; et al. Performance evaluation of sentinel-2 and landsat 8 OLI data for land cover/use classification using a comparison between machine learning algorithms. Remote. Sens. 2021, 13, 1349. [Google Scholar] [CrossRef]
  19. Talukdar, S.; Singha, P.; Mahato, S.; Shahfahad; Pal, S.; Liou, Y.-A.; Rahman, A. Land-use land-cover classification by machine learning classifiers for satellite observations—A review. Remote. Sens. 2020, 12, 1135. [Google Scholar] [CrossRef]
  20. Shanableh, A.; Al-Ruzouq, R.; Siddique, M.; Merabtene, T.; Yilmaz, A.; Imteaz, M. Impact of urban expansion on potential flooding, storage and water harvesting in the city of Sharjah, United Arab Emirates. MATEC Web Conf. 2017, 120, 09007. [Google Scholar] [CrossRef]
  21. Zoccatelli, D.; Marra, F.; Smith, J.; Goodrich, D.; Unkrich, C.; Rosensaft, M.; Morin, E. Hydrological modelling in desert areas of the eastern Mediterranean. J. Hydrol. 2020, 587, 124879. [Google Scholar] [CrossRef]
  22. Downer, C.W.; James, W.; Byrd, A. Gridded Surface Subsurface Hydrologic Analysis (GSSHA) Model Simulation of Hydrologic Conditions and Restoration Scenarios for the Judicial Ditch 31 Watershed, Minnesota. 2002. Available online: https://www.researchgate.net/publication/235185527 (accessed on 29 June 2024).
  23. Fattahi, A.M.; Hosseini, K.; Farzin, S.; Mousavi, S.-F. An innovative approach of GSSHA model in flood analysis of large watersheds based on accuracy of DEM, size of grids, and stream density. Appl. Water Sci. 2023, 13, 33. [Google Scholar] [CrossRef]
  24. Downer, C.W.; Ogden, F.L. GSSHA: Model To Simulate Diverse Stream Flow Producing Processes. J. Hydrol. Eng. 2004, 9, 161–174. [Google Scholar] [CrossRef]
  25. Sharif, H.O.; Sparks, L.; Hassan, A.A.; Zeitler, J.; Xie, H. Application of a Distributed Hydrologic Model to the November 17, 2004, Flood of Bull Creek Watershed, Austin, Texas. J. Hydrol. Eng. 2004, 15, 651–657. [Google Scholar] [CrossRef]
  26. Drusch, M.; Del Bello, U.; Carlier, S.; Colin, O.; Fernandez, V.; Gascon, F.; Hoersch, B.; Isola, C.; Laberinti, P.; Martimort, P.; et al. Sentinel-2: ESA’s Optical High-Resolution Mission for GMES Operational Services. Remote Sens. Environ. 2012, 120, 25–36. [Google Scholar] [CrossRef]
  27. Copernicus Open Access Hub. Open Access Hub. Available online: https://www.copernicus.eu/en (accessed on 29 June 2024).
  28. Adam, E.; Mutanga, O.; Odindi, J.; Abdel-Rahman, E.M. Land-use/cover classification in a heterogeneous coastal landscape using RapidEye imagery: Evaluating the performance of random forest and support vector machines classifiers. Int. J. Remote. Sens. 2014, 35, 3440–3458. [Google Scholar] [CrossRef]
  29. Norovsuren, B.; Tseveen, B.; Batomunkuev, V.; Renchin, T.; Natsagdorj, E.; Yangiv, A.; Mart, Z. Land cover classification using maximum likelihood method (2000 and 2019) at Khandgait valley in Mongolia. IOP Conf. Series Earth Environ. Sci. 2019, 381, 012054. [Google Scholar] [CrossRef]
  30. Te Chow, V. Chow’s Open-Channel Hydraulics; McGraw-Hill: New York, NY, USA, 1959; ISBN 07-010776-9. [Google Scholar]
  31. Sadeh, Y.; Cohen, H.; Maman, S.; Blumberg, D.G. Evaluation of manning’s n roughness coefficient in arid environments by using SAR backscatter. Remote Sens. 2018, 10, 1505. [Google Scholar] [CrossRef]
  32. Adams, K.D.; Negrini, R.M.; Cook, E.R.; Rajagopal, S. Annually resolved late Holocene paleohydrology of the southern Sierra Nevada and Tulare Lake, California. Water Resour. Res. 2015, 51, 9708–9724. [Google Scholar] [CrossRef]
  33. Arcement, G.J.; Schneider, V.R. Guide for Selecting Manning’s Roughness Coefficients for Natural Channels and Flood Plains; US Geological Survey: Denver, CO, USA, 1989. [Google Scholar] [CrossRef]
  34. Sherif, M.; Akram, S.; Shetty, A. Rainfall Analysis for the Northern Wadis of United Arab Emirates: A Case Study. J. Hydrol. Eng. 2009, 14, 535–544. [Google Scholar] [CrossRef]
  35. Al Abdouli, K.; Hussein, K.; Ghebreyesus, D.; Sharif, H.O. Coastal runoff in the United Arab Emirates—The hazard and opportunity. Sustainability 2019, 11, 5406. [Google Scholar] [CrossRef]
  36. Kalyanapu, A.J.; Burian, S.J.; Mcpherson, T.N. Effect of land use-based surface roughness on hydrologic model output. J. Spat. Hydrol. 2009, 9, 2. [Google Scholar]
Figure 1. The study area, Wadi Ham watershed in Fujairah, northeastern UAE.
Water 16 02356 g001
Figure 2. Methodological Framework.
Water 16 02356 g002
Figure 3. Methodological Flow Diagram for WMS GSSHA Modeling Process.
Water 16 02356 g003
Figure 4. The precipitation hyetograph for the rainfall event input for the GSSHA model.
Water 16 02356 g004
Figure 5. The digital elevation model for Wadi Ham watershed.
Water 16 02356 g005
Figure 6. Soil cover for Wadi Ham watershed.
Water 16 02356 g006
Figure 7. LULC data for accuracy simulation: (A) LULC map from PlanetScope Imagery (30 June 2022) RF-Classification (97% accuracy); (B) LULC Map: Sentinel-2 Imagery (22 June 2022); (C) LULC map from ESA Data User Element. ML-Classification (85% accuracy); (D) ESRI downloaded LULC map.
Water 16 02356 g007aWater 16 02356 g007b
Figure 8. LULC maps for change detection: (A) LULC map for 2022: PlanetScope Imagery_8-Band (30 June 2022) RF-Classification (97% accuracy); (B) LULC map for 2017: PlanetScope Imagery_4-Band (20 December 2017) RF-Classification (96% accuracy).
Water 16 02356 g008
Figure 9. Land-use and land-cover (LULC) map of the Wadi Ham watershed generated using maximum likelihood classification on Sentinel-2 imagery from 22 June 2022. The overall classification accuracy is 85.73%.
Water 16 02356 g009
Figure 10. Land-use and land-cover (LULC) map of the Wadi Ham watershed generated using random forest classification on Sentinel-2 imagery from 5 December 2017. The overall classification accuracy is 93.33%.
Water 16 02356 g010
Figure 11. Land-use and land-cover (LULC) map of the Wadi Ham watershed generated using random forest classification on PlanetScope 4-Band imagery from 20 December 2017. The overall classification accuracy is 96.49%.
Water 16 02356 g011
Figure 12. Land-use and land-cover (LULC) map of the Wadi Ham watershed generated using random forest classification on PlanetScope 8-Band imagery from 30 December 2022. The overall classification accuracy is 97.27%.
Water 16 02356 g012
Figure 13. Hydrographs for different LULC Scenarios in the Wadi Ham watershed: Hydrograph Water 16 02356 i017: PS-RF classification (97% accuracy); Water 16 02356 i018: LULC from ESA Data User Element; Water 16 02356 i019: Sentinel-2 ML classification (85% accuracy); Water 16 02356 i020: ESRI downloaded LULC Map.
Water 16 02356 g013
Figure 14. Change Detection of Wadi Ham Watershed (2017–2022).
Water 16 02356 g014
Figure 15. Transformation in Wadi Ham Watershed (2017–2022).
Water 16 02356 g015
Figure 16. Hydrographs showing the flow over time for 2017 and 2022 in Wadi Ham watershed.
Water 16 02356 g016
Figure 17. Flood Grid Output for Wadi Ham Watershed (2017).
Water 16 02356 g017
Figure 18. Flood Grid Output for Wadi Ham Watershed (2022).
Water 16 02356 g018
Table 1. Datasets used for LULC classification.
CharacteristicsPlanetScope (8-Band)Sentinel-2
Bandwidth in nm
(visible and NIR)
Coastal blue: 431–452;
Blue: 465–515;
Green: 513–549;
Green: 547–583;
Yellow: 600–620;
Red: 650–680;
Red-Edge: 697–713;
NIR: 845–885
Blue: 458–523;
Green: 543–578;
Red: 650–680;
Red-Edge (RE1): 698–713;
Red-Edge (RE2): 733–748;
Red-Edge (RE3): 773–793;
NIR: 785–899;
SWIR1: 1565–1655;
SWIR2: 2100–2280
Table 2. Soil Parameters for Wadi Ham, Fujairah, UAE.
ParameterLoamLoamy Sand
Hydraulic Conductivity (mm/h)1040
Wilting Point (%)158
Field Capacity (%)3014
Initial Moisture (%)158
Capillary Head (cm)8.97
Porosity0.430.41
Pore Distribution Index0.40.6
Residual Saturation0.0780.057
Table 3. Manning’s Roughness Coefficients, Impervious Surface, and Initial Losses for LULC Classes.
LULC ClassLULC NameManning’s Roughness Coefficient (n)Impervious Surface (%)Initial Losses (mm)
10Built-up0.15805
20Rock0.0552
30Barren Land0.0401
40Shrubs0.11103
50Vegetation0.1852
60Water Bodies0.0351000
70Roads0.03906
Table 4. Accuracies of the classifications in the LULC maps.
ClassificationOverall Accuracy [%]Image Acquisition Date
Sentinel-2 imagery
Maximum Likelihood85.7322 June 2022
Random Forest93.335 December 2017
PlanetScope 4-Band imagery
Random Forest96.4920 December 2017
PlanetScope 8-Band imagery
Random Forest97.2730 June 2022
Table 5. Change Detection Table—Wadi Ham.
2017
Water 16 02356 i001
Built-Up
Water 16 02356 i002
Rock
Water 16 02356 i003
Barren Land
Water 16 02356 i004
Shrubs
Water 16 02356 i005
Vegetation
Water 16 02356 i006
Water Bodies
Water 16 02356 i007
Roads
Water 16 02356 i008
Total Area in 2022
(Sq. km)
Water 16 02356 i009 2022
Built-up
Water 16 02356 i010
1.2781.8200.5720.9190.0610.0211.5566.227
Rock
Water 16 02356 i011
0.368149.6484.4693.1520.5900.0342.728160.989
Barren Land
Water 16 02356 i012
0.5683.4691.8351.5040.1850.0690.6948.324
Shrubs
Water 16 02356 i013
1.18727.9054.6248.5351.2900.1027.57951.222
Vegetation
Water 16 02356 i014
0.0030.0420.1160.2921.1020.00030.0021.557
Water Bodies
Water 16 02356 i015
0.000060.0490.00040.00340.00100.00650.060
Roads
Water 16 02356 i016
0.23010.748570.733411.201830.1420.01672.85815.930
Total Area in 2017
(Sq. km)
3.634193.68112.35015.6063.3710.24315.424244.309
Disclaimer/Publisher’s Note: The statements, opinions and data contained in all publications are solely those of the individual author(s) and contributor(s) and not of MDPI and/or the editor(s). MDPI and/or the editor(s) disclaim responsibility for any injury to people or property resulting from any ideas, methods, instructions or products referred to in the content.