1. Introduction
Flash flood is one of the most laborious challenges, particularly in urban regions. This kind of natural disaster gives the last ultimatum for governments to tackle the negative impact of climate change. Throughout the last few years, Japan has witnessed an increase in rainfall rate while many other countries, such as Pakistan, Afghanistan, and Saudi Arabia, have experienced unprecedented scale of flash floods [
1,
2,
3]. Yet this crisis has been leaving individuals with irreplaceable loss of lives and possessions.
In order to find a resilient mitigation strategy to flash floods, it is rather imperative to evaluate the buildings’ status quo in areas that suffer greater flood repercussion. While it is challenging to entirely avoid flood damage, the impacts of such disasters can be lessened to some extent through precise planning and preparation [
4]. Moreover, flood damage assessment (FDA) can be conducted to address this debacle at micro-, meso-, and macroscales [
5,
6]. The microscale targets the mitigation of dwelling-specific risks, and it highlights the multitude of features that are exposed to risk [
7], whilst mesoscale is used to analyze land divisions such as residential and commercial units. Likewise, the macroscale is intended for broader countrywide coverage, such as communities, and may be extended to nations [
8]. Microscale studies can address this crisis at its smallest scale; therefore, the resulting output can give more details about the flood damage in individual structures. Furthermore, gaining an understandable view of the suitable mitigation method for every single category in the community will be helpful. For this cause, this research adopted the microscale.
Integration of hydrological modeling and a geographic information system (GIS) has an explicit advantage. While the main role of hydrological modeling in some studies is about estimation of excess rainfall, the GIS is responsible for delineation of the terrain elevation to obtain the basins, subbasins, and accumulation flow.
The hydrodynamic models have been utilized very widely to simulate spatial runoff in urban areas [
9]. To alleviate the adverse effects of sudden and intense flooding, it is imperative to pinpoint the primary locations where runoff accumulates the most [
10]. However, most inundation models are incapable of adequately simulating floods in urban areas [
11]. Moreover, the hydrodynamic models show a greater benefit when the hydraulic properties of urban drainage systems, river channel systems, streets, and other microtopographies are taken into account, all of which have a significant impact on the urban flood process [
12], which is why significant changes in land use lead to disrupted geographical and temporal aspects of floods in urban areas [
13].
Furthermore, to provide reliable flood forecasting in complex urban areas, high-resolution numerical models are required to resolve complicated urban spatial characteristics, such as roads, traffic channels, and buildings, whereas the high computation complexity of entire hydrodynamic models has severely restricted their application to genuine flood modeling [
14]. In addition, HEC-RAS and MIKE 21 are among the software that are able to operate hydrological and hydraulic models that provide a unique physical process that takes flood formation and transit into account [
15].
From other perspectives, the evaluation of vulnerable areas to flooding is imperative. It has been investigated in Sinai Peninsula, Egypt, using morphometric factors to achieve some of the Sustainable Development Goals [
16,
17]. In addition, many measures aimed at mitigating the adverse effects of floods have undergone testing. One such approach was implemented by Julien et al. [
18], wherein a levee was employed along the Muda River in Malaysia. In this investigation, a HEC-RAS model was employed to ascertain the optimal height of the levee [
18]. Similarly, the utilization of HEC-RAS software has facilitated the creation of a simulation to model the flow of water in the Tigris River, located in Turkey. This simulation encompasses various flood recurrence scenarios, and the findings of the study have played a pivotal role in the restoration efforts aimed at rehabilitating the river [
19].
Regarding flash flood hazard assessment, it can be measured both qualitatively based on risk categories and quantitatively in the form of financial direct losses [
20]. In Japan, flooding area data have been accessible since 1993; nevertheless, no research has used these records to investigate the generation processes in urban pluvial flooding [
21]. In addition, many previous studies have estimated the hazard of flash floods through the use of classified hazard maps [
22,
23], whilst others have utilized both the external actions of flash floods as well as the buildings properties to estimate the physical vulnerability of each individual building [
7,
24]. Physical vulnerability is defined as the aggregate of the exposed components’ susceptibility to damage and the capacity of natural hazards to inflict harm [
25,
26]. There is no standardized way for assessing physical vulnerability due to the following factors [
27]: (a) the term’s complication and its extent, and the absence of a standard definition [
28]; (b) the limitations in estimating exposure to several natural disasters using the same methodologies [
29]; and (c) the components that determine vulnerability vary quantitatively and qualitatively in their nature [
30].
Using natural hazard characteristics, this research aims to construct a schematic approach to estimate the flash flood intensity for buildings. Furthermore, this study introduces a novel aspect by incorporating the flood duration factor into the assessment of FFI; this factor has been previously overlooked in determination of the FFI [
24,
31,
32]. The inclusion of flood duration is crucial as it accounts for the temporal aspect, specifically the duration of flooding around structures. Additionally, this research implements a mitigation approach along the river by leveling the riverbank and creating an artificial channel, aimed at mitigating the adverse impacts of flash floods on buildings. In addition, this study suggests using the artificial channel for ecosystem improvement. This approach will lead to averting monetary loss and fatalities during strong flooding.
2. Materials and Methods
2.1. Study Area Description
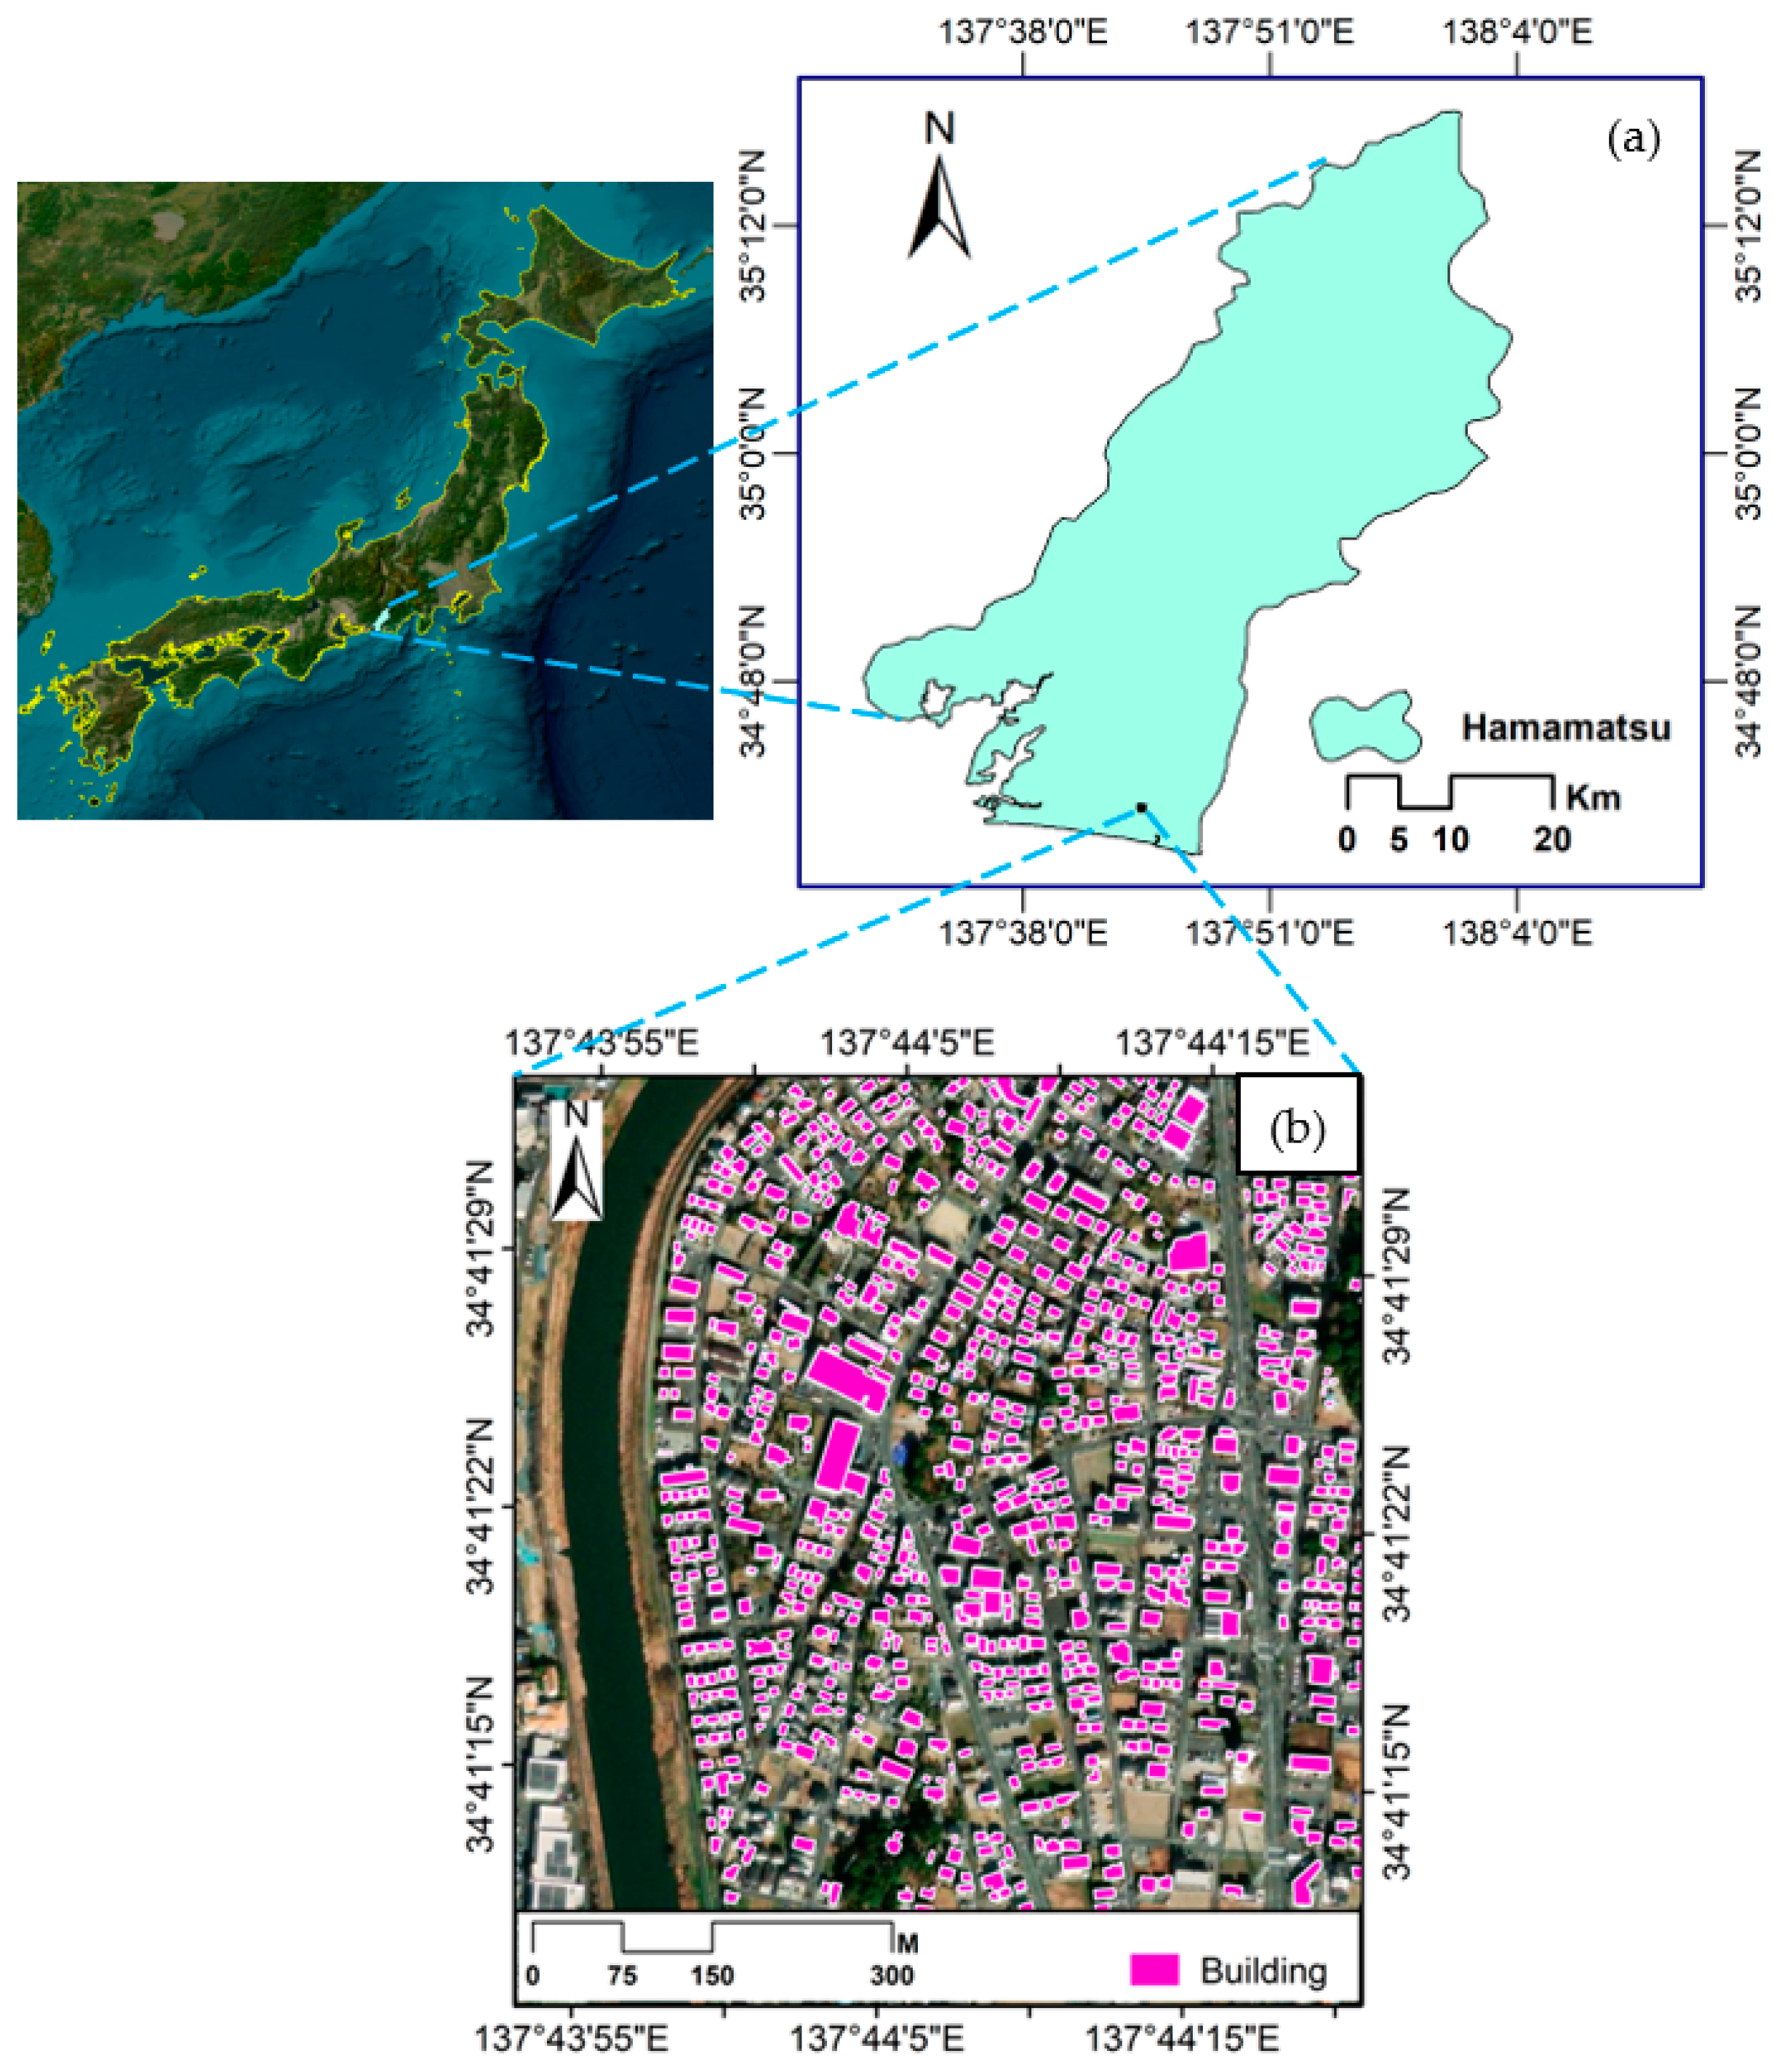
The adopted study area is a part of Hamamatsu city. This city situated in the southwest region of Shizuoka prefecture in central Honshu, Japan, along the Pacific Ocean shoreline adjacent to the Tenryū River estuary. It is located at approximately 30°00′00″ N and 137°45′00″ E. Its 305 km border circumscribes an area of about 1505 km
2. Hamamatsu experiences a humid continental climate characterized by warm summers and no distinct dry season. The average annual temperature in this district stands at 17.07 °C, which is 1.88% greater than Japan’s overall average. Hamamatsu usually receives around 106.49 mm of precipitation annually, spread over 111.75 rainy days, accounting for approximately 30.62% of the year [
33]. Furthermore, the city contains four major basins and the Pacific Ocean borders it along its southern side with an approximate length of 18 km.
Figure 1 illustrates the location of the study area.
On the other hand, the adopted study area takes a position in the far-south of the city. This area resembles one of the overcrowded regions in the Hamamatsu city in terms of building distribution. Likewise, this study has been conducted on 937 buildings; most of these structures are classified as residential buildings. Furthermore, the adopted buildings are located on one bank of the Magome River. This is a major river in the city and has length of about 26 km.
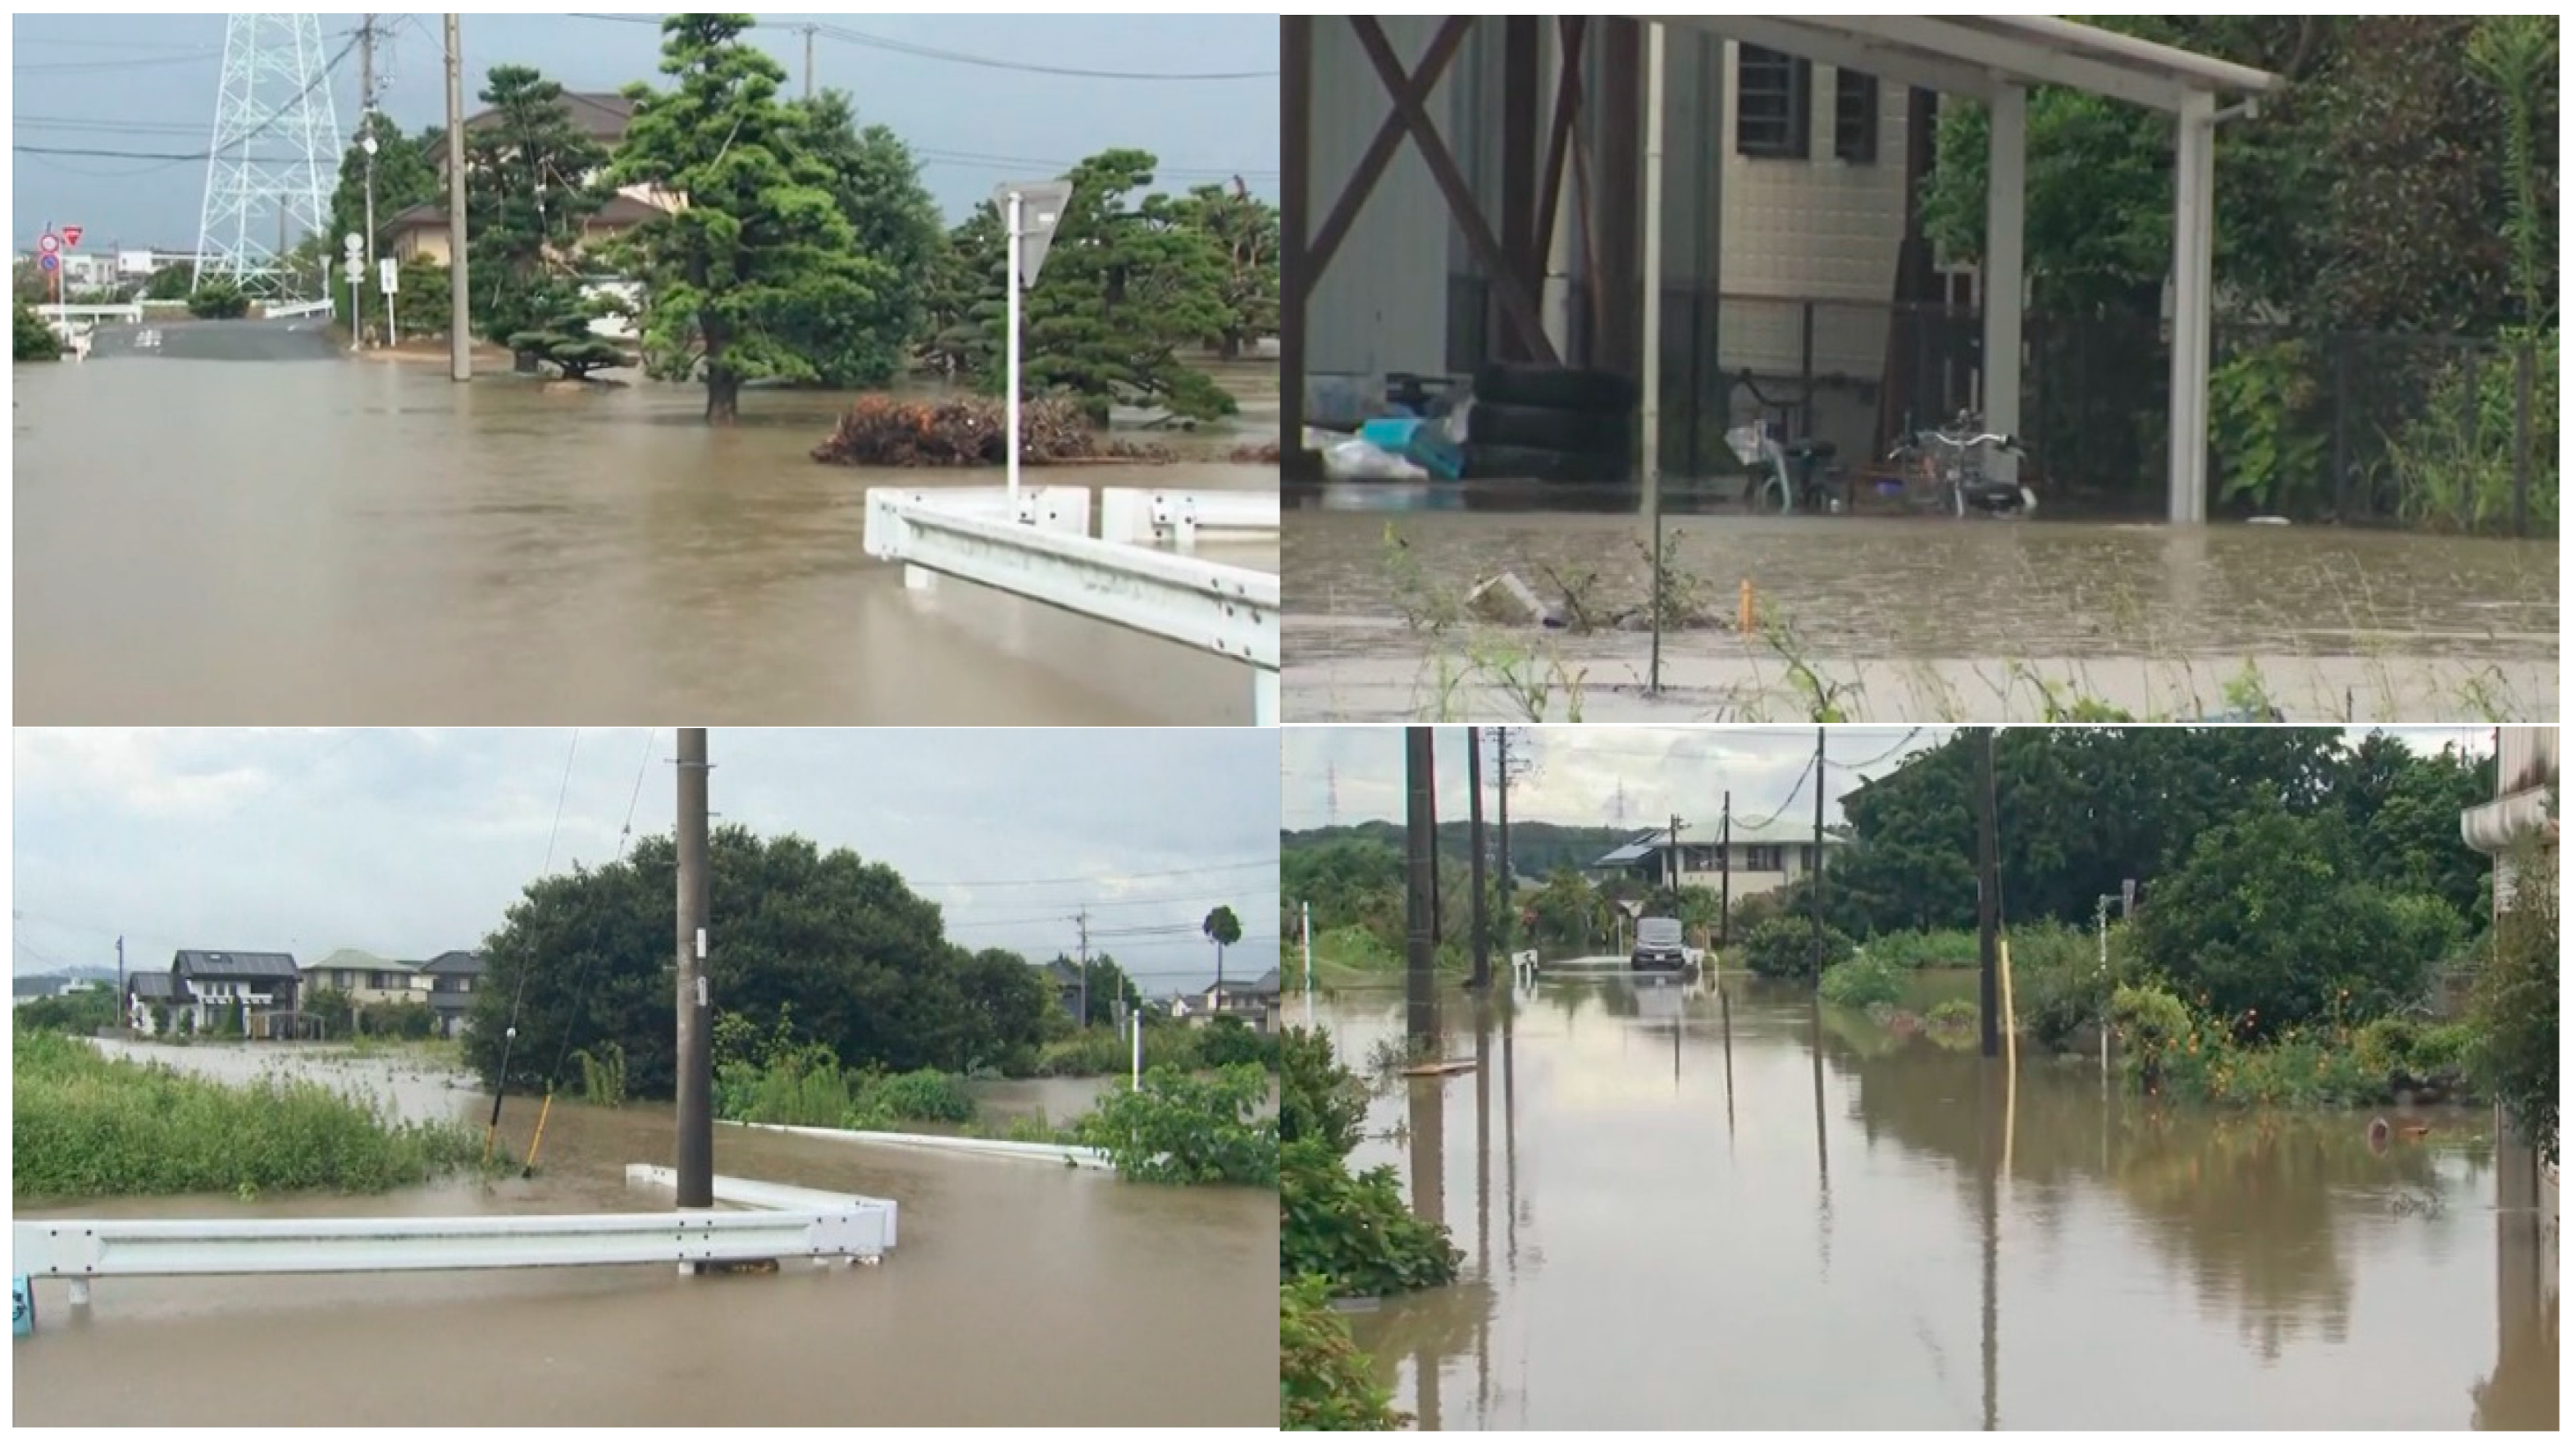
Figure 2 resulted from the overwhelming flow from the Magome River during heavy rainfall that occurred on 2 September 2022 [
34]. In addition, Hamamatsu city was struck by strong flash floods in September 2022;
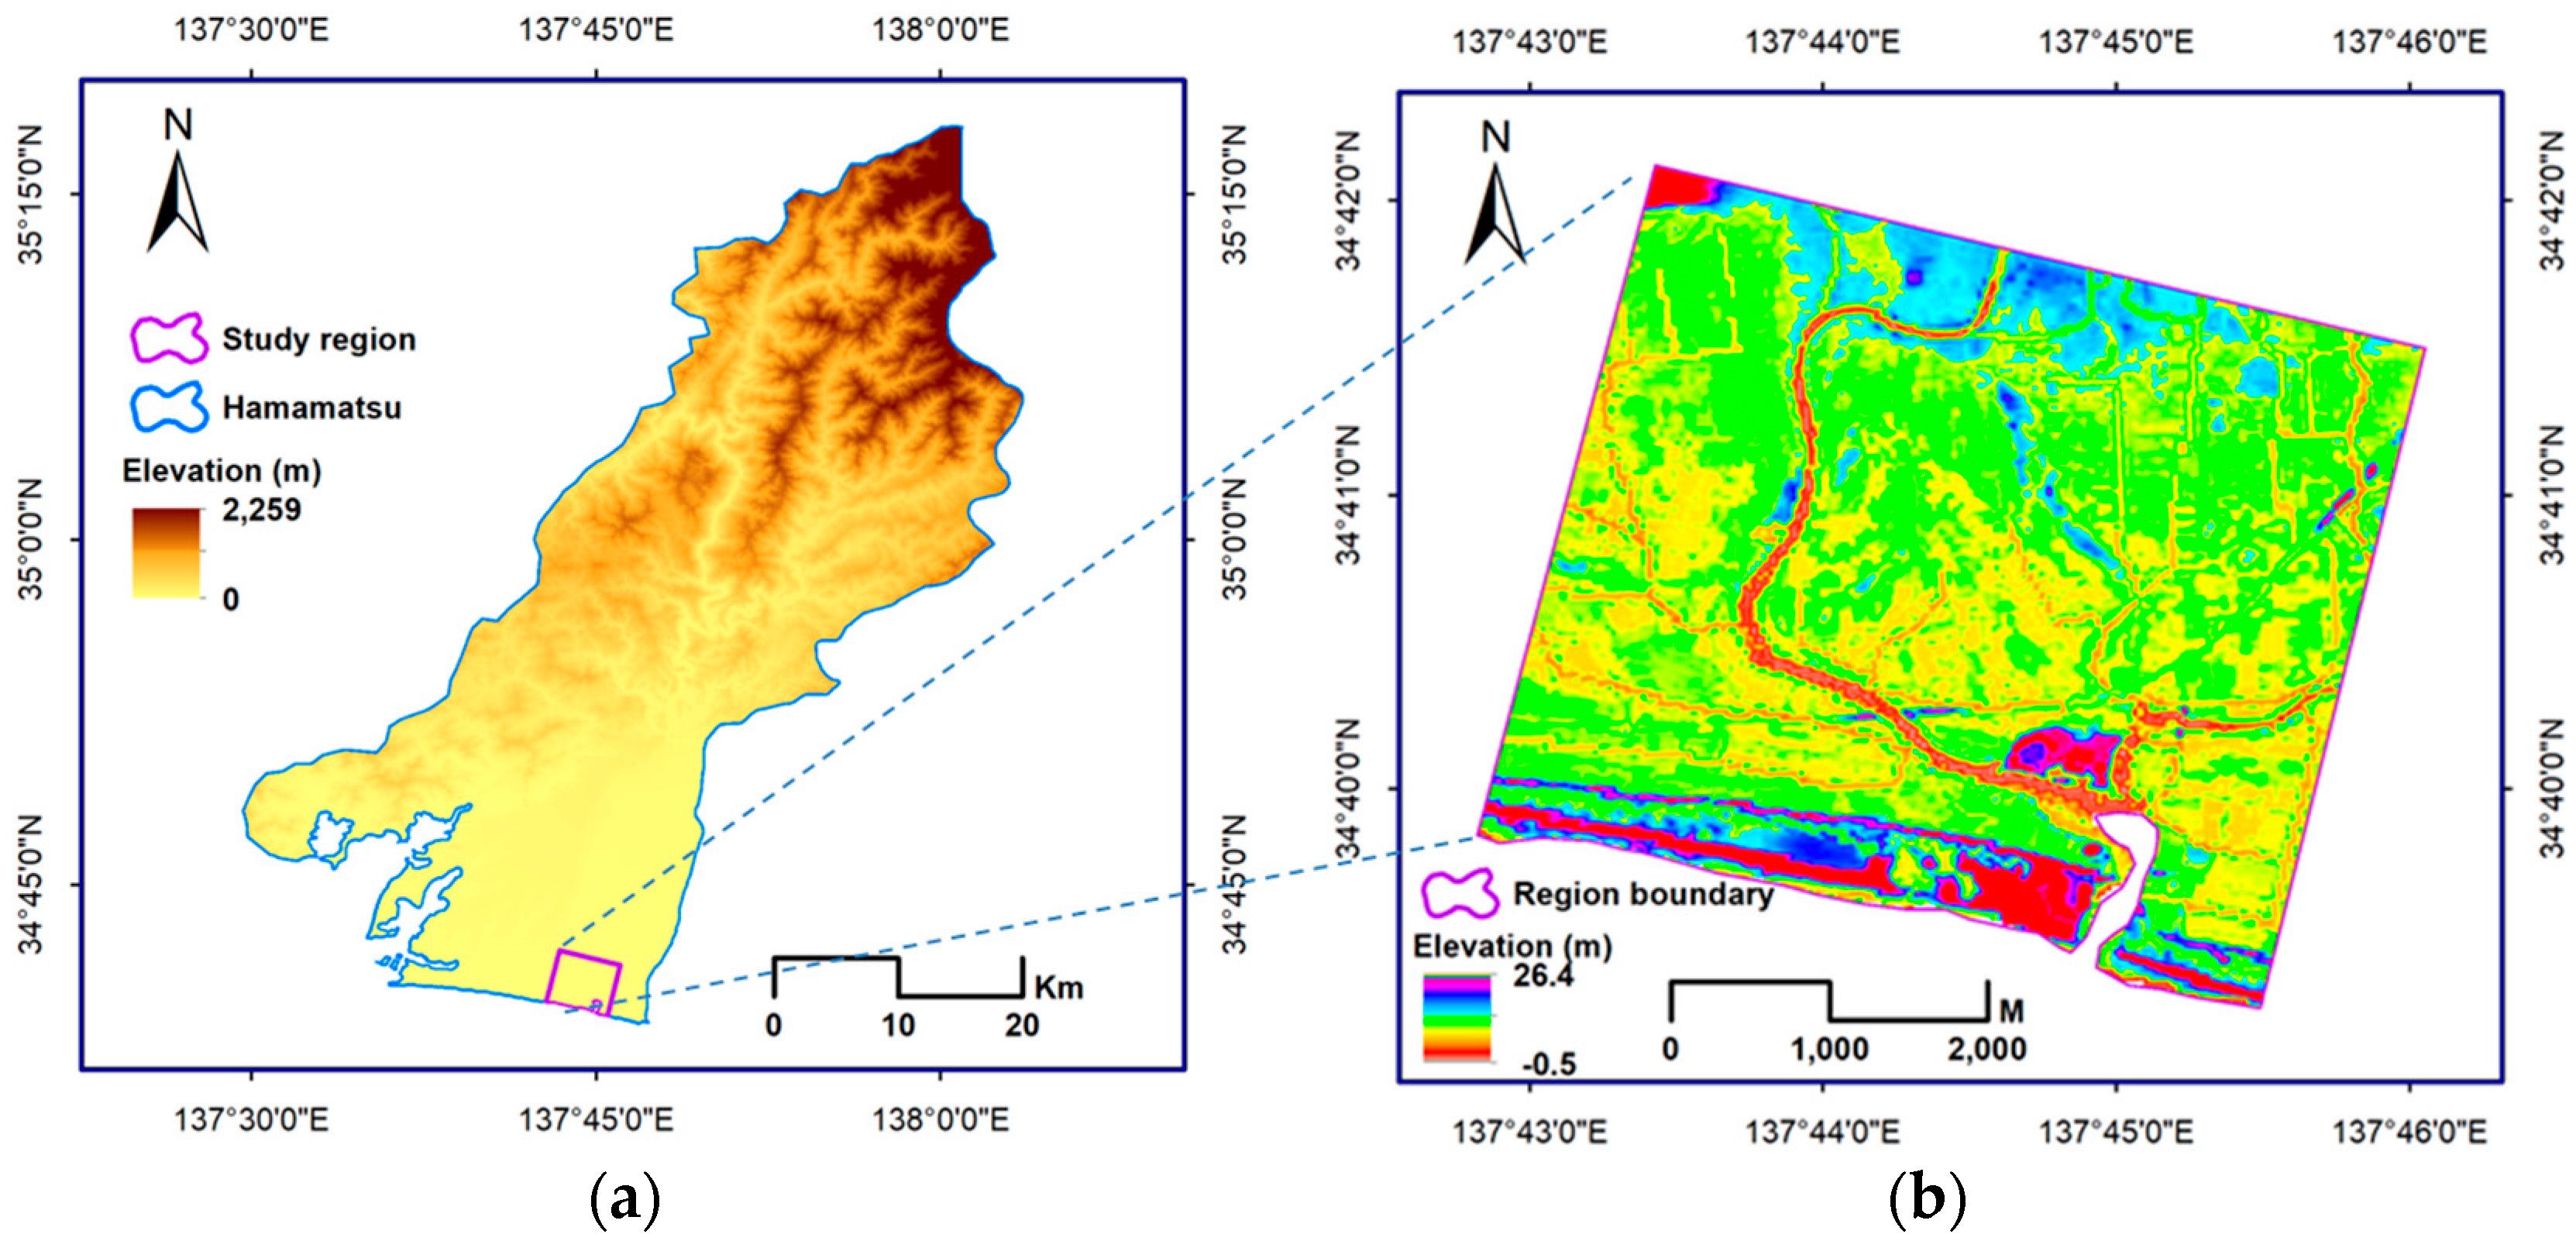
Figure 3 illustrates some areas in the city that received a high volume of runoff.
2.2. Materials and Sources
The delineation of Hamamatsu City was established, and information pertaining to building categorization and land utilization was extracted. These data are essential for use in the hydrodynamic model as obstructions and are also used to obtain information about the buildings during the process of categorizing the flash flood hazard. In addition, a satellite imagery map of Japan was utilized and prepared using ArcMap 10.8.2. The classification of the data obtained is illustrated in
Table 1.
Furthermore, the digital elevation model (DEM) (
Figure 3) containing the terrain levels was obtained after conducting adjustment in the Yamazaki laboratory.
The rainfall data were acquired from the Japan Meteorological Agency website (
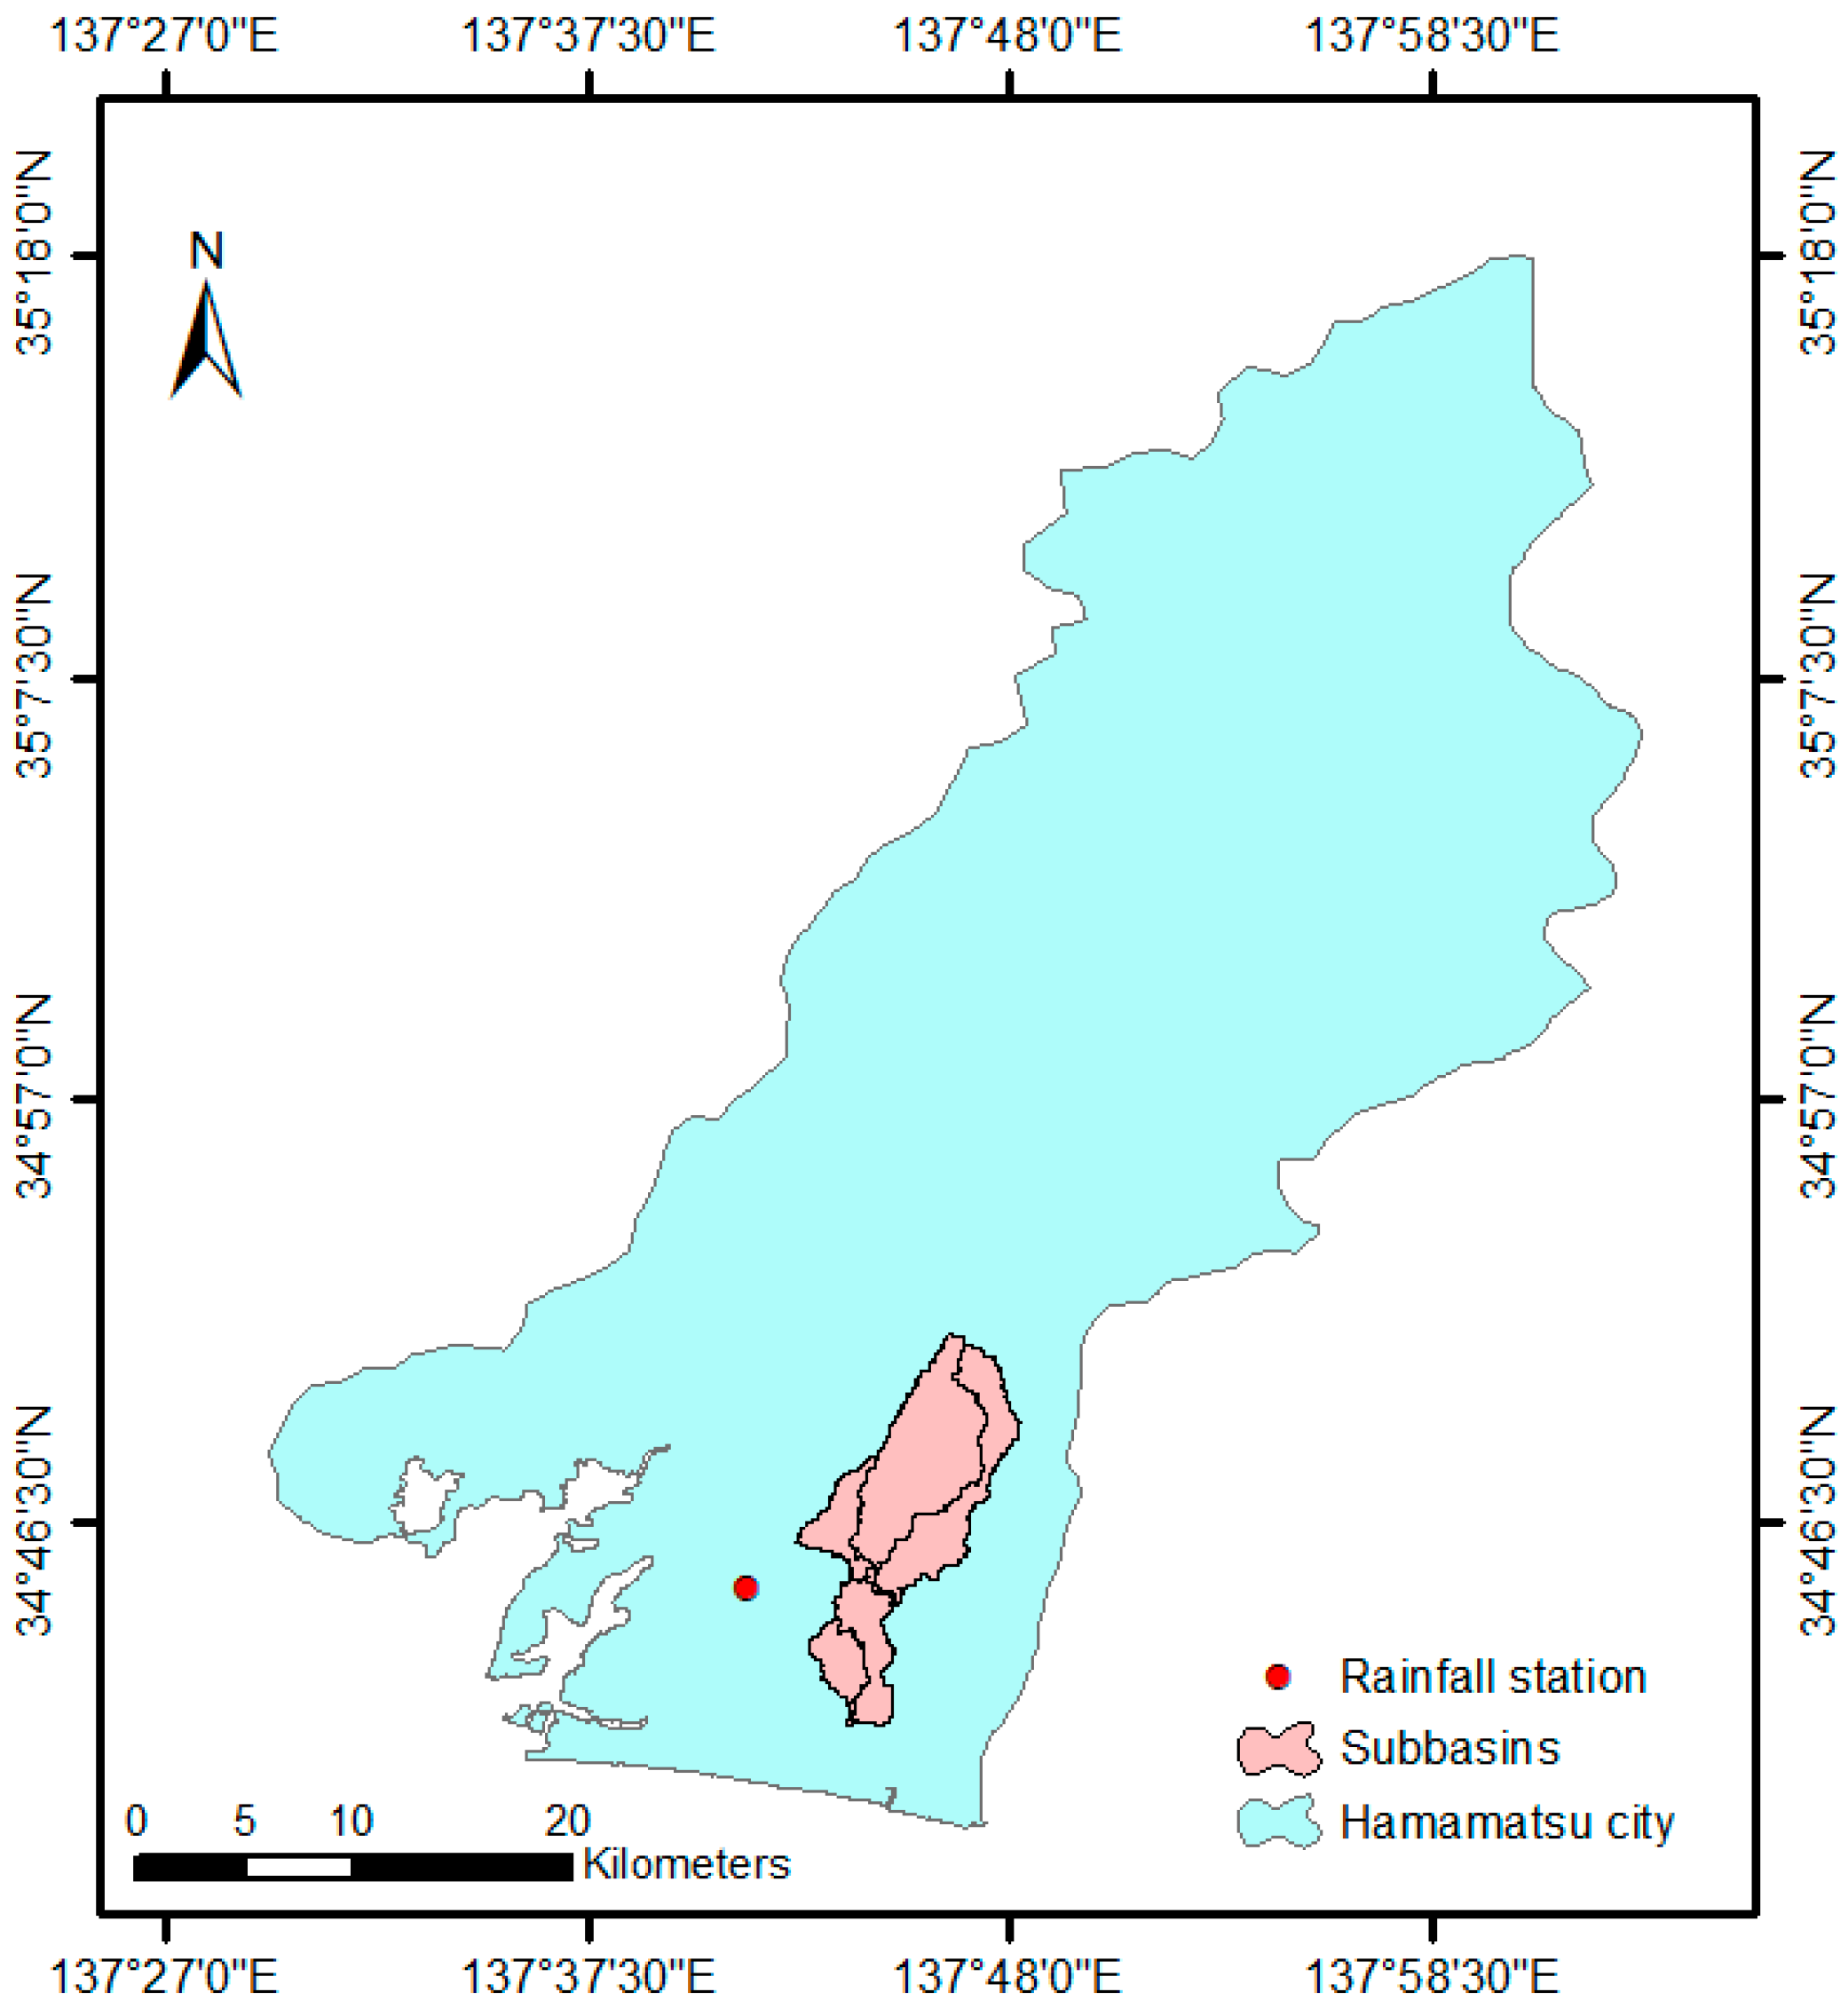
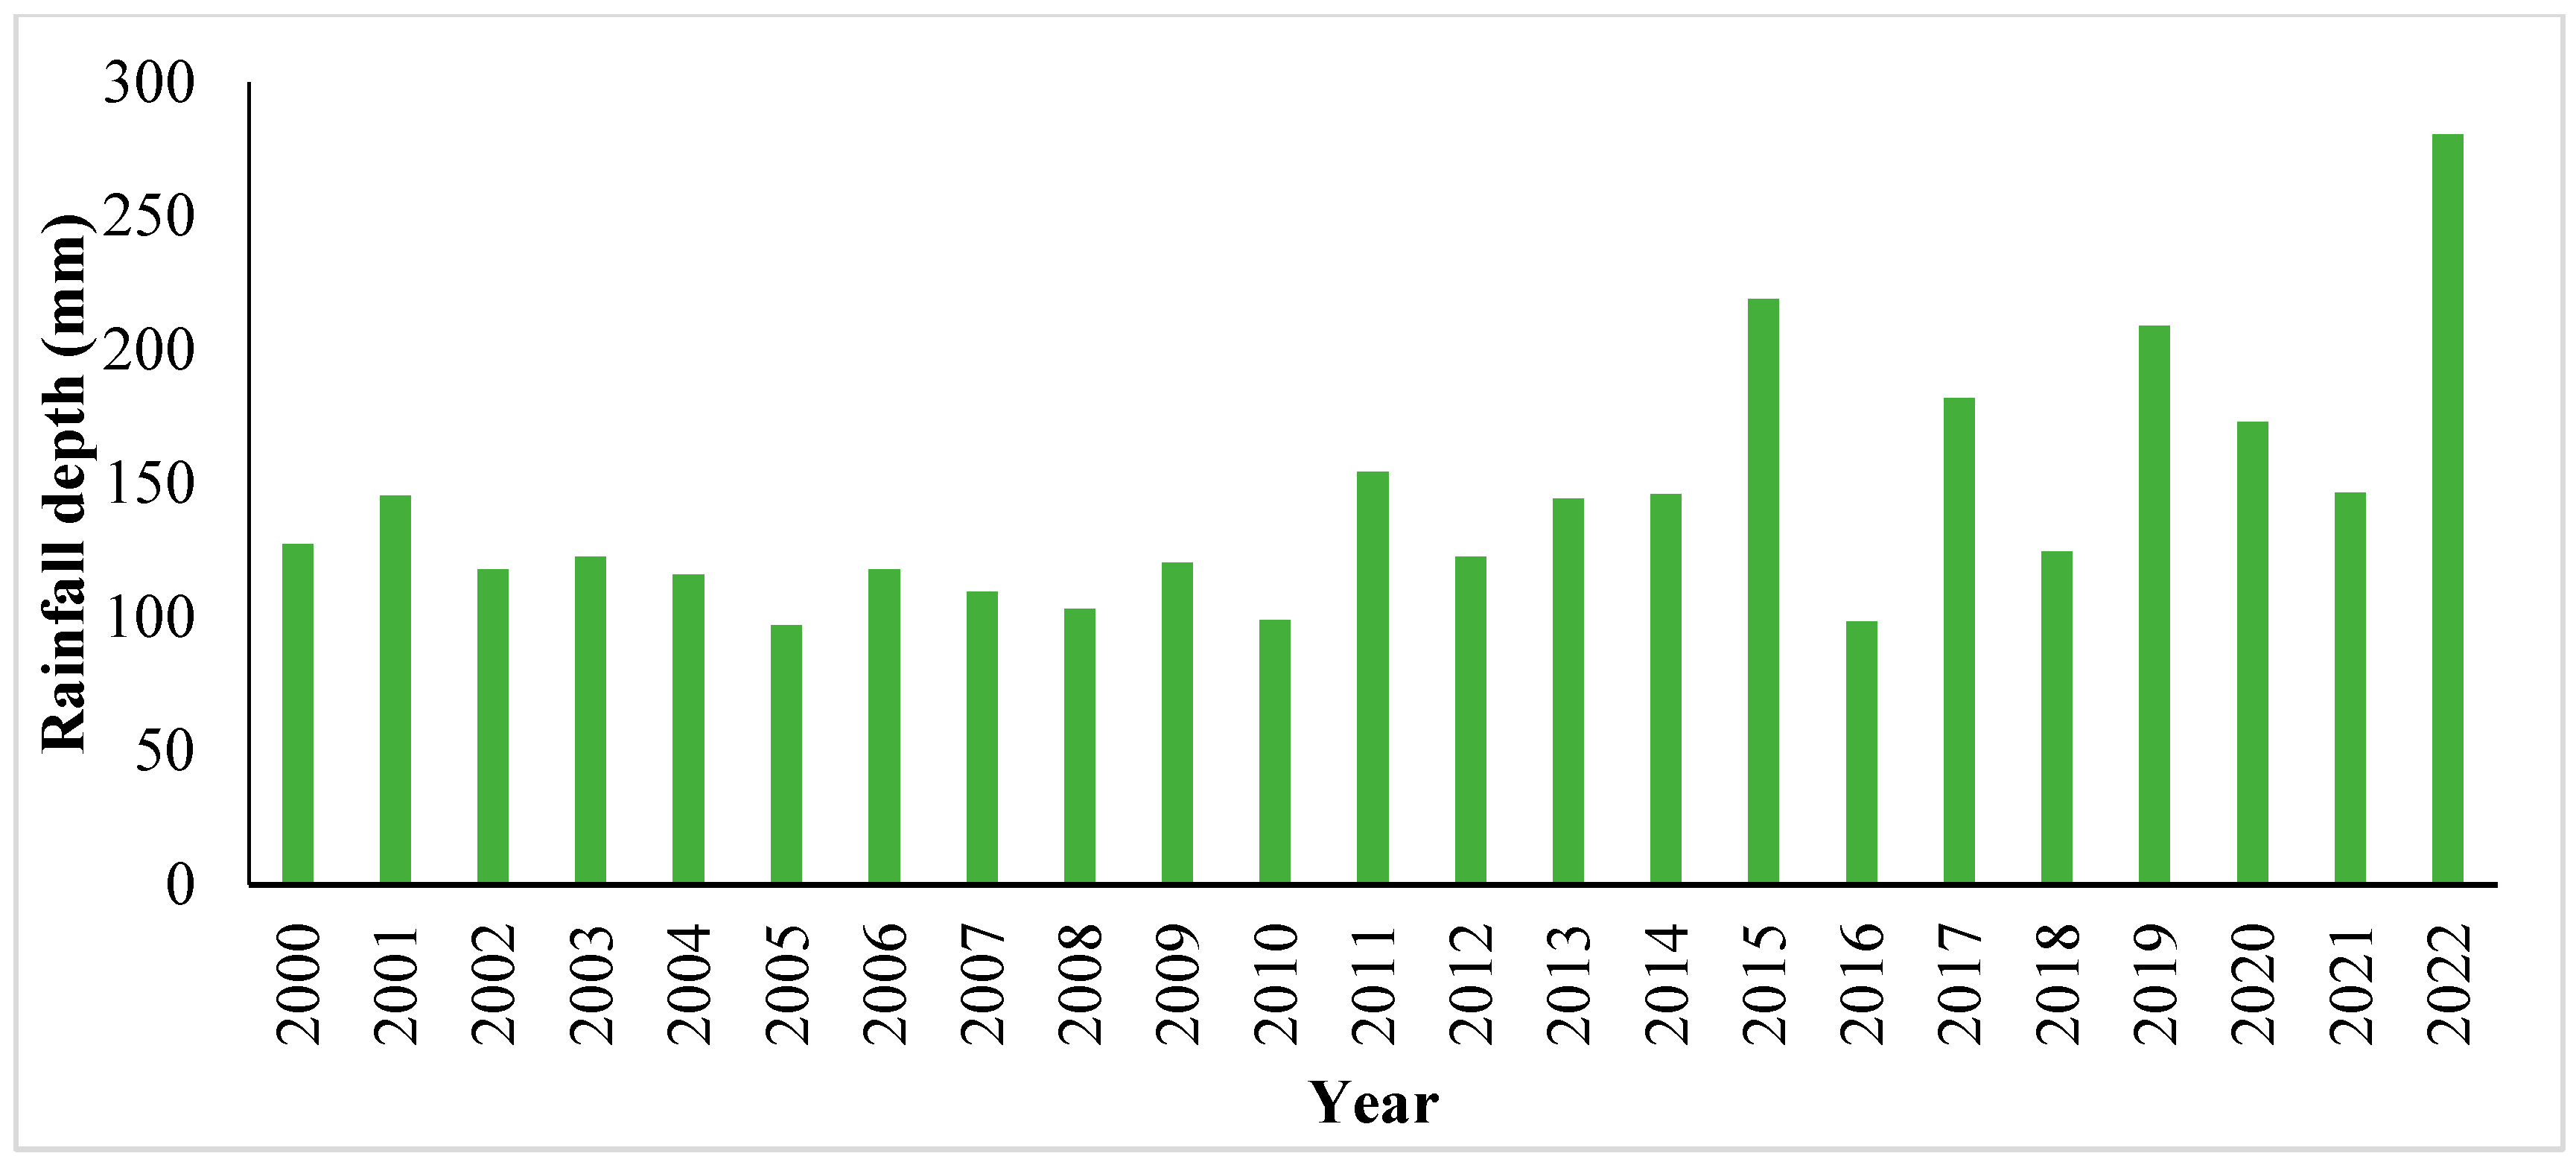
https://www.data.jma.go.jp/gmd/risk/obsdl/#, accessed on 15 June 2023). This website includes the observed rainfall data for stations distributed throughout many parts in Japan. The location of the adopted station and maximum daily rainfall observed at this station from 2000 to 2022 are shown in
Figure 4 and
Figure 5, respectively.
2.3. Methodology
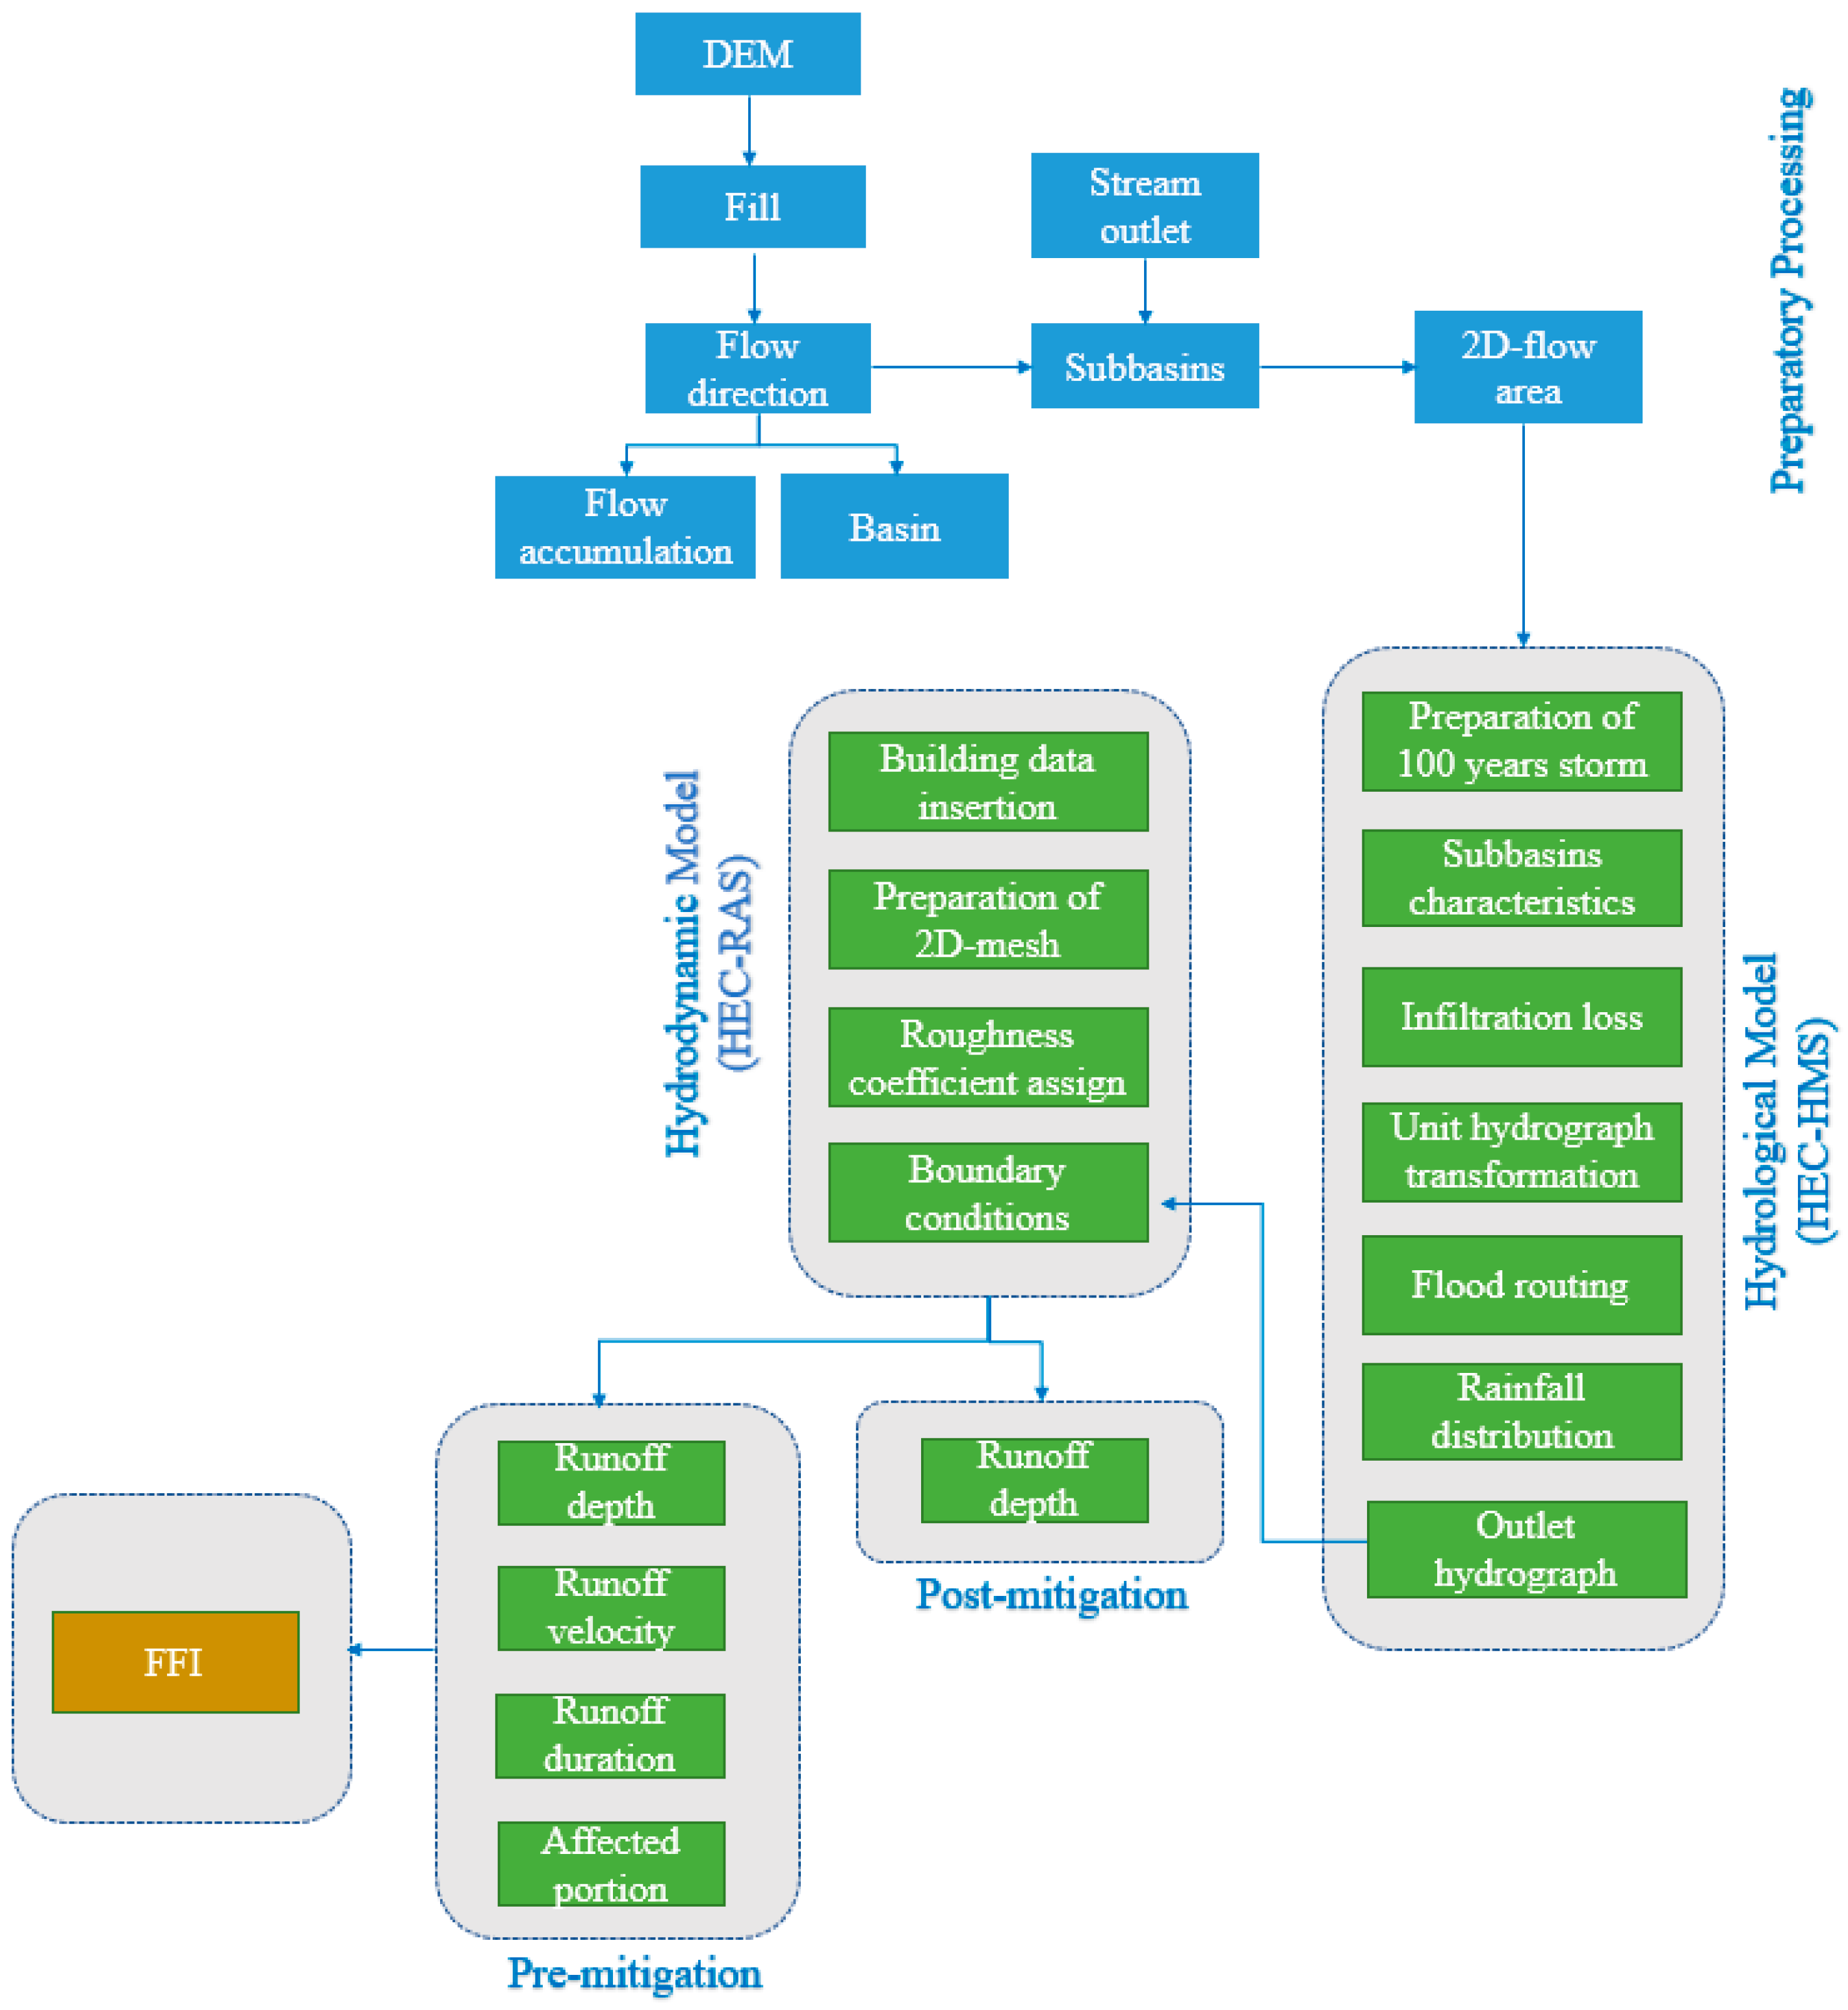
The flash flood intensity can be identified through four major stages (preparatory process, hydrological model, hydrodynamic model, and FFI parameters), as schemed in
Figure 6. The first stage is responsible for obtaining a high resolution of digital elevation model (DEM) to be delineated using ArcMap 10.8.2. In the delineation process, the flow direction was estimated spatially for use in determining and locating the basins and major streamlines.
In the subsequent step, the DEM was transferred to HEC-HMS 4.11 for setting the subbasin attributes, including the determination of the longest flow path within each subbasin and the calculation of the mean land slope. These data are very imperative in combination with the spatial curve number to obtain the lag time for each subbasin. In addition, the curve number was utilized to estimate the infiltration loss, whereas the lag time was used to calculate the unit hydrograph. Consequently, the Muskingum method was employed for the flood routing. Moreover, the estimated 100-year return-period storm was distributed throughout 24 hrs. Finally, the hydrological simulation was performed to obtain the hydrograph at the outlet of the delineated subbasins.
The third stage is to establish the hydrodynamic model to estimate the four parameters of FFI. In this stage, the estimated hydrograph was utilized an input for the unsteady flow model. This hydrograph was used as the upstream boundary condition at the identified outlet, whilst the downstream discharge was estimated at the end of the river from the friction slope. Moreover, the 2D flow area was established with mesh size 4 m and the roughness coefficient was taken into account to obtain accurate runoff velocity.
In addition, the FFI parameters were extracted from the hydrodynamic model to be analyzed via ArcMap 10.8.2. The data required for the FFI formula are the spatial runoff depth, runoff velocity, runoff duration, and adopted portion. All these data were bound to the corresponding buildings to calculate the value of FFI. Eventually, the post-mitigation strategy was applied to the hydrodynamic model and the final depth of the runoff depth was then calculated.
2.4. Hypothetical Storm Calculation
To project the potential storm under hypothetical conditions, the initial step involves estimating the rainfall storm design. In this investigation, to account for the most severe conceivable scenario, the maximum daily rainfall corresponding to a 100-year return period was computed. The return period is a calculation of the probability of an event, such as a flood or intense precipitation, transpiring over a prolonged duration, and serves as a method for the likelihood of surpassing a certain threshold [
39]. The precipitation data used to develop the 100-year return period were collected from the previously mentioned station.
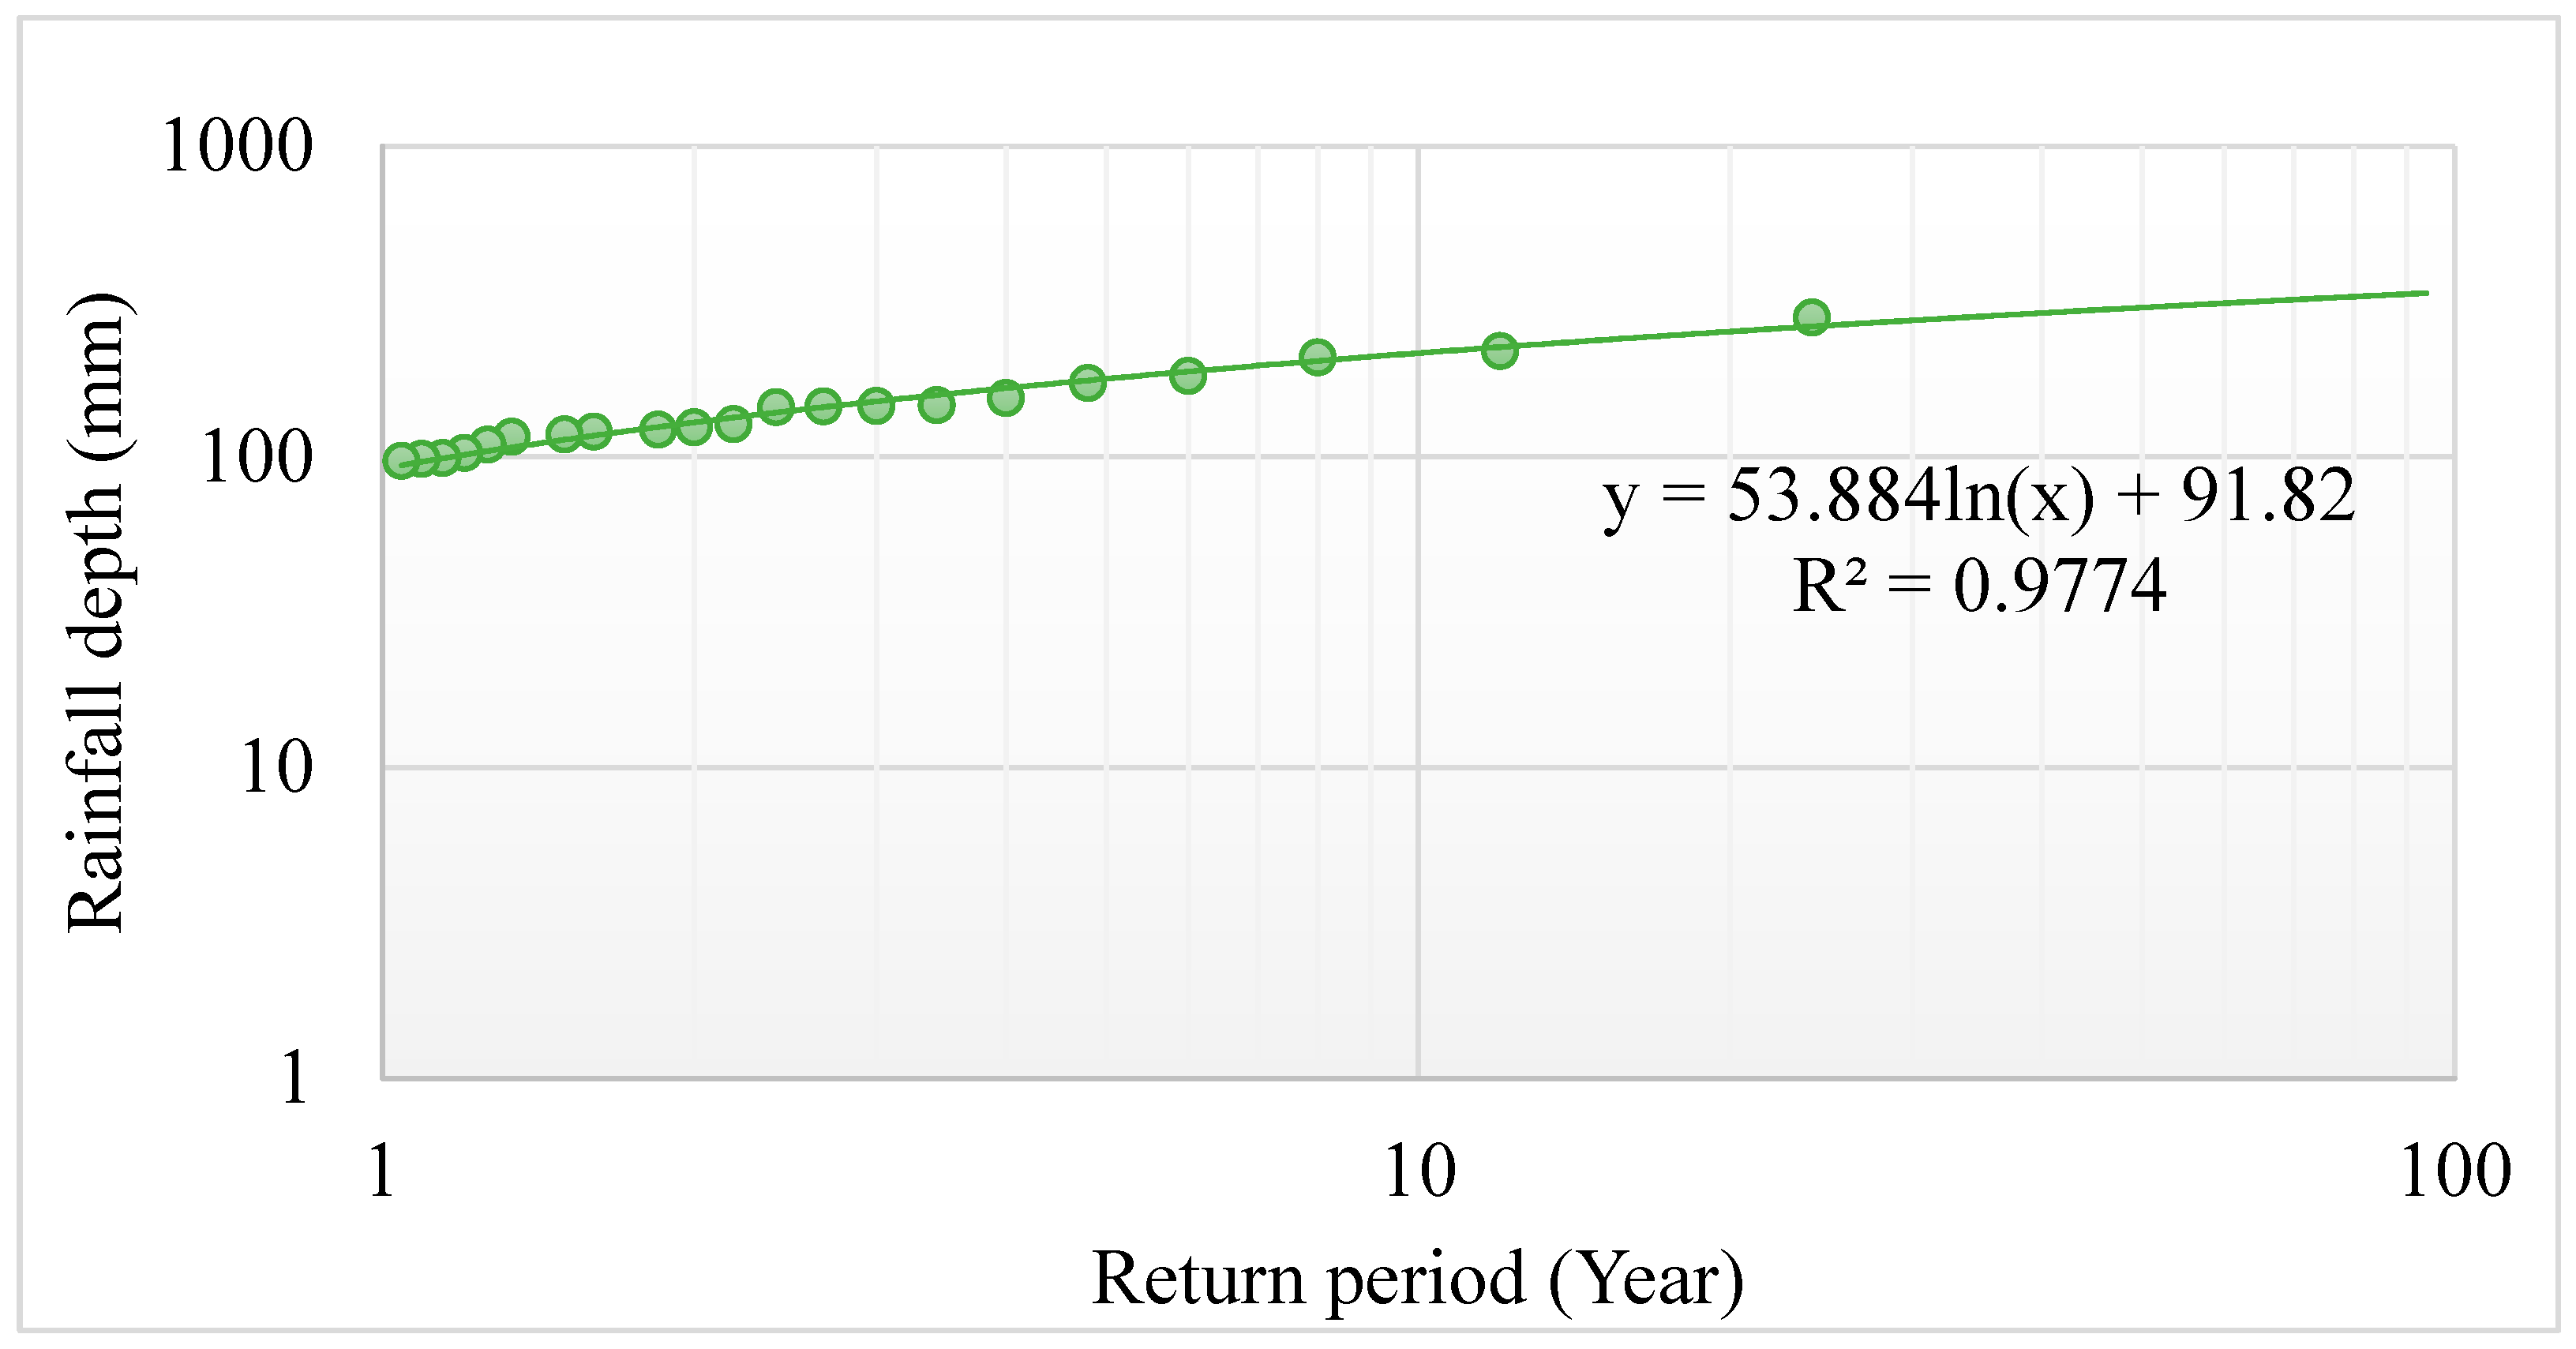
Table 2 shows the calculation of the return period for the maximum daily cumulative rainfall observed for 2000 to 2022. In addition, the probability was calculated through Equations (1) and (2) [
40]. The estimated 100-year return rainfall is 339.9 mm.
Figure 7 shows return-period diagram.
where
P is the probability,
m represents the rank of an ordered list by descending magnitude,
n denotes the overall count of values, and
b is a factor assumed to be 0 according to the Weibull formula [
41]. The heavier tail weight of the Weibull distribution is anticipated to better capture extreme values, especially concerning subdaily rainfall quantities [
42].
Furthermore, among various functions like “linear” and “exponential”, the logarithmic function has emerged as a more accurate representation of the data trend. This determination follows from achieving a higher R-squared value for the logarithmic function when compared to the alternatives.
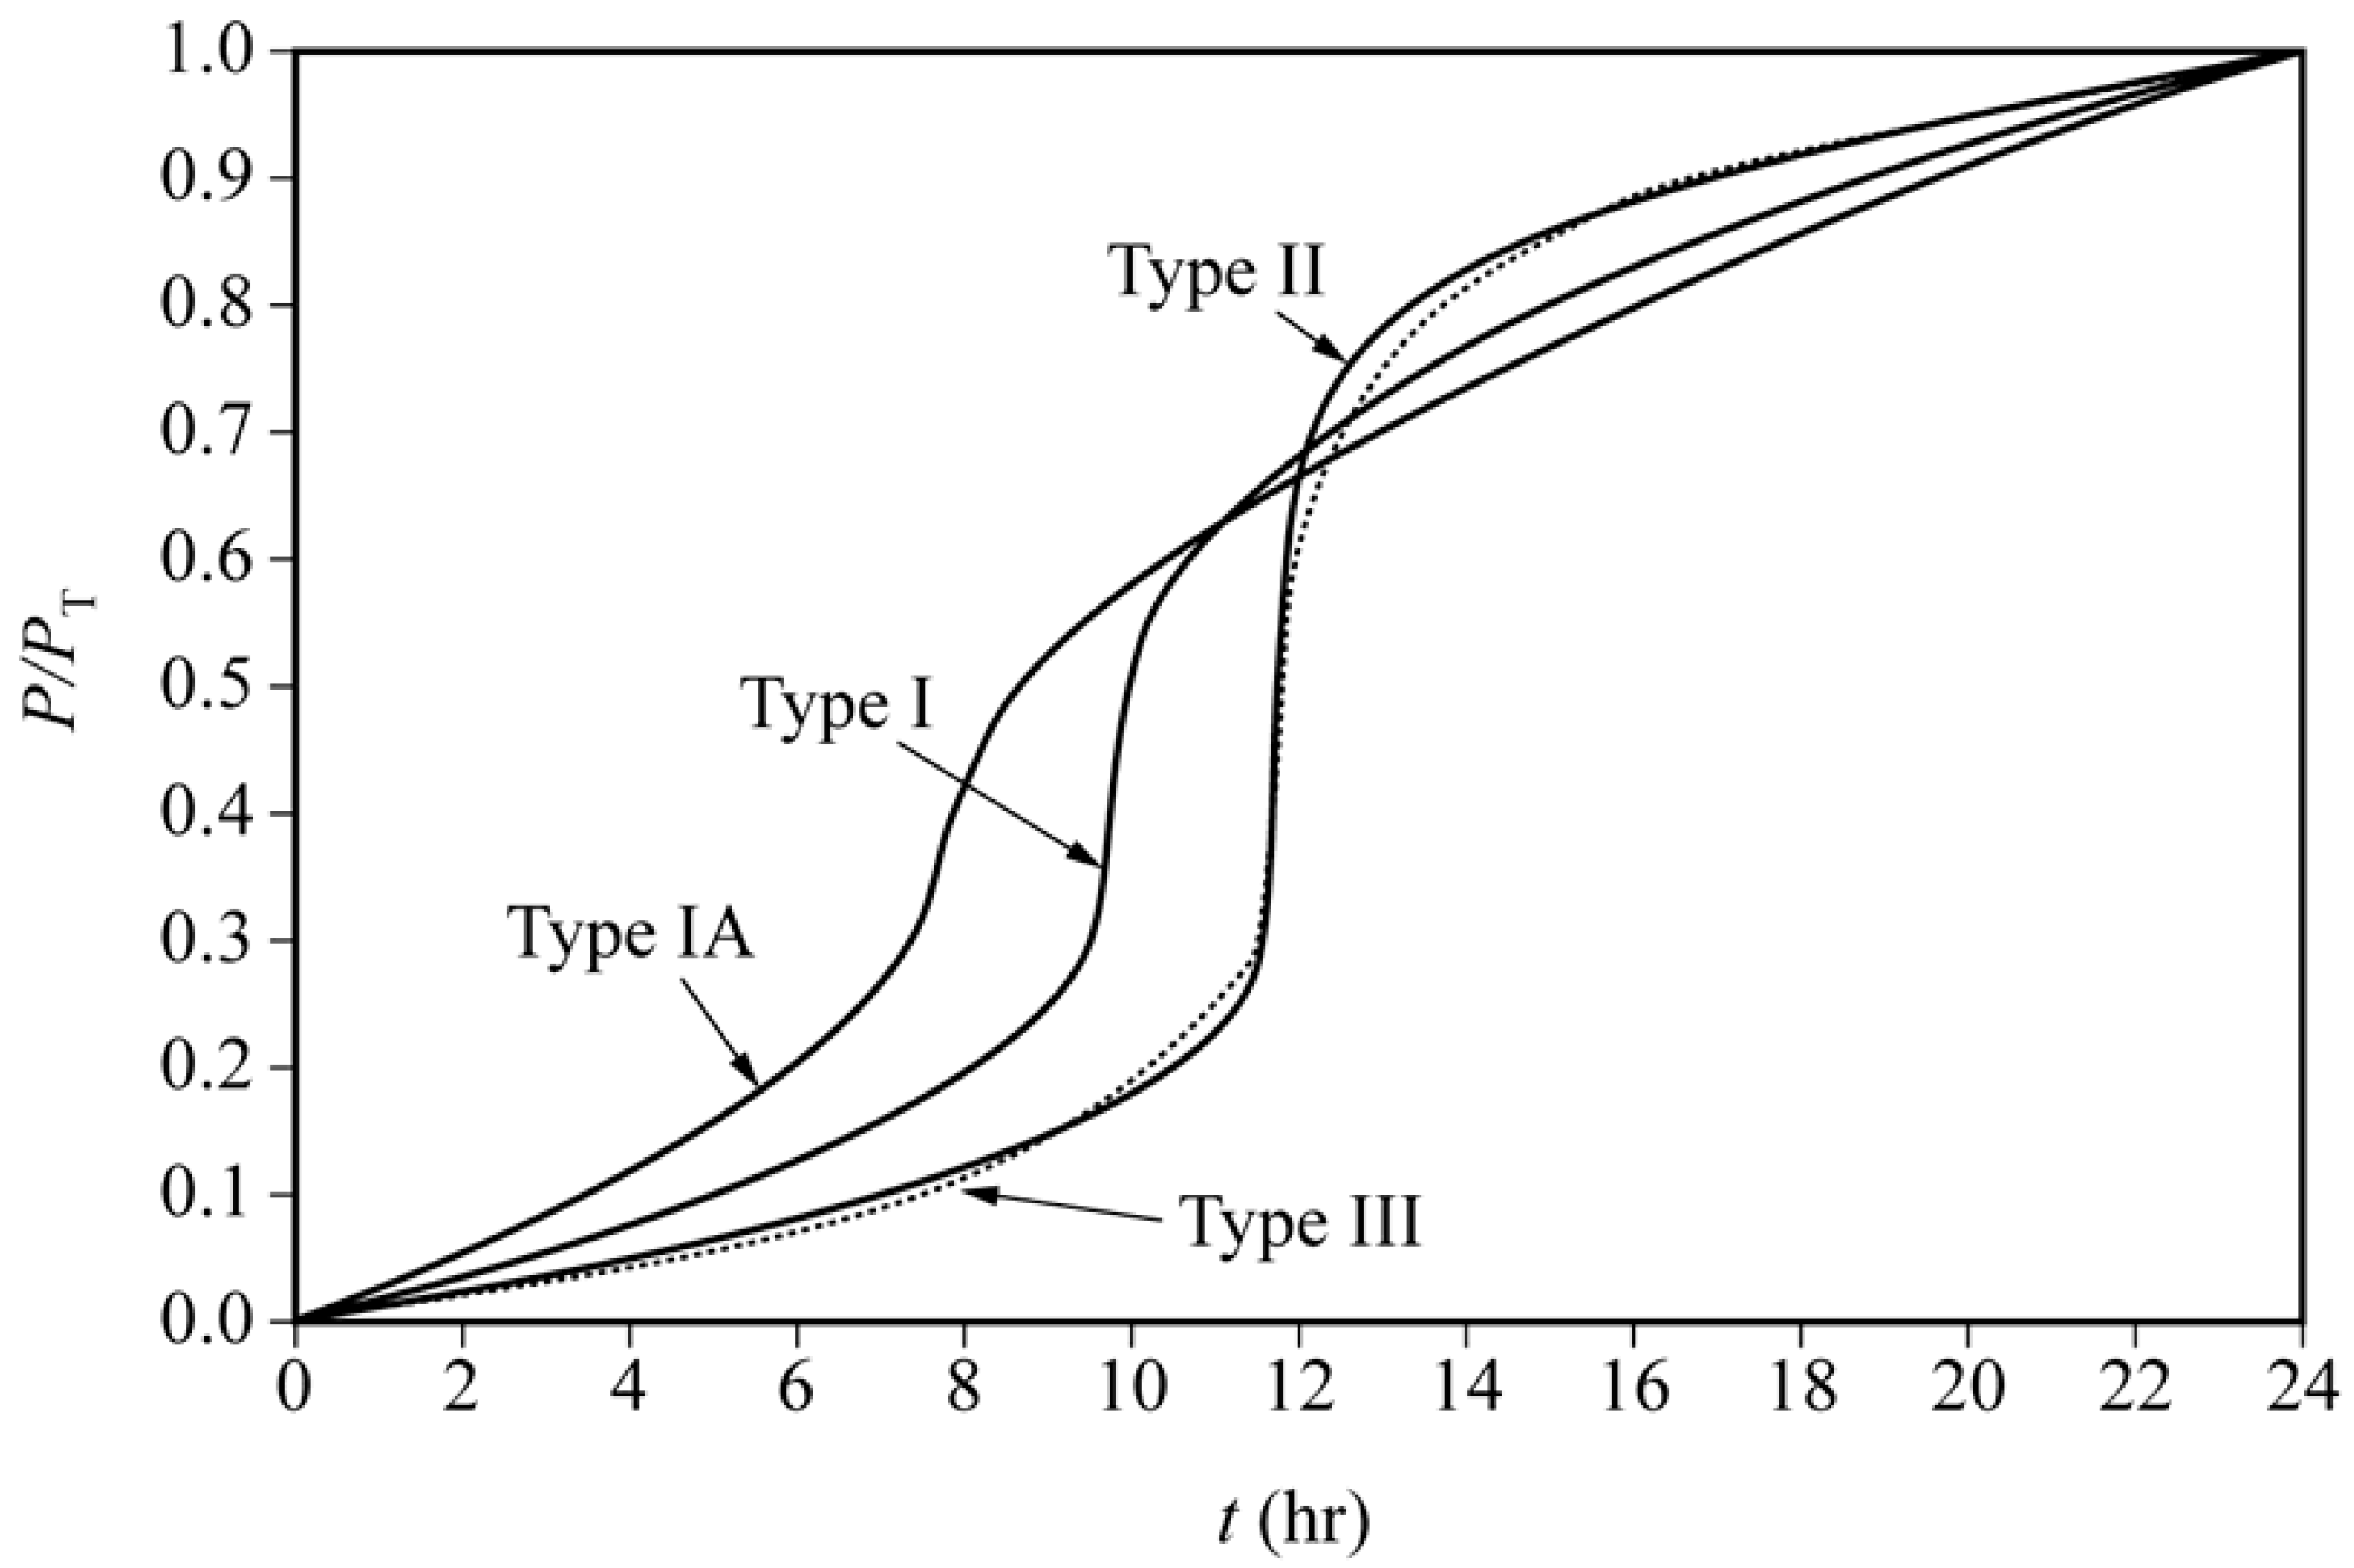
The estimated 100-year storm was distributed for 24 hrs. according to Soil Conservation Service (SCS) protocol.
Figure 8 illustrates the distribution of the rainfall according to various types of rainfall patterns [
43]. In this investigation, type III was employed, as it aligns with the characteristics of a tropical storm analogous to the circumstances at Hamamatsu city. The calculation of the distributed 24 hrs. storm was carried out in HEC-HMS 4.11.
Type I and IA storms signify Pacific climates characterized by predominantly moist winters and arid summers. In contrast, type III storms are indicative of regions where substantial runoff occurs due to the generation of tropical storms and hurricanes.
2.5. Hydrodynamic Model Assumptions
A 2D unsteady hydrodynamic model was developed to estimate all these essential FFI parameters using HEC-RAS 6.3.1. The model was generated at microscale level with mesh size 4 m to obtain more accurate results in a very small scale. The total area of the 2D mesh is about 5.1 km2. The model gave 0.0015% for the overall volume accounting error and 0.2629 m3 for the overall volume accounting error in 1000 m3. Additionally, the river’s roughness coefficient was set at 0.035, and two boundary conditions were established: one for the flow upstream and others for the flow downstream. The upstream boundary condition was determined based on the estimated hydrograph, while the downstream conditions were derived using the normal depth with an estimated friction slope of 0.01. Furthermore, a 100% imperviousness assumption was made due to the predominant pavement coverage across the study area. The flow discharge in the Magome River in the studied reach was calculated for a 100-year return period and the model was generated at a time scale of 113 h. The buildings were constructed in the model as an obstacle toward the flow to obtain more accurate results for both the flow depth and velocity.
3. Results and Discussion
3.1. Hydrological Model
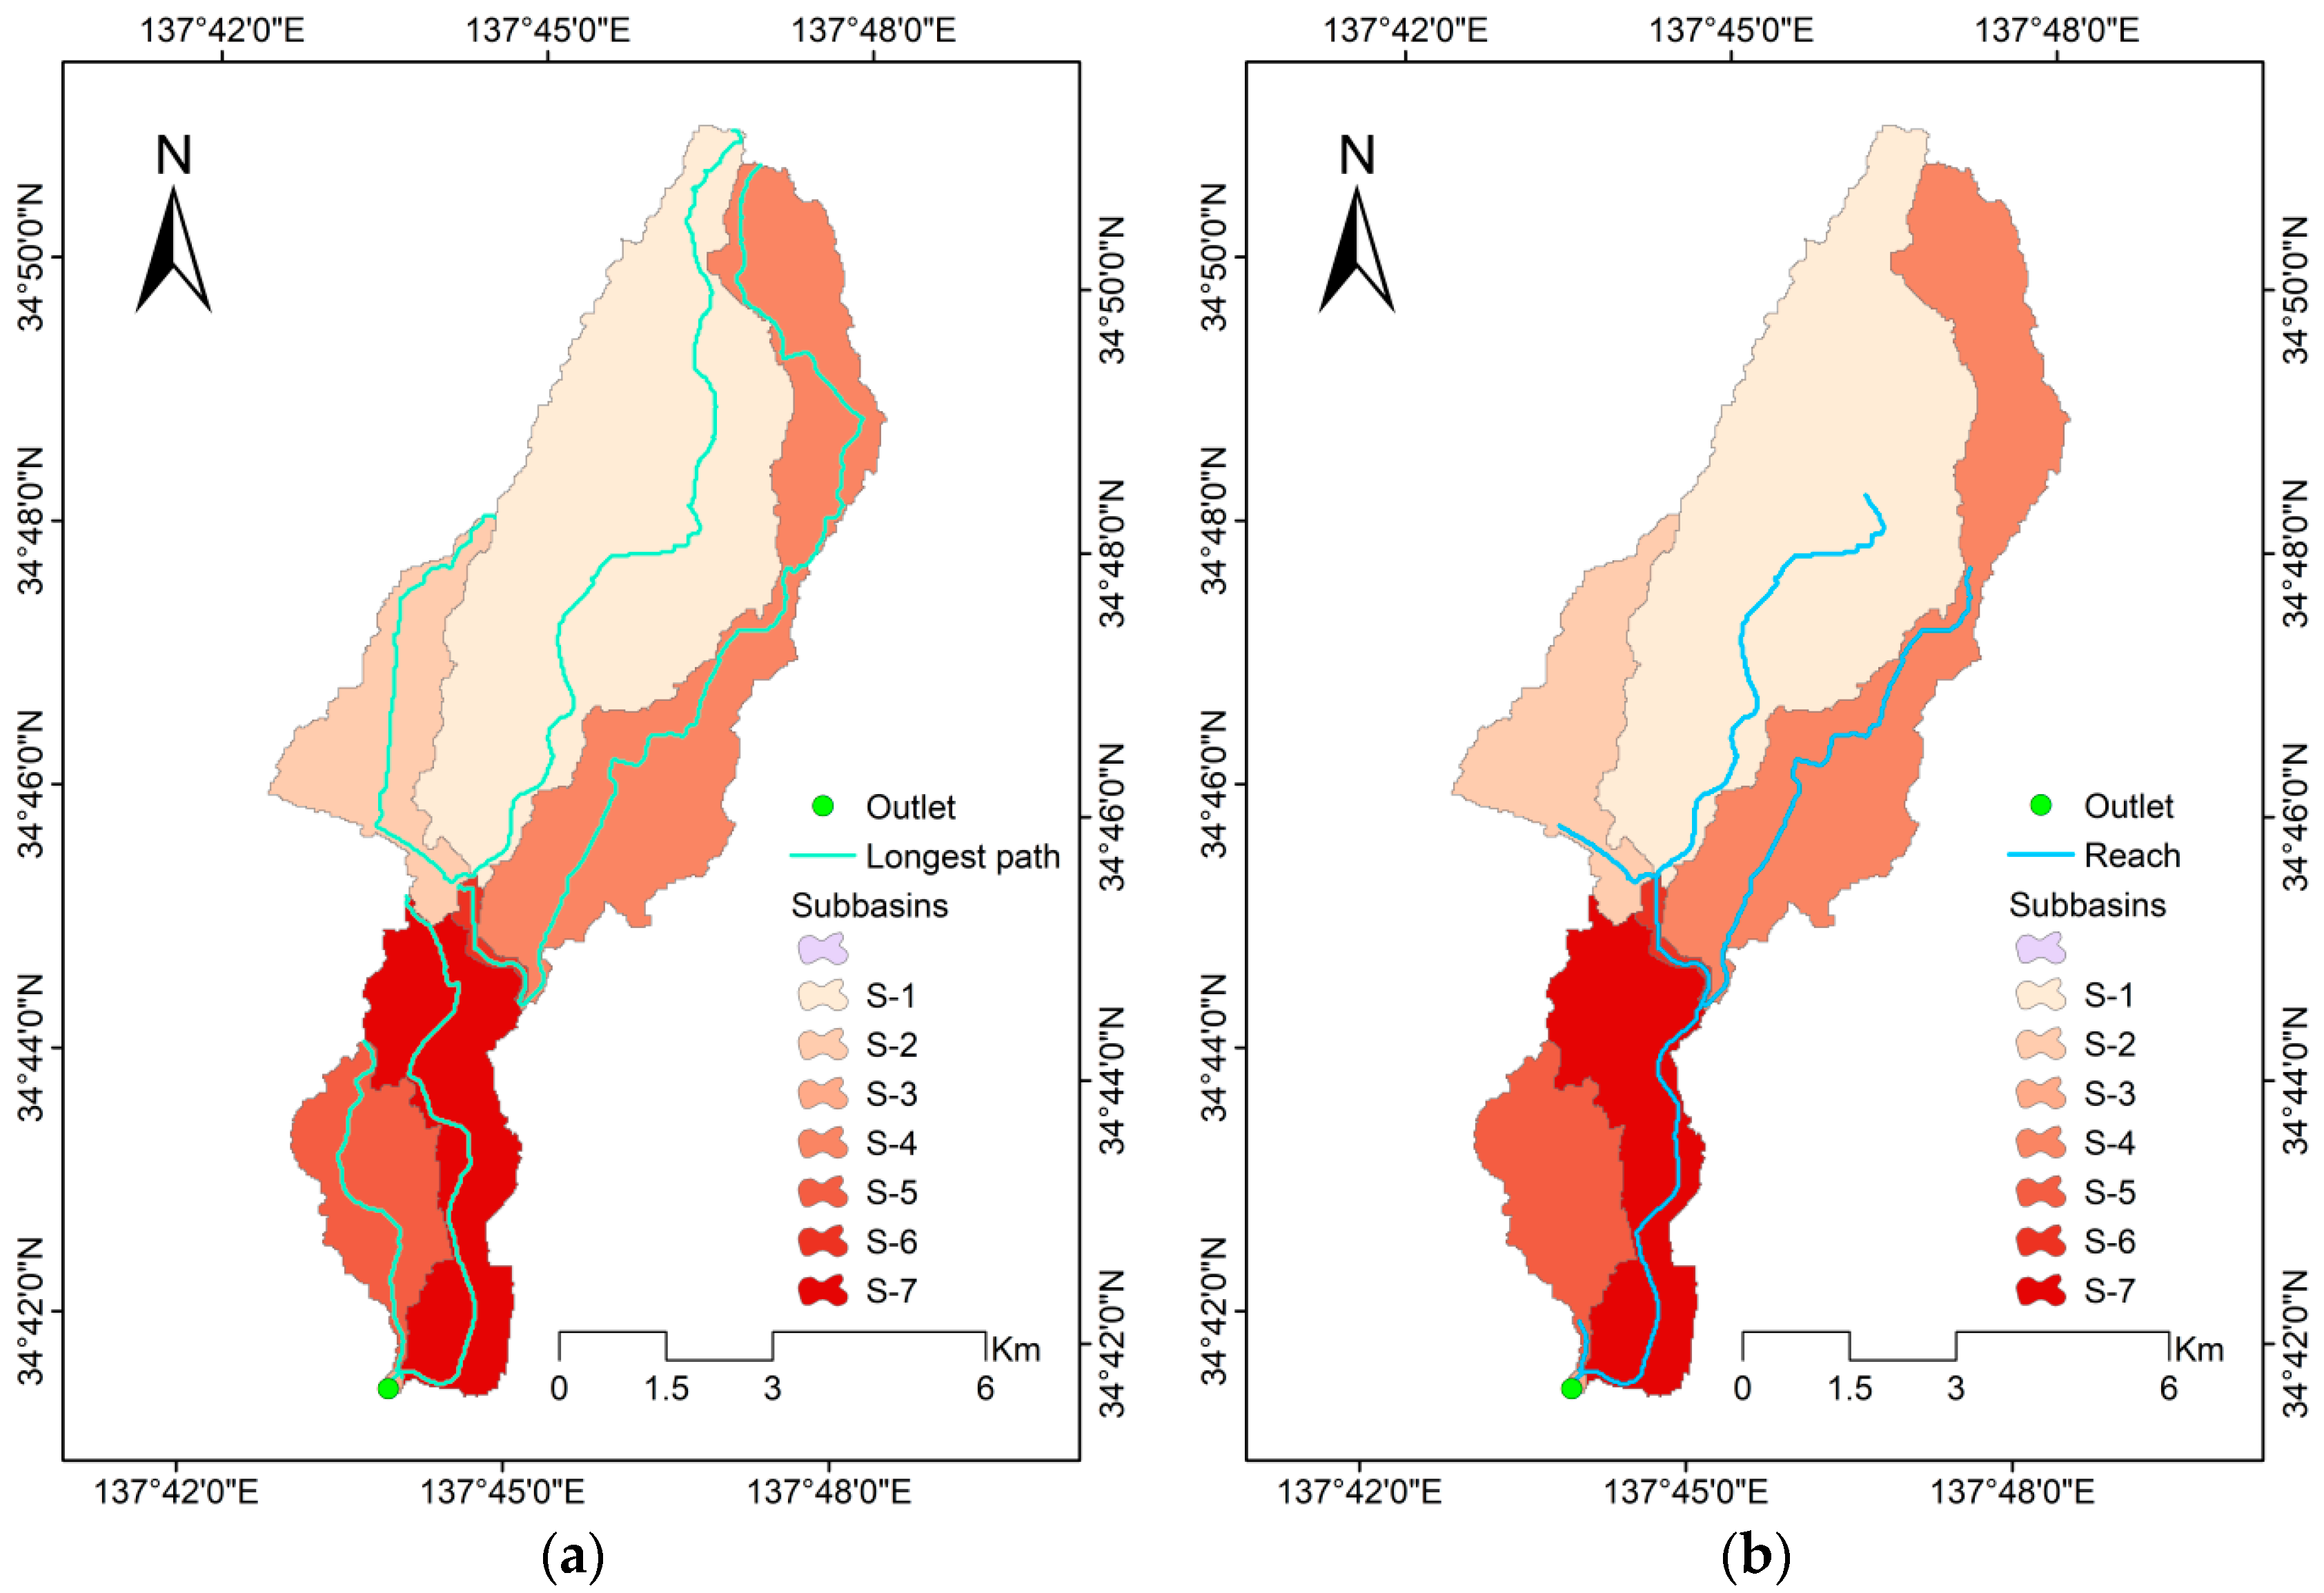
The hydrological study was conducted in HEC-HMS 4.11. The outlet was identified at the Magome River as upstream for the study area. The subbasins, longest flow path, and reaches are sketched in
Figure 9.
The concentration and lag time were calculated as follows:
where
Tc = time of concentration (hr);
l = longest path (ft);
Lg = lag time (hr);
S = maximum potential retention (in);
Y = average watershed land slope (%); and
CN = curve number
The curve number was identified according to the hydrological soil group and land cover.
Table 3 shows the calculations needed to estimate
Tc and
Lg.
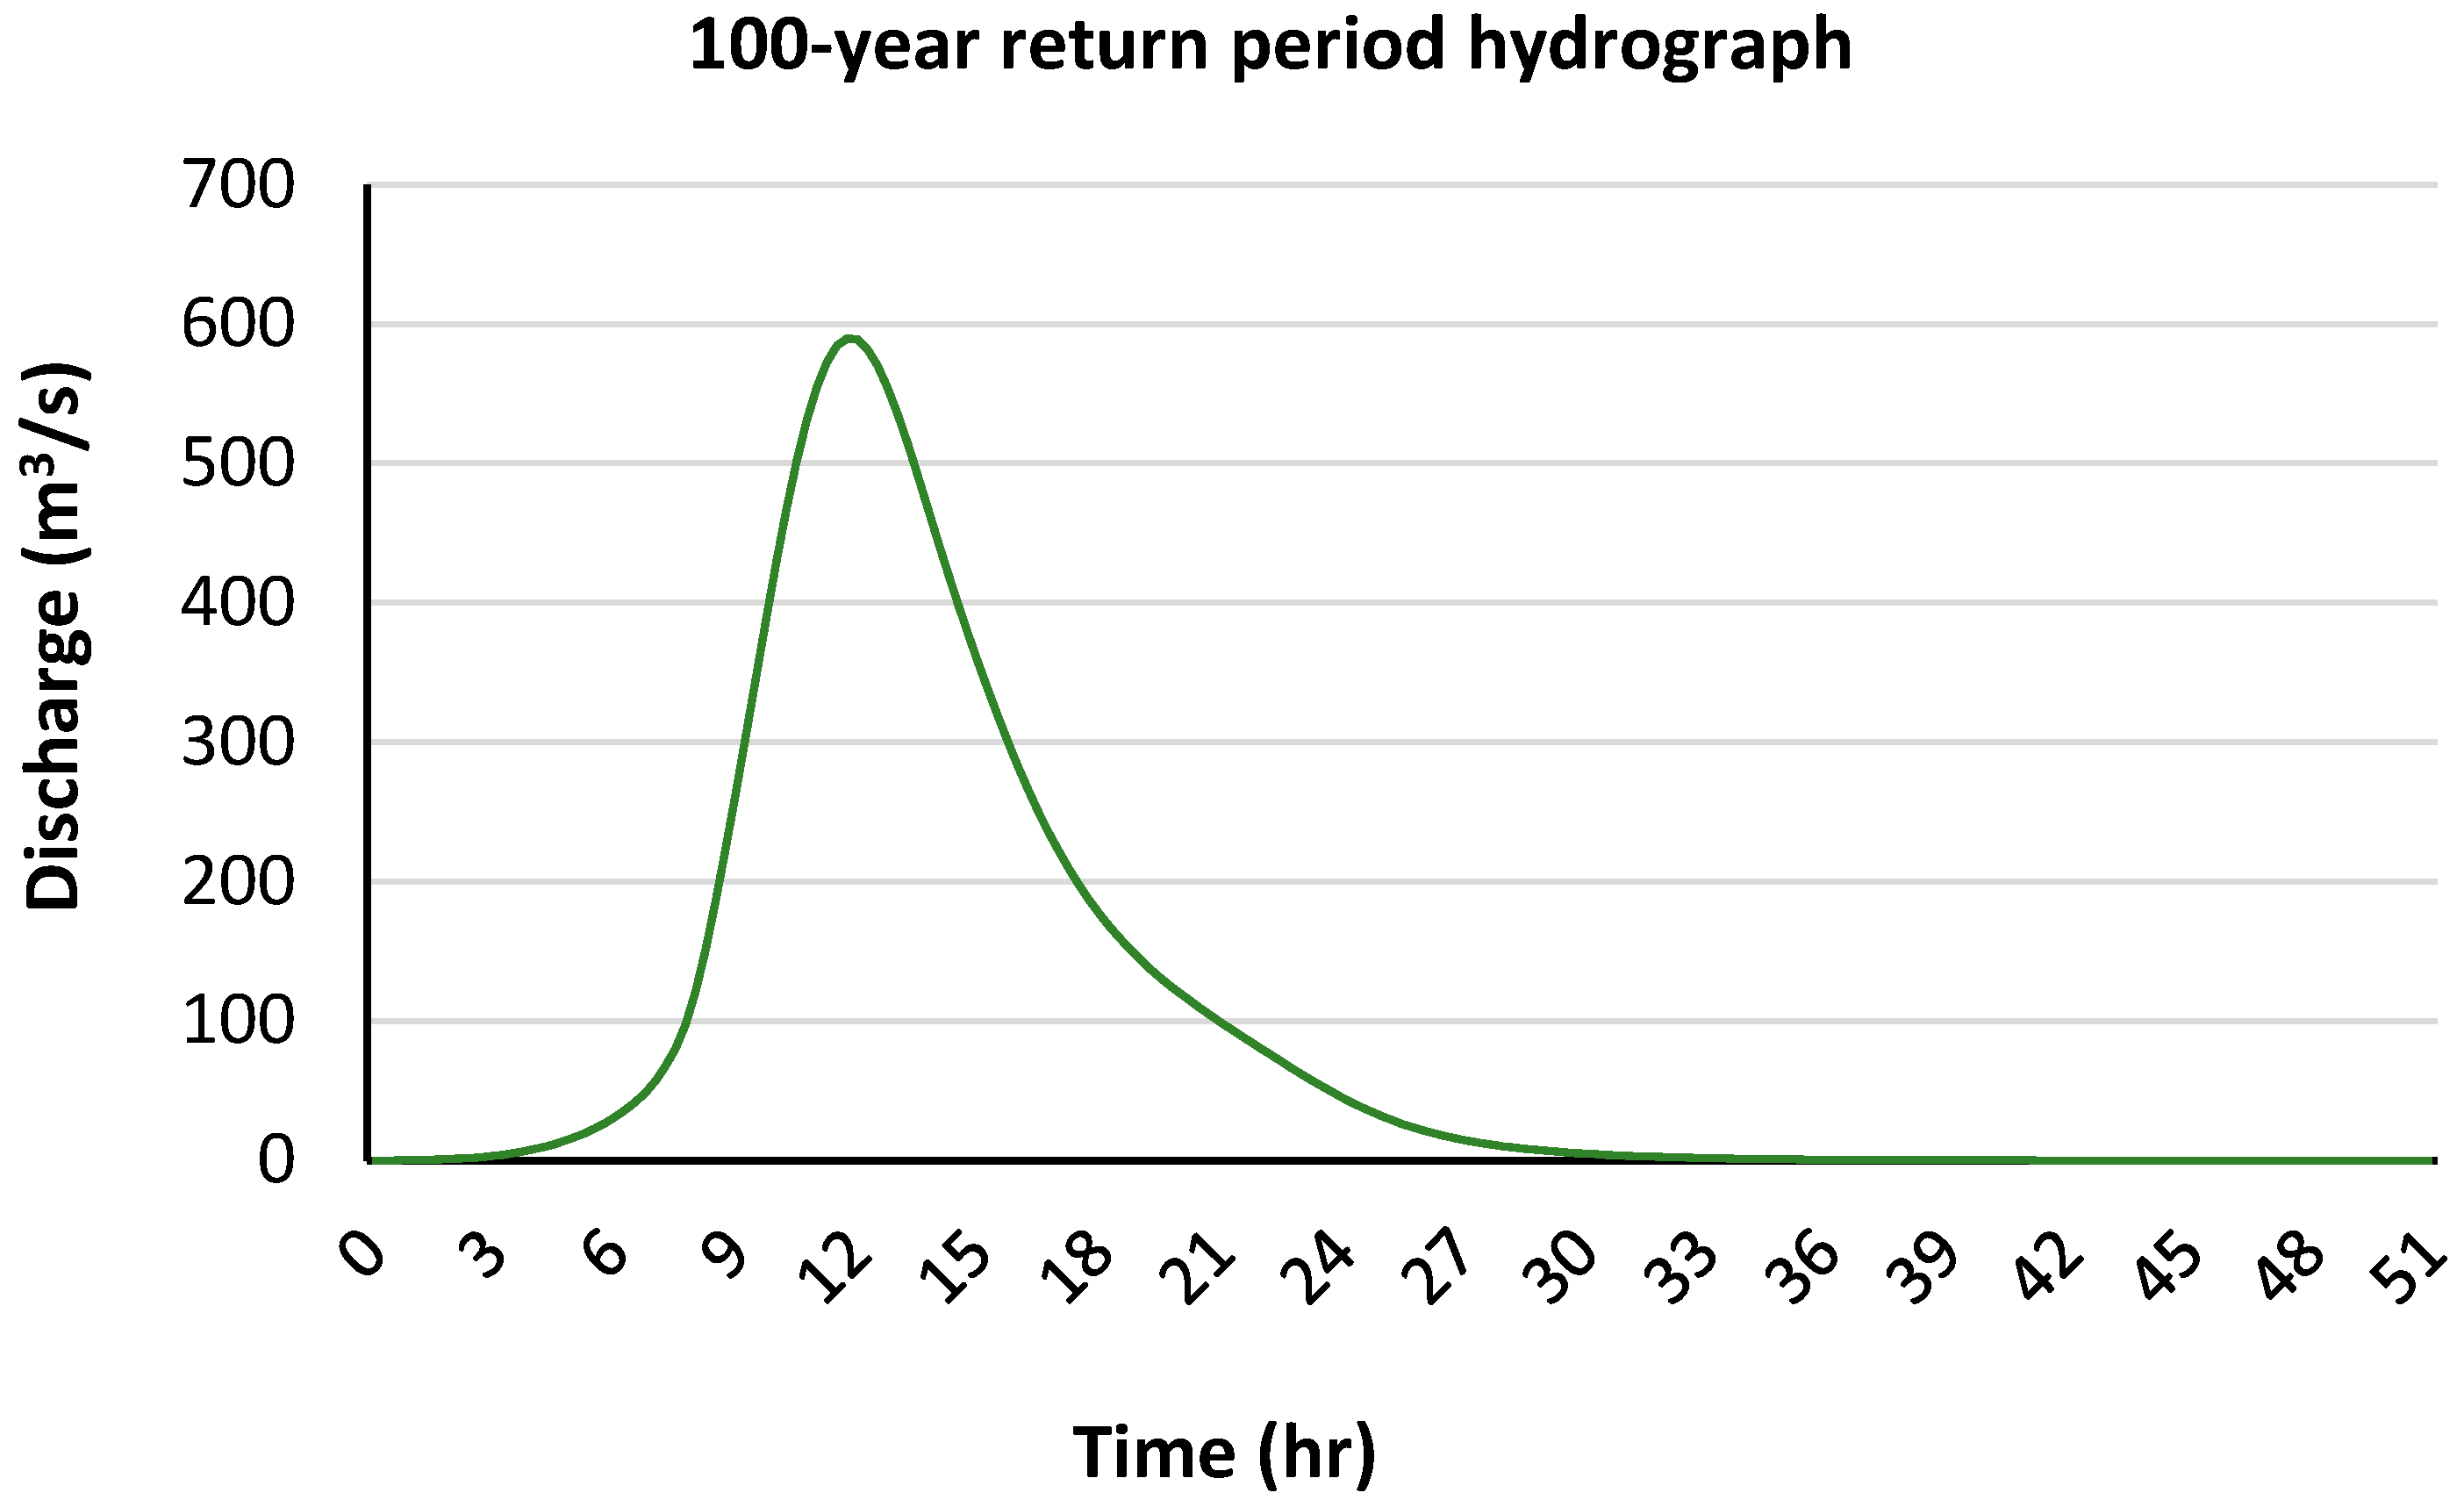
The 100-year return-period hydrograph was estimated with peak flow 589.7 m
3/s. The overall time for the flow is about 40 hrs.
Figure 10 illustrates the calculated hydrograph.
3.2. Flash Flood Intensity (FFI)
FFI resembles the external actions against the building structure. It contains many different aspects of the flood characteristics that can exacerbate the status of buildings. Moreover, FFI represents the flood parameters that have the main accountability in the hazard. According to [
44], there are many flood actions that may devastate buildings. Some of these actions involve the hydrostatic force that is promptly magnified with the rise in runoff. The second action is the hydrodynamic force that is generated from the flow movement. Moreover, buoyancy force is also one flood action that threatens to uplift the light buildings with the increase in the runoff outside buildings. These parameters have a direct relation to the potential damage magnitude to the buildings. In this research, four FFI parameters were opted to fully describe most of the collective actions that are caused by flash floods on a building scale. The adopted parameters are as follows:
Runoff depth is one of the major elements that can cause significant sabotage, particularly in urban regions. The rise of water in the streets can paralyze human movement and damage facilities that are sensitive to water interaction. Likewise, with the surge in runoff depth outside buildings, the water has a high potential to percolate the building’s external walls, which heralds losses in lives and property.
As flow celerity accelerates, the damage is expected to be greater because the flow movement can cause erosion to the infrastructure with the effect of hydrodynamic action. In addition, the flow motion is responsible for the spread of pollution and shifting of the debris from one place to another, which may barricade streets and clog sewage systems that were previously constructed to drain runoff.
The length of time in contact with runoff is a major influence in the severity of building damage [
7], since the flow may carry a hazardous material that can badly deteriorate the condition of outer walls of buildings. Moreover, the longer time that water remains outside the building, the more possibility there is for the flow to infiltrate the buildings’ external walls.
This parameter represents the length of a building’s perimeter that is in direct contact with the runoff. The affected potion of the building is approximately tantamount to the entire building’s perimeter [
24]. This proposition may be debunked in the case of some building’s facades that are directly connected to neighboring structures. The runoff duration was added to the FFI formula as a novel aspect to obtain a more representative index of the flood impacts on the buildings.
Equation (6) depicts the FFI formula. This equation was adapted from [
24].
The adopted FFI criteria with the corresponding factors are shown in
Table 4. These data were modified after [
24,
29].
3.3. Pre-Mitigation Results
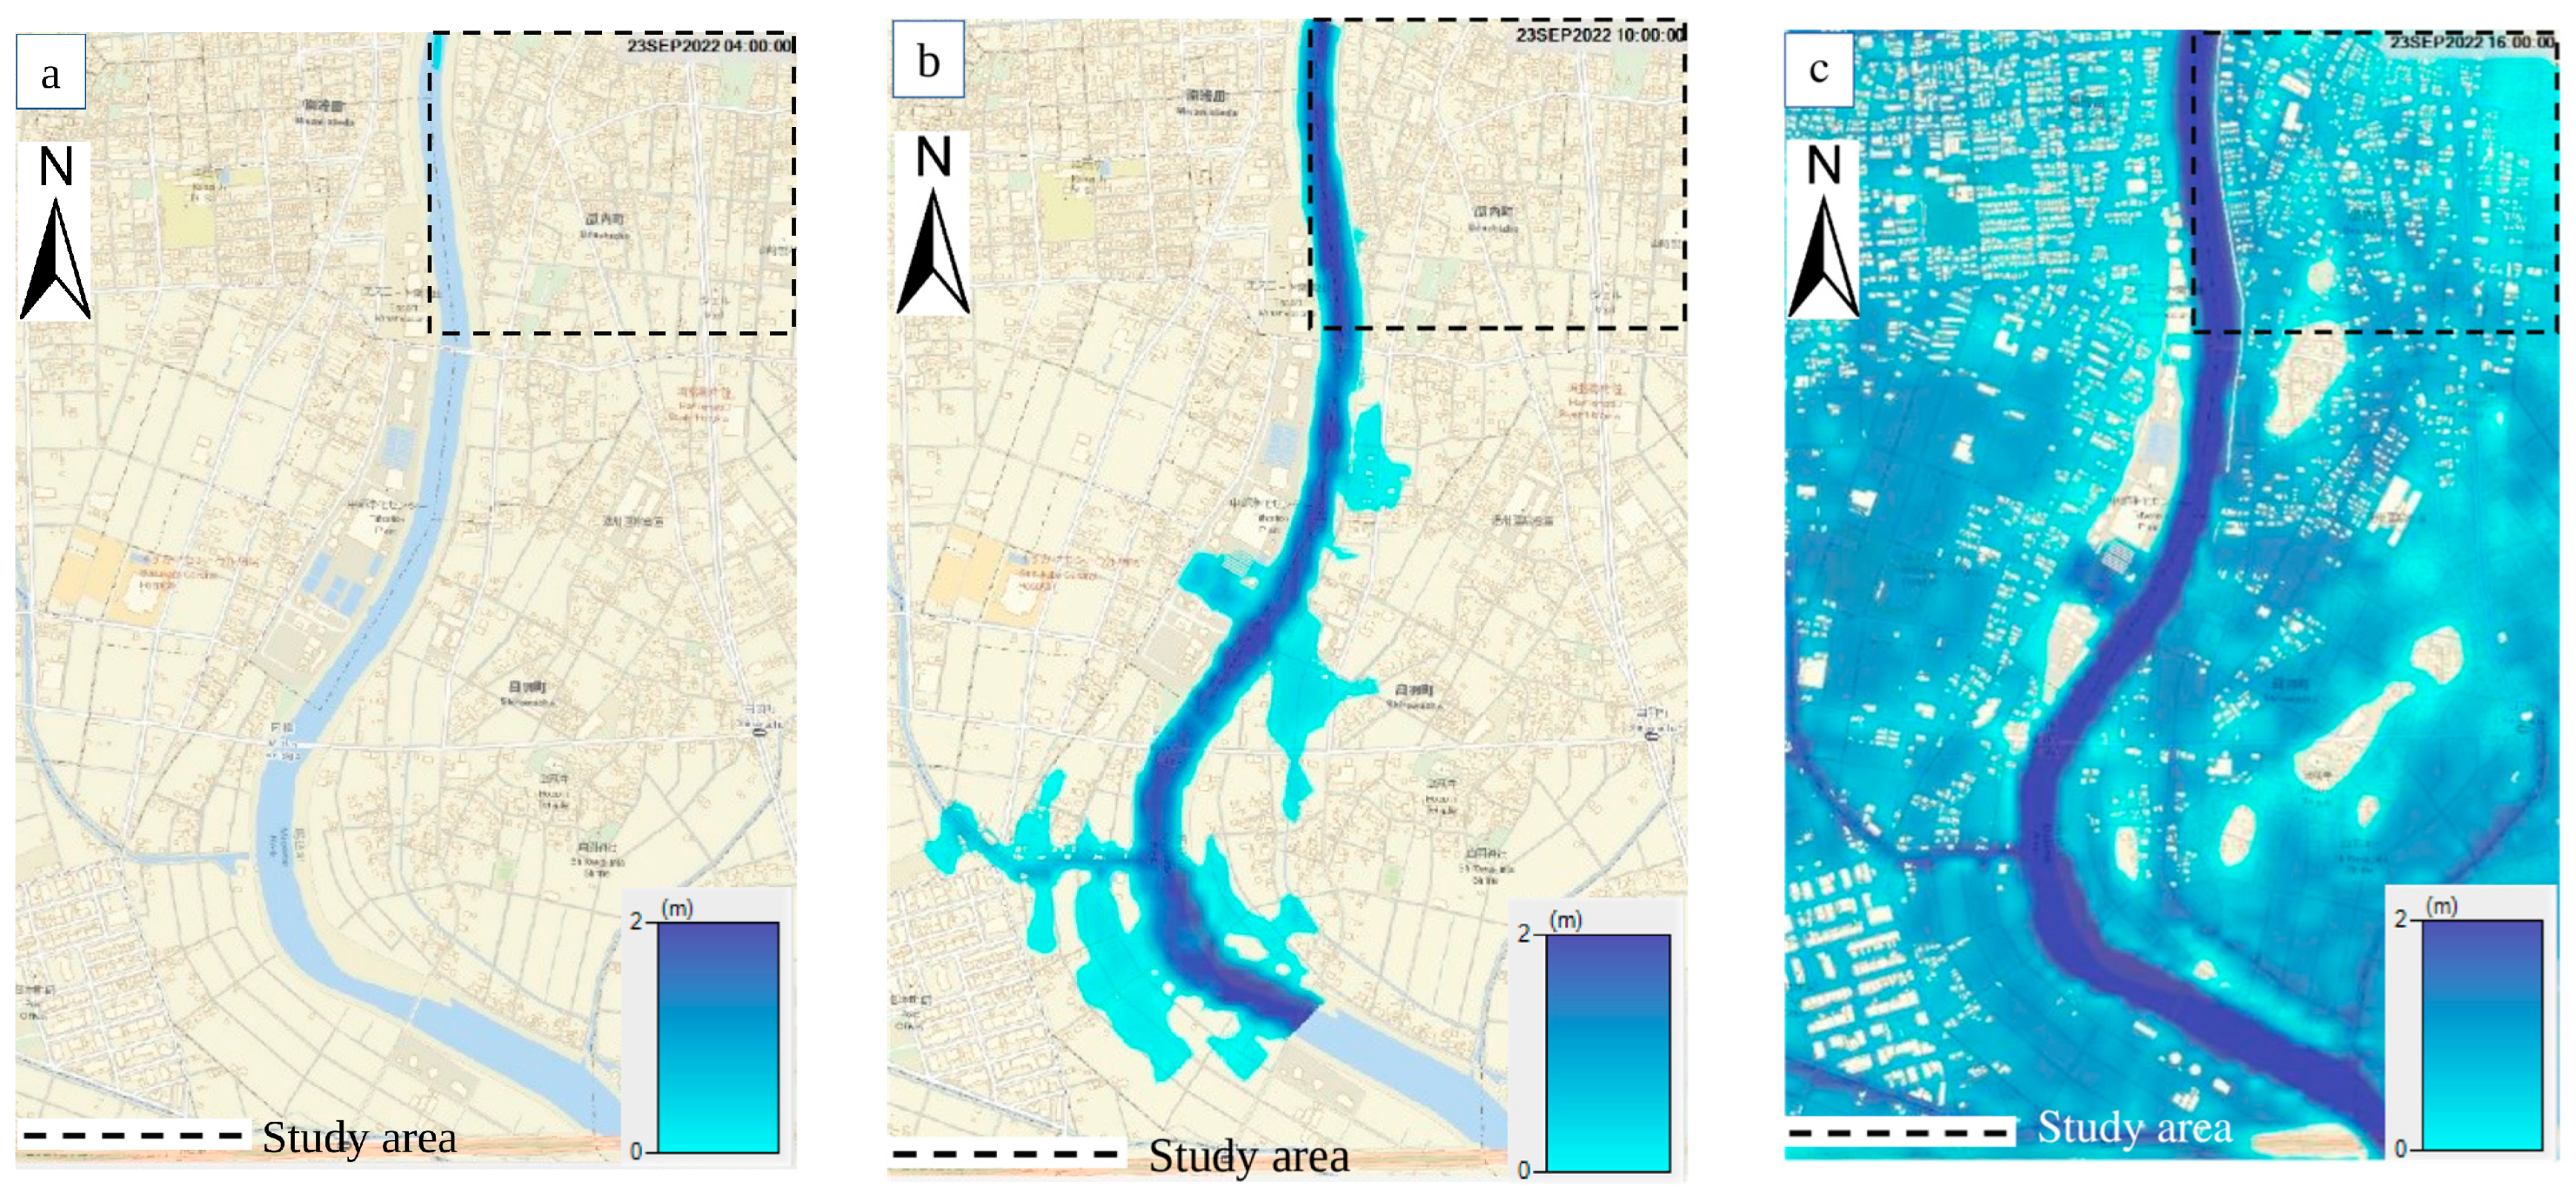
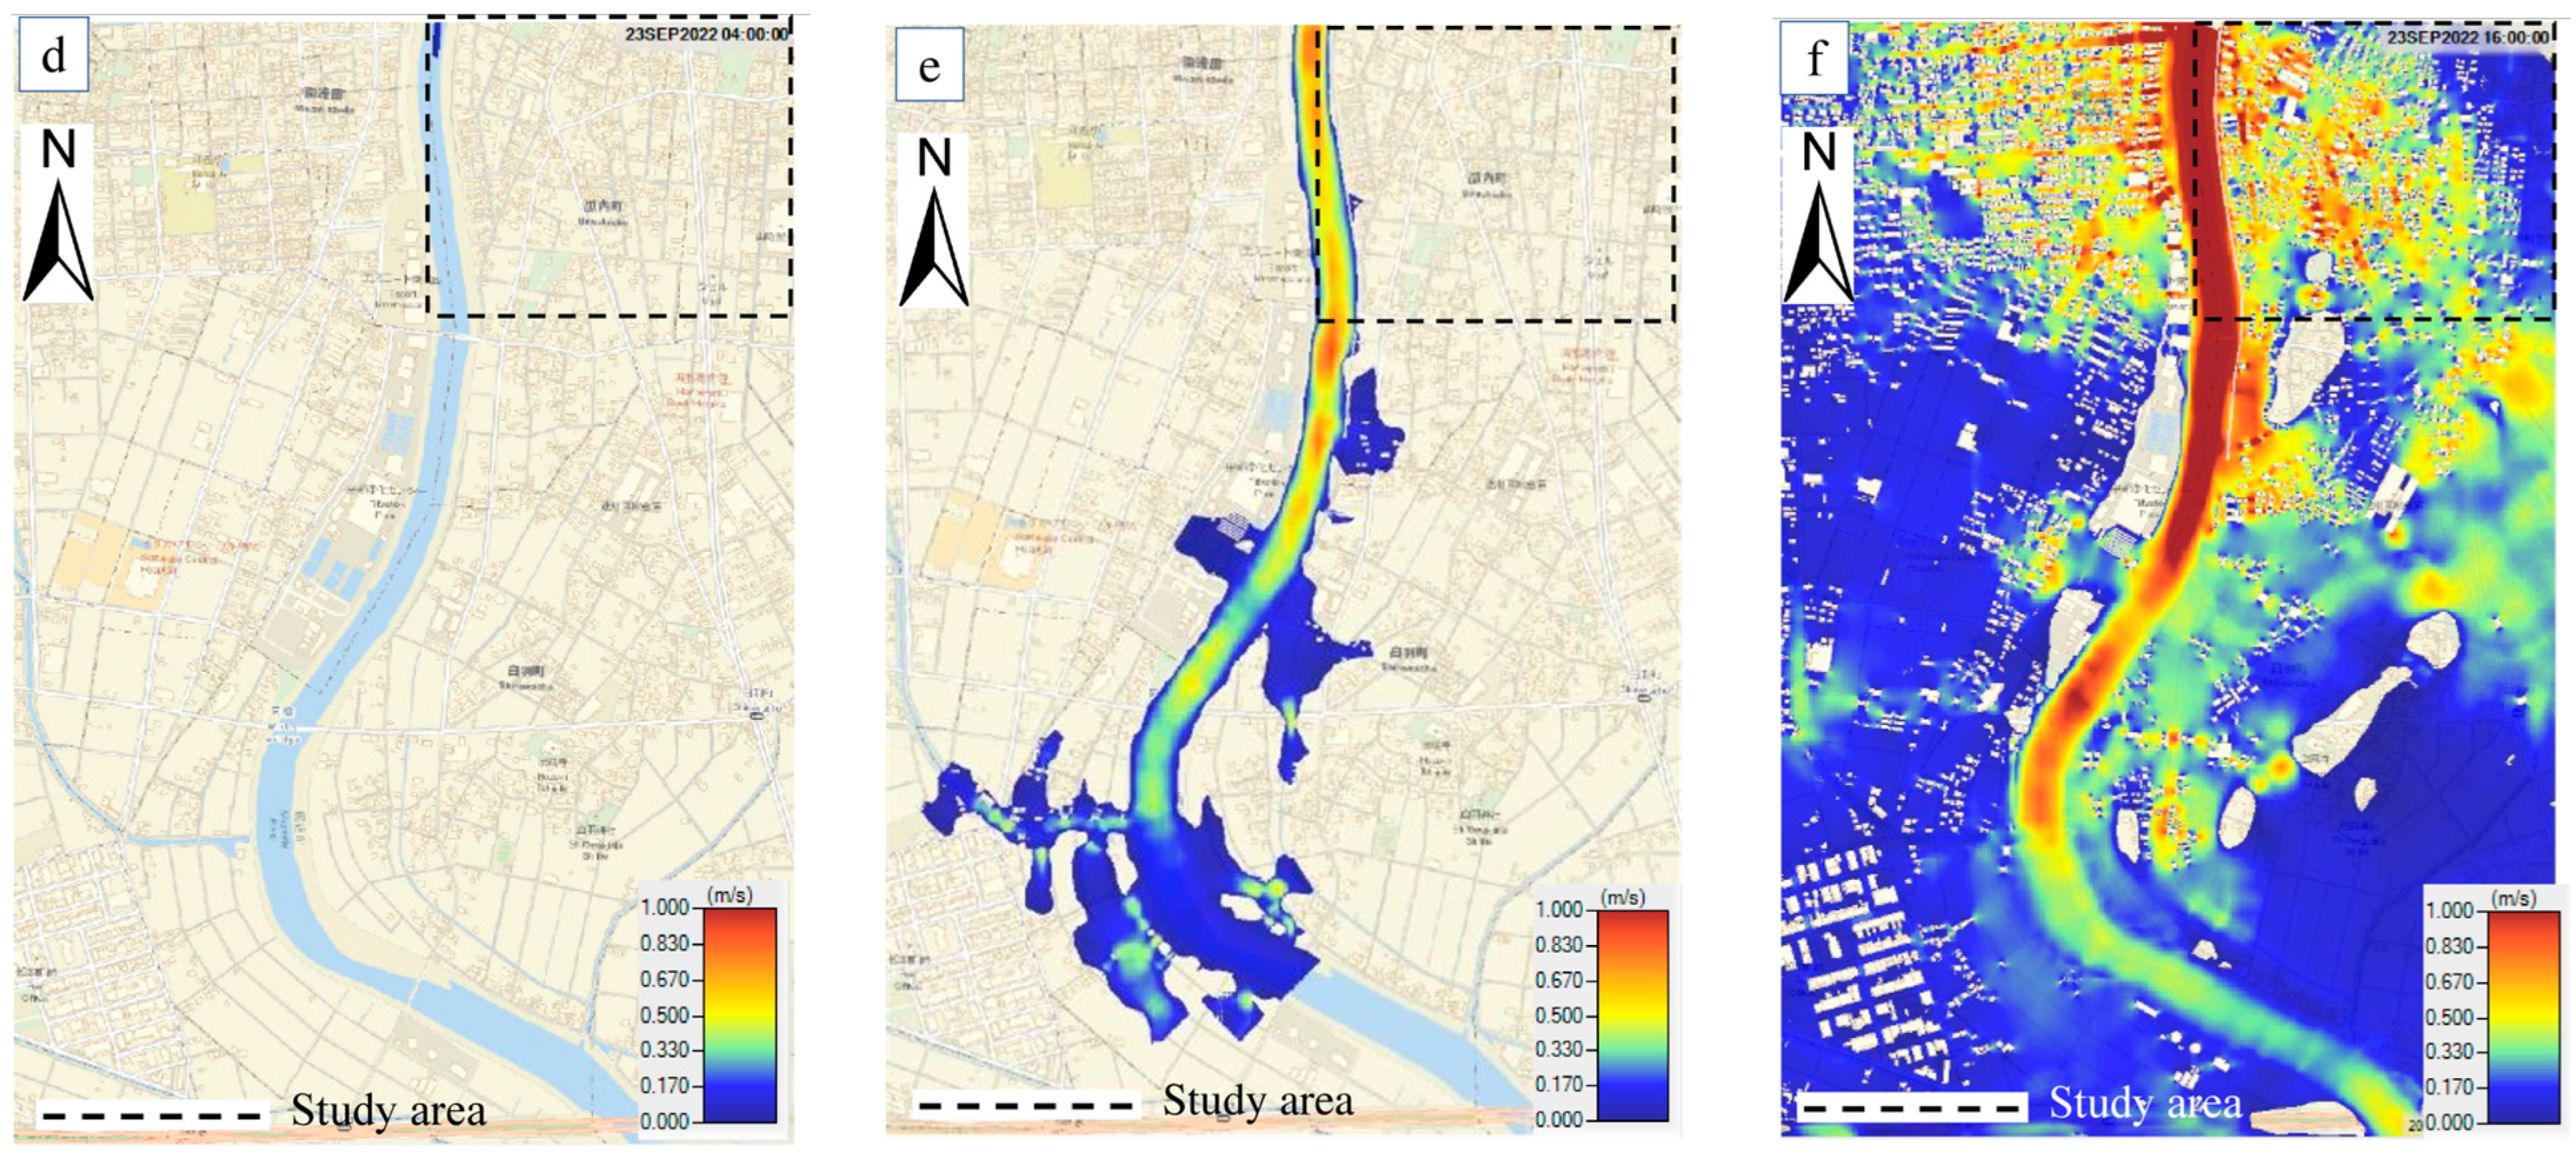
The FFI data contain four parameters: runoff depth, runoff velocity, runoff duration, and affected portion. The runoff propagation and runoff velocity were spatially mapped for a time step of 6 hr, as shown in
Figure 11a–f. After about 18 hr from the outset of the storm, the flow inundated most of the study area. It is logically observed that when comparing the region’s elevation map with the estimated floodplain map, the concentration of the flow is anticipated to accrue in the lower-lying region where the likelihood of flood hazard is projected to be considerably elevated, as deduced by previous studies [
29,
45]. The region has an area of about 35 hectares containing 938 buildings. It is worth noting that some buildings located in no-data pixels were assumed to have the maximum value of the nearest pixel.
Four results were obtained from the hydrodynamic model (RD, RV, RT, and AP). The values from each output were classified according to ranges shown in
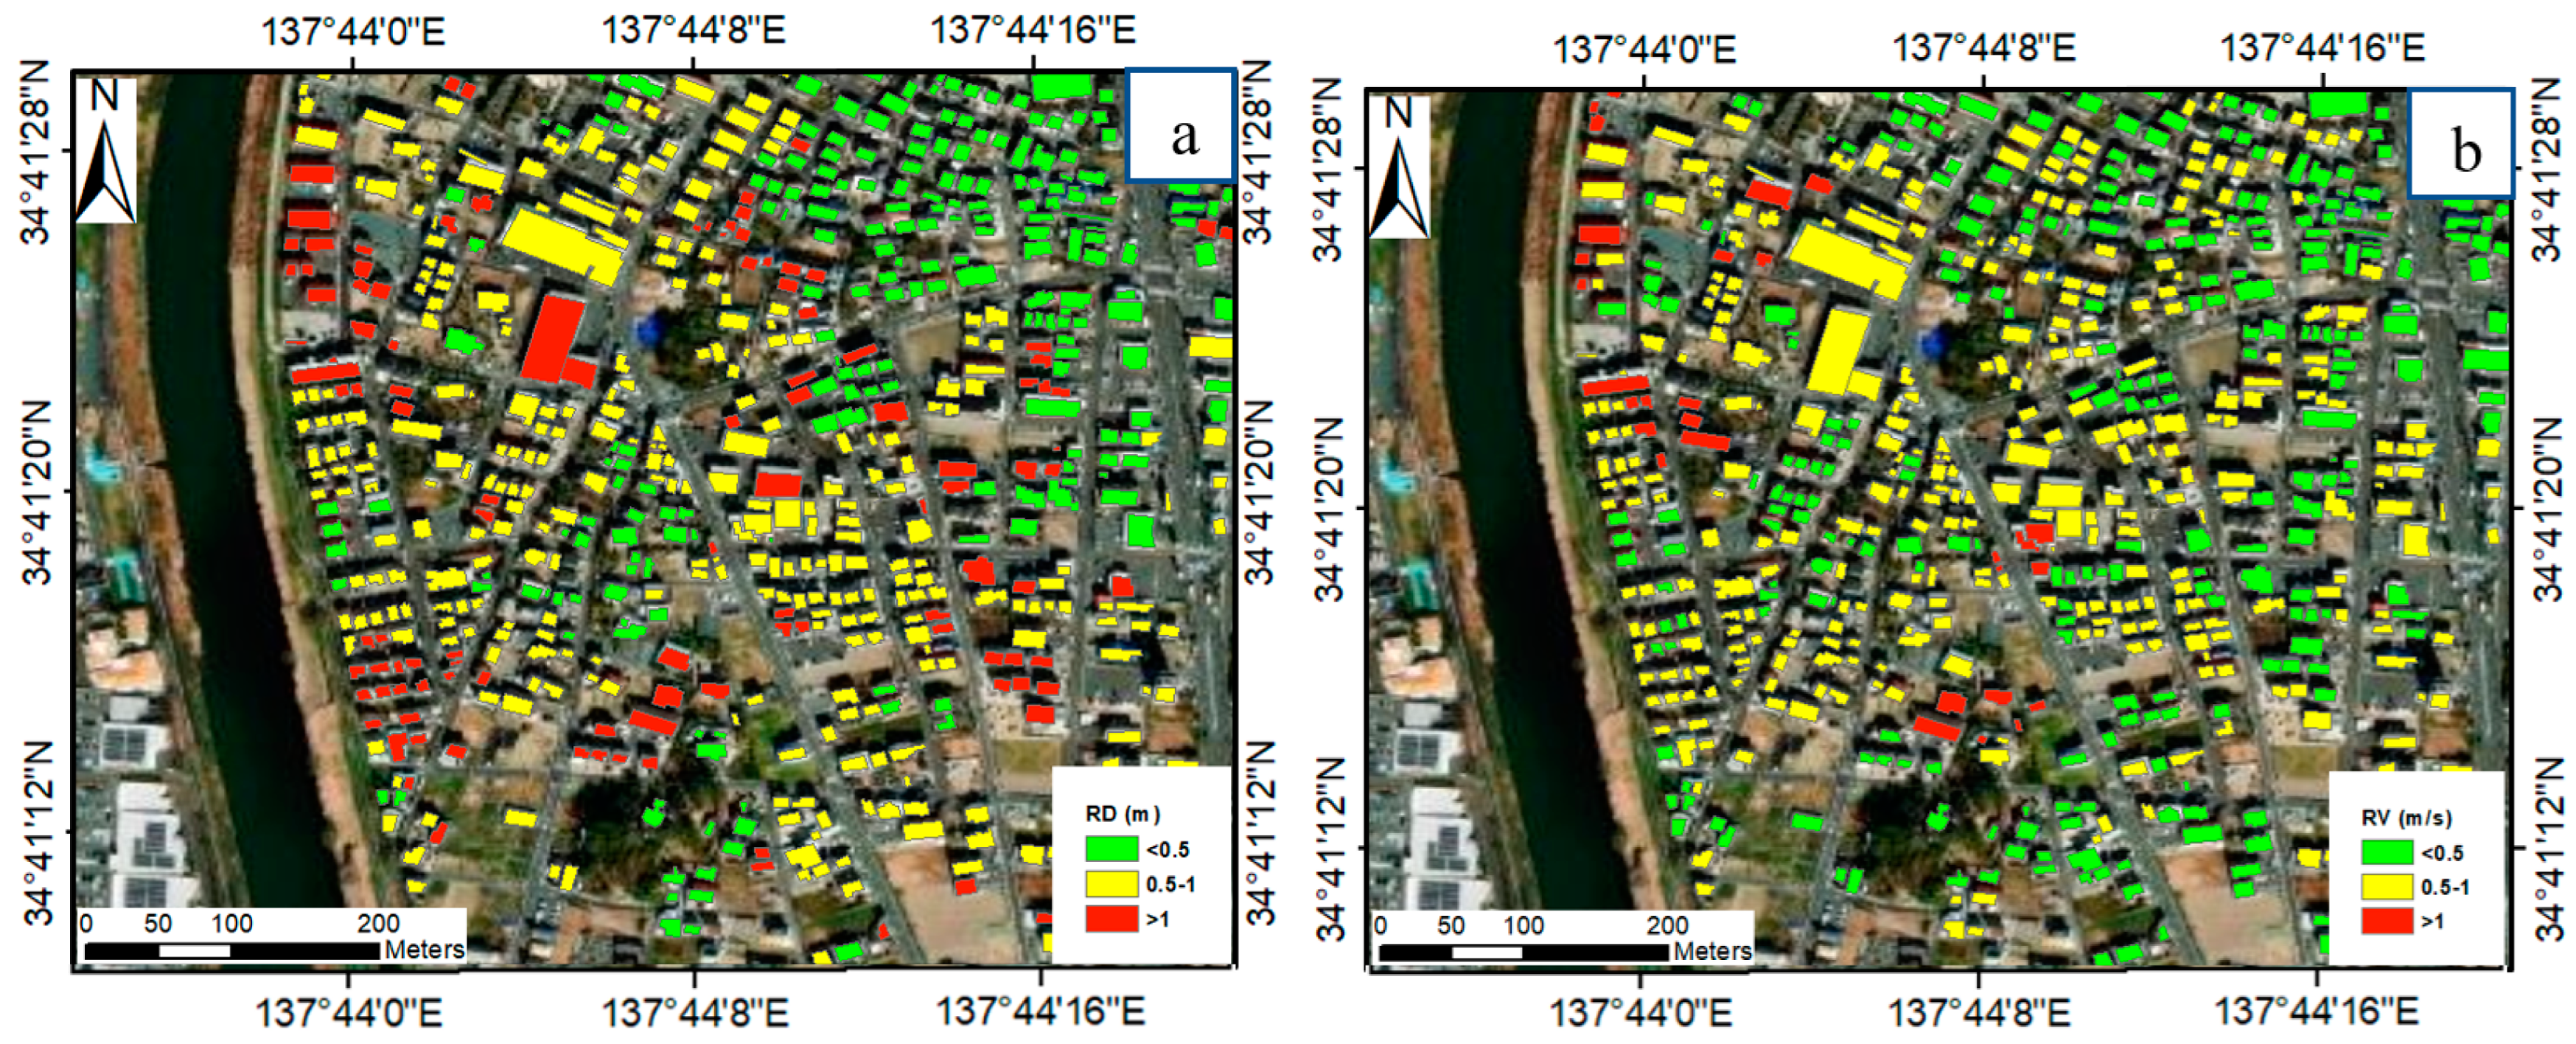
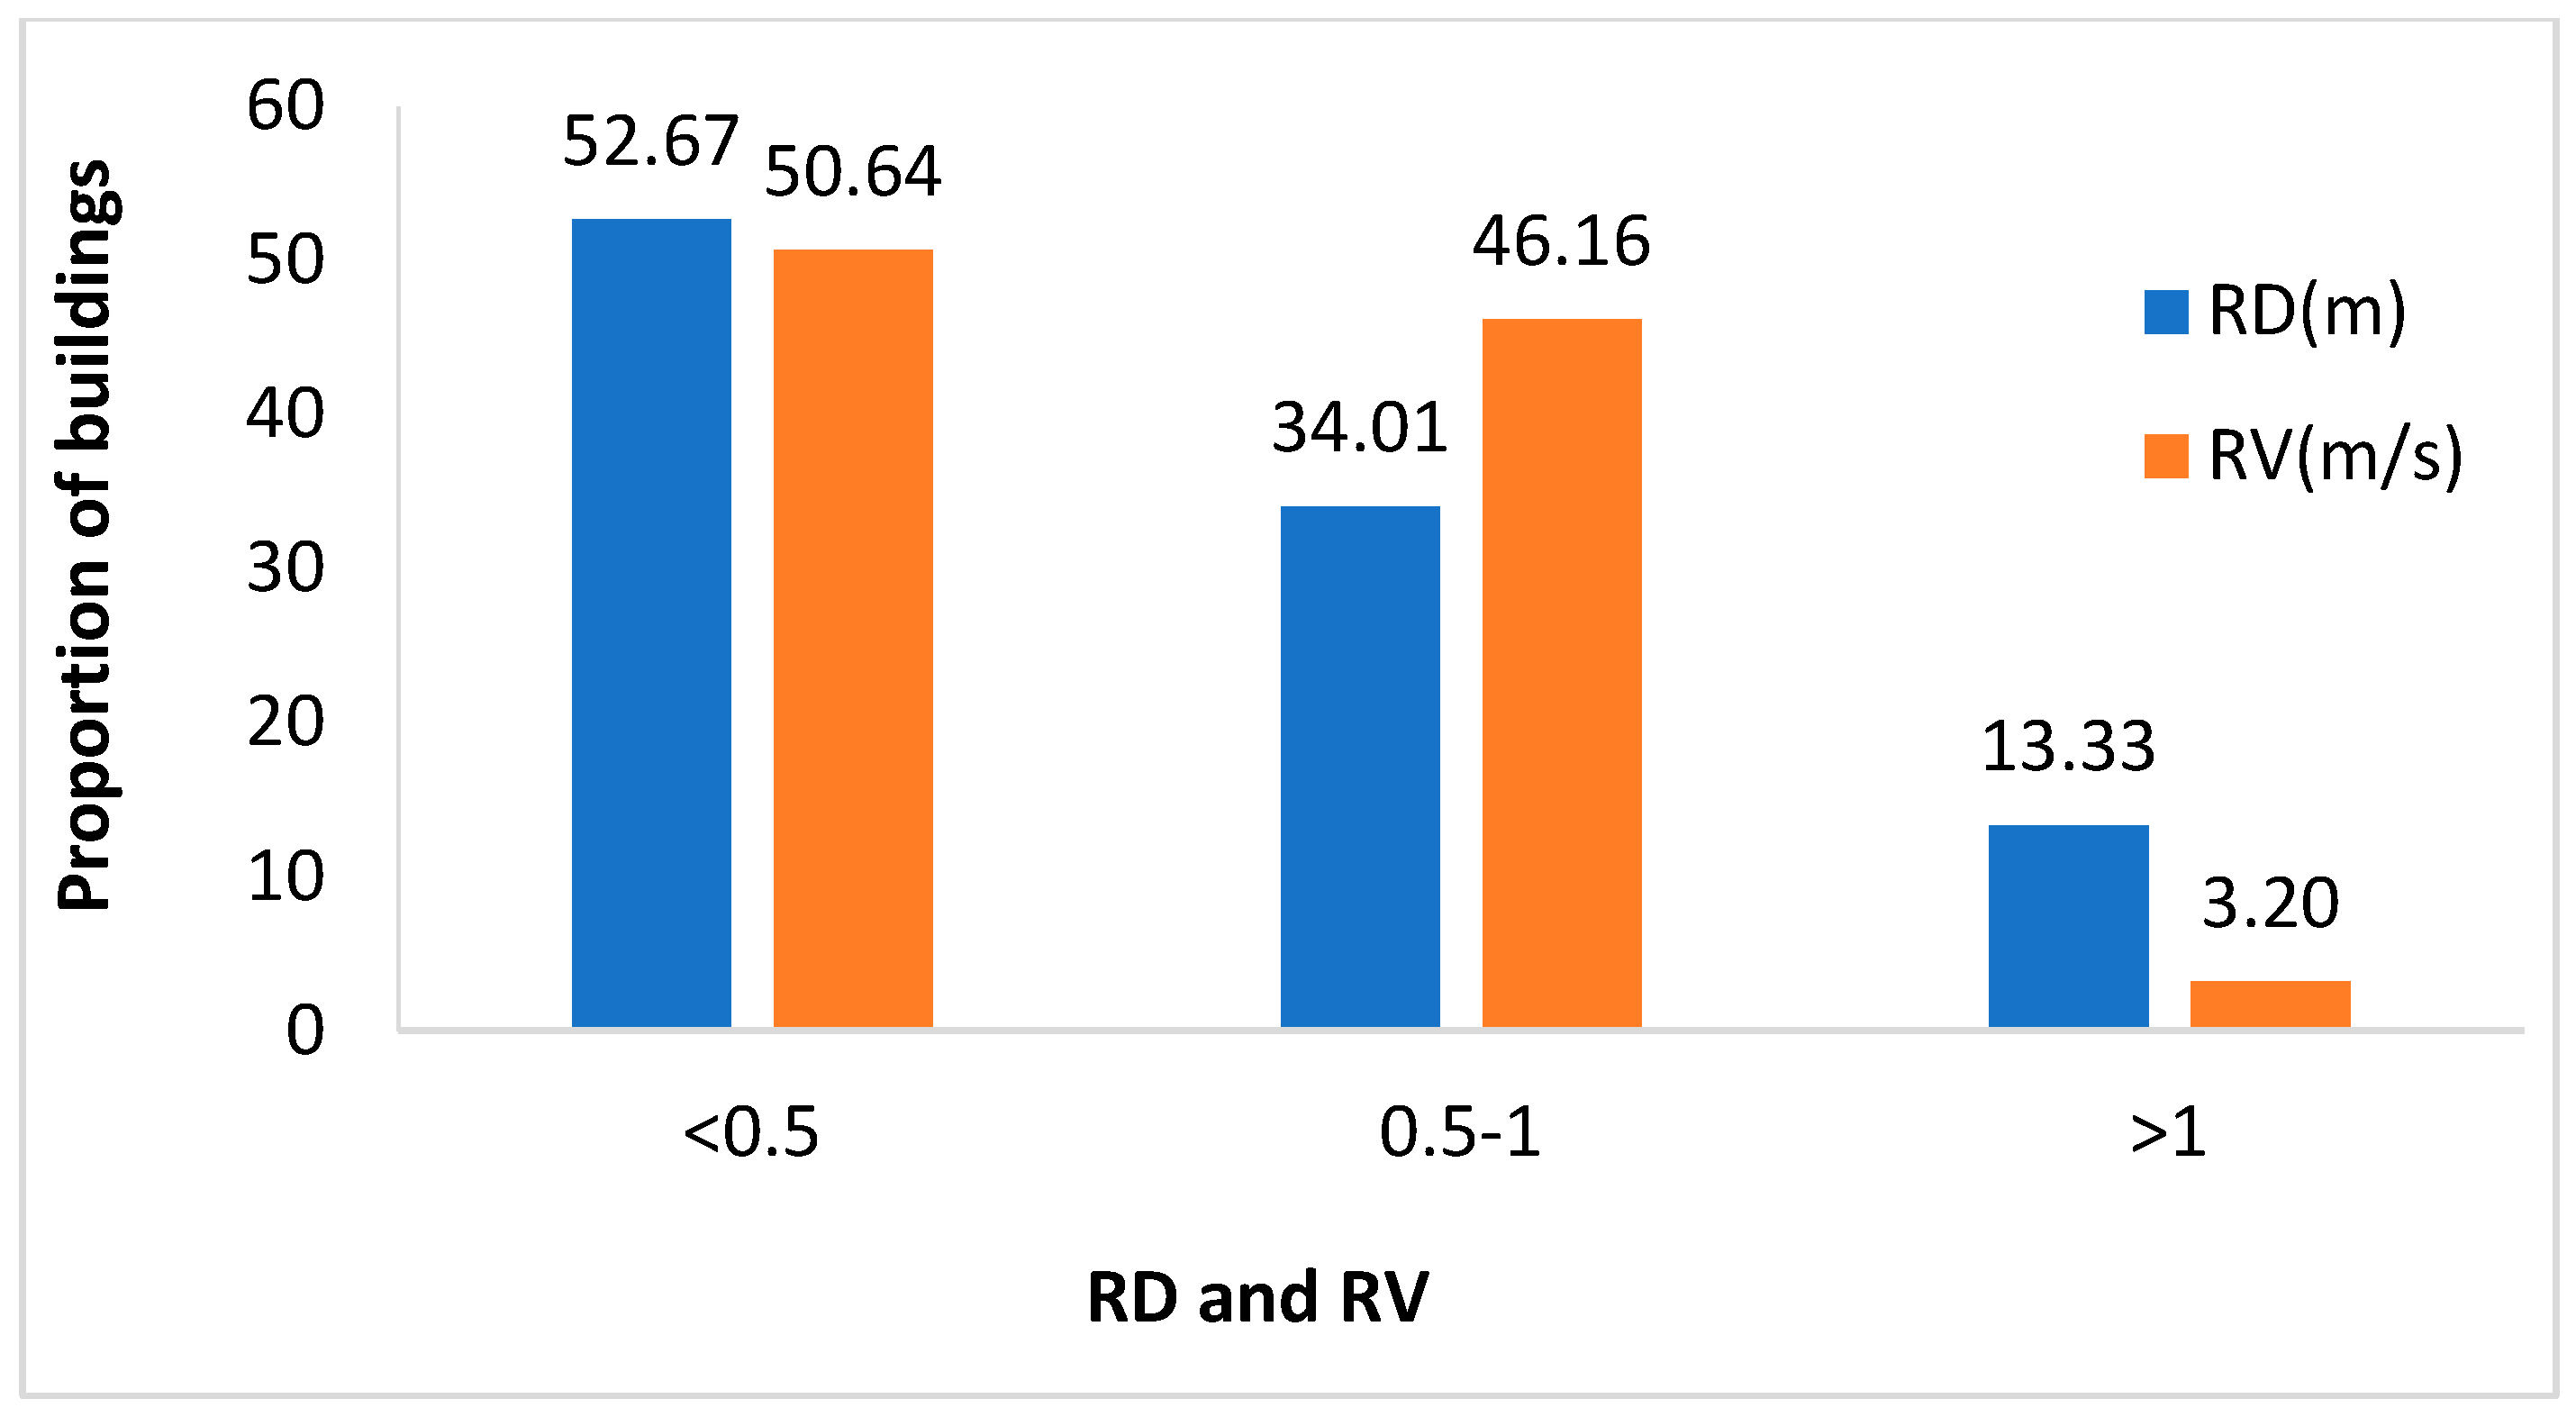
Table 4. In terms of the runoff depth (RD), just over half of the buildings have water depths of less than 0.5 m. Moreover, nearly one-third of the houses have inundation depth ranging between 0.5 and 1 m, whilst more than one-tenth of buildings have a runoff depth above 1 m. Most of buildings that experience a water level of more than 1 m are in the riverbank and middle of the studied region. However, buildings that have a runoff depth that is less than 0.5 m are mostly in the northeast of the area.
In terms of runoff velocity, despite a slight count of buildings (about 3%) that encounter a very high speed of flow that exceeds 1 m/s, buildings that confront runoff velocity less than 0.5 m/s and between 0.5 and 1 m/s represent around 50% and 47% of all the buildings, respectively; see
Figure 12a,b and
Figure 13.
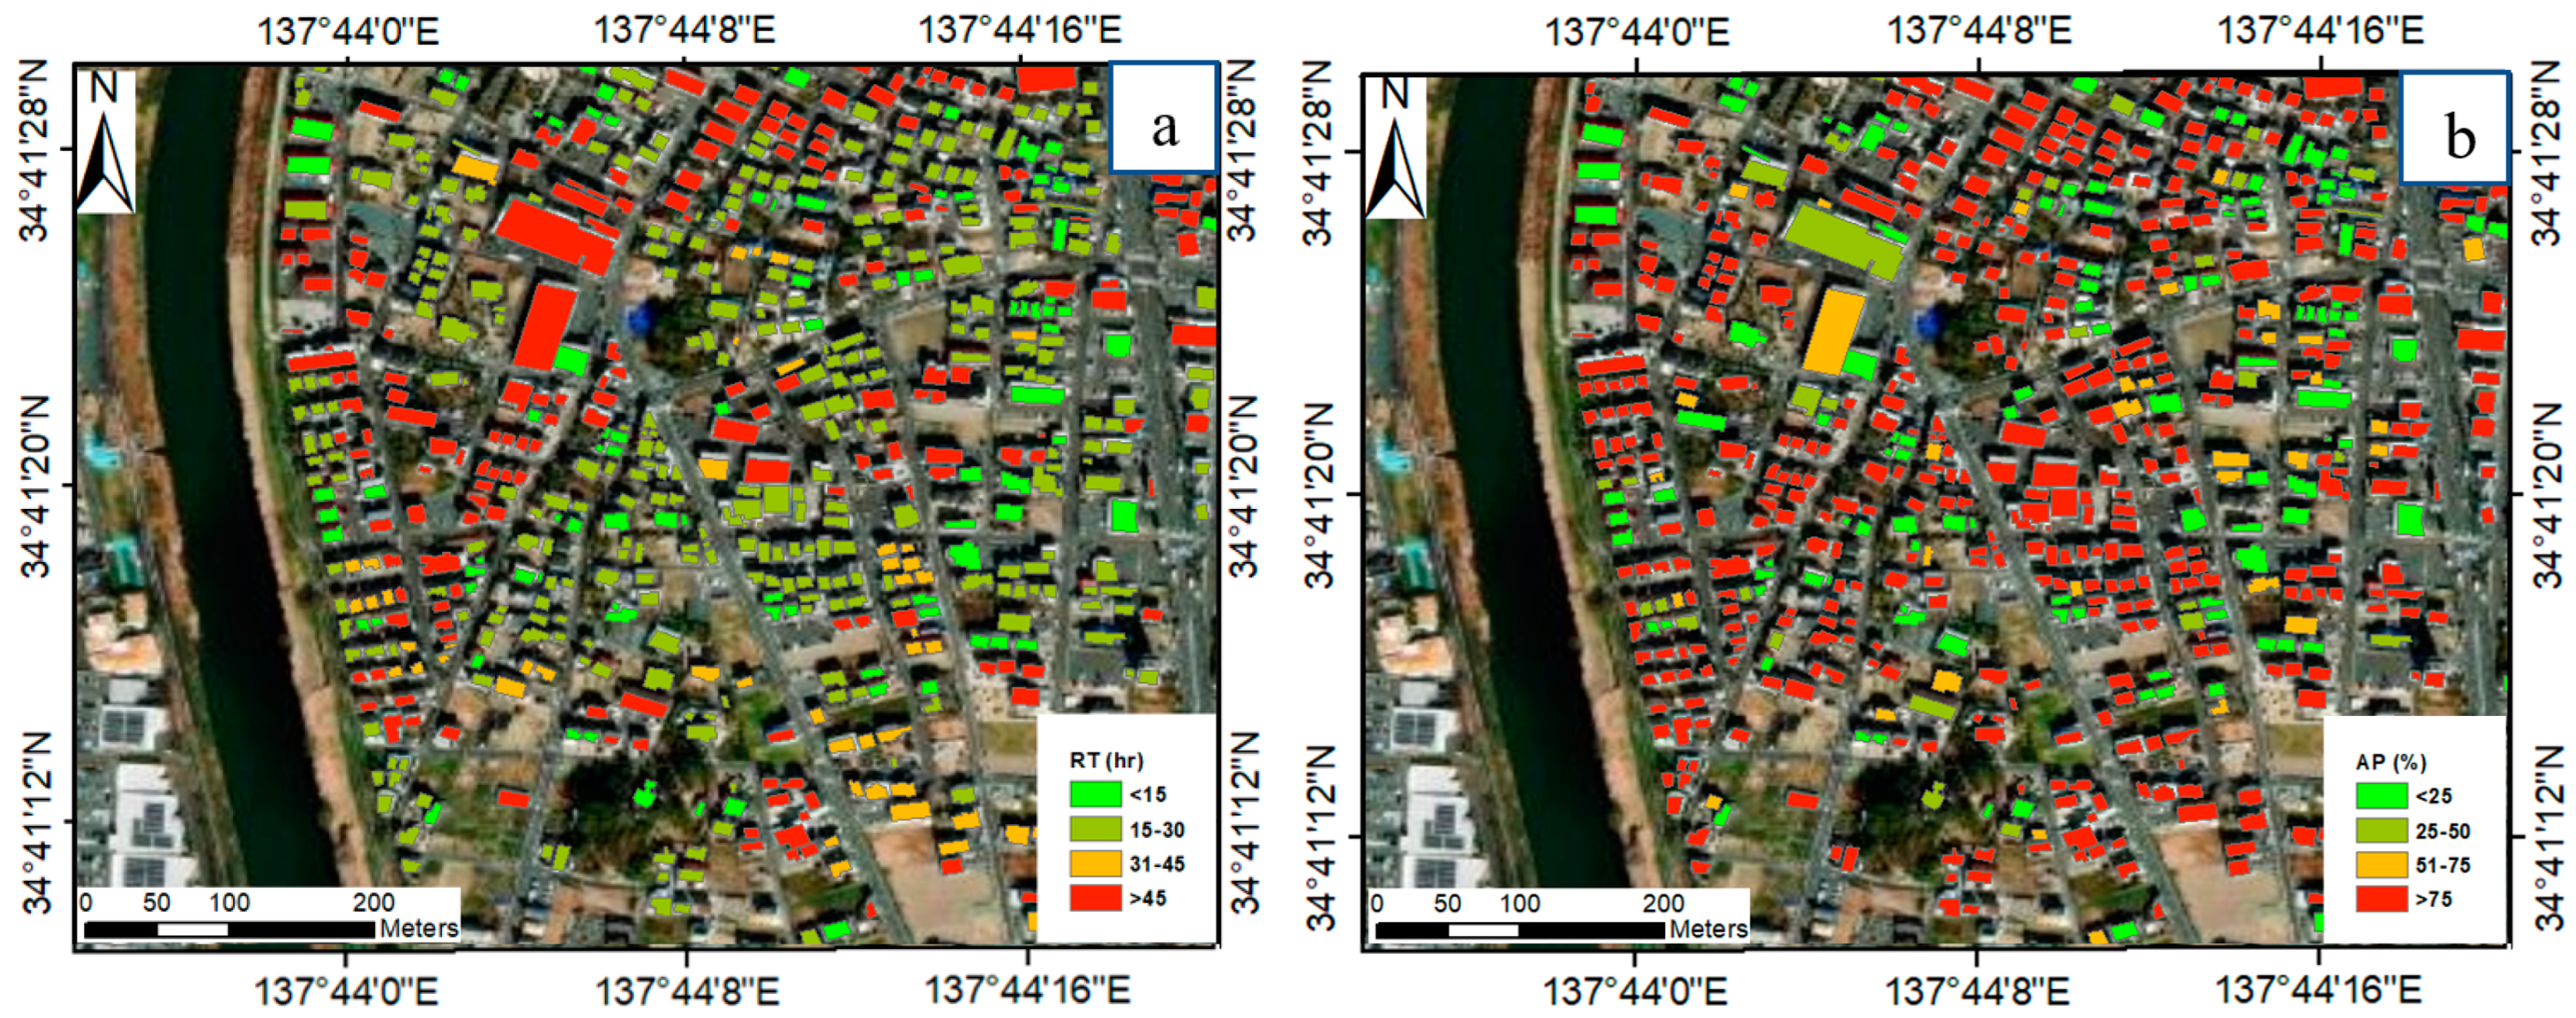
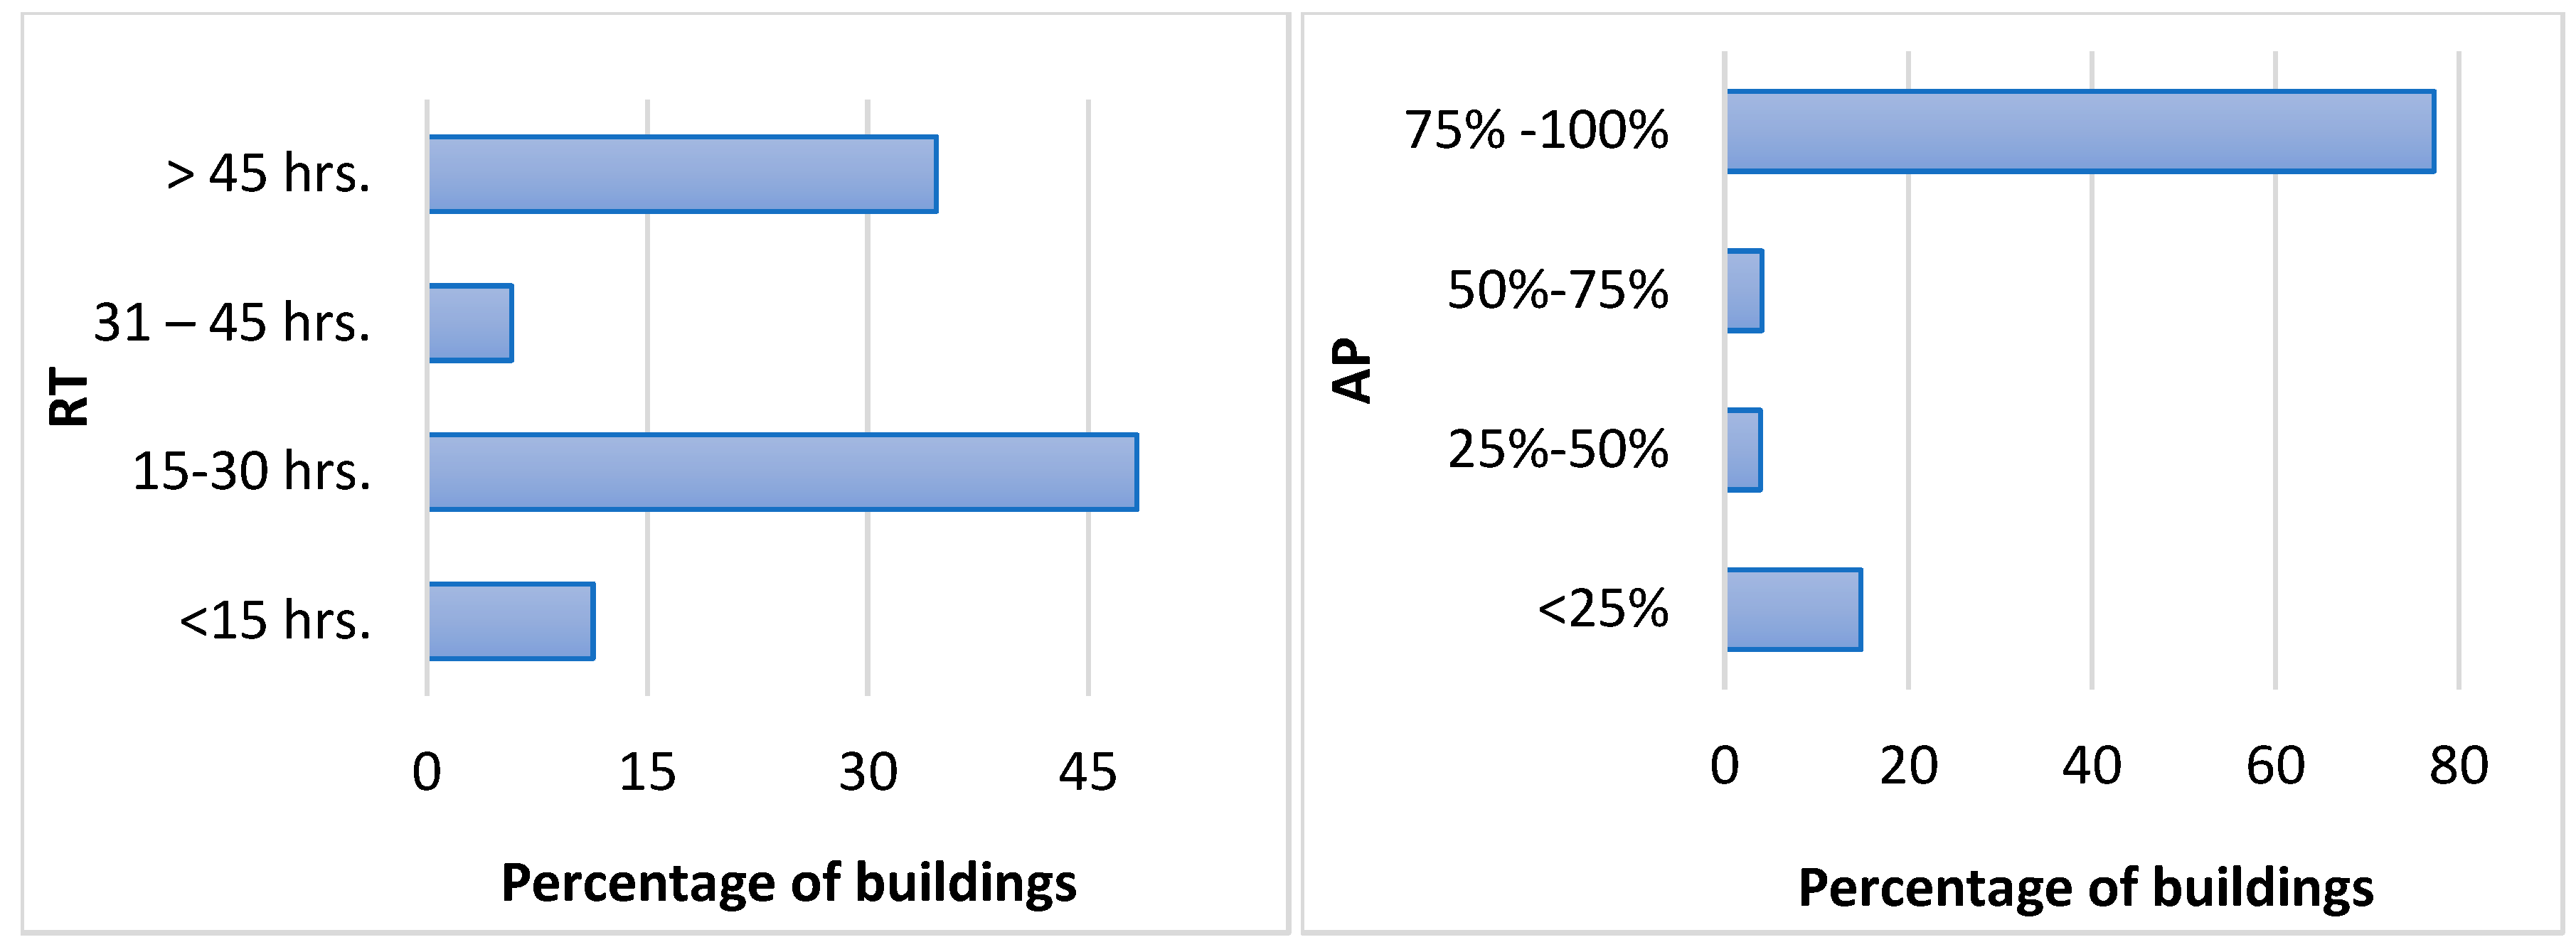
Furthermore, just above one-tenth of the buildings will face inundation that lasts for less than 15 hrs. Nevertheless, approximately one-half of them have a duration ranging between 15 and 30 hrs. In addition, more than one-third of the buildings experience runoff for nearly two days. These buildings are overwhelmingly distributed in the riverbank and northern part of the studied area.
Figure 14a,b and
Figure 15 portray the spatial distribution of buildings in terms of RT and AP, and the proportion of buildings classified as RT and AP.
The fourth FFI parameter is the affected portion (AP). As described in
Figure 14b and
Figure 15, the vast majority of buildings are contacted by water, ranging from three-quarters to the entire building perimeter. These buildings are located in most of the study area. Less than one-fifth of the buildings, however, have water contacting less than one-quarter of the building’s circumference.
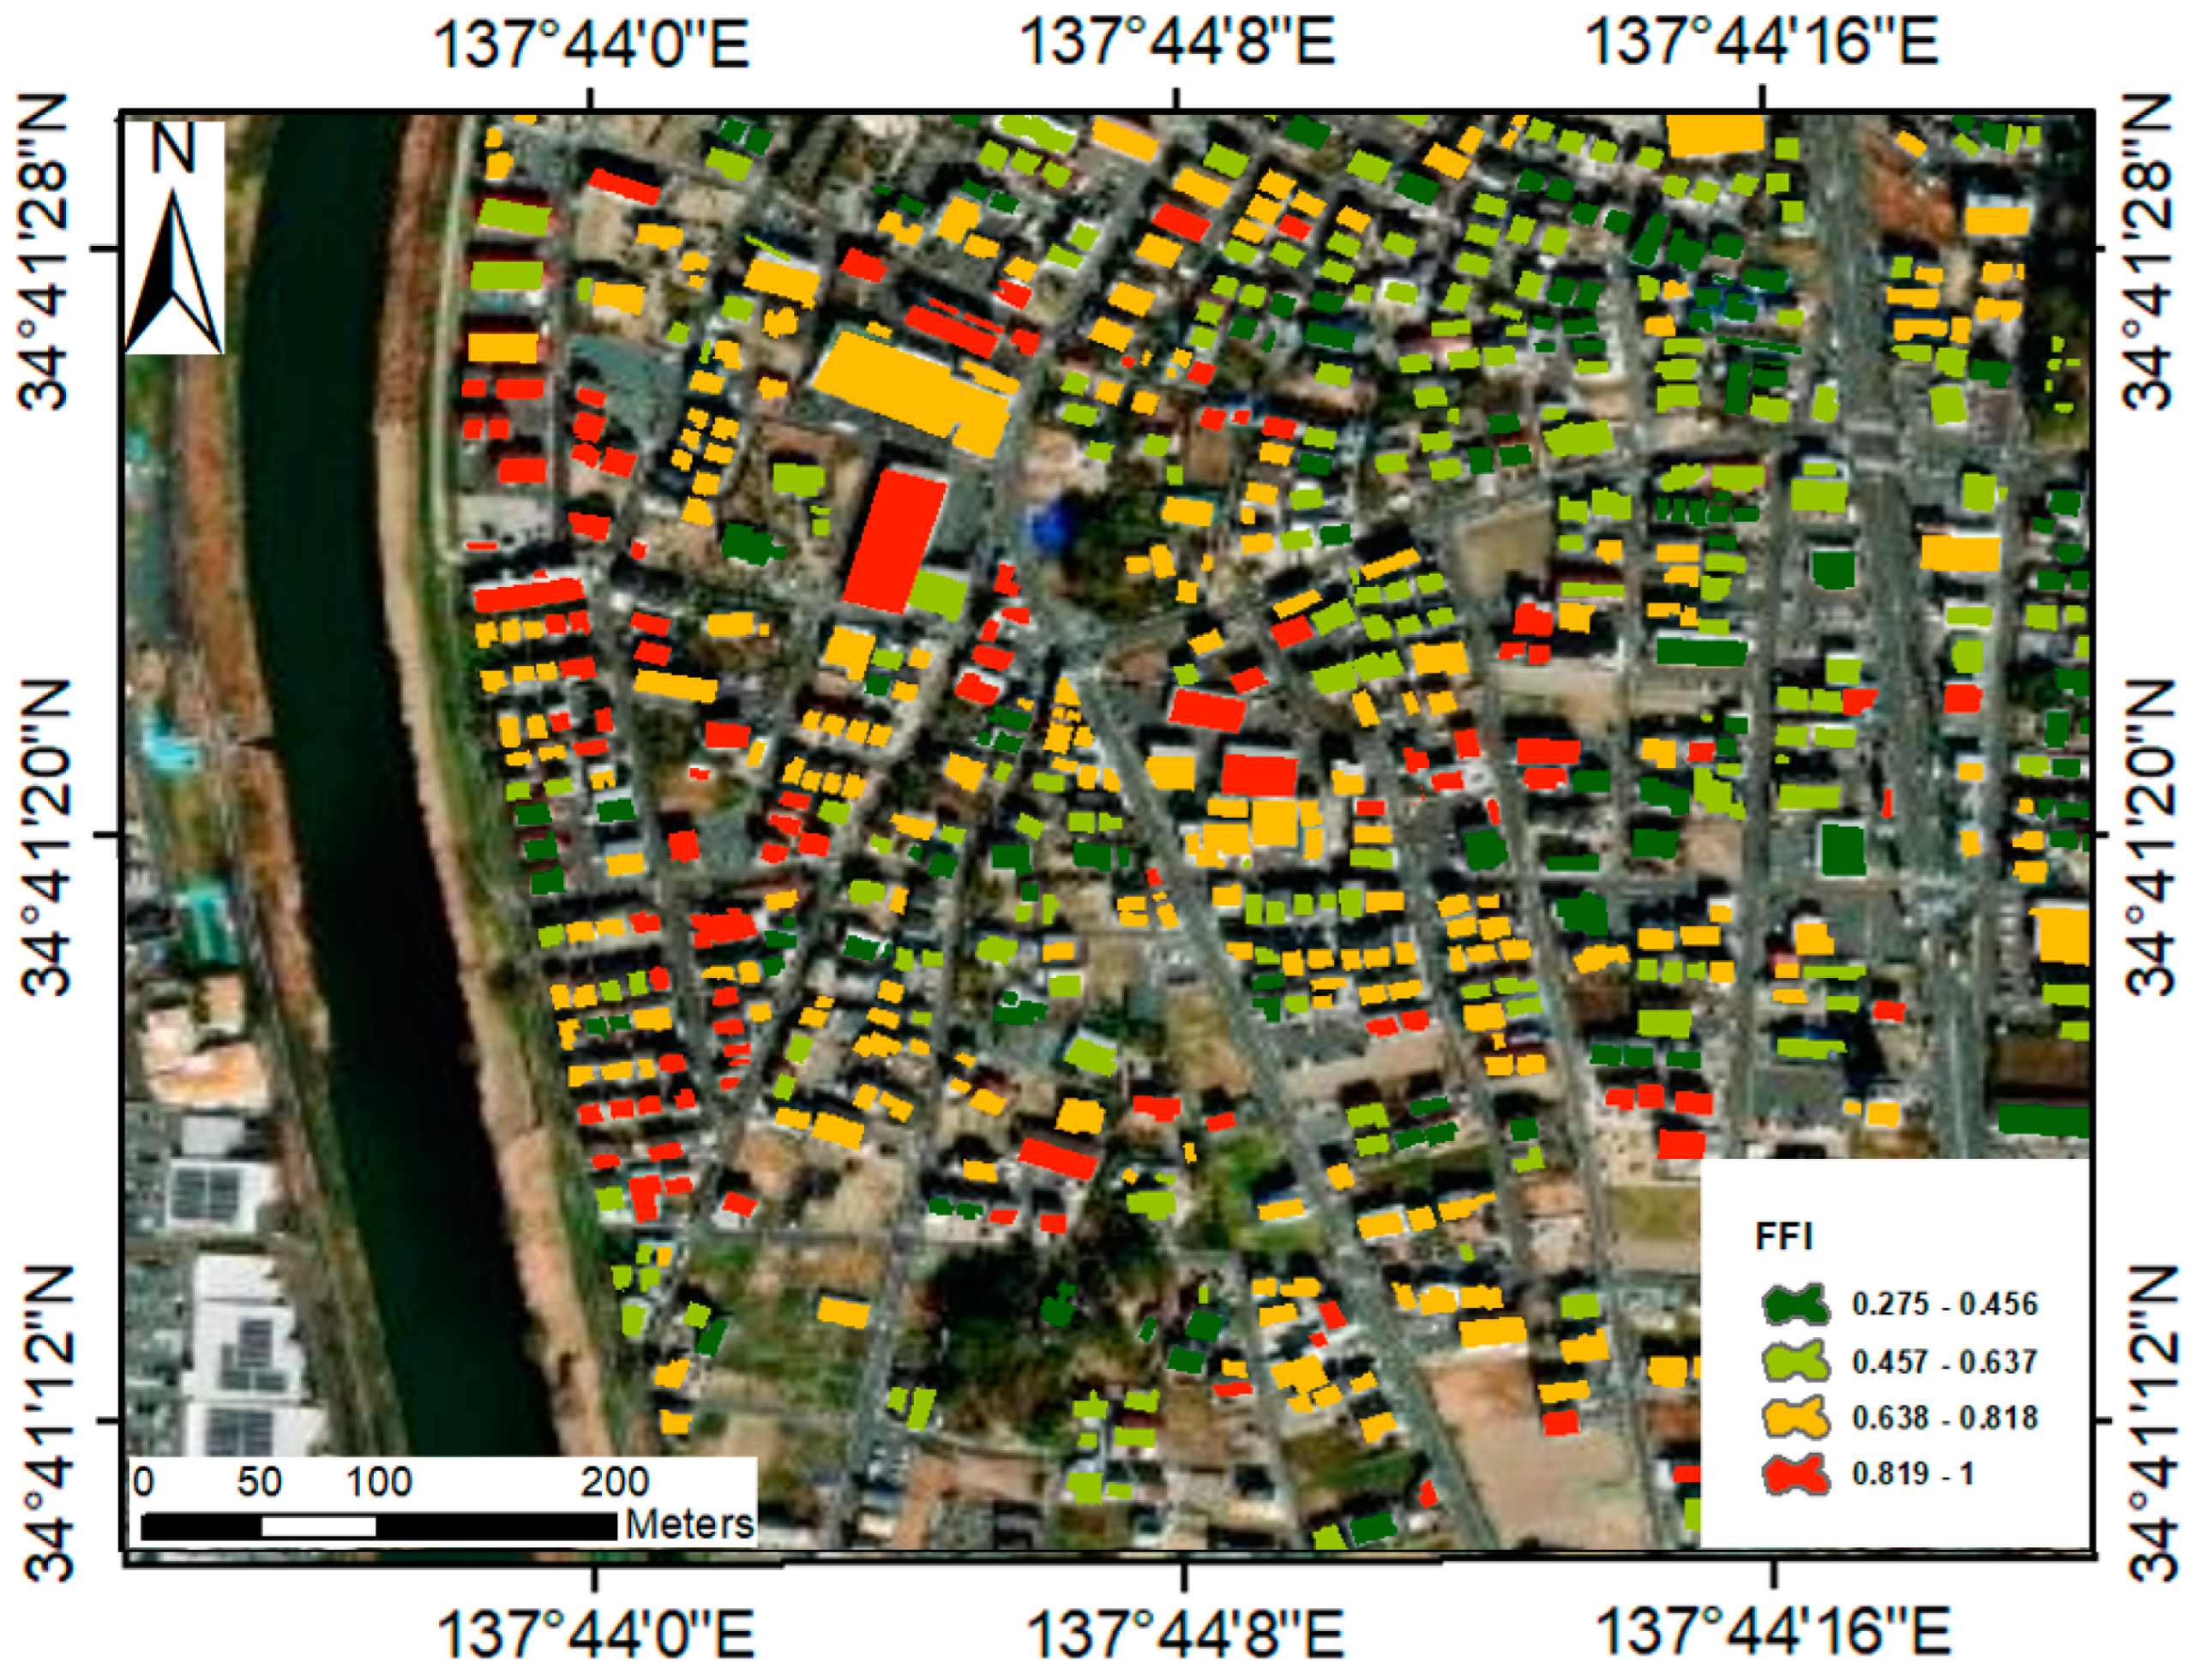
The resulting FFI was classified into four categories, as given in
Table 5. The FFI has a scale ranging from 0.275 to 1. Moreover, the higher value of FFI indicates a greater risk of flash floods.
The spatially distribution of FFI is depicted in
Figure 16. As described in the output FFI, buildings that are located closer to the riverbank face the greatest flood risk as they possess higher values of FFI. On the contrary, buildings located away from the river have lower possibility of flood risk.
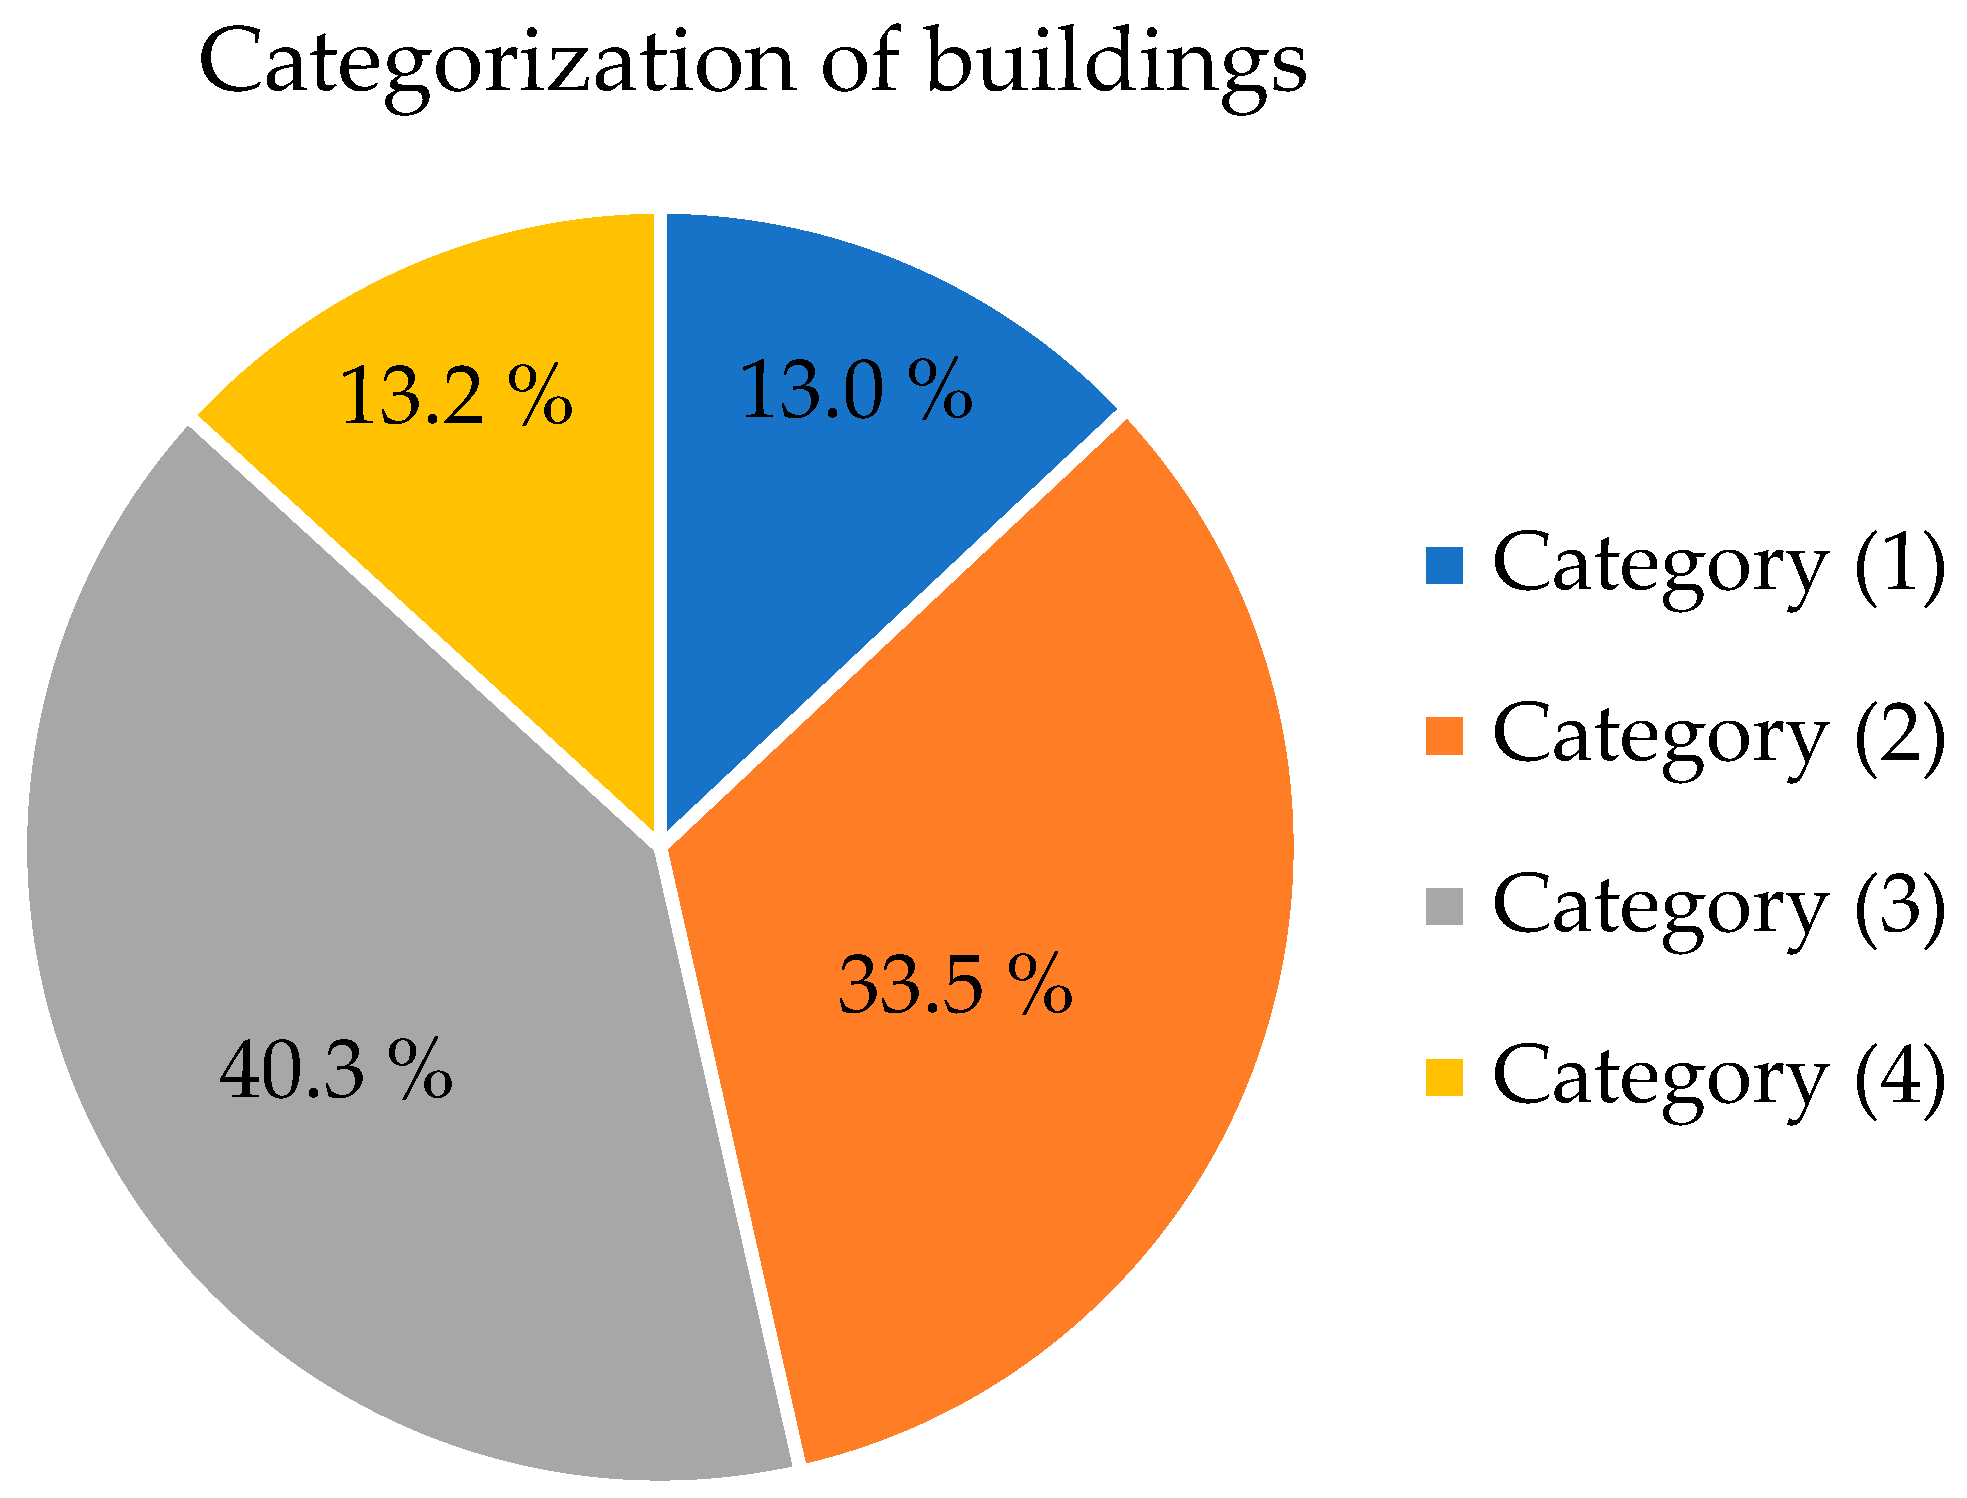
In addition, the overall count of tested buildings is 938, just above one-tenth of them are lying in category (1) and these buildings are mostly located in the far east of the studied region. Categories (2) and (3) have a similar proportion, with nearly 34% and 40%, respectively, for all the studied buildings. Moreover, about 13% of structures are in category (4).
Figure 17 displays the proportions of buildings in each category.
Additionally, this investigation provides a procedural framework applicable to urban areas grappling with adverse consequences of flash floods. It facilitates the work of planners in evaluating the FFI for individual structures, offering valuable insights into the pre-construction phase. Notably, structures with elevated FFI ratings necessitate construction using specialized materials capable of withstanding inundation. Furthermore, this metric serves as a directive for insurance companies in ascertaining the potential risks associated with a given building. Consequently, this study proves instrumental not only in addressing existing vulnerabilities to flooding, but also in serving as a pre-emptive tool for planners in the pre-construction phase.
Moreover, the research methodology employed in this study can serve as a crucial approach for future investigations, particularly in the incorporation of hydrometric analysis of flash floods with building information modeling (BIM). The integration of BIM will advance the assessment of building vulnerability to floods by incorporating factors related to building attributes, such as materials, age, and number of levels, among others, which contribute to the resilience against flood effects.
3.4. Post-Mitigation Scenario
The flood hazard represents a significant challenge for contemporary, advanced societies reliant on sophisticated technology. Addressing this challenge has involved the implementation of diverse flood mitigation strategies encompassing both engineering and non-engineering approaches [
46]. Regarding non-engineering strategies, they encompass methodologies and associated frameworks aimed at controlling land utilization within flood-prone areas, issuing flood alerts and predictions, mitigating disasters, facilitating rescue operations, and undertaking reconstruction efforts following a calamity, in addition to establishing uniform guidelines for utilizing flood detention zones, allocating adequate space for flood occurrence, and advocating for the adoption of flood risk mapping and insurance policies [
47].
On the other hand, engineering measures primarily consist of structures such as embankments, reservoirs, and flood detention zones, complemented by enhancements to channels to manage and mitigate flood-related issues [
48].
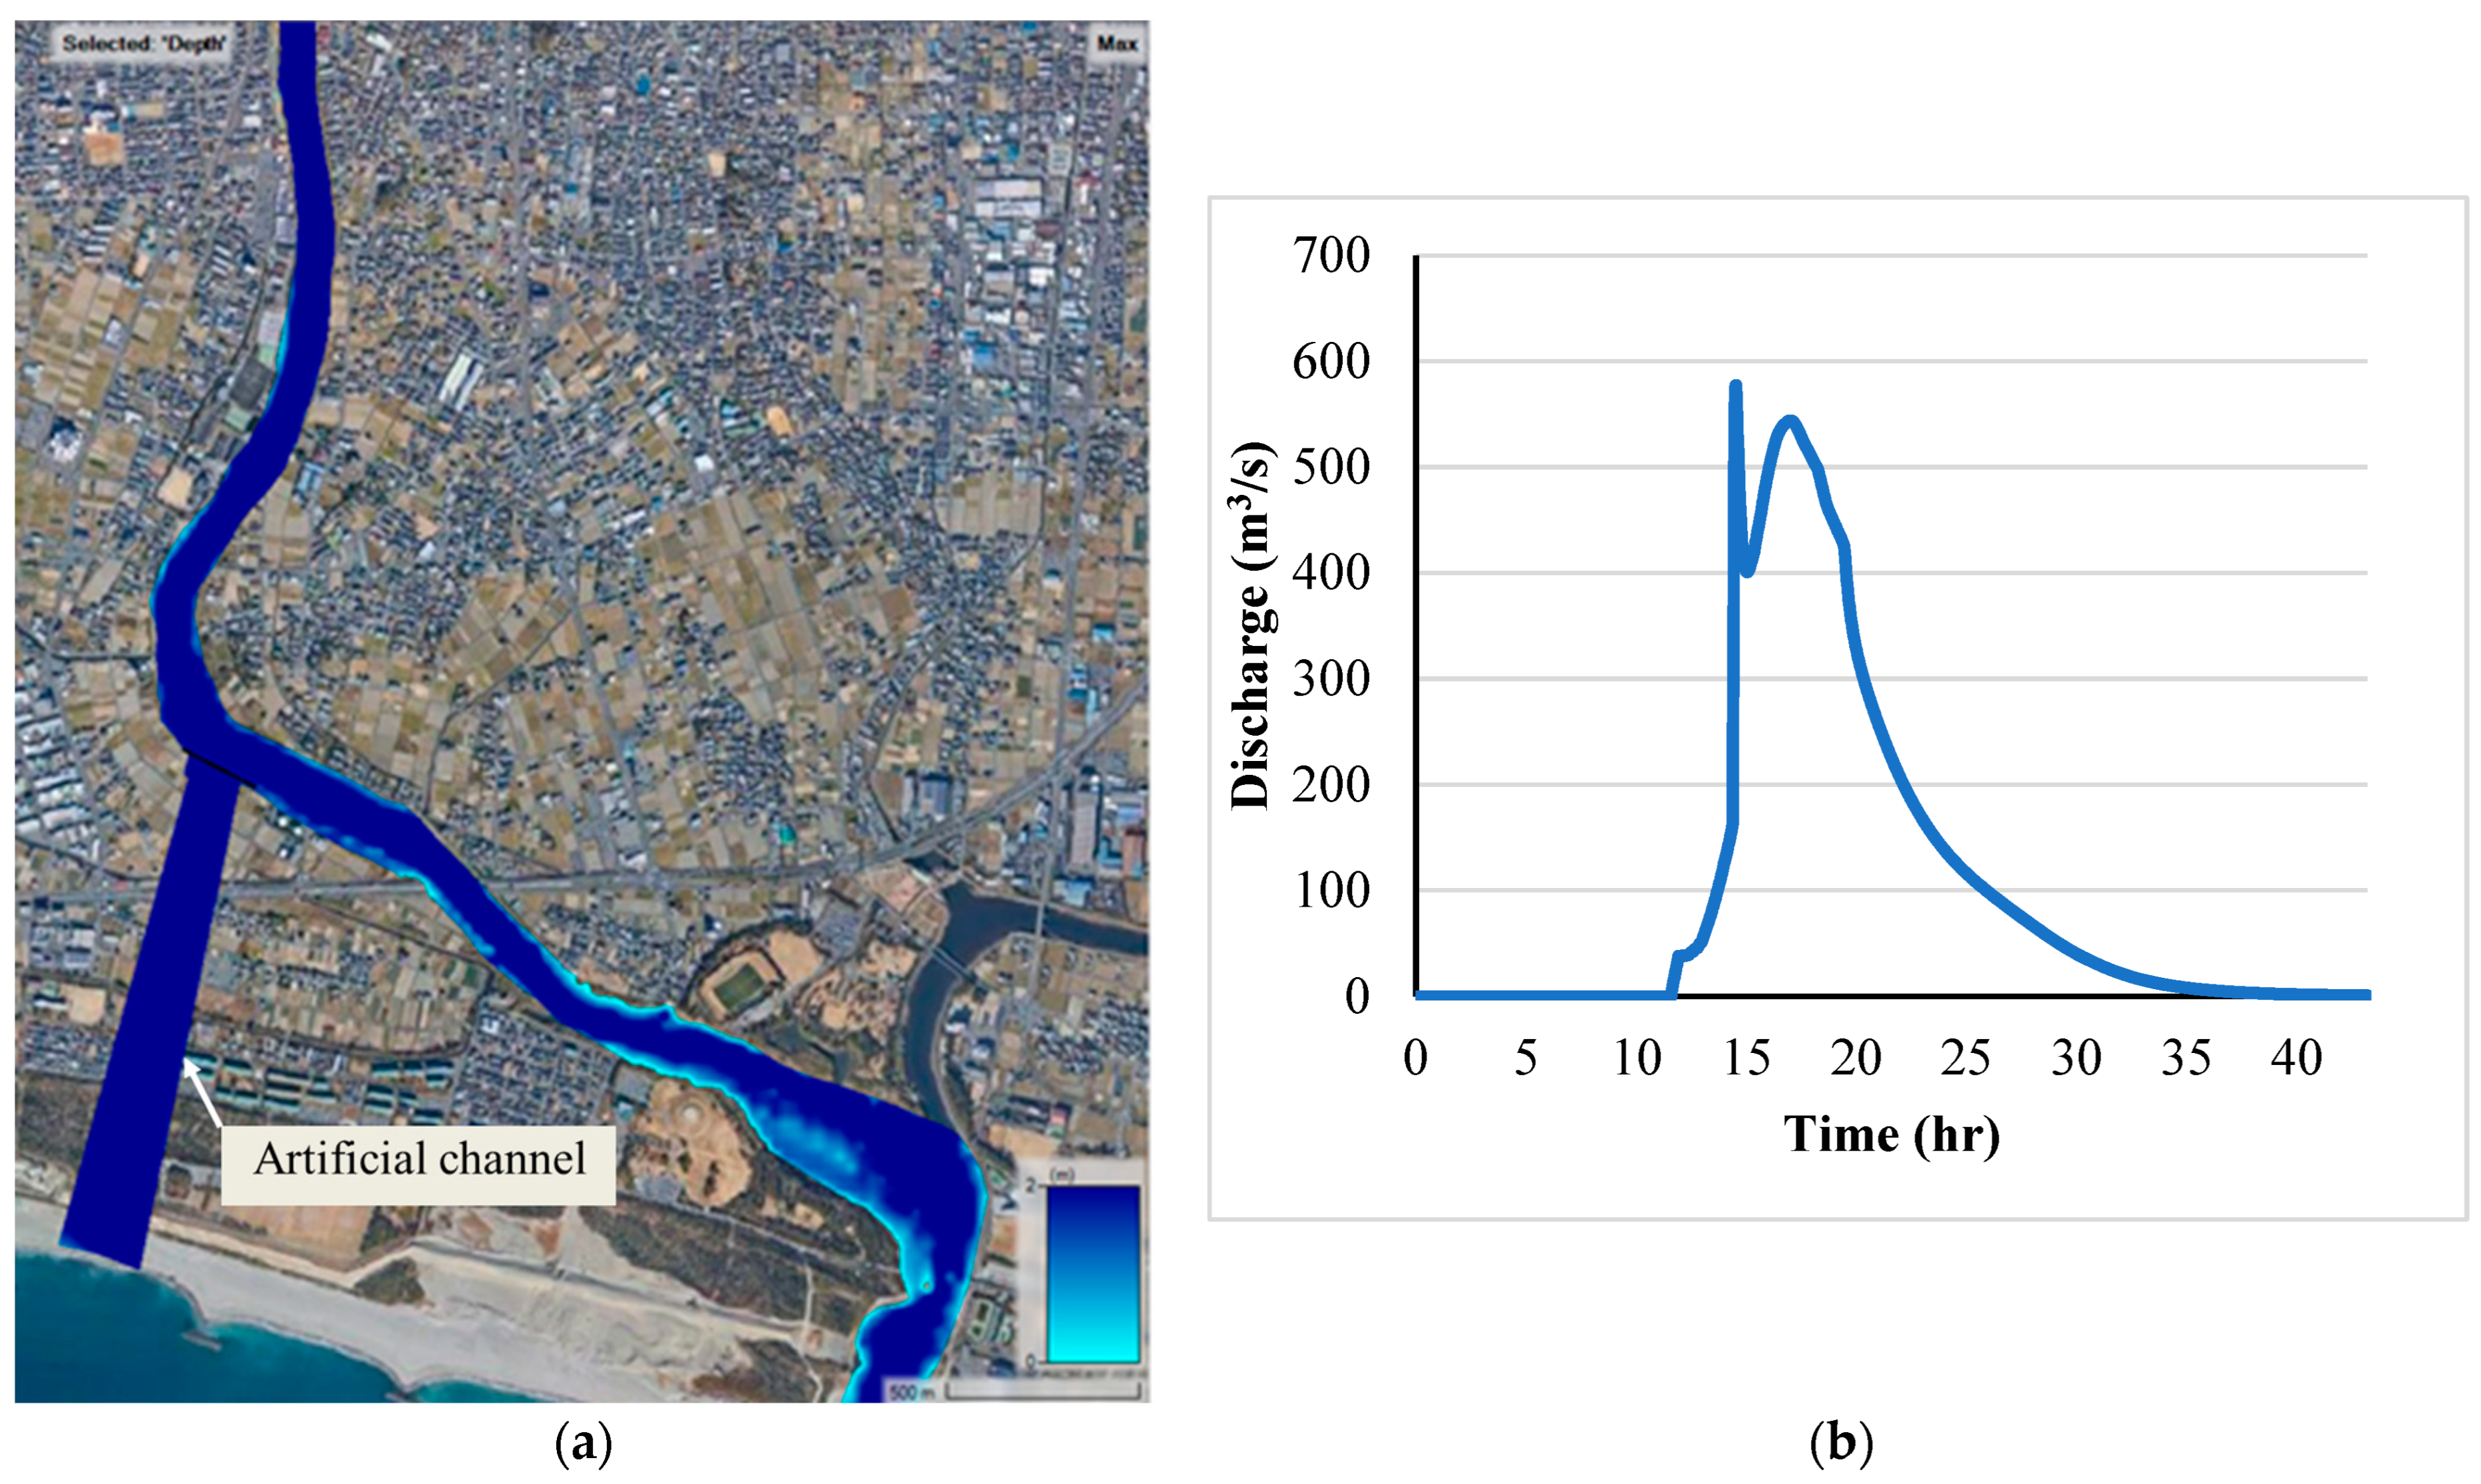
In this research, engineering mitigation measures were adopted through two techniques, the first one is leveling the riverbank elevation alongside the river reach within the study area. The length of the river reach was estimated at about 6.1 km, which begins at the upper boundary of the study area and extends to the mouth of river. The height needed to be added to the riverbank is optimized to be 3.0 m, which is necessary to impede the excess flow from overtopping the riverbanks. In addition, the second mitigation approach that needs to be implemented is to construct a channel to convey the excess flow at the time of flooding from the marked point in
Figure 18a to the ocean. This artificial channel has a length of nearly 1.40 km, which may also store the flood water to be used after treatment. For the design rainfall storm, the flow discharge at the upstream end of the artificial channel is sketched in
Figure 18b. The bed level of the created channel is assumed to be 0.00 and the maximum flow depth during the study storm was calculated to be 3.48 m. Furthermore, the introduced mitigation scenario will prevent inundation of areas surrounding the rivers, which will save lives and reduce monetary costs during the flood period. Lastly, the establishment of the artificial channel constitutes an innovative contribution within the research goals, serving as a novel mitigation measure in the study area.
Moreover, in terms of water resource management, communities gain many advantages. The accumulation of water within an artificial channel proves highly beneficial for irrigating extensive expanses of urban green spaces. The harnessed floodwater, when bounded, can also play a pivotal role in enhancing the ecosystem. This can be achieved by utilizing the artificial channel for cultivating aquatic plants, thereby not only improving the environmental conditions, but also presenting opportunities for commercial utilization.
3.5. Hydrodynamic Model Uncertainty and Research Limitations
The generated models are built upon the existing data such as elevations and building layout. Therefore, modification of terrain slopes and land use may potentially lead to some changes in the model results. Furthermore, despite the correction applied to the utilized DEM to align with the high accuracy of actual terrain elevation, it possesses a relatively low resolution of 30 m. Consequently, opting for a higher resolution DEM, given its availability, it is strongly advised.
4. Conclusions
Flash floods represent one of the most deleterious natural phenomena in Japan, underscoring the critical need for the formulation of effective mitigation strategies, particularly in regions highly susceptible to flooding. This research focuses on the assessment of structural vulnerability in buildings situated in close proximity to the Magome River in Hamamatsu city, Japan, by estimating the flash flood index (FFI) for each individual structure. The investigative process commenced with the delineation of an adjusted digital elevation model (DEM) to derive basins, subbasins, and flow accumulation, serving as a foundational step for implementing a hydrological model. Simultaneously, this delineation process facilitated the initiation of a hydrograph prediction for a storm with a 100-year return period at the selected outlet of the Magome River. The resultant hydrograph, indicative of upstream conditions, was then utilized as a boundary condition in a hydrodynamic model to estimate four key FFI parameters: runoff depth (RD), runoff velocity (RV), runoff duration (RT), and affected portion (AP).
Moreover, the spatial allocation of the FFI was carried out for each respective building in the studied area. Approximately 50% of the buildings exhibit runoff depth and velocity below 0.5 m and 0.5 m/s, respectively. Conversely, more than one-tenth of the structures experience runoff depths exceeding 1 m, with fewer than 5% encountering flow velocities surpassing 1 m/s. Regarding the AP factor, more than 75% of the buildings are anticipated to be encircled by water along more than three-quarters of their perimeters. Furthermore, the generated FFI map illustrates that over one-tenth of the buildings fall within the highest FFI range. However, the second and third FFI categories collectively account for approximately three-quarters of all structures.
In addition, two mitigation strategies are proposed to prevent excessive flow from inundating the adjacent area near the river. These mitigation approaches involve elevating the riverbanks by an additional 3.0 m and constructing an artificial channel to accumulate a significant portion of the excess flow during flood periods. This research incorporates the flood duration factor, representing a leading-edge addition to this study. Additionally, it involves the development of a mitigation plan encompassing the construction of riverbank and an artificial channel. These measures aim to mitigate the adverse impacts of sudden floods on structures and buildings. Finally, this research offers a conceptual methodology and practical guidance for decision-makers and insurance companies, facilitating a comprehensive evaluation of the flood risk associated with structures and empowering them to make judicious decisions based on informed assessments.
