1. Introduction
The study of the reclamation and reconstruction of soil is an important part of ecosystem restoration in mining areas. Soil is the foundation of living organisms and is the focus of ecosystem restoration in mining areas [
1,
2]. Soil has many important properties, among which the soil structure and moisture content are important [
3,
4]. Therefore, understanding the structural characteristics of reclaimed and reconstructed soils in mining areas and understanding the spatial and temporal distributions and changes in moisture of reclaimed and reconstructed soils in mining areas are highly important for the management of the ecological environment. At present, the traditional soil structure research method is mainly the onsite profile excavation method, which is highly accurate, but the implementation process is time-consuming, laborious, inefficient, and unable to reflect the overall soil structure and soil thickness in a region [
5]. The conventional soil moisture content determination methods in mining areas include the neutron method, time domain reflectometer method, and drying-and-weighing method, but the above methods have the shortcomings of low efficiency, complicated operation, and greater destructive effects on the original structure of the soil [
6].
Ground-penetrating radar (GPR) has been widely utilized in the field of soil exploration in recent years. Ground-penetrating radar (GPR) transmits electromagnetic wave pulses to the soil medium below the ground, receives the echo signals reflected by different media, processes the received signals, and inverts the spatial structure and geometry of the target object or area within a certain depth range underground according to the single-channel waveform, amplitude characteristics and other parameters of the received wave [
7,
8]. By analyzing and calculating the two-dimensional image and signal wave of the ground-penetrating radar, the corresponding information on the soil structure and moisture content can be obtained. Its non-destructiveness, accuracy, and convenience can effectively compensate for a series of shortcomings of traditional methods for determining the soil structure and conventional soil moisture content [
9,
10]. Many scholars at home and abroad have researched the soil structure and moisture content in mining areas by using ground-penetrating radar. Zhao Yanling and others used ground-penetrating radar to detect reclaimed soil and successfully revealed the structure of the reclaimed soil and the thickness of the soil layer [
11]. Farrish, Mokma, and other scholars used ground-penetrating radar to study the continuity of thin layers of soil [
12,
13]. Cui Fan and other scholars utilized ground-penetrating radar to detect the moisture content of the surface layer of the soil of a coal mine, which resulted in the same error as that of the drying method. The results were less erroneous with the drying method [
14]. Lu Q et al. [
15,
16] demonstrated the efficacy of using early-time GPR signals to estimate soil water content in cultivated land, providing insights into the early signal characteristics that correlate with soil moisture levels. Liu K et al. [
17] further explored the AEA method in farmland settings, emphasizing its accuracy and reliability for moisture content estimation within complex agricultural environments. However, the current research has mainly focused on analyzing the structure and moisture content of soil in the natural state, and the degree of research on reconstructed soil under complex conditions has been limited.
On the basis of previous research, this study utilizes ground-penetrating radar to detect the structure and moisture content of multilayered reconstructed soils under complex soil samples in quasienergy mining areas. The specific objectives of this study are as follows:
To assess the efficacy of ground-penetrating radar in identifying and delineating soil layers and moisture content in multilayered reconstructed soils.
To validate the accuracy and reliability of the AEA method for inverting soil moisture content by comparing it with the sample-drying method through field experiments.
To explore the applicability of the envelope detection method in characterizing soil structure and to evaluate its effectiveness in different soil types and depths.
To provide a comprehensive analysis of the advantages and limitations of GPR-based methods in soil structure and moisture content research, thereby broadening the application scope of GPR in complex soil investigations.
2. Materials and Methods
2.1. Study Area
The study area is located in the Jungar Banner Junneng Mining Area, Ordos City, Inner Mongolia Province (
Figure 1), and has a three-layered reconstructed soil with artificial composition.
The study area is a nearly rectangular reconstructed soil area with a total width of 205 m, a total length of 165 m, and a total height of 3 m, and it is divided into two zones, A and B. The two zones are equal in total length, and both zones are equal in total height. The total length of the two areas is equal to 165 m. Zone A has a total width of approximately 61.5 m and covers an area of approximately 15 acres, which is a reconstructed soil area with a mixture of red clay, sandy loam, and loess. Zone B has a total width of approximately 143.5 m and covers an area of approximately 35 acres, which has a 0.75 m-thick compaction of red clay at the bottom, 0.75 m-thick compaction of sandy loam in the middle, and 1.5 m-thick compaction of loess at the top, and it represents a standard reconstructed soil area with three layers of reclaimed soil. Three layers of reclaimed and reconfigured soil areas were used (
Figure 2).
2.2. Survey Line Layout and Sample Collection
The ground-penetrating radar wiring in the study area is shown in
Figure 3, with two survey lines in the north-south direction and a total length of 205 m, which are marked every 10 m. In the east-west direction, two survey lines are laid at equal intervals in each area, with a total of four 165 m lines, which are marked every 10 m. Data acquisition was carried out via a GR ground-penetrating radar system with a 400 MHz antenna developed independently by the China University of Mining and Technology, Beijing (CUMTB). This radar system, with an effective depth of approximately 3 m, was used to detect the survey lines and was able to detect the reclaimed and reconstructed study area under complex conditions. The sampling time window was set to 80 ns, the number of sampling points was 512 and 1024, respectively, and the average antenna movement speed was approximately 1 m/s.
In the actual detection process, whenever the ground-penetrating radar traveled to the red points, a marking was carried out, and borehole sampling was carried out with a Luoyang shovel. The depth of all the boreholes was 3 m. Each borehole depth was divided into 3 sections, sampling was carried out at 20 cm, 40 cm, and 60 cm, and the samples were sealed and preserved with a ring knife. On the day of sampling, the samples were sent to the laboratory for drying (110 °C, 6–24 h) to test the mass moisture content of the soil samples, and the measured soil compactness was converted to volumetric moisture content.
2.3. Methods
2.3.1. Radar Image Processing Techniques
Soils are mainly composed of solid particles with certain pores between them, and the pore space is filled by gases and liquids. There are differences in the electromagnetic polarization effects of these complex components, resulting in distinct boundaries in electrical properties between different soil types [
18]. When electromagnetic waves encounter the boundaries of different soil types, due to differences in electrical properties, refraction, and reflection phenomena occur, resulting in different energy scattering and reflection fluctuations; thus, the signals received by ground-penetrating radar exhibit diverse amplitudes, phases, and energies [
19]. By studying the characteristics of processed radar images, it is possible to determine the structural characteristics of the soil.
2.3.2. Soil Structure Analysis via the Envelope Detection Method
The electromagnetic wave reflection signals received by ground-penetrating radar change in energy fluctuations, phase echoes, and amplitudes as they traverse soils with different properties. These changes in reflected waveforms are important indicators of differences in soil structure [
20]. In this work, we used the envelope detection method to average, normalize, and filter the radar single-channel data [
21] to obtain the soil layer wave amplitude mean line. Then, the Hilbert transform was applied to draw the upper and lower envelopes, and the instantaneous phase signals of the envelopes were least squares fitted to obtain the instantaneous phase fitting curve. The soil structure was analyzed in detail on the basis of the wave crest characteristics of this curve [
22,
23]. For a soil medium with dielectric constant
, the velocity
Vr of electromagnetic wave propagation through the soil can be derived from Equation (1):
where
C is s the propagation speed of electromagnetic wave in vacuum, taken as 3 × 10
8 m*s
−1.
The formula for calculating the thickness of each soil layer is:
where
represents the soil layer thickness;
denotes the two-way time delay of the electromagnetic wave within the soil.
2.3.3. Methodology for Soil Moisture Content Studies
The moisture content is one of the most important indicators for characterizing soil properties and is closely related to the dielectric constant of the soil [
24]. Owing to the differences in the pore and particle characteristics of different soils, the moisture contents of different soils in the same region also differ. According to electromagnetic wave propagation theory, the higher the moisture content is, the more significant the absorption effect of high-frequency electromagnetic waves in the region. Therefore, analyzing the spatial distribution differences in moisture content can help reveal the regional soil structure.
The average envelope amplitude (AEA) is a method used to study the envelope characteristics of early radar signals in relation to the fit of the soil dielectric constant to determine the AEA with the optimal correlation and thus to inversely determine the soil moisture content (
Figure 4) [
25,
26].
Electromagnetic waves emitted by ground-penetrating radar into the subsurface are affected by the electromagnetic properties of the subsurface medium, and the energy decays exponentially during propagation. Electromagnetic signals are transmitted at different speeds when passing through air and underground, which depends on the relative dielectric constant
ε of the underground medium, and the change in moisture content is an important factor in determining the soil dielectric constant. Simulation experiments have revealed that the single-channel signal starting fluctuation of radar waves has a close relationship with the dielectric constant; in general, the smaller the dielectric constant of the medium is, the earlier the single-channel signal starting fluctuation, and vice versa. Therefore, we can analyze the relationship between the amplitude envelope value of the radar signal and the relative dielectric constant and obtain the value of the relative dielectric constant
εr to deduce the relationship between the amplitude envelope value of the radar wave and the electromagnetic parameters of the equation [
27]:
where
is represents the magnetic permeability;
denotes the permittivity of free space;
s the dielectric constant of the soil;
is the amplitude envelope of the radar wave propagating in air;
is the amplitude envelope of the radar wave propagating in the ground;
is the distance between the transmitting and receiving antennas.
3. Results
3.1. Soil Structure Detection
After the ground-penetrating radar acquired data from the study area (Zone B), the data were subjected to signal processing, such as background denoising, signal gain processing, bandpass filtering, and a sliding average, which effectively removed the background noise and high-frequency interference of the radar image, significantly improved the signal-to-noise ratio of the signal, and thus accurately acquired the waveform characteristics of the data. The collected original image and the processed image are shown in
Figure 5, in which the horizontal direction is the length of the ground-penetrating radar detection, and the vertical direction is the depth of the soil detected by the radar.
Based on the two-dimensional raw images of ground penetrating radar in Zone B (
Figure 5b), the stratification of the soil can be observed roughly. The 0–8 ns range clearly marks the boundary between the air and the upper soil layer. The region from 8–40 ns, where noise is relatively weak, corresponds to the upper part of Zone B. The 40–80 ns range, however, makes it difficult to distinguish between the middle and lower parts of Zone B, although a faint stratification boundary can be observed between 60–64 ns. To accurately delineate the soil boundaries; evidently, further data processing is required.
After further processing of the data, the single-channel envelopes were used as a basis to draw the upper and lower envelopes, as shown in
Figure 6. The upper and lower envelopes of the ground-penetrating radar signals depict the waveform characteristics of the signals in the region. When ground-penetrating radar signals propagated underground in the study area, due to differences in the dielectric properties of different soils, reflection phenomena were generated, which were manifested mainly in the anomalous increase in the amplitude of the reflected signals, and compared with the original signals, the envelopes were able to reflect the trend of the reflected signals in terms of intensity and time more clearly.
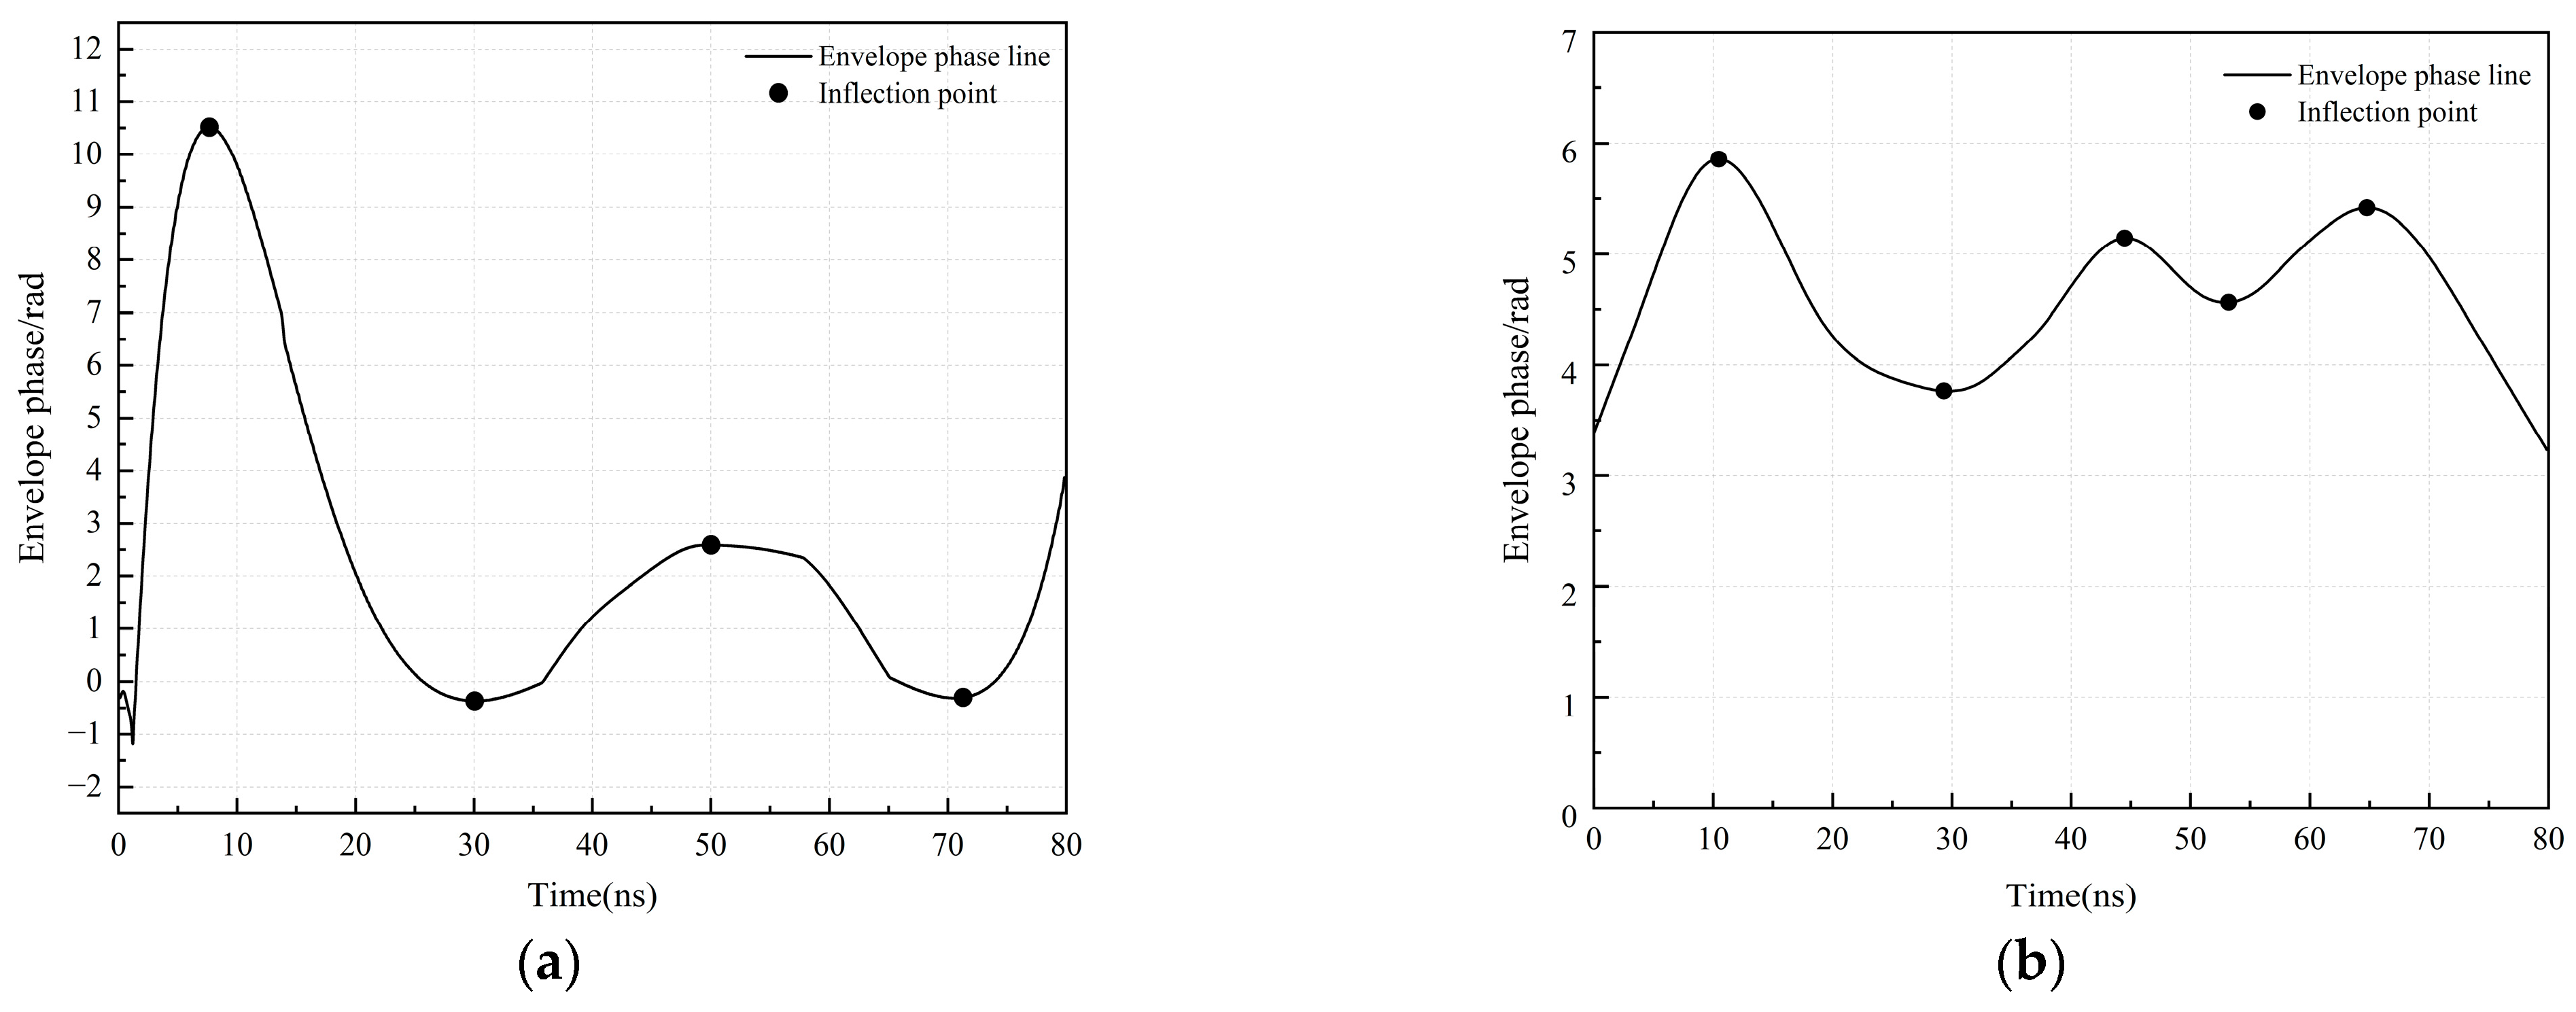
The Hilbert transform was performed on the signal to extract the instantaneous phase signal, and the least squares fitting method was applied, which in turn yielded the fitted curve of the instantaneous phase. The least-squares fitting curve of the instantaneous phase can more accurately describe the characteristics of the signal over time and the reflection details. When radar waves propagate in the subsurface, soil medium differences can lead to an abnormal increase in the amplitude of the reflected signal wave, and least-squares fitting can mathematically optimize the instantaneous phase curve to more comprehensively unite the regions of the curve with an abnormally increased amplitude to construct boundaries approximating the actual change in the soil medium. The wave crests of the least-squares fitted curves of the instantaneous phase were analyzed to identify information about the inflection points at the crests of the curves, which are the points at which the soil medium changed. On this basis, several inflection points at the upward wave crests were identified as demarcation points of the soil structure, i.e., demarcation lines between different types of soils.
Figure 7 shows that the demarcation line of the soil structure was successfully calibrated, and the envelope instantaneous phase fitting curve and the convex-concave inflection points were plotted (
Figure 7). The boundary point between the upper and middle soil layers occurs at 44.7 ns in the time domain, and the boundary between the middle and bottom layers is at 65 ns. Substituting these values into Equation (2), the thickness of the upper soil layer is calculated to be 1.47 m, the middle layer is 0.88 m, and the bottom layer is 0.65 m.
After applying the Hilbert transform to the mean values of the single-channel data, empirical mode decomposition of the data in Zones A and B was performed via MATLAB to extract the high-frequency components in the mean values of the radar single-channel data, and the corresponding Hilbert–Yellow transformed plots were generated, in which the vertical coordinates represent the frequency of the reflected wave and the horizontal coordinates represent the time of propagation of the detected wave through the subsurface, i.e., the depth of the soil layer. The color bar on the right represents the amplitude value, which is not shown on the plot if it is too small. Taking Area B as an example, the light continuous curve in the upper part of the image shows three discontinuities of colored line segments. These discontinuities may be caused by radar waves encountering unusually high reflected energy in these areas. In these colored line segments, the point with the highest energy (marked with a red dot) is at approximately the same location as the peak inflection point of the instantaneous phase fit curve (
Figure 8). This finding coincides with the pattern of anomalous reflections of radar waves when encountering different media, thus verifying the reliability of the previously identified soil structure demarcation points.
For Zone A, which has an overall three-soil mixing structure, its radar-averaged amplitude envelope had a peak at 50 ns because of the difference in soil compaction at the time of construction in the study area, but the amplitude was not obvious. Moreover, the Hilbert-Huang transform map of Zone A only had clear visible line segments in a range of 0–16 ns; therefore, the stratified structure of Zone A was not obvious compared with that of Zone B. The Hilbert-Huang transform map of Zone A had a clear visible line segment in a range of 0–16 ns only; therefore, we can assume that the mixed soil in Zone A does not have a distinct layered structure.
3.2. Detection of the Soil Moisture Content
The inverse of the mean radar amplitude envelope was first extracted from the processed radar detection data and fitted to the dielectric constant (
Figure 9). The moisture content was then fitted to the radar amplitude (
Figure 10), and in the fitted curve, the radar amplitude and moisture content had a negative correlation with a certain logarithmic curve, which had a good fit with an R
2 value as high as 0.99. This result shows that there was a strong correlation between the radar amplitude and moisture content and that the AEA method is capable of inverting the moisture content in reconstructed soils under complex conditions.
Second, to ensure the accuracy of the data, the data from the sampling points on each measurement line were averaged and normalized. Through the relationship between the mean value of the radar amplitude envelope and the relative dielectric constant, the relative dielectric constant at three different depths ranging from the top to the bottom in Zones A and B was calculated, and the moisture content of the corresponding zones was subsequently calculated via the Topp formula. Comparing the drying method with the AEA inversion of moisture content values, the AEA method inversion of moisture content in the N-S direction of the zones in the upper and lower data, for example, the inverted moisture content in the overall inversion effect, was good (
Figure 11 and
Figure 12). As shown in
Table 1, the relative errors ranged from 2.81% to 7.41%, with better results in the upper (0–1.4 m) range, and the relative errors gradually increased with increasing depth.
Differences in moisture content among the reconstituted soil layers in the study area existed at the beginning of their establishment, and as measured by infiltration experiments, the red clay layer in Zone B had the highest maximum water-holding capacity and the best water retention capacity; the yellow sandstone layer was in the middle of the list; and the loess layer had a relatively weaker water-holding capacity. Specifically, the bulk weight and compactness of the loess, yellow sandstone and red clay layers increased with depth. To construct the study area, red clay at the bottom was used as a water barrier, yellow sandstone at the centre was used as a water-bearing layer, and the loess layer at the top was used as a plant cultivation layer. As a result, Zone B presented a more clearly defined layered structure than did the mixed reconstructed soil structure in Zone A.
The differences in moisture content presented by the ground-penetrating radar inversions clearly distinguished the layers between the reconstructed soils. As shown in
Figure 13 and
Figure 14, both the mean measured values of moisture content and the inversion results revealed that the moisture content increased with depth, and this increasing trend is consistent in the direction of the survey line arrangement, i.e., the trends of increasing and decreasing moisture content were basically the same under the same soil profile. A comparison of the soil properties and structural data shown in
Table 2 with the AEA inversion moisture content trend reveals that the moisture content change in Zone B was more significant than that in Zone A in different depth ranges, and the moisture content of different soil layers in Zone B clearly tended to increase stepwise with depth, which is attributed to the more distinctive reconstructed soil layering structure in Zone B and the significant differences in soil properties among the layers. In contrast, Zone A in general has a mixed reconstructed soil structure and lacks the significant stratification variability shown in Zone B. Although the water content also increased with depth, this is attributed to two main reasons: first, at the time of the construction of Zone A, the climate in the study area was dry, with virtually no precipitation, and the rate of evaporation of water from the topsoil layer was greater than that of the bottom soil layer; second, in the vertical direction at the same site with the same type of soil (all of which are mixed soils), the topsoil layer was less compacted than the bottom soil layer was over time. Under the effect of gravity, the topsoil layer was less compacted than the bottom soil layer was, and the water retention property of the topsoil layer was weaker than that of the bottom soil layer.
4. Discussion
In this study, in the reconstructed soil study area with complex conditions, i.e., the upper layer of loess, the middle layer of sandy loam, and the bottom layer of red clay, as well as the soil composed of a mixture of these three types of soils, ground-penetrating radar was used for detection, and the data were subjected to signal processing techniques, such as background denoising, signal gain processing, bandpass filtering, and the sliding average, which effectively removed background noise and high-frequency interference from the radar image and significantly improved the signal-to-noise ratio, thus accurately obtaining the waveform characteristics of the data.
4.1. Result of the Soil Structure
The radar average single-channel signal was Hilbert transformed, its envelope was plotted, and the instantaneous phase signal was extracted and fitted via the least squares method to obtain the fitted curve of the instantaneous phase. The stratification boundaries of different soil types were successfully identified on the basis of the peak points of the mean amplitude envelope. Furthermore, the accuracy of the soil structure analysis results was verified via the Hilbert–Yellow transformation diagram, which clearly depicts the stratified structural characteristics of the complex reconstructed soil zone. According to the experimental results, after calculation, the thickness of the upper soil layer in Zone B is 1.47 m, the middle layer is 0.88 m, and the bottom layer is 0.65 m.
4.2. Result of the Soil Moisture Content
The drying method was subsequently used to measure the moisture content of the study area within a depth of 3 m, and the AEA method was applied to reflect the moisture content within a depth of 3 m. The two methods were compared to verify that the AEA method can effectively reflect the moisture content within a depth of 3 m in the study area of complex reconstructed soil under complex conditions. The results of the soil structure delineated by the envelope detection method are more accurate; the AEA method can effectively invert the moisture content in the 3 m depth range. Among the two different soil structures, the top layer (0–1.4 m) had the most accurate inversion effect, with the mean relative error (MRE) ranging from 2.81% to 2.92%; the middle layer (1.4–2.2 m) had the second-best inversion effect, with the MRE ranging from 3.78% to 5.01%; and the bottom layer had the highest inversion error, with the MRE ranging from 6.64% to 7.41%. In contrast, the layered soil structure yielded better inversion results than did the mixed soil structure.
4.3. Research Summary
This study focused on the three-layer structure and mixed structure of specific complex reconstructed soil types (loess, sandy loam, and red clay) in the mining area, successfully analyzed the soil structure of the study area via the envelope detection method, and clarified the differences in the distribution of moisture content between different reconstructed soil layers in the study area by combining them with the inverted moisture content derived with the AEA method. In comparison to previous studies utilizing GPR for moisture content, our research expands the application of the AEA method to multilayered reconstructed soils under complex conditions. Earlier studies typically focused on natural soils or simpler conditions, such as siltstone, post-sandstone, and farmland soils [
28]. However, our findings demonstrate that the combination of GPR and the AEA method can effectively delineate soil layers and accurately invert soil moisture content even in heterogeneous and stratified soils. Nevertheless, similar to other studies, we observed that signal attenuation in high-conductivity soils remains a challenge, potentially limiting the effective depth of moisture detection. This limitation underscores the necessity for further research to refine signal processing techniques or to integrate GPR with complementary methods such as numerical simulations to enhance overall detection accuracy.
5. Conclusions
This study successfully demonstrated the efficacy of ground-penetrating radar (GPR) in identifying and delineating soil layers and moisture content in multilayered reconstructed soils under complex conditions. The application of the Average Envelope Amplitude (AEA) method proved particularly effective, achieving high accuracy in moisture content inversions, especially within the upper soil layers. The envelope detection method also showed strong potential in accurately identifying stratification boundaries across different soil types.
The findings from this research expand the application scope of GPR in complex soil investigations and contribute valuable insights into the use of AEA and envelope detection methods in environmental studies. However, it is important to note the potential limitations, such as the reduced effectiveness of GPR in soils with high conductivity or in areas with significant moisture content variations.
Future research should focus on validating these methods across a wider variety of soil types and environmental conditions. Additionally, integrating GPR with other geophysical techniques or advanced numerical models could further enhance the accuracy and applicability of soil structure and moisture content investigations in reconstituted and natural soils.
Author Contributions
Conceptualization, Y.H., S.P. and L.F.; methodology, Y.H., S.P. and L.F.; software, L.F. and W.L.; validation, Y.H., C.C. and L.F.; formal analysis, W.L. and C.C.; investigation, Y.H. and L.F.; resources, S.P.; data curation, Y.H. and L.F.; writing—original draft preparation, Y.H. and L.F.; writing—review and editing, Y.H. and L.F; visualization, Y.H. and L.F.; supervision, Y.H. and S.P.; project administration, Y.H. and S.P.; funding acquisition, S.P. All authors have read and agreed to the published version of the manuscript.
Funding
This research was funded by the Fundamental Research Funds for the National Natural Science Foundation of China (No. 42272286); National Natural Science Foundation Major Project (52394195); Open Fund of Key Laboratory of Industrial Safety Accident Analysis, Monitoring and Early Warning, Ministry of Emergency Management, North China Institute of Science and Technology (No. OF2301).
Data Availability Statement
The original contributions presented in the study are included in the article, further inquiries can be directed to the corresponding authors.
Acknowledgments
The authors wish to acknowledge the Fundamental Research Funds for the National Natural Science Foundation of China; National Natural Science Foundation Major Project, for their financial contribution to this work; Open Fund of Key Laboratory of Industrial Safety Accident Analysis, Monitoring and Early Warning, Ministry of Emergency Management, North China Institute of Science and Technology.
Conflicts of Interest
The authors declare no conflict of interest.
References
- Hu, Z.Q. Theory and method of soil reconstruction of reclaimed mined land. J. China Coal Soc. 2022, 47, 2499–2515, (In Chinese with abstract in English). [Google Scholar] [CrossRef]
- Bi, Y.L.; Peng, S.P.; Du, S.Z. Technical difficulties and development direction of ecological reconstruction in arid and semi-arid open-pit coal mines in western China. J. China Coal Soc. 2021, 46, 1355–1364, (In Chinese with abstract in English). [Google Scholar] [CrossRef]
- Cheng, Q.; Zhang, S.W.; Luo, M.; Xia, K.; Xu, Y.F. Inversion of reclaimed soil moisture based on ground penetrating radar fly ash filling. Prog. Geophys. 2021, 36, 2159–2167, (In Chinese with abstract in English). [Google Scholar] [CrossRef]
- Hu, Z.Q. Re-exploration of land reclamation science. China Land Sci. 2019, 33, 1–8, (In Chinese with abstract in English). [Google Scholar] [CrossRef]
- Li, K.L.; Tan, M.Z.; Mi, S.X.; Chen, J. Evaluating soil quality with texture profile configuration—A case study of Fenqiu, Henan. Soils 2016, 48, 1253–1260, (In Chinese with abstract in English). [Google Scholar] [CrossRef]
- Ren, W.; Yao, Z.A.; Chen, L.F.; Wang, X.T.; Li, H.X.; Chen, Z.H. The development history of GPR technology is analyzed. Jiangxi Sci. 2024, 42, 100–107, (In Chinese with abstract in English). [Google Scholar] [CrossRef]
- Hu, R.M.; Wu, J.Q.; Yao, Y.Z.; Li, S.J. Application of ground penetrating radar in coal seam anomaly detection. Coal Eng. 2023, 55, 136–142, (In Chinese with abstract in English). [Google Scholar] [CrossRef]
- Yang, F.; Peng, S.P. Study on Principle and Method of Geological Radar Detection; Science Press: Beijing, China, 2010; (In Chinese with abstract in English). [Google Scholar]
- Zhang, W.H.; Du, K.M.; Sun, Y.K.; Liu, B.C.; Sun, Z.F.; Ma, J.C.; Zheng, F.X. GPR based soil water content monitoring at different depths at the field scale. Smart Agric. 2022, 4, 84–96, (In Chinese with abstract in English). [Google Scholar] [CrossRef]
- Liu, C.; Liu, Q.; Zhang, Q.; Dan, C.X.; Liu, G. Ground penetrating radar was used to determine the spatial variation of the thickness of the black soil layer on the slope in northeast China. Acta Pedol. Sin. 2024, 61, 952–963, (In Chinese with abstract in English). [Google Scholar] [CrossRef]
- Zhao, Y.L.; Wang, J.; Gong, X.G.; Zhang, M.M.; Chen, B. Nondestructive detection of soil layer based on GPR. Sci. Technol. Rev. 2009, 27, 35–37, (In Chinese with abstract in English). [Google Scholar] [CrossRef]
- Mokma, D.; Schaetzl, R.; Doolittle, J.; Johnson, E. Ground-penetrating radar study of ortstein continuity in some Michigan Haplaquods. Soil Sci. Soc. Am. J. 1990, 54, 936–938. [Google Scholar] [CrossRef]
- Farrish, K.; Doolittle, J.; Gamble, E. Loamy substrata and forest productivity of sandy glacial drift soils in Michigan. Can. J. Soil Sci. 1990, 70, 181–187. [Google Scholar] [CrossRef]
- Cui, F.; Chen, B.P.; Wu, Z.Y.; Nie, J.L.; Li, S.Y.; Geng, X.H.; Li, S. Soil moisture estimation based on GPR power spectrum and envelope amplitude in sand loam. Trans. Chin. Soc. Agric. Eng. 2018, 34, 121–127, (In Chinese with abstract in English). [Google Scholar] [CrossRef]
- Lu, Q.; Liu, K.; Zeng, Z.; Liu, S.; Li, R.; Xia, L.; Li, Z. Estimation of the Soil Water Content Using the Early Time Signal of Ground-Penetrating Radar in Heterogeneous Soil. Remote Sens. 2023, 15, 3026. [Google Scholar] [CrossRef]
- Lu, Q.; Liu, K.; Liu, S.; Feng, X.; Liang, W. Early Time GPR Signals to Estimate Soil Water Content in Cultivated Land. In Proceedings of the 6th Asia Pacific Meeting on Near Surface Geoscience and Engineering, Tsukuba, Japan, 13–15 May 2024; pp. 1–6. [Google Scholar]
- Liu, K.; Lu, Q.; Zeng, Z.; Li, Z. Estimation of Soil Moisture Content of Farmlands Based on AEA Method of GPR. J. Phys. Conf. Ser. 2023, 2651, 12036. [Google Scholar] [CrossRef]
- Li, P.Y.; Wang, H.H.; Wang, Y.C.; Wu, Q.M. Analysis of GPR high-frequency electromagnetic wave propagation characteristic in dispersive media. Prog. Geophys. 2023, 38, 2276–2287, (In Chinese with abstract in English). [Google Scholar] [CrossRef]
- Black, K.; Kopac, P. The application of ground-penetrating radar in highway. Public Roads 1992, 56, 96–103. [Google Scholar]
- Wang, J.P.; Wang, J.M.; Zhang, Y.F. Research progress of ground penetrating radar (GPR) in detecting soil properties. Chin. J. Soil Sci. 2021, 52, 242–252, (In Chinese with abstract in English). [Google Scholar] [CrossRef]
- Li, H.; Lu, G.Y.; He, X.Q.; Deng, K. The progress of the GPR and discussion on its future development.Progress in Geophys. Prog. Geophys. 2010, 25, 1492–1502, (In Chinese with abstract in English). [Google Scholar] [CrossRef]
- Zou, H.L.; Ning, S.N.; Yang, F. The application of multi-wavelets transforms in signal processing for GPR. Comput. Eng. Appl. 2004, 40, 213–216, (In Chinese with abstract in English). [Google Scholar] [CrossRef]
- Li, L.; Fu, X.; Cui, J.; Zhang, C.; Zhu, D.H.; Wu, K.N. Soil layer identification based on envelope detector and STFT spectrum analysis of ground penetrating radar signals. J. Geo-Inf. Sci. 2020, 22, 316–327. [Google Scholar] [CrossRef]
- Wu, Q.; Yao, X.J.; Chen, X.D.; Zhao, M.; Zhao, H.; Yun, H. Nondestructive inspection method for soil profile configuration based on ground penetrating radar. Arid Land Geogr. 2022, 45, 1860–1869, (In Chinese with abstract in English). [Google Scholar] [CrossRef]
- Pettinelli, E.; Vannaroni, G.; Di Pasquo, B.; Mattei, E.; Di Matteo, A.; De Santis, A.; Annan, P.A. Correlation between near-surface electromagnetic soil parameters and early-time GPR signals: An experimental study. Geophysics 2007, 72, A25–A28. [Google Scholar] [CrossRef]
- Nie, J.; Yang, F.; Peng, S.; Hao, L. Geological radar detection algorithm research of water content in the shallow surface layers and its application. Disaster Adv. 2013, 6, 44–53. [Google Scholar]
- Di Matteo, A.; Pettinelli, E.; Slob, E. Early-time GPR signal attributes to estimate soil dielectric permittivity: A theoretical study. IEEE Trans. Geosci. Remote Sens. 2012, 51, 1643–1654. [Google Scholar] [CrossRef]
- Zhiyuan, W.; Fan, C.; Junli, N.; Tianxiang, X. Research on soil water content variation in coal mining area based on ground-penetrating radar. Int. J. Environ. Sci. Technol. 2022, 19, 5097–5108. [Google Scholar] [CrossRef]
Figure 1.
Topographic and geomorphological map of Zhungeer Banner. The five-pointed star is the location of the study area.
Figure 1.
Topographic and geomorphological map of Zhungeer Banner. The five-pointed star is the location of the study area.
Figure 2.
Schematic diagram of the soil profile in the research area. A, B refer to Study Zone A and Study Zone B, respectively.
Figure 2.
Schematic diagram of the soil profile in the research area. A, B refer to Study Zone A and Study Zone B, respectively.
Figure 3.
Layout plan of the radar survey lines in the research area. A, B refer to Study Zone A and Study Zone B; L1–L6 refers to the ground-penetrating radar wiring for radar detection.
Figure 3.
Layout plan of the radar survey lines in the research area. A, B refer to Study Zone A and Study Zone B; L1–L6 refers to the ground-penetrating radar wiring for radar detection.
Figure 4.
AEA method flowchart.
Figure 4.
AEA method flowchart.
Figure 5.
Two-dimensional raw images of ground penetrating radar. (a) Unprocessed two-dimensional image of ground-penetrating radar; (b) Preprocessed two-dimensional image of ground-penetrating radar.
Figure 5.
Two-dimensional raw images of ground penetrating radar. (a) Unprocessed two-dimensional image of ground-penetrating radar; (b) Preprocessed two-dimensional image of ground-penetrating radar.
Figure 6.
Envelope analysis curves. (a) Envelope line of the mixed reconstruction soil area in Zone A; (b) Envelope line of the three-layer reconstruction soil area in Zone B.
Figure 6.
Envelope analysis curves. (a) Envelope line of the mixed reconstruction soil area in Zone A; (b) Envelope line of the three-layer reconstruction soil area in Zone B.
Figure 7.
Envelope instantaneous phase fitting curve and convex-concave inflection point graph. (a) Envelope instantaneous phase fitting curve and convex-concave inflection point in Zone A; (b) Envelope instantaneous phase fitting curve and convex-concave inflection point in Zone B.
Figure 7.
Envelope instantaneous phase fitting curve and convex-concave inflection point graph. (a) Envelope instantaneous phase fitting curve and convex-concave inflection point in Zone A; (b) Envelope instantaneous phase fitting curve and convex-concave inflection point in Zone B.
Figure 8.
Hilbert-Huang transform graph. (a) Hilbert-Huang transform graph in Zone A; (b) Hilbert-Huang transform graph in Zone B.
Figure 8.
Hilbert-Huang transform graph. (a) Hilbert-Huang transform graph in Zone A; (b) Hilbert-Huang transform graph in Zone B.
Figure 9.
Fitting graph of the permittivity and reciprocal of the radar signal envelope value.
Figure 9.
Fitting graph of the permittivity and reciprocal of the radar signal envelope value.
Figure 10.
Fitting graph of moisture content and radar amplitude.
Figure 10.
Fitting graph of moisture content and radar amplitude.
Figure 11.
Comparison chart of the moisture content between the AEA and drying methods in the N-S direction in Zone A: (a) Comparison of the moisture content between the AEA and drying methods in the upper part of Zone A; (b) Comparison of the moisture content between the AEA and drying methods in the bottom part of Zone A.
Figure 12.
Comparison chart of the moisture content between the AEA and drying methods in the N-S direction of Zone B: (a) Comparison of the moisture content between the AEA and drying methods in the upper part of Zone B; (b) Comparison of the moisture content between the AEA and the drying methods in the bottom part of Zone B.
Figure 13.
Comparison chart of the moisture content trends of AEA in Zone A. (a) Comparison of the moisture content trends of AEA in the N-S direction in Zone A; (b) Comparison of the moisture content trends of AEA in the E-W direction in Zone A.
Figure 13.
Comparison chart of the moisture content trends of AEA in Zone A. (a) Comparison of the moisture content trends of AEA in the N-S direction in Zone A; (b) Comparison of the moisture content trends of AEA in the E-W direction in Zone A.
Figure 14.
Comparison chart of the moisture content trends of AEA in Zone B. (a) Comparison of the moisture content trends of AEA in the N-S direction in Zone B; (b) Comparison of the moisture content trends of AEA in the E-W direction in Zone B.
Figure 14.
Comparison chart of the moisture content trends of AEA in Zone B. (a) Comparison of the moisture content trends of AEA in the N-S direction in Zone B; (b) Comparison of the moisture content trends of AEA in the E-W direction in Zone B.
Table 1.
Comparison of the errors in the drying method and AEA of the moisture content at the different depths.
Table 1.
Comparison of the errors in the drying method and AEA of the moisture content at the different depths.
| Test Region | r2 | MRE/% | RMSE/% |
|---|
| Upper of Zone A | 0.98 | 2.81 | 2.28 |
| Middle of Zone A | 0.97 | 5.01 | 3.97 |
| Bottom of Zone A | 0.96 | 8.41 | 9.56 |
| Upper of Zone B | 0.96 | 2.92 | 2.55 |
| Middle of Zone B | 0.97 | 3.78 | 3.99 |
| Bottom of Zone B | 0.94 | 7.64 | 10.06 |
Table 2.
Comparison of inversion and actual values of moisture content and soil thickness.
Table 2.
Comparison of inversion and actual values of moisture content and soil thickness.
| | | Upper of Zone A | Middle of Zone A | Bottom of Zone A | Upper of Zone B | Middle of Zone B | Bottom of Zone B |
|---|
| Soil moisture content | Measured value/% | 7.41 | 7.98 | 10.73 | 7.61 | 9.89 | 13.09 |
| Inversion value/% | 7.38 | 7.87 | 10.13 | 7.62 | 9.67 | 12.41 |
| Thickness of soil layer | Measured value/% | | | | 1.40 | 0.80 | 0.80 |
| Inversion value/% | | | | 1.47 | 0.88 | 0.65 |
| Soil type | | Mixed soil | Mixed soil | Mixed soil | Loess | Sandy loam | Red clay |
| Disclaimer/Publisher’s Note: The statements, opinions and data contained in all publications are solely those of the individual author(s) and contributor(s) and not of MDPI and/or the editor(s). MDPI and/or the editor(s) disclaim responsibility for any injury to people or property resulting from any ideas, methods, instructions or products referred to in the content. |
© 2024 by the authors. Licensee MDPI, Basel, Switzerland. This article is an open access article distributed under the terms and conditions of the Creative Commons Attribution (CC BY) license (https://creativecommons.org/licenses/by/4.0/).


