Article

Evaluating the Spatiotemporal Distributions of Water Conservation in the Yiluo River Basin under a Changing Environment

by
Yufan Jia
1,2,3,4,
Junliang Jin
1,2,3,4,
Yueyang Wang
1,2,3,4,
Xinyi Guo
3,4,
Erhu Du
1,2,3,* and
Guoqing Wang
1,2,3,4,*
1
The National Key Laboratory of Water Disaster Prevention, Nanjing 210098, China
2
Yangtze Institute for Conservation and Development, Nanjing 210098, China
3
Research Center for Climate Change, Ministry of Water Resources, Nanjing 210029, China
4
Cooperative Innovation Center for Water Safety and Hydro Science, Hohai University, Nanjing 210098, China
*
Authors to whom correspondence should be addressed.
Water 2024, 16(16), 2320; https://doi.org/10.3390/w16162320
Submission received: 2 July 2024 / Revised: 7 August 2024 / Accepted: 15 August 2024 / Published: 18 August 2024

Abstract

:
Water conservation is a crucial indicator that measures the available water resources needed for maintaining regional ecological services and socioeconomic development. The Yiluo River Basin plays an essential role in water conservation in the Yellow River Basin, which is one of the most important river basins with vulnerable ecological conditions and a large population in China. However, previous studies have a limited understanding of the distribution of water conservation in the Yiluo River Basin. To address this knowledge gap, we developed a SWAT model to evaluate water conservation in the Yiluo River Basin with high spatial and temporal details on a monthly scale. From a monthly perspective, water conservation accumulation primarily took place in July (54.6 mm), August (23.5 mm), and September (33.2 mm), which are in the flood season. From 1966 to 2018, we found a significant 47% reduction in basin-wide water conservation, and the reduction was primarily influenced by meteorological conditions and underlying surface dynamics. The results of the temporal correlation analysis identified precipitation as the most significant factor influencing water conservation, while the spatial correlation analysis revealed that potential evapotranspiration, vegetation, and elevation had the highest spatial correlation with water conservation. By combining SWAT outputs on the HRU (hydrological response unit) scale with the spatial distribution of HRUs, the study achieved the visualization of the spatial distribution of water conservation, identifying Luonan County, Luanchuan County, and Luoning County as the key regions that experienced water conservation decline over the past decades. These findings advance our understanding of the distributions of water conservation and their key driving factors in the study area and provide valuable policy implications to support ecological protection and water resource management in the Yellow River Basin.

1. Introduction

Over the past several decades, the Yellow River Basin, as one of the biggest basins in China, has undergone significant changes in its natural environment driven by anthropogenic activities and climate change. Water resource scarcity and global warming have already posed serious threats to its vulnerable ecosystems [1]. As the central basin of the Yellow River Basin water conservation zone, the Yiluo River Basin plays an important part in protecting and enhancing the ecosystem service function with its diverse landforms and abundant vegetation [2]. It is characterized by a temperate continental climate with distinct seasonal variations—hot, rainy summers and cold, dry winters. Additionally, the river is located in Shaanxi Province, one of China’s major industrial bases. The region has a high degree of industrialization, primarily focusing on energy, heavy industry, and high-tech industries. Although this industrialization has driven economic development, it has also exerted a certain degree of pressure on the environment in the Yiluo River Basin. Among numerous ecosystem service functions related to environmental protection, water conservation holds central importance in sustaining the basin’s ecological balance. According to the requirements of the “Outline of the Yellow River Basin’s Ecological Protection and High-Quality Development Plan”, the main challenges and ecological tasks facing the Yiluo River Basin are quantitatively evaluating water conservation, analyzing the main influencing factors of water conservation, and rationally regulating water conservation in response to a changing environment [3]. In fact, the ecosystem water conservation function represents a prominent area of the intersection of ecology and hydrology [4]. Currently, the definition of water conservation is divided into the following two levels: broad and narrow. The narrow definition typically refers to the role of plant ecosystems in intercepting precipitation and regulating runoff. In contrast, the broad definition encompasses a variety of ecosystems, including forests, meadows, woodlands, marshes, and lakes, as well as a wide range of ecological factors, for example, water, soil, and atmosphere [5]. Depending on various research purposes, water conservation functions are characterized in different ways. In this study, we define water conservation as the water-holding capacity of a region, which is influenced by factors such as climate, soil, vegetation, and others. Moreover, the stored water in the region must be able to replenish surface runoff or groundwater, providing a relatively stable water source for the region’s agricultural and industrial development.
In the study of hydrology, the quantitative assessment of water conservation typically relies on the following two main methodologies: traditional methods and hydrological modeling. Traditional approaches primarily focus on determining the maximum potential precipitation interception and often provide accurate outcomes. However, their reliance on point-scale experiments may limit their ability to accurately capture the spatial distribution of water conservation. Therefore, hydrological models capable of simulating complicated hydrological processes at large scale are becoming wildly applied to assess ecosystem service functions. Such models include the Soil Conservation Service model (SCS) [6], the Integrated Assessment of Ecosystem Services and Trade-Offs model (InVEST) [7], the Temperature–Vegetation Aridity Index (TVDI) model, and the SWAT model [8,9,10]. For example, Liu et al. [11] utilized the SCS model to assess regional water conservation capacity through surface runoff volume; Chen [12] used the TVDI model to calculate the soil moisture content as a key indicator of the water conservation capacity; Li et al. [13] employed the InVEST model to evaluate water conservation functions in the Danjiangkou Basin; Zhang et al. [7] conducted an evaluation of water conservation functions in the Weihe River Basin based on the InVEST model and identified key areas. Additionally, machine learning methods have been introduced into hydrological prediction and assessment. Tang et al. [14] utilized dynamic clustering and random forest techniques to identify flood types and significantly improved the accuracy of flood predictions. However, among all these models, the SWAT model was widely applied, because it enables a comprehensive overview of the diverse processes involved in water conservation, accounting for the influence of slope, land use types, and soil types [15]. Soomro et al. [16] combined geomorphometric parameters and the SWAT model to enhance the accuracy of flood risk assessment; Chung et al. [17] used an integrated SWAT-MODFLOW model to focus on determining the exploitable amount of groundwater in the Mihocheon watershed, South Korea; Goldstein & Tarhule [18] investigated the effects of climate change and the cultivation of switchgrass on hydrological processes in a semiarid basin in the US Great Plains using the SWAT model. In particular, most current studies about water conservation have focused on examining the multiannual variation in water conservation, with a lack of understanding of the intra-annual changes in water conservation and the influencing factors, such as meteorological elements and land use, which are critical in affecting hydrological processes [15,19,20,21]. However, the SWAT model can refine the analysis of water conservation from an annual scale to monthly or daily scales based on the granularity of the data [13]. Additionally, it can also reflect the contribution of water storage increment in each unit to vegetation growth and habitat quality, as well as the roles of runoff regulation and baseflow supplementation in water conservation through groundwater and soil flow.
This study aims to comprehensively and quantitatively evaluate the water conservation of the Yiluo River Basin. We developed a SWAT model to assess water conservation and its annual and monthly distributions with high spatial and temporal resolutions. The quantile classification and Sen’s trend analysis method were used to identify the key areas and trends. Additionally, we examined the responses of water conservation to a number of environmental factors (e.g., meteorological conditions and subsurface geomorphology). The results will provide important policy implications for environmental and ecological protection in the whole Yellow River Basin.

2. Materials and Methods
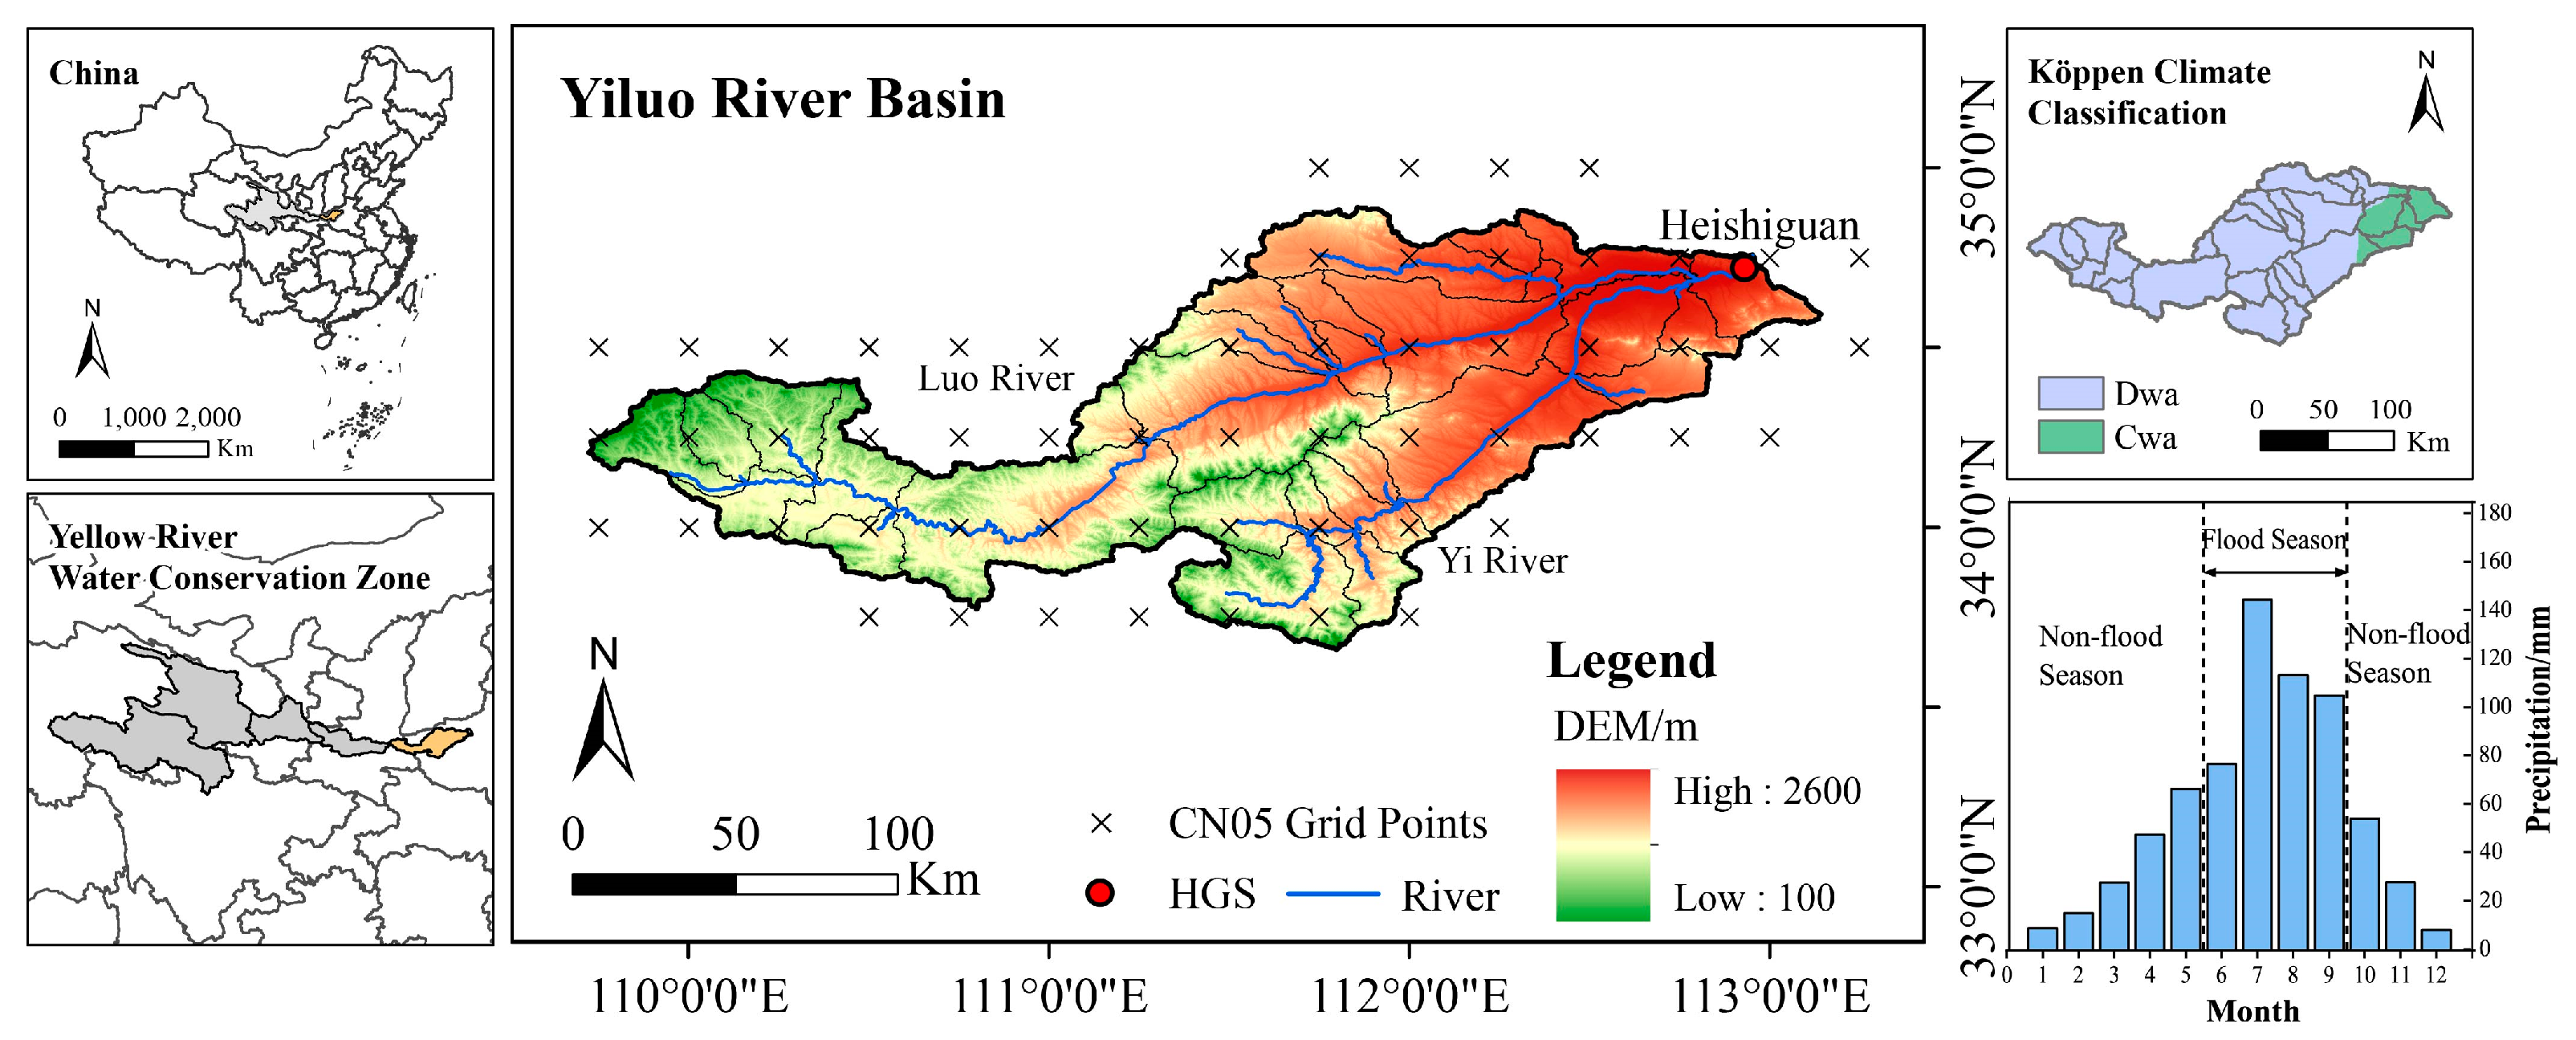
2.1. Study Area

The Yiluo River Basin, located in Henan Province, China, spans an area of 18,550 km2 and extends 447 km, with two main tributaries—the Yi and Luo rivers (Figure 1). The upper region consists mainly of soil and rocky mountain covered with lush vegetation, the lower reaches feature low mountains, hills, and river valley plains. The river experiences a humid to semi-humid continental monsoon climate, with hot, rainy summers and cold, snowy winters [22]. The annual precipitation averages about 700 mm, with 60% occurring during the flood season (June to October). The annual average actual evapotranspiration is approximately 556 mm, with a corresponding annual average runoff of about 22.8 billion m3. Because of its rich vegetation and abundant summer rainfall, the Yiluo River Basin demonstrates a significant water conservation capacity, making it a worthwhile subject for scholarly investigation.
Figure 1 presents the Köppen climate classification results for the Yiluo River Basin. This study utilized CN05 gridded precipitation and temperature data from 1961 to 2018 for each grid point to conduct the Köppen climate classification. The results indicate that most of the western part of the Yiluo River Basin falls under the humid continental climate with a hot summer and dry winter (Dwa), while a small part of the upstream eastern region belongs to the humid subtropical climate also with hot summer and dry winter (Cwa). These classification results are consistent with those obtained by Wang Ting in their Köppen climate classification for China, ensuring the reliability of the results [23]. The river, located in the Dwa and Cwa climate zones, exhibits typical characteristics of these two climate types, as follows: hot and rainy summers, mild and dry winters, with precipitation during the flood season accounting for 60% of the annual total.
There are six primary land use types within the study area, as follows: cropland, forest, grassland, water body, urban land, and bare land. Forest land, grassland, and cropland are the major types, covering a total area of 93%. It can be observed from Figure 2 that the land use/cover in the Yiluo River Basin underwent significant changes in 1980, 1995, and 2015. In 1980, cropland was primarily distributed in the central and southern regions of the basin, while forests were mainly located in the northern and western mountainous areas. Grassland was sparsely distributed in the transitional areas between cropland and forests. Urban land and bare land covered relatively small areas, concentrated in a few regions. By 1995, the area of cropland had decreased, especially in the central and southern parts, while forest cover had increased, particularly in the northern and western mountainous areas. The area of grassland remained largely unchanged but became more concentrated. Urban land had expanded, mainly around major towns, indicating the initial stages of urbanization. In 2015, vegetation restoration and protection measures had yielded some results. The area of cropland continued to decrease, and forest cover further increased. Simultaneously, the area of urban land had significantly expanded, extending into more regions, especially around major cities and towns, signifying an accelerated urbanization process.

2.2. Data Source and Processing Method

We collected a set of meteorological, hydrological, and subsurface data for the development of the SWAT model. The meteorological data include monthly precipitation, wind speed, temperature, and solar radiation. Subsurface data include soil types, soil saturated hydraulic conductivity, and soil available water content. Hydrological data include monthly streamflow data spanning from 1961 to 2018. All of these data and sources are shown below (Table 1). To ensure temporal and spatial consistency across the collected multisource data, we used ArcGIS 10.3 for reprojection and gridding. All datasets were transformed to the same coordinate system and resampled to a uniform grid resolution. For any periods with missing data, linear interpolation and similar methods were used to fill the gaps, based on overlapping timeframes.

2.3. Methodology

2.3.1. Statistic Method for Analyzing Abrupt Changes in Hydrological and Meteorological Conditions

The Mann–Kendall change point test, as a nonparametric statistical method, is commonly employed for identifying abrupt changes in hydro–meteorological time series data [27]. Its robustness extends to the handling of missing values and outliers, making it especially well-suited for evaluating the significance of trends in extensive time series data. Building upon this foundation, we incorporated the Theil–Sen trend test for calculating trends [28]. The specific formula of this method is shown below:
β = M e d i a n X j X i j i j > i
If β is greater than zero, then there is an uptrend, whereas a β less than zero indicates a declining trend. By combining both the Sen method and the MK method, the sign of β provides information about the trend direction, while the MK value quantifies the degree of significance.
Given the potential changes in hydrological cycle consistency over long-term runoff simulations, using abrupt change points in meteorological and hydrological elements to segment the runoff simulation periods can more accurately capture these significant changes in hydrological processes. These change points typically indicate shifts in climate, land use, or human activities. By identifying these changes, this study divided the simulation period into the following three relatively stable phases: 1966–1985 (Period I), 1986–2000 (Period II), and 2001–2018 (Period III) (the specific results and bases for the abrupt change analysis are detailed in Section 3.1 and Section 3.2). This segmentation approach can effectively enhance the model’s simulation accuracy within each phase, reduce the overall errors, and better reflect the dynamic response of runoff to environmental changes.

2.3.2. Development of the SWAT Model and Assessment of Water Conservation

In this study, we developed a SWAT model to quantitatively evaluate the water conservation. The SWAT model, developed by the USDA (United States Department of Agriculture), is a typical semi-distributed model [29]. It considers many different types of soil, land use, changing climatic environments, and complex management practices, having an explicit physical basis for describing the spatial–temporal variability in hydrological processes. The SWAT model divides the watershed into several mutually independent and uniform units based on input data including soil, land use, and slope, referred to as hydrological response units (HRUs). Precipitation is distributed over each HRU, where a portion of the water evaporates back into the atmosphere through plant transpiration and soil evaporation, while another portion forms surface runoff and enters the river channel. The remaining water (which we consider as the water conservation) infiltrates into the soil, with some becoming subsurface flow and joining the river channel, and the rest percolating into groundwater storage, ultimately contributing to groundwater flow into the river. From a hydrological perspective, the water conservation is approximately equal to the sum of subsurface flow, groundwater flow, and HRU water storage changes. The specific formula for calculating water conservation on each HRU is as follows:
W R i = P R E i A E T i S U R F i
where W R i     is the model-calculated water conservation in month i (mm); P R E i   represents the precipitation in month i (mm); A E T i   represents the model-calculated actual evapotranspiration in month i (mm); and S U R F i   is the surface runoff in month i (mm).
As the initial parameters may be unable to accurately reflect the characteristics of runoff from Heishiguan station, a sensitivity analysis is conducted. Based on a literature review, 18 commonly used runoff simulation parameters were selected for the Yellow River Basin for the global sensitivity analysis [30]. Using a p-value threshold of <0.4 to identify and select the most sensitive parameters for model calibration and validation, the most sensitive parameters were selected to enhance the operational efficiency. The 15 selected parameters are representative of the soil (SOL_AWC, SOL_K, and SOL_BD), vegetation (CANMX and EPCO), delineation of runoff components (CN2, ALPHA_BF, ALPHA_BNK, and GWQMN), evapotranspiration processes (REVAPMN, GW_REVAP, and ESCO), and channel characteristics (CH_N2, CH_K2, and SLSUBBSN) of the watershed. The specific results of the sensitivity analysis for the parameters are presented in Table 2.
For measuring the goodness of fit of the model, the Nash–Sutcliffe efficiency coefficient (NSE) and the coefficient of determination (R2) were used. The NSE results are used to indicate the quality of the simulation. The value range of the Nash–Sutcliffe efficiency coefficient is [−∞, 1], where values closer to 1 indicate a higher accuracy of the model simulation. The specific calculation formula is as follows:
N S E = 1 i = 1 n Q o b s Q s 2 i = 1 n Q o b s Q s ¯ 2
The coefficient of determination (R2) reflects the fit between the simulated and observed values. Its value range is [0, 1], with values closer to 1 indicating a better fit. The specific calculation formula is as follows:
R 2 = i = 1 n Q o b s Q o b s ¯ Q s Q s ¯ 2 i = 1 n Q o b s Q o b s ¯ 2 i = 1 n Q s Q s ¯ 2
In the equation, n represents the number of time steps in the simulation; i denotes the i-th time step; Q o b s is the observed runoff value; Q s is the simulated runoff value; Q o b s ¯ is the mean of the observed data; and Q s ¯ is the mean of the simulated data. The Nash–Sutcliffe efficiency coefficient in the range of [0.5, 0.65] indicates acceptable results; values between [0.65, 0.75] indicate good simulation results; and values between [0.75, 1] indicate accurate simulation results. The coefficient of determination in the range of [0.5, 0.75] indicates acceptable results; values between [0.75, 1] indicate accurate simulation results.
To achieve the quantitative assessment and spatial visualization of water conservation in the Yiluo River Basin, this study combined the SWAT model and GIS technology through the detailed division of hydrological response units (HRUs) and spatial analysis. The specific methodology is as follows: Firstly, the watershed is divided into nearly 500 HRUs, with areas ranging from 0 to 200 km2, based on land use, soil type, and topography. The SWAT model is then used to calculate the water conservation of each HRU individually. Using the spatial distribution of HRUs, ArcGIS software is employed to transform the textual output of the HRUs into spatial maps by associating the SWAT model outputs with the spatial locations of the HRUs. ArcGIS’s spatial analysis functions are utilized to statistically analyze the water conservation of different HRUs and to generate intuitive spatial distribution maps. This method not only displays the spatial distribution of water conservation but also reveals, to some extent, the influence of different land use types and topographical conditions on the spatial distribution of water conservation.

2.3.3. SUFI-2 Uncertainty Analysis Algorithm

The SUFI-2 algorithm represents the uncertainty of all sources through the parameter uncertainty in the hydrological model. This method describes the parameter uncertainty as a multivariate uniform distribution within a parameter hypercube. The 95% confidence interval is determined by the 2.5% and 97.5% cumulative distribution percentiles obtained through Latin hypercube sampling, and this interval is used to assess the uncertainty of the simulation results [31]. The algorithm uses the following two indicators to measure the uncertainty of model simulations: the P-factor and the R-factor. The P-factor represents the percentage of observed data within the 95% confidence interval, while the R-factor is the average width of the 95% confidence interval divided by the standard deviation of the observed data. The value range of the P-factor is [0, 100%], with values closer to 100% indicating that the simulated data are closer to the observed data. The value range of the R-factor is [0, 1], with values closer to 0 indicating a small uncertainty of the simulation.

2.3.4. Temporal Correlation Analysis and Geodetector Tool

To analyze the temporal correlation between influencing factors and water conservation capacity, this study employed Pearson correlation analysis, which is a statistical method used to measure the linear relationship between two variables [32]. By calculating the Pearson correlation coefficient, we can quantify the linear correlation between two variables, aiding in the understanding of how different influencing factors affect the water conservation capacity within the watershed. Based on this analysis, we used the 31 sub-basins delineated by the SWAT model as the basic units for the correlation analysis. Through Pearson correlation analysis and the spatial distribution of the sub-basins within the Yiluo River Basin, we further examined the temporal correlation of the core influencing factors and their spatial distributions.
To analyze the spatial correlation between influencing factors and water conservation capacity, this study employed the Geographical detector. Geographical detector is a statistical method that explores the explanatory power of independent variables on dependent variables, revealing the spatial heterogeneity of the dependent variables and the driving forces behind them [33]. Factor detection is a core component of the geographical detector. It reflects the spatial heterogeneity of the dependent variable and the extent to which each independent variable influences the spatial distribution of the dependent variable. This influence is measured by comparing the overall variance within the study area to the sum of the variances within the stratified subregions. The larger this ratio, the weaker the explanatory power of the factor on the spatial heterogeneity of the dependent variable. This is measured by the q value, and the specific calculation formula is as follows [34]:
q = 1 h = 1 L σ h 2 N σ 2 = 1 S S W S S T ( h = 1,2 , 3 , , L )
S S W = h = 1 L N h σ h 2 , S S T = N σ 2  
In the equation, h represents the stratification of the dependent or independent variable factors; N h and N represent the sample size within stratum h and the total sample size for the entire study area, respectively; σ h 2 and σ 2 represent the variance within stratum h and the variance for the entire area, respectively; and SSW and SST represent the sum of variances within each stratum and the sum of variances for the whole area, respectively.

2.3.5. Water Conservation Importance Classification

To support water conservation protection within the Yiluo River Basin, we used the quantile approach to categorize the water conservation level of importance based on the ecological protection red line [35]. According to the “red line”, water conservation in the Yiluo River Basin is classified into the following five levels: extremely important (V: 148–229 mm), highly important (IV: 128–148 mm), moderately important (III: 103–128 mm), slightly important (II: 73–103 mm), and generally important (I: 0–73 mm) [36,37].

3. Results

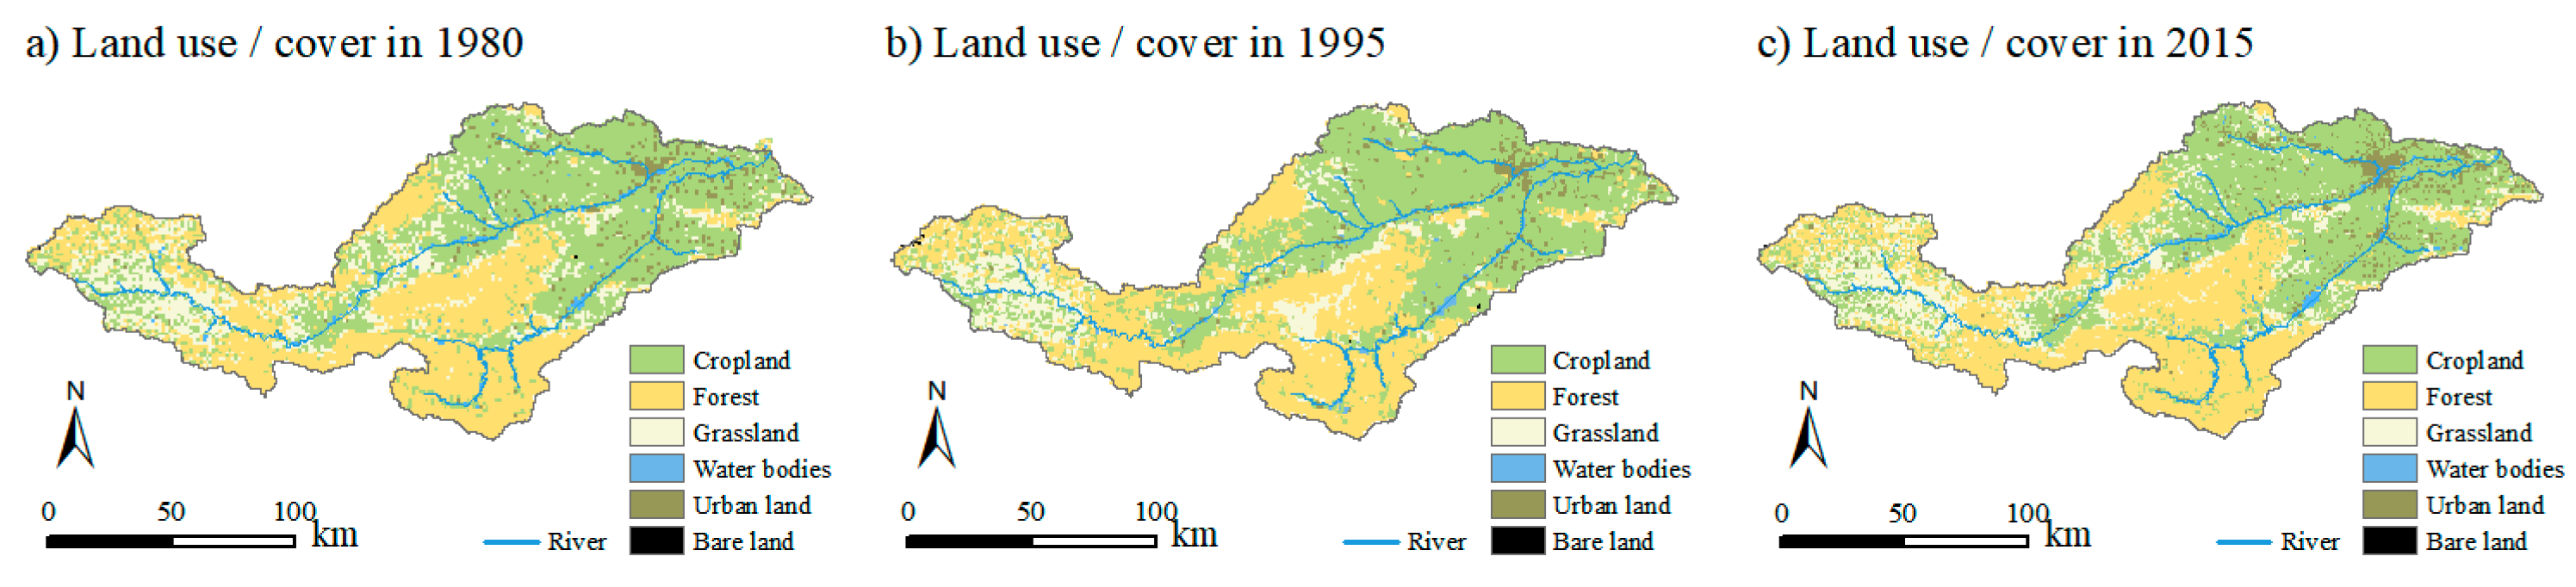
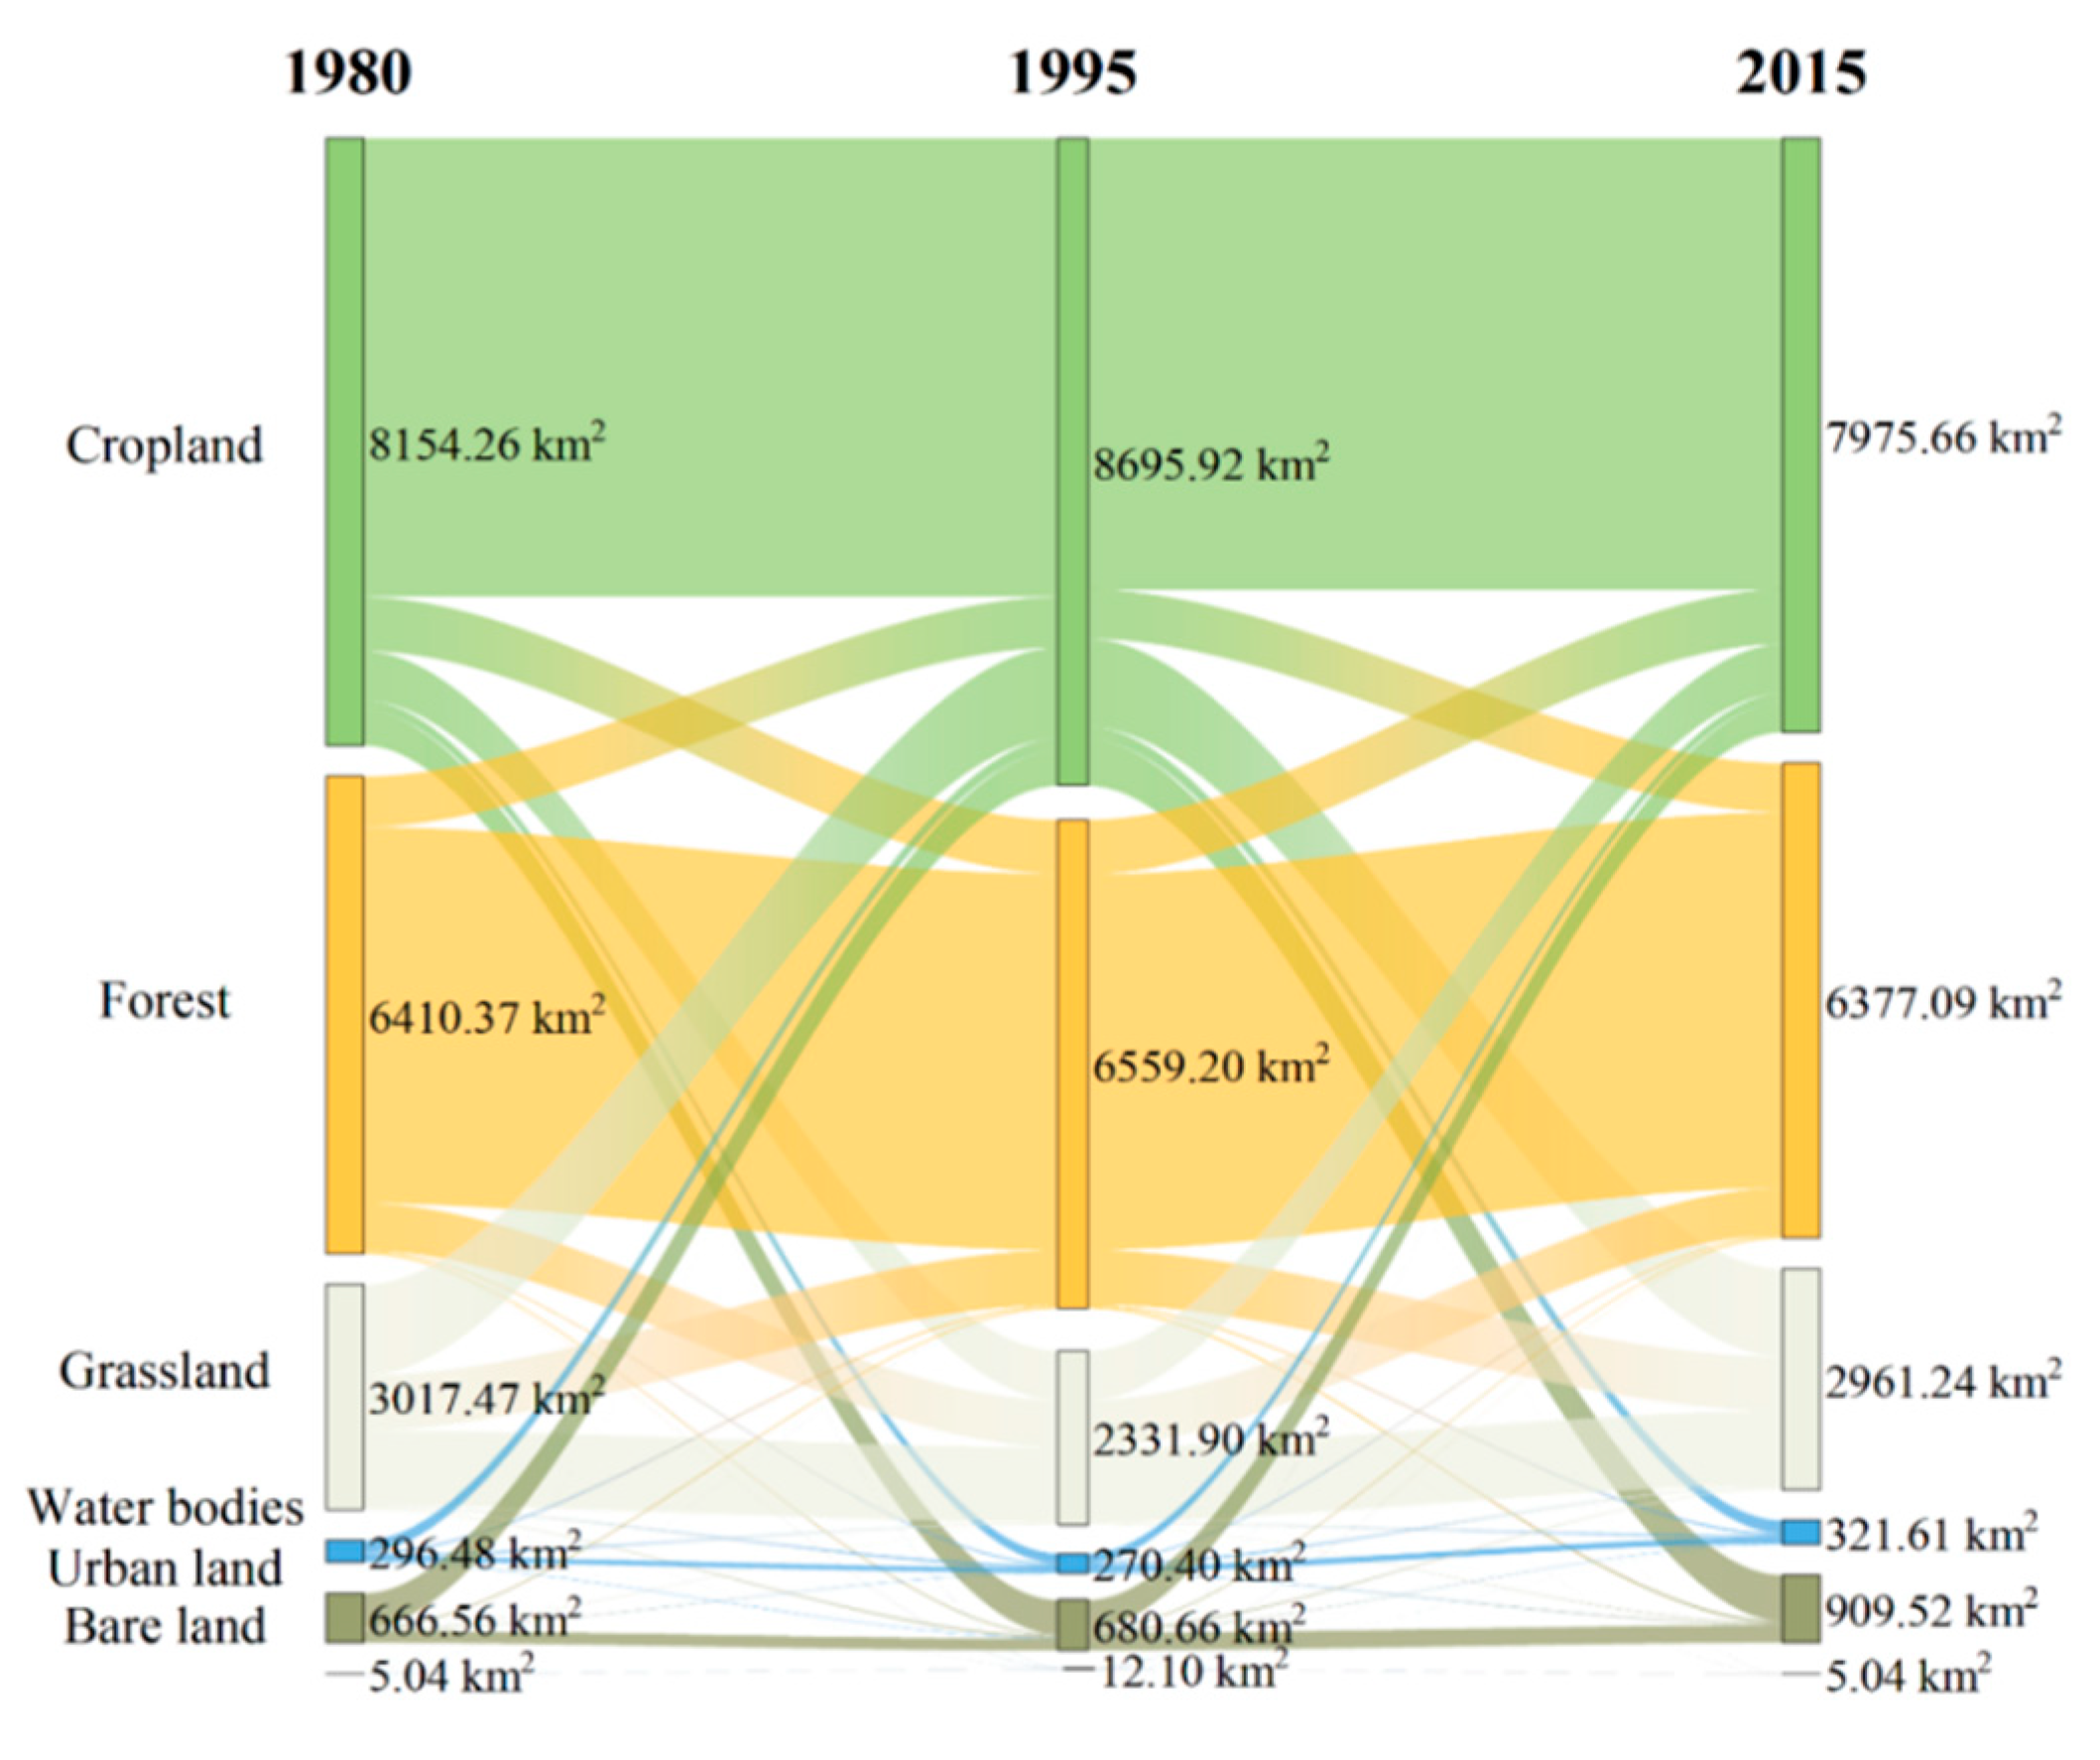
3.1. Meteorological, Hydrological and Land Use Changes

The Mann–Kendall test was employed for diagnosing the sudden changes in precipitation, temperature, and runoff [38,39]. Figure 3 presents the temporal evolution and diagnostic outcomes in the meteorological and hydrological elements spanning from 1961 to 2018. As depicted in the figure, the statistical parameters of the basin’s average temperature exhibited a distinct and significant intersection in the year 2000, rising from 11.7 °C to 12.3 °C. The statistical parameters of precipitation and annual measured runoff last intersected in 1985, signifying an abrupt change in both precipitation and runoff sequences during that year.
Through the 5-year moving average process, it is evident that precipitation was relatively high from 1961 to 1985, especially in 1964 (1088 mm, about 1.55 times the multiyear average). Since 1985, it has been relatively low, reaching a minimum in 1997 (450 mm, which is only 64% of the multiyear average). Meanwhile, the runoff at Heishiguan Station exhibited an overall decreasing trend, with the average annual runoff decreasing from 3 billion m3 to 1.8 billion m3. According to the diagnostic results, the runoff series is divided into the following two periods: 1961–1985 and 1986–2018. The maximum runoff occurred in 1964 (9.5 billion m3), nearly four times the multiyear average, whereas the minimum runoff occurred in 1995 (5.6 billion m3), representing only 25% of the multiyear average.
Previous studies suggested that the effects of anthropogenic activities in the Yellow River Basin did not become prominent until after 1980 [40,41]. After that year, the areas of cropland and urban land increased gradually from 1980 to 1995 [41]. Then, around the year 2000, China implemented a series of ecological restoration practices; one of them is to return cultivated land to forest or pastures. Nowadays, as socio-economy situations entered a period of rapid development stage, urban land expansion emerges as the most prominent feature of land use changes [42]. Figure 4 illustrates the areas of different land uses and their interconversion between 1980, 1995, and 2015. The most notable changes occur among cropland, forest, and grassland, whereas urban land, bare land, and water bodies constitute only a small portion of the total land area. From 1980 to 2015, cropland decreased by approximately 180 km2, with most of this reduction converting to forest, grassland, and urban land. Grassland experienced a slight decrease (~56 km2), mainly converting to cropland and forest. In contrast, forest land remained relatively constant at around 6400 km2. During this period, urban land increased significantly. Meanwhile, water bodies and bare land showed minimal change, underscoring the dominant transitions among cropland, forest, and grassland.

3.2. Model Analysis and Evaluation

3.2.1. Model Calibration and Validation

The analysis in Section 3.1 indicated that precipitation and surface runoff changed rapidly in 1985. Typically, an abrupt shift in runoff signifies the onset of a substantial influence of human activities [43]. Hence, the study sets the initial time period as 1966–1985, selecting the first ten years and the last ten years as calibration period and validation period, respectively. Meanwhile, Fu’s study suggests that the water cycle relationship in the Yellow River Basin underwent an important change around 2000 [44,45]. They found that the main reasons for the abrupt change in runoff consistency in the Yellow River Basin after 2000 are the increase in extreme precipitation events and the impact of human activities, such as dam construction and soil and water conservation measures. These factors have collectively altered the spatiotemporal distribution of water and sediment discharge within the basin, leading to a significant increase in extreme runoff events since 2000. According to these reasons, the study classified the remaining time into the following two segments: 1986–2000 and 2001–2018. The model calibration and validation effects for the three periods are shown as follow (Table 3).
The comparison of the simulated and observed streamflow is shown in Figure 5.

3.2.2. Uncertainty Analysis

The calibration and validation results for three distinct periods (1966–1975, 1986–1995, and 2001–2010) were analyzed. The P-factor and R-factor are presented in Table 3. During the first period, the R-factor values suggest that the model’s predictions were reasonably precise. Within that uncertainty band, the P-factor values indicate that a substantial portion of the observed data is captured, especially during the calibration phase. The P-factor and R-factor values during Period II show that the model maintained a good balance between reliability and precision, capturing most of the observed data within the uncertainty bands. In the final period, the P-factor values indicate a high level of data capture within the uncertainty bands during both calibration and validation phases. However, the R-factor during the validation phase suggests a broader uncertainty band, which may be caused by the increasingly active human activities. Overall, the uncertainty analysis demonstrates that the SWAT model provides reliable and robust simulations for the Yiluo River Basin, with a good balance between capturing observed data and maintaining prediction precision. This analysis supports the model’s application in hydrological assessments and water resource management in the basin.

3.3. Spatial and Temporal Distribution of Water Conservation

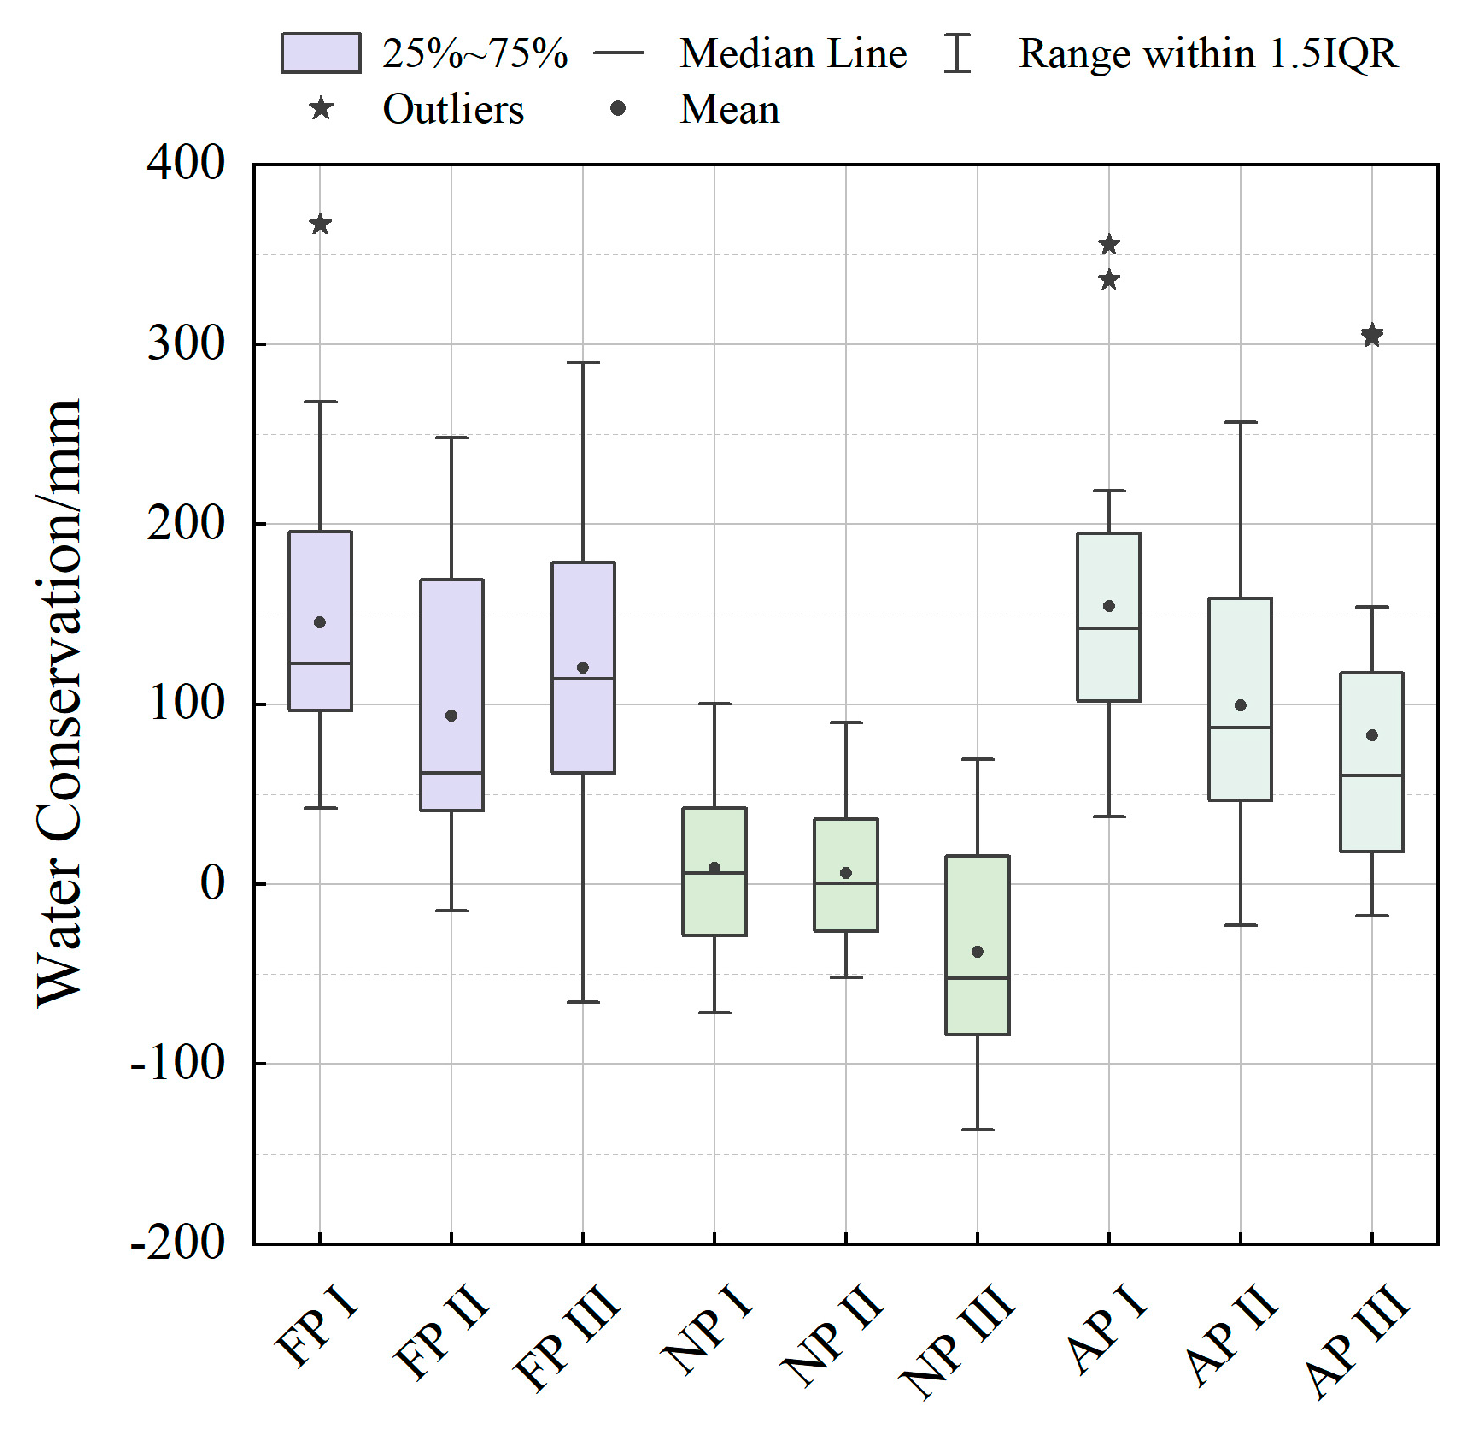
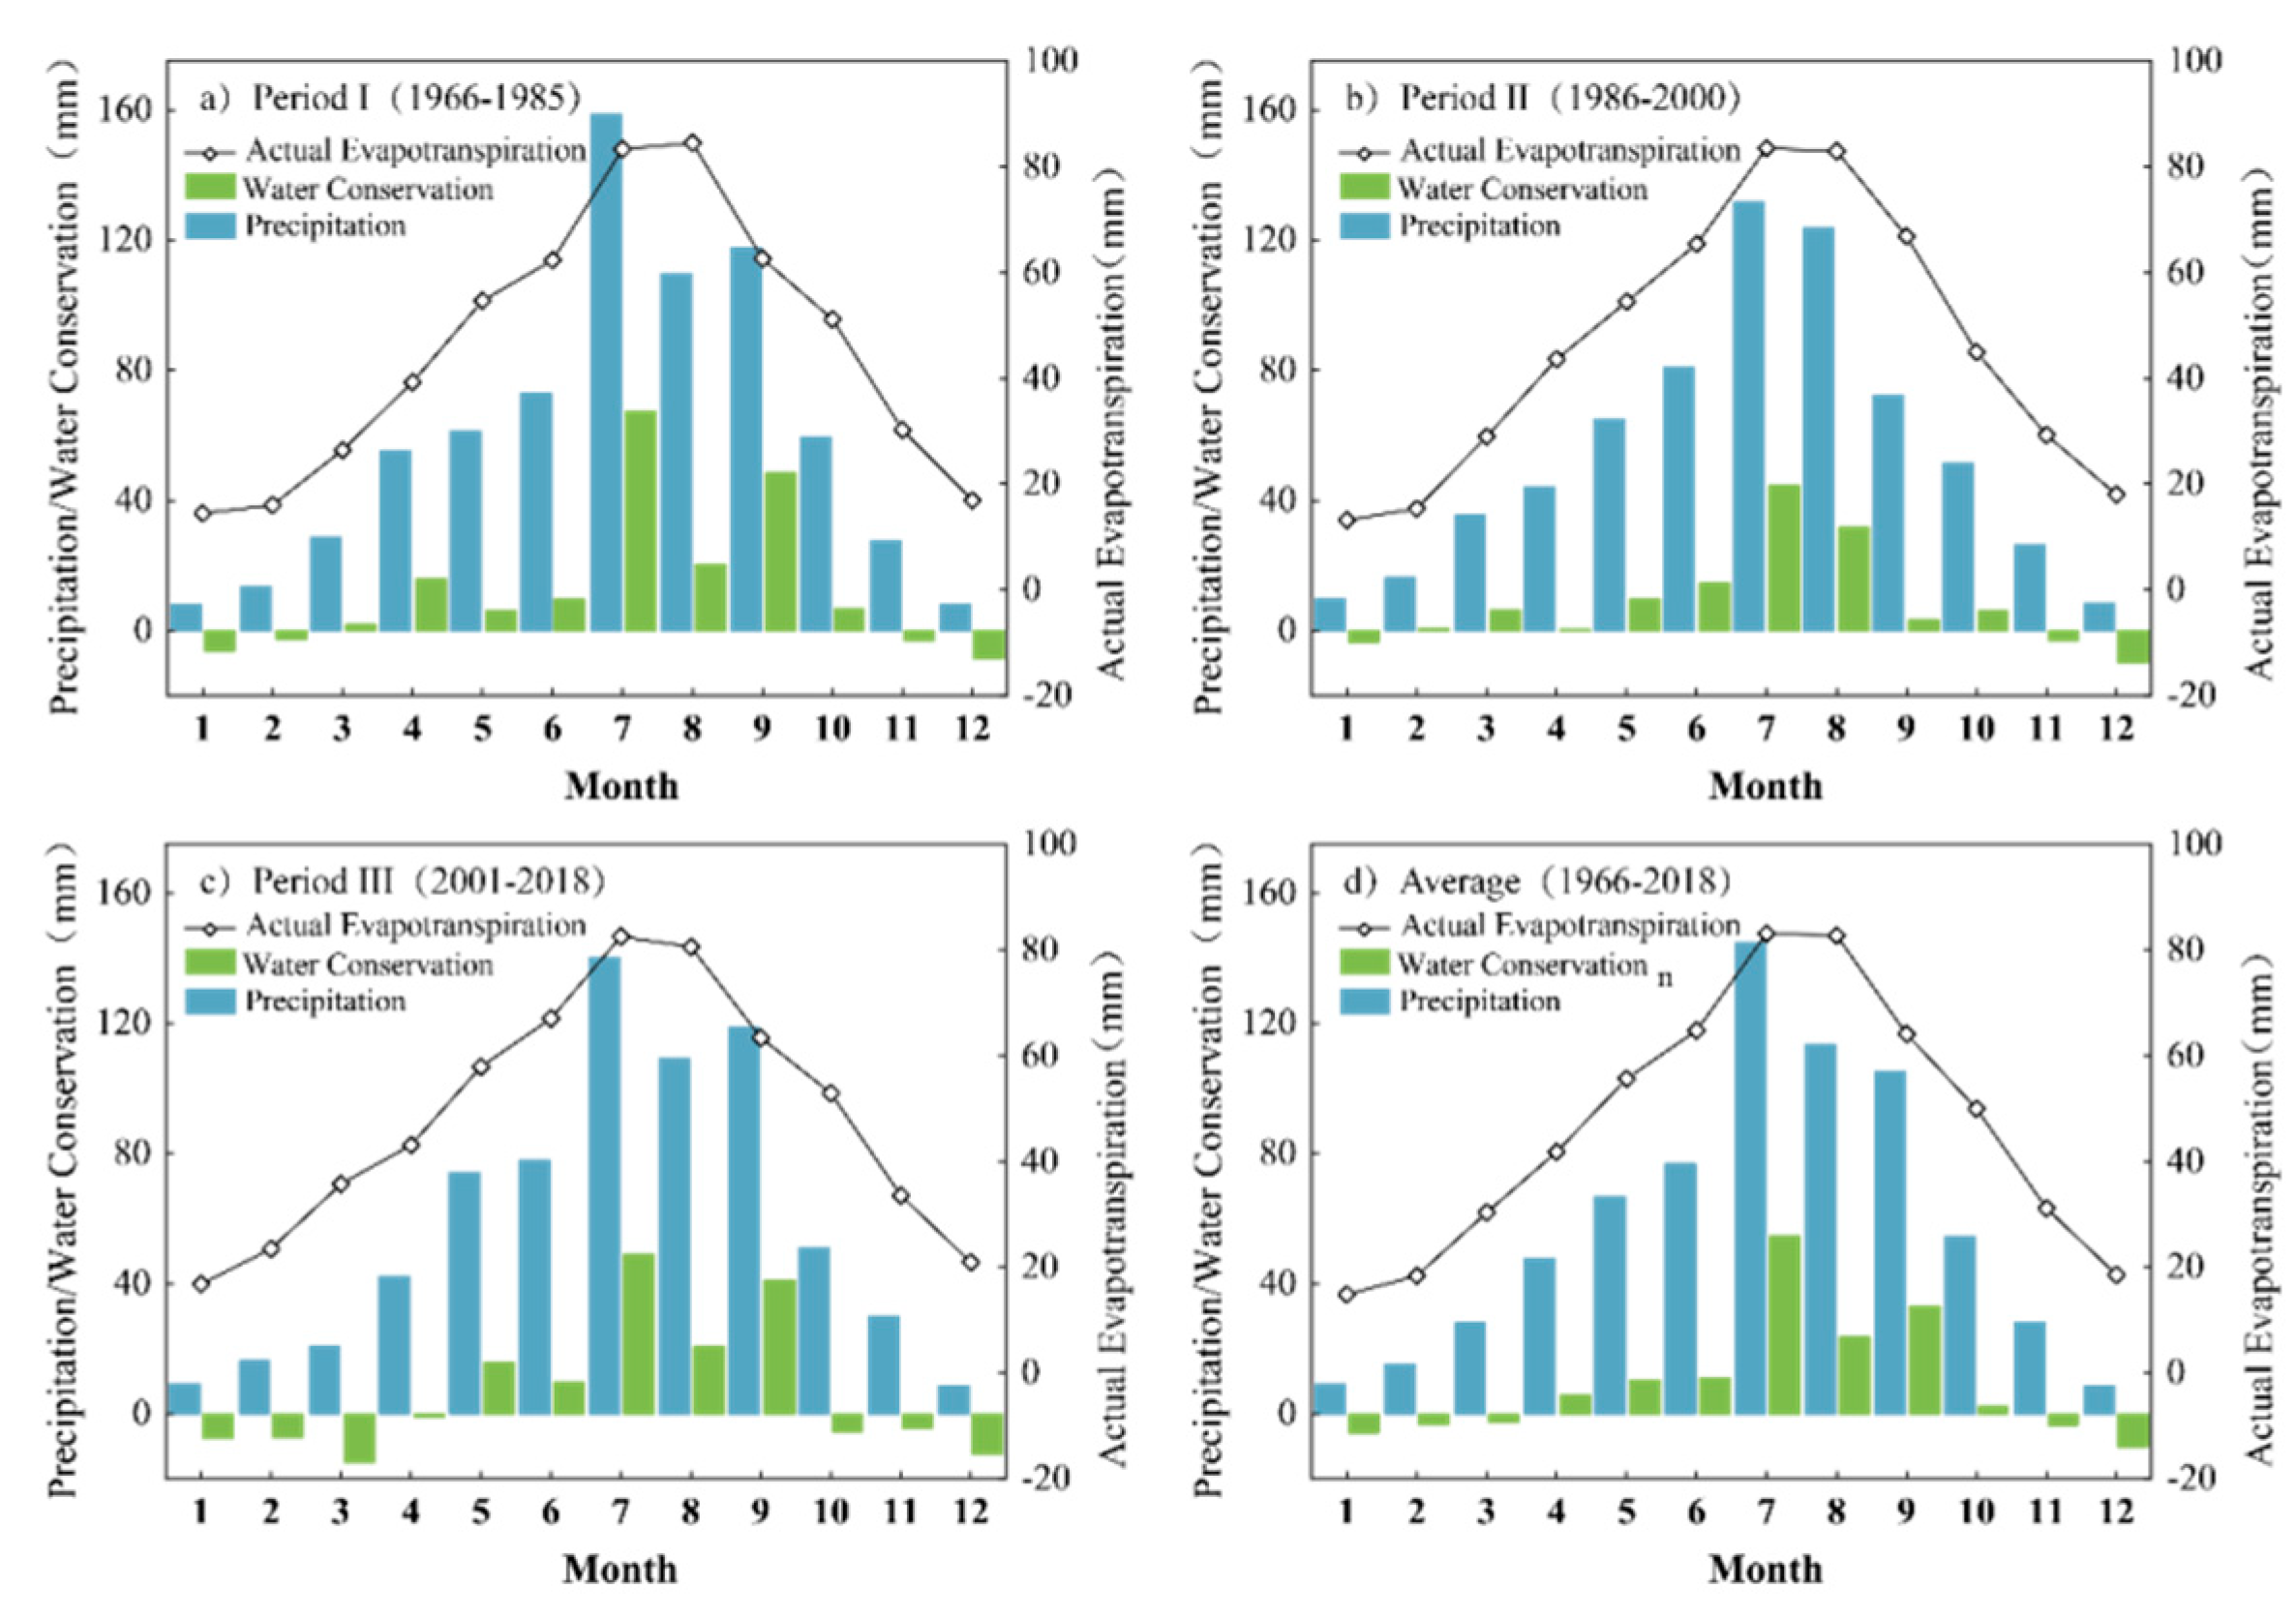
3.3.1. Temporal Distribution of Water Conservation

Figure 6 illustrates the inter-annual variability characteristics of water conservation and its basic meteorological factors. The annual average water conservation of the Yiluo River basin is approximately 116 mm, with 157 mm in Period I (1966–1985), 100 mm in Period II (1986–2000), and 83 mm in Period III (2001–2018). Evidently, water conservation significantly decreased, with negative values being observed during extreme drought years (1997, 2001, 2002, and 2013). This result is consistent with the trend calculated by Wang et al., using the WEP-L model in the Weihe River Basin [46]. Notably, in 1997 and 2012, it reached −23 mm and −18, respectively. Figure 4 provides the annual distribution of precipitation, evapotranspiration, and water conservation for two typical water-deficient years. It can be observed from the figure that the water conservation capacity of the basin is mainly controlled by the relationship between rainfall and evapotranspiration. Taking the year 1997 as an example, Shao et al. identified a severe drought in 1997 over northern China that resulted in a period of 222 days of zero flow in the Yellow River [47]. With relatively low precipitation throughout the year, the high evapotranspiration during the summer season resulted in a deficit in water conservation for the entire year. However, the situation was different in 2012, Yao identified a severe drought in 2011 [48]. The water stored during the summer precipitation of this year and last year was insufficient to offset the consumption during the dry season, leading to a deficit in water conservation. These instances highlight the necessity of paying attention to the monthly processes of basin water conservation. Also, the negative values indicate inter-annual replenishment of water conservation and regulation of runoff.
Figure 7 presents box plots of water conservation for different periods (flood season, nonflood season, and the entire year) across various periods. The results indicate that water conservation during the flood season is significantly higher than during the nonflood season. During the flood periods (FP I, FP II, and FP III), water conservation is relatively high, especially during FP I and FP III, where both the median and mean values exceed 100 mm, indicating substantial water conservation effects during the flood season. Additionally, FP I and FP II show abnormally high values influenced by local precipitation or topographical conditions, suggesting potentially high water conservation capacities in certain flood years. In contrast, water conservation during the nonflood periods (NP I, NP II, and NP III) shows significant depletion, particularly in NP I and NP II, where the median and mean values approach zero, indicating limited water conservation during the nonflood season. However, NP III shows an increase in water conservation capacity, although it remains below the levels observed during the flood season. The annual water conservation (AP I, AP II, and AP III) exhibit certain fluctuations across different time segments. Notably, AP I showed relatively high water conservation capacity, indicating effective water conservation. In comparison, AP II and AP III display lower water conservation, with some negative values, suggesting possible water depletion in certain regions during these periods. It is noteworthy that the third period (FP III, NP III, and AP III) shows a wider range of fluctuations, possibly reflecting greater variability in water conservation due to human activities, climate change, or land use transitions after 2010.
Figure 8 illustrates the intra-annual distributions of water conservation, precipitation and actual evapotranspiration of three distinct periods. The results shows that water conservation deficit typically occur in January (with an average deficit of 6.0 mm), February (with an average deficit of 3.3 mm), November (with an average deficit of 2.6 mm), and December (with an average deficit of 10.3 mm), which are in the nonflood season. By contrast, water conservation accumulation primarily takes place in July (with an average accumulation of 54.6 mm), August (with an average accumulation of 23.5 mm), and September (with an average accumulation of 33.2 mm), which are in the flood season. The intra-annual distribution of the multiyear average water conservation exhibited remarkable seasonal characteristics, with an accumulation trend in the summer, a deficit trend in the winter, and a relatively consistent trend in the spring and fall. Considering the multiyear average, the Yiluo River Basin generally retains more precipitation than it consumes. This surplus water can be used to regulate runoff, support vegetation growth, and provide supplemental water for human consumption.

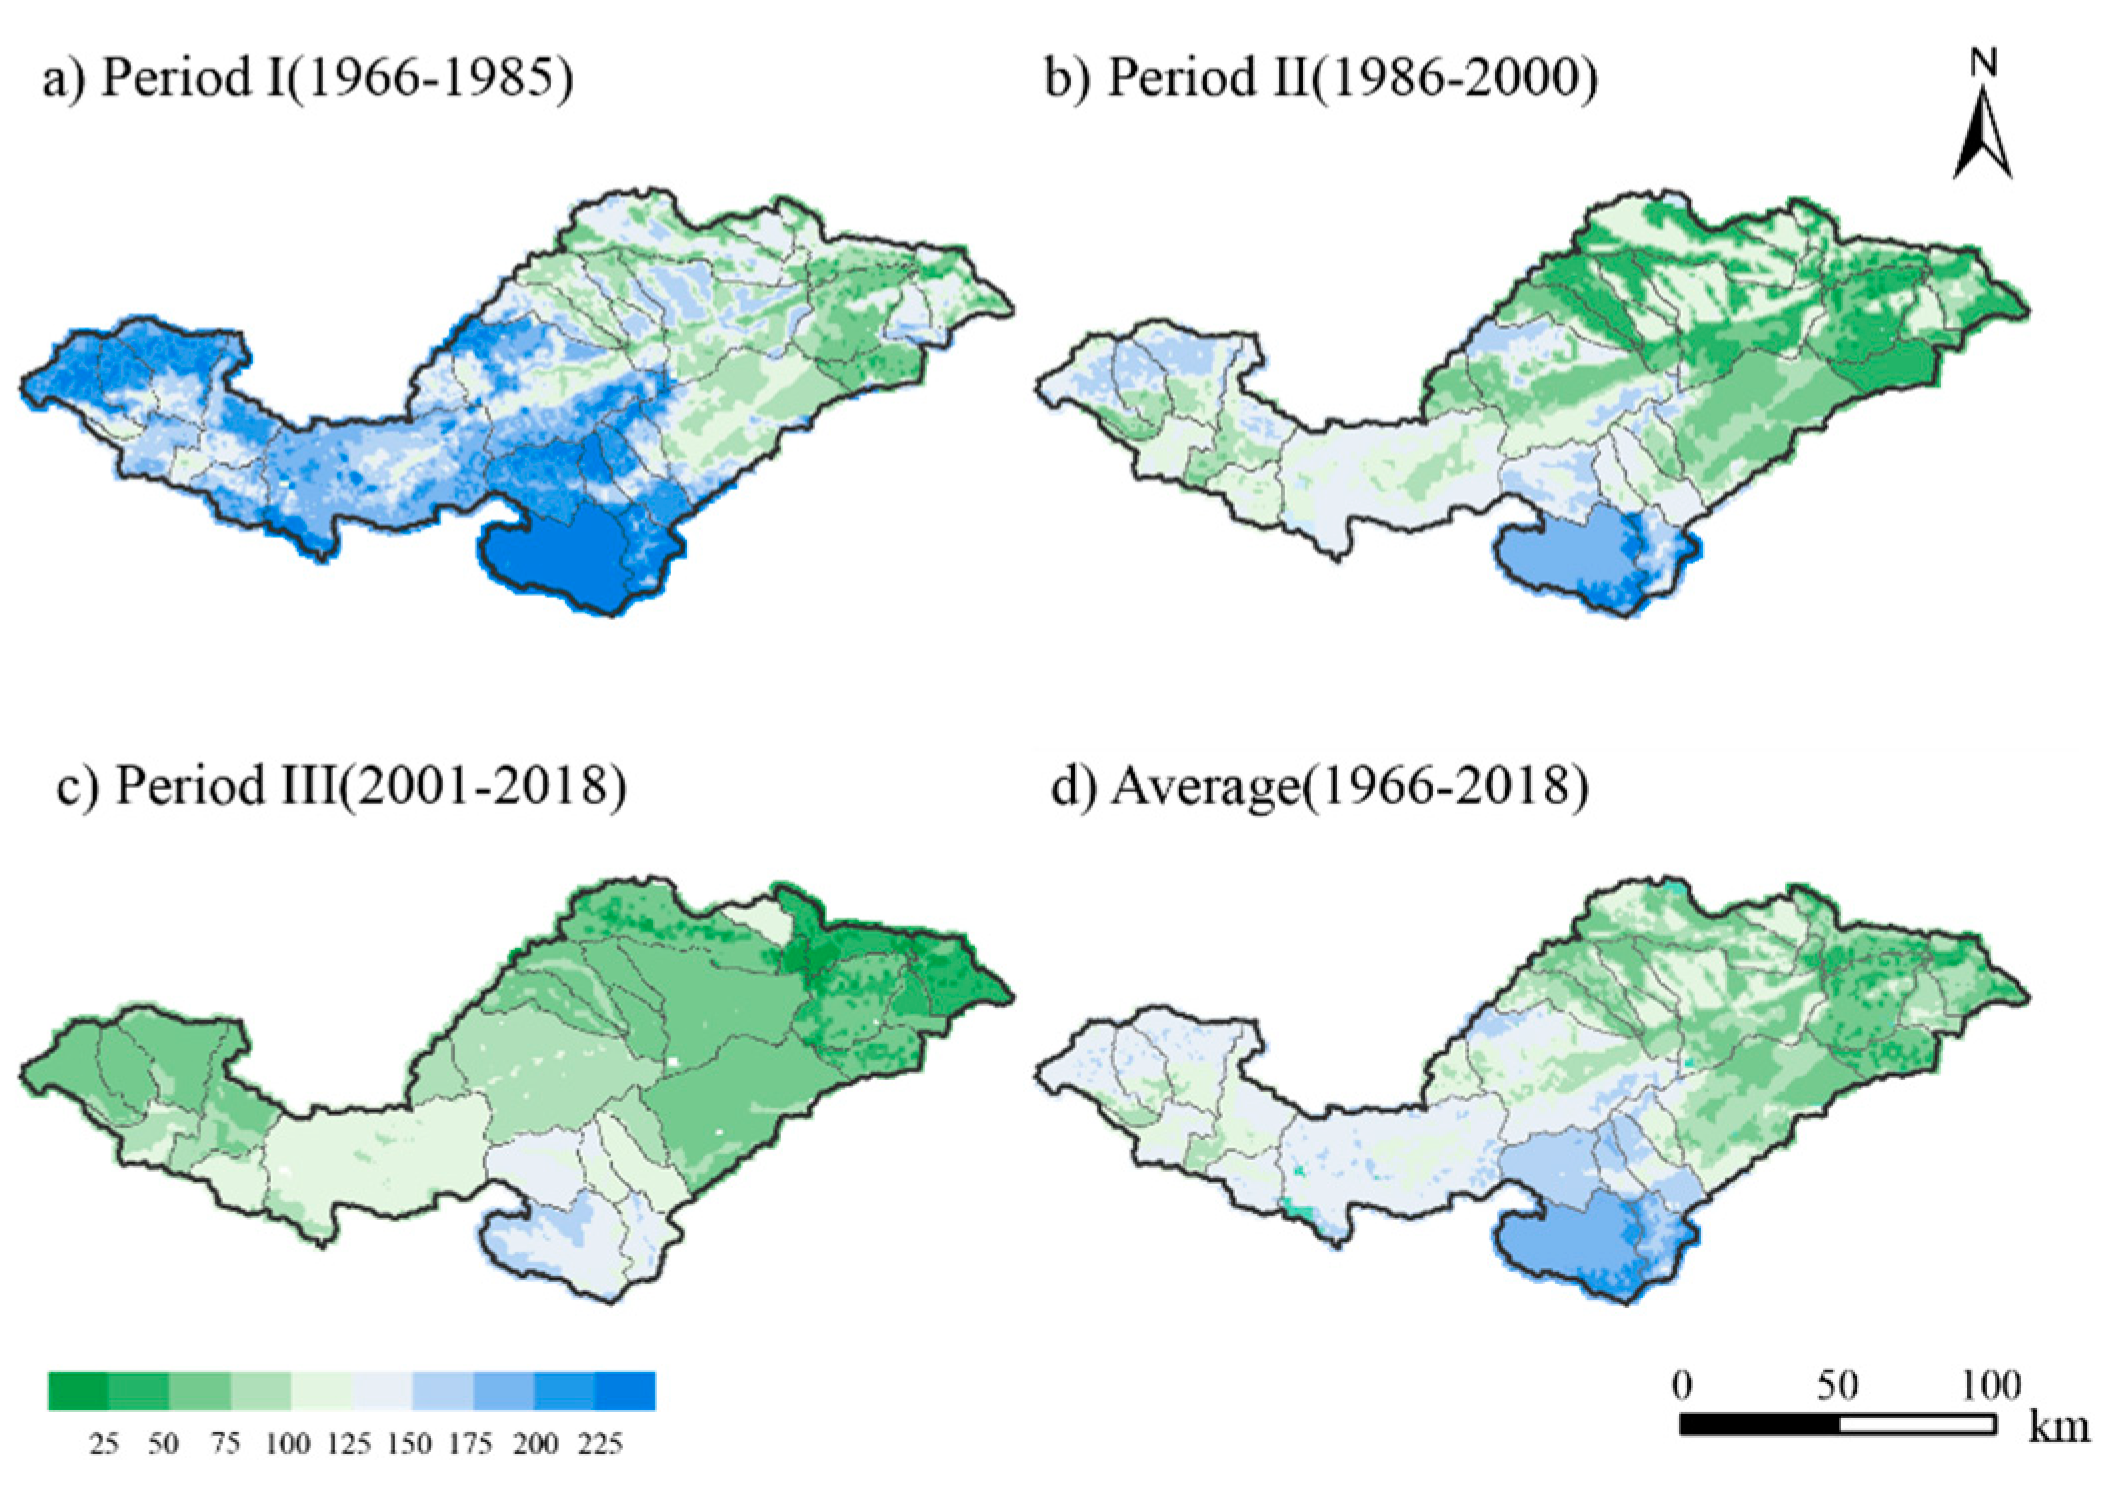
3.3.2. Spatial Distribution of Water Conservation

Figure 9 illustrates the spatial characteristics of the water conservation in Yiluo River Basin, which exhibited a downward trend from upstream to downstream and from west to east of the watershed. Most of the areas with high values are situated in the upper reaches, particularly in soil and rocky mountainous areas. In comparison, areas with low values are situated in the lower region, mainly in the low hills with extensive cropland and bare land. This result is consistent with the spatial distribution patterns of the water conservation areas identified by Sui et al., confirming the feasibility of using the SWAT model to assess the spatial distribution of water conservation [49]. This spatial distribution pattern may be influenced by the characteristics of the basin’s underlying surface and the spatial distribution of meteorological factors, which are elaborated upon in Section 4.1.
To further explore the spatiotemporal changes in water conservation across different periods, we analyzed the variations in average conservation depth and conservation volume of each naturally delineated sub-basin. Figure 10 presents the spatial distribution of the changes in depth and volume of water conservation at sub-basin scale. From 1966 to 2018, the depth of water conservation declined considerably, with a substantial decrease in the upper and middle reaches and a slightly slower decline in the relatively lower reaches. Among these 31 sub-basins, sub-basin #31 experienced the most substantial decline in mean water conservation depth, reducing by 132 mm, while sub-basin #26 experienced the most notable reduction in water conservation depth, decreasing by 178 million m3. By comparing the changes in meteorological conditions and underlying surfaces across different periods, we found that the upstream areas of the basin, characterized by higher altitudes and greater climatic variability, exhibited relatively significant variations in water conservation.

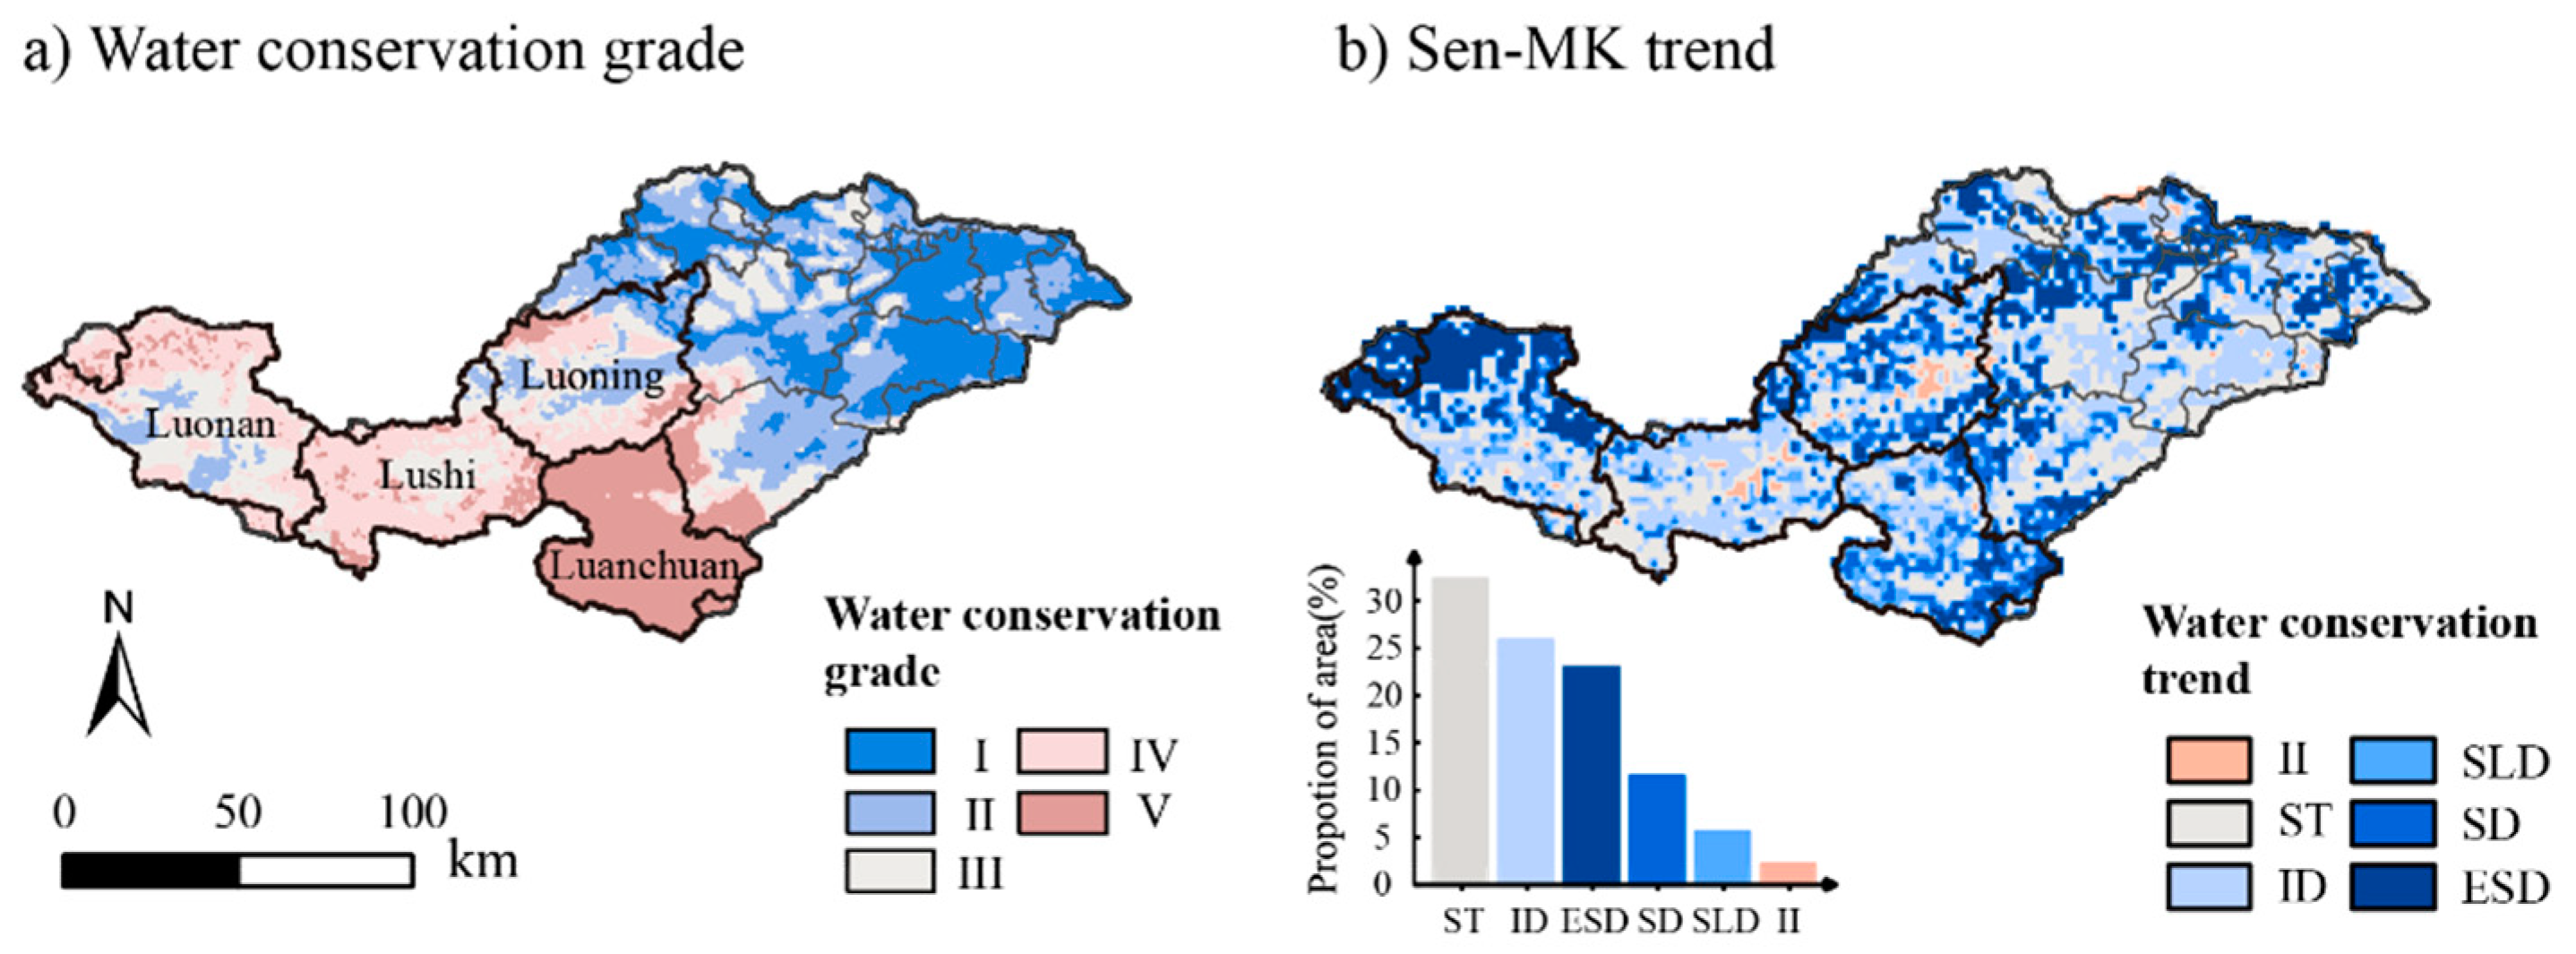
3.4. Spatial Division of Water Conservation Importance

Figure 11 shows the long-term evolution trend of water conservation and spatial distribution of the importance classification. The results reveal that the key areas for water conservation are primarily concentrated within the upper and middle reaches of the basin, particularly in forested regions such as Luonan County, Luanchuan County, and Luoning County. A clear downward trend in water conservation was observed in these areas, highlighting the need to enhance water conservation efforts in these priority districts. Meanwhile, the highly important and fundamentally stable areas are situated in the upper and middle basin of Lushi County. Efforts should be focused on emphasizing the stabilization and maintenance of water conservation function in these areas.

3.5. Key Factors That Affect Water Conservation

From the above analysis, it is evident that water conservation can be significantly influenced by various meteorological and subsurface elements [50]. We explored the temporal and spatial distribution characteristics of different influencing factors on water conservation in the Yiluo River Basin.

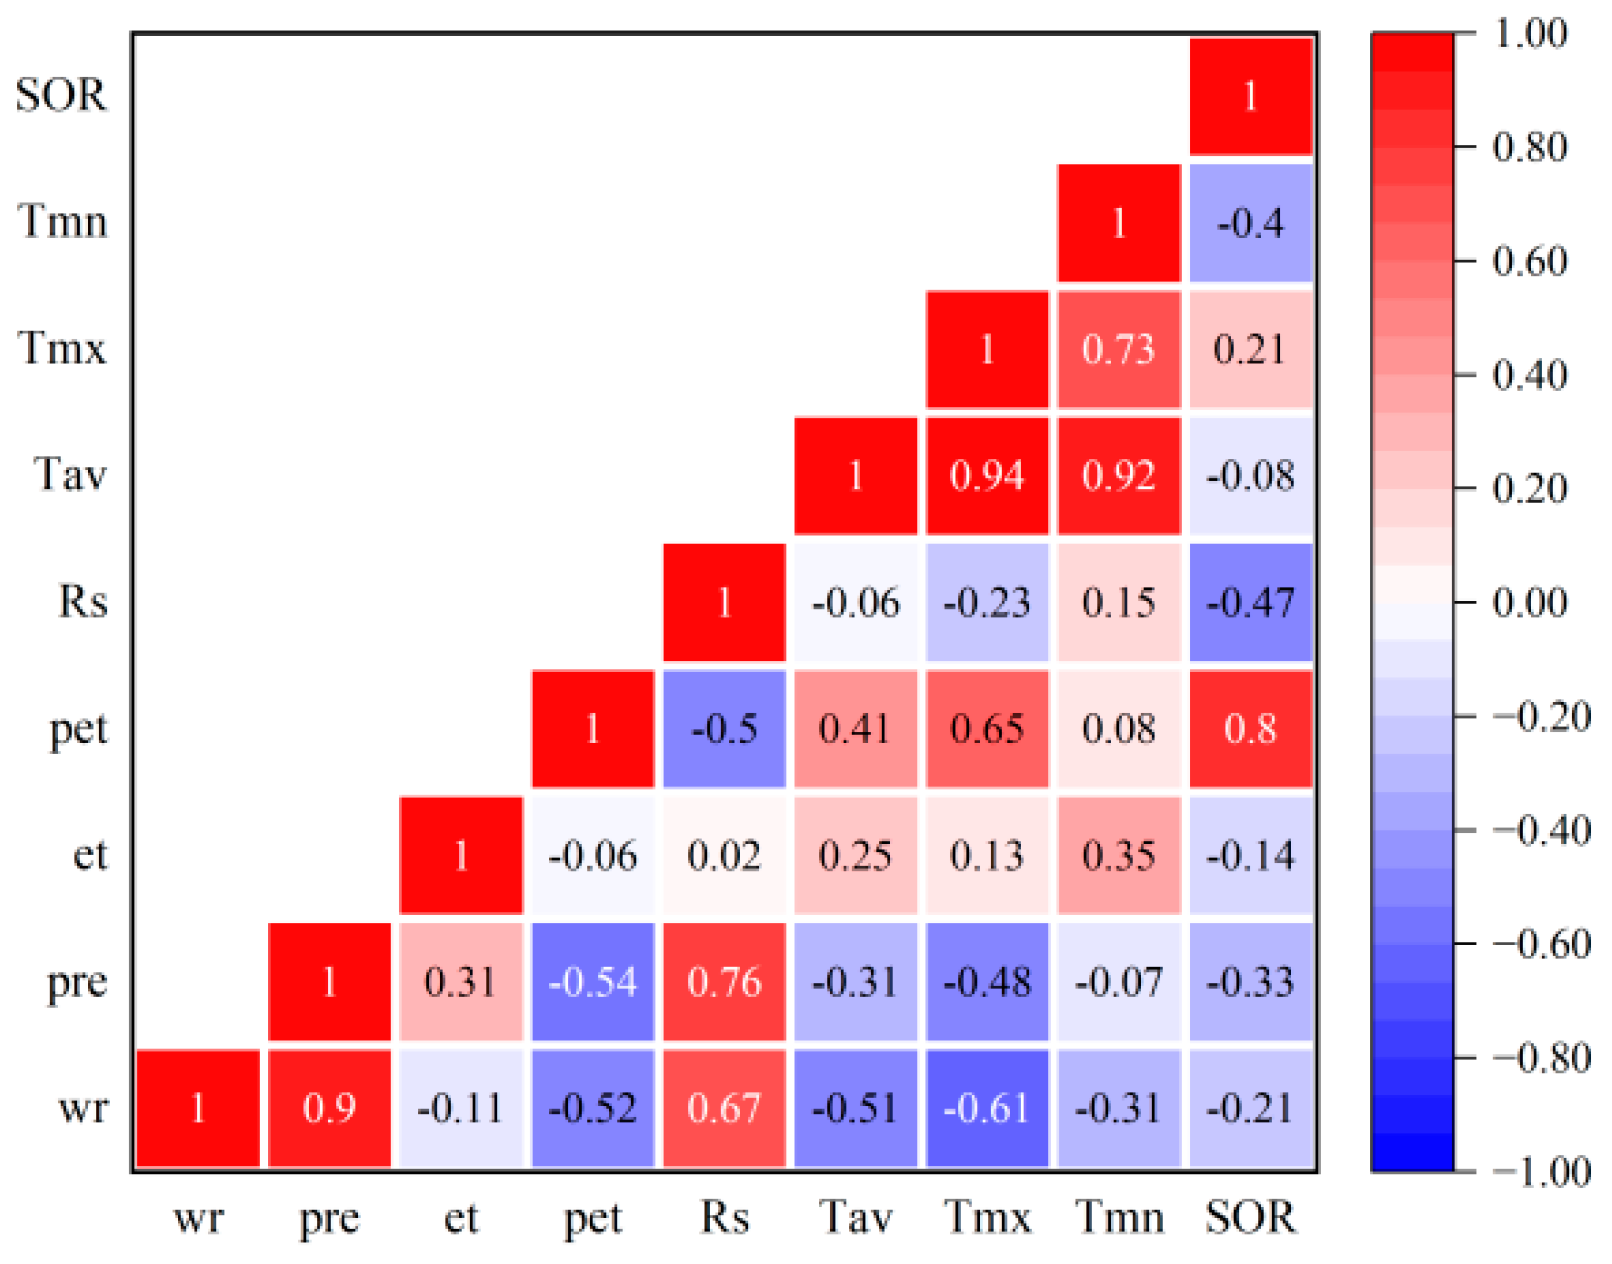
3.5.1. Temporal Correlation Analysis

In this study, we performed a correlation analysis between water conservation and the following factors: precipitation (PRE), potential evapotranspiration (PET), actual evapotranspiration (AET), average daily maximum temperature (Tmx), minimum temperature (Tmn), average temperature (Tav), and solar radiation (SOR). Figure 12 presents the results of the correlation analysis. It is evident from the analysis that precipitation and surface runoff show a strong positive correlation with water conservation, indicating that higher precipitation and runoff are associated with increased water conservation. Conversely, average daily maximum temperature and potential evapotranspiration exhibited a strong negative correlation with water conservation, suggesting that higher temperatures and evapotranspiration reduce water conservation capacity. These findings highlight the critical roles of precipitation in supporting water conservation and the detrimental impact of higher temperatures and evapotranspiration.
The maximum potential water conservation depth in a region can be represented by the regional precipitation minus actual evapotranspiration [51]. Therefore, precipitation and actual evapotranspiration are considered the most important meteorological factors influencing regional water conservation. Among these, AET is affected by elements such as potential evapotranspiration, temperature, and solar radiation. According to the correlation analysis in Figure 13, precipitation (PRE), potential evapotranspiration (PET), and daily maximum temperature (Tmx) were selected for further detailed investigation.
The spatial distribution characteristics of the correlation coefficients between water conservation and key factors are illustrated in Figure 10. The results indicate that precipitation, potential evapotranspiration, and maximum temperature exhibit significant variations across the watershed. Specifically, precipitation showed an insignificant declining trend from the upper to lower reaches, while potential evapotranspiration and maximum temperature displayed a noticeable increasing trend. Examining the spatial distribution map in Figure 11, it is evident that water conservation in sub-basins #28, #20, #12, and #4 did not significantly correlate with precipitation and maximum temperature. In contrast, these sub-basins demonstrated a strong negative correlation with potential evapotranspiration compared to their neighboring sub-basins. Therefore, sub-basins #28, #20, #8, and #4 can be identified as regions primarily influenced by potential evapotranspiration. Furthermore, water conservation in the southern sub-basins #22 and #23 showed significant positive correlations with precipitation and weak negative correlations with potential evapotranspiration. Meanwhile, in the upper sub-basins #29 and #30, water conservation exhibited a notable negative correlation with maximum temperature. In summary, there is a clear positive correlation between water conservation and precipitation across the entire watershed, which underscores that precipitation is the most influential meteorological factor within the Yiluo River Basin.

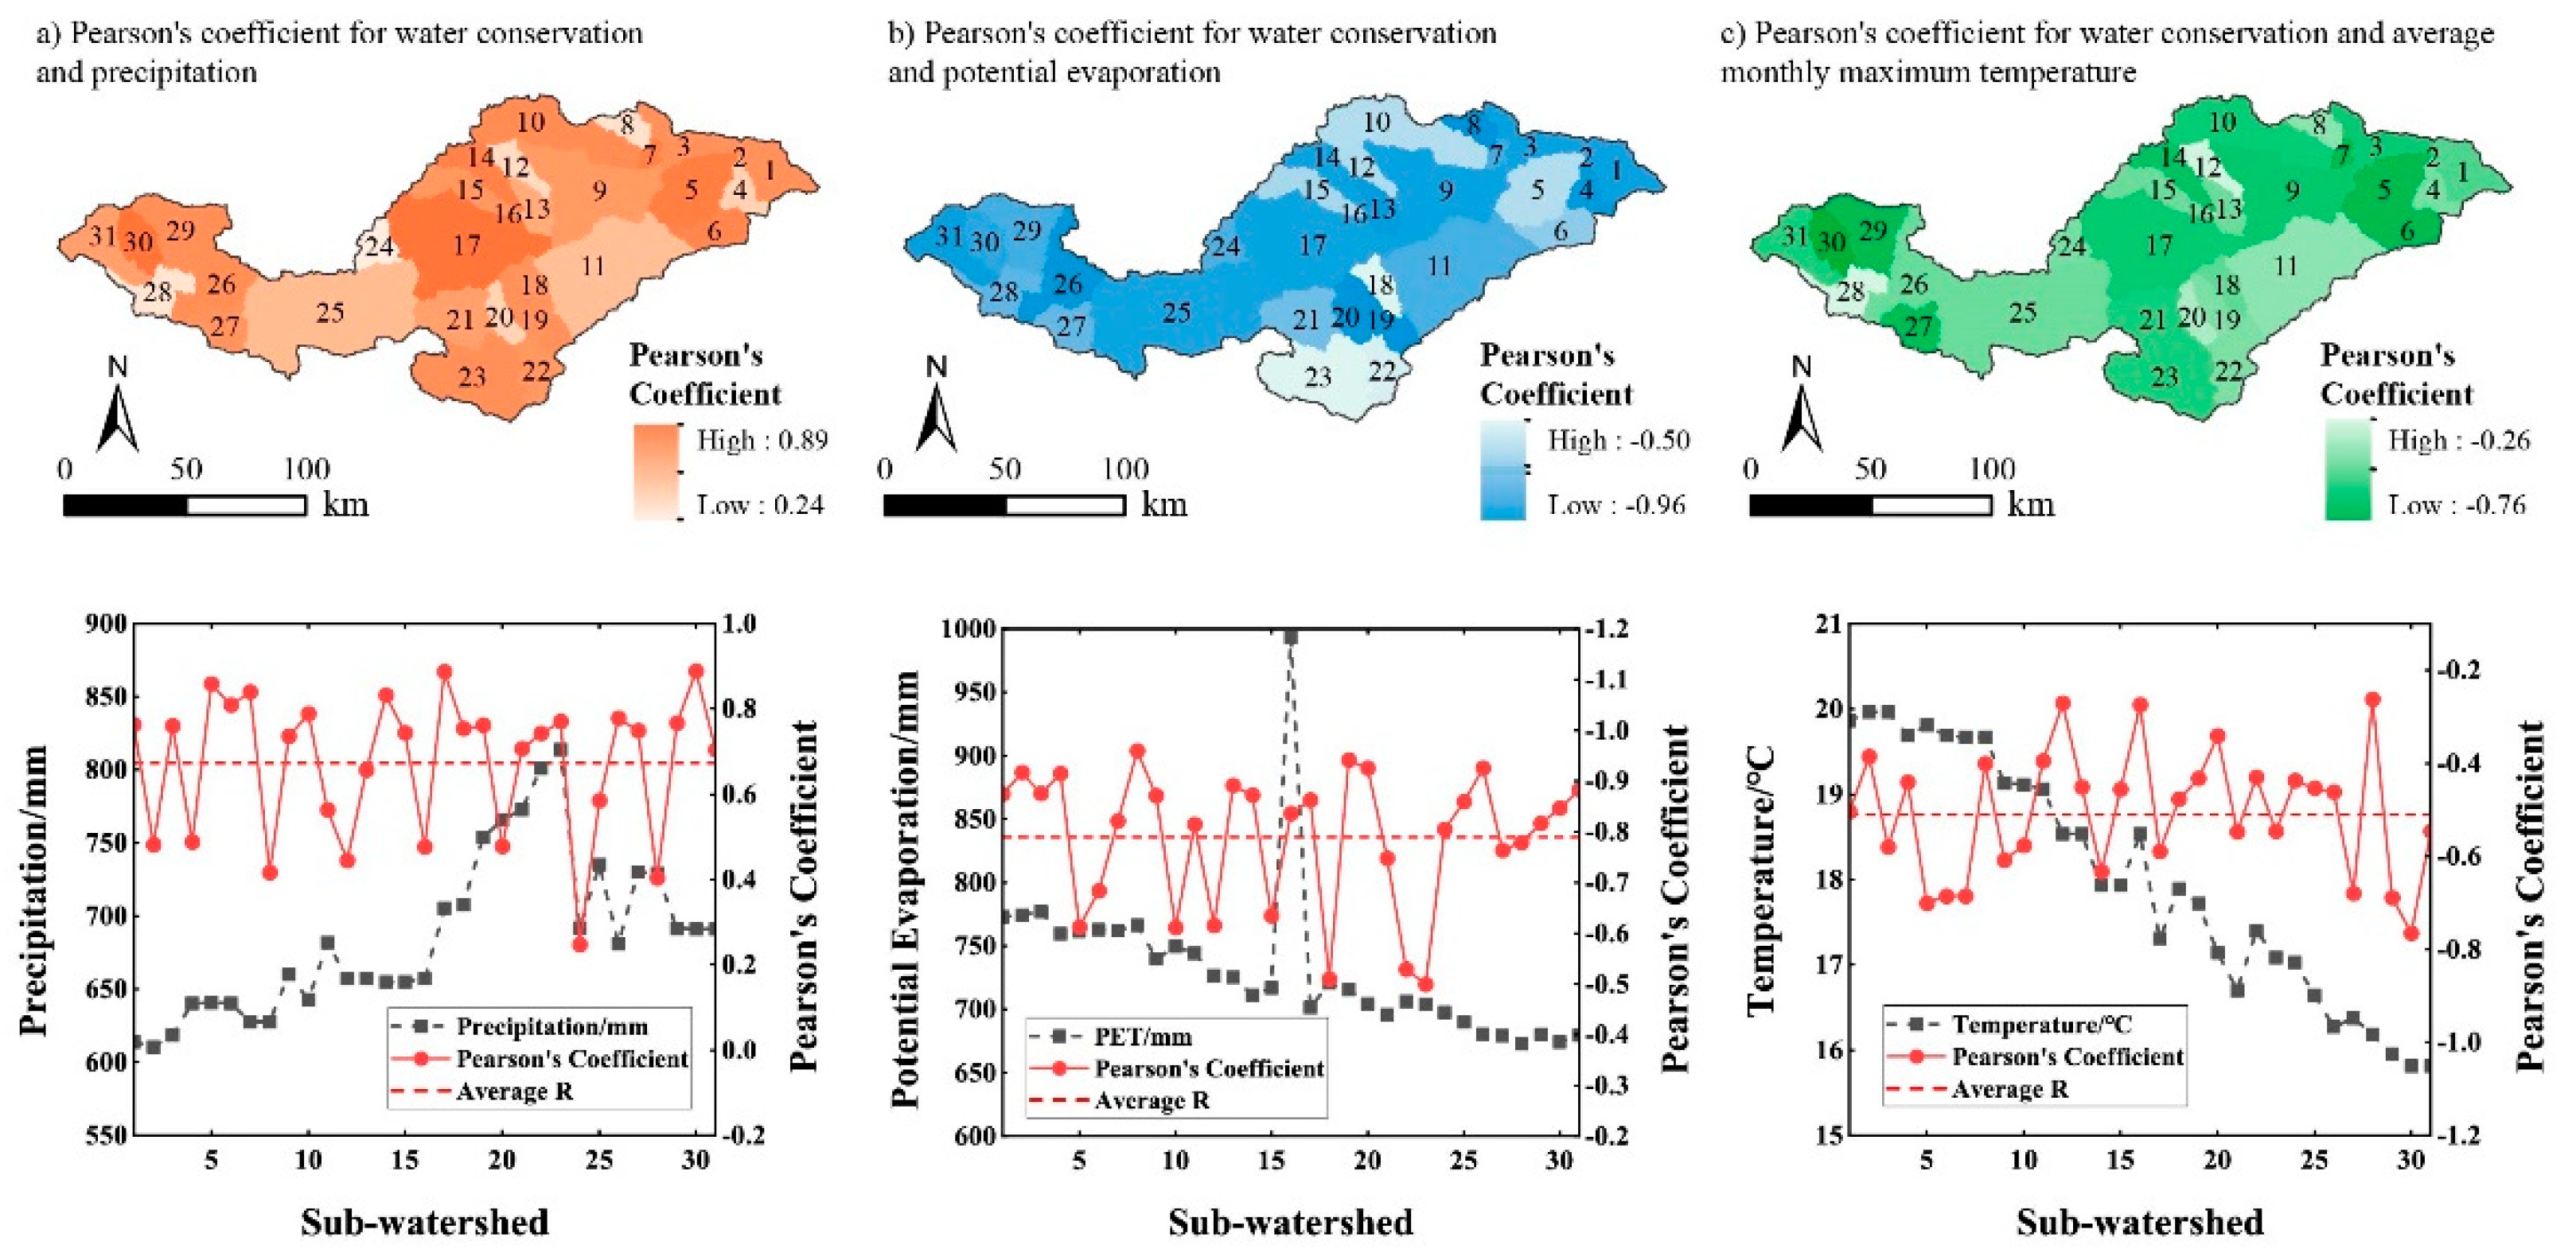
3.5.2. Spatial Correlation Analysis

Figure 14 illustrates the interaction of 13 selected factors. Among them, the factor with the greatest impact on spatial correlation is potential evapotranspiration, with the highest q-value occurring in the interaction column between potential evapotranspiration and vegetation. The radar chart of the factor detector (Figure 15) indicates that meteorological factors represented by potential evapotranspiration exhibit a more significant spatial correlation with water conservation compared to underlying surface characteristics. However, the spatial distributions of land use, DEM, and vegetation have a relatively noticeable impact among all these underlying surface factors. Among the 13 factors, we selected, population density showed the weakest correlation. In reality, areas with high population density are mainly concentrated on urban land, which occupies only a small proportion of the basin and has relatively weak water conservation capacity. This may partially obscure the influence of population density on the spatial distribution of water conservation.

4. Discussion

4.1. Environmental Protection Strategies

Based on the analysis of water conservation importance classification and Sen–MK trends, the study tried to propose some corresponding environmental protection strategies to enhance water conservation capacity in the Yellow River Basin and promote sustainable development of the regional ecological environment. For the extremely important areas (V: 148–229 mm), such as Luonan County, Luanchuan County, and Luoning County, it is essential to strictly protect existing forests and vegetation to prevent illegal logging and overdevelopment. Additionally, in key counties facing significant risks of water conservation reduction, measures such as strengthening vegetation restoration and increasing soil and water conservation projects should be implemented to mitigate the trend of ecological function degradation. In the very important areas (IV: 128–148 mm), such as urban areas of Luoyang in the midstream region, the risk of water conservation degradation is relatively low. Therefore, it is necessary to promote rational land use planning to maintain the current advantages of water conservation and prevent urban expansion from encroaching on water conservation areas. For the moderately important areas (III: 103–128 mm), such as upstream mountainous regions and some agricultural areas, it is crucial to systematically advance ecological restoration projects such as returning cropland to forests and grasslands, increase vegetation cover, construct terraces, and build soil and water conservation facilities to reduce soil erosion. In the slightly important areas (II: 73–103 mm), such as low hills and some croplands, drought-tolerant plants should be planted on slopes or wastelands as needed to increase vegetation cover and corresponding agricultural improvement and vegetation restoration measures should be implemented.

4.2. Improvement in Research Ideas and Methods

In this study, the SWAT model was employed to assess water conservation in the Yiluo River Basin. The model provides a detailed elucidation of each component involved in water conservation assessment, avoiding reliance solely on empirical formulas for correction. It is clear physical significance in simulating hydrological processes allows for a more precise description of these processes. Several studies have demonstrated that the SWAT model offers a more detailed and accurate calculation for water yield assessment compared to other water conservation assessment models. Additionally, because of its clear physical significance, the SWAT model addresses the issue of overly coarse temporal scales in watershed water conservation assessments. The model can identify the regulation of water conservation between inter-annual, flood, and nonflood seasons, emphasizing the monthly-scale regulatory function of water conservation [52,53]. Moreover, since the SWAT model considers various influencing factors such as meteorological conditions and underlying surface characteristics, the study enables an analysis of the impacts of different factors on the spatiotemporal distribution of water conservation. By combining SWAT outputs at the HRU (Hydrologic Response Unit) scale with the spatial distribution of HRUs, the study achieved the visualization of the spatial distribution of water conservation. This comprehensive approach provides a robust tool for understanding and managing regional water resources.
Based on the concept and connotation of water conservation, water area increasing often signifies an increase in conservation capacity. However, the model used to calculate water conservation in water areas may show more extreme negative values due to the higher evaporation. Given this consideration, mitigating the negative impact of water surface evaporation can lead to a more realistic assessment. Therefore, when utilizing the SWAT model to assess water conservation, it is essential to distinguish between water bodies and other land use types. In this study, the negative impact of water surface evaporation was excluded from the calculations. Nonetheless, as the proportion of water surface area is relatively small compared to the total watershed area, this exclusion did not significantly influence the overall results.

4.3. Implications and Limitations

Being the focus of attention for ecological services, the Yellow River water conservation zone has been wildly conducted by the academic interested in regional ecological conservation and high-quality development [54,55]. Previous researches have primarily used the InVEST model to assess annual water conservation of the Yiluo River Basin. However, such assessment lacks a clear physical mechanism and does not adequately capture the complementary and regulatory functions of water conservation across different seasons with varying hydrological conditions [56]. In this research, we introduced a new understanding of the definition of water conservation and then assessed its depth from 1966 to 2018, focusing on the response to environmental change at a monthly scale. The SWAT model was employed to assess water conservation in the Yiluo River Basin, providing a detailed elucidation of each component involved in water conservation assessment. Because of its clear physical significance, the model addresses the issue of overly coarse temporal scales in watershed water conservation assessments. Additionally, by refining the HRUs and combining model outputs with the spatial distribution of HRUs, the spatial distribution of water conservation was demonstrated. Based on this, the influence of various factors on the spatiotemporal distribution characteristics of water conservation was analyzed from both temporal and spatial scales. This analysis is important for assessing and enhancing the water conservation function, particularly it fills a research gap in the monthly water conservation analyses.
In response to alterations in climatic and subsurface conditions, the water conservation of the study area has declined significantly. Our investigation highlights precipitation as the most predominant factor influencing water conservation. Additionally, the analysis using the Geodetector reveals that potential evapotranspiration among meteorological factors and land use among underlying surface characteristics exhibit the most significant spatial correlation with water conservation. From a long-term developmental perspective, noteworthy reductions in water conservation are evident at a number of key areas of the study basin. Thus, given its significance as a primary water source for the Yellow River Basin, the protection and enhancement of water conservation in these key areas is imperative for ecological preservation and effective water resource management.
The study still has some limitations due to data incompleteness and the specific research scope of this study. Firstly, the SWAT model construction was limited by lacking daily-scale flow data, which prevented a detailed assessment of water conservation on a daily scale. Secondly, the SWAT model operates with a set of fixed input parameters, including land use, soil type, and meteorological data. These parameters remained constant throughout the simulation period, failing to reflect dynamic changes in future scenarios, human activities, or meteorological conditions and cannot accurately capture the impact of vegetation dynamics on water conservation, which are critical factors. Although segmented simulations can partially address the lack of parameter dynamics, this approach cannot fully overcome the limitations encountered in long-term simulations. The static nature of the SWAT model’s structure prevents it from updating input data and parameters in real time, rendering it incapable of adapting to rapidly changing environmental conditions or the impacts of human activities. To address this challenge, future research should consider incorporating mechanisms for real-time data updates and dynamic parameter adjustments to enhance the model’s responsiveness to environmental changes and improve prediction accuracy.

5. Conclusions

The Yiluo River basin is an important watershed with strategic significance for environmental protection and water resource management in China. Nevertheless, there are limited studies on water conservation evaluation in this watershed. In this research, we employed the SWAT model to rigorously assess the water conservation dynamics of the Yiluo River Basin with high spatial and temporal details across three distinct periods from 1966 to 2018. The main conclusions are set out below, as follows:
(1)
The average water conservation depths calculated by the SWAT model are 157 mm from 1966 to 1985, 100 mm from 1986 to 2000, and 83 mm from 2001 to 2018. The multiyear average depth of water conservation is approximately 116 mm. Water conservation declined significantly over the past several decades due to changes in climatic conditions and subsurface characteristics.
(2)
The study proposes environmental protection strategies based on water conservation importance and Sen–MK trends. The water conservation depth of extremely important areas, such as Luonan County, Luanchuan County, and Luoning County, decreased significantly over the past decades. Key strategies include protecting forests and vegetation in these highly important areas, implementing vegetation restoration and soil conservation projects in areas at risk, and promoting rational land use planning to maintain water conservation in urban areas.
(3)
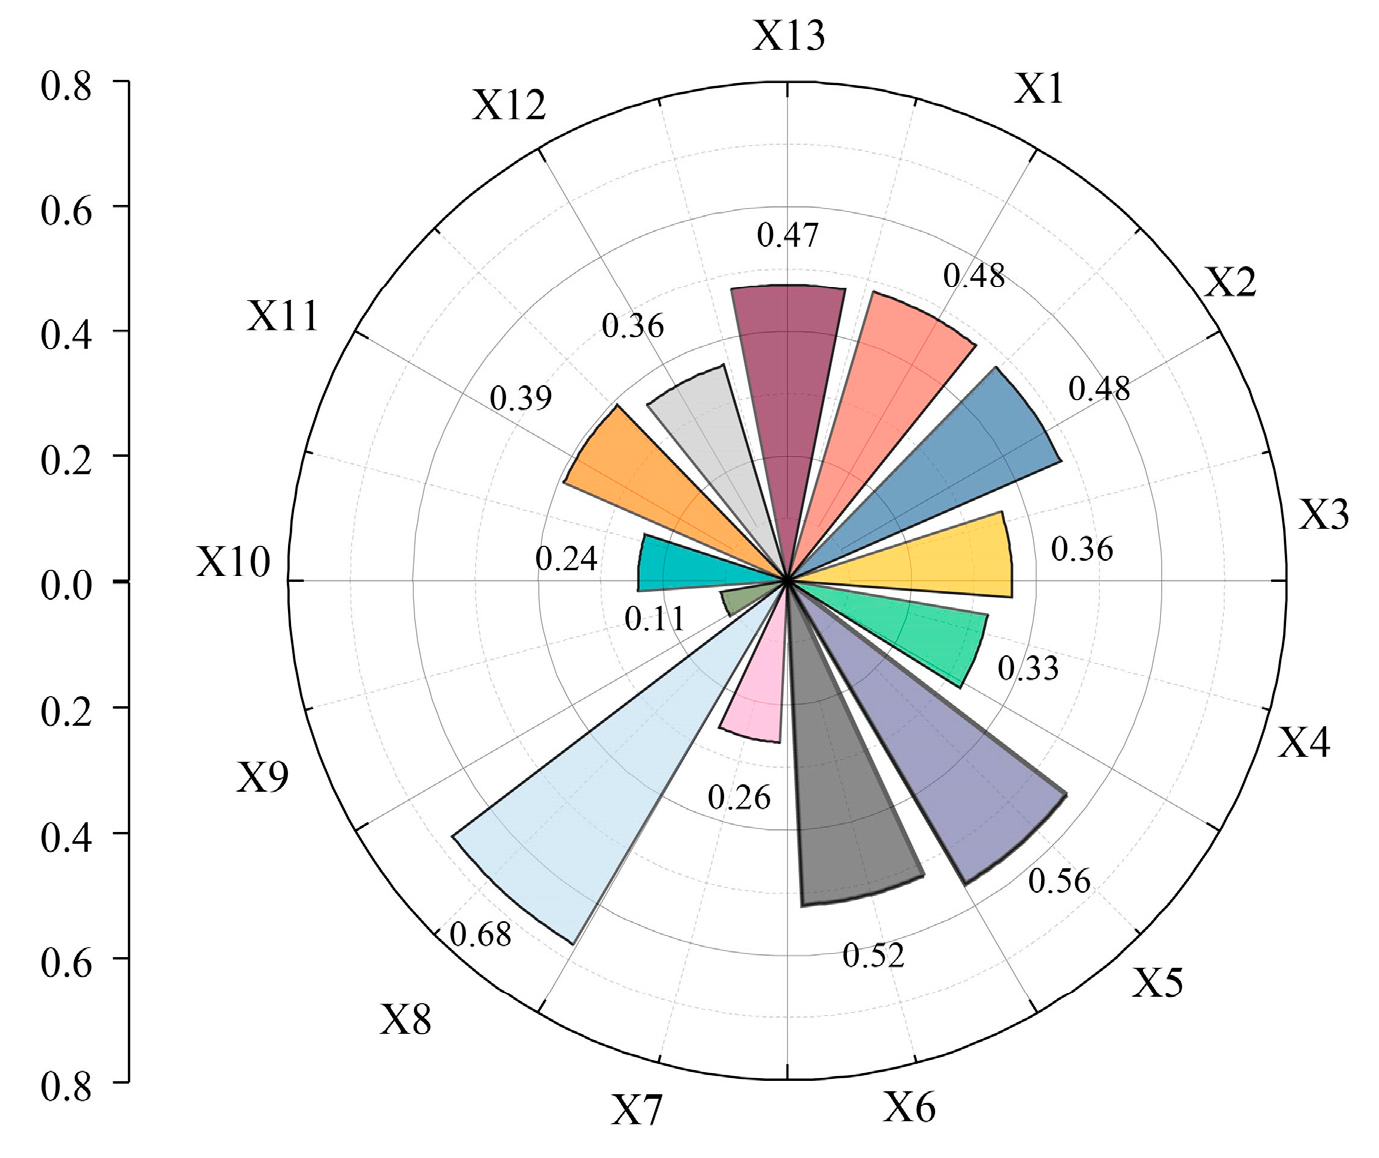
The comprehensive analysis initially identified precipitation, maximum temperature, and potential evapotranspiration as the primary factors influencing water conservation, based on temporal correlation analysis. Subsequent spatial correlation analysis, employing Geodetector, highlighted potential evapotranspiration, elevation, and vegetation as exhibiting the strongest spatial correlations with water conservation.

Author Contributions

Conceptualization, G.W.; Methodology, J.J. and E.D.; Formal analysis, Y.J., Y.W. and X.G.; Investigation, Y.W.; Writing—original draft, Y.J.; Writing—review & editing, E.D.; Supervision, G.W.; Funding acquisition, G.W. All authors have read and agreed to the published version of the manuscript.

Funding

The work was financially supported by the National Key Research and Development Programs of China (Grant Nos. 2021YFC3201100), National Natural Science Foundation of China (Grant Nos. U2243228, 52121006), and Belt and Road Science and Technology Fund on Water and Sustainability of the National Key Laboratory of Water Disaster Prevention (Grant Nos. 2022nkzd01, 2023nkzd02).

Data Availability Statement

Data are contained within the article.

Acknowledgments

We sincerely thank the associate editor and the reviewers for their valuable feedback, which significantly enhanced the quality of this paper.

Conflicts of Interest

The authors declare no conflict of interest.

References

  1. Tian, Q.; Yang, S.L. Regional climatic response to global warming: Trends in temperature and precipitation in the Yellow, Yangtze and Pearl River basins since the 1950s. Quat. Int. 2017, 440, 1–11. [Google Scholar] [CrossRef]
  2. Wang, G.Q. Definition of the Yellow River Basin Water Conservation Zone. J. China Hydrol. 2022, 42, 65, (In Chinese with an English Abstract). [Google Scholar]
  3. Zuo, Q.T. Research framework for ecological protection and high-quality development in the Yellow River Basin. Yellow River 2019, 41, 1–6+16, (In Chinese with an English Abstract). [Google Scholar]
  4. Hu, W.M.; Li, G.; Gao, Z.H.; Jia, G.Y.; Wang, Z.C.; Li, Y. Assessment of the impact of the Poplar Ecological Retreat Project on water conservation in the Dongting Lake wetland region using the InVEST model. Sci. Total Environ. 2020, 733, 139423. [Google Scholar] [CrossRef] [PubMed]
  5. Zhou, J.W.; Gao, J.X.; Gao, Z.Q.; Yang, W.C. Analyzing the water conservation service function of the forest ecosystem. Acta Ecol. Sin. 2018, 38, 1679–1686, (In Chinese with an English Abstract). [Google Scholar]
  6. Nie, Y.H. A study of the water conservation of Qilian Mountains based on surface energy balance and SCS model. Earth Sci. Front. 2010, 17, 269–275, (In Chinese with an English Abstract). [Google Scholar]
  7. Zhang, Y.W.; Zhang, B.; Ma, B.; Yao, R.P.; Wang, L.B. Evaluation of the water conservation capacity of the Weihe River Basin based on the Integrated Valuation of Ecosystem Services and Tradeoffs model. Ecohydrology 2022, 15, e2465. [Google Scholar] [CrossRef]
  8. Lin, F.; Chen, X.W.; Yao, W.Y.; Fang, Y.H.; Deng, H.J.; Wu, J.F.; Lin, B.Q. Multi-time scale analysis of water conservation in a discontinuous forest watershed based on SWAT model. Acta Geogr. Sin. 2020, 75, 1065–1078, (In Chinese with an English Abstract). [Google Scholar] [CrossRef]
  9. Arnold, J.G.; Srinivasan, R.; Muttiah, R.S.; Williams, J.R. Large area hydrologic modeling and assessment—Part 1: Model development. J. Am. Water Resour. Assoc. 1998, 34, 73–89. [Google Scholar] [CrossRef]
  10. Douglas-Mankin, K.R.; Srinivasan, R.; Arnold, J.G. Soil and Water Assessment Tool (SWAT) Model: Current Developments and Applications. Trans. ASABE 2010, 53, 1423–1431. [Google Scholar] [CrossRef]
  11. Liu, J.F.; Jiang, W.G.; Zhan, W.F.; Zhou, J. Processes of SCS Model for Hydrological Simulation: A Review. Res. Soil Water Conserv. 2010, 17, 120–124, (In Chinese with an English Abstract). [Google Scholar]
  12. Chen, S.L. Estimating Forest Ecosystem Service Function of Water Conservation Based on TVDI. Ecol. Econ. 2016, 32, 5, (In Chinese with an English Abstract). [Google Scholar]
  13. Li, M.; Liang, D.; Xia, J.; Song, J.; Cheng, D.; Wu, J.; Cao, Y.; Sun, H.; Li, Q. Evaluation of water conservation function of Danjiang River Basin in Qinling Mountains, China based on InVEST model. J. Environ. Manag. 2021, 286, 112212, (In Chinese with an English Abstract). [Google Scholar] [CrossRef] [PubMed]
  14. Tang, Y.H.; Sun, Y.; Han, Z.Y.; Soomro, S.-e.-h.; Wu, Q.; Tan, B.Y.; Hu, C.H. flood forecasting based on machine learning pattern recognition and dynamic migration of parameters. J. Hydrol. Reg. Stud. 2023, 47, 101406. [Google Scholar] [CrossRef]
  15. Hu, C.H.; Zhang, L.; Wu, Q.; Soomro, S.-e.-h.; Jian, S.Q. Response of LUCC on Runoff Generation Process in Middle Yellow River Basin: The Gushanchuan Basin. Water 2020, 12, 1237. [Google Scholar] [CrossRef]
  16. Soomro, S.-e.-h.; Hu, C.; Boota, M.W.; Ahmed, Z.; Chengshuai, L.; Zhenyue, H.; Xiang, L.; Soomro, M.H.A.A. River Flood Susceptibility and Basin Maturity Analyzed Using a Coupled Approach of Geo-morphometric Parameters and SWAT Model. Water Resour. Manag. 2022, 36, 2131–2160. [Google Scholar] [CrossRef]
  17. Chung, I.-M.; Lee, J.; Kim, N.W.; Na, H.; Chang, S.W.; Kim, Y.; Kim, G.-B. Estimating exploitable amount of groundwater abstraction using an integrated surface water-groundwater model: Mihocheon watershed, South Korea. Hydrol. Sci. J. 2014, 60, 863–872. [Google Scholar] [CrossRef]
  18. Goldstein, J.C.; Tarhule, A. Evaluating the impacts of climate change and switchgrass production on a semiarid basin. Hydrol. Process. 2014, 29, 724–738. [Google Scholar] [CrossRef]
  19. Zhai, J.; Hou, P.; Zhang, W.G.; Chen, Y.; Jin, D.D.; Gao, H.F.; Zhu, H.S.; Yang, M. Assessment of Water Conservation Services Based on the Method of Integrating Hydrological Observation Data According to Different Ecosystem Types and Regions. Water 2023, 15, 1475. [Google Scholar] [CrossRef]
  20. Hou, J.; Qin, T.L.; Liu, S.S.; Wang, J.W.; Dong, B.Q.; Yan, S.; Nie, H.J. Analysis and Prediction of Ecosystem Service Values Based on Land Use/Cover Change in the Yiluo River Basin. Sustainability 2021, 13, 6432. [Google Scholar] [CrossRef]
  21. Wang, S.; Zhang, B.; Wang, S.; Xie, G.D. Dynamic changes in water conservation in the Beijing–Tianjin Sandstorm Source Control Project Area: A case study of Xilin Gol League in China. J. Clean. Prod. 2021, 293, 126054. [Google Scholar] [CrossRef]
  22. Guo, Y.L.; Lu, X.L.; Ding, S.Y. The classification of plant functional types based on the dominant herbaceous species in the riparian zone ecosystems in the Yiluo River. Acta Ecol. Sin. 2012, 32, 4434–4442, (In Chinese with an English Abstract). [Google Scholar]
  23. Wang, T.; Zhou, D.W.; Shen, X.J.; Fan, G.H.; Zhang, H. Koppen’s climate classification map for China. J. Meteorol. Sci. 2020, 40, 752–760, (In Chinese with an English Abstract). [Google Scholar]
  24. Wu, J.; Gao, X.J.; Giorgi, F.; Chen, D.L. Changes of effective temperature and cold/hot days in late decades over China based on a high resolution gridded observation dataset. Int. J. Climatol. 2017, 37, 788–800. [Google Scholar] [CrossRef]
  25. Wu, J.; Gao, X. A gridded daily observation dataset over China region and comparison with the other dataset. Chin. J. Geophys 2013, 56, 1102–1111, (In Chinese with an English Abstract). [Google Scholar]
  26. Xu, Y.; Gao, X.J.; Shen, Y.; Xu, C.H.; Shi, Y.; Giorgi, F. A daily temperature dataset over China and its application in validating a RCM simulation. Adv. Atmos. Sci. 2009, 26, 763–772. [Google Scholar] [CrossRef]
  27. Hamed, K.H.; Rao, A.R. A modified Mann-Kendall trend test for autocorrelated data. J. Hydrol. 1998, 204, 182–196. [Google Scholar] [CrossRef]
  28. Khaliq, M.N.; Ouarda, T.; Gachon, P.; Sushama, L.; St-Hilaire, A. Identification of hydrological trends in the presence of serial and cross correlations: A review of selected methods and their application to annual flow regimes of Canadian rivers. J. Hydrol. 2009, 368, 117–130. [Google Scholar] [CrossRef]
  29. Arnold, J.G.; Moriasi, D.N.; Gassman, P.W.; Abbaspour, K.C.; White, M.J.; Srinivasan, R.; Santhi, C.; Harmel, D.; Griensven, A.V.; Van Liew, M.W.; et al. SWAT: Model Use, Calibration, and Validation. Trans. ASABE 2012, 55, 1491–1508. [Google Scholar] [CrossRef]
  30. Zhang, X.S.; Srinivasan, R.; Debele, B.; Hao, F.H. Runoff Simulation of the Headwaters of the Yellow River Using The SWAT Model with Three Snowmelt Algorithms1. JAWRA J. Am. Water Resour. Assoc. 2008, 44, 48–61. [Google Scholar] [CrossRef]
  31. Yang, J.; Reichert, P.; Abbaspour, K.C.; Xia, J.; Yang, H. Comparing uncertainty analysis techniques for a SWAT application to the Chaohe Basin in China. J. Hydrol. 2008, 358, 1–23. [Google Scholar] [CrossRef]
  32. Pearson, K. Mathematical Contributions to the Theory of Evolution. III. Regression, Heredity, and Panmixia. Philos. Trans. R. Soc. A 1986, 187, 253–318. [Google Scholar]
  33. Wang, J.F.; Xu, C.d. Geodetector: Principle and prospective. Acta Geogr. Sin. 2017, 72, 116–134, (In Chinese with an English Abstract). [Google Scholar] [CrossRef]
  34. Wang, J.F.; Li, X.H.; Christakos, G.; Liao, Y.L.; Zhang, T.; Gu, X.; Zheng, X.Y. Geographical Detectors-Based Health Risk Assessment and its Application in the Neural Tube Defects Study of the Heshun Region, China. Int. J. Geogr. Inf. Sci. 2010, 24, 107–127, (In Chinese with an English Abstract). [Google Scholar] [CrossRef]
  35. Bai, S.; Jing, L.; Li, H.; Feng, W. The Demaracation of ecological protection red line based on water conservation function. Ecol. Environ. Sci. 2017, 26, 1665–1670, (In Chinese with an English Abstract). [Google Scholar] [CrossRef]
  36. Cai, B.F.; Yu, R. Advance and evaluation in the long time series vegetation trends research based on remote sensing. Natl. Remote Sens. Bull. 2009, 13, 1170–1186, (In Chinese with an English Abstract). [Google Scholar]
  37. De Beurs, K.M.; Henebry, G.M. A statistical framework for the analysis of long image time series. Int. J. Remote Sens. 2005, 26, 1551–1573. [Google Scholar] [CrossRef]
  38. Mann, H.B. Nonparametric Tests Against Trend. Econometrica 1945, 13, 245. [Google Scholar] [CrossRef]
  39. Kendall, M.G. Rank Correlation Methods; Griffin: Oxford, England, 1948. [Google Scholar]
  40. Lambin, E.F.; Turner, B.L.; Geist, H.J.; Agbola, S.B.; Angelsen, A.; Bruce, J.W.; Coomes, O.T.; Dirzo, R.; Fischer, G.; Folke, C.; et al. The causes of land-use and land-cover change: Moving beyond the myths. Glob. Environ. Chang. Hum. Policy Dimens. 2001, 11, 261–269. [Google Scholar] [CrossRef]
  41. Turner, B.L.; Lambin, E.F.; Reenberg, A. Land Change Science Special Feature: The emergence of land change science for global environmental change and sustainability. Proc. Natl. Acad. Sci. USA 2007, 104, 20666–20671, Erratum in Proc. Natl. Acad. Sci. USA 2008, 105, 2751. [Google Scholar] [CrossRef]
  42. Zhang, P.; Shao, G.; Zhao, G.; Le Master, D.C.; Parker, G.R.; Dunning, J.B., Jr.; Li, Q. China’s forest policy for the 21st century. Science 2000, 288, 2135–2136. [Google Scholar] [CrossRef] [PubMed]
  43. Huang, B.B.; Hao, C.Y.; Li, R.N.; Zheng, H. Research Progress on the Quantitative Methods of Calculating Contribution Rates of Climate Change and Human Activities to Surface Runoff Changes. J. Nat. Resour. 2018, 33, 899–910, (In Chinese with an English Abstract). [Google Scholar]
  44. Wang, Z.Z.; Fu, B.J.; Wu, X.T.; Li, Y.J.; Wang, S.; Lu, N. Escaping social–ecological traps through ecological restoration and socioeconomic development in China’s Loess Plateau. People Nat. 2023, 5, 1364–1379. [Google Scholar] [CrossRef]
  45. Yin, S.H.; Gao, G.Y.; Ran, L.H.; Li, D.F.; Lu, X.X.; Fu, B.J. Extreme streamflow and sediment load changes in the Yellow River Basin: Impacts of climate change and human activities. J. Hydrol. 2023, 619, 129372. [Google Scholar] [CrossRef]
  46. Wang, D.D.; Jia, Y.W.; Niu, C.W.; Sui, Y.B.; Yang, X. Evaluation method for main functions of water retention based on WEP-L model: A case of water retention area in Wei River. Acta Ecol. Sin. 2024, 44, 4342–4352, (In Chinese with an English Abstract). [Google Scholar]
  47. Shao, D.; Chen, S.; Tan, X.; Gu, W. Drought characteristics over China during 1980–2015. Int. J. Climatol. 2018, 38, 3532–3545. [Google Scholar] [CrossRef]
  48. Yao, N.; Li, Y.; Lei, T.; Peng, L. Drought evolution, severity and trends in mainland China over 1961-2013. Sci. Total Environ. 2018, 616–617, 73–89. [Google Scholar] [CrossRef]
  49. Sui, Y.B.; Niu, C.W.; Jia, Y.W.; Yang, X.; Wang, D.D. Precipitation, temperature and runoff for the recent 60 years in the Yellow River water conservation area of China and their influence on water conservation. Mt. Res. 2023, 41, 41–55, (In Chinese with an English Abstract). [Google Scholar]
  50. Berghuijs, W.R.; Larsen, J.R.; van Emmerik, T.H.M.; Woods, R.A. A Global Assessment of Runoff Sensitivity to Changes in Precipitation, Potential Evaporation, and Other Factors. Water Resour. Res. 2017, 53, 8475–8486. [Google Scholar] [CrossRef]
  51. Wang, X.X.; Shen, H.T.; Li, X.Y.; Jing, F. Concepts, processes and quantification methods of the forest water conservation at the multiple scales. Acta Ecol. Sin. 2013, 33, 1019–1030, (In Chinese with an English Abstract). [Google Scholar] [CrossRef]
  52. Cong, W.C.; Sun, X.Y.; Guo, H.W.; Shan, R.F. Comparison of the SWAT and InVEST models to determine hydrological ecosystem service spatial patterns, priorities and trade-offs in a complex basin. Ecol. Indic. 2020, 112, 106089. [Google Scholar] [CrossRef]
  53. Lüke, A.; Hack, J. Comparing the Applicability of Commonly Used Hydrological Ecosystem Services Models for Integrated Decision-Support. Sustainability 2018, 10, 346. [Google Scholar] [CrossRef]
  54. Ju, Q.; Shen, T.; Zhao, W.; Wang, X.; Jiang, P.; Wang, G.; Liu, Y.; Wang, Q.; Yu, Z. Simulation and prediction of changes in maximum freeze depth in the source region of the Yellow River under climate change. Sci. Total Environ. 2023, 905, 167136. [Google Scholar] [CrossRef] [PubMed]
  55. Wu, J.Y.; Ju, Q.; Liu, X.N.; Lian, Z.X.; Zhang, Y.Y.; Duan, Y.Y. Assessment of precipitation and temperature in the water conservation region of the Yellow River Basin using CMIP6 models. Hydro-Sci. Eng. 2023, 1–14, (In Chinese with an English Abstract). [Google Scholar]
  56. Jia, Y.F.; Wang, G.Q. Assessment of water conservation capavity of Yiluo River Basin based on the InVEST Model. J. Soil Water Conserv. 2023, 37, 101–108, (In Chinese with an English Abstract). [Google Scholar]
Figure 1. Geographical location, Köppen climate classification, and precipitation patterns of the Yiluo River Basin (Dwa: humid continental climate with hot summer and dry winter; Cwa: humid subtropical climate also with hot summer and dry winter).
Water 16 02320 g001
Figure 2. Land use/cover in the Yiluo River Basin from 1980 to 2015.
Water 16 02320 g002
Figure 3. Diagnosis of the temporal trends and abrupt changes in the hydro–meteorological factors in the Yiluo River Basin from 1961 to 2018.
Water 16 02320 g003
Figure 4. Land use transfers in the Yiluo River Basin.
Water 16 02320 g004
Figure 5. Simulated and observed streamflow at Heishiguan station.
Water 16 02320 g005
Figure 6. Annual dynamics of water cycle elements and water conservation in the Yilou River Basin (the annual distribution of the typical negative years of 1997 and 2012 is illustrated on the right).
Water 16 02320 g006
Figure 7. Allocation of annual water conservation during the flood and nonflood season (FP, NP, and AP represent flood season, nonflood season, and all year period. FP II FP II, and FP III represent the flood seasons of Periods I, II, and III, respectively.).
Water 16 02320 g007
Figure 8. Intra-annual allocation of precipitation and water conservation in the Yiluo River Basin.
Water 16 02320 g008
Figure 9. Spatial distributions of the water conservation in the Yiluo River Basin.
Water 16 02320 g009
Figure 10. Change in the water conservation in each sub-basin of the Yiluo River basin.
Water 16 02320 g010
Figure 11. Water conservation grade and Sen–MK trend of water conservation (II represents insignificant improvement, ST represents stable, ID represents insignificant degradation, SLD represents slightly degradation, SD represents significant degradation, and ESD represents extremely significant degradation).
Water 16 02320 g011
Figure 12. Correlation analysis of the main factors of water conservation.
Water 16 02320 g012
Figure 13. Pearson’s correlation coefficient in each subbasin in the Yiluo River basin.
Water 16 02320 g013
Figure 14. Interaction heatmap of the main factors (X1 represents the average multiyear temperature, X2 represents the multiyear average precipitation, X3 represents land use, X4 represents the number of hours of daylight, X5 represents wind speed, X6 represents relative humidity, X7 represents the saturated hydraulic conductivity of the soil, X8 represents the potential evaporation, X9 represents population density, X10 represents slope, X11 represents the vegetation, X12 represents the GDP, and X13 represents the digital elevation model).
Water 16 02320 g014
Figure 15. Factor detector results of main factors.
Water 16 02320 g015
Table 1. Acquisition and processing of the data.
DataData Source and Processing Method
Meteorological dataIncluding precipitation, temperature, wind speed, and sunshine hours, obtained from CN05 gridded observation dataset [24,25,26].
Land use/coverObtained from National Tibetan Plateau Science Data Center (https://data.tpdc.ac.cn).
Soil dataIncluding soil saturated conductivity, available water content, soil texture, soil matric bulk density, and electrical conductivity, obtained from National Tibetan Plateau Science Data Center (https://data.tpdc.ac.cn).
Digital elevation modelObtained from Geospatial Data Cloud: ASTER GDEM 30 M resolution digital elevation data (https://www.gscloud.cn).
Hydrological dataMonthly streamflow data obtained from Yellow River Basin Hydrological Yearbook.
Table 2. Definitions of the parameters and sensitivity analysis.
NumberParameterPhysical Definitionp-Valuet-Stat
1CN2SCS runoff number0.0000−25.90
2ESCOSoil evaporation compensation factor0.0000−22.94
3SOL_BDWet compacted weight of soil0.0000−9.80
4SOL_KSaturated hydraulic conductivity0.0000−8.08
5SOL_AWCAvailable water capacity of soil0.00007.40
6GW_DELAYDelay time of groundwater0.00004.54
7ALPHA_BNKBasic alpha flow factor0.0001−3.99
8CH_K2Main channel hydraulic conduction0.06961.82
9SLSUBBSNLength of overland flow0.07601.78
10GW_REVAPCoefficient of groundwater revap0.12801.52
11EPCOPlant uptake factor0.13581.49
12REVAPMNWater depth threshold in shallow aquifers for “revap”0.24571.16
13CH_N2Manning value for main channel0.28431.07
14GWQMNShallow aquifer thresholds required for regression flow generation0.3040−1.03
15ALPHA_BFBaseline flow alpha factor0.3510−0.93
16HRU_SLPSlope of HRU0.4018−0.84
17OV_NManning’s n value for overland flow0.7202−0.36
18SFTMPSnowfall temperature0.82050.23
Table 3. Calibration and validation of the SWAT model.
PeriodTimeNSER2P-FactorR-Factor
1Calibration (1966–1975)0.790.790.710.66
Validation (1976–1985)0.820.880.480.44
2Calibration (1986–1995)0.780.790.680.71
Validation (1996–2000)0.770.870.550.68
3Calibration (2001–2010)0.850.860.790.77
Validation (2011–2018)0.720.800.70 1.08
Disclaimer/Publisher’s Note: The statements, opinions and data contained in all publications are solely those of the individual author(s) and contributor(s) and not of MDPI and/or the editor(s). MDPI and/or the editor(s) disclaim responsibility for any injury to people or property resulting from any ideas, methods, instructions or products referred to in the content.

