Study Protocol

Flocculants for the High-Concentration Activated Sludge Method and the Effectiveness of Urban Wastewater Treatment

1
School of Architecture and Civil Engineering, Xihua University, Chengdu 610039, China
2
China Municipal Engineering Southwest Design & Research Institute Co., Ltd., Chengdu 610213, China
3
Chengdu University Library, Chengdu 610106, China
*
Author to whom correspondence should be addressed.
Water 2024, 16(16), 2281; https://doi.org/10.3390/w16162281
Submission received: 7 July 2024 / Revised: 2 August 2024 / Accepted: 5 August 2024 / Published: 13 August 2024
(This article belongs to the Special Issue Advanced Technologies in Water Treatment)

Abstract

:
In this paper, the three inorganic flocculants polymeric chloride PAC, FeCl3, and Al2(SO4)3 and two organic flocculants anionic polyacrylamide APAM and cationic polyacrylamide CPAM were screened to determine the most efficient flocculants and the optimal dosage, optimizing the flocculation operating conditions through the orthogonal test and then proving the experimental effect according to a comparison study of the high-concentration method and the traditional activated sludge method. The results show that the addition of CPAM achieves the best flocculation for high-concentration activated sludge suspension, and that the sludge interface descent rate, sludge volume index, and sludge settling ratio are better than those of other flocculants. The orthogonal test was used on the sludge volume index to perform evaluations and analyses: mixing section mixing intensity > Flocculation Stage 1 section mixing intensity > Flocculation Stage 2 section mixing intensity > mixing section residence time > flocculation section hydraulic residence time. In the comparison test, the settling performance of the high-concentration method was higher than that of the traditional activated sludge method. In terms of pollutant removal, the removal rates of COD, ammonia nitrogen, and total nitrogen of the traditional activated sludge method were 90.85%, 95.74%, and 71.6%, respectively. The average removal rates of COD, ammonia nitrogen, and total nitrogen of high-concentration activated sludge method were 92.24%, 97.28%, and 80.97%—higher than that of the traditional activated sludge method.

1. Introduction

Activated sludge systems have been used to treat a wide range of wastewaters, with over 90% of municipal wastewater treatment plants using them as a core part of the treatment process. The basic function of the wastewater biological treatment process is to convert organic matter into carbon dioxide, water, and bacterial cells. The cells can then be separated from the pure water and disposed of in a concentrated form known as excess sludge [1,2]. The activated sludge method is one of the most widely used wastewater treatment technologies in China, but it is constantly highlighting problems such as a weak adaptability to water quality changes and shock loads. It is difficult to maintain a low discharge concentration of total nitrogen during the conventional treatment process of urban wastewater for the improvement of quality and efficiency, and increases in biomass and the strengthening of denitrification and denitrogenating are the main improvement factors identified for the upgrading of wastewater treatment systems [3].
A large number of studies have proved that the high-concentration activated sludge method is suitable for sewage treatment, and high-concentration sludge can effectively remove nitrogen pollutants in sewage; and from this background, the high-concentration activated sludge method came into being. At present, the biochemical reaction section of the high-concentration sludge maintenance technology can be divided into four methods: one is based on a physical membrane separation membrane bioreactor (MBR) process, where a membrane bioreactor (MBR) is used in the traditional activated sludge method in combination with membrane separation technology to create a new wastewater treatment process [4]. Baoyu et al. [5] found that for microplastic treatment efficiency, the MBR membrane process improves the effluent stability of the process, and the high concentration of activated sludge in the reactor is favorable for the decomposition of difficult-to-degrade microorganisms and has advantages including shock load resistance, easy operation and management, and a small footprint [6]. However, this process also has disadvantages—the price of the membrane is expensive, membrane contamination requires clean-up costs, and the overall cost of this process is high. The second method is the aerobic granular sludge process based on microbial sub-coagulation. Aerobic granular sludge refers to the granular sludge with a highly dense structure formed by microorganisms that coagulate by themselves under specific hydraulic conditions [7]. Li et al. [8] used the aerobic granular sludge process to treat waste permeate, and the results of the study showed that no matter what the mixing ratio of influent solution or the concentration of free ammonia (FA) and free nitrite (FNA) in the influent solution, GSBR was able to achieve the same result, exhibiting high total ammonia nitrogen (TAN) removal efficiencies ranging from 95% to 100%. Compared with traditional activated sludge, the good granular sludge process—the AGS process—results in a large biomass, good sludge sedimentation performance, and high shock load resistance; in practice, the higher settleability achieved can reduce the volume of the secondary sedimentation tank, reducing land utilization and infrastructure costs [9]. However, there are some disadvantages of the aerobic granular sludge process: Firstly, the formation time of aerobic granular sludge is longer and the criteria for the successful start-up of the process have not been accurately determined so far. Secondly, the stability of the process is poorer; it is more difficult to maintain stable operation, and there are many constraints during operation [10]. The third disadvantage is based on the large reflux ratio of the completely mixed Bio-Dopp process, which achieves biological denitrification, phosphorus removal, and biological nitrification in the same reactor by means of an anti-clogging aeration system, biological nitrogen and phosphorus removal, rapid clarification, etc. [11]. Ronauli et al. [12] treated cyanide-containing wastewater using Bio-Dopp, and the results showed that maintaining the DO at 0.3 mg/L not only saves energy, but also achieves a COD removal rate of 88.76% and an ammonia nitrogen removal rate of 88.76%. The reactor was able to achieve simultaneous nitrification and denitrification in an environment with a lower concentration of dissolved oxygen. However, this process also has shortcomings—it has strict requirements for conditions such as the amount of dissolved oxygen and requires specific large-area aeration [10]. The fourth disadvantage is based on the chemical-assisted high-concentration activated sludge method, which is simple, easy to operate, achieves a good treatment effect, can withstand a high shock load capacity, has no special requirements for the sedimentation tank, and can be widely used in the ordinary activated sludge method of wastewater plants to improve quality and efficiency. Zeng et al. [13] found that a new type of composite chitosan flocculant was made of chitosan, polymer aluminum chloride (PAC), and silicate. Compared with conventional flocculants such as PAC, the removal rates of COD, SS, and Al in water treated with this new composite chitosan flocculant were increased by 1.8–23.7%, 50%, and 61.2–85.5%, respectively, and the cost was reduced by 7.34%, but it has not yet been widely disseminated due to the lack of an effective, economical, and convenient solid–liquid separation method for high-concentration activated sludge suspensions [11]. Compared with the conventional activated sludge method, the high-concentration method has the following advantages: lower energy consumption, higher nitrogen and phosphorus removal efficiency, and lower sludge production, which is important for the construction or renovation of other wastewater treatment plants.
The coagulation–flocculation process is one of the most well-known water treatment technologies in the world and is widely used in industrial, domestic, and natural water treatment plants [14]. Coagulation and flocculation are often used interchangeably in the literature. However, these are two different processes; typically, coagulation is defined as the destabilization of a suspension, leading to aggregation (main mechanism: charge neutralization), whereas flocculation is a process by which unstable particles are induced to come into contact to form larger aggregates (main mechanism: bridging/electrostatic interactions). As in Ref. [15], for example, the use of flocculation to treat suspended solids can be used as a process for sludge thickening and dewatering [16]. The choice of flocculant is very important in this regard; flocculants are subdivided into inorganic and organic flocculants, with organic coagulants offering a number of advantages including lower operating costs, lower sludge generation, and very high biodegradability [17]. Inorganic and organic flocculants tend to be more effective when used in combination, for example, through interparticle bridging using organic and inorganic polymeric coagulants such as chitosan, polymeric aluminum chloride, and polysilicate aluminum chloride [18]. However, chemical flocculants such as metal salts and inorganic polymers have obvious disadvantages such as human health effects, high costs, and the generation of large amounts of sludge [19]. Therefore, current research on bioflocculants is beginning to gradually increase, but so far, the use of biocoagulant flocculants has been limited to the laboratory and pilot scale [20]. Numerous studies have demonstrated the ability of flocculants to improve the performance of activated sludge mud–water separation; Lekniute-Kyzike et al. [21] evaluated the effectiveness of produced cationic starch (CS) and crosslinked cationic starch (CCS) flocculants in the thickening and dewatering of residual activated sludge in comparison with synthetic cationic flocculants (SCFs) by measuring the treated residual filtration rate of activated sludge to determine the flocculation efficiency of SCFs, CSs, and CCSs in sludge thickening. Ozun et al. [22] investigated the effect of flocculants in determining the effects of three different high molecular weight (HMW) flocculants (anionic, cationic, and nonionic flocculants) on the removal of fine particles from the wastewater of a natural stone (flocculated with flocculation stone) processing plant at alkaline pH conditions. In the presence of flocculants, the pH-dependent turbidity removal efficiency varied with flocculant type, flocculant concentration, and time. Peng et al. [23] investigated a second-order polynomial model based on the phenomenological theory, and successfully quantitatively evaluated the effects of two important structural factors, hydrophobicity and CD, of the St-based flocculants on sludge dewaterability. Through theoretical simulations, the constitutive relationship of St-based flocculants in sludge dewatering was obtained. Wu et al. [24] investigated the settlement behavior of flocculant-treated river dredging slurry under woven geotextile filtration. The effect of different flocculants, particularly nonionic polyacrylamide (NPAM) and cationic polyacrylamide (CPAM), was assessed by the settling rate of the dredged slurry. The results showed that both NPAM and CPAM significantly increased the settling rate of the slurry during geotextile filtration at an optimum concentration of around 250 mg/L. The results showed that the flocculants were effective in increasing the settling rate of the slurry during geotextile filtration. At equivalent flocculant concentrations, NPAM outperformed CPAM in accelerating the settling rate. Tsilo et al. [25] obtained removal efficiencies of 43% (COD), 64% (BOD), 73% (P), and 50% (N) using microbial flocculants for the treatment of coal mine wastewater. Barros et al. [26]. utilized a coagulation–flocculation process as a pre-treatment, and the coagulation/flocculation pre-treatment resulted in a high NH4 + recovery of 570.6 mgNH4 +/L and the reduced re-sizing or replacement of other membrane treatment processes due to its high TSS removal.
Based on the advantages and disadvantages of the high concentration activated sludge method, it can be determined if conventional flocculants suit local conditions and if the desired treatment effect can be achieved using this method, or whether the fourth method, based on a chemical-assisted high concentration activated sludge method, can achieve this effect. The research objectives of this paper: (1) through relevant tests, the formation of high-concentration activated sludge of the most suitable flocculant is screened, using the addition of flocculant to maintain a good sludge settling performance from the high-concentration sludge so that it has a better solid–liquid separation effect in the conventional settling tank; (2) through the screening of flocculants used in actual wastewater treatment applications, the high-concentration activated sludge method and the conventional activated sludge method are compared. The treatment effect is verified.

2. Materials and Methods

2.1. Materials and Reagents

Aluminum sulphate Al2(SO4)3, ferric chloride FeCl3, polymeric aluminum chloride PAC, cationic polyacrylamide CPAM, and anionic polyacrylamide APAM were used; the structure of CPAM and APAM is shown in Figure 1. High concentrations of activated sludge suspension were used. The sub-test used a sewage treatment plant regulating pool sewage; this sewage plant is responsible for discharging the local area and is a combined rain and sewage system. The COD and BOD5 concentrations are low, the influent organic carbon source is low, and the water quality is shown in Table 1.

2.2. Test Equipment and Instruments

A JJ-4 (A) six coagulation mixer (Changzhou Ronghua Instrument Manufacturing Co., Ltd., Changzhou, China), BSA124S-CW electronic balance (Sartorius Scientific Instruments Beijing Co., Ltd., Beijing, China), 2100Q turbidimeter (HACH Company, Shenzhen, China), 101-1AB electric blast drying oven (Beijing Zhongxing Weiye Century Instrument Co., Ltd., Beijing, China), and SX-4-10 muffle furnace (Beijing Zhongxing Weiye Century Instrument Co. Ltd., Beijing, China) were used.

2.3. Test Methods

(1) Beaker experiments were set up to simulate the removal of high-concentration activated sludge suspension by five dosages of three inorganic flocculants, PAC, FeCl3, and Al2(SO4)3, and two organic flocculants, CPAM and APAM, in the coagulation process. The flocculation efficacy of various types of flocculants on high-concentration activated sludge suspension was studied on the basis of the rated mixing intensity and residence time. The effective dosage of each type of flocculant used is shown in Table 1, and the mixing conditions of the six mixers are shown in Table 2.
(2) Under the premise of determining the optimal flocculant and flocculant dosage, orthogonal experimental studies were carried out to further optimize the mixing section HRT, flocculation section HRT, mixing section mixing intensity, Flocculation 1 mixing intensity, and Flocculation 2 mixing intensity during flocculation and sedimentation, and to determine the optimal operational control parameters.
(3) In order to determine the optimal flocculation scheme, it was necessary to determine the settling performance index of the mixture.
The ① sludge interface decline rate (V60) was determined as below.
To do this, take 1000 mL of the sludge sample to be tested and pour it into a beaker, then pour in different doses of the agent, mix, and stir, and then pour it into a 1000 mL measuring cylinder; observe and record the height of the drop of the sludge interface after 60 min:
V 60 = v t
v in the equation represents the volume of the sludge interface drop at time t, mL; t stands for settling time, min.
② Sludge Settling Ratio (SV30)
The 30 min settling ratio refers to the percentage of the volume of the original mixture that is formed by the sludge after the sludge-water and chemical mixture has settled in the measuring cylinder for 30 min.
S V 30 = v 1 v 0 × 100 %
v1 in the formula represents the volume of silt at the bottom of the mixture after settling for 30 min, mL; v0 represents the volume of the original mixture, mL.
The sludge settling ratio can directly reflect the amount of activated sludge in the aeration tank, which can be used for the regulation of residual sludge in the actual production process of sewage plants. At the same time, according to the sludge settlement ratio, the operating conditions of the activated sludge system can be preliminarily determined and analyzed to see whether there are problems such as sludge expansion. Studies have shown [15] that the activated sludge method can be operated normally when the SV30 is lower than 90%, and that the activated sludge method can be operated better and more stably when the SV30 is lower than 68%.
③ Sludge volume after 1 h (mL)
That is, the volume of sludge at the bottom of the measuring cylinder after standing for 1 h.
④ Turbidity of supernatant (NTU)
The turbidity of the supernatant was determined using a Hash turbidimeter 2100Q.
⑤ Sludge Volume Index (SVI)
The Sludge Volume Index (SVI) refers to the volume occupied by 1 g of dry sludge in the aeration tank after the mixture of mud and water and chemicals has been settled for 30 min and the SVI value can react to the looseness and cohesive settling characteristics of the activated sludge in the aeration tank.
S V I = S V 30 M L S S
MLSS in the formula represents the dry weight of suspended solids of the mixture.
(4) Two systems, sidestream high-concentration activated sludge and conventional activated sludge, were operated for 20 days under their respective optimal operating conditions to analyze the pollutant removal effectiveness of both systems. The dissolved oxygen concentration of the sidestream high-concentration activated sludge system ranged from 1 to 2 mg/L, while that of the conventional activated sludge system ranged from 2 to 3 mg/L. The sludge age was maintained for 20 days. In the following discussion, the high-concentration activated sludge system is referred to as System I, and the conventional activated sludge system is referred to as System II.

2.4. Test Equipment and Devices

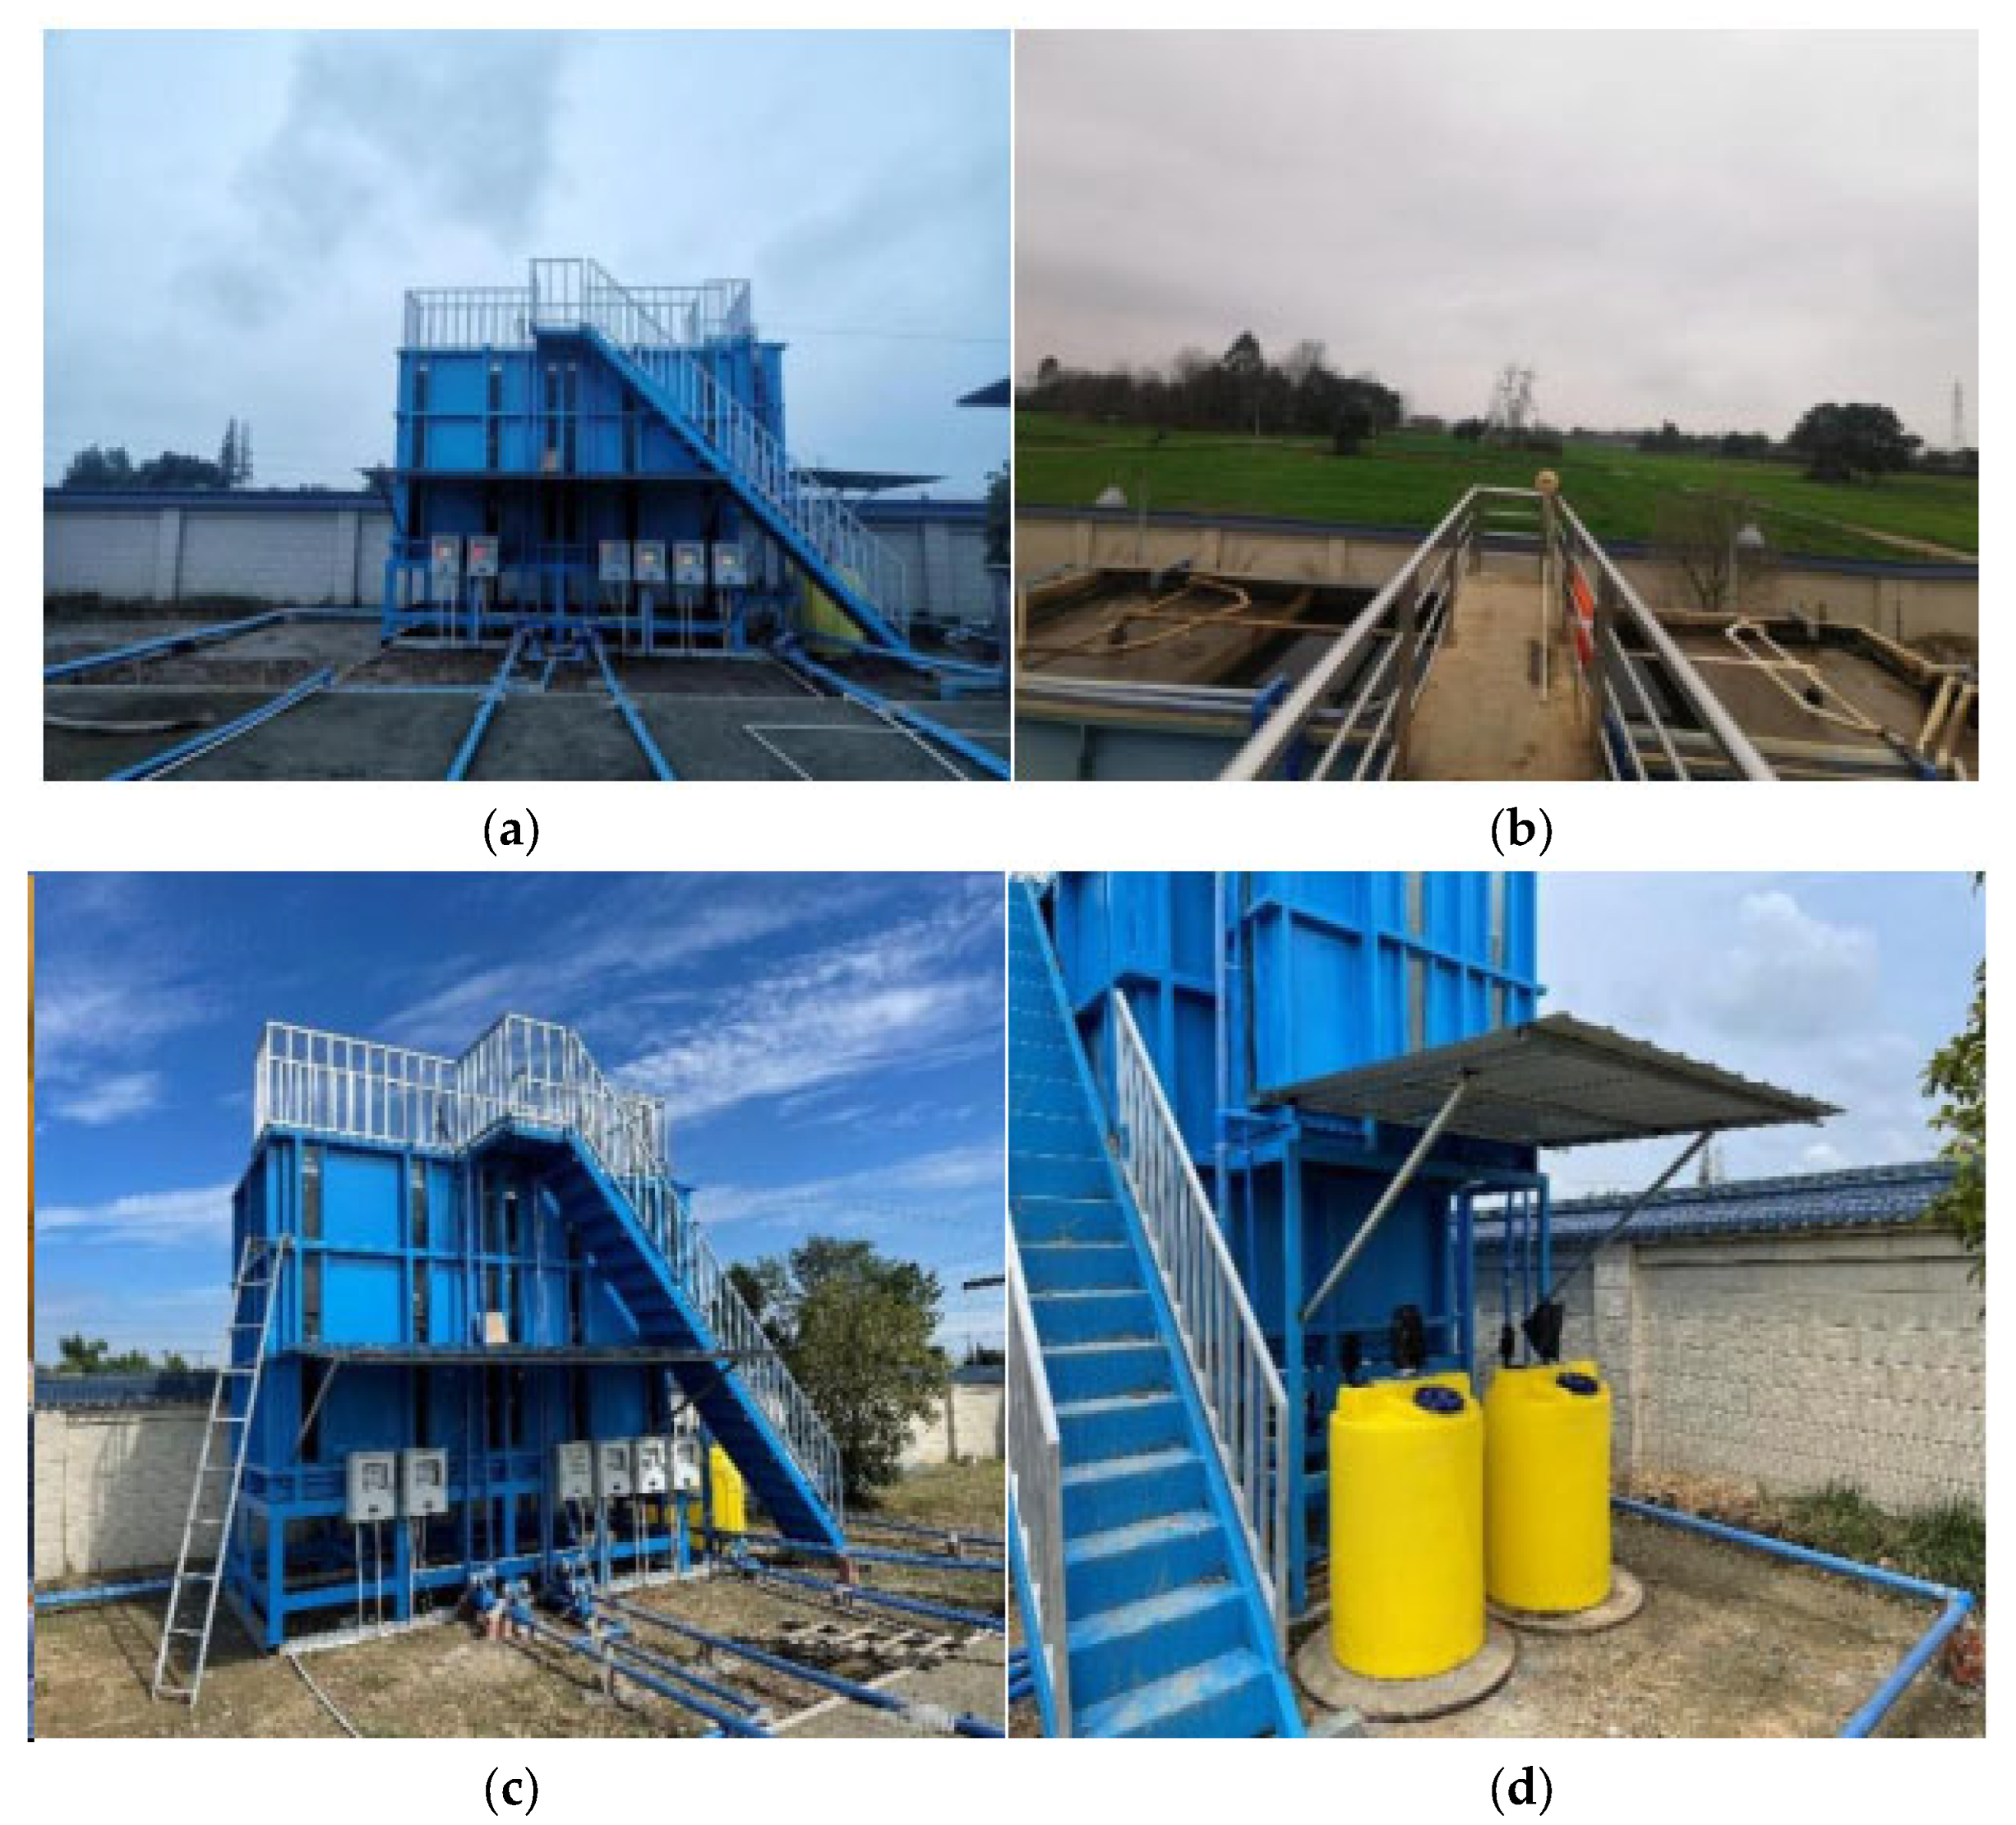
2.4.1. Pilot Test Equipment

The beaker test, which is the most commonly used test for the coagulation process, is used to simulate the mixing, flocculation, and precipitation of the three main processes of the coagulation process. The experimental photos are shown in Figure 2.

2.4.2. Medium-Type Test Set

The medium-sized trial test was divided into two groups of process systems: the control group (conventional activated sludge method) and the experimental group (high-concentration method). In the control group, a new anoxic tank was added before the aeration tank in the sewage plant, and mixed liquid reflux was added between the aeration tank and the anoxic tank. In the experimental group, a side-flow mixing reaction pool was added based on the control group setup. The mud–water mixture in front of the aeration tank was pumped into the mixing reaction tank, where a coagulant was added with a dosing pump and stirred rapidly to ensure thorough mixing with the substances in the water. The mixture then passed through flocculation Stages 1 and 2 before returning to the aeration tank by gravity flow, constituting a side-flow-type high-concentration activated sludge system. The flow diagram of the pilot test is shown in Figure 3. The site of the medium-sized test is shown in Figure 4.

3. Results and Discussion

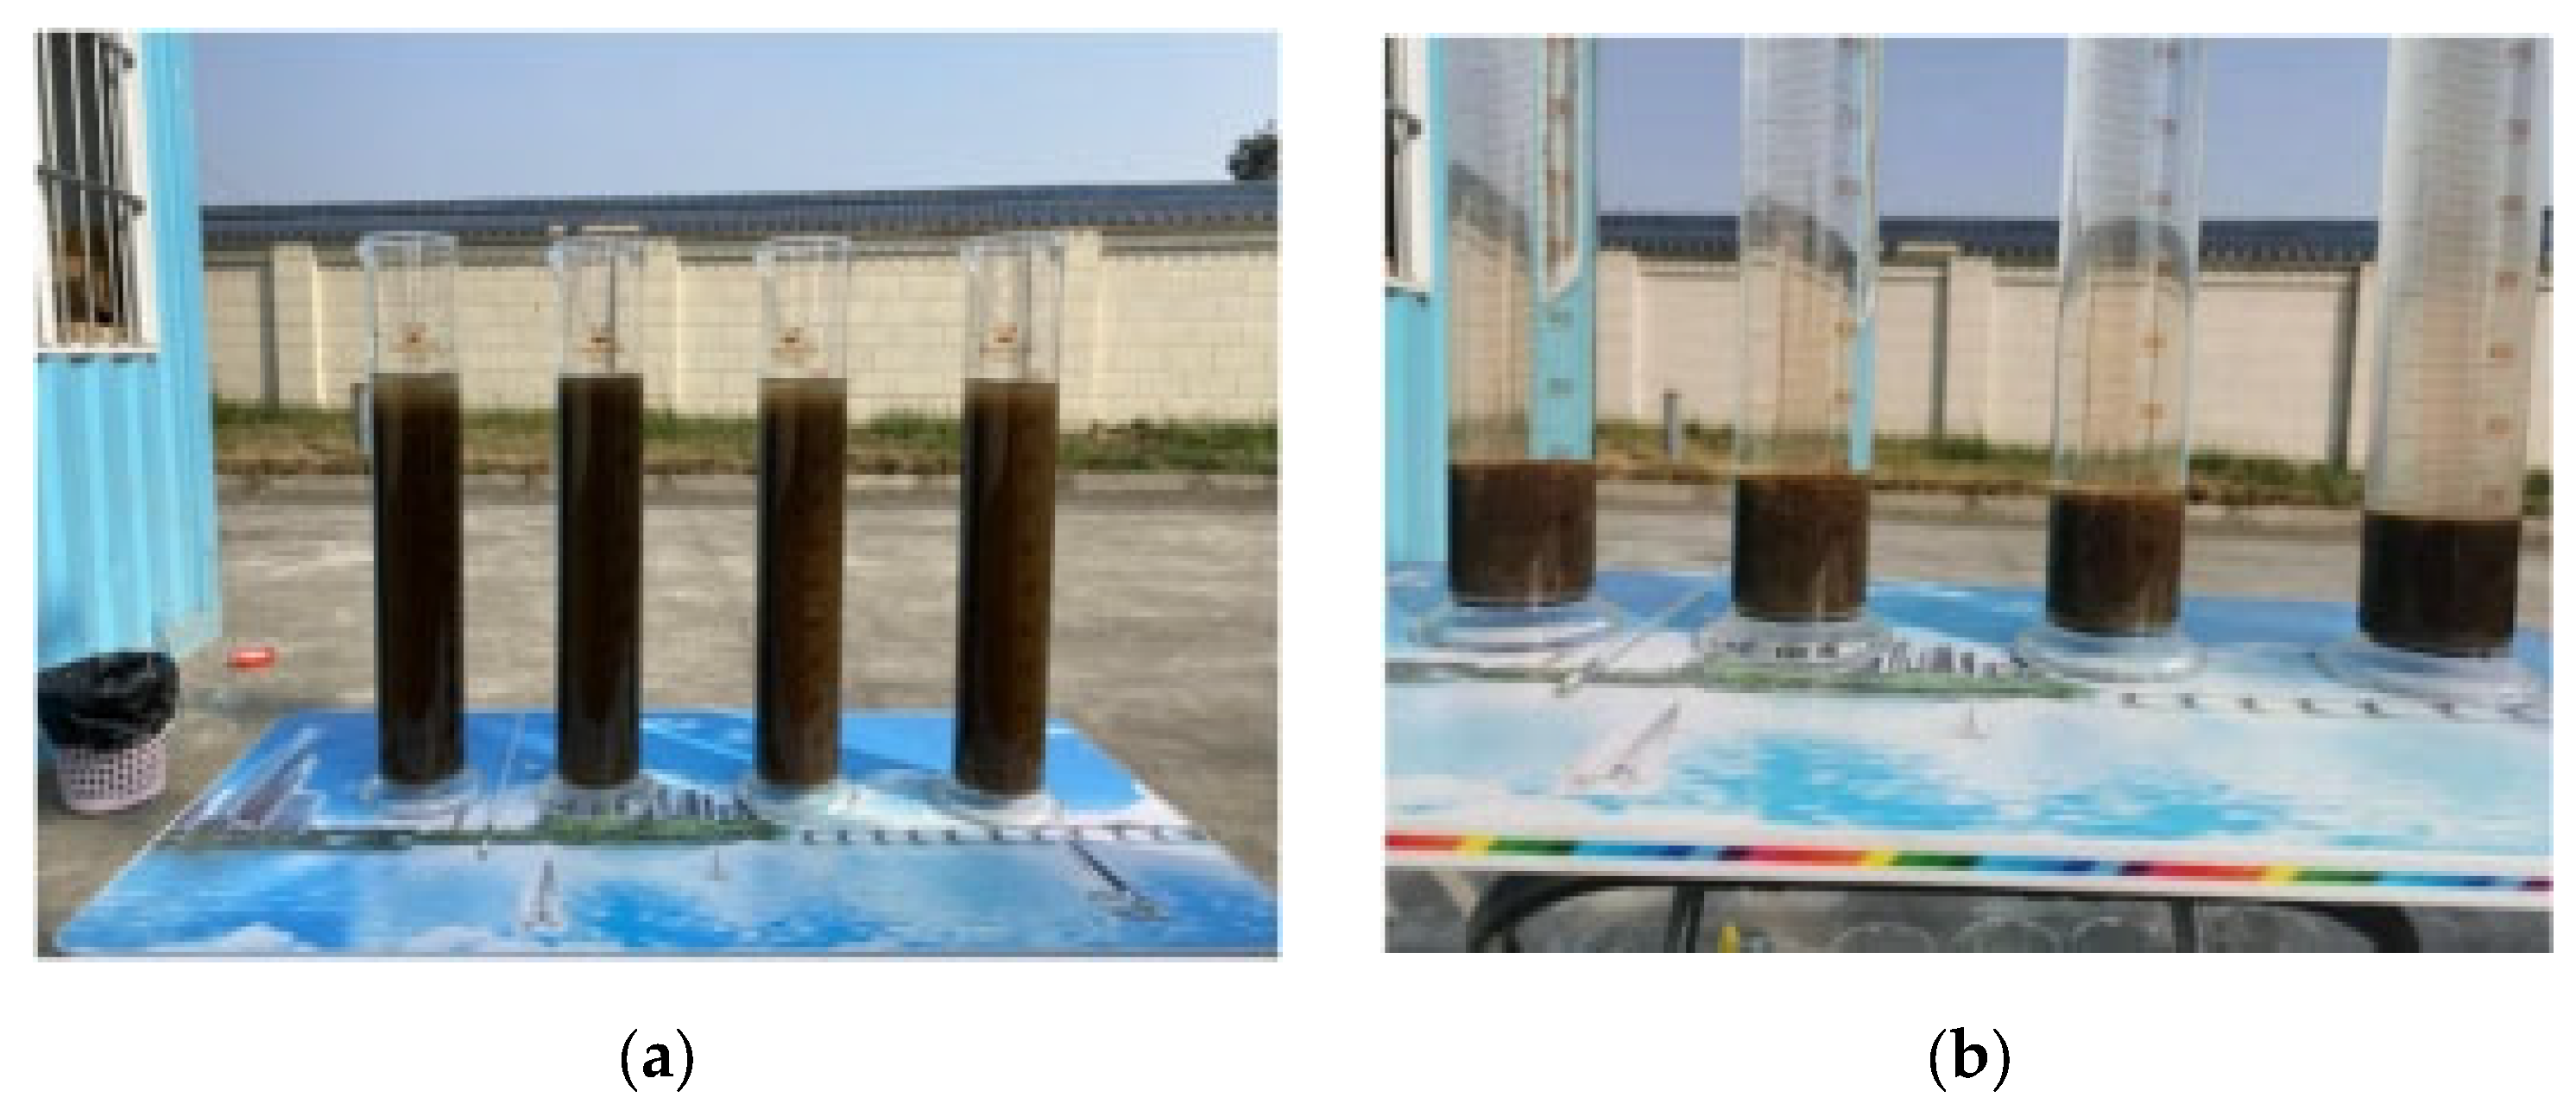
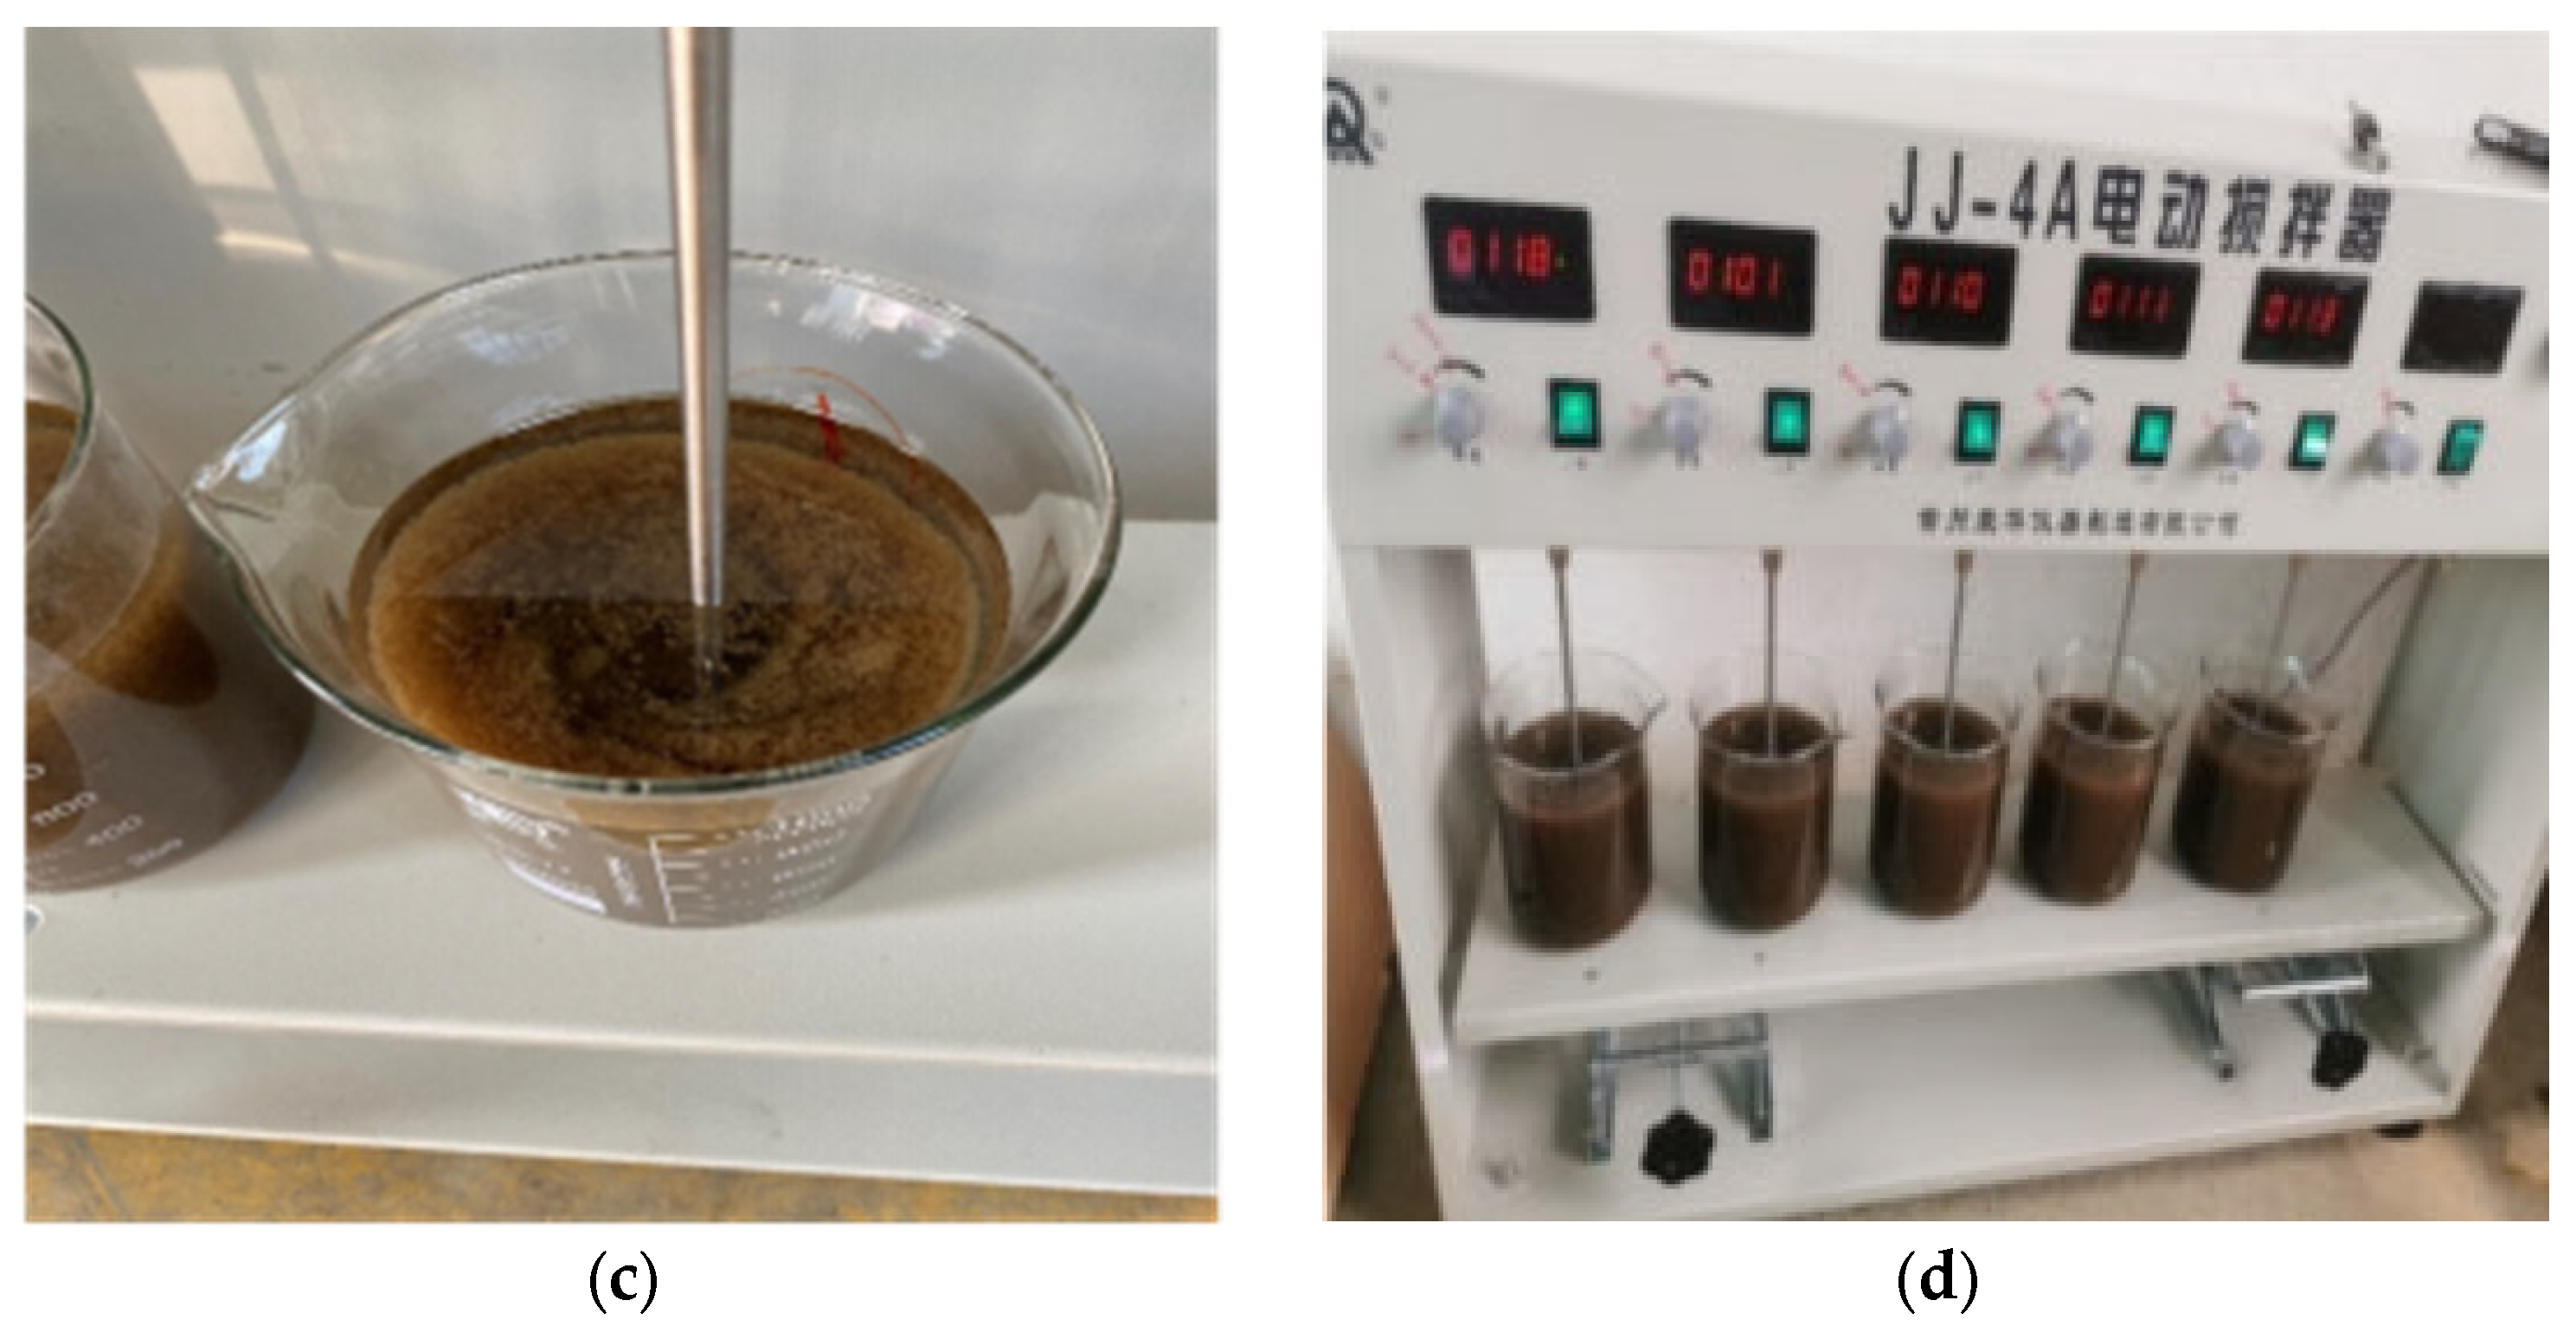
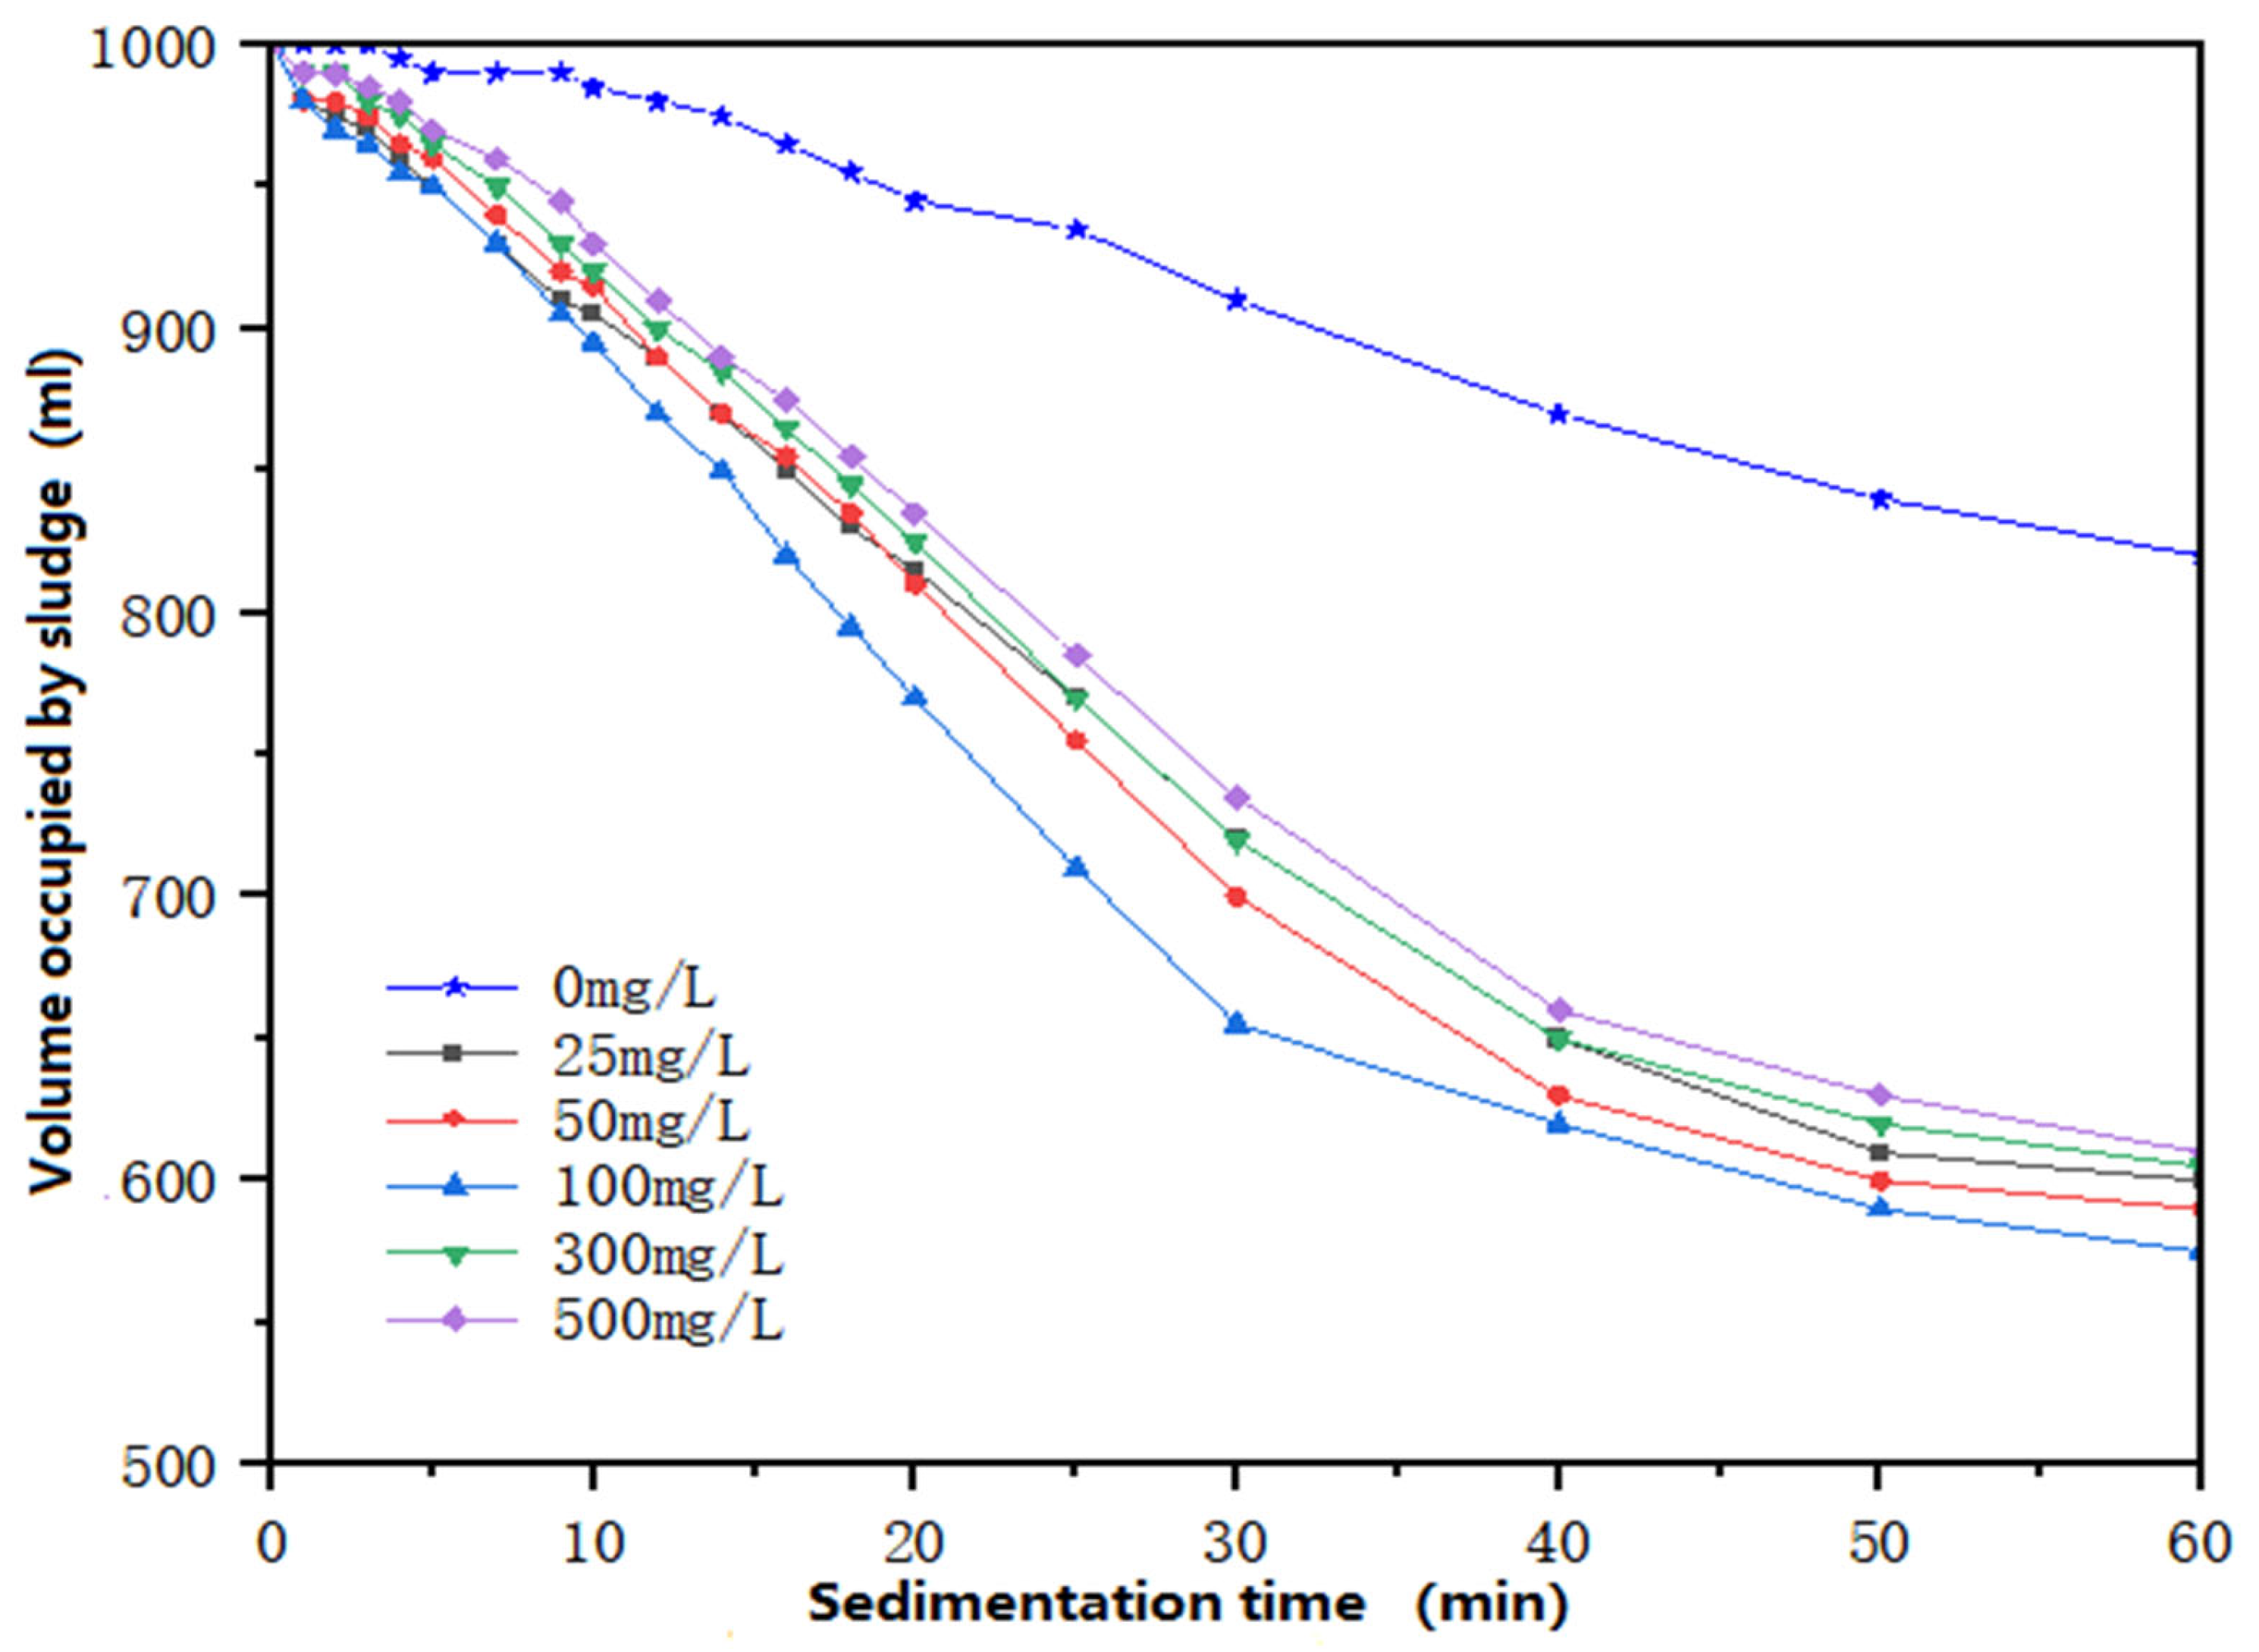
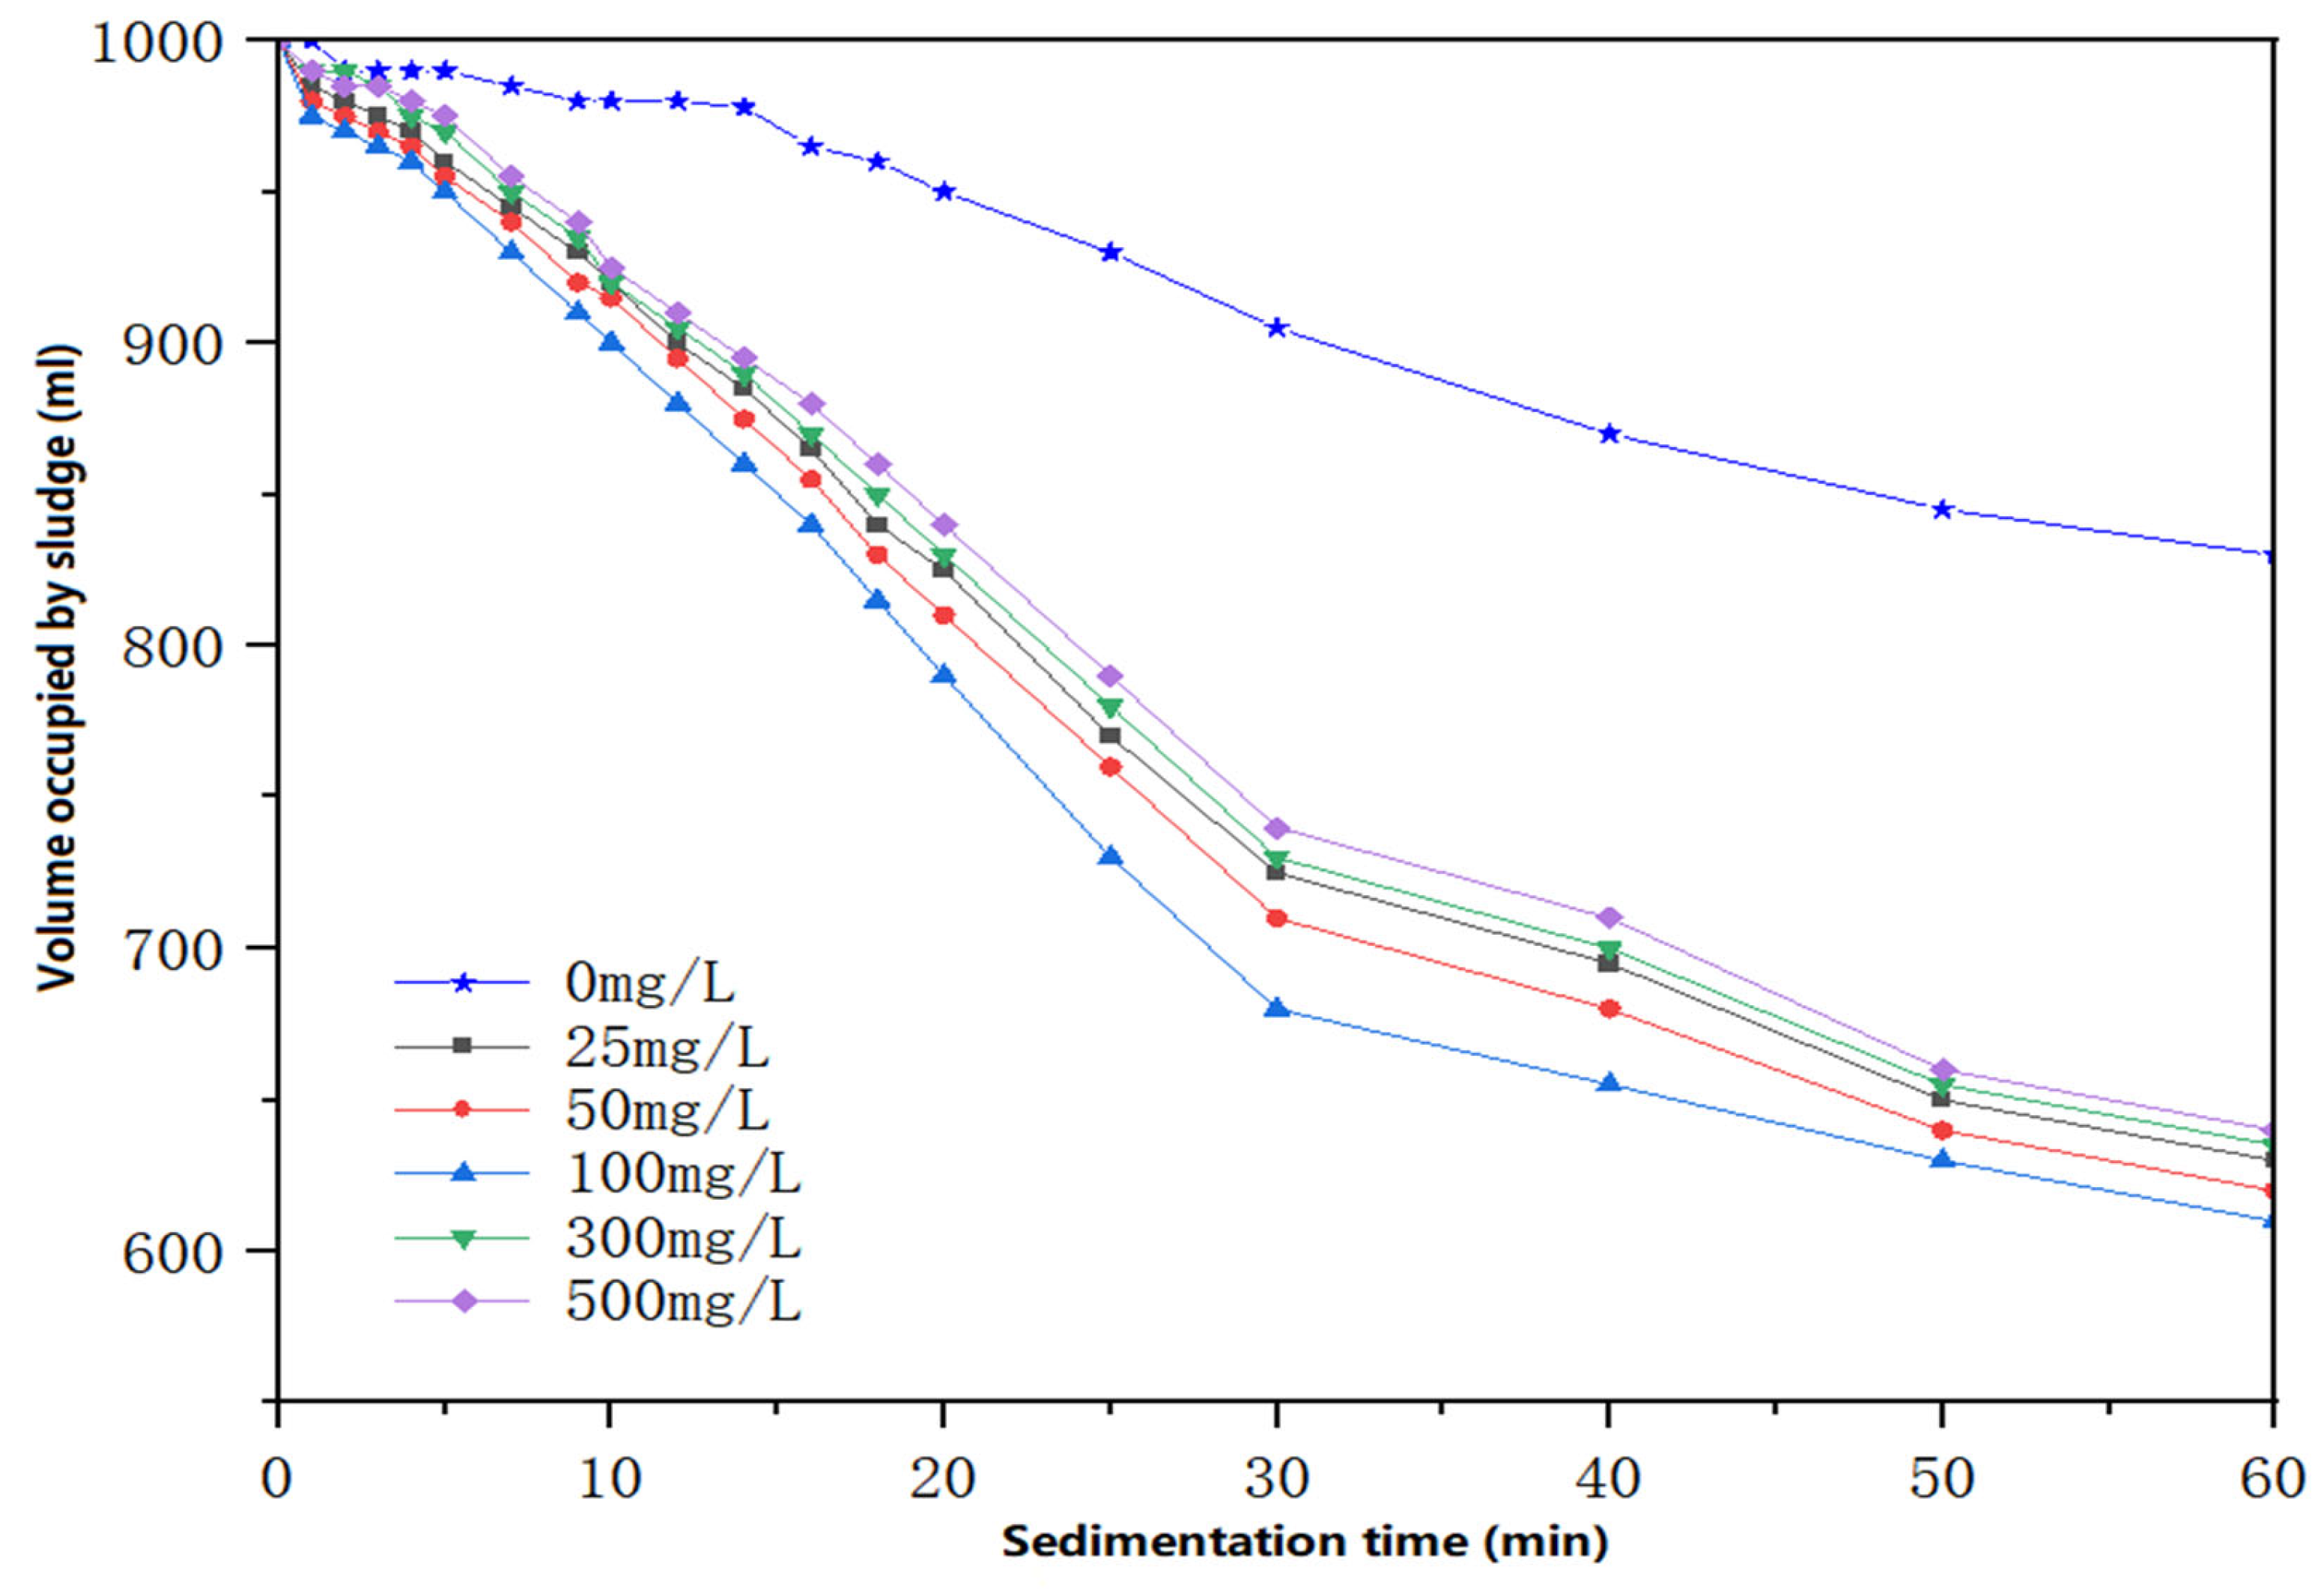
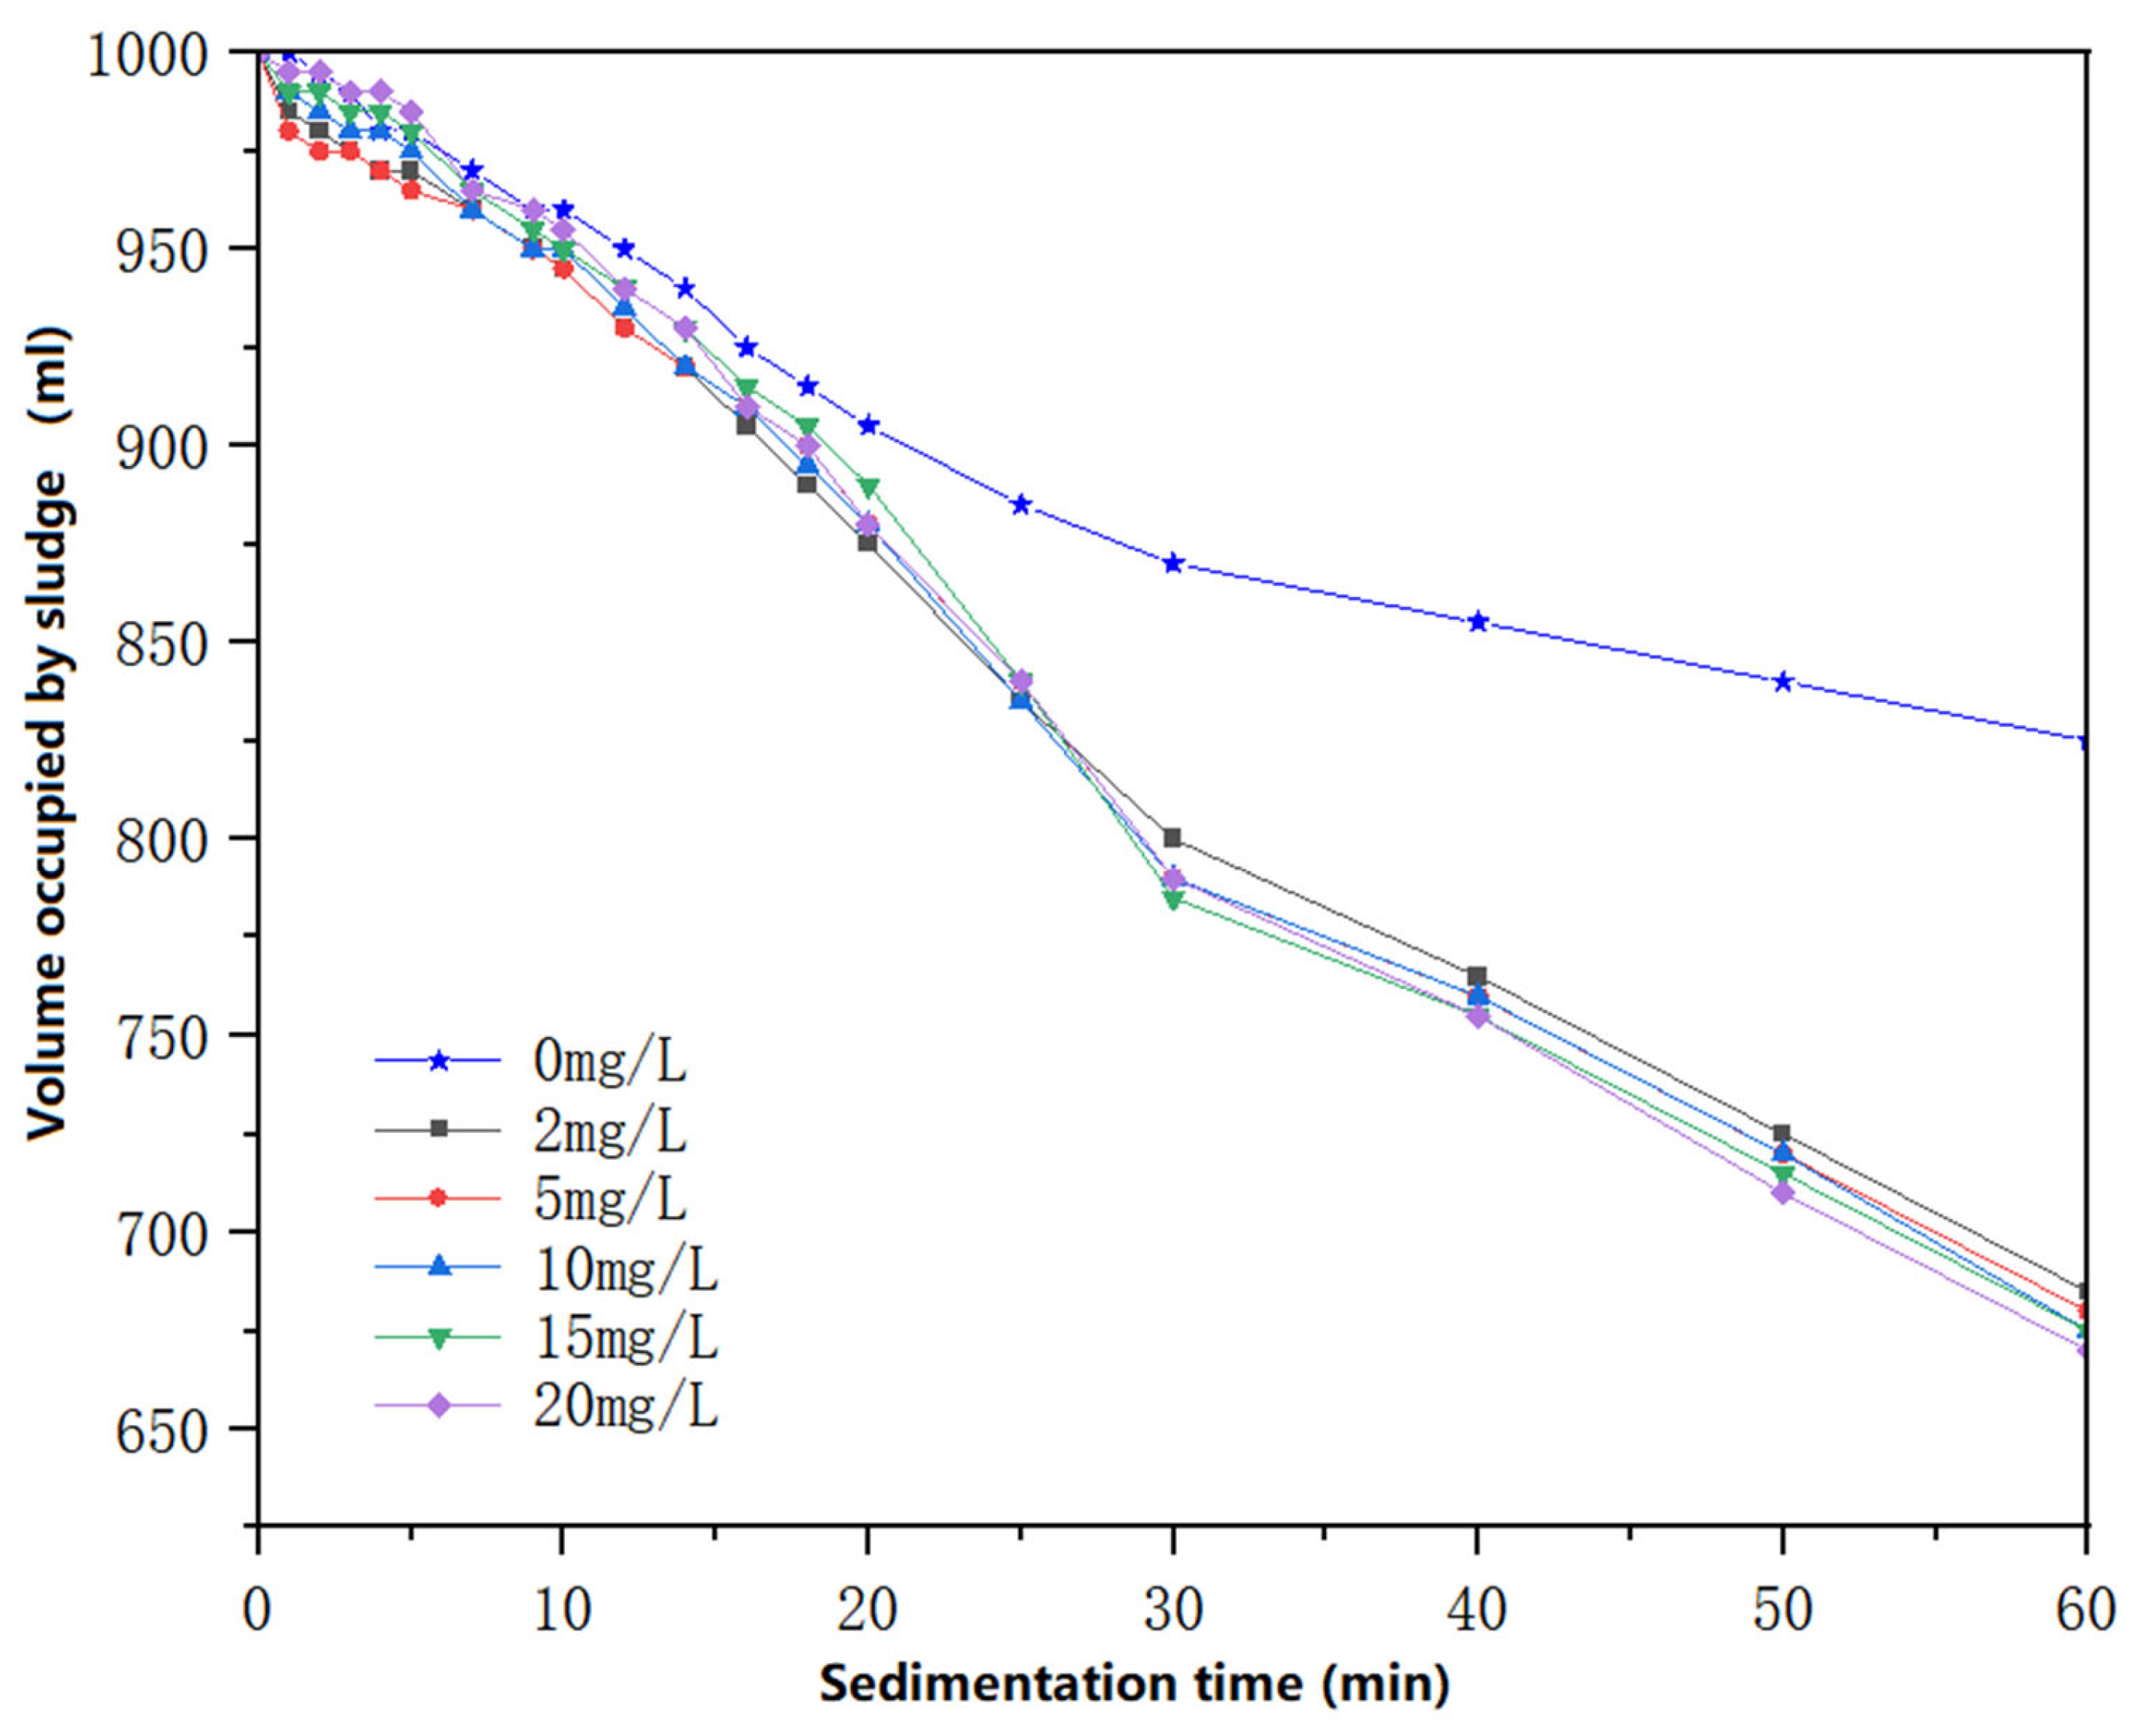
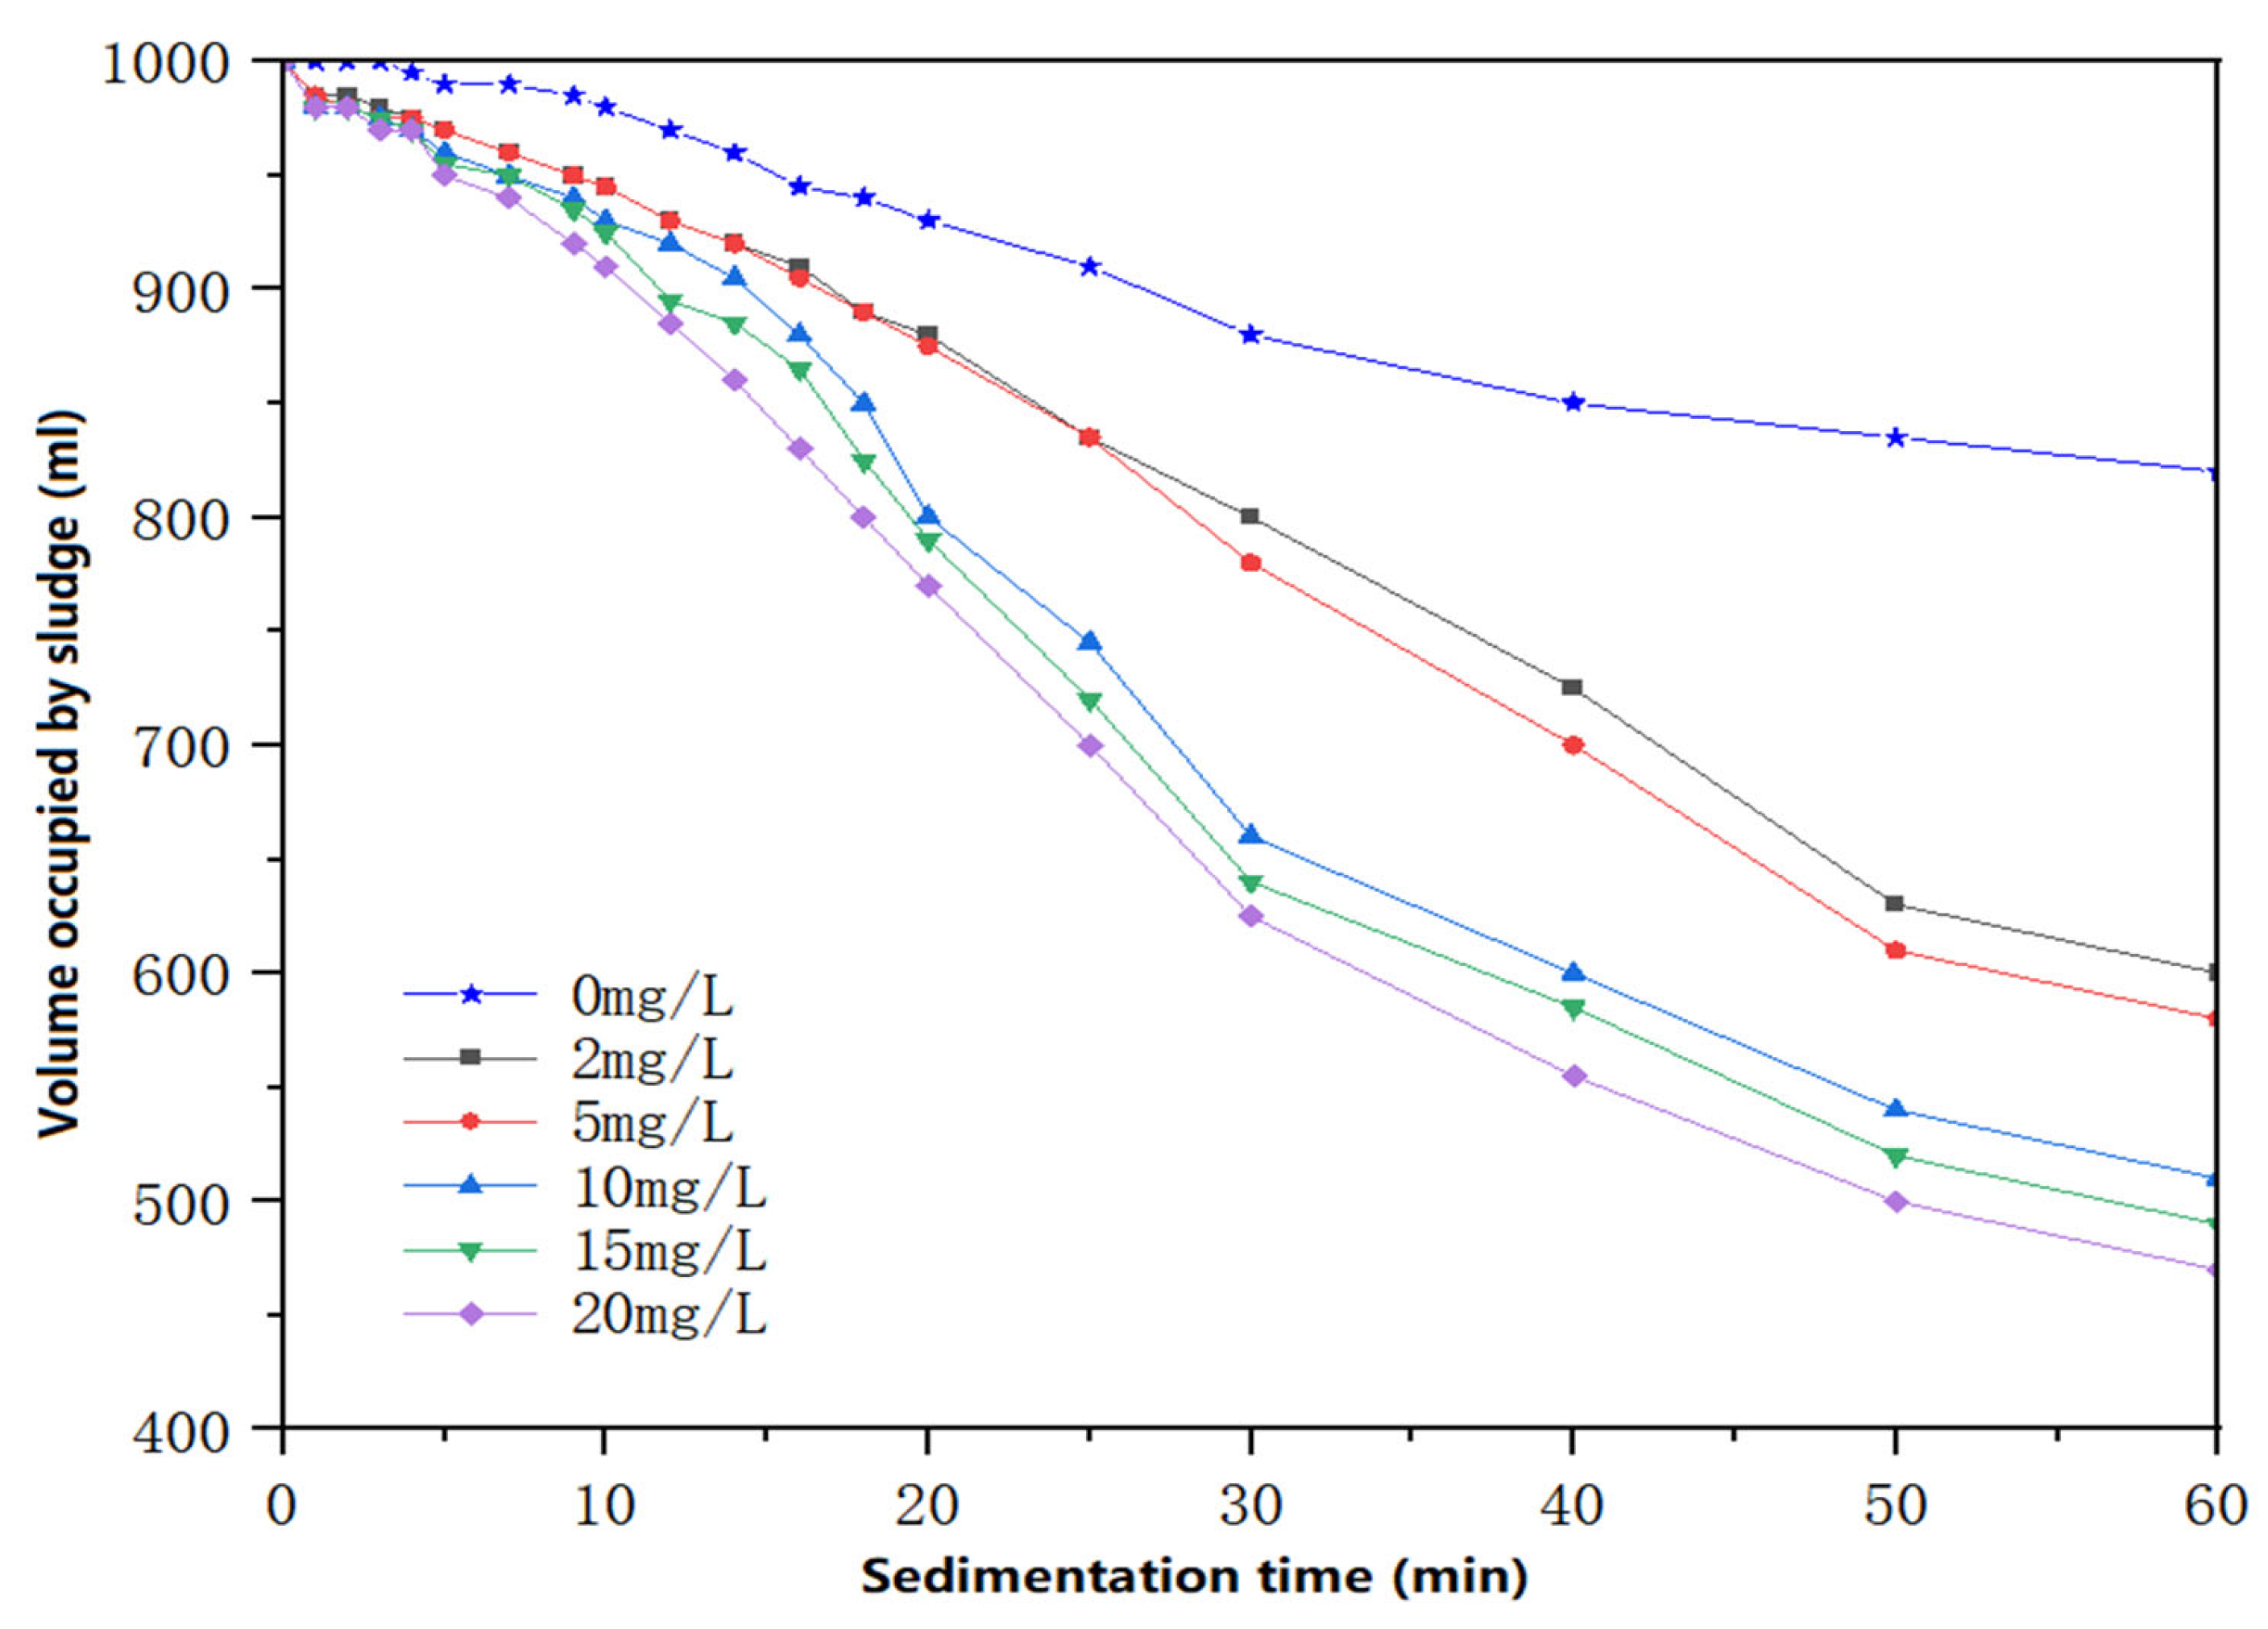
3.1. One-Way Flocculation Test

(1) Aluminum ions in the PAC react with alkaline substances in the water (e.g., carbonate, hydroxide) to form colloidal aluminum hydroxide, which can bind to suspended particles and form larger agglomerates. The mixing conditions of the mixer are shown in Table 3. The volumes of sludge resulting from different dosages of PAC are shown in Figure 5, and the changes in the sludge indices are shown in Table 4. It can be observed that SV30 was the smallest, V60 was the largest, and the SVI value was the lowest when the PAC dosage was 100 mg/L. The effect of PAC dosage on the turbidity of the supernatant was minimal. As the PAC dosage increased, SV30 initially decreased and then increased, while V60 initially increased and then decreased. The flocculation effect was optimal, and the settling speed was fastest when the PAC dosage was 100 mg/L. When the PAC concentration is low, floc formation is minimal, and the settling rate is slow [27]. As the PAC concentration increases, the floc volume increases, and the settling rate accelerates. However, when the PAC dosage exceeds a certain value, excess flocculant causes “colloidal protection” [28], disrupting the equilibrium and leading to re-stabilization of particles, thereby slowing the settling rate.
(2) Iron ions (Fe3+) combine with hydroxide ions (OH) in water to form a precipitate, while hydrolysis produces iron hydroxide colloids. These colloidal particles are positively charged and interact with negatively charged suspended particles in the water, reducing charge repulsion and encouraging aggregation into larger clusters. As shown in Figure 6 and Table 5, when the FeCl3 dosage was increased from 25 mg/L to 500 mg/L, the sludge settling ratio decreased and then increased. The SV30 was the lowest and the sludge settling speed the fastest at a dosage of 100 mg/L. There was little difference in SV30 at other dosages, indicating that the optimal FeCl3 dosage under the test conditions was 100 mg/L.
(3) Aluminum ions have a strong positive charge and can react with water molecules to form hydroxide ions (OH), resulting in aluminum hydroxide precipitation. This precipitate acts as a flocculant, precipitator, and separator of impurities in water. Furthermore, the flocculation principle of aluminum sulphate also involves charge neutralization and adsorption. As shown in Figure 7 and Table 6, when the dosage of Al2(SO4)3 was increased from 25 mg/L to 500 mg/L, the SV30 gradually decreased, and the settling speed slightly improved. However, the overall difference in each index was not significant, and the optimal dosage of Al2(SO4)3 under the test conditions was determined to be 100 mg/L, based on comprehensive consideration.
(4) Anionic polyacrylamide: Firstly, through adsorption, the surface of suspended particles becomes negatively charged, causing the particles to repel each other and achieve dispersion; secondly, through the bridging effect of the macromolecular chain, the suspended particles aggregate to form larger flocs, accelerating the settling or filtration process. As shown in Figure 8 and Table 7, the dosage of APAM does not significantly influence the changes in SV30 and sludge volume after 1 h of sedimentation, and after the APAM dosage increased from 2 mg/L to 20 mg/L, the V60 slightly improved, and the SVI value tended to first increase and then decrease, but there was no significant difference in SV30, V60, and SVI values between the dosages of 2 mg/L and 20 mg/L. Considering this, the optimum dosage of APAM under the test conditions was determined to be 2 mg/L.
(5) After hydrolysis, the cationic enhancer with a positive charge causes the active group to adsorb onto the surface of the coal slurry particles. This results in the neutralization of the negative charge on the surface, the compression of the double electric layer, and a decrease in the absolute value of the potential. Consequently, the repulsive force between the particles is overcome, leading to the destabilization of the van der Waals forces. The particles aggregate into larger structures, resulting in the formation of micro-flocs. As illustrated in Figure 9 and Table 8, an increase in CPAM dosage led to a significant decrease in SV30, a gradual reduction in SVI values, a decrease in supernatant turbidity, and an improvement in the sludge settling effect. Increasing the dosage to 20 mg/L resulted in a slight decrease in SV30 compared to 10 mg/L, a slight improvement in V60, and a reduction in sludge volume after 1 h of settling. However, the SV30 only improved by 5.3% at 20 mg/L compared to 10 mg/L. Considering the cost factor, the optimal CPAM dosage under the experimental conditions was determined to be 10 mg/L.
Various flocculants improved the sludge settlement performance to varying degrees. A comparison of different flocculants at their optimal dosages in terms of sludge settlement performance indicators is provided. Table 9 shows that, at their respective optimal dosages, SV30 values for PAC, FeCl3, and CPAM were similar, and there was no significant difference in turbidity removal. However, the mixture containing CPAM demonstrated superior performance in V60, sludge volume after 1 h, and SVI compared to the other four flocculants. Therefore, CPAM was determined to be the most effective flocculant for sludge settling.

3.2. Orthogonal Test

Studies have shown [29] that the flocculant flocculation time and mixing intensity will have a certain effect on the flocculation effect. Duan et al. [13] added flocculant to treat coal mud water and found that there is a significant difference in flocculation and the sedimentation effect with changes in mixing intensity, and that a high mixing intensity will destroy the formation of flocs. Based on the single-factor test, a multi-factor and multi-level experimental study based on the mixing flocculation time and mixing intensity was carried out; 10 mg/L CPAM was added to the mud–water mixture to analyze the main factors affecting the flocculation process, and to determine the mixing flocculation operating conditions suitable for the high-concentration activated sludge process, and the parameters of the experimental design are shown in Table 10.
The orthogonal table of L16 (45) was used to carry out 16 groups of tests while parallel tests were conducted in each group, and the average value of the SVI for each group of tests and parallel tests was used as the evaluation index of the flocculation effect; the results of the tests are listed in Table 11.
As can be seen from the above table, the lowest SVI-value group was the experimental Group 12. The results of the orthogonal test were analyzed with the SVI value as the evaluation index, and the results of the mean and extreme deviation analyses are shown in Table 10, from which it can be concluded that the optimal flocculation operating condition combinations are as follows: mixing section retention time of 120 s, flocculation section hydrodynamic retention time of 20 min, mixing section stirring intensity of 1000 r min−1, Flocculation 1 stirring intensity of 120 r min−1, and Flocculation 2 stirring intensity of 60 r min−1. At 120 r min−1 and a Flocculation 2 stirring intensity of 60 r min−1, the SVI value was 73 in the supplementary tests. The degree of influence on the SVI value was as follows: mixing section stirring intensity > Flocculation 2 stirring intensity > Flocculation 1 stirring intensity > mixing section residence time > flocculation section hydraulic residence time.
Stirring intensity has a great influence on the sludge SVI value. When rapid stirring is carried out in the mixing stage, it is necessary to make the hydrolysis products of the flocculant quickly collide and adsorb with the colloids and particles in the water body, so it needs a larger stirring intensity. After entering the flocculation stage, the flocculation stirring intensity gradually decreases, and the appropriate reduction of stirring intensity after the flocculant has been fully mixed can make the floc continue to grow, which is conducive to improving the coagulation effect.
Based on the results of the orthogonal test, the optimal conditions were obtained, and the pilot test was carried out under the optimal flocculation operating conditions. The optimum flocculation operation is shown in Table 12.

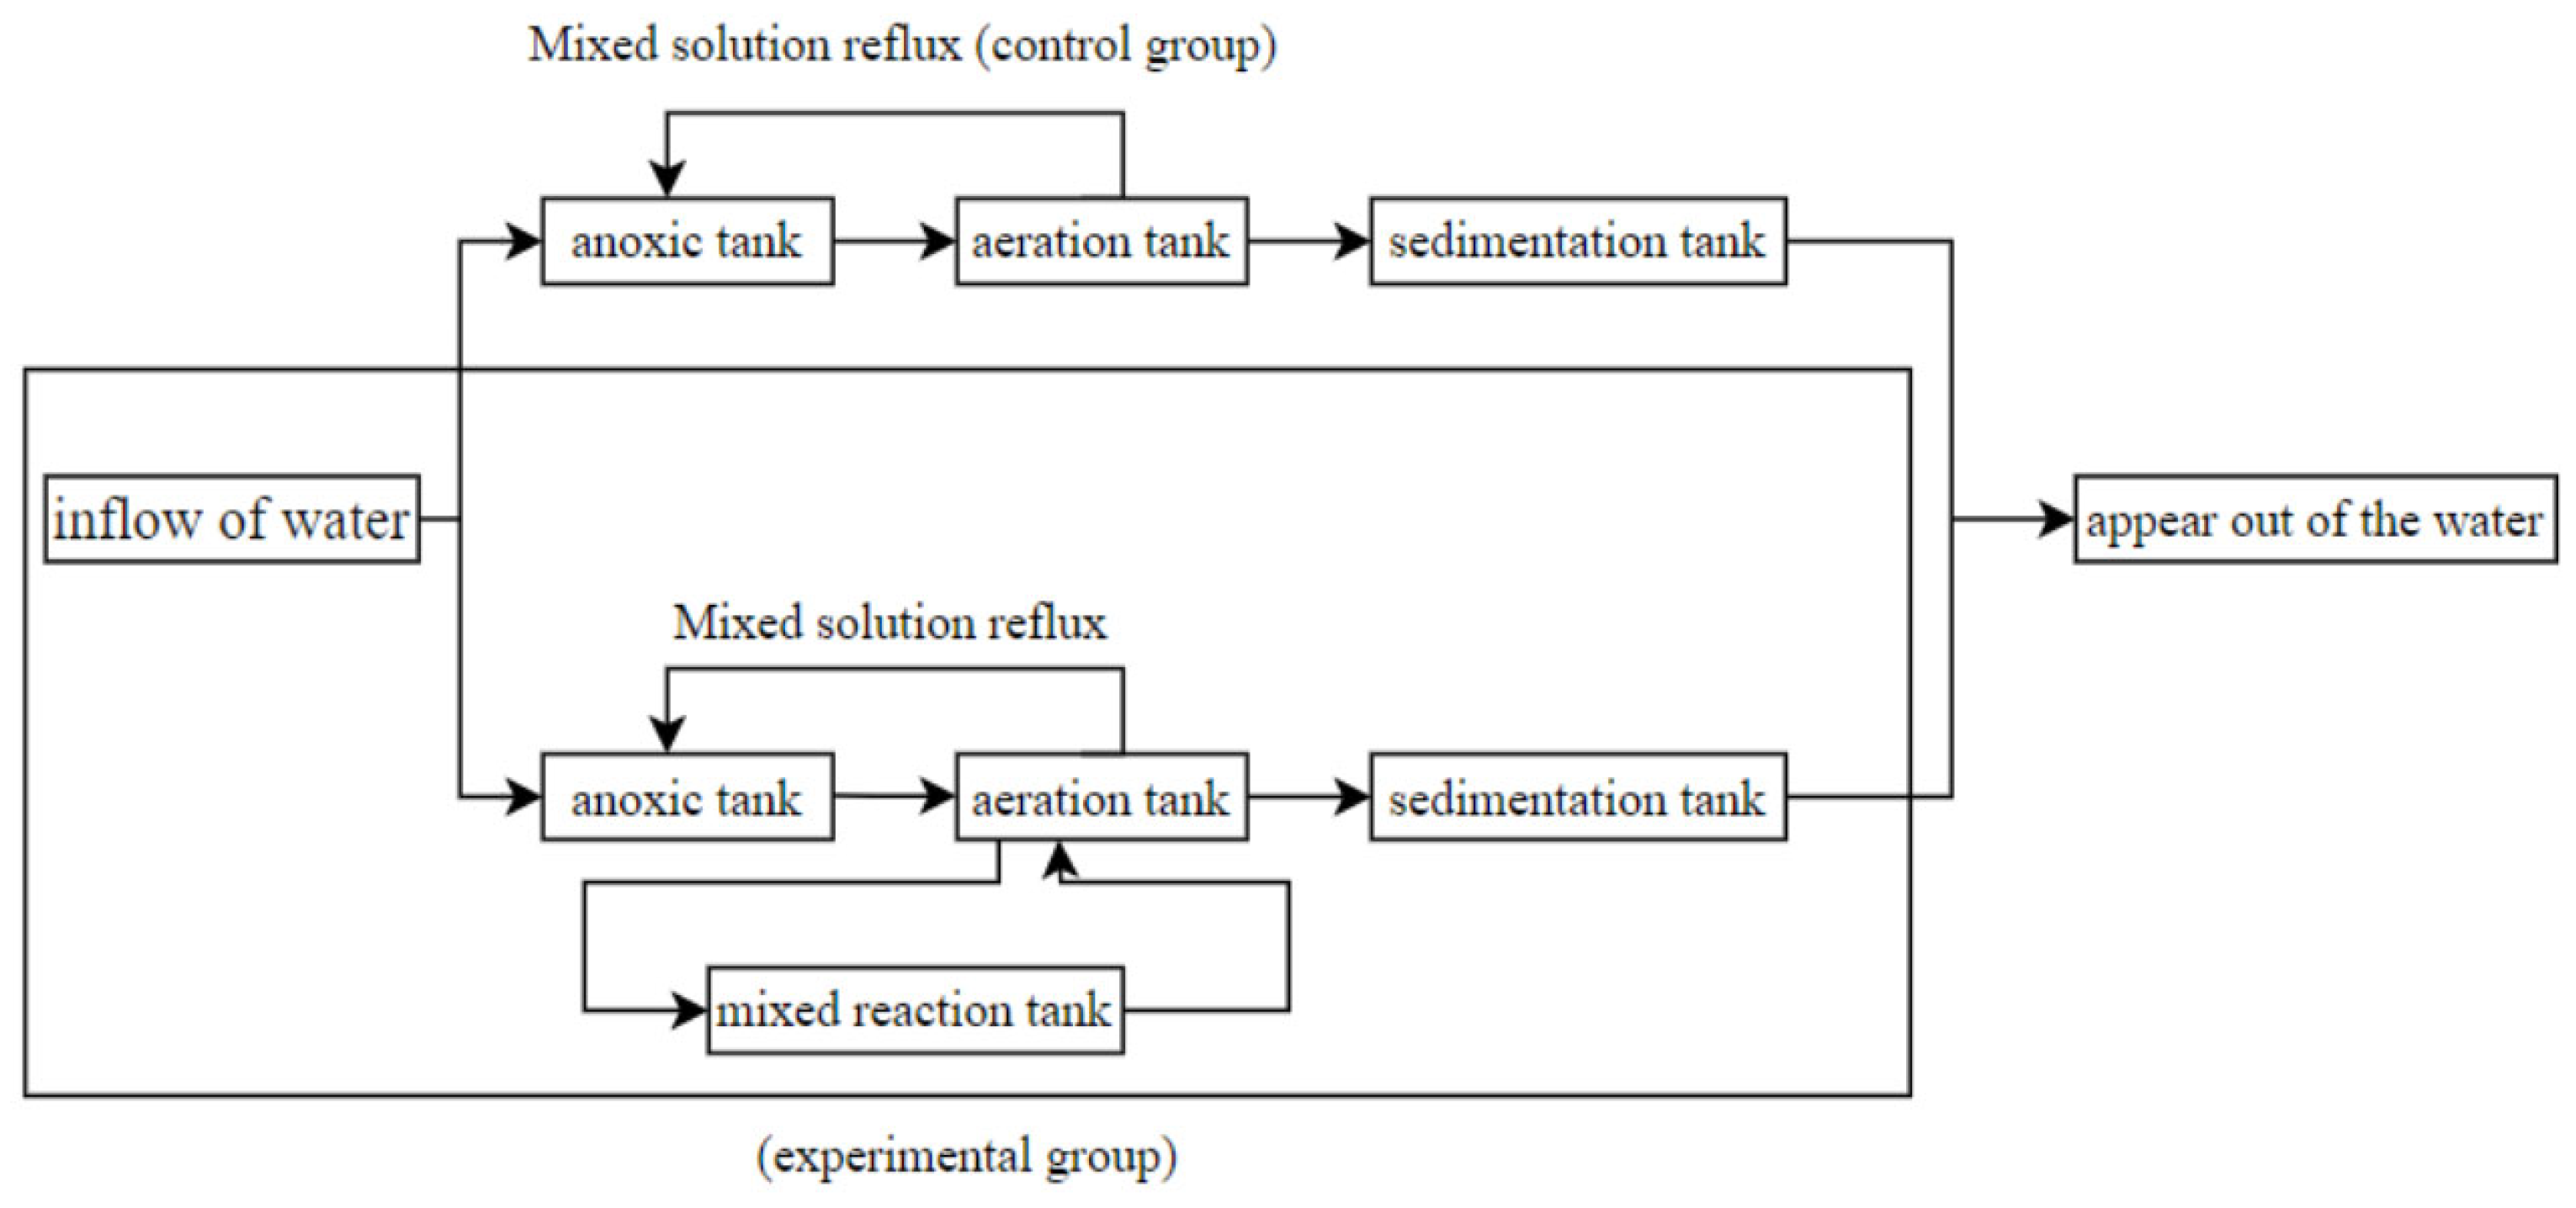
3.3. Comparative Study of Lateral Flow High-Concentration Method and Conventional Activated Sludge Method

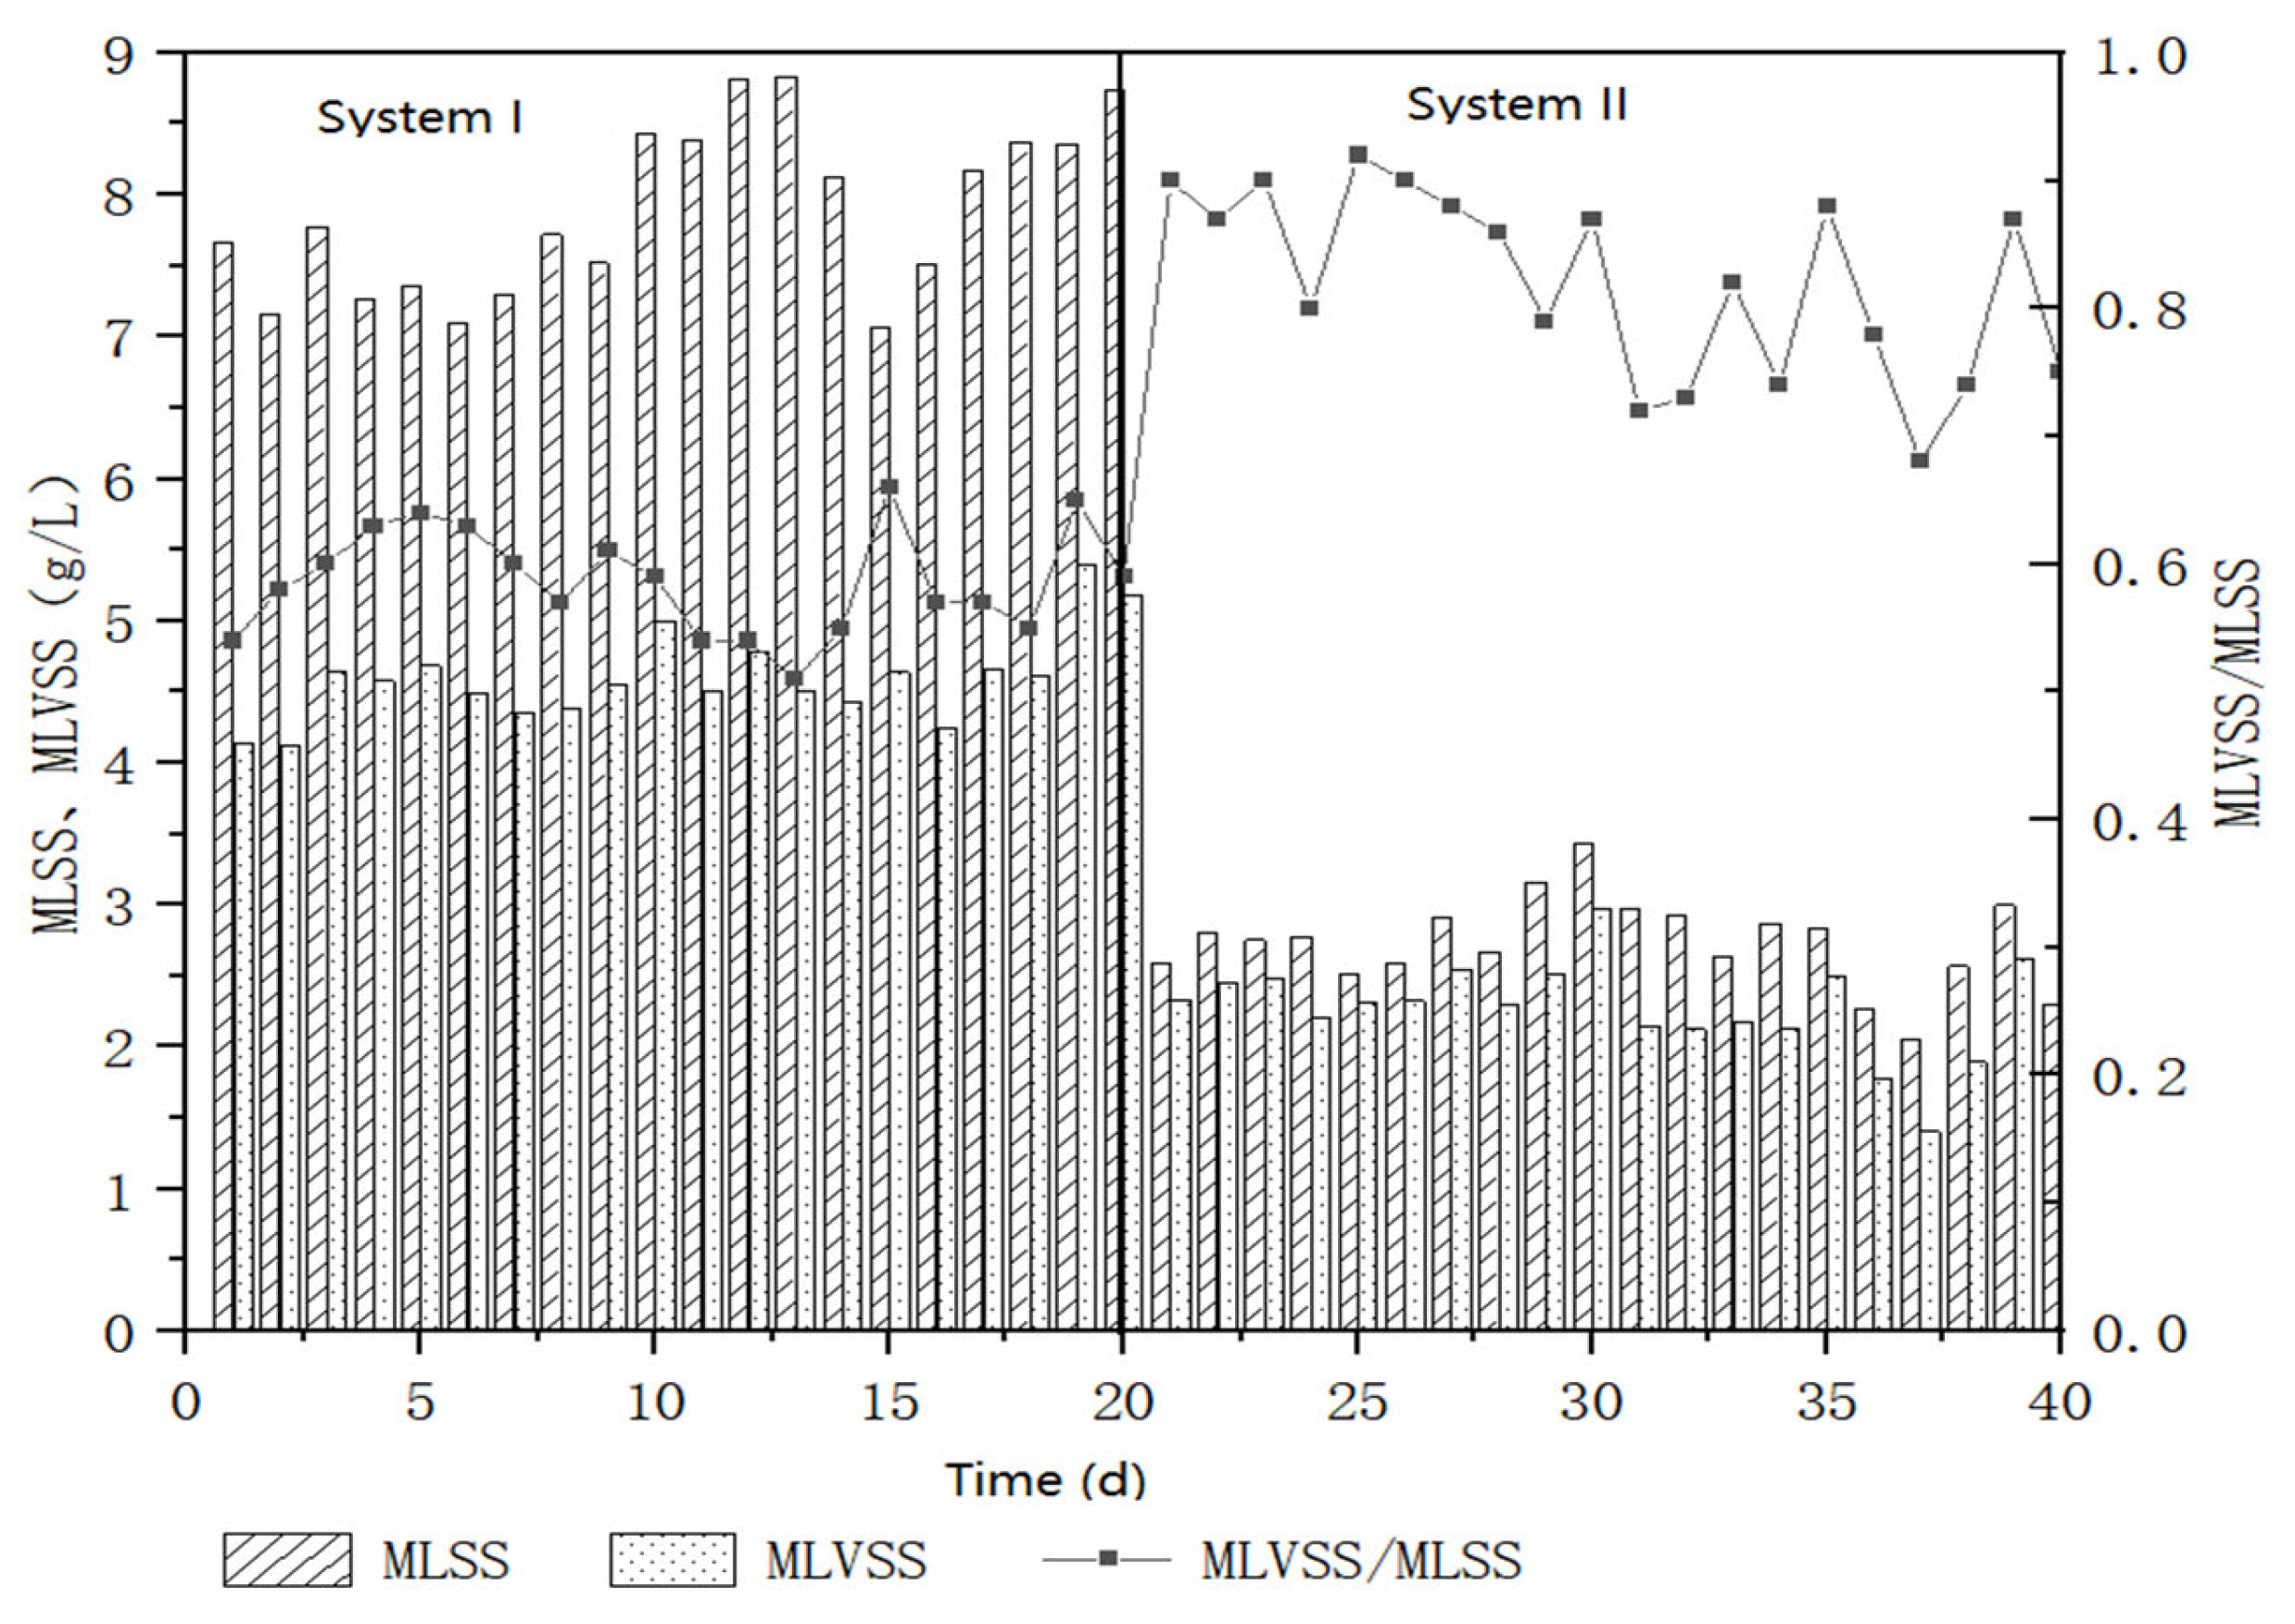
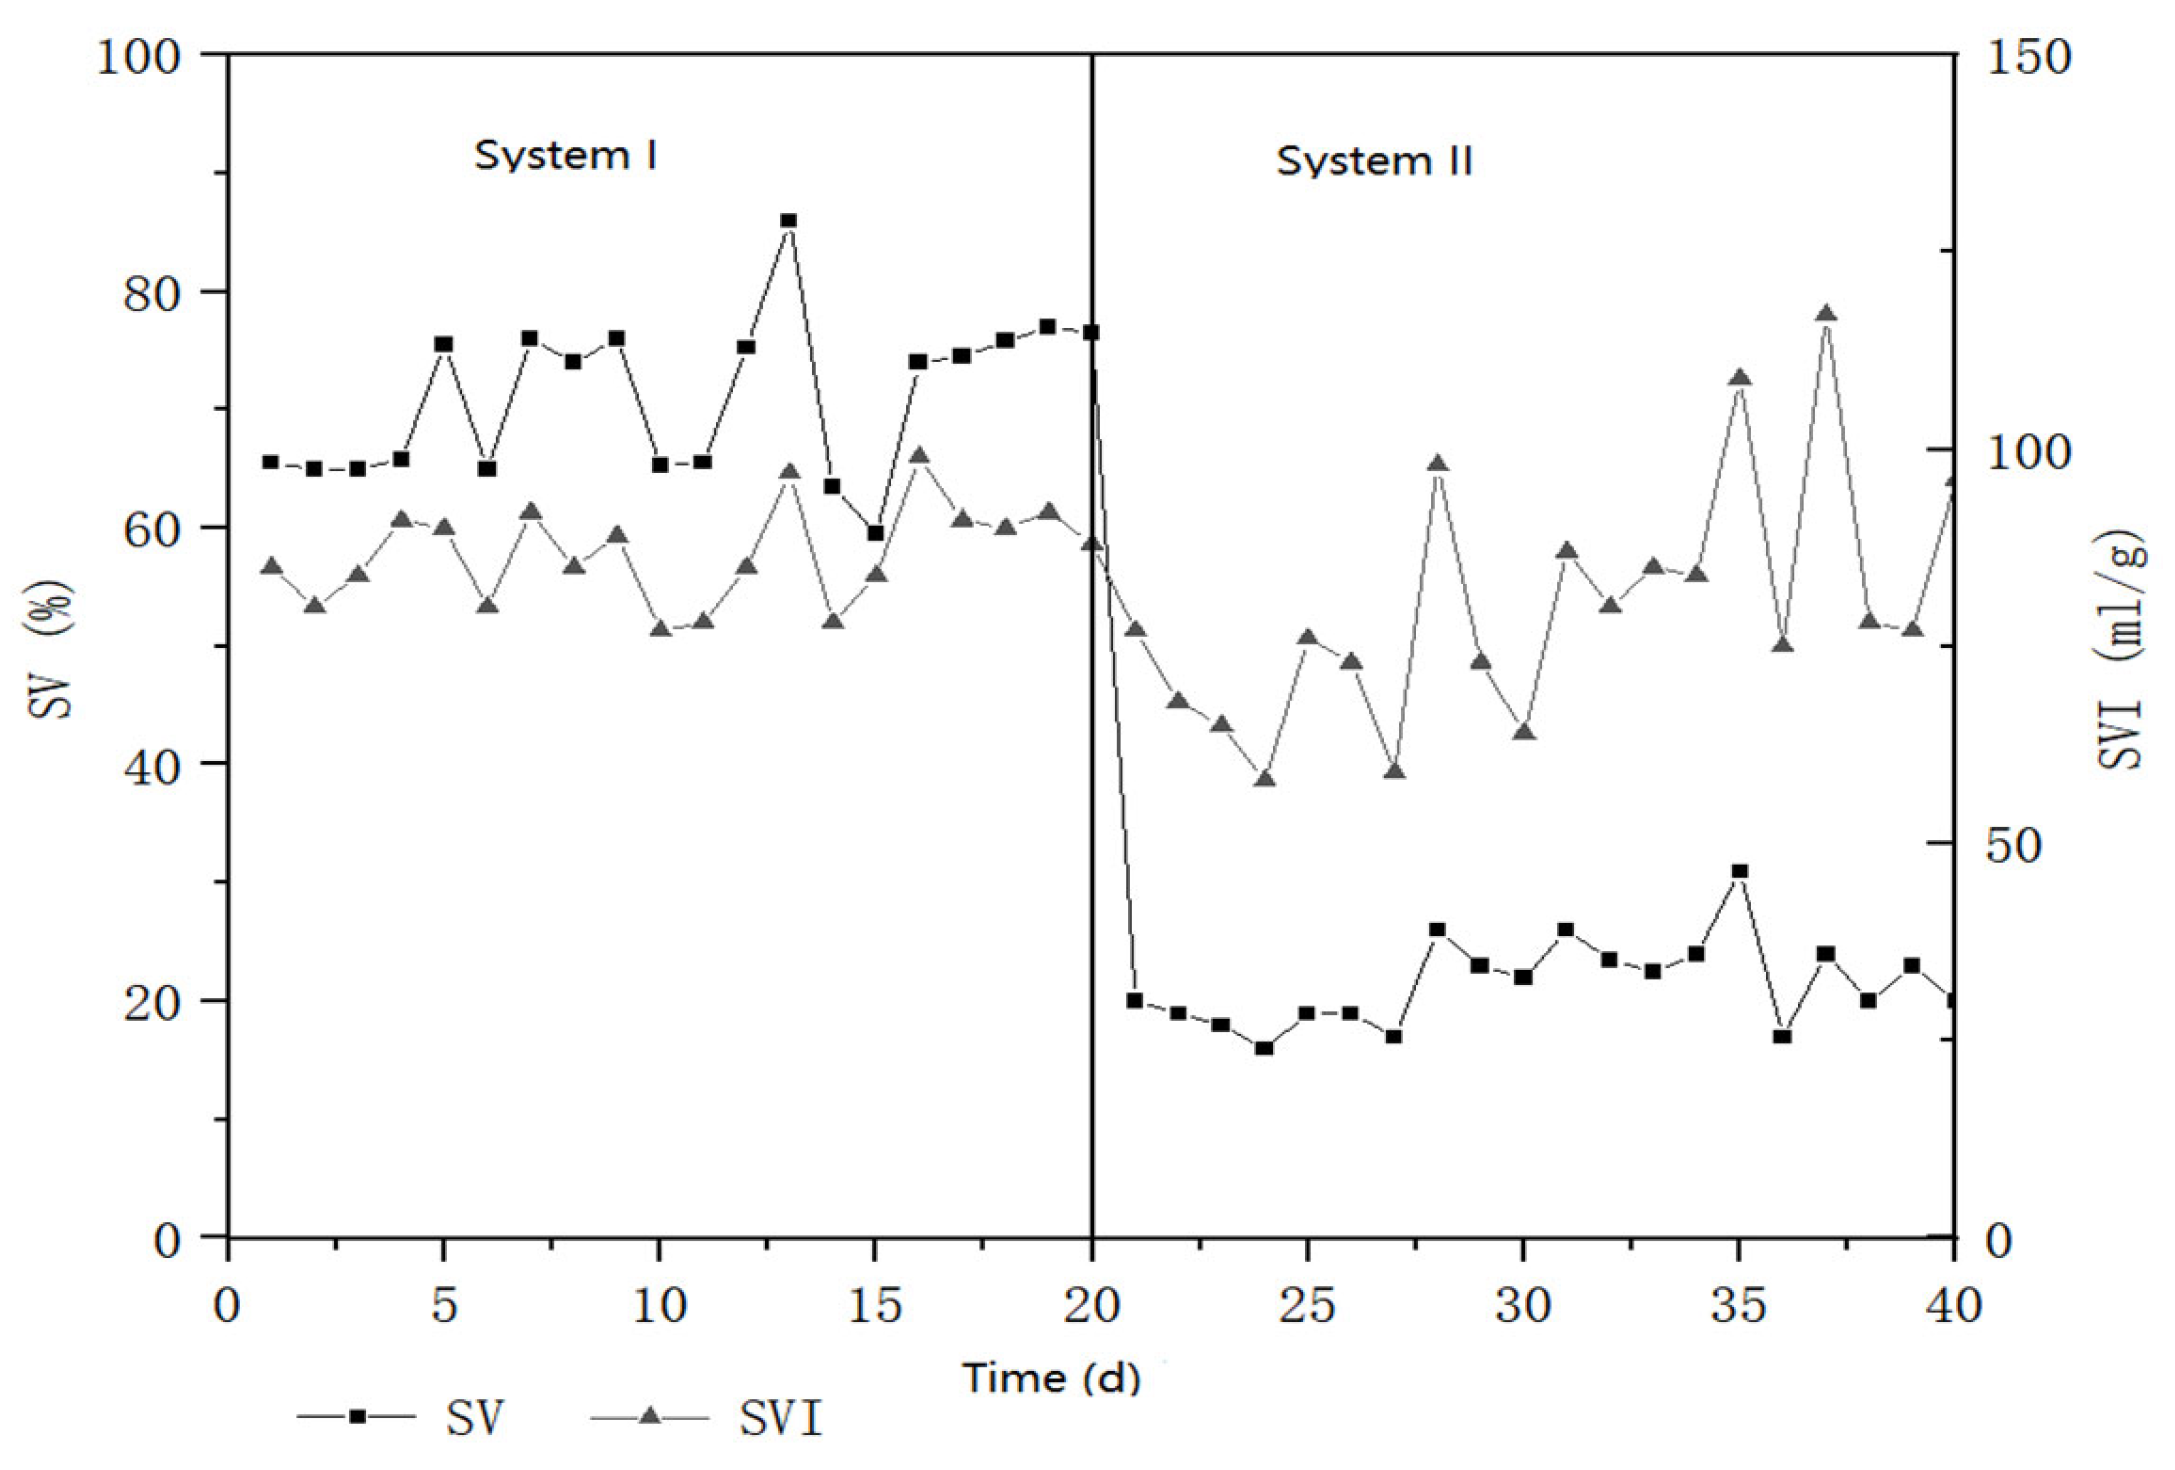
3.3.1. Comparison of Sludge Concentration and Settling Performance

The sludge concentrations of the two systems are shown in Figure 10. The activated sludge concentration in the aeration basin of System I fluctuated between 7062 and 8838 mg/L, with an average concentration of 7885 mg/L and an MLVSS/MLSS fluctuating between 0.51 and 0.66; the activated sludge concentration in the aeration basin of System II fluctuated between 2050 and 3428 mg/L, with an average concentration of 2730 mg/L; the MLVSS/MLSS fluctuated between 0.68 and 0.92.
The sludge concentration in the aeration basins of both systems fluctuated somewhat, with a general upward trend. For the MLVSS/MLSS value, the MLVSS/MLSS value of system I was low, but the sludge activity was still good; compared with system I, the MLVSS/MLSS value of system II was higher, the inorganic components in the activated sludge accounted for a lower percentage, and the sludge activity was good.
The sludge settling ratios and sludge indices of the two systems are shown in Figure 11. SV30 fluctuated between 59.5% and 86% and SVI fluctuated between 77 and 104 for System I, while SV30 fluctuated between 16% and 31% and SVI fluctuated between 58 and 117 for System II. The SV30 of System I, which was the high sludge concentration system, was significantly higher than that of System II, which is the conventional activated sludge system, and the sludge settling ratio increased as the sludge concentration rose, so the SV30 of System I was on the high side and the value of the SVI was slightly higher.

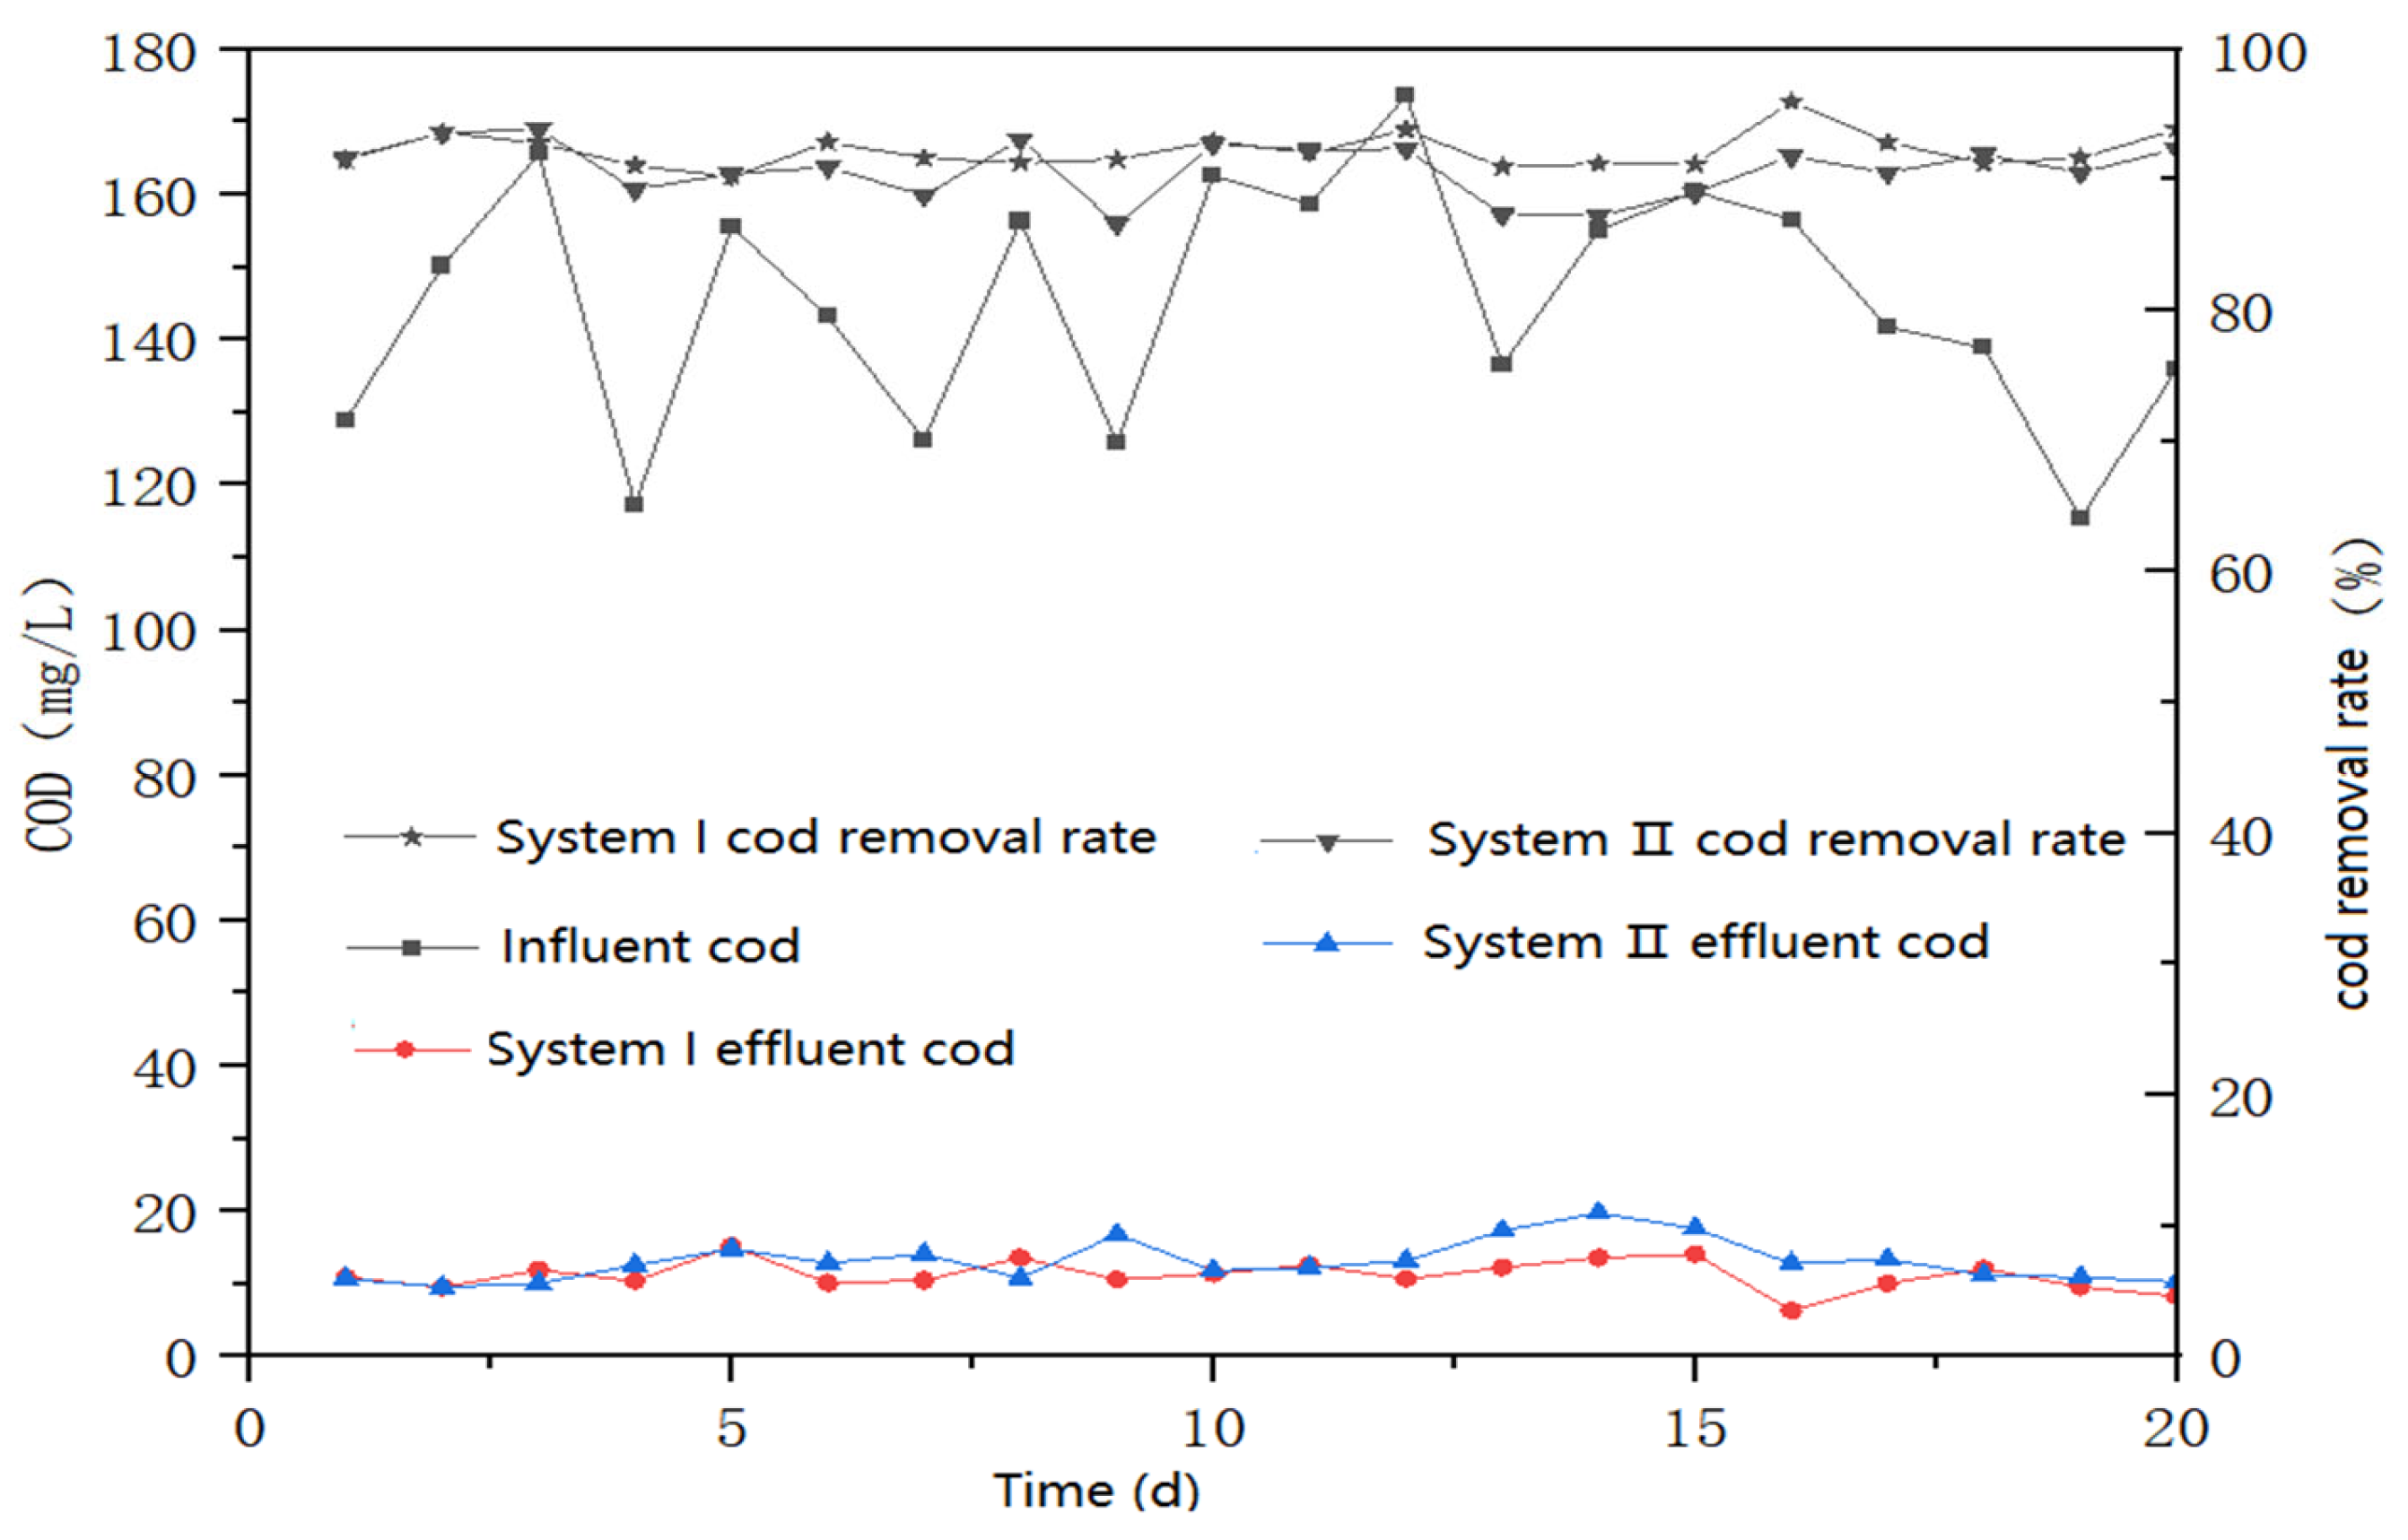
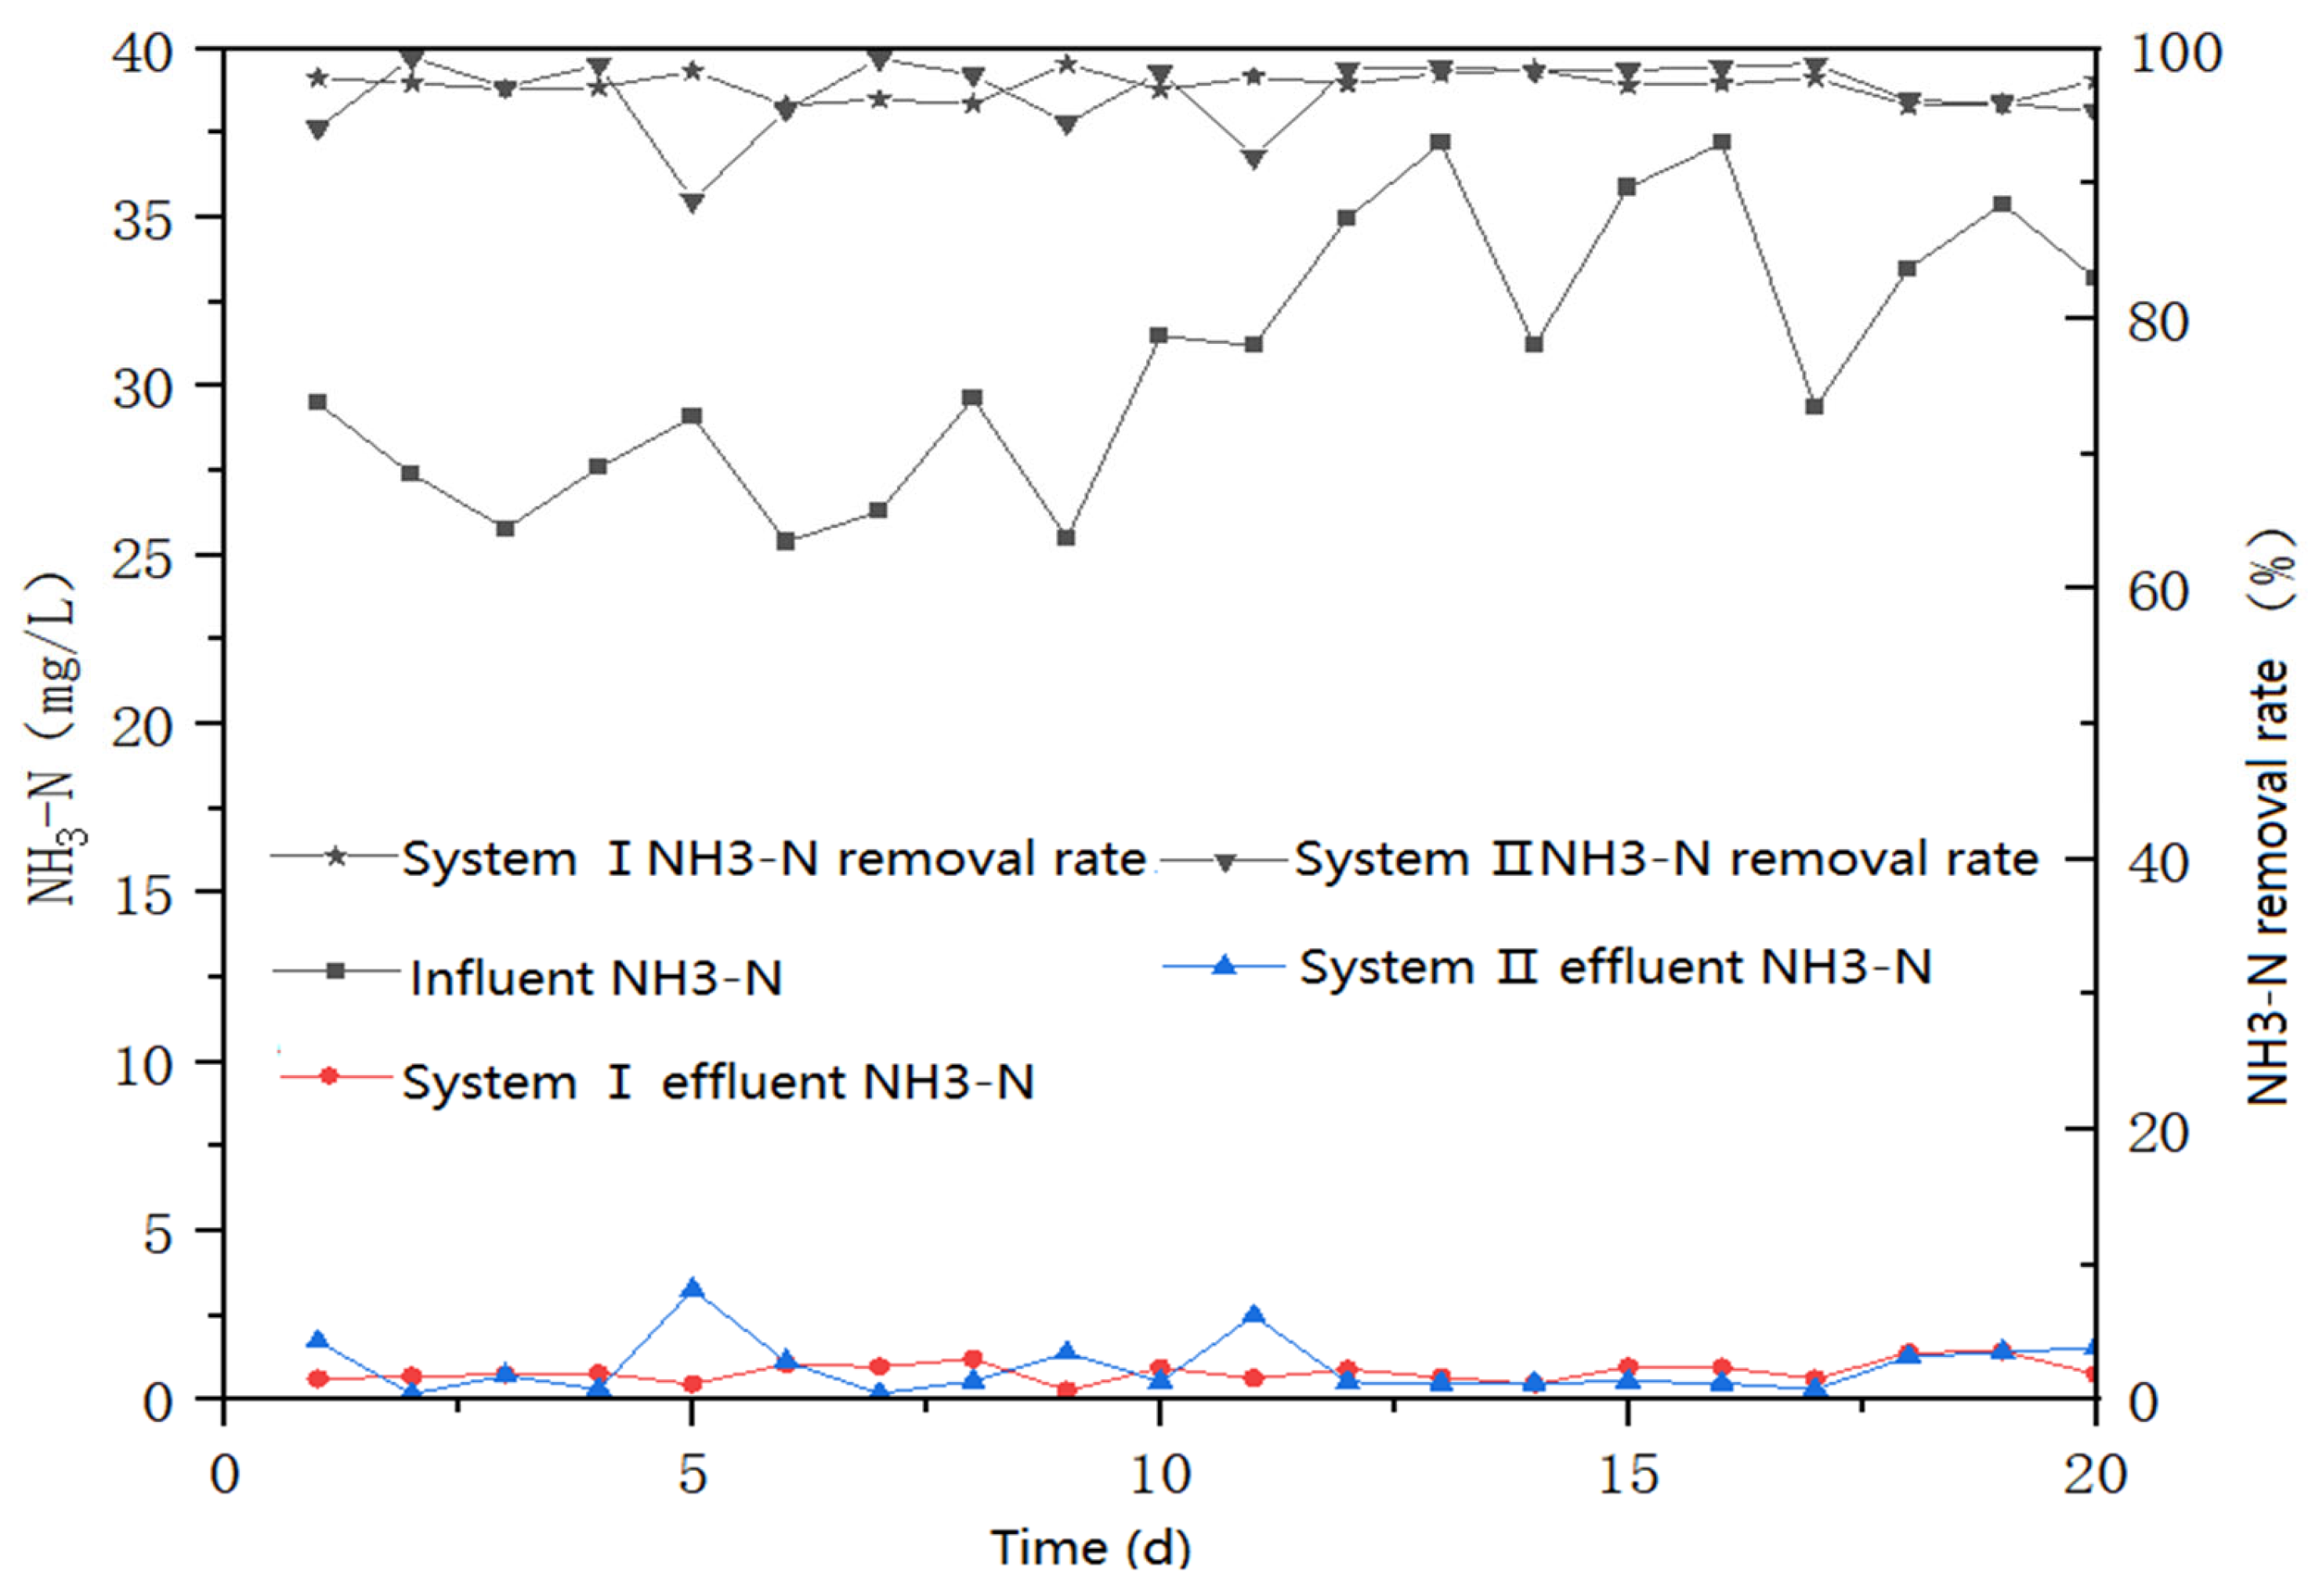
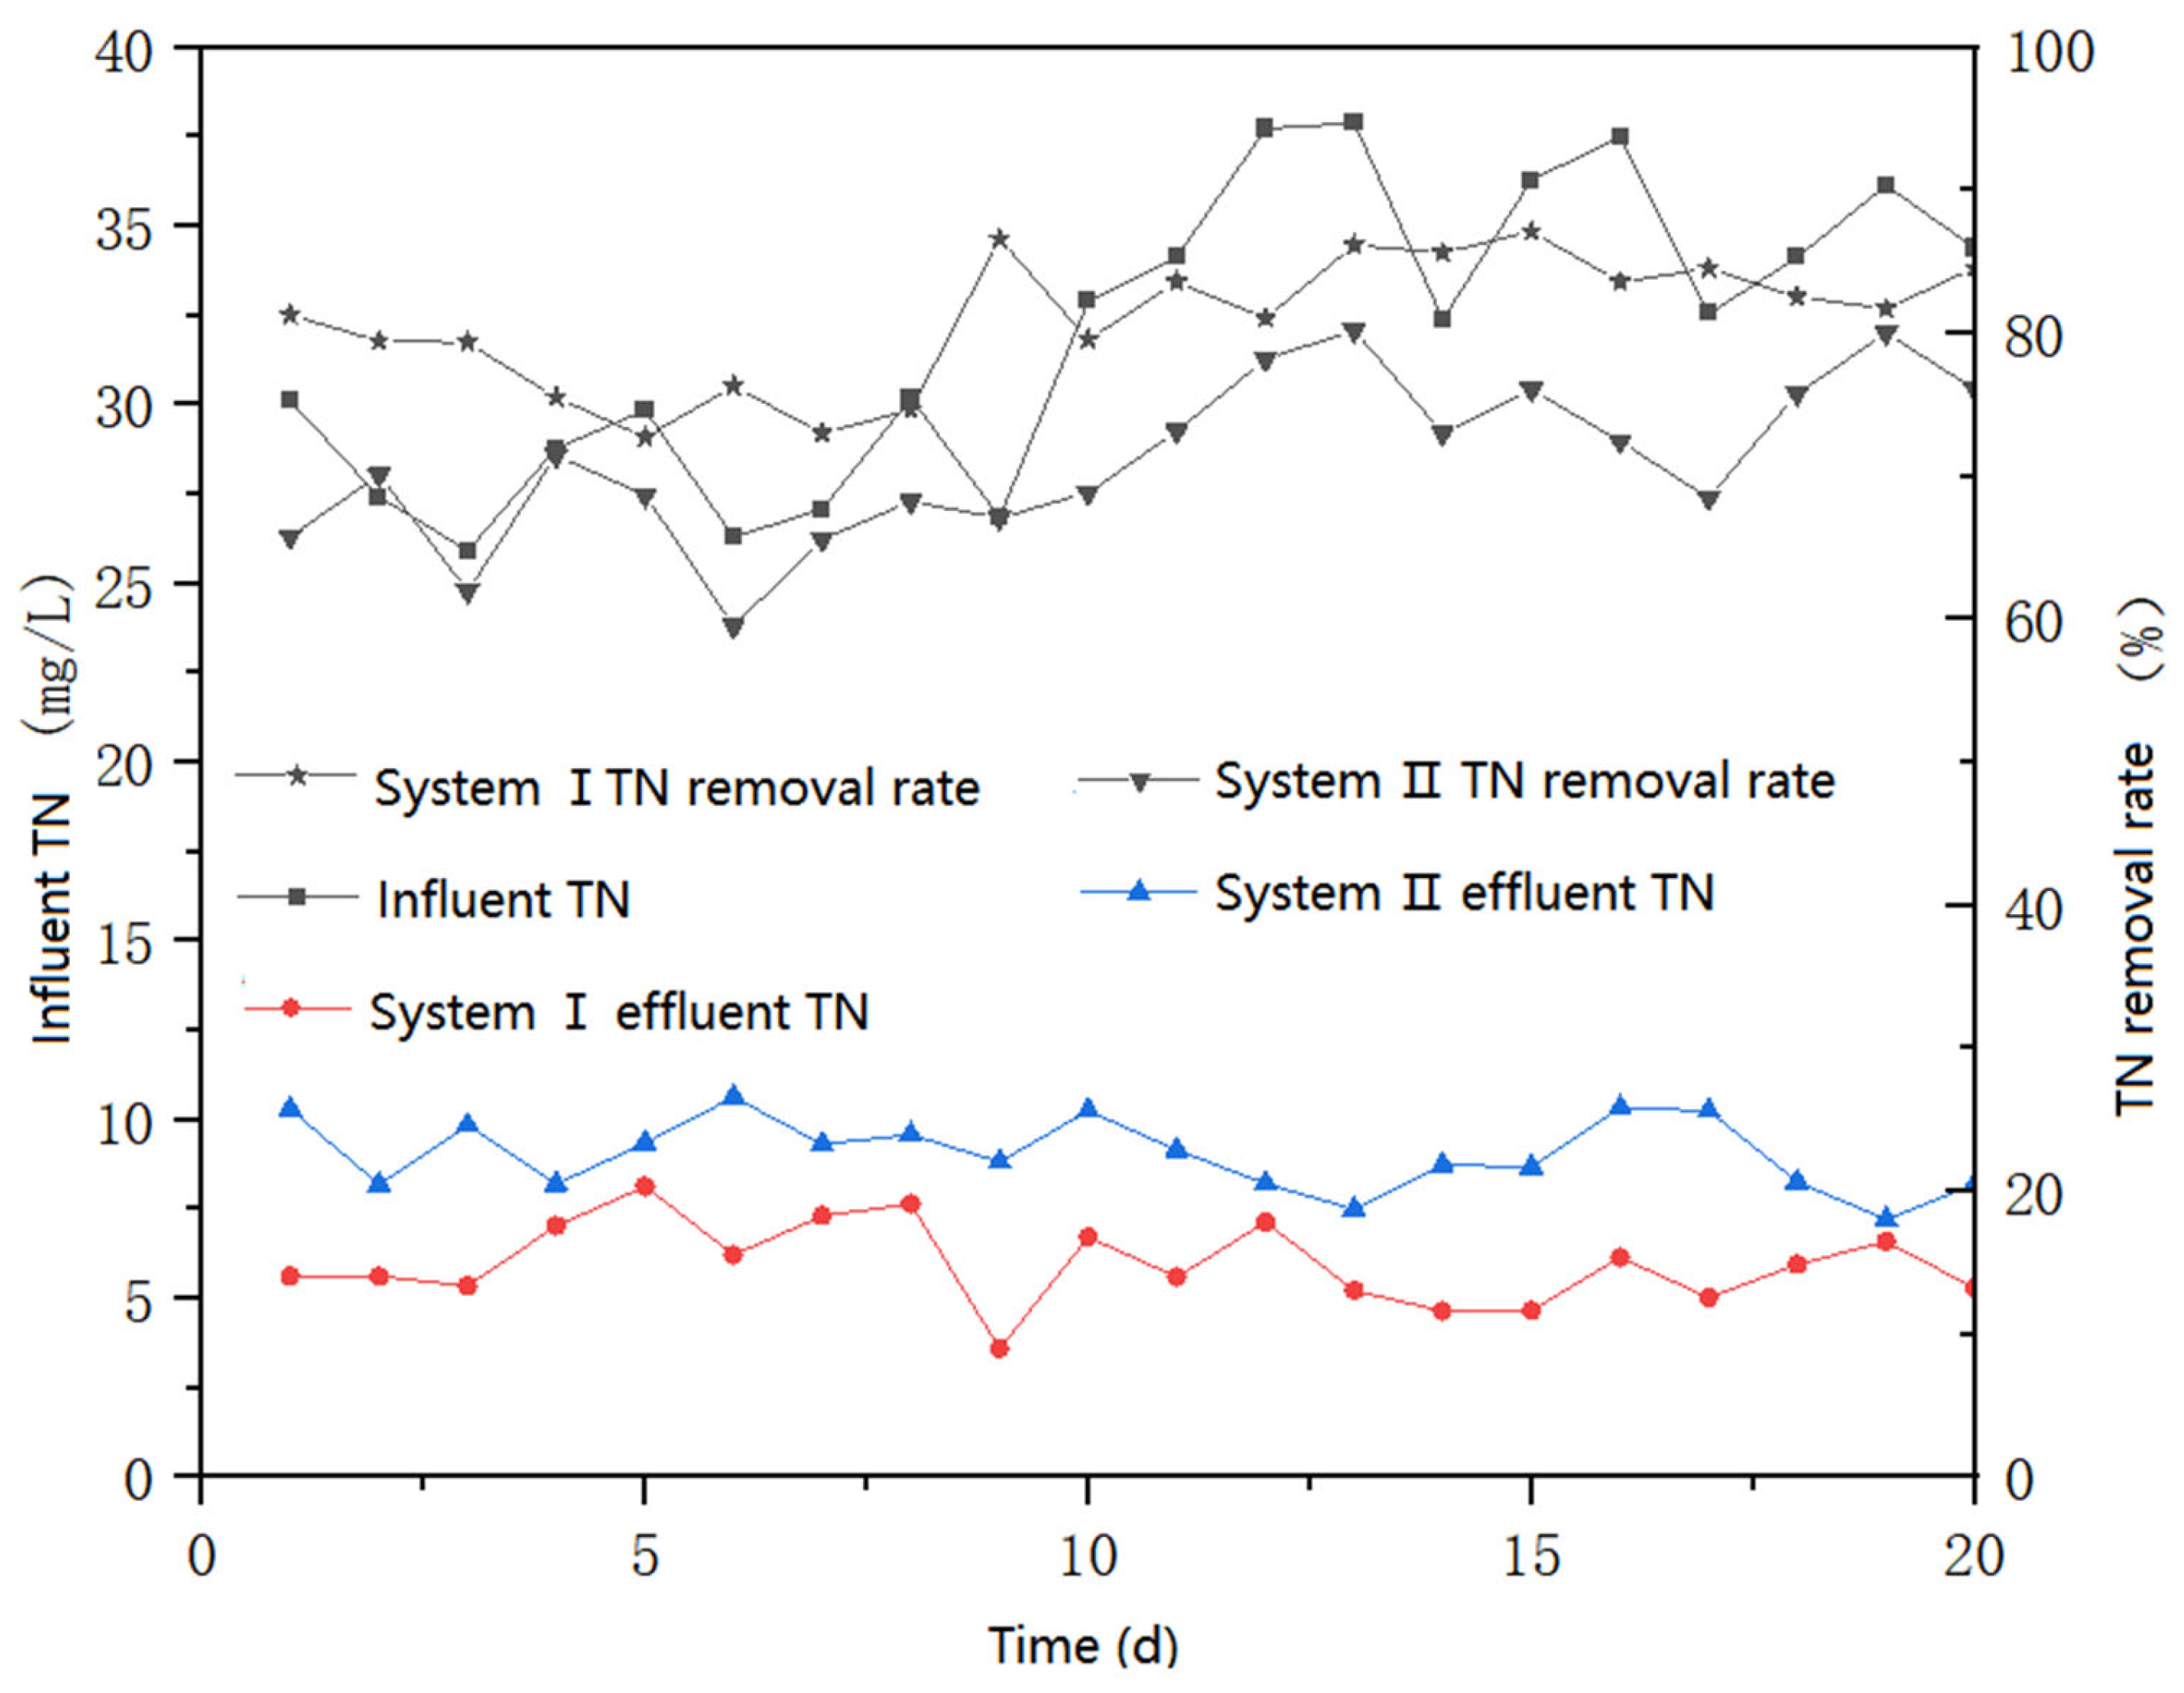
3.3.2. Comparison of Pollutant Removal Effect

The COD removal results of the two systems are shown in Figure 12. The COD influence concentration fluctuated between 115.30 and 173.60 mg/L, and the average influent concentration was 145.22 mg/L. The average COD effluent from System I was 11.19 mg/L, with an average removal rate of 92.24%, and the average COD effluent from System II was 13.14 mg/L, with an average removal rate of 90.85%.
The removal effect of COD in System I was better than that in System II, but the COD effluent from both systems met the standard of quasi-IV (<30 mg/L). In the high-concentration activated sludge system, the total amount of microorganisms was higher, the sludge load of the system was low, the suspended sludge was free in the wastewater—being able to fully remove the organic matter in the wastewater—and the COD removal rate of the system was higher.
The ammonia nitrogen removal effects of the two systems are shown in Figure 13. The ammonia nitrogen influent concentration fluctuated between 25.4 and 37.2 mg/L, with an average influent concentration of 30.85 mg/L. The average value of ammonia nitrogen in the effluent of System I was 0.84 mg/L, with an average removal rate of 97.28%, and the average value of ammonia nitrogen in the effluent of System II was 0.98 mg/L, with an average removal rate of 96.75%.
System I was relatively stable for ammonia nitrogen removal, and System II was less stable for ammonia nitrogen removal; the effluent of Stage I met the standard of quasi-IV (<1.5 mg/L). Compared with the traditional activated sludge method, the high-concentration method had a better effect on ammonia nitrogen removal, which may be due to the high concentration of sludge in the system, with high numbers of microorganisms and nitrifying bacteria; under appropriate conditions of dissolved oxygen, nitrifying bacteria can make full use of dissolved oxygen in the sewage to improve its activity so that the system has a higher effect on the removal of ammonia nitrogen.
The total nitrogen removal effect of the two systems is shown in Figure 14. The total nitrogen influent concentration fluctuated between 25.93 and 37.90 mg/L, and the average influent concentration was 31.94 mg/L. The average value of total nitrogen in the effluent of System I was 5.98 mg/L and the average removal rate was 80.97%; the average value of total nitrogen in the effluent of System II was 9.05 mg/L and the average removal rate was 71.06%.
The removal rate of TN by the high-concentration activated sludge process was nearly 10% higher than that of the traditional activated sludge process. To analyze the reasons for this, nitrogen was removed by denitrification, the total number of microorganisms in the aeration tank of high-concentration activated sludge process was kept high, the number of denitrifying bacteria was also kept relatively high, and denitrification was carried out more completely; it is possible that simultaneous nitrification and denitrification occurred under the conditions of a high sludge concentration and low levels of dissolved oxygen [30].

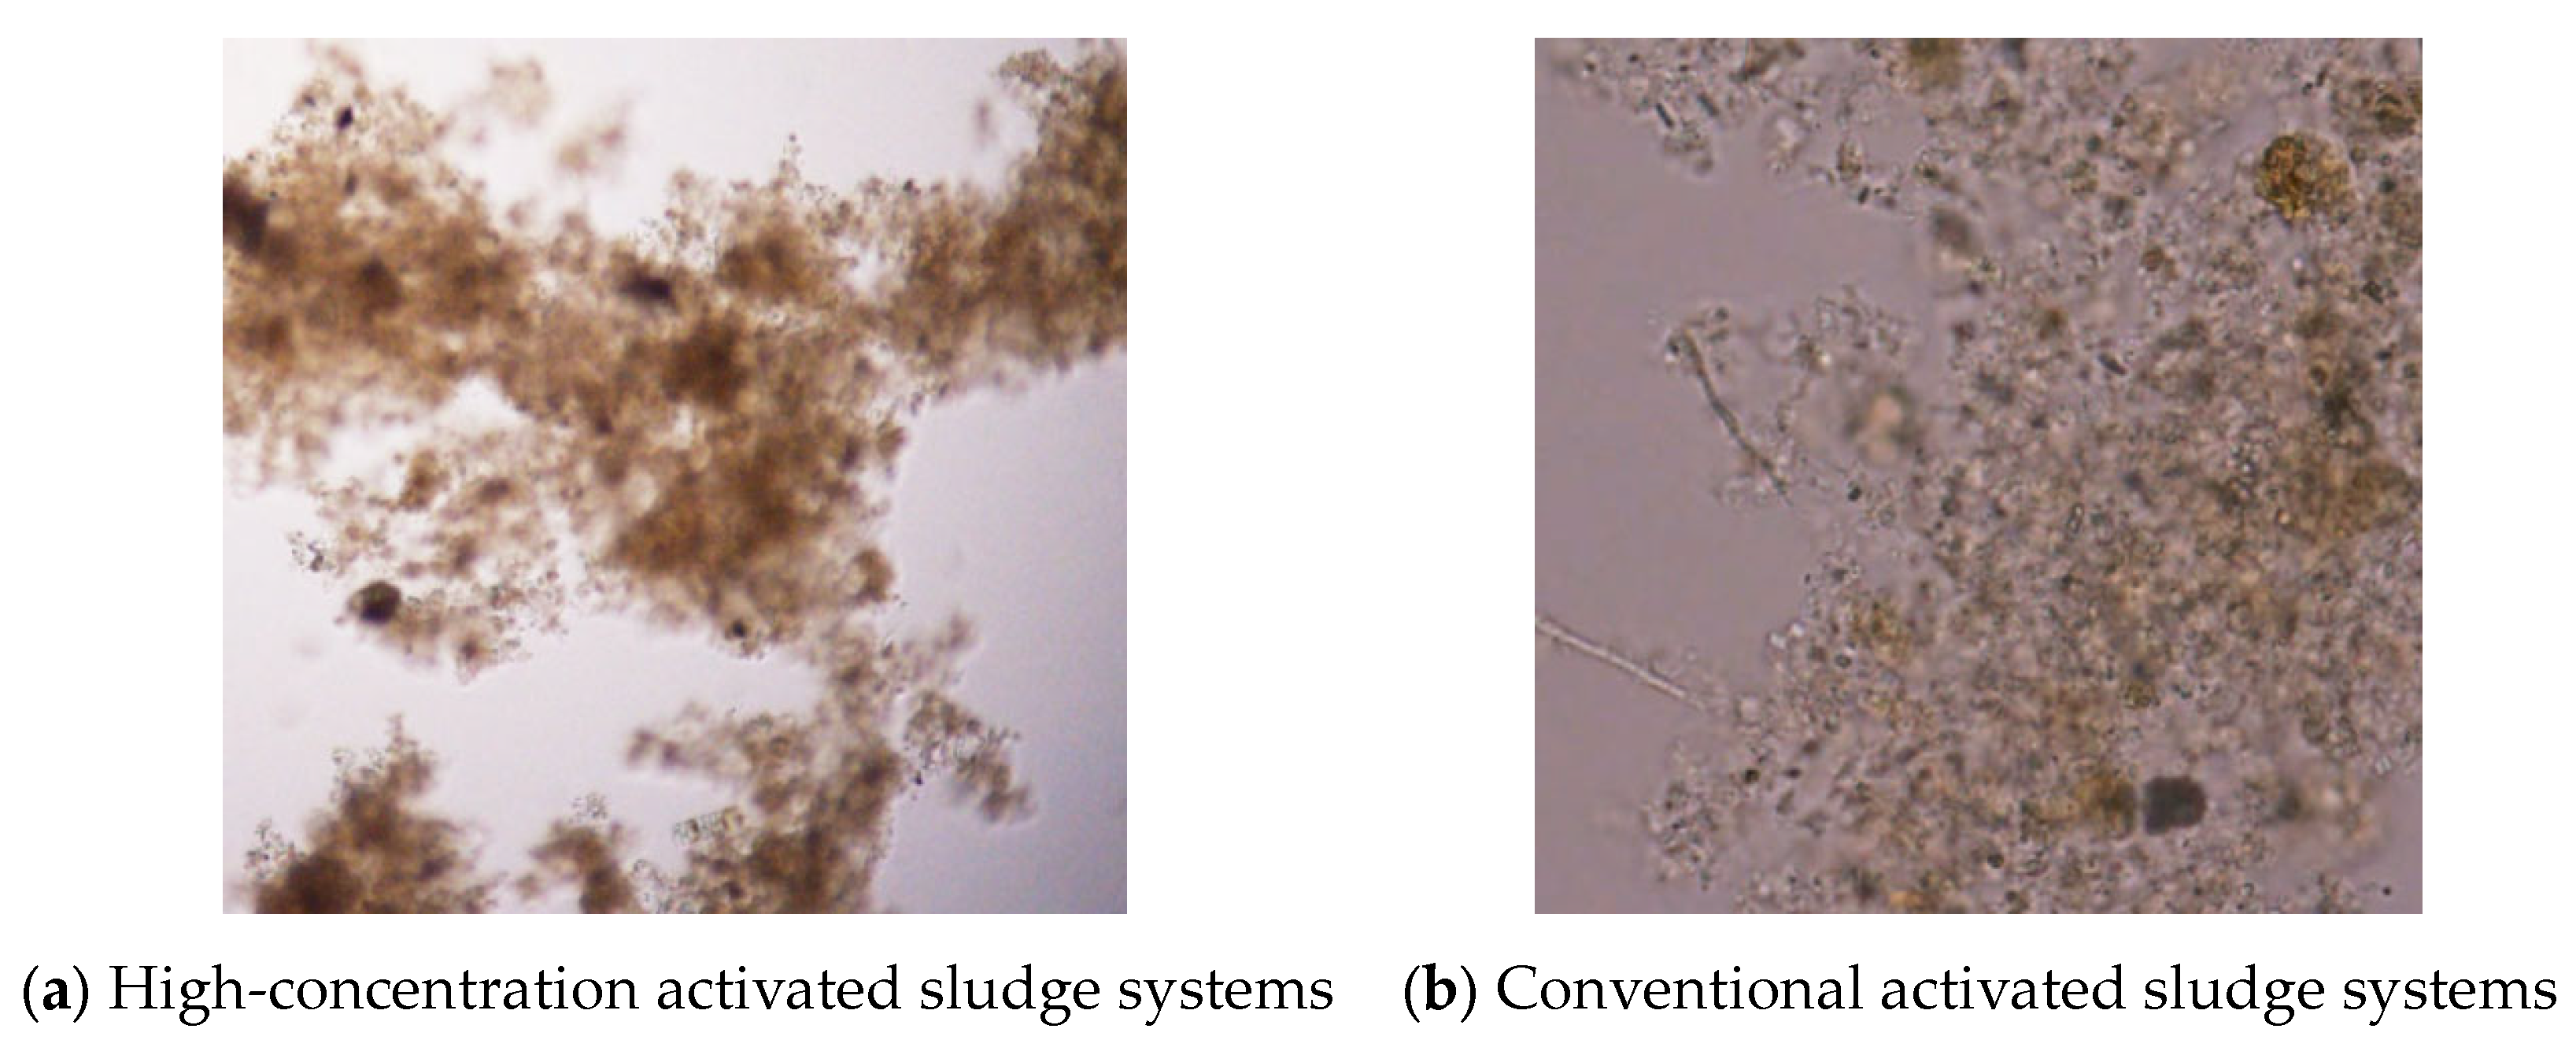
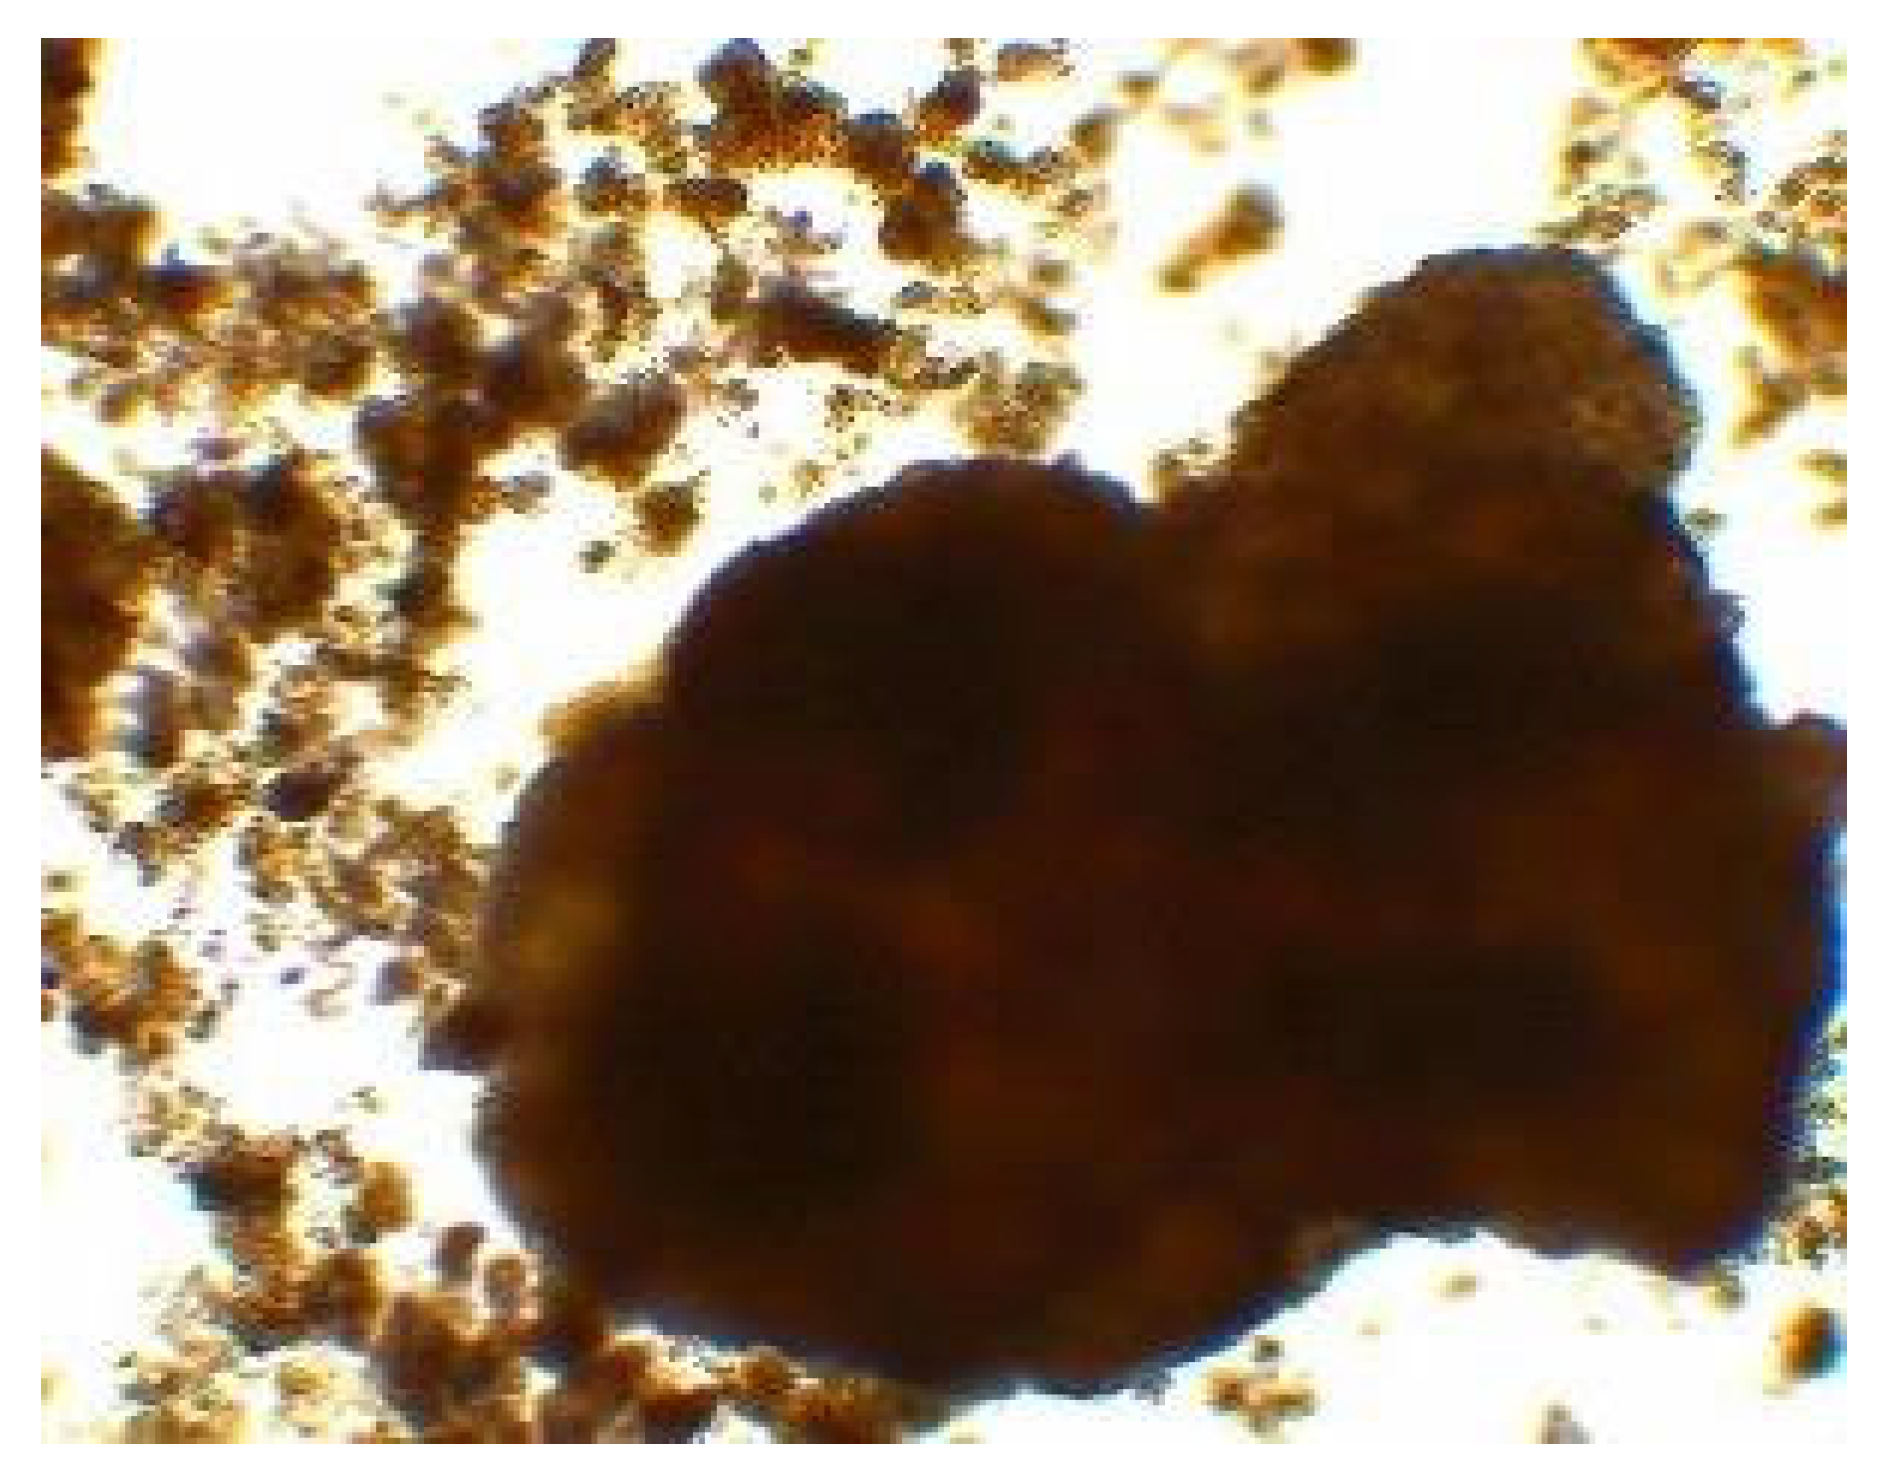
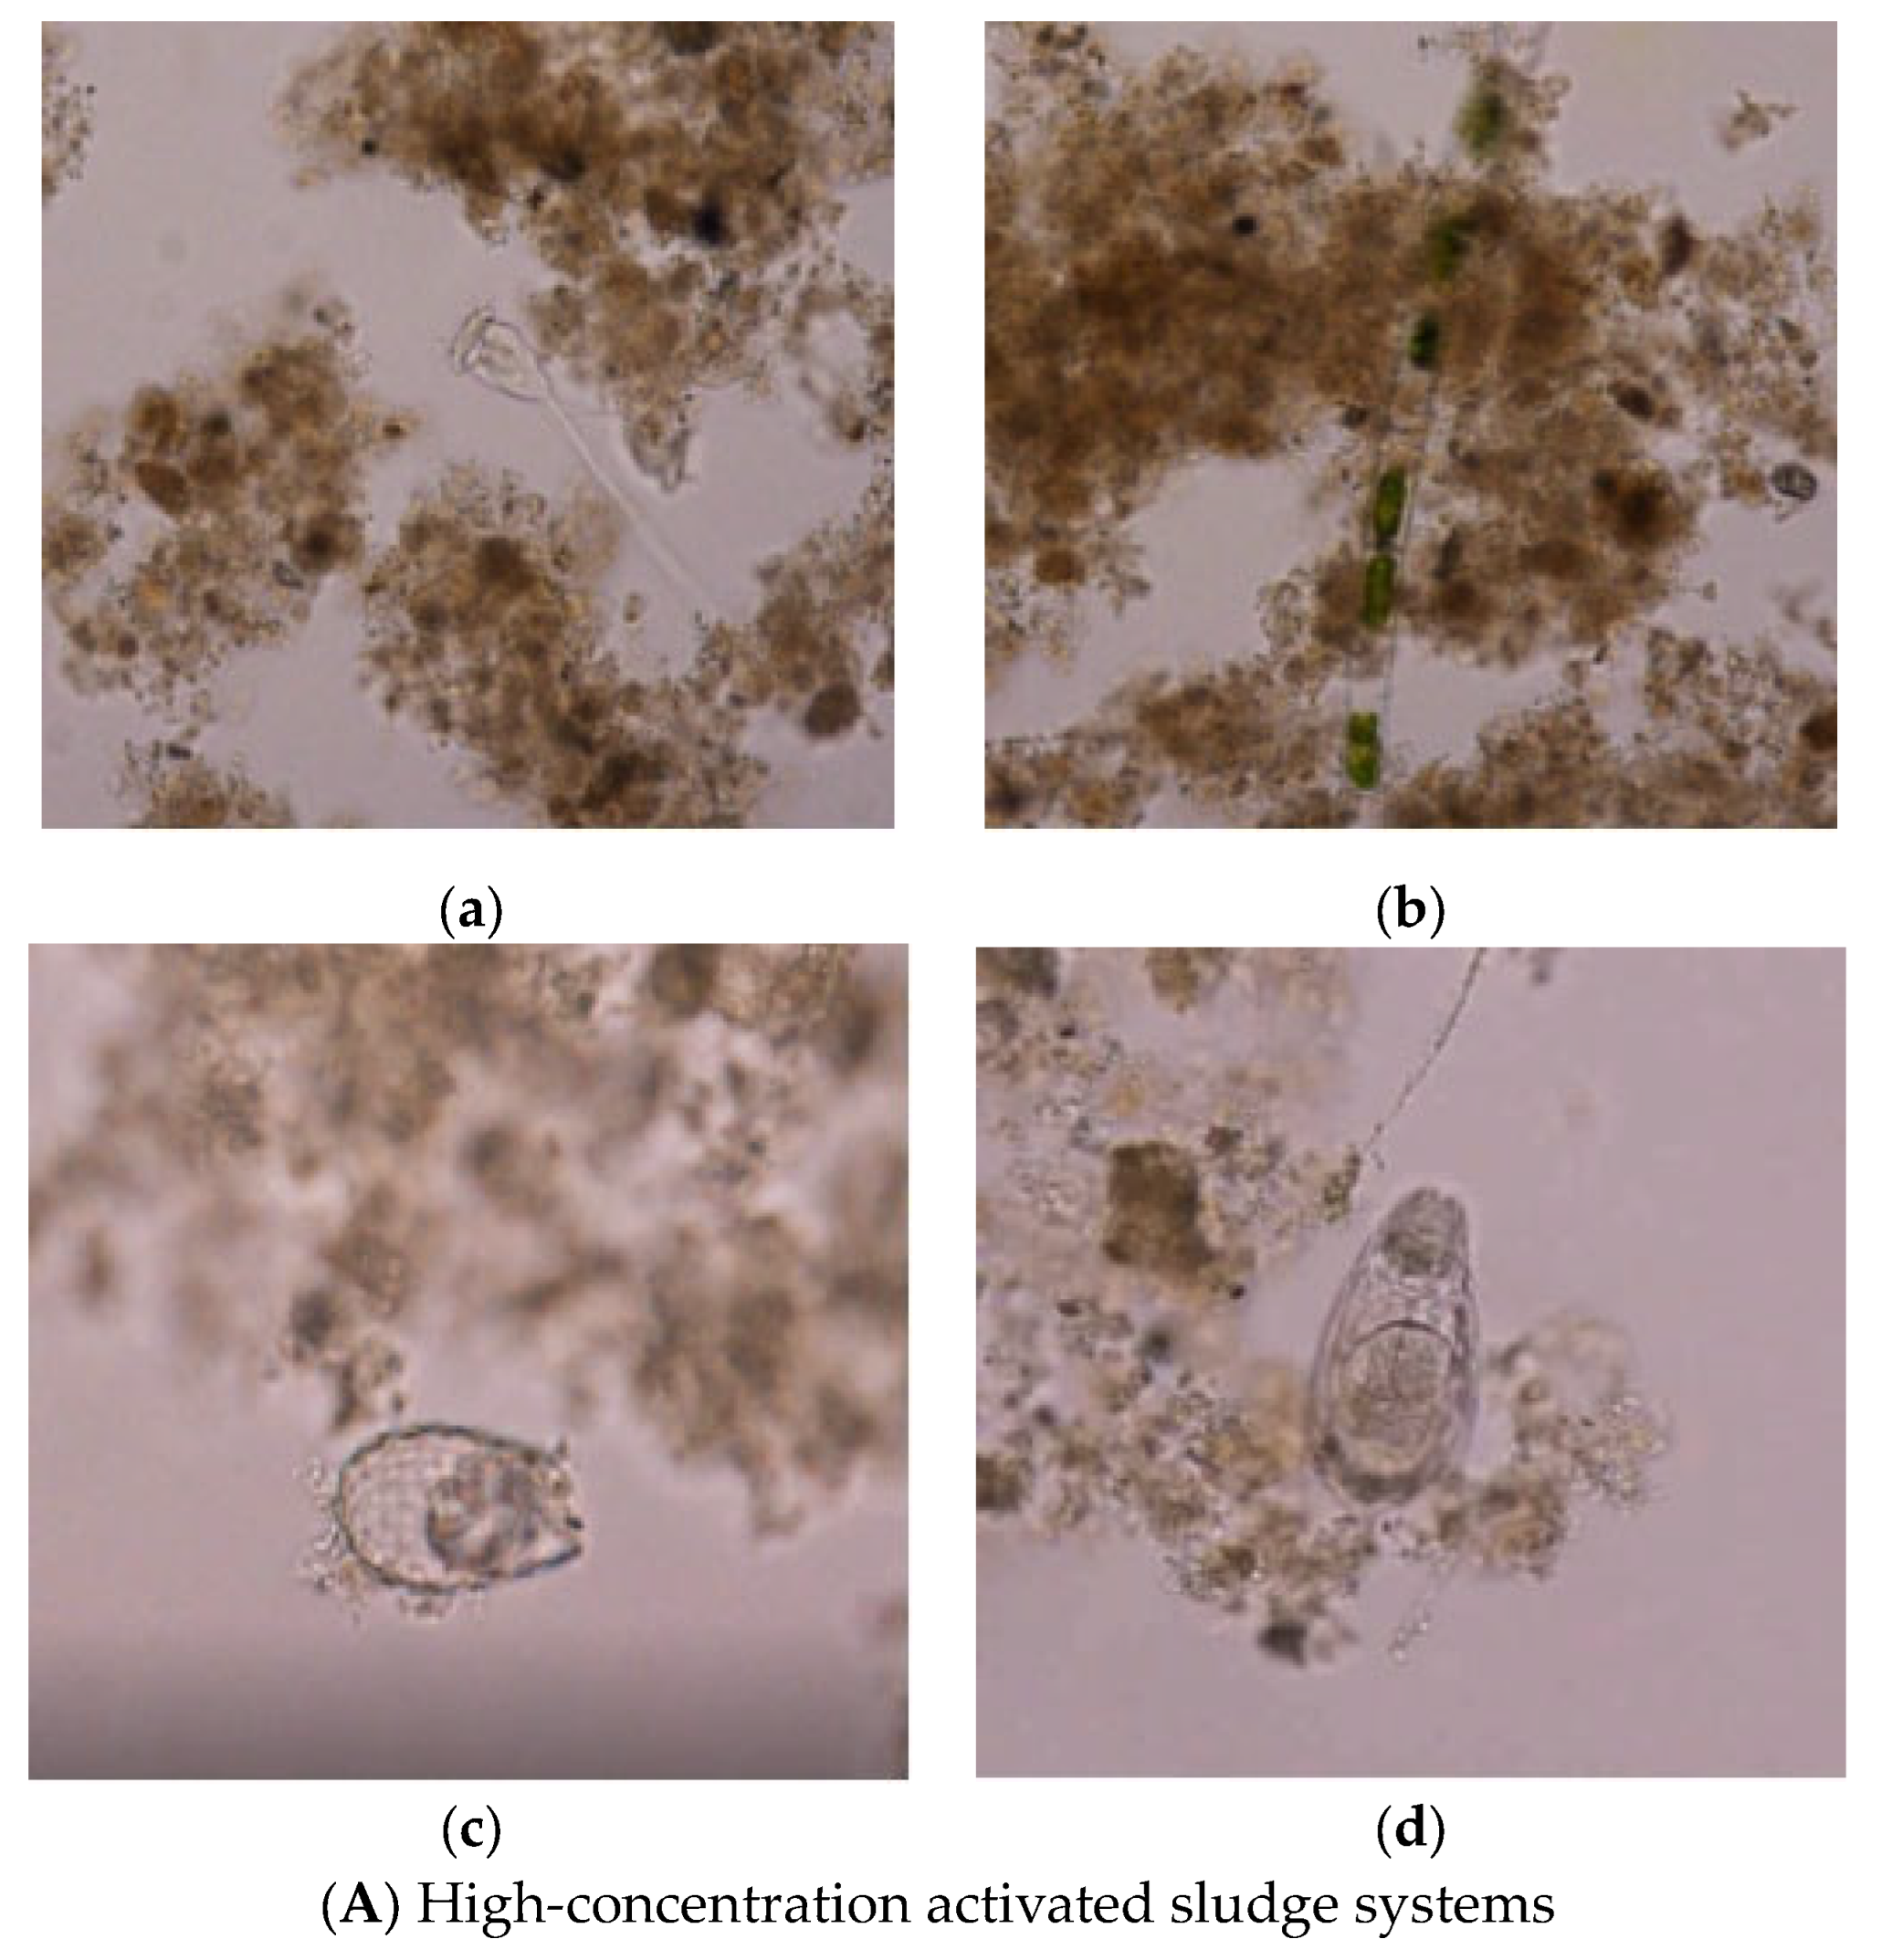
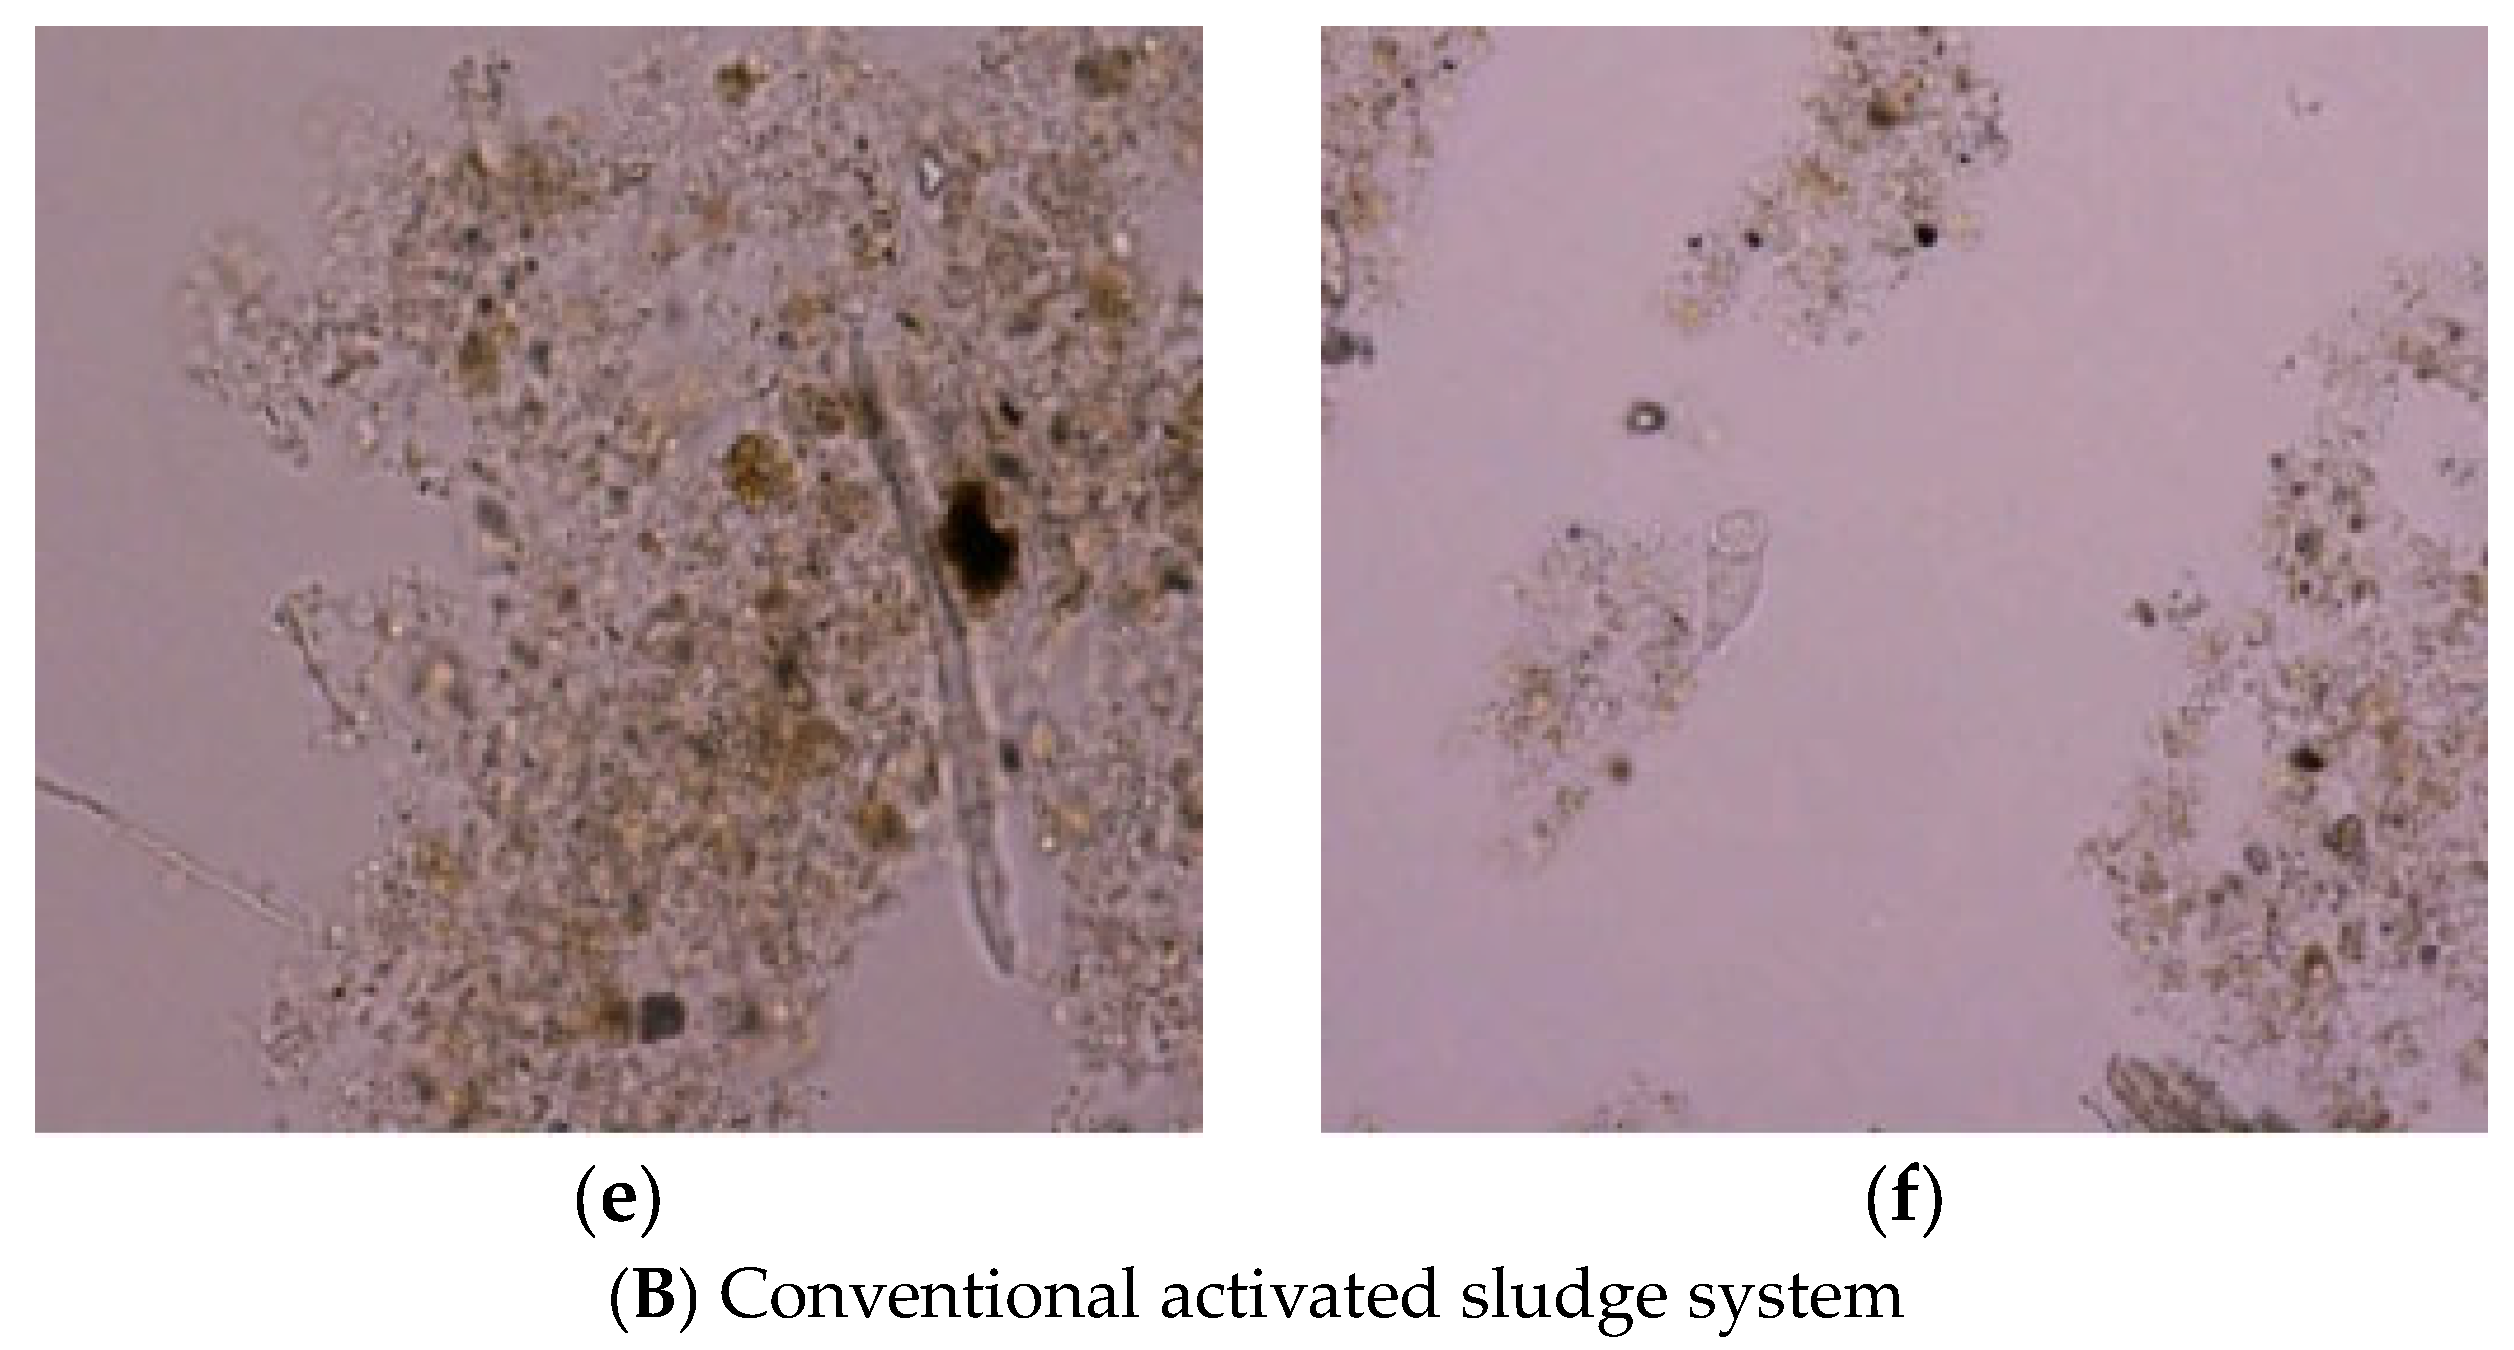
3.3.3. Comparison of Microorganisms in Two Systems

As can be seen in Figure 15, the bacterial pellets formed within the high-concentration activated sludge system were larger and denser, with better activated sludge flocculation and a structure similar to aerobic granular sludge incubated up to 40 d (see Figure 14), whereas the bacterial pellets formed in the conventional activated sludge system were looser and finer.
As can be seen in Figure 16 and Figure 17, the microorganisms in the lateral flow high-concentration activated sludge system were mainly bellworms, weaselworms, floating body worms, and rotifers, and its physico-chemical properties such as its sludge settling were good. The main microorganisms in the conventional activated sludge system were nematodes and bellworms. The microorganisms in the high-concentration activated sludge system were rich in species, and the ecosystem was more diverse and stable.

4. Conclusions

(1) PAC, FeCl3, Al2(SO4)3, APAM, and CPAM were used as flocculants to improve the sludge settling performance, and the best flocculation effect was achieved when the dosages of PAC, FeCl3, and Al2(SO4)3 were 100 mg/L, with an SV30 of 65.5%, 68%, and 84%, and an SVI of 70, 73, and 75, respectively. The best flocculation effect was achieved when the dosage of APAM was 2 mg/L, with an SV30 of 80% and an SVI of 65; when CPAM was 10 mg/L, with an SV30 of 66% and an SVI of 61; when APAM was dosed at 2 mg/L, with an SV30 of 80% and an SVI of 65; and when CPAM was dosed at 10 mg/L, with an SV30 of 66% and an SVI of 61. The most suitable flocculant for the high-concentration method was CPAM, and the dosage was 10 mg/L. The optimum operating conditions of flocculation were as follows: the mixing section was mixed at a fast rate of 1000 r min−1 for 2 min, and flocculation Section I was mixed at a fast rate of 120 r min−1 for 10 min, and flocculation Section 2 at 60 r min−1 for 10 min.
(2) Compared with the traditional activated sludge method, the high-concentration activated sludge system is more effective than the activated sludge method in removing all traditional pollutants. The more significant effect is that the high-concentration method has a better nitrogen removal effect, which increases the total nitrogen removal rate by nearly 10% under the conditions of insufficient organic carbon sources.
(3) The bacterial gel mass formed by the high-concentration activated sludge system is more compact and has a larger morphological structure compared with the traditional activated sludge system, similar to aerobic granular sludge, and the system is also rich in protozoa and postulates such as bellworms, floating body worms, weasel worms, rotifers, and so on.
(4) The research results of this paper provide a reference for the application of the lateral flow high-concentration method for the upgrading of wastewater plants, which is of practical guidance significance.

Author Contributions

Conceptualization, B.L. and X.Y.; methodology, H.H.; software, Y.L.; validation, J.X., H.H. and W.H.; formal analysis, B.L.; investigation, H.H.; resources, Y.W.; data curation, J.X.; writing—original draft preparation, H.H.; writing—review and editing, B.L.; visualization, Y.Y.; supervision, B.L.; project administration, H.H.; funding acquisition, Y.W. All authors have read and agreed to the published version of the manuscript.

Funding

This study was completed by three projects funded by respectively: (1) Experimental study on the application of high-concentration activated sludge in the upgrading process of urban domestic wastewater treatment plants, approved as 212,097. (2) Research on advanced oxidation technology for the deep treatment of wastewater from the soy sauce and wine industries, approved as 222,357. (3) Transformation study on the processing technology of the fixed recirculating bed biofilm method, approved as 2022-YF05-00830-SN.

Data Availability Statement

The raw data supporting the conclusions of this article will be made available by the authors upon request.

Acknowledgments

This study was supported by financial and technical assistance from China Municipal Engineering Southwest Design and Research Institute Limited Co, China Municipal Engineering Zhongnan Design and Research Institute and Sichuan Development Environmental Science and Technology Research Institute Limited. We thank them for their support throughout the study. We also feel that the State Key Fluid Mechanics Laboratory partially supported this study.

Conflicts of Interest

Author Wang Yin works for China Municipal Engineering Southwest Design and Research Institute. The remaining authors declare that the research was conducted in the absence of any commercial or financial relationships that could be construed as a potential conflict of interest.

References

  1. Mishima, K.; Nakamura, M. Self-immobilization of aerobicactivated sludge-a pilot study of the aerobic upflow sludge blanket process in municipal sewage treatment. Water Sci. Technol. 1991, 23, 981–990. [Google Scholar] [CrossRef]
  2. McSwain, B.S.; Irvine, R.L.; Hausner, M.; Wilderer, P. Composition and distribution of extracellular polymeric substances in aerobic flocs and granular sludge. Appl. Environ. Microbiol. 2005, 71, 1051–1057. [Google Scholar] [CrossRef]
  3. Lee, D.J.; Chen, Y.Y.; Show, K.Y.; Whiteley, C.G.; Tay, J.H. Advances in aerobic granule formation and granule stability in the course of storage and reactor operation. Biotechnol. Adv. 2010, 28, 919–934. [Google Scholar] [CrossRef] [PubMed]
  4. de Bruin, L.M.M.; van der Roest, H.F.; van Loosdrecht, M.C.M. Overview of Applied Research with Nereda-Technology in the Netherlands. Proc. Water Environ. Fed. 2010, 2010, 103–113. [Google Scholar] [CrossRef]
  5. Feng, L.; Zheng, H.; Gao, B.; Zhang, S.; Zhao, C.; Zhou, Y.; Xu, B. Fabricating an anionic polyacrylamide (APAM) with an anionic block structure for high turbidity water separation and purification. RSC Adv. 2017, 7, 28918–28930. [Google Scholar] [CrossRef]
  6. Pronk, M.; De Kreuk, M.K.; De Bruin, B.; Kamminga, P.; Kleerebezem, R.V.; Van Loosdrecht, M.C.M. Full scale performance of the aerobic granular sludge process for sewage treatment. Water Res. 2015, 84, 207–217. [Google Scholar] [CrossRef] [PubMed]
  7. Li, X.; Zheng, H.; Gao, B.; Sun, Y.; Liu, B.; Zhao, C. UV-initiated template copolymerization of AM and MAPTAC: Microblock structure, copolymerization mechanism, and flocculation performance. Chemosphere 2017, 167, 71–81. [Google Scholar] [CrossRef] [PubMed]
  8. Li, J.; Ding, L.B.; Cai, A.; Huang, G.X.; Horn, H. Aerobic Sludge Granulation in a Full-Scale Sequencing Batch Reactor. Biomed Res. Int. 2014, 2014, 268789. [Google Scholar] [CrossRef] [PubMed]
  9. Bassin, J.P.; Kleerebezem, R.; Dezotti, M.; Van Loosdrecht, M.C.M. Measuring biomass specific ammonium, nitrite and phosphate uptake rates in aerobic granular sludge—ScienceDirect. Chemosphere 2012, 89, 1161–1168. [Google Scholar] [CrossRef]
  10. Ni, B.J.; Xie, W.M.; Liu, S.G.; Yu, H.Q.; Wang, Y.Z.; Wang, G.; Dai, X.L. Granulation of activated sludge in a pilot-scale sequencing batch reactor for the treatment of low-strength municipal wastewater. Water Res. 2009, 43, 751–761. [Google Scholar] [CrossRef]
  11. Yang, H.G.; Li, J.; Liu, J.; Ding, L.B.; Chen, T.; Huang, G.X.; Shen, J.Y. A case for aerobic sludge granulation: From pilot to full scale. J. Water Reuse Desalination 2016, 6, 188–194. [Google Scholar] [CrossRef]
  12. Sumiyati, S.; Sitinjak, R. Removal of Ammonia Nitrogen by Activated Sludge Process Using Simultaneous Nitrification Denitrification Method. In Proceedings of the E3S Web of Conferences, 5th International Conference on Energy, Environmental and Information System (ICENIS 2020), Semarang, Indonesia, 12–13 August 2020; Volume 202. [Google Scholar]
  13. Zeng, D.; Wu, J.; Kennedy, J.F. Application of a chitosan flocculant to water treatment. Carbohydr. Polym. 2008, 71, 135–139. [Google Scholar] [CrossRef]
  14. Owodunni, A.A.; Ismail, S.; Kurniawan, S.B.; Ahmad, A.; Imron, M.F.; Abdullah, S.R.S. A review on revolutionary technique for phosphate removal in wastewater using green coagulant. J. Water Process Eng. 2023, 52, 103573. [Google Scholar] [CrossRef]
  15. Abidli, A.; Huang, Y.; Rejeb, Z.B.; Zaoui, A.; Park, C.B. Sustainable and efficient technologies for removal and recovery of toxic and valuable metals from wastewater: Recent progress, challenges, and future perspectives. Chemosphere 2022, 292, 133102. [Google Scholar]
  16. Du, Y.; Cao, B.; Zhang, W.; Yang, P.; Xu, Q.; Wang, D.; Shen, X. Improvement of wastewater sludge dewatering properties using polymeric aluminum-silicon complex flocculants conditioning: Importance of aluminum/silicon ratio. Colloids Surf. A Physicochem. Eng. Asp. 2017, 530, 134–145. [Google Scholar] [CrossRef]
  17. Villaseñor-Basulto, D.L.; Astudillo-Sánchez, P.D.; del Real-Olvera, J.; Bandala, E.R. Wastewater treatment using Moringa oleifera Lam seeds: A review. J. Water Process Eng. 2018, 23, 151–164. [Google Scholar] [CrossRef]
  18. Zhao, C.; Zhou, J.; Yan, Y.; Yang, L.; Xing, G.; Li, H.; Wu, P.; Wang, M.; Zheng, H. Application of coagulation/flocculation in oily wastewater treatment: A review. Sci. Total Environ. 2021, 765, 142795. [Google Scholar] [CrossRef] [PubMed]
  19. Boulaadjoul, S.; Zemmouri, H.; Bendjama, Z.; Drouiche, N. A novel use of Moringa oleifera seed powder in enhancing the primary treatment of paper mill effluent. Chemosphere 2018, 206, 142–149. [Google Scholar] [CrossRef] [PubMed]
  20. Tomasi, I.T.; Machado, C.A.; Boaventura, R.A.; Botelho, C.M.; Santos, S.C. Tannin-based coagulants: Current development and prospects on synthesis and uses. Sci. Total Environ. 2022, 822, 153454. [Google Scholar] [CrossRef]
  21. Lekniute-Kyzike, E.; Bendoraitiene, J.; Navikaite-Snipaitiene, V.; Peciulyte, L.; Rutkaite, R. Production of Cationic Starch-Based Flocculants and Their Application in Thickening and Dewatering of the Municipal Sewage Sludge. Materials 2023, 16, 2621. [Google Scholar] [CrossRef]
  22. Ozun, S.; Ulus, D.A. An Investigation on the Turbidity Removal from Natural Stone Processing Plant Wastewater by Flocculation. Inz. Miner. J. Pol. Miner. Eng. Soc. 2020, 2, 157–162. [Google Scholar] [CrossRef]
  23. Hu, P.; Shen, S.; Yang, H. Evaluation of hydrophobically associating cationic starch-based flocculants in sludge dewatering. Sci. Rep. 2021, 11, 13. [Google Scholar] [CrossRef] [PubMed]
  24. Wu, H.M.; Zhang, M.X.; Zheng, H.H.; Yi, F. Sedimentation Behavior of Flocculant-Treated Dredged Slurry under Filtration of Woven Geotextiles. Water 2023, 15, 4158. [Google Scholar] [CrossRef]
  25. Tsilo, P.H.; Basson, A.K.; Ntombela, Z.G.; Maliehe, T.S.; Pullabhotla, V. Production and Characterization of a Bioflocculant from Pichia kudriavzevii MH545928.1 and Its Application in Wastewater Treatment. Int. J. Environ. Res. Public Health 2022, 19, 3148. [Google Scholar] [CrossRef]
  26. Barros, A.; Vecino, X.; Reig, M.; Cortina, J.L. Coagulation and Flocculation Optimization Process Applied to the Sidestream of an Urban Wastewater Treatment Plant. Water 2022, 14, 4024. [Google Scholar] [CrossRef]
  27. Chen, Y.; Liu, S.Q.; Ren, Z.Y.; Wang, Q.; Zhang, Y.; Zuo, Y.J.; Zhou, J.; Jia, H.T.; Wang, T.C. Potential of non-thermal discharge plasmas for activated sludge settling: Effects and underlying mechanisms. RSC Adv. 2023, 13, 19869–19880. [Google Scholar] [CrossRef]
  28. Ren, G.P.; Zhang, J.; Feng, T.G.; Liang, Y.; Yin, Y.H. Mechanism and Influence of Dispersants on the Action of Polymer Flocculants Used in Slurry Separation. Polymers 2023, 15, 4073. [Google Scholar] [CrossRef] [PubMed]
  29. Wang, W.C.; Fan, L.; Ni, S.B.; Wei, J.H.; Huang, Y.P. Study on the matching rules and control mechanisms between flocculants and slurry settlement characteristics. Environ. Res. Commun. 2023, 5, 11. [Google Scholar] [CrossRef]
  30. Jia, X.F.; Fan, H.X.; Liang, J.W.; Dai, J.H.; Sun, Y.; Mai, W.N. Performance Analysis of Anaerobic Digestion Coupled with Simultaneous Nitrification and Denitrification Process for Treating Alcohol Precipitation Wastewater of Chinese Patent Medicine. Water 2023, 15, 1939. [Google Scholar] [CrossRef]
Figure 1. (a) is the molecular structure of CPAM and (b) is the molecular structure of APAM.
Water 16 02281 g001
Figure 2. Pictures (ad) all show the site of the beaker experiment.
Water 16 02281 g002aWater 16 02281 g002b
Figure 3. Flowchart of the medium-sized test.
Water 16 02281 g003
Figure 4. (ad) show all the medium-sized test sites.
Water 16 02281 g004
Figure 5. Changes in sludge volume of mixtures with different dosages of PAC.
Water 16 02281 g005
Figure 6. Changes in sludge volume of mixed liquor with different dosages of FeCl3.
Water 16 02281 g006
Figure 7. Variation in sludge volume of mixed liquor with different dosages of Al2(SO4)3.
Water 16 02281 g007
Figure 8. Changes in sludge volume of mixed liquor with different dosages of APAM.
Water 16 02281 g008
Figure 9. Variation in sludge volume of mixtures with different dosages of CPAM.
Water 16 02281 g009
Figure 10. Comparison of sludge concentration between System I and System II.
Water 16 02281 g010
Figure 11. Comparison of System I and System II sludge SV and SVI.
Water 16 02281 g011
Figure 12. Comparison of sludge COD removal effect between System I and System II.
Water 16 02281 g012
Figure 13. Comparison of ammonia nitrogen removal effect between System I and System II.
Water 16 02281 g013
Figure 14. Comparison of total nitrogen removal effect between System I and System II.
Water 16 02281 g014
Figure 15. Morphology of activated sludge micelles in two systems.
Water 16 02281 g015
Figure 16. Microscopic examination of aerobic granular sludge.
Water 16 02281 g016
Figure 17. (a) is a bellworm, (b) is a ladybird beetle, (c) is a skunk bug, (d) is a saddle beetle rotifer, (e) is a nematode, and (f) is a bellworm.
Water 16 02281 g017aWater 16 02281 g017b
Table 1. Test of influent water quality.
Ordinal NumberBasic Control ItemsMinimum to
Maximum
Average Value
1BOD5 (mg/L)15.3~12455.5
2CODcr (mg/L)25.1~315128
3SS (mg/L)21~11766
4NH3-N (mg/L)7.94~58.325.8
5TN (mg/L)13.60~74.6936.1
6TP (mg/L)0.64~7.132.64
7PH6.64~8.177.52
Table 2. List of flocculant types and dosages.
Types of FlocculantsAffiliated CategoriesDosage (mg/L)
PACInorganic polymer flocculant2550100300500
FeCl3Traditional inorganic flocculants2550100300500
Al2(SO4)3Traditional inorganic flocculants2550100300500
APAMAnionic organic synthetic flocculants25101520
CPAMCationic organic synthetic flocculants25101520
Table 3. Mixing conditions of the six mixers.
Sports EventSpeedyMedium SpeedSlow Speed
Number of revolutions per minute (r/min)100012060
Mixing time (min)21010
Table 4. Changes in sludge indexes under different dosages of PAC.
PAC Dosage (mL)SV30 (100%)V60 (mL/min)Sludge Volume after Settling for 60 min (mL)Turbidity of Supernatant (NTU)MLSS (g/L)SVI (mL/g)
090.53.082010.510.11290
25726.676004.639.67674
50706.835903.839.65672
10065.57.085753.009.33670
300726.586055.459.8473
500756.506107.869.95277
Table 5. Changes of sludge indexes under different dosages of FeCl3.
FeCl3 Dosage (mL)SV30 (100%)V60 (mL/min)Sludge Volume after Settling for 60 min (mL)Turbidity of supernatant (NTU)MLSS (g/L)SVI (mL/g)
090.52.8383013.448.466106
2572.56.176306.589.46277
50716.336205.769.37076
100686.506104.209.33673
300736.086355.529.82274
500746.006408.639.62675
Table 6. Changes in sludge indexes under different dosages of Al2(SO4)3.
Al2(SO4)3 Dosage (mL)SV30 (100%)V60 (mL/min)Sludge Volume after Settling for 60 min (mL)Turbidity of Supernatant (NTU)MLSS (g/L)SVI (mL/g)
092.52.178709.5110.23090
25854.007606.9210.73479
50854.007606.3510.08684
100844.177505.7611.24675
300834.337405.0610.97676
500824.337406.4810.68677
Table 7. Changes in sludge indexes under different dosages of APAM.
APAM Dosing Rate (mL)SV30 (100%)V60 (mL/min)Sludge Volume after Settling for 60 min (mL)Turbidity of Supernatant (NTU)MLSS (g/L)SVI (mL/g)
0872.9282513.6810.9280
2805.256857.0612.37665
5795.336806.2911.39269
10795.426755.1911.35270
15795.426755.4210.73474
20795.56704.1612.11665
Table 8. Changes of sludge indexes under different dosages of CPAM.
CPAM Dosage (mL)SV30 (100%)V60 (L/min)Sludge Volume after Settling for 60 min (mL)Turbidity of Supernatant (NTU)MLSS (g/L)SVI (mL/g)
0883.0082012.4810.5683
2806.676006.7510.85874
5787.005805.4910.78972
10668.165105.1710.89261
15648.504904.7210.52961
2062.58.834704.1610.76258
Table 9. Changes in sludge indexes after adding different flocculant dosages of 10 mg/L.
FlocculantDosage (mg/L)SV30 (100%)V60 min (mL/min)Sludge Volume after 60 min of Settling (mL)Turbidity of Supernatant (NTU)MLSS (g/L)SVI (mL/g)
PAC10065.57.085753.009.33670
FeCl3100686.506104.209.33673
Al2(SO4)3100844.177505.7611.24675
APAM2805.256857.0612.37665
CPAM10668.165105.1710.89261
Table 10. Orthogonal parameter design table.
ConsiderationsMixing Section Hydraulic Retention Time (s)Hydraulic Retention Time of Flocculation Section (min)Mixing Intensity of Mixing Section
(r min−1)
Flocculation 1# Section Mixing Intensity
(r min−1)
Flocculation 2# Section Mixing Intensity
(r min−1)
13056006020
260108009040
312015100012060
430020120015080
Table 11. Table of orthogonal test results.
ConsiderationsMixing Section Hydraulic
Retention Time (s)
Hydraulic Retention Time of Flocculation Section (min)Mixing Intensity of Mixing Section
(r min−1)
Flocculation 1# Section Mixing
Intensity (r min−1)
Flocculation 2# Section Mixing
Intensity (r min−1)
SVI (mL/g)
1305600602099
23010800904097
3301510001206086
4302012001508088
56058001208094
660106001206095
760151200604087
860201000902085
9120510001504086
101201012001202085
1112015600908084
1212020800606082
1330051200906096
14300101000608097
153001580015020100
16300206001204093
Table 12. Analysis of results.
ConsiderationsMixing Section Hydraulic
Retention Time (s)
Hydraulic Retention Time of Flocculation Section (min)Mixing Intensity of Mixing Section
(r min−1)
Flocculation 1# Section Mixing Intensity
(r min−1)
Flocculation 2# Section Mixing Intensity
(r min−1)
Mean value 192.5093.7792.9191.2592.04
Mean value 290.2393.5390.5590.5590.77
Mean value 384.3789.2489.4889.4889.80
Mean value 496.3886.9392.2090.8690.86
Range error2.882.654.673.723.25
Disclaimer/Publisher’s Note: The statements, opinions and data contained in all publications are solely those of the individual author(s) and contributor(s) and not of MDPI and/or the editor(s). MDPI and/or the editor(s) disclaim responsibility for any injury to people or property resulting from any ideas, methods, instructions or products referred to in the content.

