Article

A Risk Assessment of the Vegetation Ecological Degradation in Hunshandake Sandy Land, China: A Case Study of Dabusennur Watershed

1
Key Laboratory of Quaternary Chronology and Hydrological Environmental Evolution, China Geological Survey, Shijiazhuang 050061, China
2
The Institute of Hydrogeology and Environmental Geology, Chinese Academy of Geological Sciences, Shijiazhuang 050061, China
3
School of Urban Geology and Engineering, Hebei GEO University, Shijiazhuang 050031, China
4
School of Earth Science and Resources, China University of Geosciences (Beijing), Beijing 100083, China
5
Department of Geology, Northwestern University, Xi’an 710069, China
*
Author to whom correspondence should be addressed.
Water 2024, 16(16), 2258; https://doi.org/10.3390/w16162258
Submission received: 19 June 2024 / Revised: 4 August 2024 / Accepted: 9 August 2024 / Published: 10 August 2024
(This article belongs to the Special Issue Soil and Groundwater Quality and Resources Assessment)

Abstract

:
In the context of climate change, it is essential for sustainable development to assess the risks associated with climate change and human-induced vegetation degradation. The Hunshandake Sandy Land provides a variety of ecosystem services and is a substantial ecological security barrier in the Beijing–Tianjin–Hebei area of China. This study used the Normalized Difference Vegetation Index (NDVI) to analyze the spatiotemporal variation trend in vegetation in the Dabusennur Watershed using linear trend analysis and the GeoDetector model to identify the main drivers of vegetation change in the watershed. Finally, the study assessed the risk of ecological degradation in the vegetation of the watershed. The results show that the NDVI in the study area has had a fluctuating trend in the last 22 years, and the change has been small. Precipitation and groundwater depth are the key factors affecting vegetation change. The NDVI reaches its maximum value when the groundwater depth is at 2.75 m. The vegetation ecology of the basin is relatively fragile, mainly with medium risk and large risk. To cope with the ecological risk of vegetation degradation caused by climate change, appropriate water use strategies should be formulated to ensure ecological water use. The present study’s outcomes provide the basis for developing ecological engineering solutions in the arid and semi-arid parts of northern China.

1. Introduction

Ecological degradation is a significant environmental challenge [1,2,3] that affects both human existence and the ability of economies to grow sustainably [4,5]. China is the country where ecological degradation is occurring at one of the highest rates in the world [6,7,8]. Ecological degradation has attracted considerable interest from a wide range of people and has become one of the hottest areas of modern ecological research [9,10]. Vegetation is an essential part of ecosystems and plays a crucial role in global energy and material cycles [11], as well as in the management of climate change [12]. Moreover, it offers a comprehensive reflection of human activity features, water quantity, and the impacts of climate change [6,13,14]. Its coverage can potentially depict the growth status and patterns of vegetation in respective regions [15]. Investigating vegetation degradation and restoration from a time-series perspective is imperative as they represent dynamic equilibrium processes that are both regional and relative [14,16]. The extensive coverage, strong spatiotemporal continuity, and lengthy data series provided by satellite remote sensing data enable the study of large-scale ecological changes [15,17,18]. The Normalized Difference Vegetation Index (NDVI) is a valuable metric for assessing vegetation quality, influenced by various driving factors [19,20]. Among these factors, precipitation plays a crucial role and cannot be disregarded as one of the natural forces impacting the NDVI dynamics [13]. The relationship between NDVI and temperature is intricate and closely linked to the magnitude of temperature increase [19]. Additionally, the altitude [21], groundwater depth (GD) [22,23], and soil type [24], along with other variables, exert significant influence on the NDVI. Regarding human factors, ecological restoration projects [14,25], land use and land cover (LULC) [18], and large-scale groundwater exploitation [6,26], among others, substantially contribute to the dynamics of the NDVI. The aforementioned studies have examined the relationship between ecological variables and the NDVI at various spatiotemporal scales in multiple study sites [24,27,28]. However, there is limited research on the vegetation ecological degradation risk (VEDR). Quantitatively describing the VEDR of local vegetation using the primary factors that influence NDVI distribution remains a challenging task [29,30,31]. Regions characterized by mountains and plateaus are particularly susceptible to climate change impacts [32]. The fragility and irreversibility of ecosystems in these regions have garnered significant attention towards understanding vegetation changes in such areas [33,34]. Hunshandake Sandy Land is located in an arid and semi-arid, ecologically sensitive area in northern China, which is a transitional zone between grassland animal husbandry and agriculture. As agricultural irrigation water occupies ecological water, ecological problems such as land desertification and lake wetland shrinkage are caused, which is one of the main reasons for the prominent dust weather in the Beijing–Tianjin–Hebei region. [14,35,36,37]. Therefore, we employ the Dabusennur Watershed (DW) in Hunshandake Sandy Land as our research subject. Conducting a risk assessment of ecological degradation will serve as a crucial guiding principle for future ecological protection and sustainable development within this basin, while also providing a foundation for developing ecological engineering strategies in the arid and semi-arid regions of northern China.
The objectives of the study are as follows: (1) to analyze the spatiotemporal dynamics of the NDVI in the DW from 1998 to 2019; (2) to investigate the relationships between ecological factors and their interaction with the NDVI; (3) to describe how the NDVI responds to the primary driver; and (4) to quantify and evaluate the VEDR of the DW.

2. Materials and Methods

2.1. Study Area

The DW, situated in the southwestern region of the Xilingol Grassland in Inner Mongolia, represents a typical grassland area located on the southern edge of the Hunshandake Sandy Land (Figure 1). Its geographical coordinates are 42°20–43°00′ N, 114°00′–115°20′ E, with an elevation ranging from 1077 to 1476 m; it experiences pronounced continental climate characteristics influenced by cold and high-pressure airflow originating from Mongolia. The notable climatic features include extreme coldness, aridity, strong winds, limited and concentrated precipitation patterns, an annual average temperature of ~1.9 C, annual average precipitation of ~270 mm, and annual average evaporation reaching ~210 mm. The predominant soil type is chestnut calcareous soil followed by Brown calcareous soil. The dominant land use/land cover (LULC) consists of grasslands and unused land. The primary vegetation types encompass Caragana microphylla, Artemisia desertorum, Hedysarum laeve, Cleistogenes squarrosa, Achnatherum splendens, and Stipa capillata. The unused land includes mainly saline-alkali land, marshland, and bare land.

2.2. Data Collection

Meteorological data (precipitation and temperature) from 1998 to 2019 were obtained from the Chinese National Meteorological Information Centre (NMIC) (http://data.cma.cn, accessed on 3 August 2024). We collected the Normalized Difference Vegetation Index (NDVI) dataset for the same period from the Data Center for Resources and Environmental Sciences, Chinese Academy of Sciences (RESDC) (http://www.resdc.cn, accessed on 3 August 2024). The maximum value of NDVI in a year was selected to reduce the impact of the cloud on remote sensing data [38]. Furthermore, the land use and land cover (LULC) remote sensing monitoring data and socio-economic data were acquired from RESDC. Meanwhile, the groundwater depth (GD) data were collected in the field. The GD was interpolated into the whole basin by ArcGIS 10.2 (https://www.esri.com, accessed on 3 August 2024) through ordinary kriging interpolation [39]. For spatial analysis and regional comparison, all data were standardized to 1000 m × 1000 m grid data. Further information regarding the data can be found in Table 1.

2.3. Research Methods
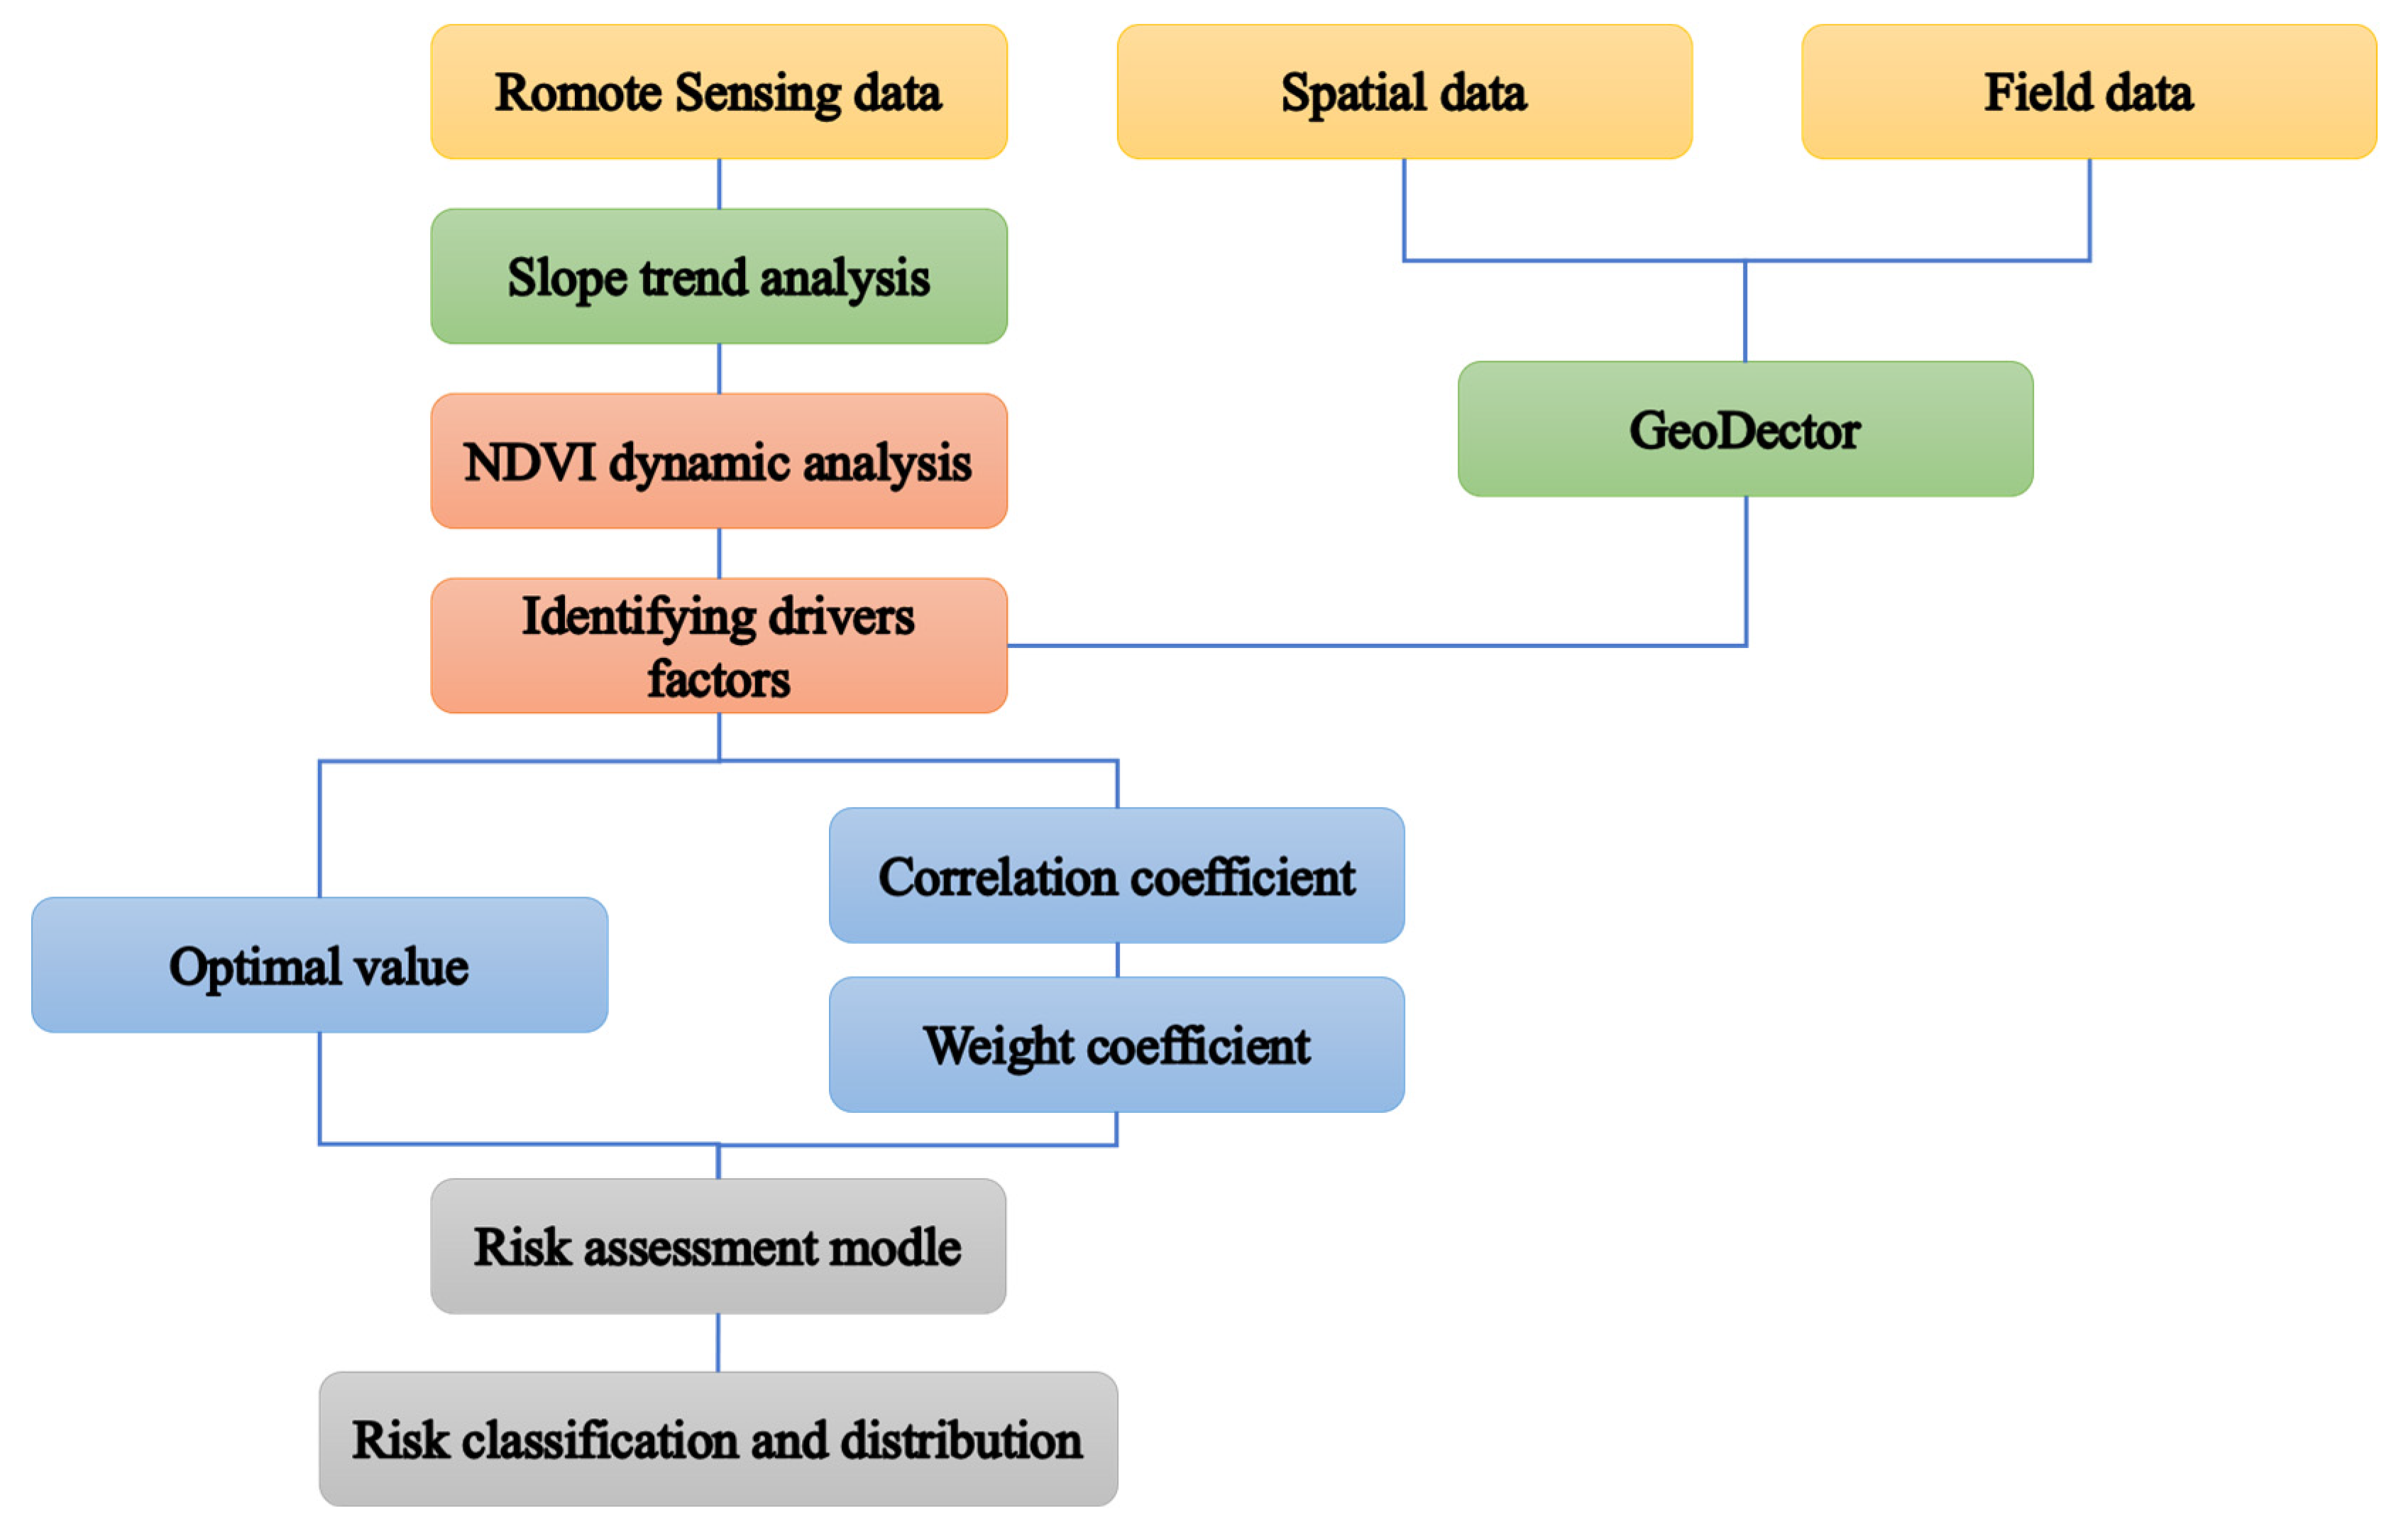
2.3.1. Workflow

Firstly, remote sensing data, field data, geographic data, and socio-economic data were fused to create a GIS spatial database of the study region. Subsequently, we examined the multi-year dynamics of the NDVI in the study region, detected the primary factors, and established a VEDR assessment model. Lastly, a quantitative evaluation, grading, and analysis of the ecological degradation risk of vegetation in the study region were executed. The workflow is depicted in Figure 2.

2.3.2. NDVI Trend Analysis

Trend analysis involves conducting a linear regression analysis on time-dependent variables [24,40]. By applying linear trend analysis, the dynamic characteristics of vegetation can be captured through the changing trend in the NDVI for each grid. In this study, we employed a unified linear regression model to determine the vegetation change trend in DW from 1998 to 2019 and calculated the slope of the trend using the least squares method:
S l o p e = n i = 1 n i × N D V I i i = 1 n × i = 1 n N D V I i n i = 1 n i 2 i = 1 n i 2
where slope refers to the trend in vegetation change, n is the number of years studied (n = 22 in this study), i is the ordinal number of a given year, and N D V I i denotes the NDVI value for the year i; in the case of a slope >0, this indicates that the NDVI trend is increasing.
In order to better express the change trend in vegetation cover, the F-test was used to test the significance of the change trend in NDVI, and the results of the significance test reflected the reliability of the trend change [24]. The calculation formula is as follows:
F = U × n 2 Q
U = i = 1 n y i ^ y ¯ 2
Q = i = 1 n y i y i ^ 2
where U refers to the sum of squares of errors, Q is the regression square sum, y i is the NDVI value for year i, y i ^ is the NDVI regression value for fear I, y ¯ is the average NDVI value in n year, and i is the ordinal number of a given year.

2.3.3. GeoDetector

The Geodetector method is a statistical approach that utilizes spatial statistics and spatial autocorrelation [41]. It can conduct spatial anisotropy exploration, reveal the influence and significance of each driving factor, the interaction strength between the exploration factors, and carry out risk detection and other research tasks. It consists of four components: factor detector, interaction detector, risk detector, and ecological detector, which collectively assess spatially stratified heterogeneity. In this study, we employ the factor detector and interaction detector from this model to investigate the impact of the NDVI driving factor in this region.
(1)
Factor detector
The purpose of this method is to assess the spatial heterogeneity of the dependent variable Y (NDVI value) and examine the impact of independent variable X (diverse natural and socio-economic factors) on the spatial heterogeneity of Y, which is quantified by q-value. The formula for calculating it is as follows:
q = 1 h = 1 L N h σ h 2 N σ 2
where h(1,2,…, L) is the number of classifications of the factor; N h and N are the numbers of units in class h and the whole area, respectively; σ h 2 and σ 2 are the variance of Y for the units in class h and the whole area, respectively; the q-value represents the degree of explanatory power for each factor, with q ∈ [0, 1], and its strength increases as the q-value approaches 1.
(2)
Interaction detector
The interaction detector can be utilized to determine whether the interactions between any two influencing factors ( X 1 X 2 ) are weakened, enhanced, or influenced Y independently. The types of interactive influences are determined by comparing the q-value of the interacting factors with each of the two involved factors, as presented in Table 2. The GeoDetector utilized in this study can be further explored at http://geodetector.cn, accessed on 3 August 2024.

2.3.4. Risk Assessment

Defining the VEDR as the deviation of the risk factor x i j from the optimal value x a j , the VEDR F i at sampling point i has the following assessment model:
F i = j = 1 m w j x i j x a j m a x x i j x a j
where w j is the weight coefficient of the risk assessment factor j on evaluation objective j = 1 m w j = 1 and x i j is the value of risk assessment factor j at sampling point i.
In this study, we employed the correlation coefficient method to ascertain the weight of each assessment factor for the VEDR. Initially, Pearson correlation coefficients were computed for the evaluated factors, and subsequently, normalization treatment was applied to derive weight coefficients for each assessed factor.

3. Results

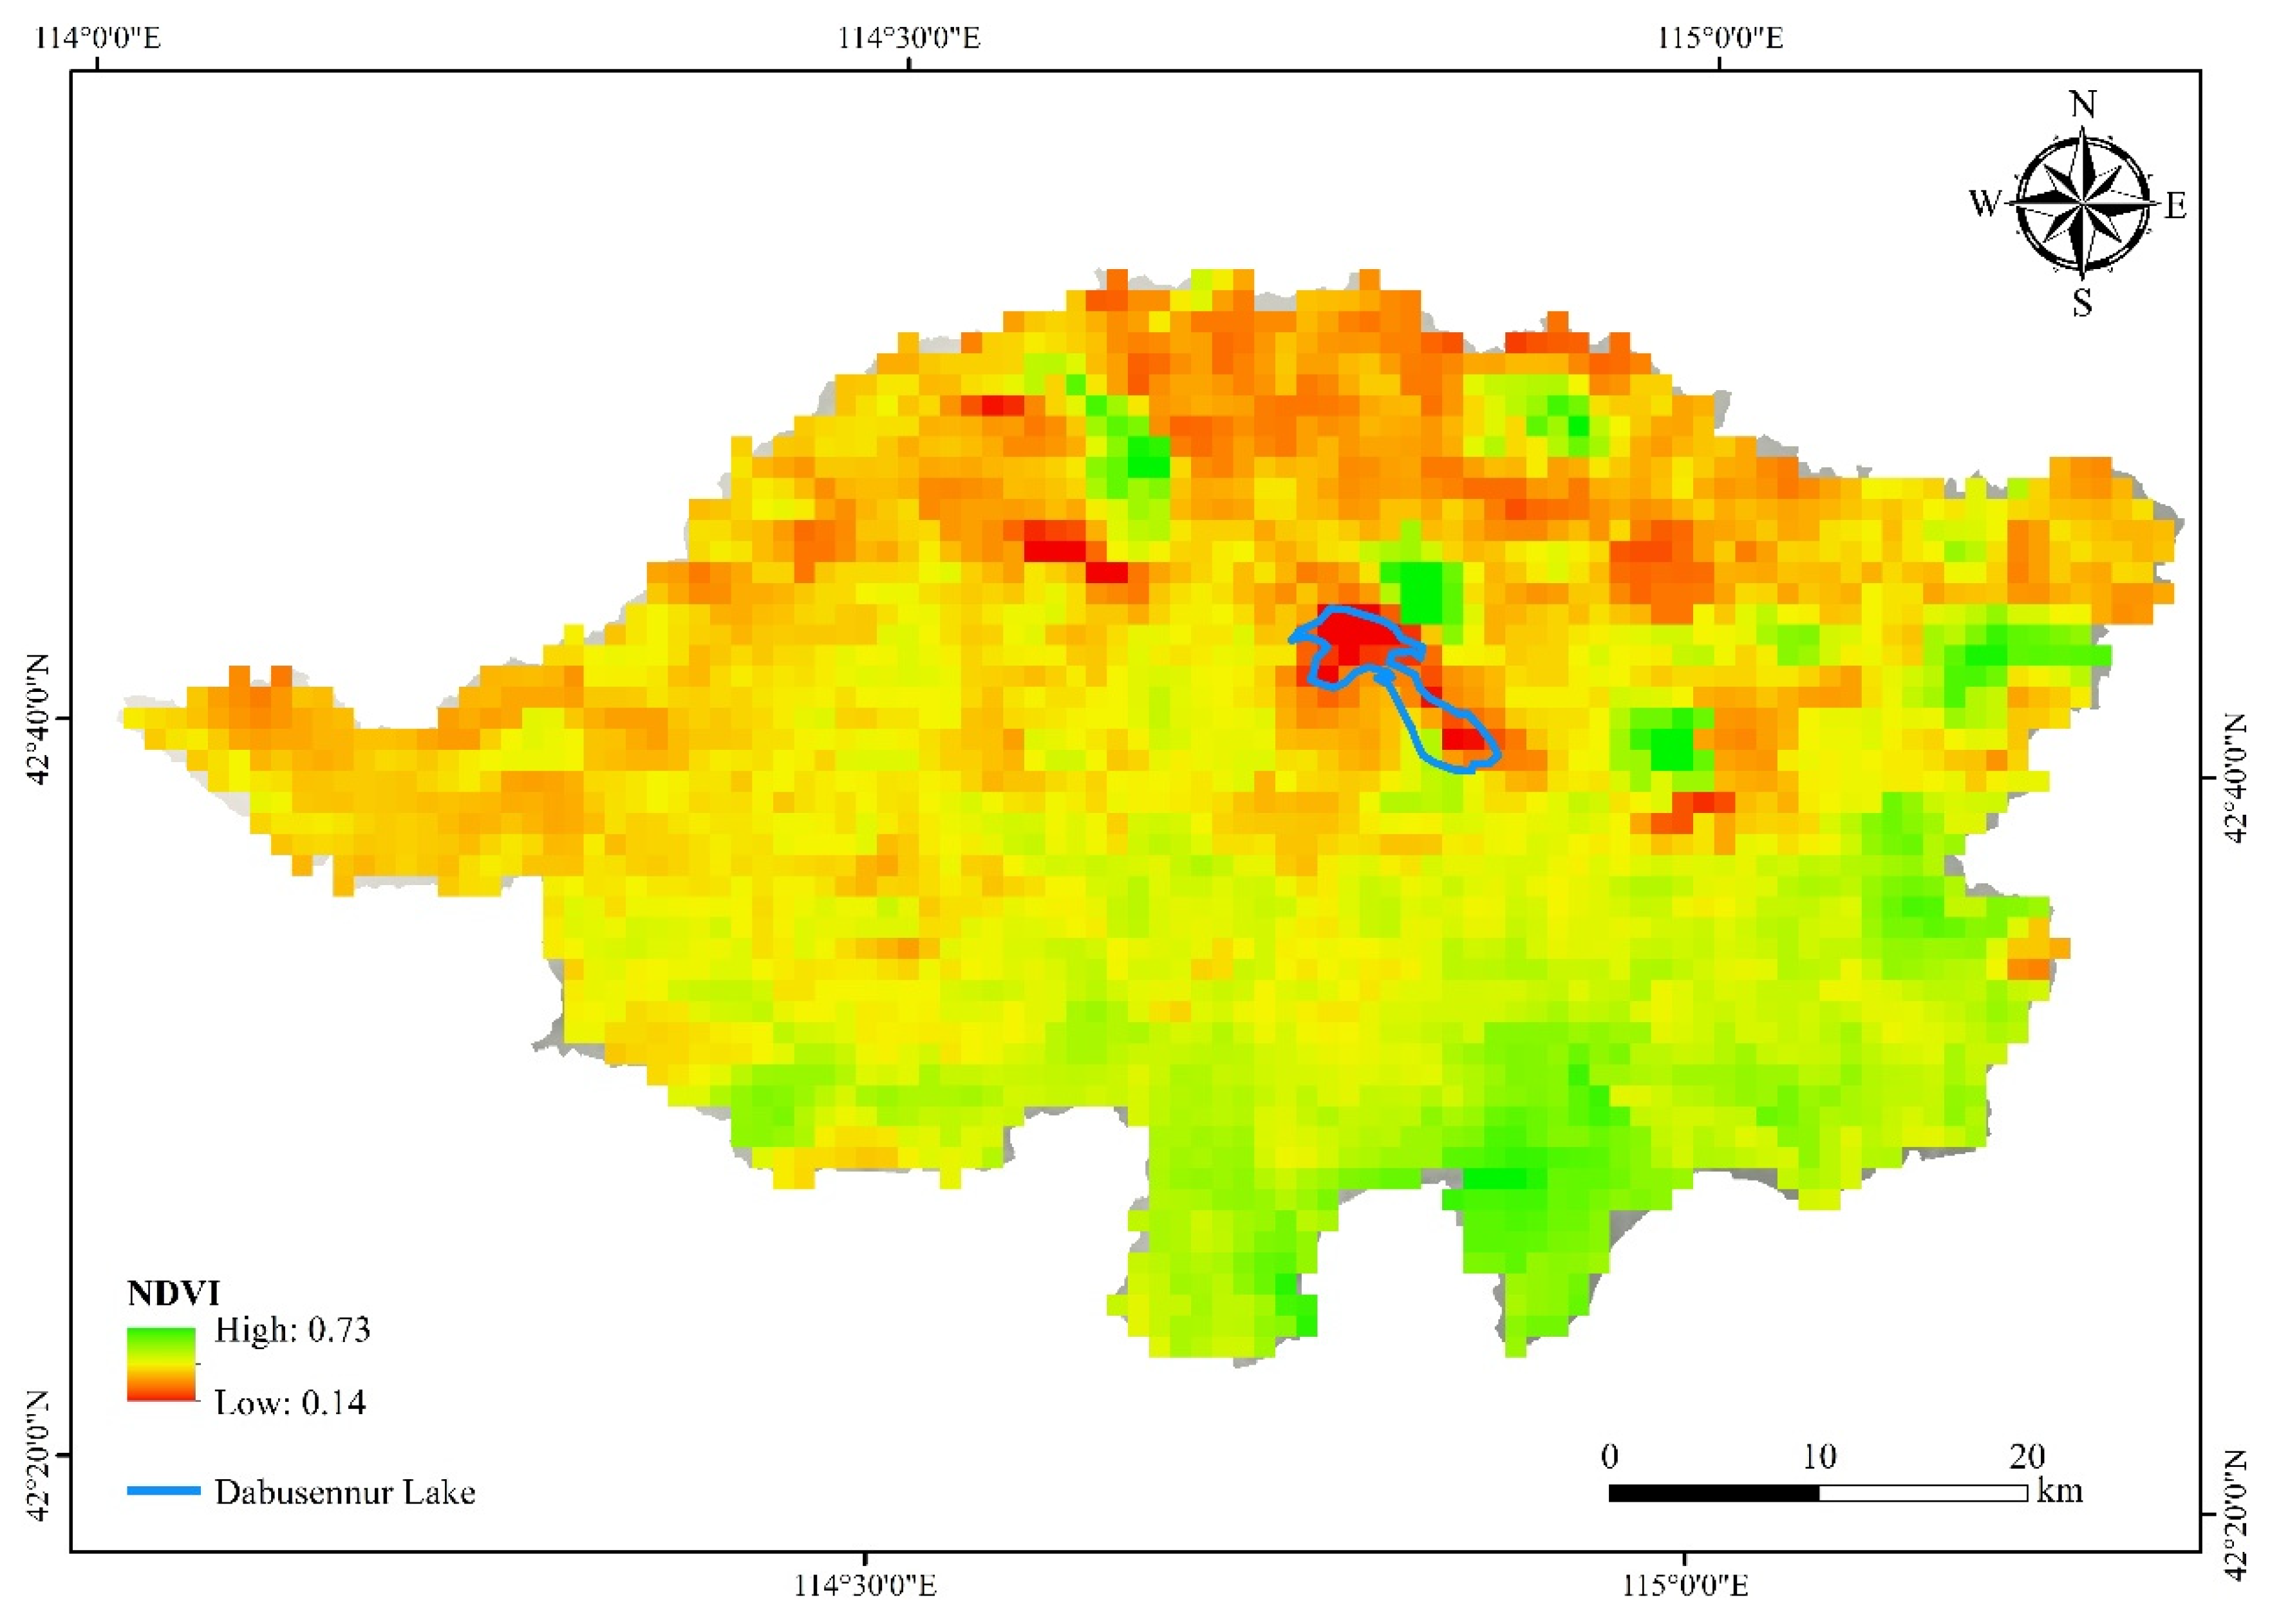
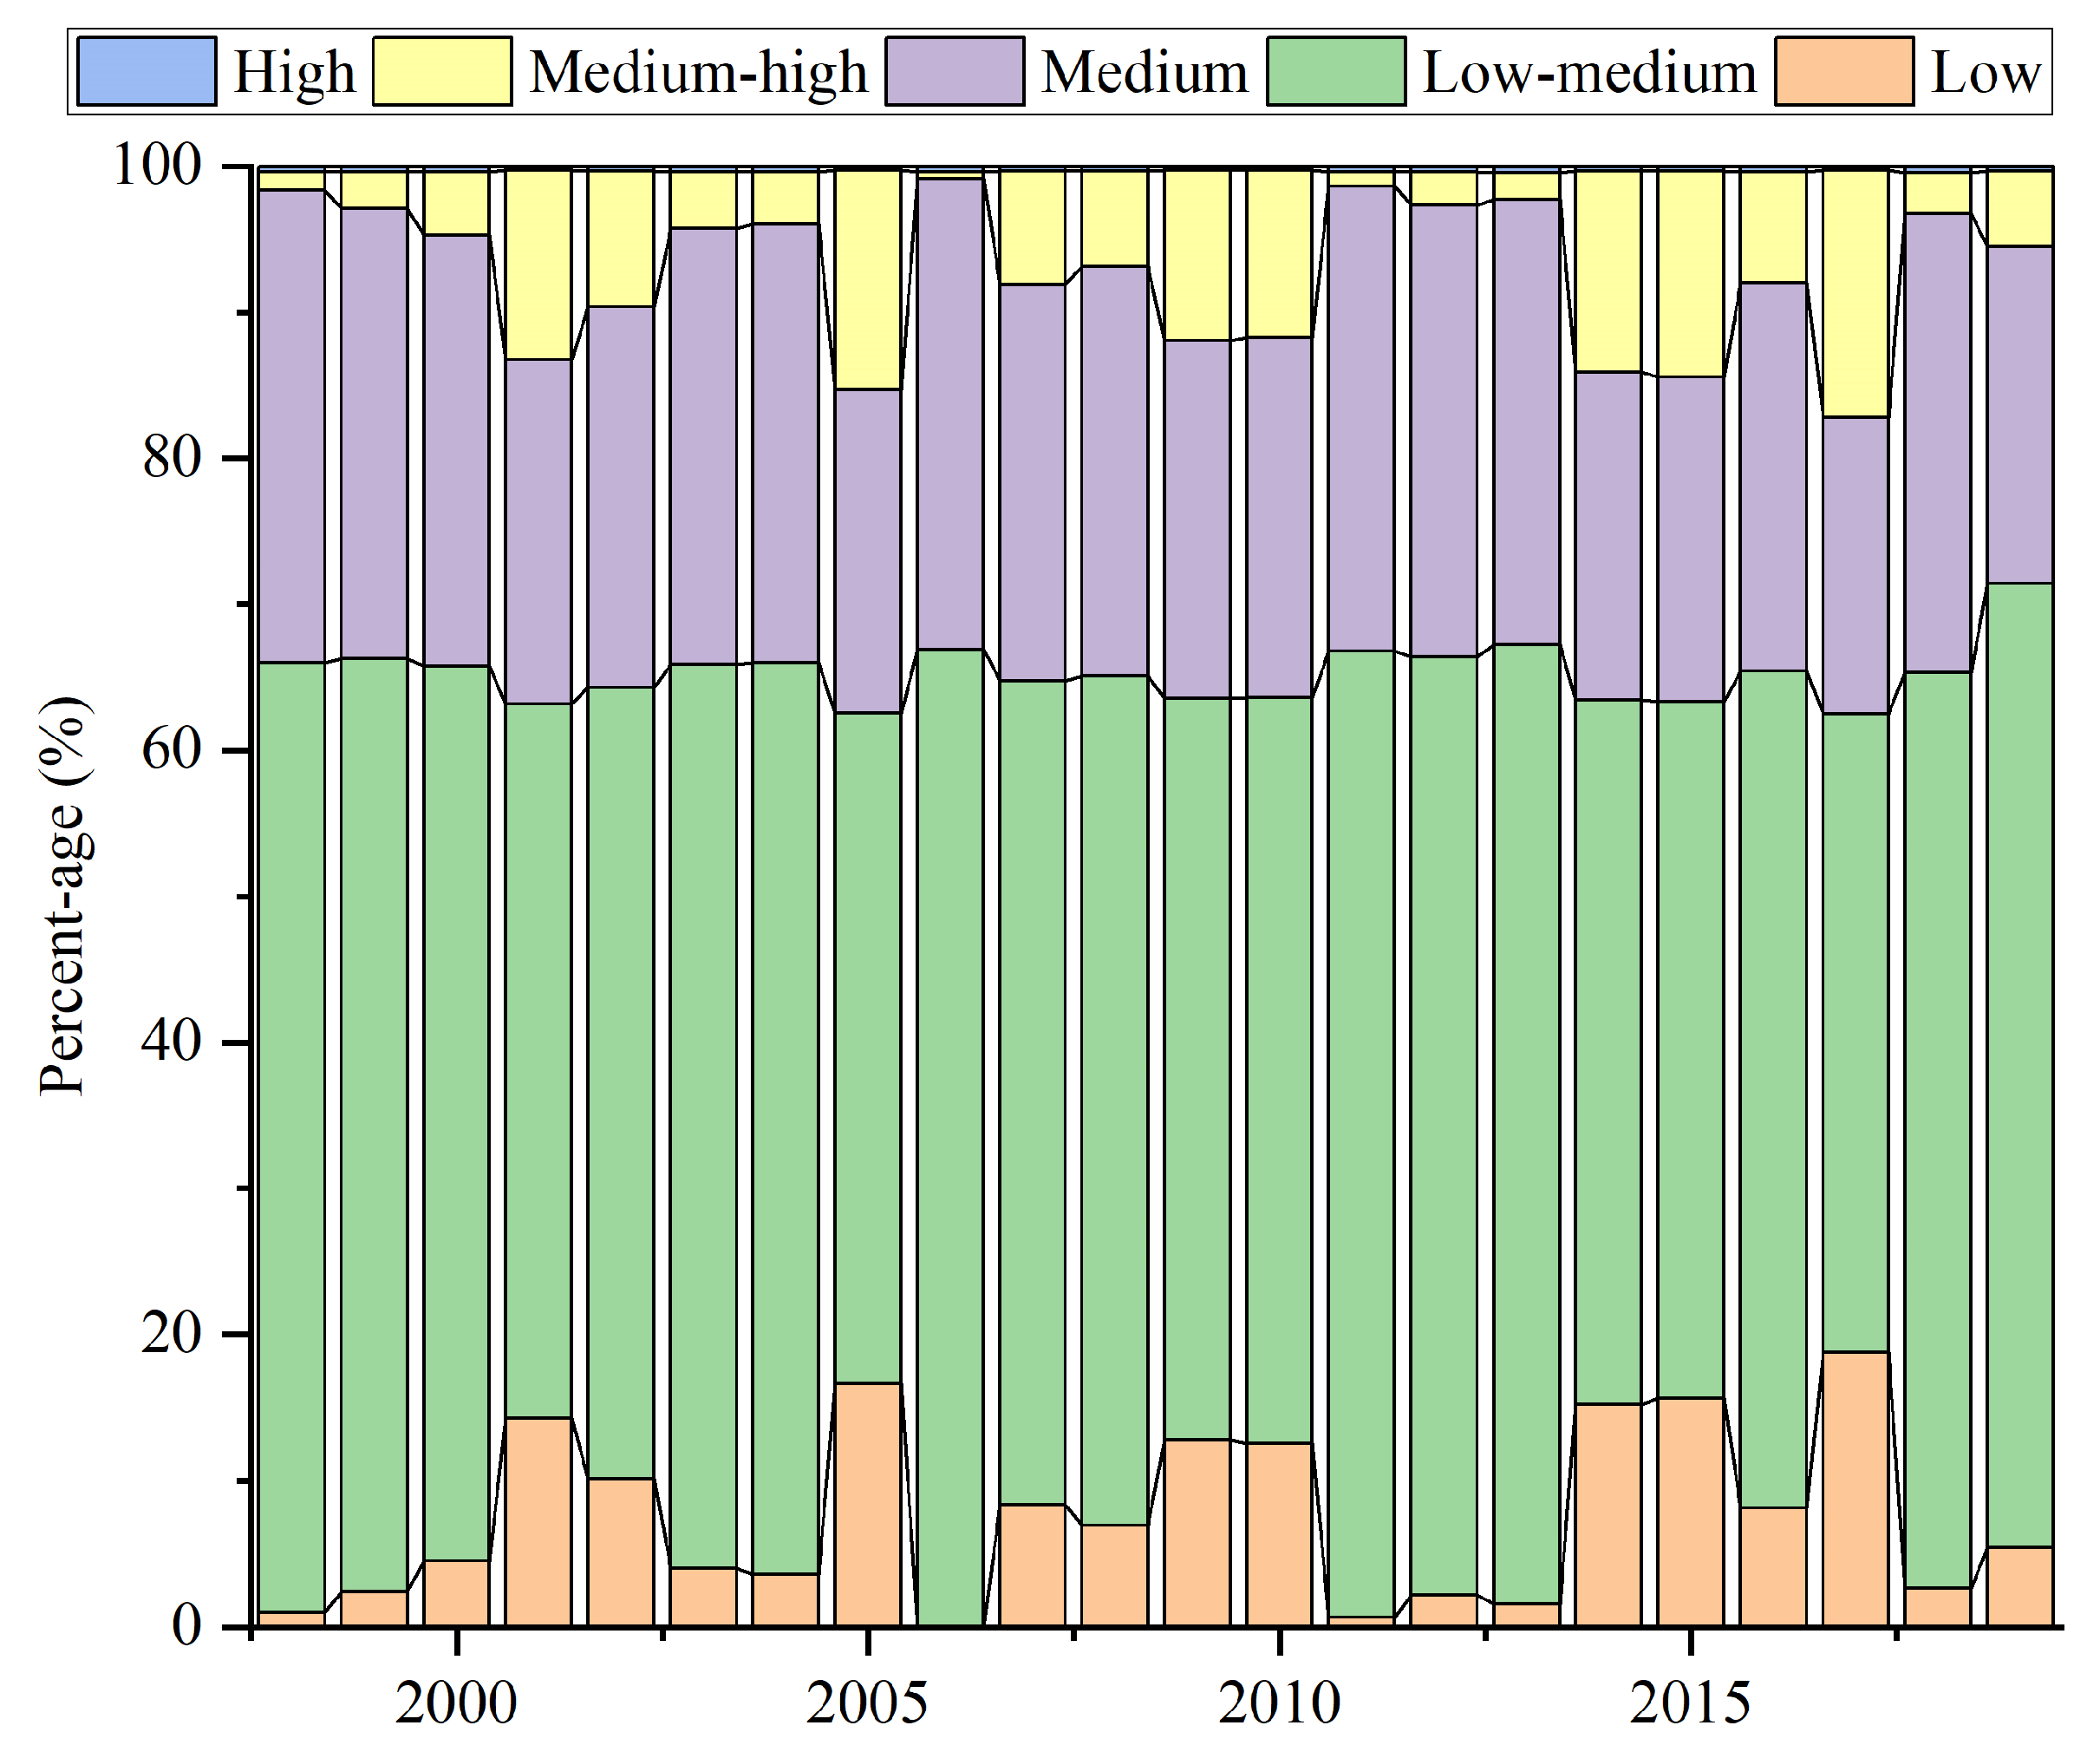
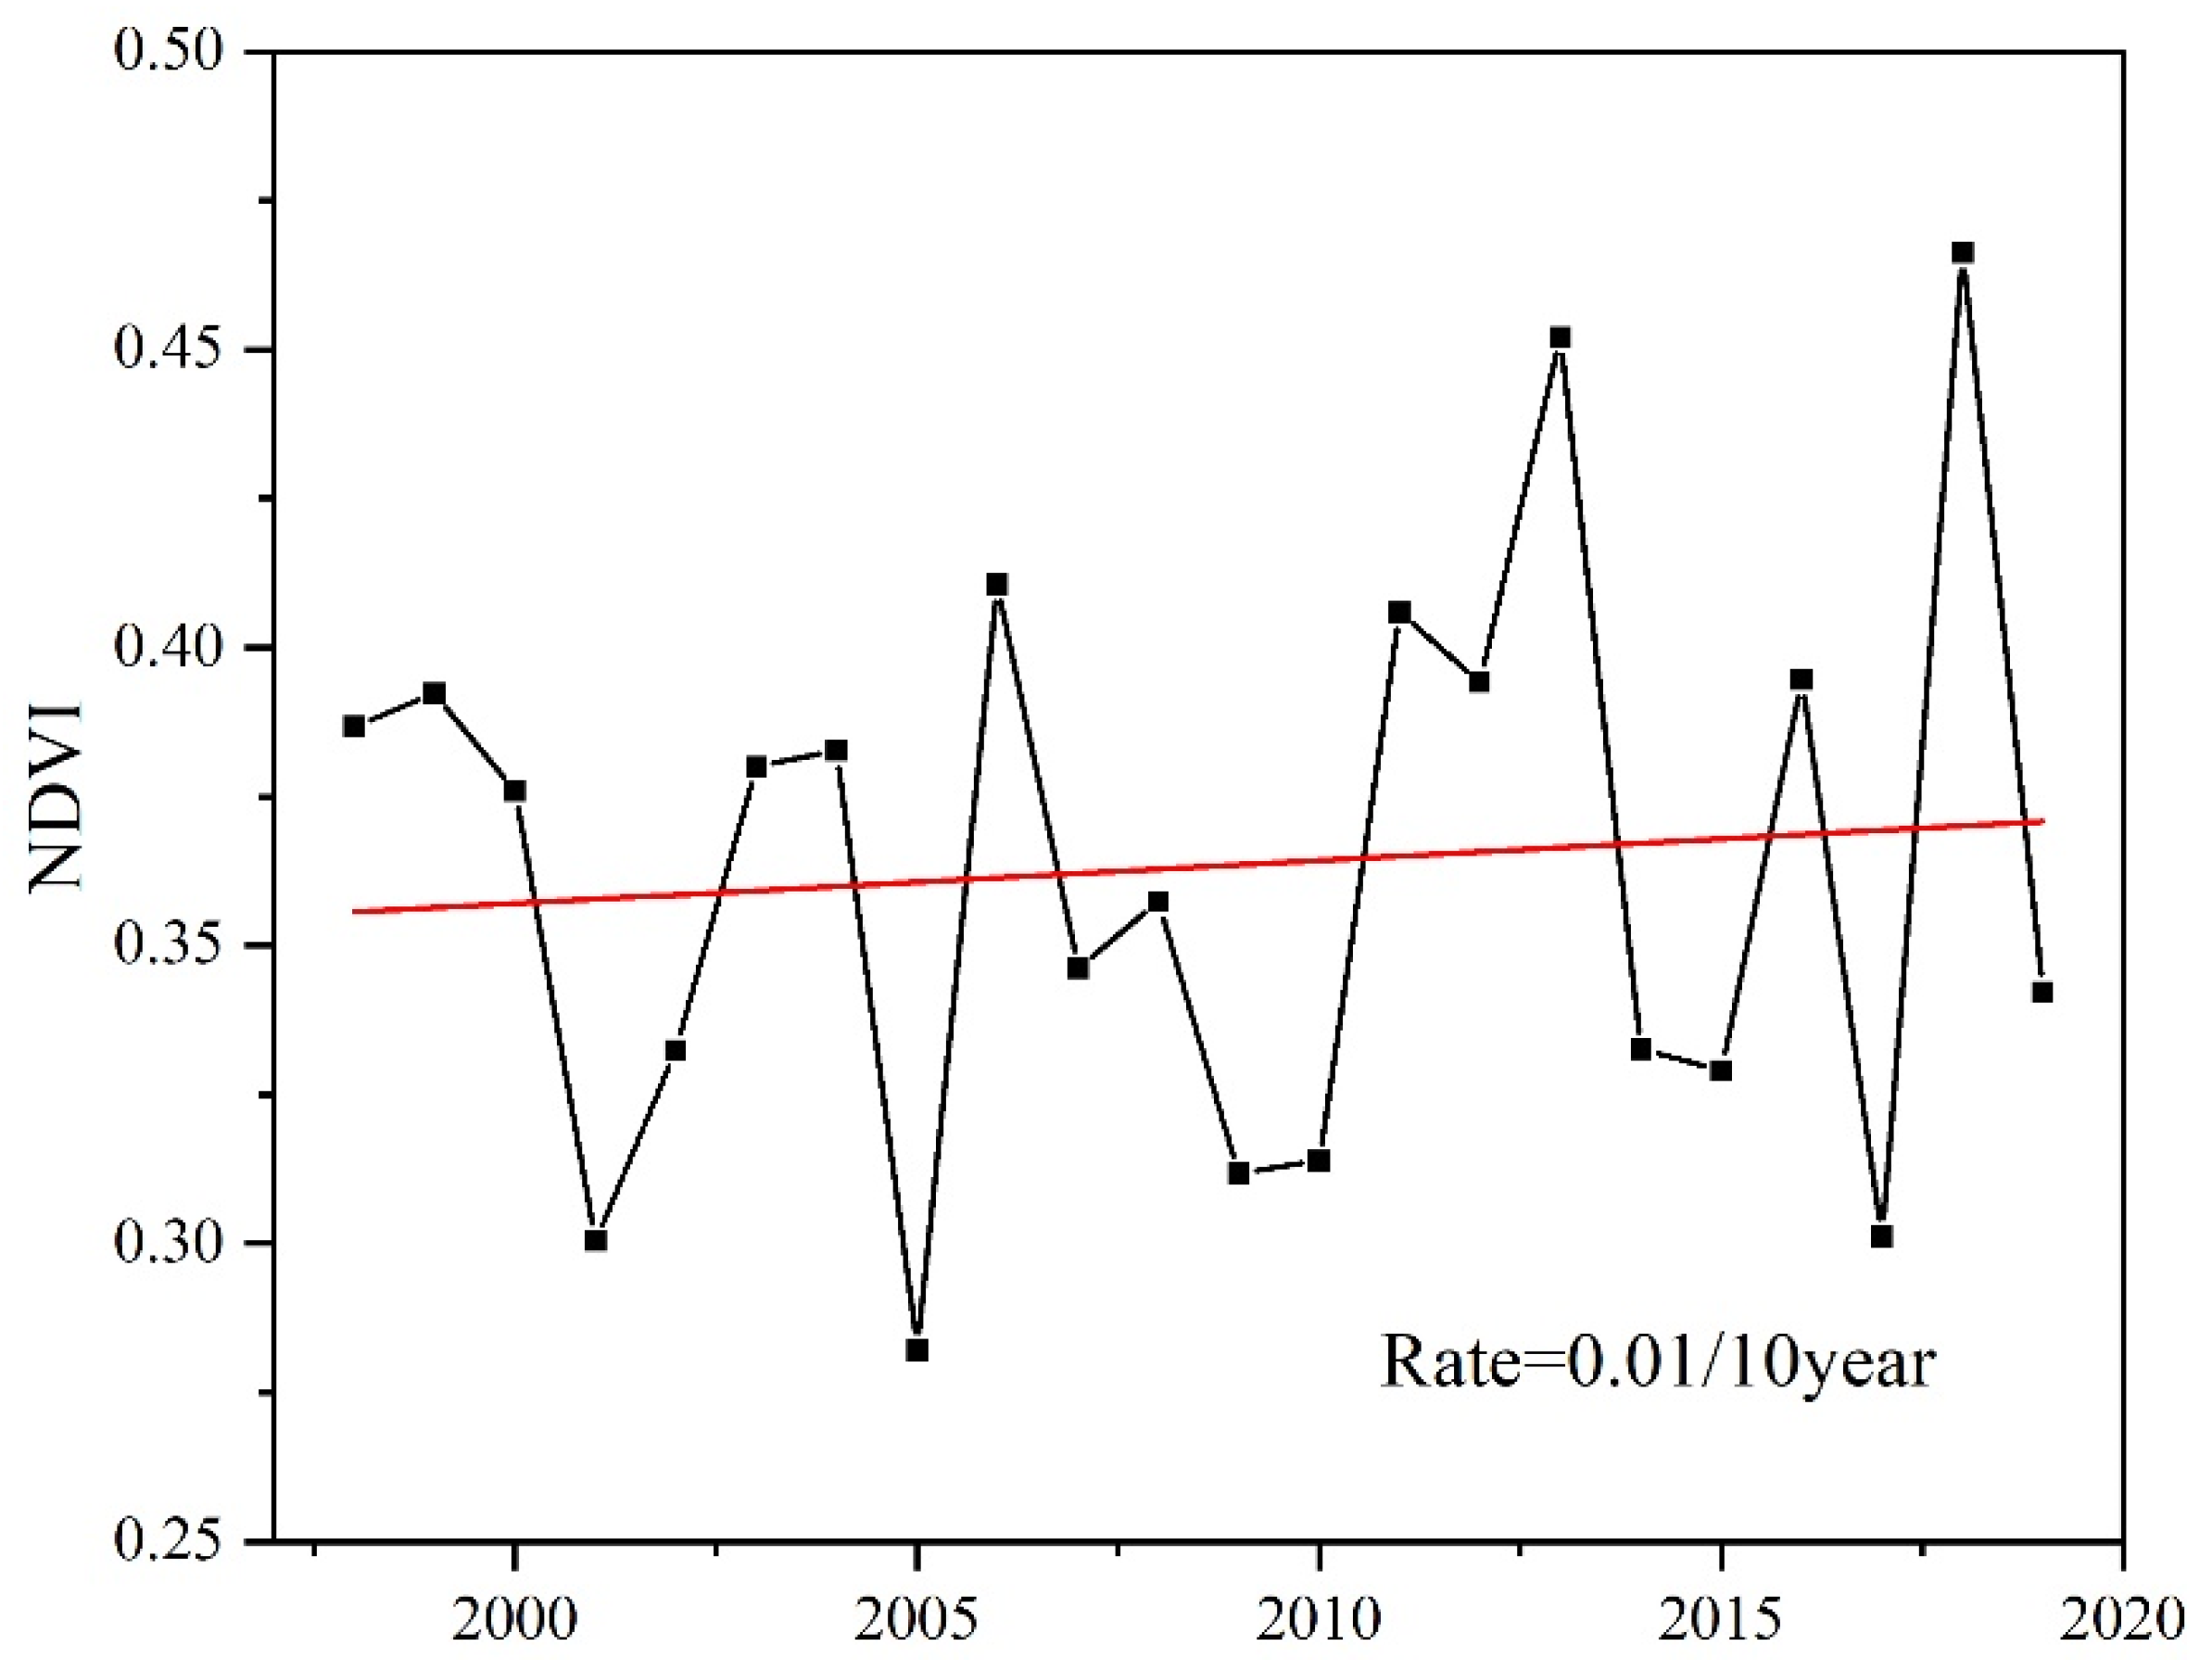
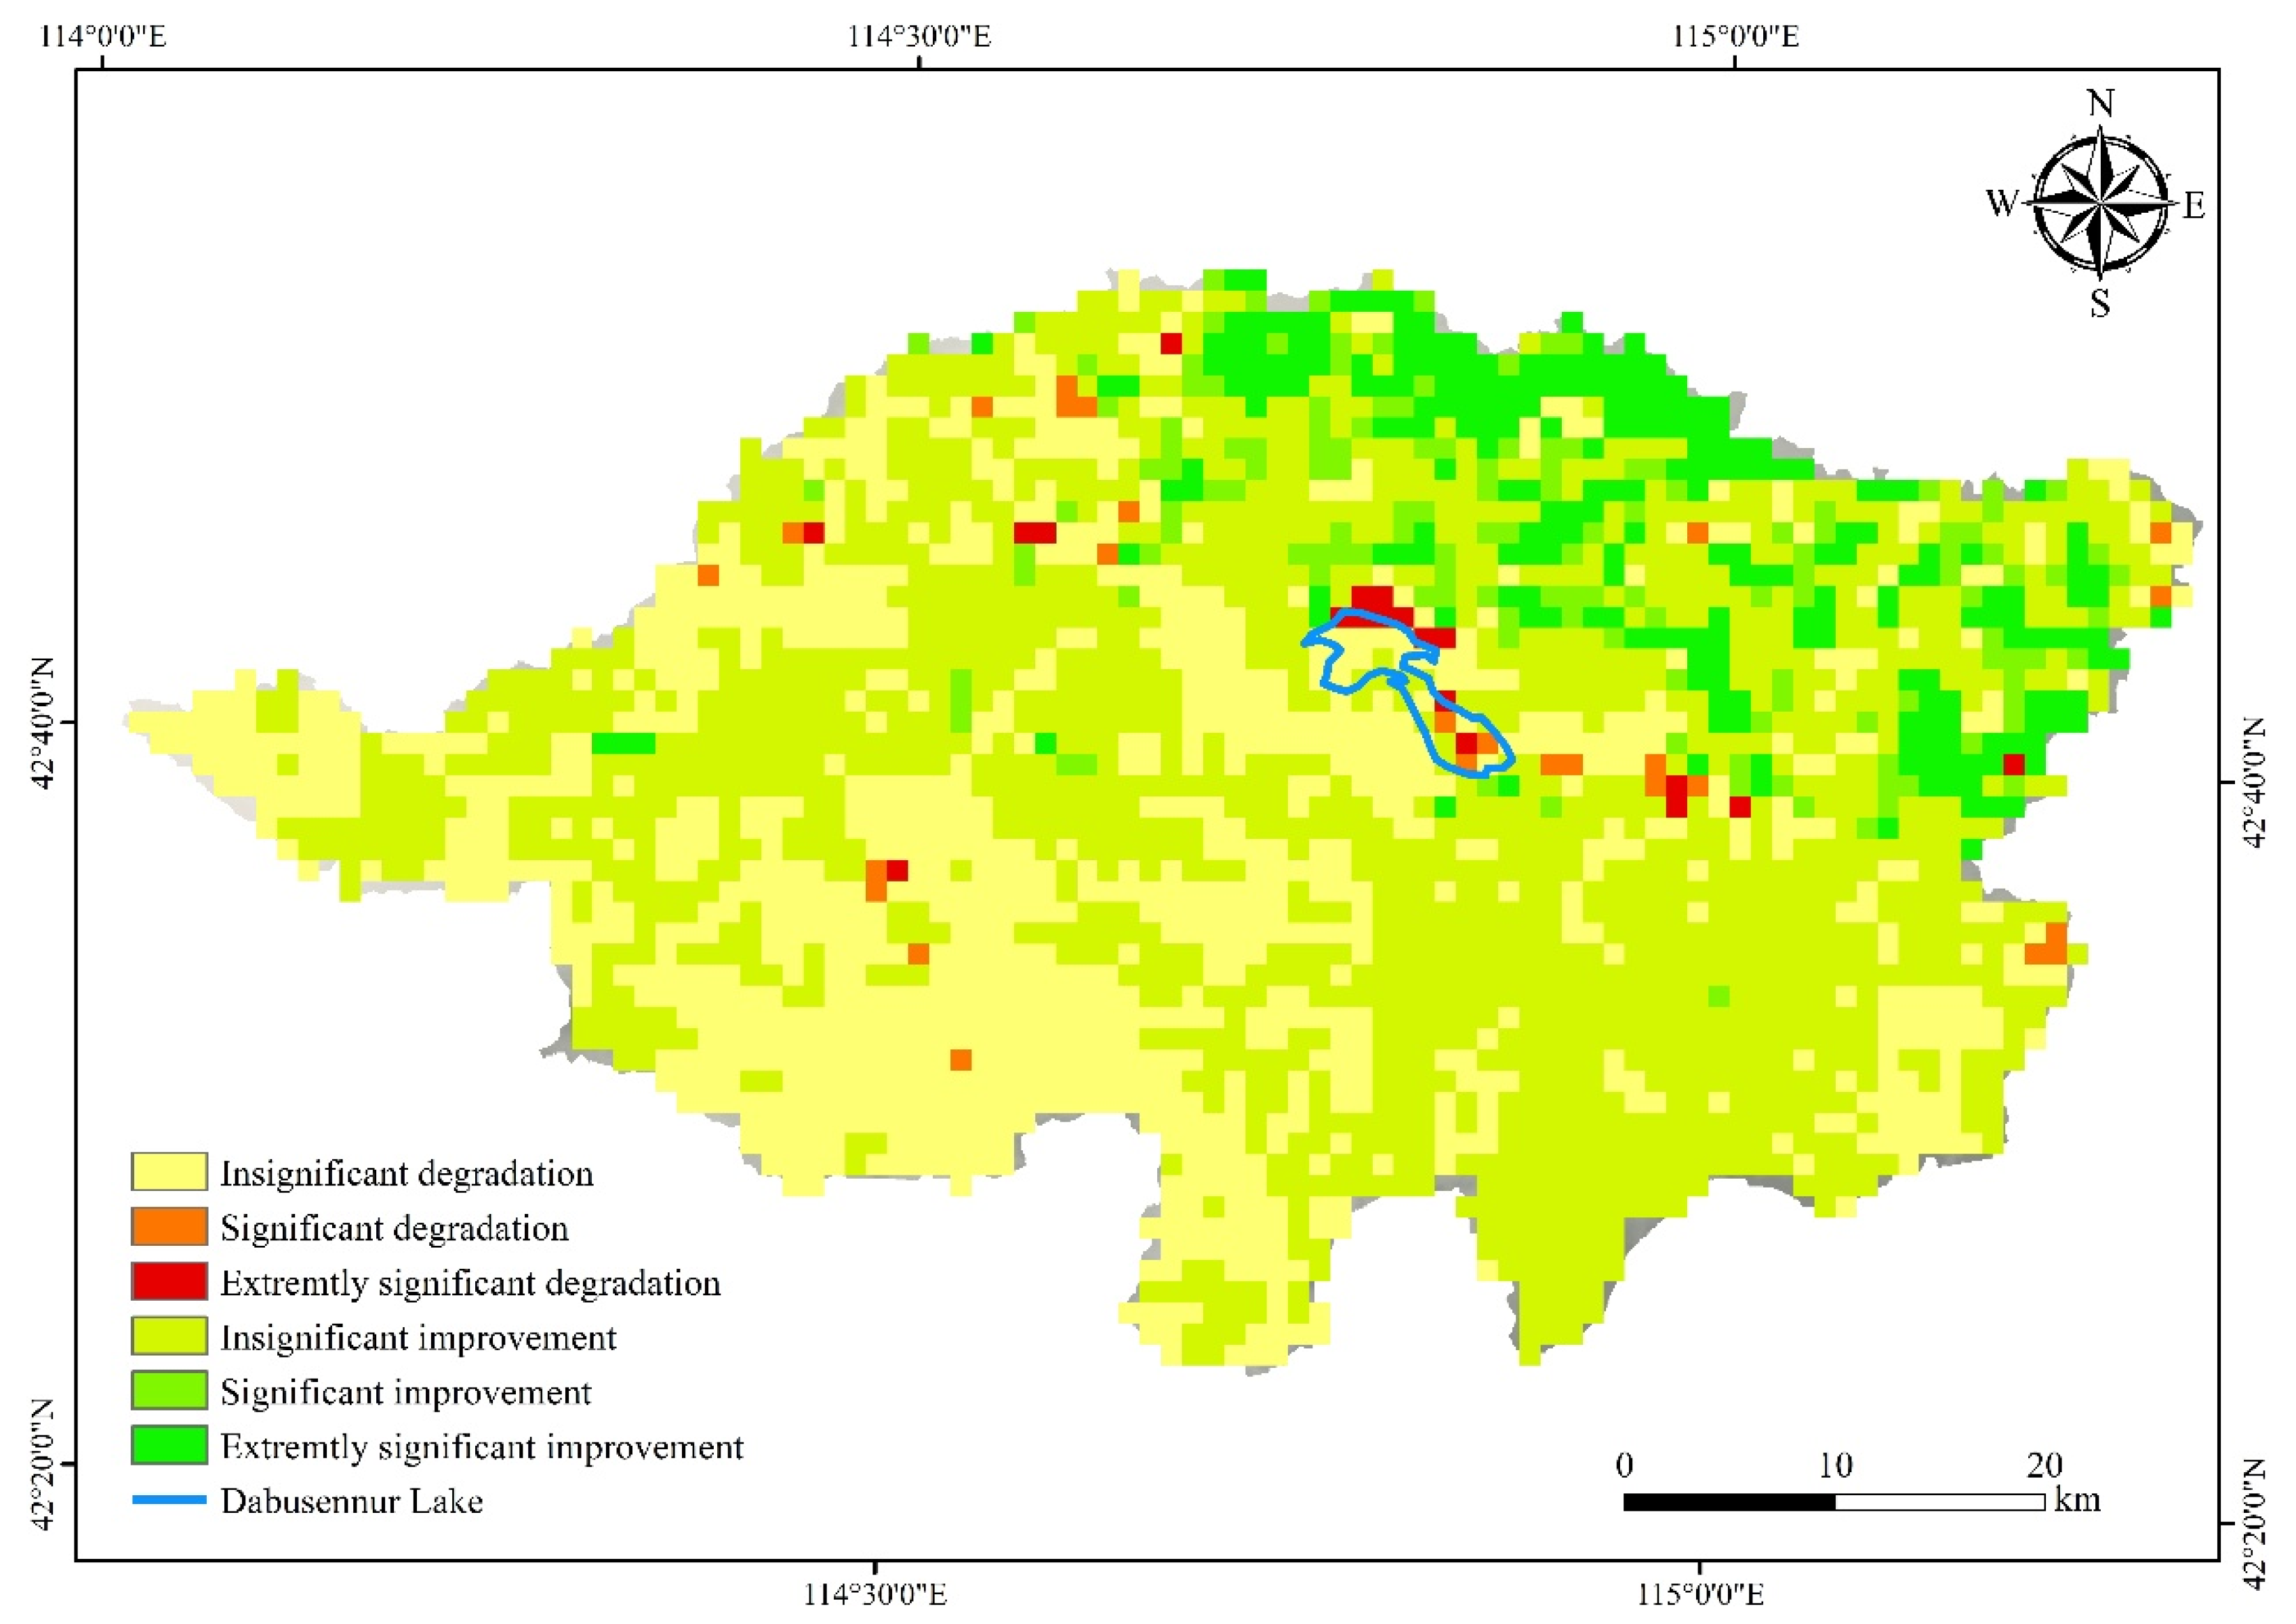
3.1. NDVI Dynamics in the DW from 1998 to 2019

To accurately describe the DW vegetation distribution pattern, we analyzed its spatial distribution properties based on the mean value of the NDVI over these years (Figure 3). As depicted in Figure 3, clear regional differences are observed in the spatial distribution of the NDVI, with a gradual decrease from south to north. We employed an equal-spacing reclassification method to categorize the NDVI into five levels. Table 3 illustrates that most areas within the basin belong to the low-medium coverage category, accounting for approximately 74.81% of the total basin area; while low-medium and medium coverage areas together account for about 99.27% of the basin area. From the perspective of time change, the NDVI distribution pattern of DW from 1998 to 2019 has little change, showing a fluctuation type change (Figure 4). This indicates that the overall growth state of the DW vegetation is poor.
Based on the temporal change trend in the watershed average NDVI (Figure 5), it is evident that the vegetation in the DW exhibited variation from 1998 to 2019, displaying a fluctuating pattern with a rate of change of 0.01/10 years. Notably, the mean NDVI value reached its lowest point in 2005 at 0.28 and peaked in 2018 at a maximum value of 0.47, while the multi-year average stood at 0.36.
The NDVI trend analysis was employed to calculate the dynamic slope of NDVI of over 22 years in DW. The spatial distribution results of NDVI variation trends in DW were obtained by conducting significance tests using the F-test (Figure 6). Based on the test results, the change trends were categorized into six levels and statistically analyzed for different change trends (Table 4).
According to Figure 4 and Table 4, approximately 36.61% of the basin exhibits a degradation trend, while around 63.69% shows an improvement trend. The majority of regions within the basin display an insignificant change trend, accounting for approximately 85.22% of the total area; notable improvements are observed in about 13.22% of the basin, primarily concentrated in its northeastern region; significant degradation is identified in approximately 1.56% scattered across the entire basin area. These findings suggest a potential association between human activities and the pronounced degradation of NDVI.

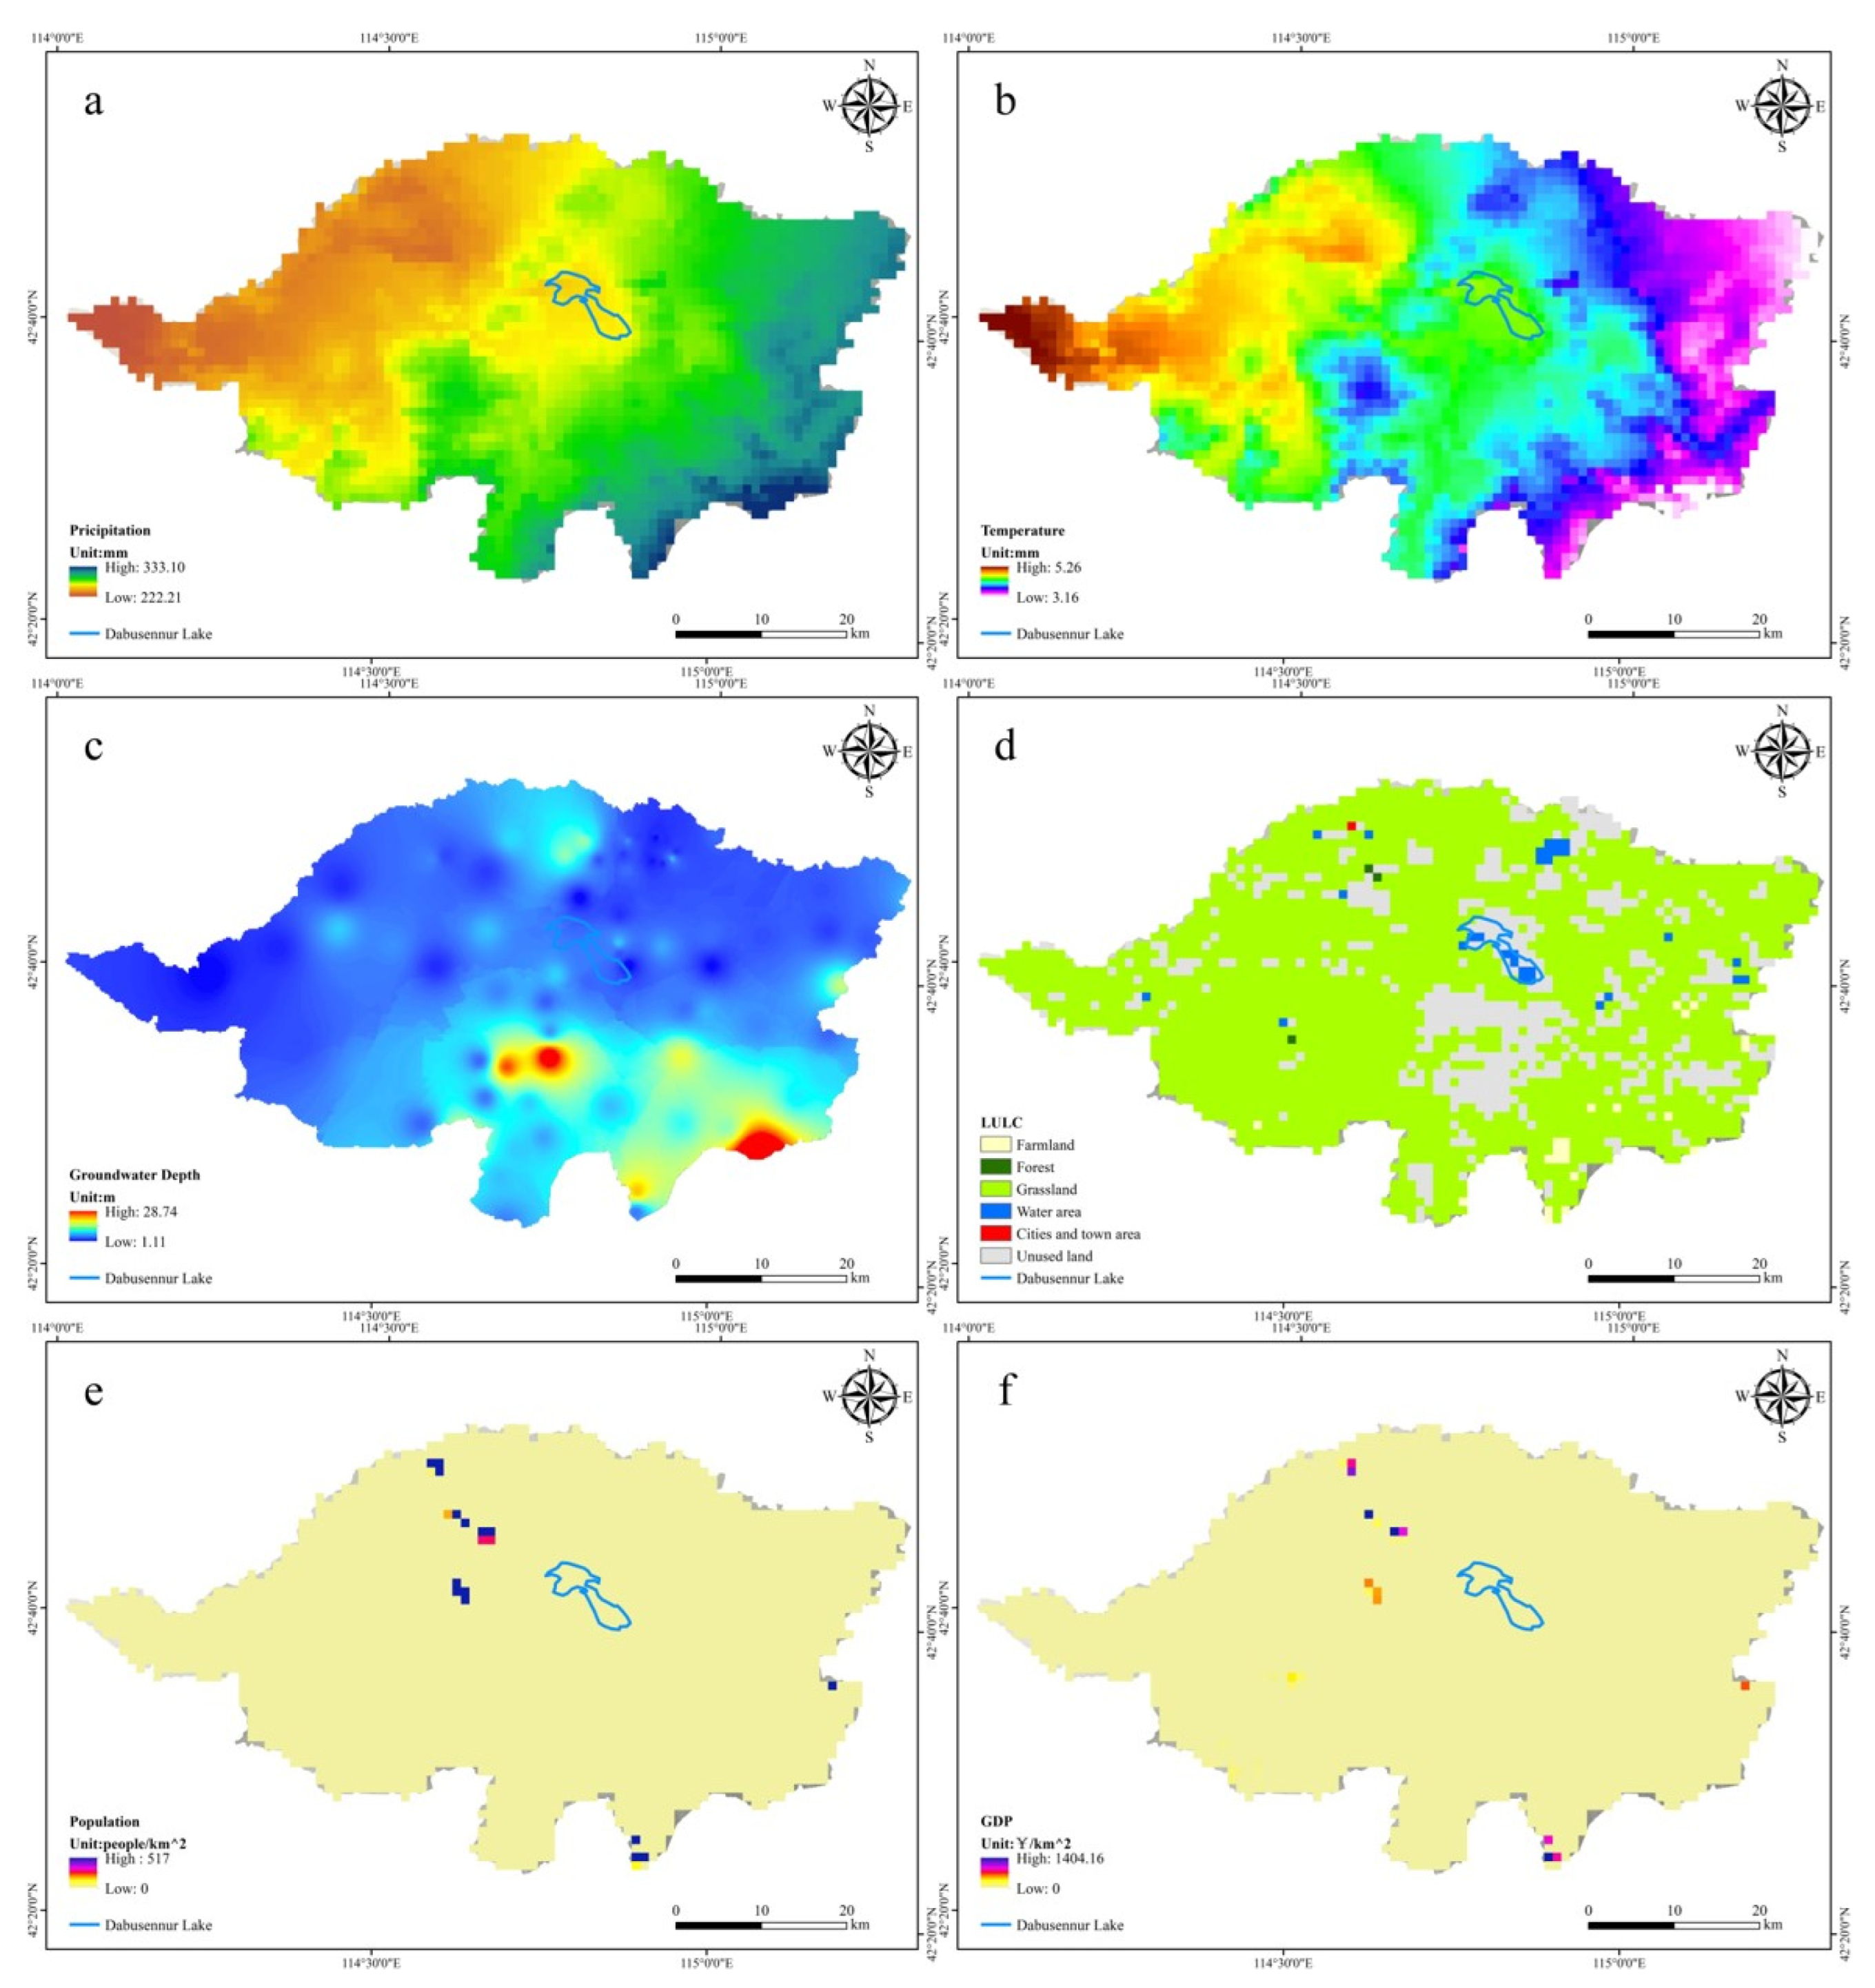
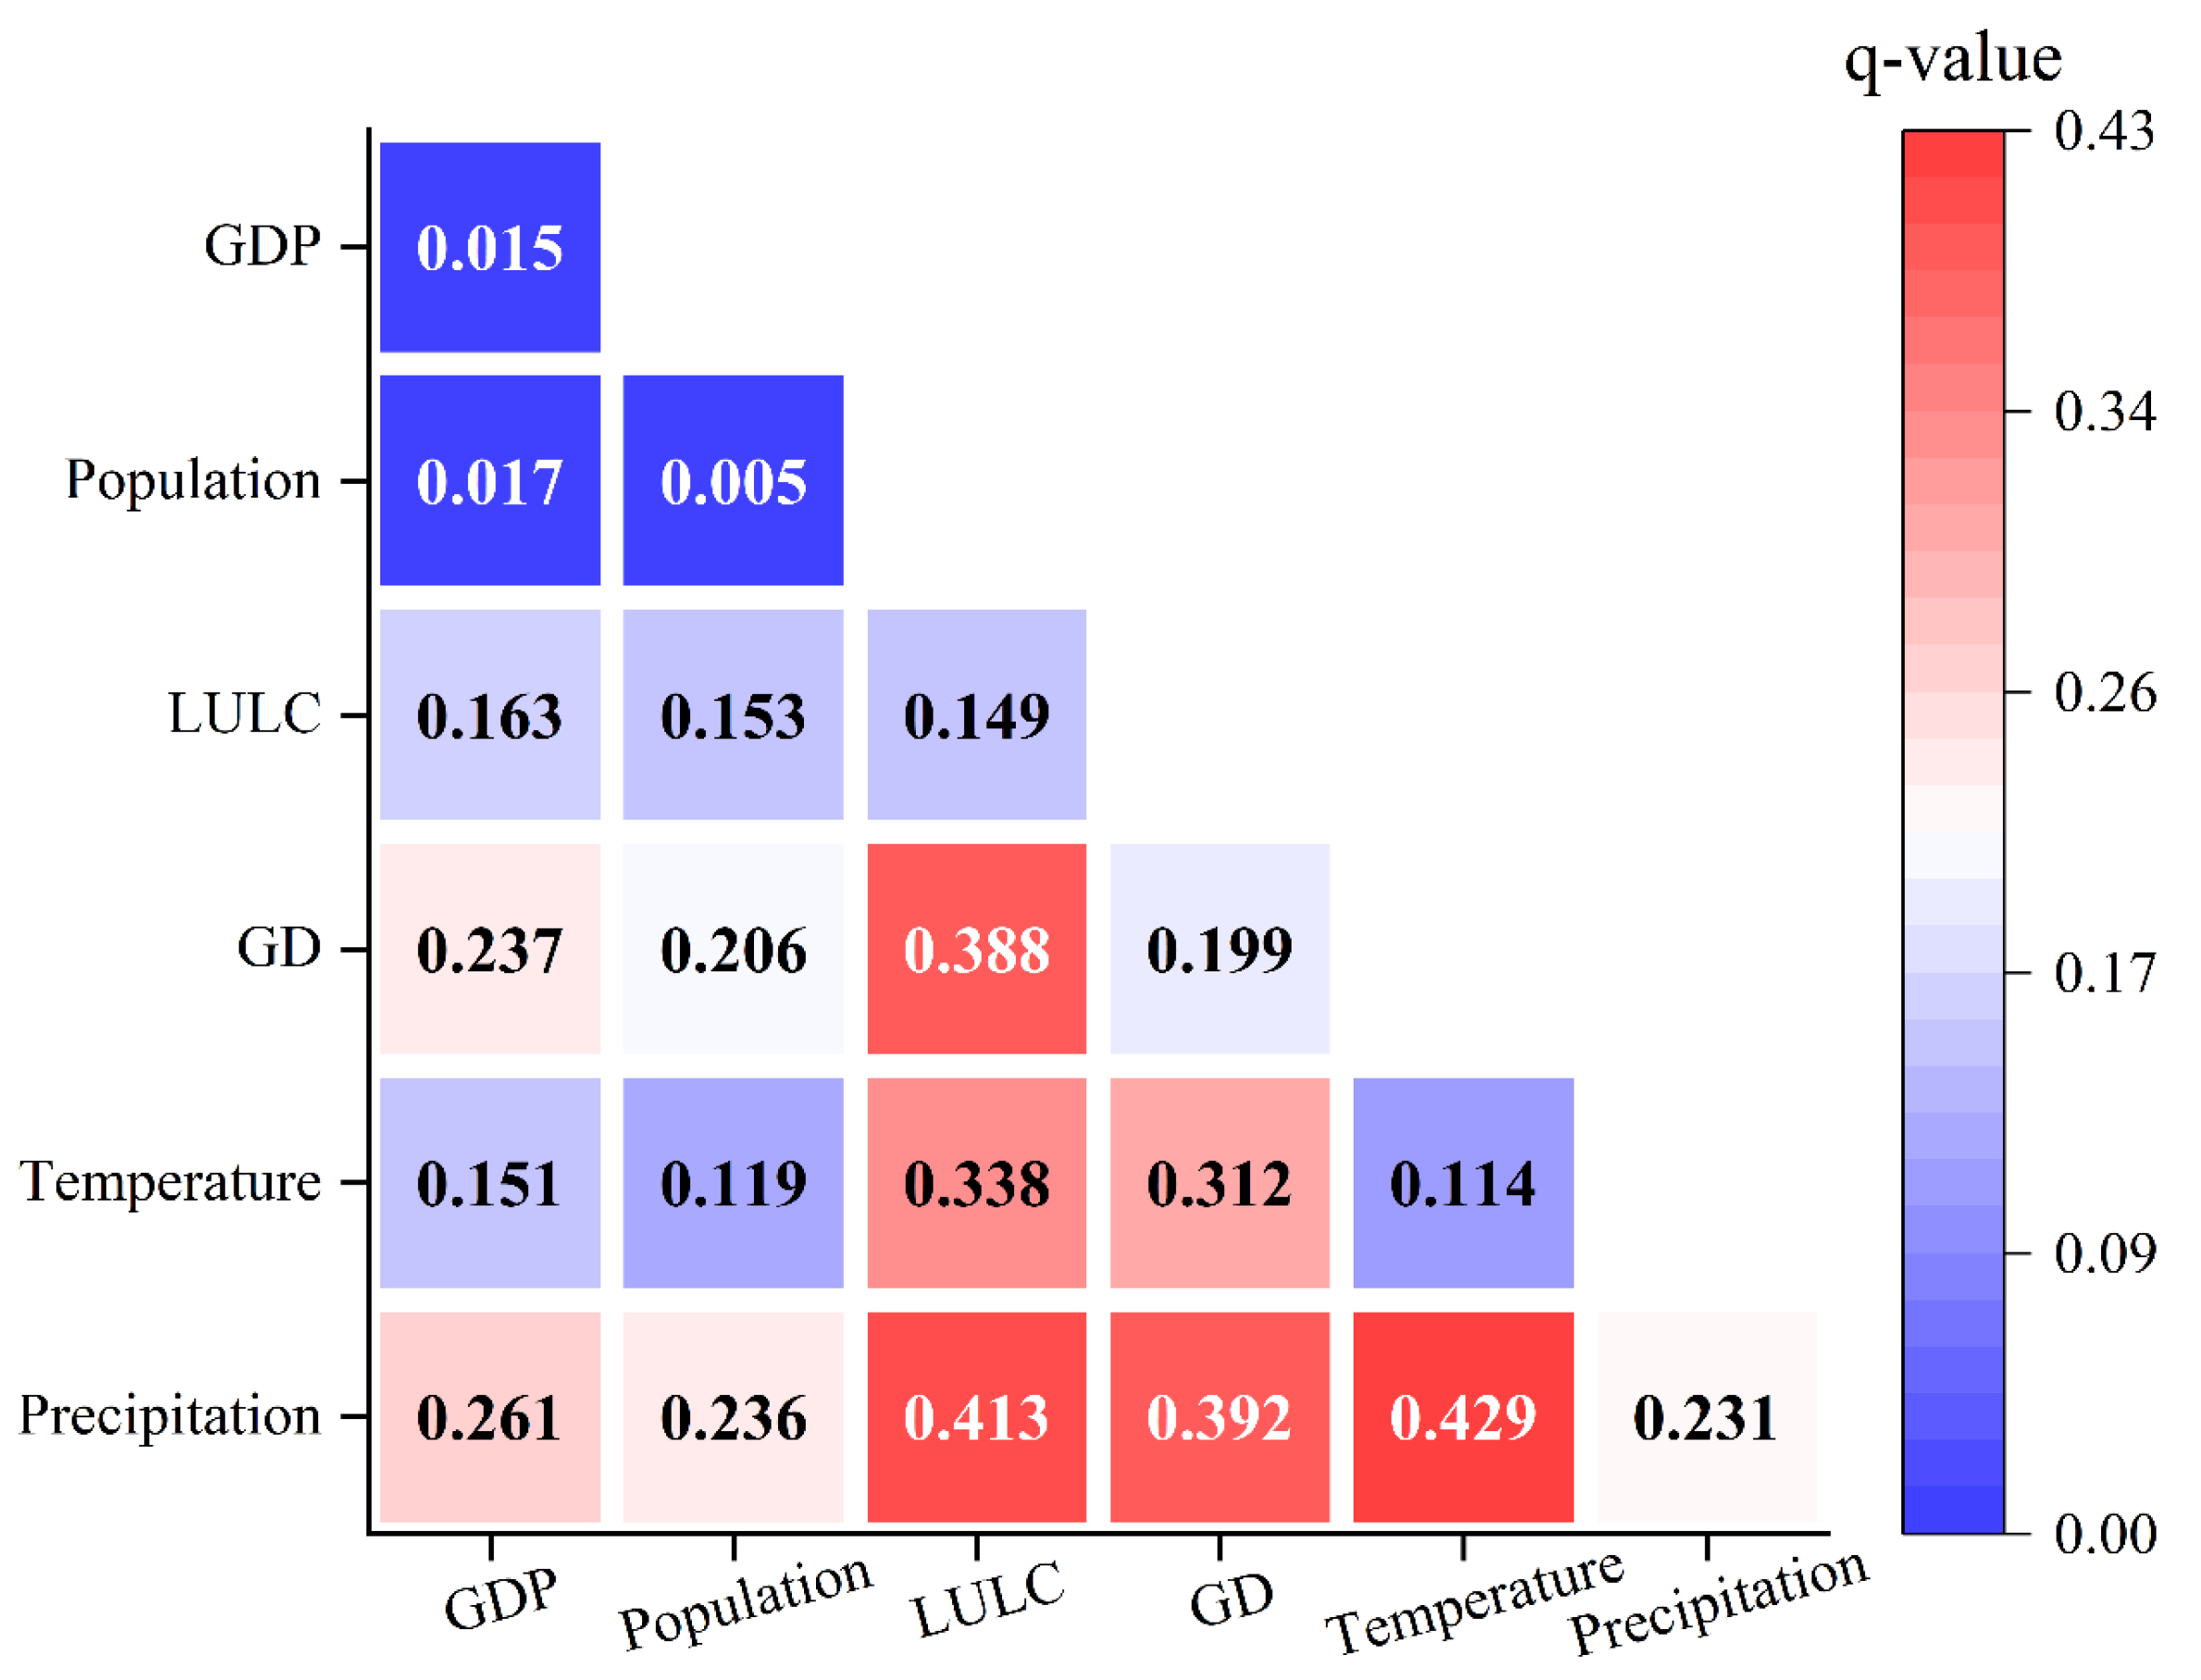
3.2. Analysis of Spatial Distribution Driving Forces of NDVI in DW

To investigate the extent to which each driver factor and their interactions, as well as the combined influence of natural and human factors, affect the vegetation coverage. By analyzing the q-value of each factor, we can identify the dominant drivers influencing NDVI distribution, including precipitation, temperature, GD, LULC, population, and gross domestic product (GDP) (Figure 7).
Based on the Geodetector, the q-value of each driving factor in the area was calculated and analyzed (Table 5). The results revealed that the impact of individual driving factors on NDVI within the region can be ranked as follows: precipitation (0.231) > GD (0.200) > LULC (0.149) > temperature (0.114) > GDP (0.015) > population (0.005). The spatial heterogeneity of NDVI within the basin is the result of combined influences from natural and human factors, with the precipitation and GD exhibiting significant contribution rates, having q-value ≥ 0.2 and explanatory power exceeding 20%. These two factors emerge as primary influencers, while other contributing factors exhibit a relatively minor influence.
The interplay between natural and human factors on the NDVI variability was investigated by employing GeoDector to analyze the interaction among different drivers and their influence on the spatial differentiation of the NDVI (Figure 8).
The q-value obtained from the interaction of driving factors, as shown in Table 6, exhibited varying degrees of improvement. Specifically, the combined effect of the two factors was found to be stronger than that of a single factor, leading to an enhanced explanatory power for the spatial differentiation of NDVI. From a perspective on interaction types, eight out of the interaction factors demonstrated nonlinear enhancement, while seven showed double enhancement. Notably, based on these interaction results, it is evident that both annual average precipitation and GD play important roles in driving the spatial differentiation of the NDVI in the DW region. Moreover, among all interactions examined, those involving precipitation and temperature (both natural factors) were particularly significant with a large q-value (0.429), indicating their substantial influence on the NDVI values in this area. Additionally, there was also a noteworthy interaction between precipitation (representing natural factors) and LULC (representing human factors), with an interaction q-value of 0.413. This suggests that the interplay between natural factors and human factors exerts a substantial influence on the NDVI values within the region.

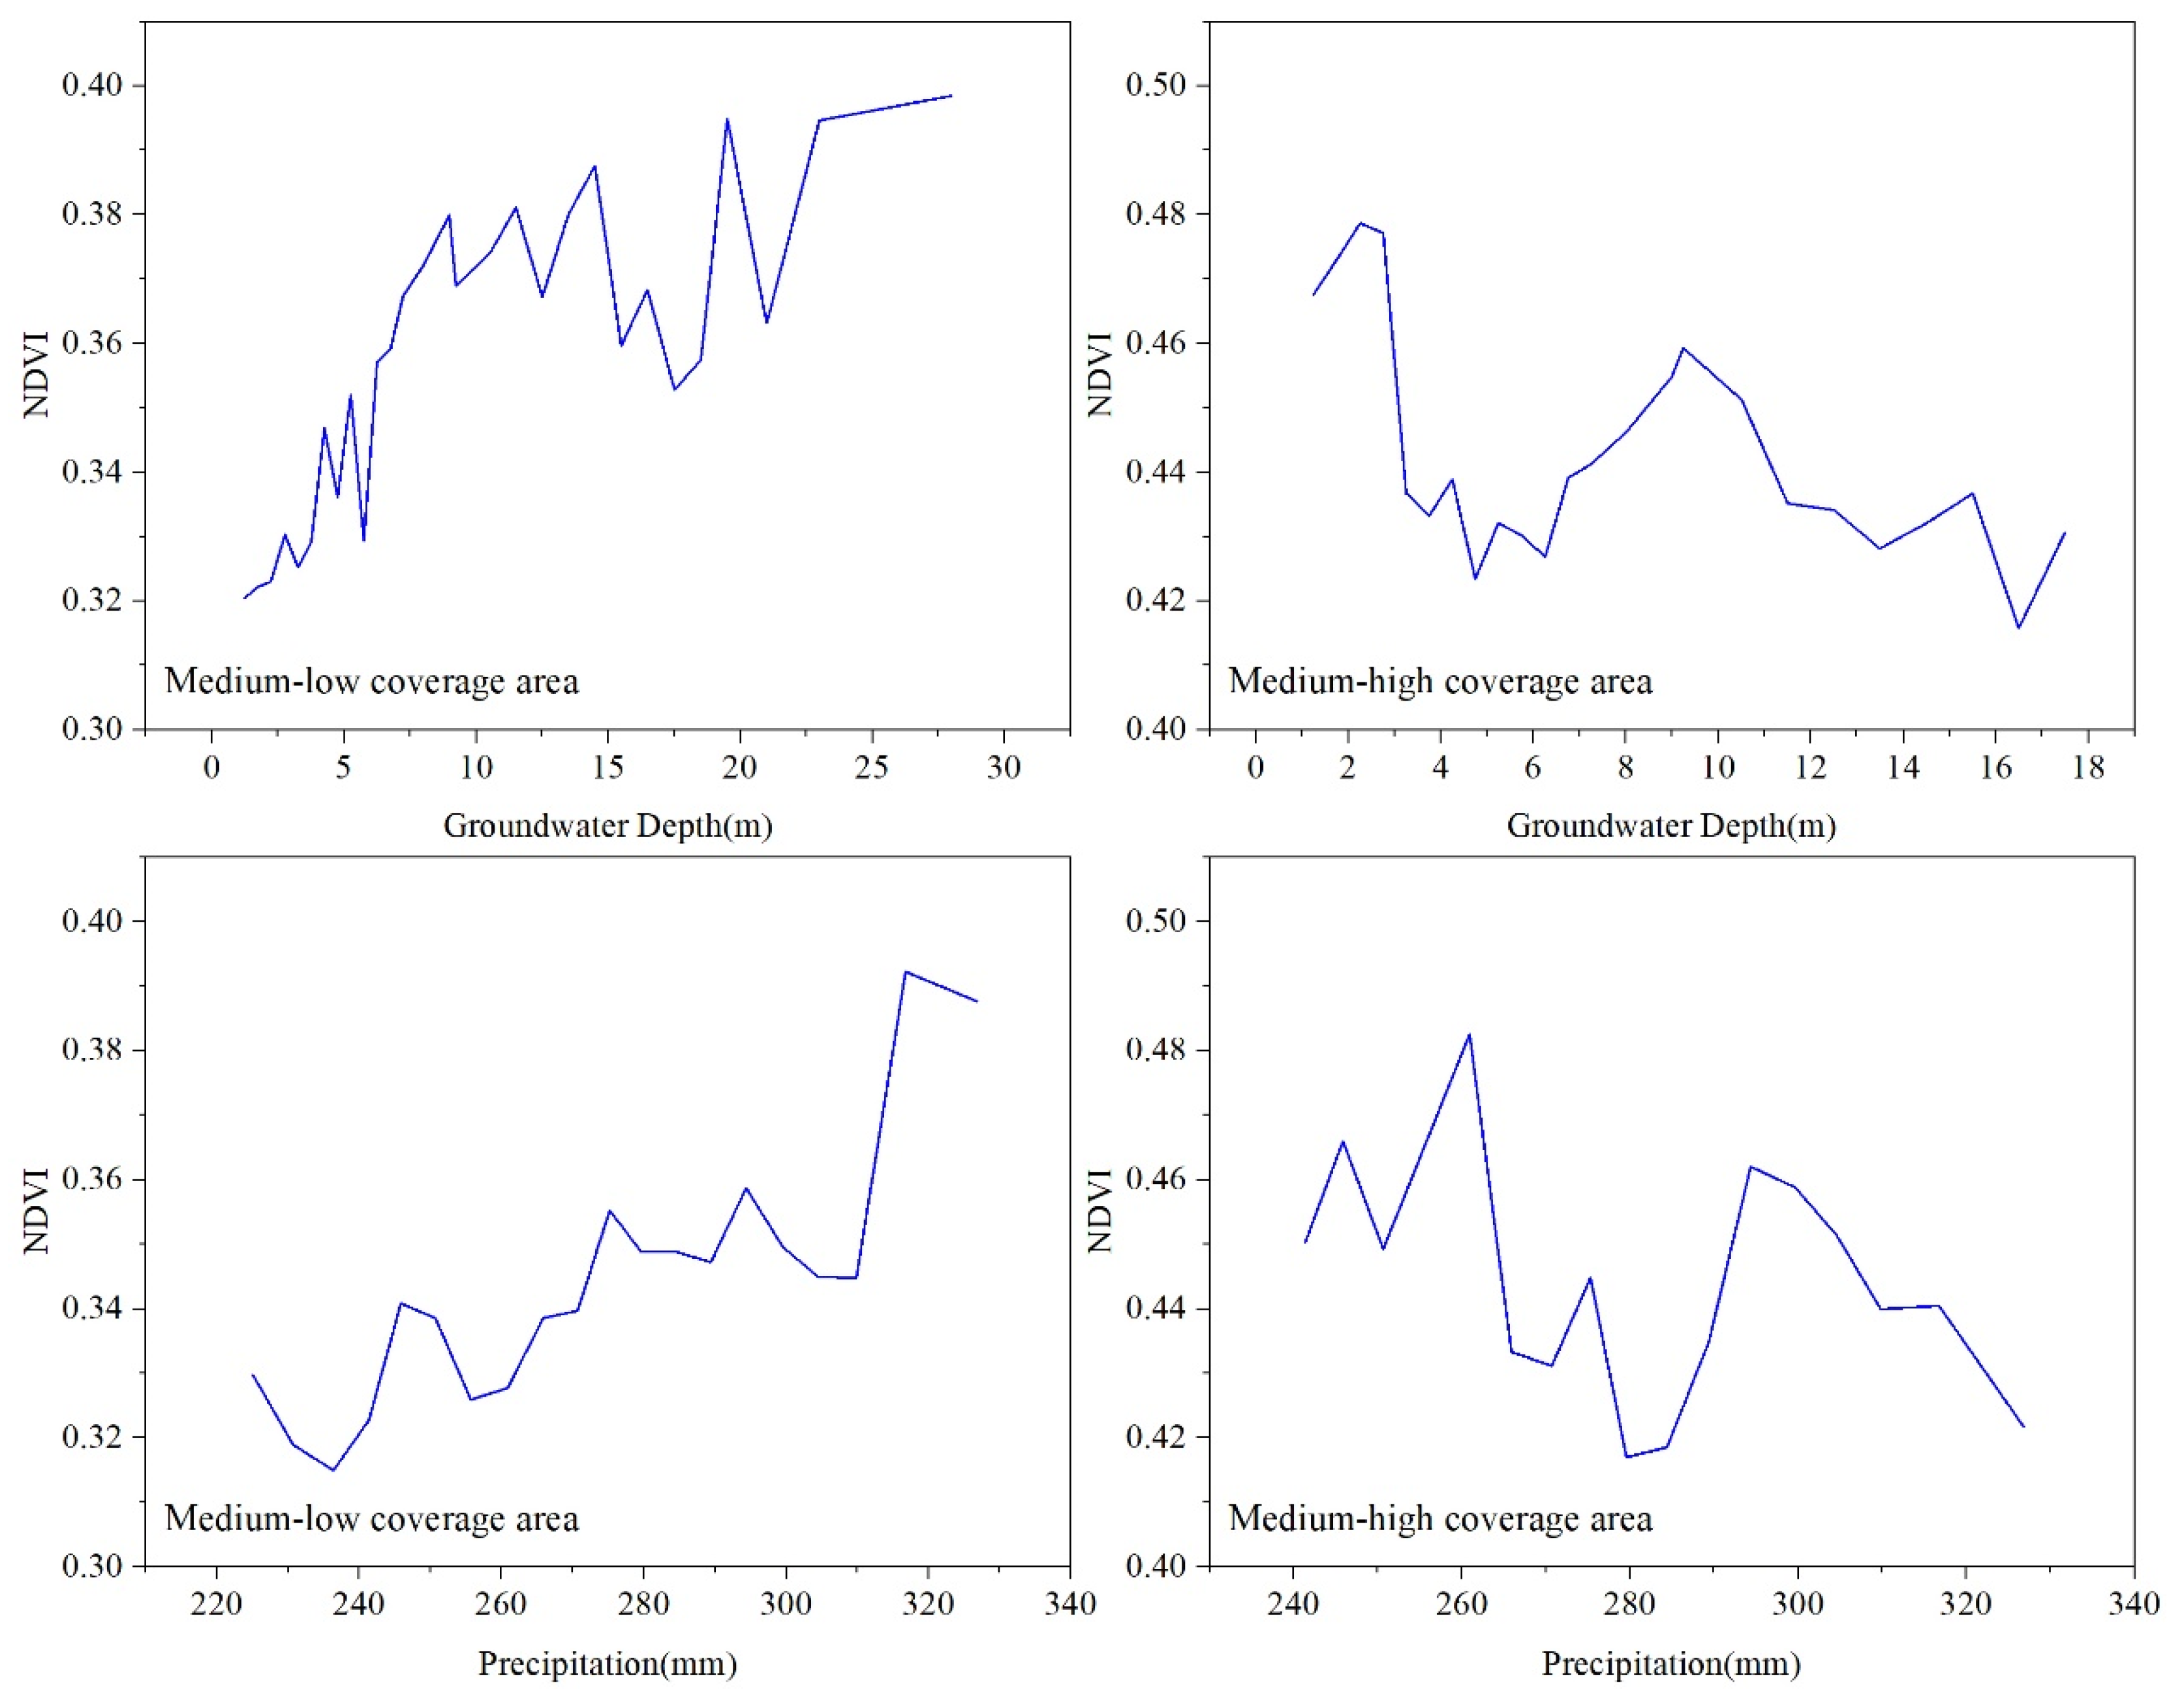
3.3. Response of NDVI to Variation of Precipitation and GD

According to Table 4, the low-medium and medium coverage areas collectively encompass 99.27% of the basin area. Consequently, we examine the response of the NDVI to variations in precipitation and groundwater in regions with medium-low coverage (0 ≤ NDVI < 0.4) and medium-high coverage (0.4 ≤ NDVI < 1), respectively. The GD was measured at intervals of 0.5 m, while precipitation was measured at intervals of 5 mm. The average value of the NDVI within each interval was utilized for analysis (Figure 9).
The NDVI in the medium-low coverage area exhibits an increase in both GD and precipitation, while the NDVI demonstrates limited dependence on GD but a strong correlation with precipitation. In this area, the vegetation primarily relies on precipitation for growth. The maximum NDVI of vegetation in the medium-high coverage area is observed at a GD of 2.75 m and a precipitation level of 260 mm, indicating that groundwater plays a crucial role in supporting vegetation growth when the GD is shallow. With increasing GD, the NDVI experiences a rapid decline under low precipitation conditions. However, as precipitation reaches 280 mm, there is another sharp rise in the NDVI, suggesting an increasing reliance on precipitation as the GD increases. In conclusion, an optimal range for achieving high NDVI values lies within the interval of 2.5–3 m for GD, and higher levels of precipitation are more favorable for promoting vegetative growth.

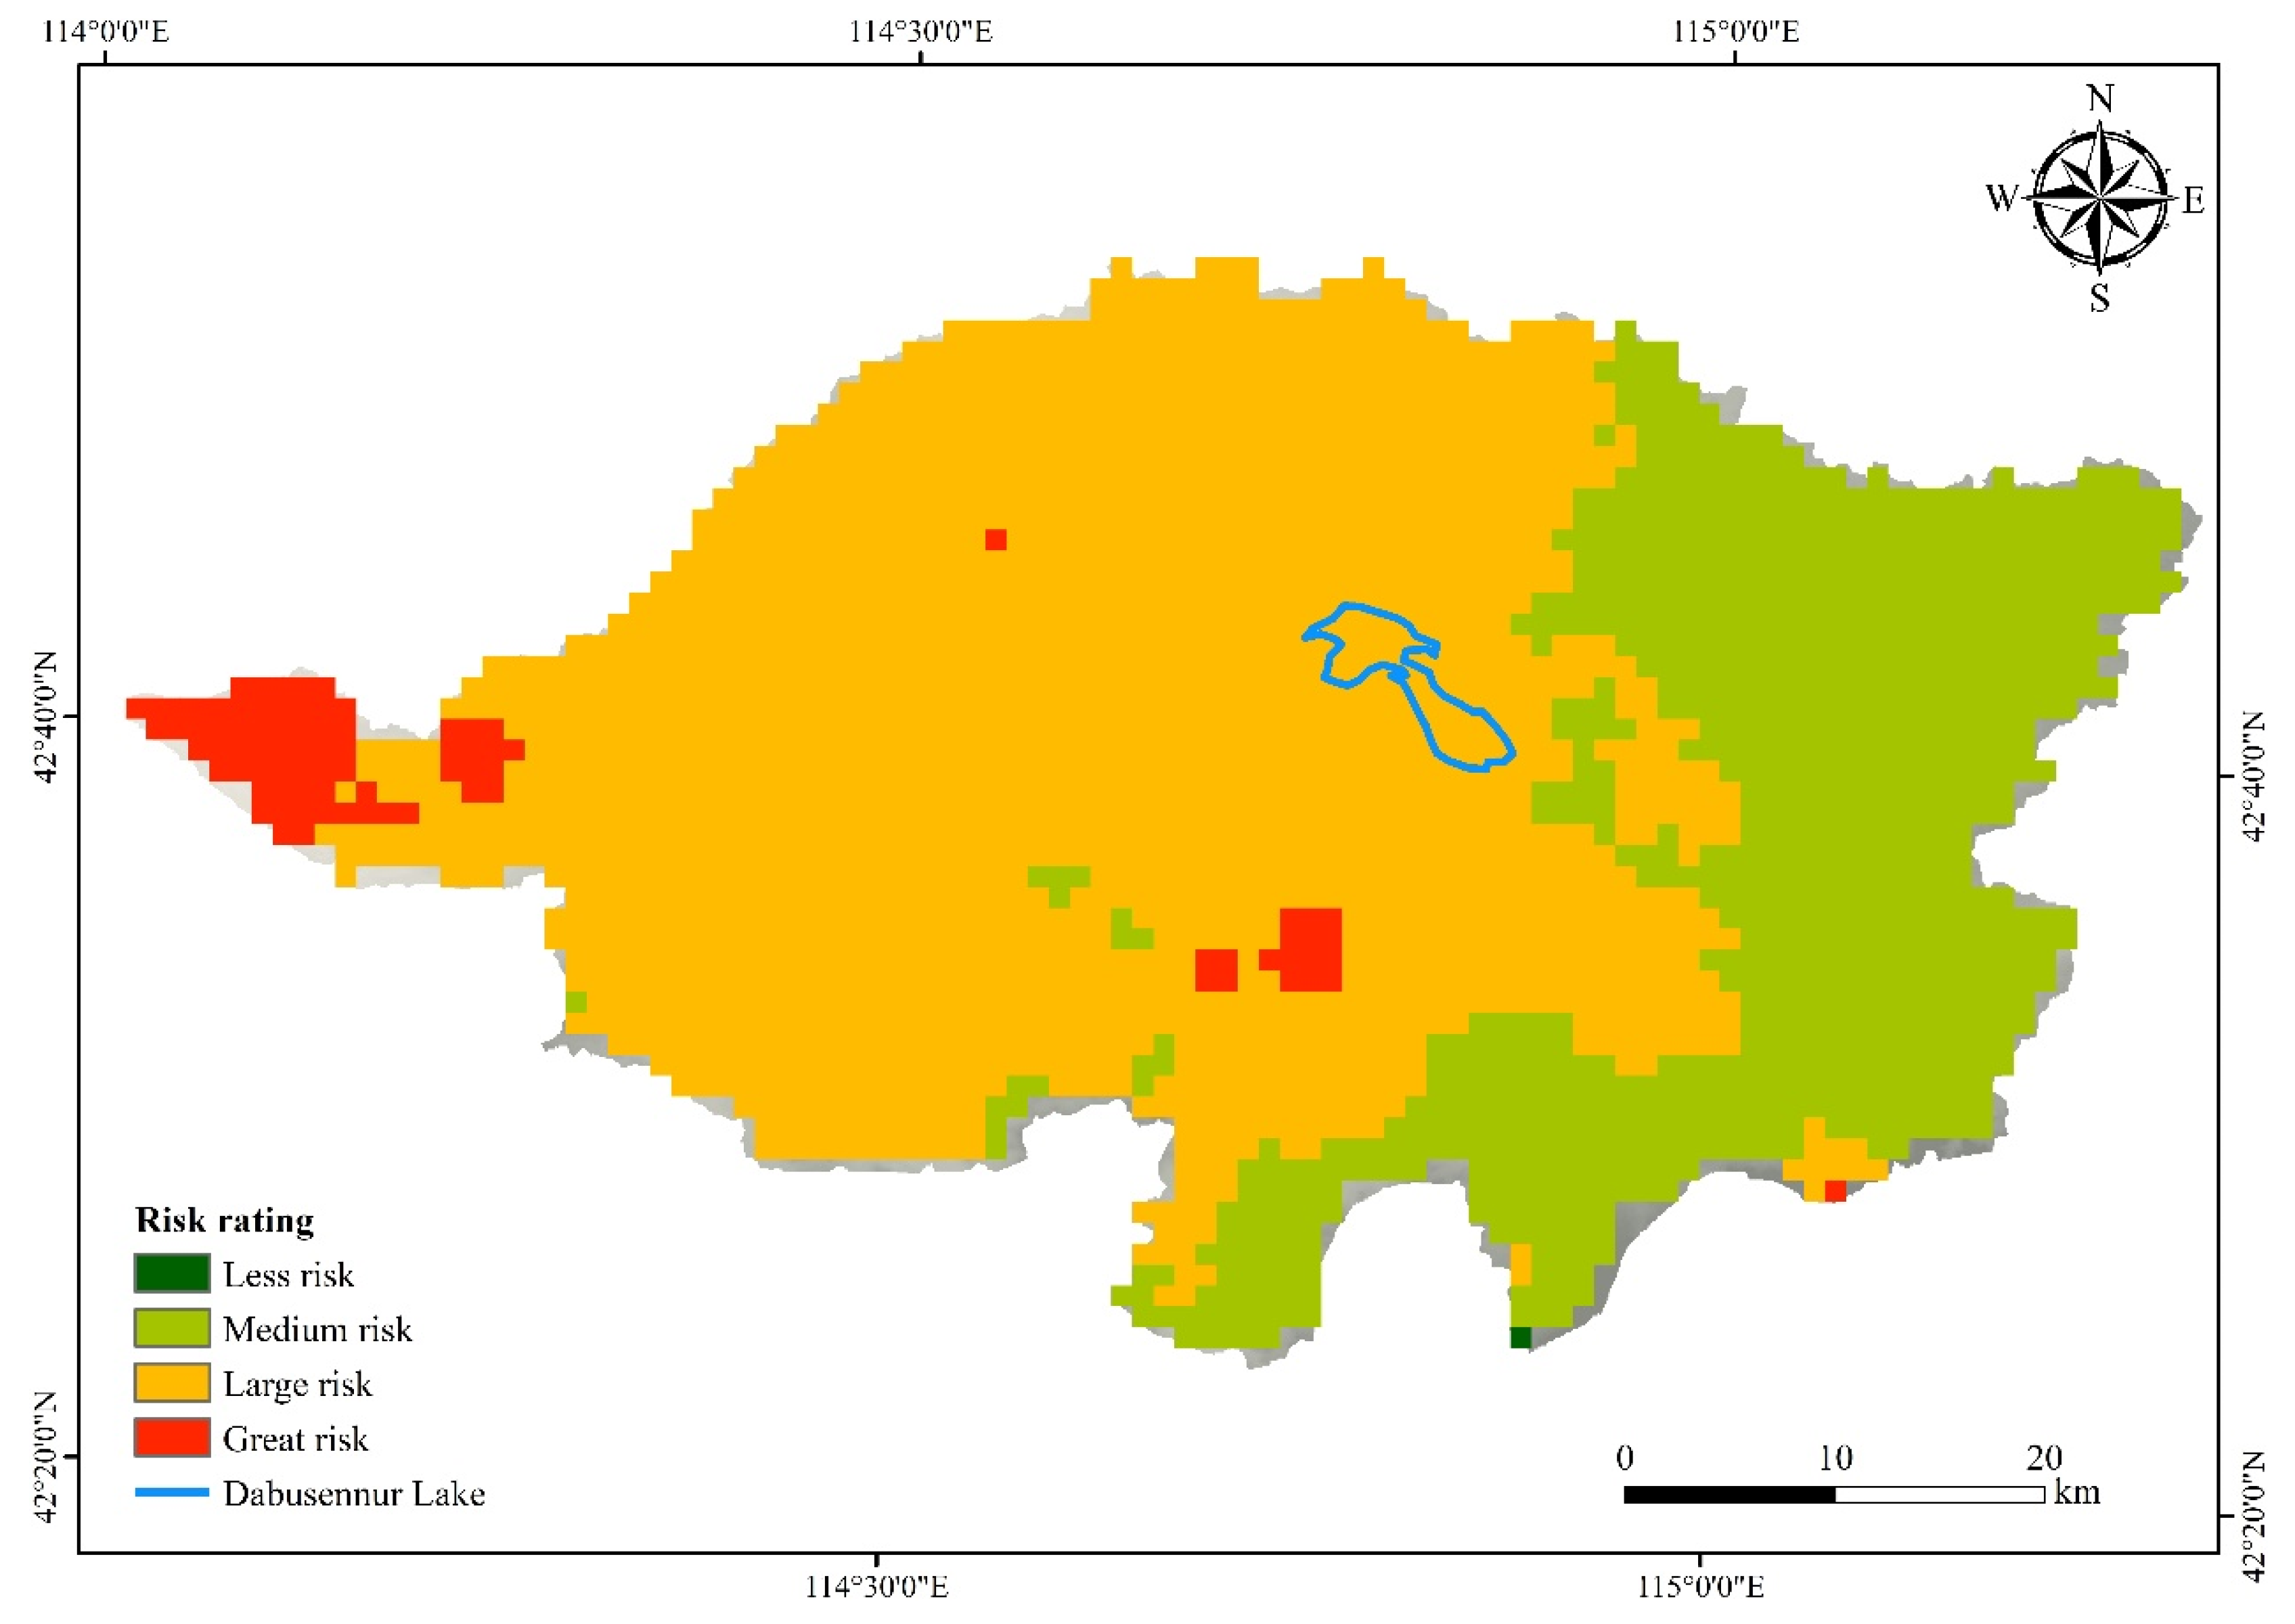
3.4. Risk Assessment of Vegetation Ecological Degradation

The weight coefficients of each evaluation factor are presented in Table 6. The classification criteria for the VEDR in this region were determined based on the ecological environment of the Hunshandake Sandy Land and by referencing classification methods employed in relevant studies, resulting in a four-level division, as illustrated in Table 7.
The assessment results are presented in Table 7 and Figure 10. In the study area, the VEDR values ranged from 0.12 to 0.60, with an average value of 0.35.
The regional VEDR levels exhibit distinct spatial variations, primarily in Level 2 (large risk), encompassing 66.17% (1922.99 km2) of the total area, predominantly situated in the central and western regions of the basin. This region serves as a transitional zone between Level 3 (medium risk) and Level 1 (great risk), with a relatively low NDVI value, shallow GD, and insufficient precipitation. Meanwhile, Level 3 (medium risk) is predominantly situated in the eastern part of the basin, covering approximately 30.77% (894.13 km2) of its total area, characterized by a shallow GD and sufficient precipitation. The smallest proportion belongs to Level 1 (great risk), which only accounts for a mere 3.06% (88.80 km2), with a deep GD and insufficient precipitation. There are no Level 4 (less risk) areas in the basin. Overall, Level 2 and Level 3 dominate the basin, encompassing 96.94% of its total area. The vegetation ecology exhibits fragility and susceptibility to exceedingly arid weather conditions as well as extensive human exploitation of groundwater resources. Additionally, the implementation of artificial rainfall or ecological water transport could be considered by local authorities to facilitate the restoration of the basin’s vegetation ecology.

4. Discussion

4.1. Spatiotemporal Vegetation Changes

Previous studies have demonstrated significant improvements in vegetation conditions across different spatiotemporal scales in Inner Mongolia [18,42,43,44]. Our research reveals a gradual enhancement of vegetation over the past two decades, with an average increase rate of 0.01 per decade, which exhibits fluctuations potentially attributed to precipitation variations. Interestingly, our findings diverge from those reported for other high-altitude regions such as the Yunnan Plateau [24], while aligning with recent discoveries within other parts of Inner Mongolia [13,14,28]. These distinct patterns may be explained by disparities in the research scope, temporal coverage, and regional climatic characteristics.

4.2. Vegetation Dynamics in Response to Climate Change and Human Activities

In arid and semi-arid climates, where temperature and radiation are also crucial factors, precipitation plays a pivotal role in constraining plant development [45,46]. According to our research, the combined influence of temperature and precipitation significantly enhances the explanatory power of vegetation change [23,47], accounting for over 40% of the variations in vegetation dynamics. GD contributes approximately 20% of vegetation change, representing another crucial factor. The primary anthropogenic factors driving changes in the ecological environment of the watershed encompass the implementation of ecological protection and restoration, alongside agricultural practices [6,8,19,33]. In this study, LULC may account for approximately 15% of the variations in vegetation dynamics. However, when combined with precipitation, temperature, and GD, it can explain more than 30% of these changes. GD, temperature, and precipitation are representative natural variables that amplify the influence of LULC on vegetation dynamics. Moreover, our findings demonstrate a nonlinear strengthening effect of interaction variables on vegetation dynamics, rather than a simple additive relationship [24,27,28]. Recent studies have indicated that Hunshandake Sandy Land has experienced both warming trends and increased precipitation over the past 40 years [32]. Under the trend in climate change, agricultural irrigation strategies should be developed considering ecological water use to ensure the appropriate depth of groundwater.

4.3. Vegetation Ecological Threshold

Vegetation plays a crucial role in ecology, and understanding its ecological threshold is essential for comprehending the external forces driving dynamic changes and maintaining steady-state conditions. Moreover, studying this threshold provides a theoretical framework for effective resource management and ecological restoration [48,49,50,51]. To comprehend the climatic environmental thresholds of plants, numerous scholars have researched vegetation’s response to climate change using pollen analysis [52,53]. In studies focused on lake wetlands in arid and semi-arid regions, the ecological threshold for vegetation is typically defined by the optimum GD required for plant development without salinization [22,54]. The investigation did not consider the production of salinization. In the DW, the optimum GD required for plant development was determined to be 2.75 m, which could be used as an ecological constraint index for groundwater extraction. These findings will contribute to forecasting future water resource utilization possibilities and serve as a fundamental basis for implementing ecological conservation strategies in the area.

4.4. The Dependence of Vegetation on Groundwater and Precipitation

The association between GD and the NDVI or vegetation coverage has been established by several researchers at the regional scale. To investigate the interaction between groundwater and ecology, GD is utilized as a classification indicator for evaluating vegetation dependency on groundwater [55,56,57]. The qualitative analysis in this study reveals that vegetation in regions with medium-high coverage exhibits a greater dependence on groundwater, while vegetation in areas with medium-low coverage shows a stronger dependence on precipitation. Subsequently, stable isotopes will be employed to quantitatively assess the water sources of plants and determine the extent of their dependency on both precipitation and groundwater [58,59]. The three representative plant species, Caragana sinica, Artemisia desertorum Spreng, and Hedysarum laeve Maxim, were selected based on the ecological characteristics of the research region. Samples of plants, soil, groundwater, and precipitation were collected for analysis, and stable isotopes 2H and 18O were employed to investigate the water sources utilized by these vegetation types [60,61,62].

5. Conclusions

The spatio-temporal evolution characteristics and main driving factors of vegetation cover in the DW, a typical watershed in the southern Hunshandake Sandy Land, were analyzed using univariable linear regression and the Geodetector method, with a primary focus on assessing the risk of vegetation ecological degradation. Precipitation and groundwater are the main factors influencing the risk of vegetation ecological degradation in the basin. The VEDR evaluation results show that the vegetation ecology of the basin is relatively fragile, mainly with medium risk and large risk. In order to cope with the potential impact of climate change on future vegetation dynamics, more reasonable water use strategies should be formulated to ensure ecological water use. A depth of 2.75 m can be used as the ecological constraint index of groundwater exploitation to reduce the interference of human activities and actively restore vegetation. The present study’s outcomes provide the basis for developing ecological engineering solutions in arid and semi-arid parts of northern China.

Author Contributions

Conceptualization, P.C. and R.M.; methodology, P.C.; validation, R.M.; formal analysis, P.C.; investigation, P.C. and L.S.; resources, L.Z., R.J. and W.D.; data curation, L.Z., R.J. and W.D.; writing—original draft preparation, P.C.; writing—review and editing, R.M.; visualization, L.S.; supervision, P.C.; project administration, R.M.; funding acquisition, R.M. All authors have read and agreed to the published version of the manuscript.

Funding

This work was funded by the “Basic Research Funds of Chinese Academy of Geological Sciences (SK202327)”, “Geological Survey Projects Foundation of the Institute of Hydrogeology and Environmental Geology (DD20221773)”, “Investigation of Groundwater Environment in Ordos (Phase II) (ESZC-G-F-220140)”, and “National Natural Science Foundation of China (4237070832; 42307555)”.

Informed Consent Statement

Not applicable.

Data Availability Statement

The data used to support the findings of this study are available from the corresponding author upon request.

Acknowledgments

The editor and reviewers are sincerely acknowledged for their instructive and detailed comments on the early versions of this manuscript. The authors appreciate all centers supplying open-source datasets used in the present research.

Conflicts of Interest

The authors declare no conflicts of interest.

References

  1. Das, A.; Basu, T. Assessment of Peri-Urban Wetland Ecological Degradation through Importance-Performance Analysis (IPA): A Study on Chatra Wetland, India. Ecol. Indic. 2020, 114, 106274. [Google Scholar] [CrossRef]
  2. Dias, T.; Crous, C.J.; Liberati, D.; Munzi, S.; Gouveia, C.; Ulm, F.; Afonso, A.C.; Ochoa-Hueso, R.; Manrique, E.; Sheppard, L.; et al. Alleviating Nitrogen Limitation in Mediterranean Maquis Vegetation Leads to Ecological Degradation: N Enrichment Degrades Ecological Partnerships and Its Functions. Land Degrad. Develop. 2017, 28, 2482–2492. [Google Scholar] [CrossRef]
  3. Park, C.Y.; Takahashi, K.; Takakura, J.; Li, F.; Fujimori, S.; Hasegawa, T.; Ito, A.; Lee, D.K. How Will Deforestation and Vegetation Degradation Affect Global Fire Activity? Earth’s Future 2021, 9, e2020EF001786. [Google Scholar] [CrossRef]
  4. Bernard, B.; Aron, M.; Loy, T.; Muhamud, N.W.; Benard, S. The Impact of Refugee Settlements on Land Use Changes and Vegetation Degradation in West Nile Sub-Region, Uganda. Geocarto Int. 2022, 37, 16–34. [Google Scholar] [CrossRef]
  5. Luo, J.; Huai, W.; Wang, P. Contaminant Transport in a Three-Zone Wetland: Dispersion and Ecological Degradation. J. Hydrol. 2016, 534, 341–351. [Google Scholar] [CrossRef]
  6. Chen, X.; Wang, F.; Jiang, L.; Huang, C.; An, P.; Pan, Z. Impact of Center Pivot Irrigation on Vegetation Dynamics in a Farming-Pastoral Ecotone of Northern China: A Case Study in Ulanqab, Inner Mongolia. Ecol. Indic. 2019, 101, 274–284. [Google Scholar] [CrossRef]
  7. Li, T.; Zhang, Q.; Singh, V.P.; Zhao, J.; Song, J.; Sun, S.; Wang, G.; Shen, Z.; Wu, W. Identification of Degradation Areas of Ecological Environment and Degradation Intensity Assessment in the Yellow River Basin. Front. Earth Sci. 2022, 10, 922013. [Google Scholar] [CrossRef]
  8. Zhang, Q.; Wang, G.; Yuan, R.; Singh, V.P.; Wu, W.; Wang, D. Dynamic Responses of Ecological Vulnerability to Land Cover Shifts over the Yellow River Basin, China. Ecol. Indic. 2022, 144, 109554. [Google Scholar] [CrossRef]
  9. Jiang, W.; Meng, L.; Liu, F.; Sheng, Y.; Chen, S.; Yang, J.; Mao, H.; Zhang, J.; Zhang, Z.; Ning, H. Distribution, Source Investigation, and Risk Assessment of Topsoil Heavy Metals in Areas with Intensive Anthropogenic Activities Using the Positive Matrix Factorization (PMF) Model Coupled with Self-Organizing Map (SOM). Env. Geochem. Health 2023, 45, 6353–6370. [Google Scholar] [CrossRef]
  10. Wang, M. Accelerating Collaborative Innovation in Hydrological, Engineering, and Environmental Fields. J. Groundw. Sci. Eng. 2024, 12, 1. [Google Scholar] [CrossRef]
  11. Wang, J.; Zhang, C.; Luo, P.; Yang, H.; Luo, C. Water Yield Response to Plant Community Conversion Caused by Vegetation Degradation and Improvement in an Alpine Meadow on the Northeastern Tibetan Plateau. Sci. Total Environ. 2023, 856, 159174. [Google Scholar] [CrossRef] [PubMed]
  12. Li, Y.; Xie, Z.; Qin, Y.; Zheng, Z. Estimating Relations of Vegetation, Climate Change, and Human Activity: A Case Study in the 400 Mm Annual Precipitation Fluctuation Zone, China. Remote Sens. 2019, 11, 1159. [Google Scholar] [CrossRef]
  13. Gu, Y.; Pang, B.; Qiao, X.; Xu, D.; Li, W.; Yan, Y.; Dou, H.; Ao, W.; Wang, W.; Zou, C.; et al. Vegetation Dynamics in Response to Climate Change and Human Activities in the Hulun Lake Basin from 1981 to 2019. Ecol. Indic. 2022, 136, 108700. [Google Scholar] [CrossRef]
  14. Yu, L.; Wu, Z.; Du, Z.; Zhang, H.; Liu, Y. Insights on the Roles of Climate and Human Activities to Vegetation Degradation and Restoration in Beijing-Tianjin Sandstorm Source Region. Ecol. Eng. 2021, 159, 106105. [Google Scholar] [CrossRef]
  15. Zhumanova, M.; Mönnig, C.; Hergarten, C.; Darr, D.; Wrage-Mönnig, N. Assessment of Vegetation Degradation in Mountainous Pastures of the Western Tien-Shan, Kyrgyzstan, Using eMODIS NDVI. Ecol. Indic. 2018, 95, 527–543. [Google Scholar] [CrossRef]
  16. Sun, B.; Li, Z.; Gao, W.; Zhang, Y.; Gao, Z.; Song, Z.; Qin, P.; Tian, X. Identification and Assessment of the Factors Driving Vegetation Degradation/Regeneration in Drylands Using Synthetic High Spatiotemporal Remote Sensing Data—A Case Study in Zhenglanqi, Inner Mongolia, China. Ecol. Indic. 2019, 107, 105614. [Google Scholar] [CrossRef]
  17. Liu, Y.; Liu, R.; Ge, Q. Evaluating the Vegetation Destruction and Recovery of Wenchuan Earthquake Using MODIS Data. Nat. Hazards 2010, 54, 851–862. [Google Scholar] [CrossRef]
  18. Yin, H.; Pflugmacher, D.; Li, A.; Li, Z.; Hostert, P. Land Use and Land Cover Change in Inner Mongolia—Understanding the Effects of China’s Re-Vegetation Programs. Remote Sens. Environ. 2018, 204, 918–930. [Google Scholar] [CrossRef]
  19. Liu, Q.; Wang, X.; Zhang, Y.; Zhang, H.; Li, L. Vegetation Degradation and Its Driving Factors in the Farming–Pastoral Ecotone over the Countries along Belt and Road Initiative. Sustainability 2019, 11, 1590. [Google Scholar] [CrossRef]
  20. Peng, Y.; Wang, Q.; Fan, M. Identification of the Key Ecological Factors Influencing Vegetation Degradation in Semi-Arid Agro-Pastoral Ecotone Considering Spatial Scales. Acta Oecologica 2017, 85, 62–68. [Google Scholar] [CrossRef]
  21. Piao, S.; Cui, M.; Chen, A.; Wang, X.; Ciais, P.; Liu, J.; Tang, Y. Altitude and Temperature Dependence of Change in the Spring Vegetation Green-up Date from 1982 to 2006 in the Qinghai-Xizang Plateau. Agric. For. Meteorol. 2011, 151, 1599–1608. [Google Scholar] [CrossRef]
  22. Chen, P.; Ma, R.; Shi, J.; Si, L. Effects of Groundwater Depth and Salt Content on Vegetation in Dry Lake Basins: A Case Study of Chahan Lake, Northern China. Geofluids 2022, 2022, e7393247. [Google Scholar] [CrossRef]
  23. Qin, D.; Zhao, Z.; Han, L.; Qian, Y.; Ou, L.; Wu, Z.; Wang, M. Determination of Groundwater Recharge Regime and Flowpath in the Lower Heihe River Basin in an Arid Area of Northwest China by Using Environmental Tracers: Implications for Vegetation Degradation in the Ejina Oasis. Appl. Geochem. 2012, 27, 1133–1145. [Google Scholar] [CrossRef]
  24. Huo, H.; Sun, C. Spatiotemporal Variation and Influencing Factors of Vegetation Dynamics Based on Geodetector: A Case Study of the Northwestern Yunnan Plateau, China. Ecol. Indic. 2021, 130, 108005. [Google Scholar] [CrossRef]
  25. Han, Y.; Ke, Y.; Zhu, L.; Feng, H.; Zhang, Q.; Sun, Z.; Zhu, L. Tracking Vegetation Degradation and Recovery in Multiple Mining Areas in Beijing, China, Based on Time-Series Landsat Imagery. GIScience Remote Sens. 2021, 58, 1477–1496. [Google Scholar] [CrossRef]
  26. Jiang, W.; Wang, G.; Sheng, Y.; Shi, Z.; Zhang, H. Isotopes in Groundwater (2H, 18O, 14C) Revealed the Climate and Groundwater Recharge in the Northern China. Sci. Total Environ. 2019, 666, 298–307. [Google Scholar] [CrossRef]
  27. Wang, Y.; Zhang, Z.; Chen, X. Quantifying Influences of Natural and Anthropogenic Factors on Vegetation Changes Based on Geodetector: A Case Study in the Poyang Lake Basin, China. Remote Sens. 2021, 13, 5081. [Google Scholar] [CrossRef]
  28. Zhu, L.; Meng, J.; Zhu, L. Applying Geodetector to Disentangle the Contributions of Natural and Anthropogenic Factors to NDVI Variations in the Middle Reaches of the Heihe River Basin. Ecol. Indic. 2020, 117, 106545. [Google Scholar] [CrossRef]
  29. Jiang, W.; Lv, J.; Wang, C.; Chen, Z.; Liu, Y. Marsh Wetland Degradation Risk Assessment and Change Analysis: A Case Study in the Zoige Plateau, China. Ecol. Indic. 2017, 82, 316–326. [Google Scholar] [CrossRef]
  30. Muqi, X.; Jiang, Z.; Yuyao, H.; Yurong, G.; Shen, Z.; Yijian, T.; Chengqing, Y.; Zijian, W. The Ecological Degradation and Restoration of Baiyangdian Lake, China. J. Freshw. Ecol. 1998, 13, 433–446. [Google Scholar] [CrossRef]
  31. Zhao, Q.; Guo, F.; Zhang, Y.; Ma, S.; Jia, X.; Meng, W. How Sulfate-Rich Mine Drainage Affected Aquatic Ecosystem Degradation in Northeastern China, and Potential Ecological Risk. Sci. Total Environ. 2017, 609, 1093–1102. [Google Scholar] [CrossRef] [PubMed]
  32. Ma, R.; Chen, P.; Zhang, B.; Zhao, L.; Ning, K. Identification of Ecological Restoration Standard for Lakes on the Inner Mongolia Plateau, China. Ecol. Indic. 2024, 162, 111993. [Google Scholar] [CrossRef]
  33. Yuan, L.; Gao, Y.; Cheng, F.; Du, J.; Hu, Z.; Yang, X.; Wang, H.; Kong, X.; Fu, Z.; Wang, W.; et al. The Influence of Oil Exploitation on the Degradation of Vegetation: A Case Study in the Yellow River Delta Nature Reserve, China. Environ. Technol. Innov. 2022, 28, 102579. [Google Scholar] [CrossRef]
  34. Zhang, X.; Wang, N.; Xie, Z.; Ma, X.; Huete, A. Water Loss Due to Increasing Planted Vegetation over the Badain Jaran Desert, China. Remote Sens. 2018, 10, 134. [Google Scholar] [CrossRef]
  35. Yang, X.; Scuderi, L.A.; Wang, X.; Scuderi, L.J.; Zhang, D.; Li, H.; Forman, S.; Xu, Q.; Wang, R.; Huang, W.; et al. Groundwater Sapping as the Cause of Irreversible Desertification of Hunshandake Sandy Lands, Inner Mongolia, Northern China. Proc. Natl. Acad. Sci. USA 2015, 112, 702–706. [Google Scholar] [CrossRef] [PubMed]
  36. Zhang, G.; Cheng, Y.; Liu, H.; Xiao, C.; Nie, H.; Zhu, Z.; Zhao, D.; Zan, Y. Evaluation of the Groundwater Ecological Water Requirement in the Southeast Margin of Otindag Sandy Land Based on Allowable Groundwater Depth Drawdown. Water 2023, 15, 3504. [Google Scholar] [CrossRef]
  37. Chu, Y.; Li-jie, W.; Yi-long, Z.; Xiu-ya, W.; Zhan-chuan, W.; Zhou, Z. Effect of Groundwater on the Ecological Water Environment of Typical Inland Lakes in the Inner Mongolian Plateau. J. Groundw. Sci. Eng. 2022, 10, 353. [Google Scholar]
  38. Liang, W.; Quan, Q.; Wu, B.; Mo, S. Response of Vegetation Dynamics in the Three-North Region of China to Climate and Human Activities from 1982 to 2018. Sustainability 2023, 15, 3073. [Google Scholar] [CrossRef]
  39. Li, C.; Men, B.; Yin, S. Spatiotemporal Variation of Groundwater Extraction Intensity Based on Geostatistics—Set Pair Analysis in Daxing District of Beijing, China. Sustainability 2022, 14, 4341. [Google Scholar] [CrossRef]
  40. Wang, Z.; Xu, D.; Peng, D.; Zhang, Y. Quantifying the Influences of Natural and Human Factors on the Water Footprint of Afforestation in Desert Regions of Northern China. Sci. Total Environ. 2021, 780, 146577. [Google Scholar] [CrossRef]
  41. Wang, J.; Li, X.; Christakos, G.; Liao, Y.; Zhang, T.; Gu, X.; Zheng, X. Geographical Detectors-Based Health Risk Assessment and Its Application in the Neural Tube Defects Study of the Heshun Region, China. Int. J. Geogr. Inf. Sci. 2010, 24, 107–127. [Google Scholar] [CrossRef]
  42. Li, S.; Li, X.; Gong, J.; Dang, D.; Dou, H.; Lyu, X. Quantitative Analysis of Natural and Anthropogenic Factors Influencing Vegetation NDVI Changes in Temperate Drylands from a Spatial Stratified Heterogeneity Perspective: A Case Study of Inner Mongolia Grasslands, China. Remote Sens. 2022, 14, 3320. [Google Scholar] [CrossRef]
  43. Wang, S.; Li, R.; Wu, Y.; Zhao, S. Effects of Multi-Temporal Scale Drought on Vegetation Dynamics in Inner Mongolia from 1982 to 2015, China. Ecol. Indic. 2022, 136, 108666. [Google Scholar] [CrossRef]
  44. You, G.; Liu, B.; Zou, C.; Li, H.; McKenzie, S.; He, Y.; Gao, J.; Jia, X.; Altaf Arain, M.; Wang, S.; et al. Sensitivity of Vegetation Dynamics to Climate Variability in a Forest-Steppe Transition Ecozone, North-Eastern Inner Mongolia, China. Ecol. Indic. 2021, 120, 106833. [Google Scholar] [CrossRef]
  45. Ebrahimi Khusfi, Z.; Khosroshahi, M.; Roustaei, F.; Mirakbari, M. Spatial and Seasonal Variations of Sand-Dust Events and Their Relation to Atmospheric Conditions and Vegetation Cover in Semi-Arid Regions of Central Iran. Geoderma 2020, 365, 114225. [Google Scholar] [CrossRef]
  46. Jin, K.; Wang, F.; Zong, Q.; Qin, P.; Liu, C. Impact of Variations in Vegetation on Surface Air Temperature Change over the Chinese Loess Plateau. Sci. Total Environ. 2020, 716, 136967. [Google Scholar] [CrossRef] [PubMed]
  47. Yin, L.; Zhou, Y.; Huang, J.; Wenninger, J.; Zhang, E.; Hou, G.; Dong, J. Interaction between Groundwater and Trees in an Arid Site: Potential Impacts of Climate Variation and Groundwater Abstraction on Trees. J. Hydrol. 2015, 528, 435–448. [Google Scholar] [CrossRef]
  48. James-Pirri, M.-J.; Swanson, J.L.; Roman, C.T.; Ginsberg, H.S.; Heltshe, J.F. Ecological Thresholds for Salt Marsh Nekton and Vegetation Communities. In Application of Threshold Concepts in Natural Resource Decision Making; Guntenspergen, G.R., Ed.; Springer: New York, NY, USA, 2014; pp. 291–319. ISBN 978-1-4899-8040-3. [Google Scholar]
  49. Rong, H.; Shan, D.; Guo, J.Y. Analysis Threshold Value of Ecological Water Require-Ment for Vegetation Restoration on Northern Grassland. Appl. Mech. Mater. 2012, 212, 549–553. [Google Scholar] [CrossRef]
  50. Sasaki, T.; Koyama, A.; Okuro, T. Coupling Structural and Functional Thresholds for Vegetation Changes on a Mongolian Shrubland. Ecol. Indic. 2018, 93, 1264–1275. [Google Scholar] [CrossRef]
  51. Zhao, M.; Wang, C.; He, Y.; He, T. Soil Characteristics and Response Thresholds of Salt Meadow on Lake Beaches of the Ordos Platform. Front. Environ. Sci. 2022, 10, 1050757. [Google Scholar] [CrossRef]
  52. Tzedakis, P.C.; Frogley, M.R.; Lawson, I.T.; Preece, R.C.; Cacho, I.; de Abreu, L. Ecological Thresholds and Patterns of Millennial-Scale Climate Variability: The Response of Vegetation in Greece during the Last Glacial Period. Geology 2004, 32, 109. [Google Scholar] [CrossRef]
  53. Vegas-Vilarrúbia, T.; González-Sampériz, P.; Morellón, M.; Gil-Romera, G.; Pérez-Sanz, A.; Valero-Garcés, B. Diatom and Vegetation Responses to Late Glacial and Early Holocene Climate Changes at Lake Estanya (Southern Pyrenees, NE Spain). Palaeogeogr. Palaeoclimatol. Palaeoecol. 2013, 392, 335–349. [Google Scholar] [CrossRef]
  54. Qi, Z.; Xiao, C.; Wang, G.; Liang, X. Study on Ecological Threshold of Groundwater in Typical Salinization Area of Qian’an County. Water 2021, 13, 856. [Google Scholar] [CrossRef]
  55. Huntington, J.; McGwire, K.; Morton, C.; Snyder, K.; Peterson, S.; Erickson, T.; Niswonger, R.; Carroll, R.; Smith, G.; Allen, R. Assessing the Role of Climate and Resource Management on Groundwater Dependent Ecosystem Changes in Arid Environments with the Landsat Archive. Remote Sens. Environ. 2016, 185, 186–197. [Google Scholar] [CrossRef]
  56. Mpakairi, K.S.; Dube, T.; Dondofema, F.; Dalu, T. Spatio–Temporal Variation of Vegetation Heterogeneity in Groundwater Dependent Ecosystems within Arid Environments. Ecol. Inform. 2022, 69, 101667. [Google Scholar] [CrossRef]
  57. Zhang, H.; Wang, X.-S. The Impact of Groundwater Depth on the Spatial Variance of Vegetation Index in the Ordos Plateau, China: A Semivariogram Analysis. J. Hydrol. 2020, 588, 125096. [Google Scholar] [CrossRef]
  58. Sohel, M.S.I.; Grau, A.V.; McDonnell, J.J.; Herbohn, J. Tropical Forest Water Source Patterns Revealed by Stable Isotopes: A Preliminary Analysis of 46 Neighboring Species. For. Ecol. Manag. 2021, 494, 119355. [Google Scholar] [CrossRef]
  59. Wang, J.; Lu, N.; Fu, B. Inter-Comparison of Stable Isotope Mixing Models for Determining Plant Water Source Partitioning. Sci. Total Environ. 2019, 666, 685–693. [Google Scholar] [CrossRef] [PubMed]
  60. Allen, S.T.; Sprenger, M.; Bowen, G.J.; Brooks, J.R. Spatial and Temporal Variations in Plant Source Water: O and H Isotope Ratios from Precipitation to Xylem Water. In Stable Isotopes in Tree Rings; Siegwolf, R.T.W., Brooks, J.R., Roden, J., Saurer, M., Eds.; Tree Physiology; Springer International Publishing: Cham, Switzerland, 2022; Volume 8, pp. 501–535. ISBN 978-3-030-92697-7. [Google Scholar]
  61. Landgraf, J.; Tetzlaff, D.; Dubbert, M.; Dubbert, D.; Smith, A.; Soulsby, C. Xylem Water in Riparian Willow Trees (Salix Alba) Reveals Shallow Sources of Root Water Uptake by in Situ Monitoring of Stable Water Isotopes. Hydrol. Earth Syst. Sci. 2022, 26, 2073–2092. [Google Scholar] [CrossRef]
  62. Li, Y.; Ma, Y.; Song, X.; Wang, L.; Han, D. A δ2H Offset Correction Method for Quantifying Root Water Uptake of Riparian Trees. J. Hydrol. 2021, 593, 125811. [Google Scholar] [CrossRef]
Figure 1. Location of the study area.
Water 16 02258 g001
Figure 2. Workflow of study on assessment of VEDR.
Water 16 02258 g002
Figure 3. Spatial distribution of NDVI in DW.
Water 16 02258 g003
Figure 4. Percentage of different levels of NDVI in DW from 1998 to 2019.
Water 16 02258 g004
Figure 5. NDVI change trend in DW from 1998 to 2019.
Water 16 02258 g005
Figure 6. Slope trend analysis results in DW from 1998 to 2019.
Water 16 02258 g006
Figure 7. Spatial distribution of driving factors precipitation (a), temperature (b), GD (c), LULC (d), population (e), GDP (f), in DW.
Water 16 02258 g007
Figure 8. Interactions detected between different factors on NDVI.
Water 16 02258 g008
Figure 9. Response of NDVI to variations of precipitation and GD.
Water 16 02258 g009
Figure 10. Spatial distribution of VEDR.
Water 16 02258 g010
Table 1. Principal data sources.
Date NameDate TypeTimeData Source
NDVIRaster (1000 m)1998–2019RESDC (http://www.resdc.cn, accessed on 3 August 2024)
PrecipitationStations1998–2019NMIC (http://data.cma.cn, accessed on 3 August 2024)
TemperatureStations1998–2019NMIC (http://data.cma.cn, accessed on 3 August 2024)
GDPoints (6/10 km2)2020Field survey
LULCRaster (1000 m)2000, 2005, 2010, 2015RESDC (http://www.resdc.cn, accessed on 3 August 2024)
PopulationRaster (1000 m)2010RESDC (http://www.resdc.cn, accessed on 3 August 2024)
GDPRaster (1000 m)2010RESDC (http://www.resdc.cn, accessed on 3 August 2024)
Table 2. Model driving force size criterion of interval and interaction.
Criterion of IntervalInteraction
q ( X 1 X 2 )   <   M i n q X 1 , q ( X 2 ) Nonlinear weakening
M i n q X 1 , q ( X 2 ) < q ( X 1 X 2 ) < M a x q X 1 , q ( X 2 ) Single-factor nonlinear weakening
q X 1 X 2 > M a x q X 1 , q ( X 2 ) Dual factor enhancement
q X 1 X 2 = q X 1 + q ( X 2 ) Independence
q X 1 X 2 > q X 1 + q ( X 2 ) Nonlinear enhancement
Table 3. Classification standard for vegetation coverage based on NDVI.
LevelNDVIArea (km2)Percentage
Low coverage area0–0.218.100.62%
Low-medium coverage area0.2–0.42173.9174.81%
Medium coverage area0.4–0.6710.8924.46%
Medium-high coverage area0.6–0.83.020.10%
High coverage area0.8–10.000
Table 4. Classification and statistical results of F-test of NDVI trend from 1998 to 2019.
LevelChange DegreeArea (km2)Percentage
Slope > 0, p < 0.01Extremely significant improvement241.328.30%
Slope > 0, 0.01 ≤ p < 0.05Significant improvement142.784.91%
Slope > 0, p ≥ 0.05Insignificant improvement1457.9950.17%
Slope < 0, p ≥ 0.05Insignificant degradation1018.5835.05%
Slope < 0, 0.01 ≤ p < 0.05Significant degradation26.140.90%
Slope < 0, p < 0.01Extremely significant degradation19.100.66%
Table 5. q-value of different factors on NDVI in DW.
PrecipitationTemperatureGDLULCPopulationGDP
0.2310.1140.1990.1490.0050.015
Table 6. Weight of VEDR factors.
Assessment FactorsOptimal ValueCorrelation CoefficientWeight Coefficient
Precipitation333.10 mm0.47 *0.55
GD2.75 m0.38 *0.45
Note: *, p ≤ 0.05.
Table 7. Criteria of VEDR classification and area statistics.
Risk LevelRisk DegreeRisk ValueArea (km2)Percentage
4Less riskR < 0.100%
3Medium risk0.1 ≤ R < 0.3894.1330.77%
2Large risk0.3 ≤ R < 0.51922.9966.17%
1Great riskR ≥ 0.588.803.06%
Disclaimer/Publisher’s Note: The statements, opinions and data contained in all publications are solely those of the individual author(s) and contributor(s) and not of MDPI and/or the editor(s). MDPI and/or the editor(s) disclaim responsibility for any injury to people or property resulting from any ideas, methods, instructions or products referred to in the content.

