Article

Feasibility Research on Surface Water Reinjection into the Sandstone Geothermal Reservoir of the Guantao Formation in Tianjin Based on Laboratory Experiments

1
Tianjin Geothermal Exploration and Development Design Institute, Tianjin 300250, China
2
Observation and Research Station of Tianjin Low—Medium Temperature Geothermal Resources, Ministry of Natural Resources, Tianjin 300250, China
*
Author to whom correspondence should be addressed.
Water 2024, 16(17), 2475; https://doi.org/10.3390/w16172475
Submission received: 26 June 2024 / Revised: 26 August 2024 / Accepted: 27 August 2024 / Published: 30 August 2024
(This article belongs to the Special Issue Soil and Groundwater Quality and Resources Assessment)

Abstract

:
Tianjin possesses abundant geothermal resources, and geothermal reinjection is an effective strategy for maintaining the sustainable development and utilization of these resources. However, several issues have arisen in the reinjection of sandstone geothermal reservoirs in the Tianjin area, including a mismatch between the reinjection capacity and effluent capacity, as well as challenges related to continuous reinjection. Therefore, it is crucial to investigate the reinjection of exogenous water into sandstone pore-type geothermal reservoirs. This study focuses on the geothermal reservoir of the Guantao Formation in the Binhai New Area. The surface water treatment process for reinjection into sandstone geothermal reservoirs was determined through water treatment simulation experiments. Additionally, experiments examining the interaction between the reinjected water and reservoir rock were conducted to assess the feasibility of using treated surface water for reinjection into sandstone geothermal reservoirs. The hydrogeochemical response mechanisms and the impact on the reservoir under reinjection conditions were also investigated. The results indicate that a nanofiltration module and tubular microfiltration membrane are essential to ensure the stability of the system. The pH and TDS of water samples decreased after reinjecting mixed water (HHS) into the sandstone reservoir. The hydrochemical type consistently remained Cl-Na. The conventional water chemistry components and trace elements were influenced by the corresponding water–rock reactions. The reservoir minerals exhibited minimal precipitation, primarily consisting of K-feldspar and Fe-dolomite. The minerals produced during the experiment accounted for only 0.08% of the total cuttings’ mass, indicating a negligible impact on the reservoir structure. PHREEQC was employed to simulate the changes in mineral saturation index before and after the reinjection of mixed water and geothermal water, respectively. Notably, similar hydrogeochemical changes were observed in the geothermal fluids. Thus, this study demonstrates the feasibility of reinjecting treated surface water into sandstone geothermal reservoirs from a hydrogeochemical perspective. This research provides valuable insights for the development of external water reinjection projects in hot spring health care units, contributing effectively to the achievement of carbon peaking and carbon neutrality goals.

1. Introduction

Tianjin is endowed with abundant low–medium temperature geothermal resources, making it a representative area for the early development and utilization of geothermal energy in China. The geothermal resources in Tianjin are primarily distributed in sandstone pore reservoirs and carbonate fissure reservoirs [1,2,3,4]. Geothermal reinjection is an effective strategy for ensuring the sustainable development and utilization of these resources. This process is essential for maintaining pressure within geothermal reservoirs, maximizing the use of geothermal energy, and mitigating environmental pollution associated with the direct discharge of geothermal fluids. Geothermal reinjection involves the reinjection of geothermal fluids or other utilized (cooled) water sources back into the thermal reservoir through reinjection wells. In Tianjin, the utilization model for geothermal resources is characterized by an exploitation–reinjection system. Typically, geothermal reinjection is required to occur within the same geological layer. However, the annual volume of geothermal exploitation often exceeds the reinjection volume, remaining below 100%. This discrepancy can be attributed to site-specific conditions, reinjection blockages, and the inability to reinject certain geothermal return waters [5]. In light of this, the Tianjin Municipal Bureau of Planning and Natural Resources in China issued a notice titled “Implementation Measures for Geothermal Resource Management in Tianjin” (Jin PRB Documents [2019] No. 4), which encourages eligible enterprises to conduct geothermal reinjection during non-heating periods by constructing surface water reinjection systems into geothermal reservoirs. Consequently, it is essential to investigate the reinjection of exogenous water in conjunction with the reinjection of geothermal return water. The reinjection of water into sandstone porous geothermal reservoirs has consistently posed significant challenges [6]. Therefore, examining the feasibility and impact of exogenous water reinjection into sandstone geothermal reservoirs is crucial for maintaining reservoir pressure, restoring geothermal water levels, prolonging the service life of geothermal fields, preventing land subsidence, and addressing the issue of geothermal return water.
Geothermal reinjection commenced in the 1960s and has since been widely implemented in countries such as France, Germany, Iceland, Italy, Japan, New Zealand, the Philippines, and the United States. In 1969, the first high-temperature geothermal field reinjection project was initiated in the Ahuachapan geothermal field in El Salvador, while the first low–medium temperature geothermal field reinjection project was launched in the Paris Basin in France during the same year. Following 1970, there was a notable increase in global geothermal reinjection projects [7]. The world’s first geothermal power station, the Larderello geothermal power station in Italy, began reinjection in 1974. This long-term reinjection helped alleviate reservoir pressure, resulting in a significant increase in power station production. The Geysers geothermal field in California, USA, represents the most notable high-temperature geothermal reinjection project globally, where the world’s first geothermal reinjection project was also initiated in 1969. By 1980, the project had commenced reinjecting surface water, including lake water and urban sewage, into the geothermal reservoir to maintain reservoir pressure. The Geysers geothermal field is recognized as the first geothermal field in the world to enhance power generation capacity through the reinjection of exogenous water [8,9]. The geothermal reinjection in the Paris Basin of France represents the most effective area for low-temperature geothermal reinjection. The world’s first well-to-well system was established in 1969, followed by the construction of a geothermal well in 1995, which created a system comprising two exploitation wells and one reinjection well. To date, more than 70 mining–reinjection systems have been developed, alongside advancements in the mining–reinjection system processes and technologies [10]. Bodvarsson G., S. Stefansson V., and colleagues investigated the effects of pressure, chemistry, and temperature on reinjection through various geothermal field projects [11,12]. Additionally, Darwis R. S. and other researchers studied the impact of reinjection on geothermal fields by conducting reservoir model simulations [13]. Furthermore, Diazr (2016) and Kamila (2021) provided summaries of the global development status of geothermal reinjection [14,15].
Geothermal reinjection in China began in the 1970s, and significant advancements in the reinjection process and key technologies have been made over the years, particularly in the Beijing, Tianjin, and Shandong provinces. Recently, research on sandstone geothermal reservoir reinjection in China has progressed rapidly. Studies conducted by the Tianjin Geothermal Exploration and Development Design Institute (1990), Liancheng Wang (2014), and Xuepeng Wang (2020) have explored the effects of reinjection and the factors influencing sandstone geothermal reservoirs through various reinjection experiments [16,17,18]. Additionally, Xin Zhou (2013), Qun Dai (2017), and Dongxin Wu (2022) examined the blocking mechanisms and treatment measures for sandstone geothermal reservoir reinjection [19,20,21]. Guosheng Jiang (2014) and Yanting Zhao (2023) analyzed the well completion technologies and the application effects of sandstone reinjection wells [22,23]. Moreover, Shoutao Feng (2019), Huajun Wang (2019), and Shan Li (2023) evaluated the impact of sandstone reinjection on reservoir permeability [24,25,26]. Lastly, Zongyu Chen (1998), Xufei Shi (2013), and Kunyu Wu (2022) investigated the water–rock reactions occurring during sandstone reservoir reinjection from hydrogeochemical and dynamic perspectives [27,28,29]. Su (2018) summarized the research progress on sandstone geothermal reservoir reinjection in China, highlighting the causes of low reinjection rates, potential solutions, and future research directions. The research has addressed the primary mechanisms affecting well injectivity, the reinjection scheme, the hydrological characteristics of the reservoir, the quality of reinjected water, well completion methods, and the water–rock interactions between the reinjected water and the reservoir. For instance, the “Gravel-packed Completion Technique” was employed in reinjection experiments conducted in Donggu and Binhai in Tianjin, where the injection rates reached up to 64 m3/d and 102 m3/d, respectively. Additionally, the injection rate at T38-1 in Tianjin reached 51 m3/h, with reinjected water accounting for 98% of the water exploited [30].
There are few studies on the reinjection of surface water into sandstone reservoirs, particularly concerning the hydrogeochemistry during the reinjection process. Some researchers have investigated the feasibility, geochemical reaction simulations, and reinjection processes of carbonate reservoirs in the Wumishan Formation that utilize exogenous water [31,32,33,34], providing valuable insights for this study. In response to the request for “Implementation Measures for Geothermal Resource Management in Tianjin” (Jin PRB Documents [2019] No. 4), issued by The Tianjin Municipal Bureau of Planning and Natural Resources in China, this paper draws upon the experience of a similar engineering project, the “Project for Reinjection of the Geothermal Reservoir of the Wumishan Formation in the Jixian System Using Surface Water from Dongli Lake”, which commenced operations in 2021 and has a reinjection water quality treatment capacity of 450 m3/h.
This paper focuses on the geothermal reservoir of the Guantao Formation in the Bin-hai New Area as its primary research subject. It presents the results of water treatment simulation experiments and explores the interactions between reinjected water and reservoir rock. The study investigates the feasibility of reinjecting treated surface water into sandstone geothermal reservoirs and examines the impacts of this reinjection on the reservoirs. The findings provide a foundation for the reinjection of surface water into sandstone geothermal reservoirs based on laboratory experiments. Furthermore, this research lays the groundwork for exploring the reinjection of exogenous water into geothermal reservoirs, thereby enhancing the replenishment of geothermal resources and maintaining reservoir pressure. Ultimately, the study aims to offer technical insights for the development of external water reinjection engineering in hot spring health care units, contributing to the achievement of carbon peaking and carbon neutrality goals.

2. Materials and Methods

2.1. Project Overview

2.1.1. Geothermal Wells

Geothermal wells A and B are located within the Neogene Guantao Formation in the Binhai New Area of Tianjin. Well A, positioned 645 m away from Well B, was originally drilled in 1996 as an exploitation well and was later converted into a geothermal exploitation well by perforating the geothermal reservoir section of the Guantao Formation. The water layer in both wells is part of this formation. Well A has a water output of 60 m3/h and a temperature of 64 °C. In contrast, Well B, which was drilled in 2015 as a reinjection well, has a depth of 1980.81 m, exhibiting a water output of 106.48 m3/h and a temperature of 58 °C. The total thickness of the water intake layer in Well B is 128 m, with porosity ranging from 16.05% to 30.06%, permeability between 51.61 and 732.46 × 10⁻³ μm2, and shale content varying from 9.37% to 31.76%. Well A primarily serves heating and hot spring bathing purposes. Since 2016, the return water from Well A has been reinjected into Well B, with an annual reinjection volume of approximately 50,000 m3. Years of dynamic monitoring data indicate that both the water output capacity and wellhead flow temperature have remained relatively stable. The annual volume of hot spring bathing water from Well A is also approximately 50,000 m3. The wastewater generated from bathing is treated via aeration, phosphorus removal, and nitrogen removal processes before being discharged into Yingyue Lake.
Geothermal Wells A and B are located at the northeastern edge of the Banqiao sag, which is classified as a grade IV structural unit within the Huanghua depression. The primary nearby fault is the Hai River Fault (see Figure 1). The regional stratigraphy is characterized by several layers: the Cenozoic Quaternary, with a thickness ranging from 300 to 400 m; the Neogene Minghuazhen Formation, with a baseplate depth between 1350 and 1690 m and a thickness ranging from 1130 to 1290 m; the Guantao Formation, with a baseplate depth ranging from 1710 to 2000 m and a thickness ranging from 350 to 550 m; and the Paleogene Dongying Formation, with a baseplate depth between 2250 and 2400 m.
The hydrochemical composition of the geothermal fluid in Well A is classified as Cl·HCO3-Na, exhibiting a pH of 8.25 and total dissolved solids (TDS) of 1408.4 mg/L. In contrast, the geothermal fluid in Well B is characterized as Cl·HCO3·SO4-Na, with a pH of 8.44 and TDS of 1577.9 mg/L (see Table 1).

2.1.2. Surface Water

The reinjection water is sourced from Yingyue Lake, a natural lake located approximately 300 m east of Well B. The lake spans an area of about 50,000 square meters, with a water depth varying from 0 to 6 m. Its total water storage capacity is approximately 200,000 cubic meters, and the annual variation in water quantity is minimal. The eastern edge of Yingyue Lake is situated about 200 m from the Dagu Sewage River, while several unnamed natural lakes, each ranging from 10,000 to 20,000 square meters in area, are located to the north. The lake is replenished by precipitation, river inflow, groundwater, and the discharge from bathing facilities, which undergo harmless treatment. Comprehensive analyses conducted over various periods indicate that the water exhibits characteristics of both surface water and geothermal water, with minimal seasonal variation. The chemical composition of the water is presented in Table 1.

2.2. Surface Water Reinjection Experiment

2.2.1. Experimental Platform

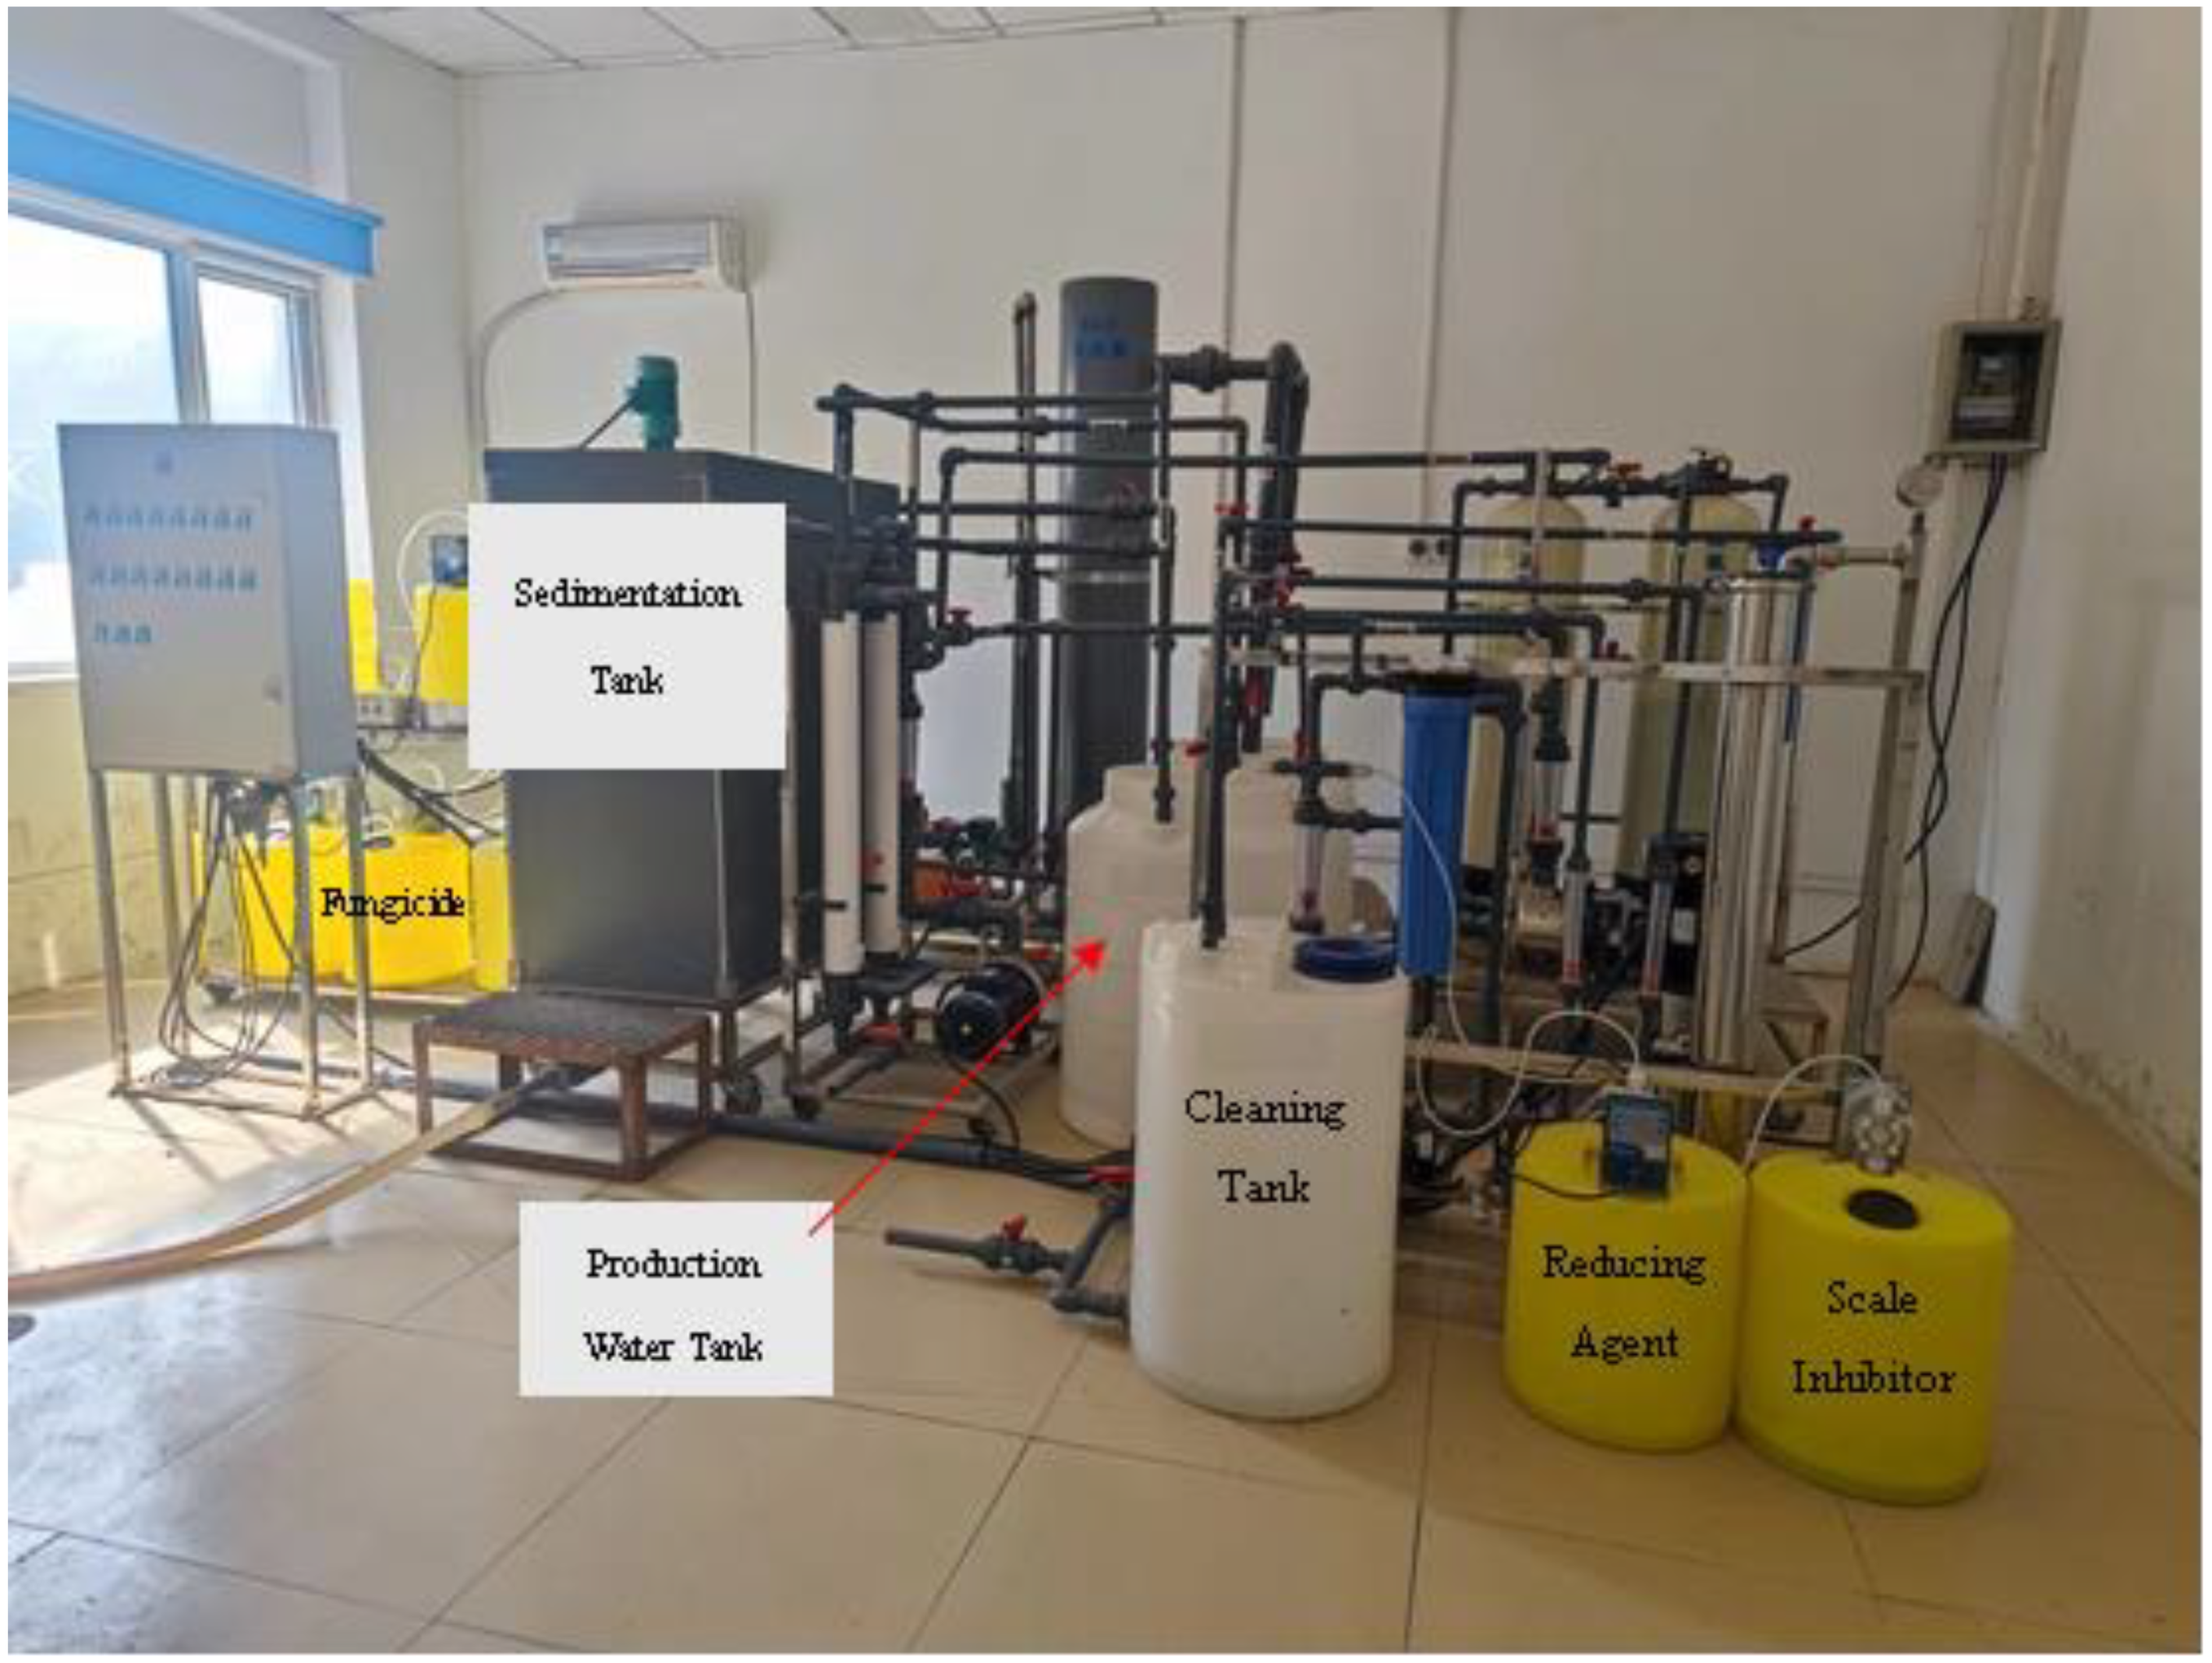
The laboratory water treatment experiment was conducted on a surface water reinjection platform established by the Tianjin Geothermal Exploration and Development Design Institute. This experimental platform consists of two primary components: a water treatment system and a chemical composition monitoring system.
The water treatment system has a capacity ranging from 0.5 to 1 ton per hour, while the surface water consumption for each group is approximately from 2 to 4 tons. In accordance with current mainstream water treatment technologies, the system is equipped with several standard water treatment modules. These include the raw water module, coagulation module, sterilization module, dosing system, sedimentation module, sand filtration module, deoxidization module, precision filtration module, tubular membrane module, BAF reactor module, nanofiltration membrane module, and a reducing agent scale inhibitor dosing system, along with other supporting equipment (Figure 2).
The chemical composition monitoring system includes a mixer, pH meter, conductivity meter, turbidity meter, and multifunctional comprehensive chemical composition analyzers. These analyzers measure the chemical oxygen demand (COD), ammonia nitrogen, total phosphorus, and suspended solids (SS), along with the necessary supporting reagents. These components are employed to design experimental schemes and to facilitate the timely detection of the chemical composition at each stage of the process.

2.2.2. Simulation Experiment

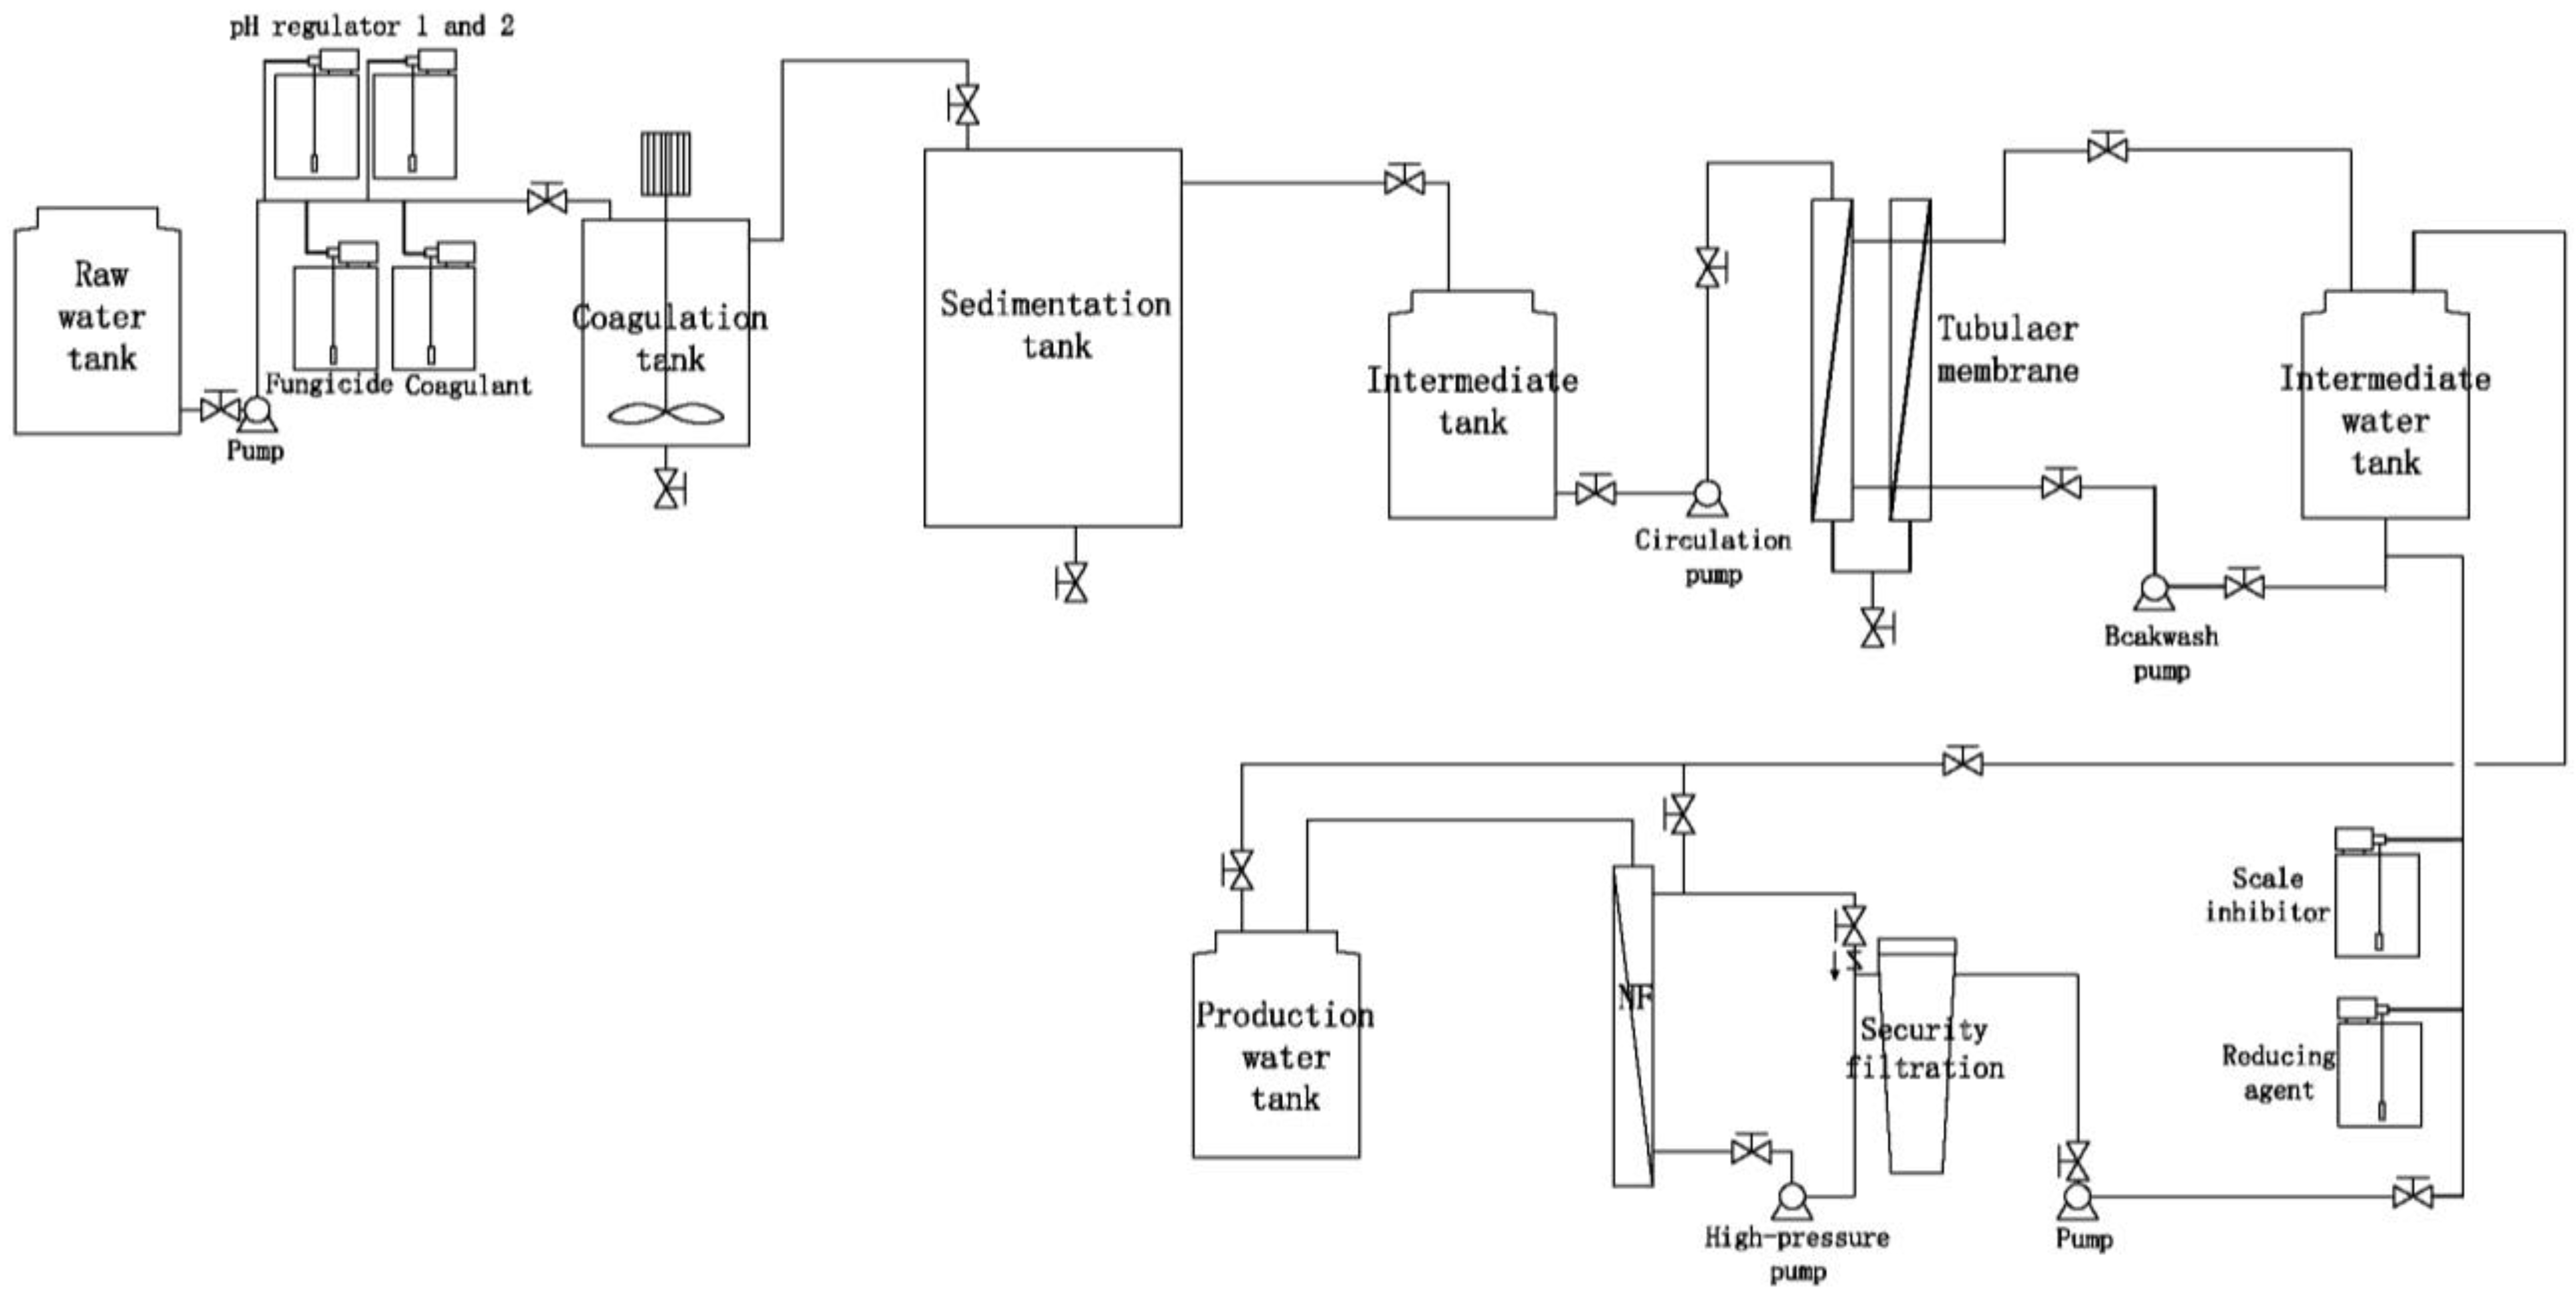
After years of practice, a standardized geothermal water treatment process for the reinjection of sandstone geothermal reservoirs has been established in Tianjin. This process comprises the following steps: raw water collection, coagulation, sedimentation, intermediate tank storage, sand filtration, deoxygenation, precision filtration, and water production. Based on the water quality analysis of the lake and the reservoir water quality requirements for the Guantao Formation, and informed by actual operational experiences from previous surface water reinjection, three sets of water treatment technologies were designed utilizing an experimental platform module. The water production outputs from these three treatment processes were tested and analyzed, with the results being presented in Table 2. Due to the open environment, the dissolved oxygen content of the test water is elevated; however, all other analytical results meet the reinjection requirements. These requirements align with the “Reuse of Urban Recycling Water: Water Quality Standard for Groundwater Recharge” (GB/T 19772-2005, Standardization Administration of China) [35], the “Water Quality Standard and Practice for Analysis of Oilfield Injecting Waters in Clastic Reservoirs” (SY/T 5329-2012, National Energy Administration of China) [36], and the “Technical Regulation for Geothermal Return Water Reinjection of Sandstone Reservoir” (DZ/T 0330-2019, Ministry of Natural Resources of the People’s Republic of China) [37].

2.2.3. Determination of Water Treatment Process

By comparing and analyzing the chemical composition test results from the simulation experiment, along with the operational experience of the existing surface water reinjection station, the principles for determining the treatment process are outlined as follows:
(1)
The inclusion of a nanofiltration module is essential in the water treatment process of the experiment to effectively reduce the total dissolved solids (TDS).
(2)
Sand filtration and precision filtration processes demonstrate a relatively low filtration accuracy for suspended solids (SS) and other impurities in water, necessitating higher raw water quality standards. Additionally, the sand filter tank occupies a significant area, making it less feasible to prioritize when spatial constraints at the station are inadequate.
(3)
During actual operations, the sponge iron in the deaeration tank is susceptible to contamination by microorganisms present in the water, which leads to a diminished deaeration capacity and ineffective backwashing. Consequently, the deaerator tanks frequently fail to fulfill their designed functions. Furthermore, the deaerator tank poses a challenge due to its large footprint, which limits its prioritization.
(4)
The biological aerated filter (BAF) requires the pretreatment of the influent water; otherwise, the presence of numerous impurities and suspended solids (SS) can obstruct the aeration and water distribution system, adversely affecting system operation. As BAF is inherently a biochemical system, its effluent contains microorganisms and their metabolites, necessitating the addition of fungicides and deoxidants in subsequent processes. This introduces uncertainty in water quality and increases the operational load.
(5)
As a membrane separation technology, tubular membranes offer several advantages, including a large diameter, low flow resistance, high surface flow velocity, reduced retention of pollutants on the membrane surface, ease of cleaning, enhanced pollution resistance, and lower requirements for water inflow. Consequently, tubular membranes are well-suited for treating lake water with fluctuating quality and demonstrate stability during laboratory experiments.
(6)
In designing the reinjection process, it is essential to establish independent dosing tanks for the fungicide, coagulant, and pH regulator, while also considering the sequence of delivery.
Based on the results of preliminary investigations and laboratory simulation experiments, and taking into account operational effectiveness and cost, the surface water treatment process was identified as Process 2: “raw water–coagulation–sedimentation–intermediate tank–tubular microfiltration membrane–nanofiltration–produced water” (see Figure 3).
Considering the high operational costs associated with the nanofiltration process and the necessity for the reinjection water quality to match the total dissolved solids (TDS) of the geothermal raw water, a mixed proportion of nanofiltration water and intermediate water was established at a ratio of 3:1 under normal temperature and pressure conditions. The TDS of the mixed water was comparable to that of the geothermal raw water. Raw water (RW), nanofiltration water (NF), and mixed water (HHS) were subjected to chemical composition analysis, with the results being presented in Table 3. Following treatment, the chemical composition of both NF and HHS meets the requirements for reinjection.

2.3. Water–Rock Reaction Experiment

An experiment was conducted to investigate the effects of reinjection on the chemical dynamics within a geothermal reservoir, focusing on water–rock interactions. This study took place at the Institute of Geology and Geophysics, part of the Chinese Academy of Sciences in China. The equipment utilized was an upgraded 4575A high-temperature and high-pressure reactor manufactured by PARR Corp. in the USA. Sandstone samples were obtained from Well B of the Neogene Guantao Formation in Tianjin, China, collected from a depth ranging from 1770 to 1900 m. For the experiment, a water sample designated as HHS was used, with 300 g of the water sample combined with 33.3 g of sandstone, resulting in a water–rock mass ratio of 9:1. Reaction periods were established at 0, 5, 10, and 15 days. Temperature and pressure were monitored to replicate the conditions of the geothermal reservoir at the sandstone sampling depth, with a temperature of 60 °C and a pressure of 15 MPa maintained. Throughout the experiment, a stirring speed of 100 r/s was consistently upheld, while the temperature and pressure were continuously tracked.
The procedures for the experiment were outlined as follows: (1) cleaned sandstone samples, along with reinjection water, were introduced into the reaction chamber, which was subsequently sealed; (2) the valve controlling the cooling water was opened, and the parameters for the reaction were established; (3) the control system was initiated, allowing for the setting of reaction temperature, pressure, and stirring speed; (4) after the water–rock reaction was completed and the reaction chamber had returned to room temperature, the samples were extracted and filtered; (5) water samples were collected in bottles for hydrochemical analysis; (6) sandstone samples were dried in an oven set at 40 °C for 24 h, allowed to cool to room temperature, and then ground to 200 mesh for mineral composition analysis [38].
The hydrochemical analysis of the water samples, encompassing both major and trace elements, was performed using inductively coupled plasma optical emission spectrometry (ICP-OES) and inductively coupled plasma mass spectrometry (ICP-MS), achieving a measurement accuracy of 0.001 μg/L. The hydrogen and oxygen isotopes of fluid samples were measured using Off-axis Integrated Cavity Output Spectrometry (OA-ICOS), with measurement accuracies of 0.2‰ for 2H and 0.03‰ for 18O. The mineral compositions of the sandstone samples were analyzed using an X-ray diffraction analyzer (XRD). A Dmax2500Pc type X-ray diffractometer (Rigaku, Japan) operated at 40 kV and 100 mA with CuKα radiation. Diffractograms were recorded from 5° to 90°, with a scanning increment of 4° per minute. All tests conducted adhered to the requirements of the relevant standards or specifications.

3. Results and Discussion

3.1. Reservoir Fluid Response

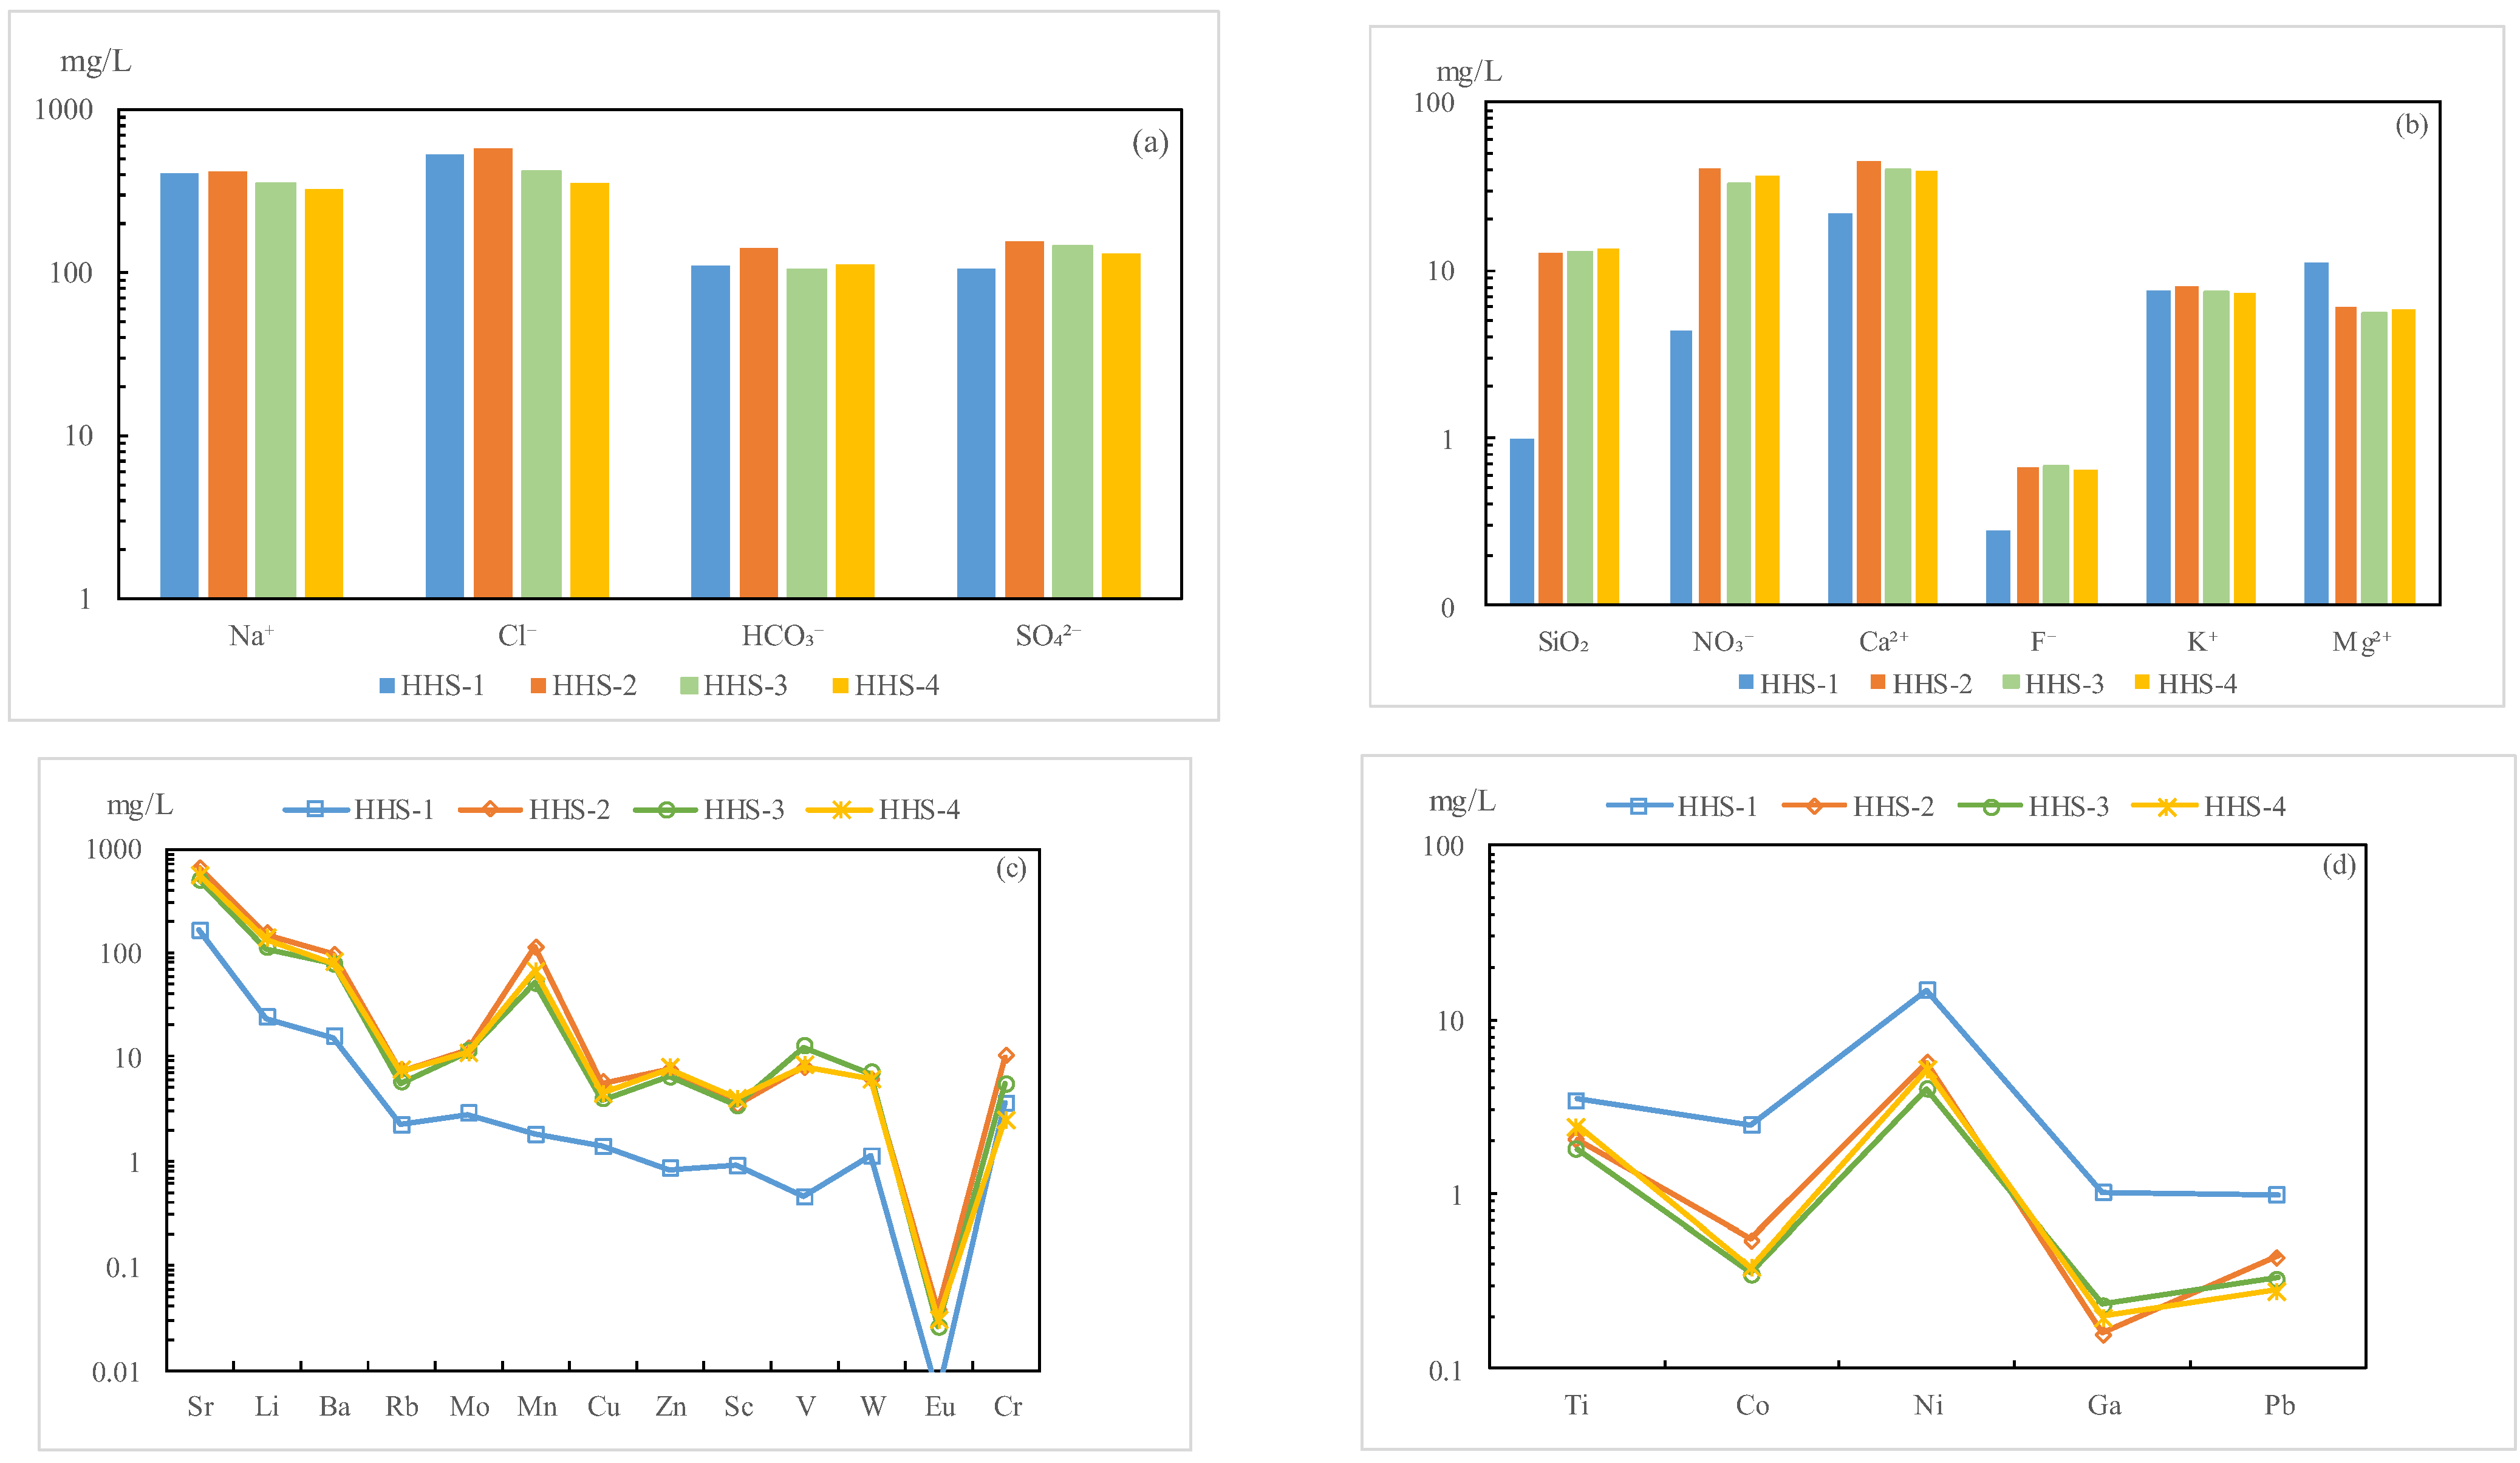
The results indicate that the total dissolved solids (TDS) initially increased and subsequently decreased during the reaction, ultimately falling below the initial value (Figure 4). The pH exhibited a decreasing trend, suggesting the production of acidic substances throughout the reaction. As the reaction progressed, the fluoride (F) content experienced a slight increase. The concentrations of chloride (Cl), nitrate (NO3), sulfate (SO42−), sodium (Na+), potassium (K+), and calcium (Ca2+) initially rose (at t = 5 d) before decreasing; however, only the concentrations of Na+ and Cl fell below their initial values. The magnesium (Mg2+) content decreased, while the silica (SiO2) content continuously increased. The bicarbonate (HCO3) content also increased initially before returning to the initial value. The hydrochemical type remained consistently Cl-Na (Table 4 and Figure 5a,b). During the reaction, TDS decreased by 94.2 mg/L, indicating that precipitation was the dominant process. This reduction in TDS was equivalent to the production of 28.3 mg of debris in this experiment, representing 0.08% of the debris involved in the reaction.
The changes in trace elements were complex. Overall, the concentrations of Sr, Li, Ba, Rb, Mo, Mn, Cu, Zn, Sc, V, W, Eu, and Cr exhibited an increase, although a decrease was observed during the intermediate process. Nevertheless, these levels remained significantly higher than the initial values (see Table 5; Figure 5c,d). In contrast, the concentrations of Ti, Co, Ni, Ga, and Pb displayed a decreasing trend. The variation in trace elements paralleled that of the conventional components of hydrochemistry, indicating that they were influenced by related water–rock reactions.
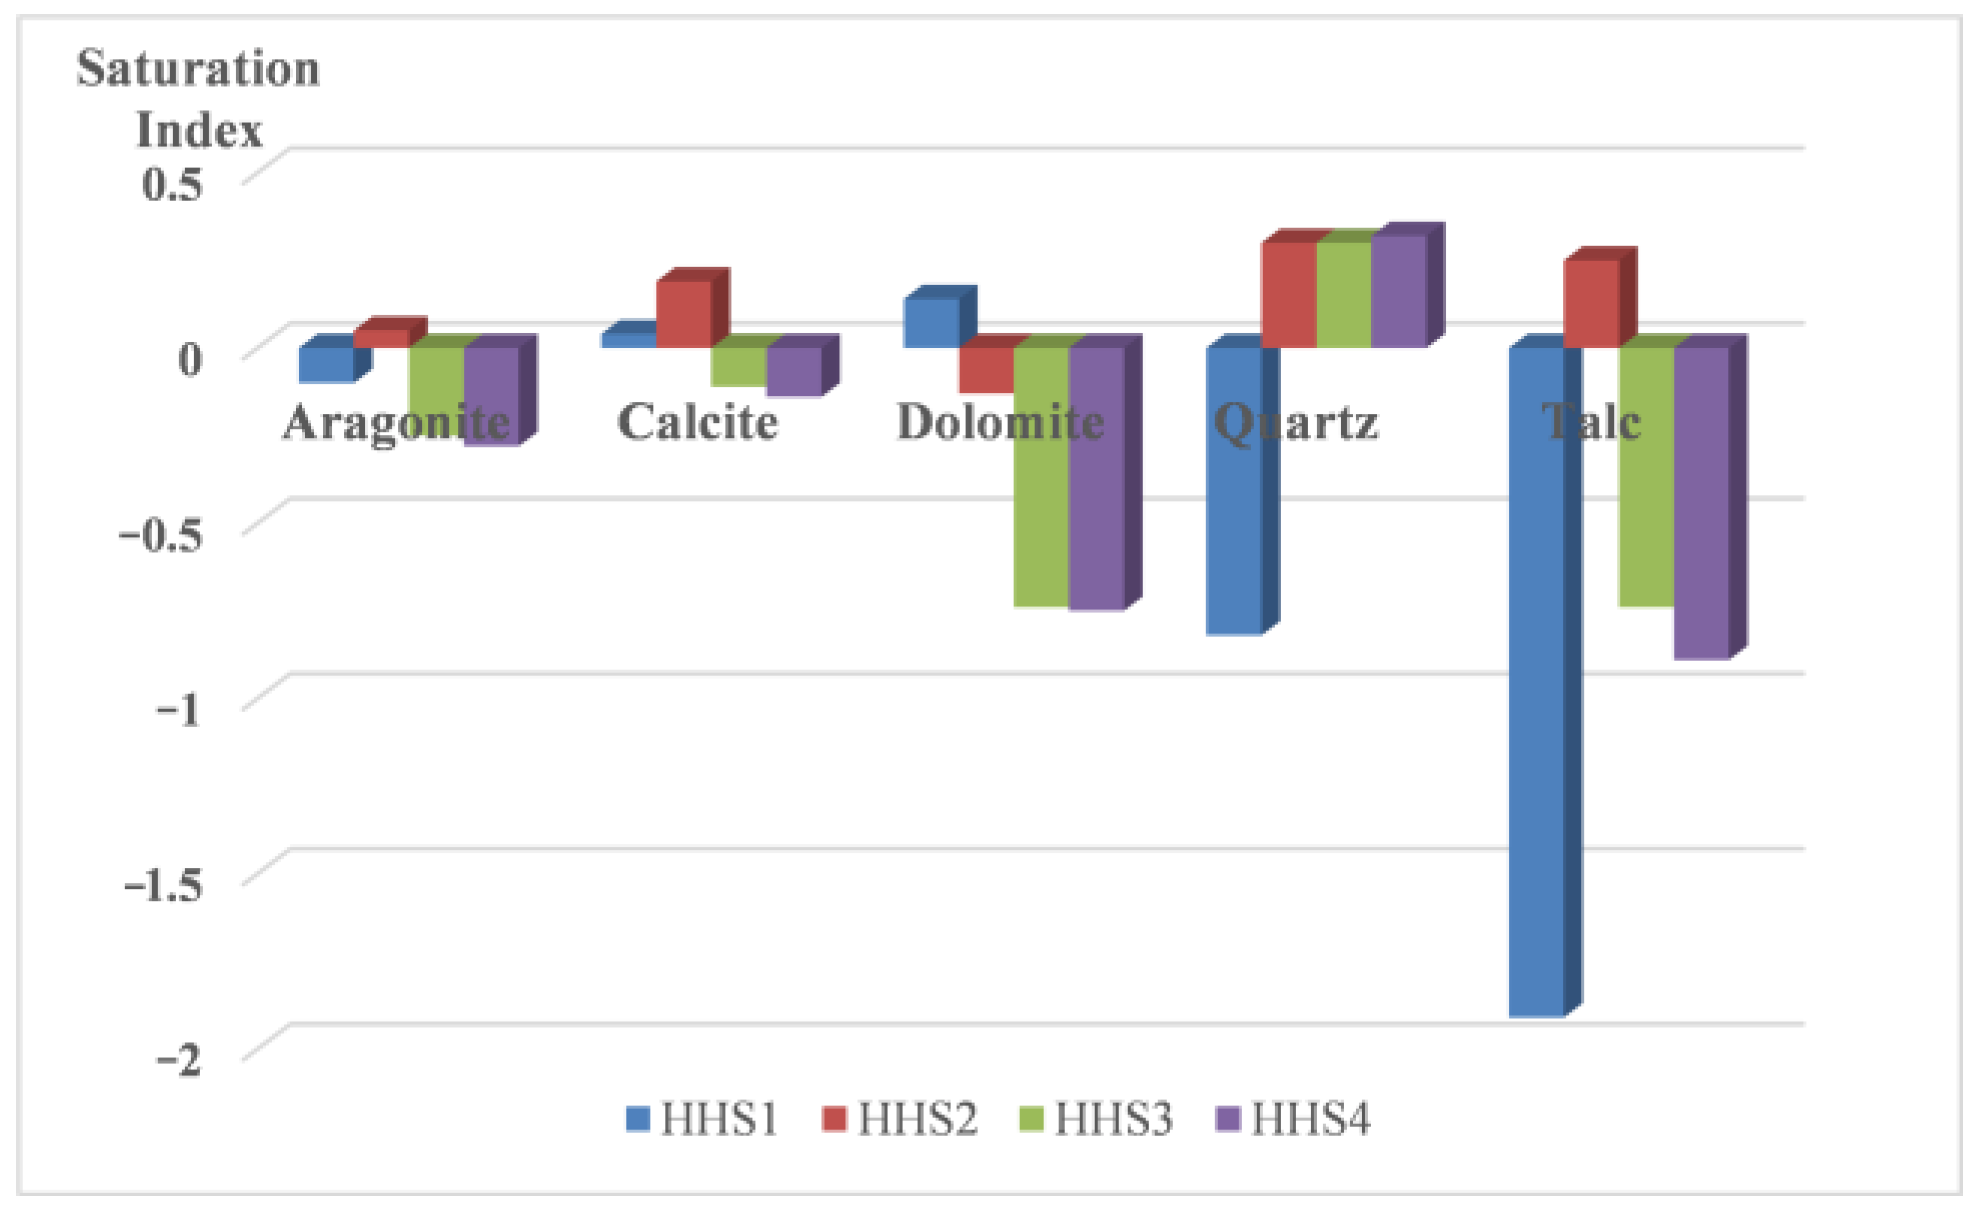
PHREEQC was utilized to calculate the ionic saturation index (Si) of the water samples during the reaction. The SOLUTION, EQUILIBRIUM, and REACTION TEMPERATURE modules of the PHREEQC program were employed to simulate the process. In the SOLUTION module, mixed water (HHS) was used to define the chemical composition of the reservoir. The EQUILIBRIUM module included dolomite, quartz, and calcite as potential minerals. The REACTION TEMPERATURE module was configured for a reservoir temperature of 60 °C. The results indicate that quartz transitioned from an unsaturated state (Si < 0) to a supersaturated state (Si > 0) during the reaction, suggesting a trend toward precipitation. Conversely, dolomite and calcite shifted from an initial supersaturated state to an unsaturated state, indicating a trend of dissolution. Aragonite and talc exhibited a pattern of initial precipitation followed by dissolution (see Figure 6).
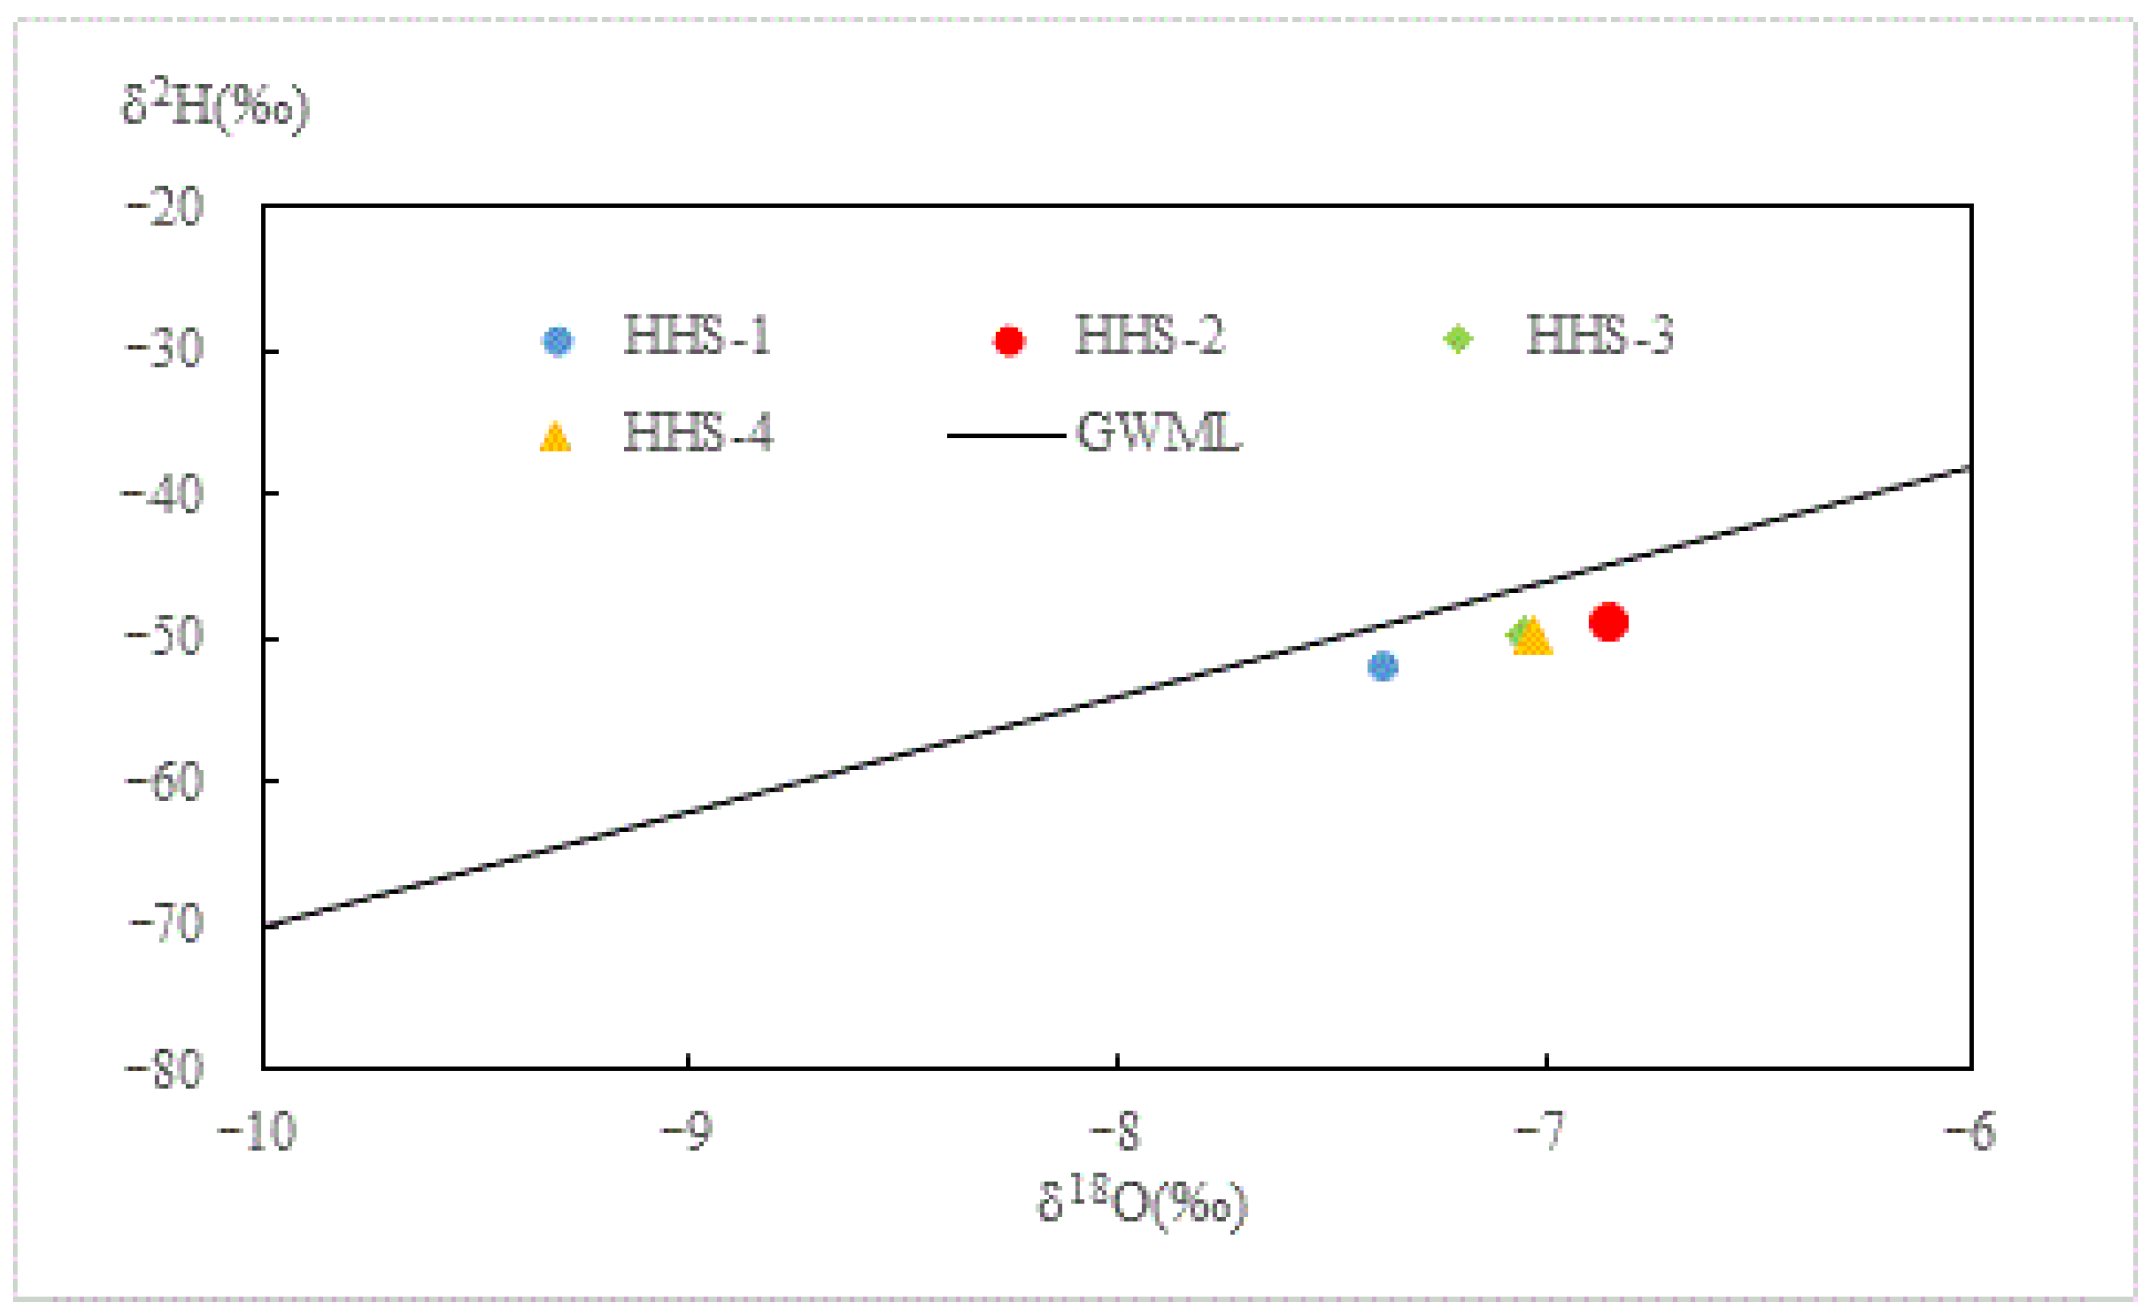
As illustrated in Figure 7, the hydrogen and oxygen isotopes exhibited an enrichment trend that peaked at the initial time point (t = 5 d). This observation indicates the dissolution of minerals with relatively enriched oxygen isotopes and the exchange of these isotopes with geothermal water, resulting in a higher enrichment of oxygen isotopes in the geothermal water compared to earlier measurements. Subsequently, a reversal in this trend occurred at t = 10 d and t = 15 d, suggesting that the oxygen isotope-enriched rock minerals precipitated from the solution, albeit in lesser quantities than those that had previously dissolved. This phenomenon was primarily governed by the combined processes of dissolution and precipitation of silicate and carbonate minerals, including quartz, plagioclase feldspar, and calcite. The reaction equations are detailed in Formulations 1 to 20 [39,40,41]. See Table 6.

3.2. Reservoir Lithology Response

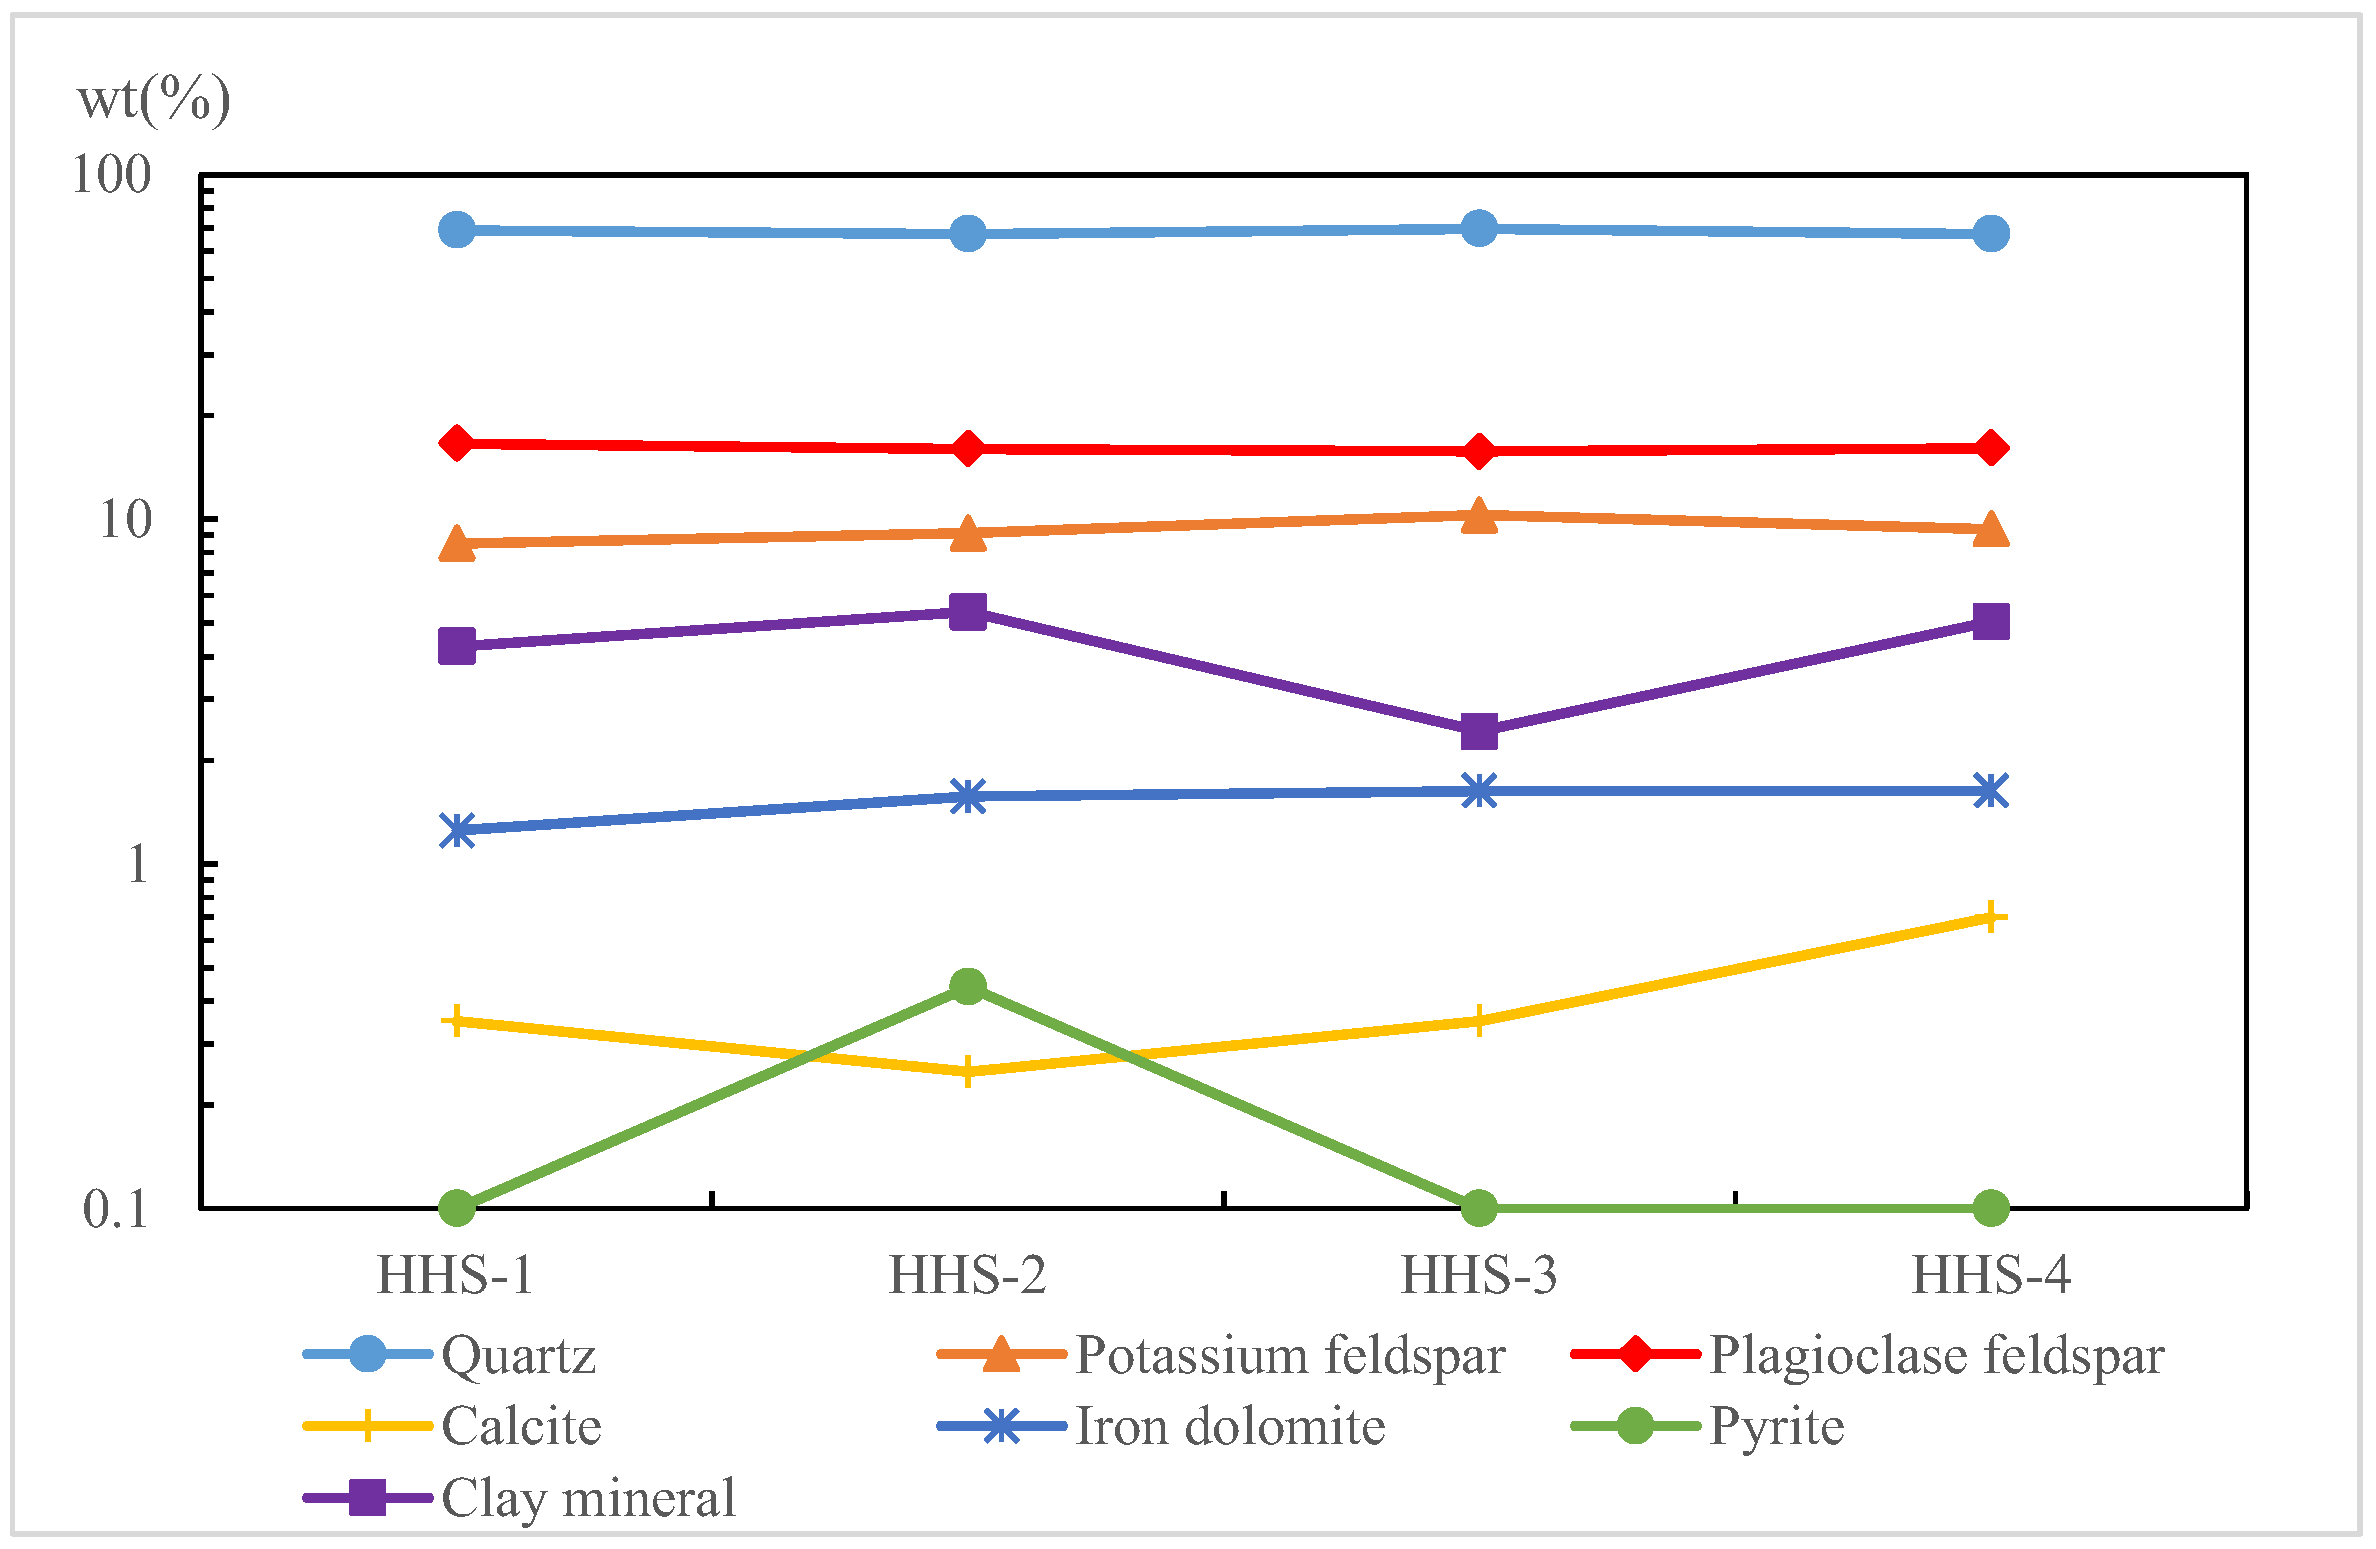
The mineral compositions of sandstone samples were analyzed using an X-ray diffraction analyzer (XRD). The analysis revealed that the quartz content in the rock debris samples initially decreased (t = 5 d), followed by an increase (t = 10 d), and then a further decrease (t = 15 d). This pattern indicates that quartz and SiO2 were converted into each other during the reaction (Formula (4)). Plagioclase feldspar exhibited a consistent downward trend, likely due to dissolution processes (Formulas (16)–(19)). In contrast, potassium feldspar, calcite, iron dolomite, and clay minerals generally showed an increasing trend, primarily driven by sedimentation (Formulas (5), (6), (11)–(15) and (20)); however, calcite and clay minerals experienced slight decreases on the 5th and 10th days of the reaction time, respectively. Notably, pyrite precipitation was observed on the 5th day of the reaction period, followed by its dissolution as the reaction progressed (Figure 8). The chemical composition of clay minerals mainly consists of silicon dioxide, alumina, and water, thus reducing its reaction equation to Formula (20). The chemical reaction equations governing the water–rock interactions occurring during the reinjection process are as follows [42]:
CO2 (g) + H2O ⇔ H2CO3 (aq)
H2CO3 ⇔ H+ + HCO3
HCO3 ⇔ H+ + CO32−
Quartz (Talc) ⇔ SiO2 (aq)
Calcite:
CaCO3 + H+ ⇔ Ca2+ + HCO3
Ca2+ + CO32− ⇔ CaCO3
Iron dolomite:
CaMg3(CO3) ⇔ CaMg(CO3)2 + 2Mg2+ + 2CO32−
CaMg3(CO3) + 2H+ ⇔ CaMg(CO3)2 + 2Mg2+ + 2HCO3
CaMg3(CO3) + 4H+ ⇔ CaMg(CO3)2 + 2Mg2+ + 2H2O + 2CO2 (g)
CaMg3(CO3) + 2Ca2+ + 2CO32− ⇔ 3CaMg(CO3)2
Potassium feldspar:
3KAlSi3O8 + 2H+ +12H2O ⇔ KAl3Si3O10(OH)2 + 6H4SiO4 (aq)+ 2K+
2KAlSi3O8 + 2H+ +9H2O ⇔ H4Al2Si2O9 + 4H4SiO4 (aq)+ 2K+
2KAl3Si3O10(OH)2 + 2H+ + 3H2O ⇔ 3H4Al2Si2O9 + 2K+
2KAl3Si3O10(OH)2 + 2H+ + 18H2O ⇔ 3Al2O3·3H2O +2K+ + 6H4SiO4 (aq)
3H4Al2Si2O9 + 5H2O ⇔ Al2O3·3H2O +2H4SiO4 (aq)
Plagioclase feldspar:
3NaAlSi3O8 + 2H+ ⇔ NaAl3Si3O10(OH)2 + 2Na+ + 6SiO2 (aq)
2NaAl3Si3O10(OH)2 + 2H+ + 3H2O ⇔ 3H4Al2Si2O9 + 2Na+
KAlSi3O8 + NaCl ⇔ NaAlSi3O8 + KCl
2(Na,Ca)(Al,Si)4O8 + H2O + 2CO2 ⇔ 2KAlSi3O8 + 2Na+ + 2HCO3 + Ca2+
Clay mineral + 10H+ ⇔ 2K+ + 2Al3+ + SiO2 (aq) + 5H2O

3.3. Geochemical Analysis

In the context of mixed water reinjection, along with changes in hydrochemistry and the isotopes of hydrogen and oxygen, it was observed that, during the initial stage of the reaction, quartz and plagioclase feldspar decreased, while potassium feldspar, calcite, iron dolomite, and clay minerals were formed. HCO3 was continuously consumed, and the reservoir rock minerals primarily precipitated throughout the entire process. The reduction in total dissolved solids (TDS) of 94.2 mg/L corresponded to 0.08% of the debris involved in the reaction. Some studies have indicated that thermal cycling-induced micro-cracks can alter the physical and mechanical properties of geothermal energy reservoirs, potentially affecting heat and mass transfer performance as well as the stability of the reservoir. However, changes in mineral composition do not necessarily have a significant impact on the initiation and propagation of cracks. Based on these findings, it can be concluded that mixed water reinjection has a minimal effect on the reservoir [43,44,45]. The content of clay minerals initially increased before subsequently decreasing. Overall, the clay mineral content increased, as evidenced by the reduction in TDS in the reinjection water.
PHREEQC was employed to simulate the variations in silicon concentration before and after the reinjection of mixed water (HHS) and geothermal water from Well A into Well B. The simulation utilized the SOLUTION, MIX, EQUILIBRIUM, and REACTION TEMPERATURE modules within the PHREEQC program. In the SOLUTION module, the geothermal fluid from Well B was used to define the chemical composition of the reservoir, while the geothermal fluid from Well A and HHS characterized the reinjection water. The MIX module established a mixing ratio of 1:1 for the reinjection water to the geothermal fluid. The EQUILIBRIUM module considered dolomite, quartz, and calcite as potential minerals. The REACTION TEMPERATURE module was adjusted to a reservoir temperature of 60 °C.
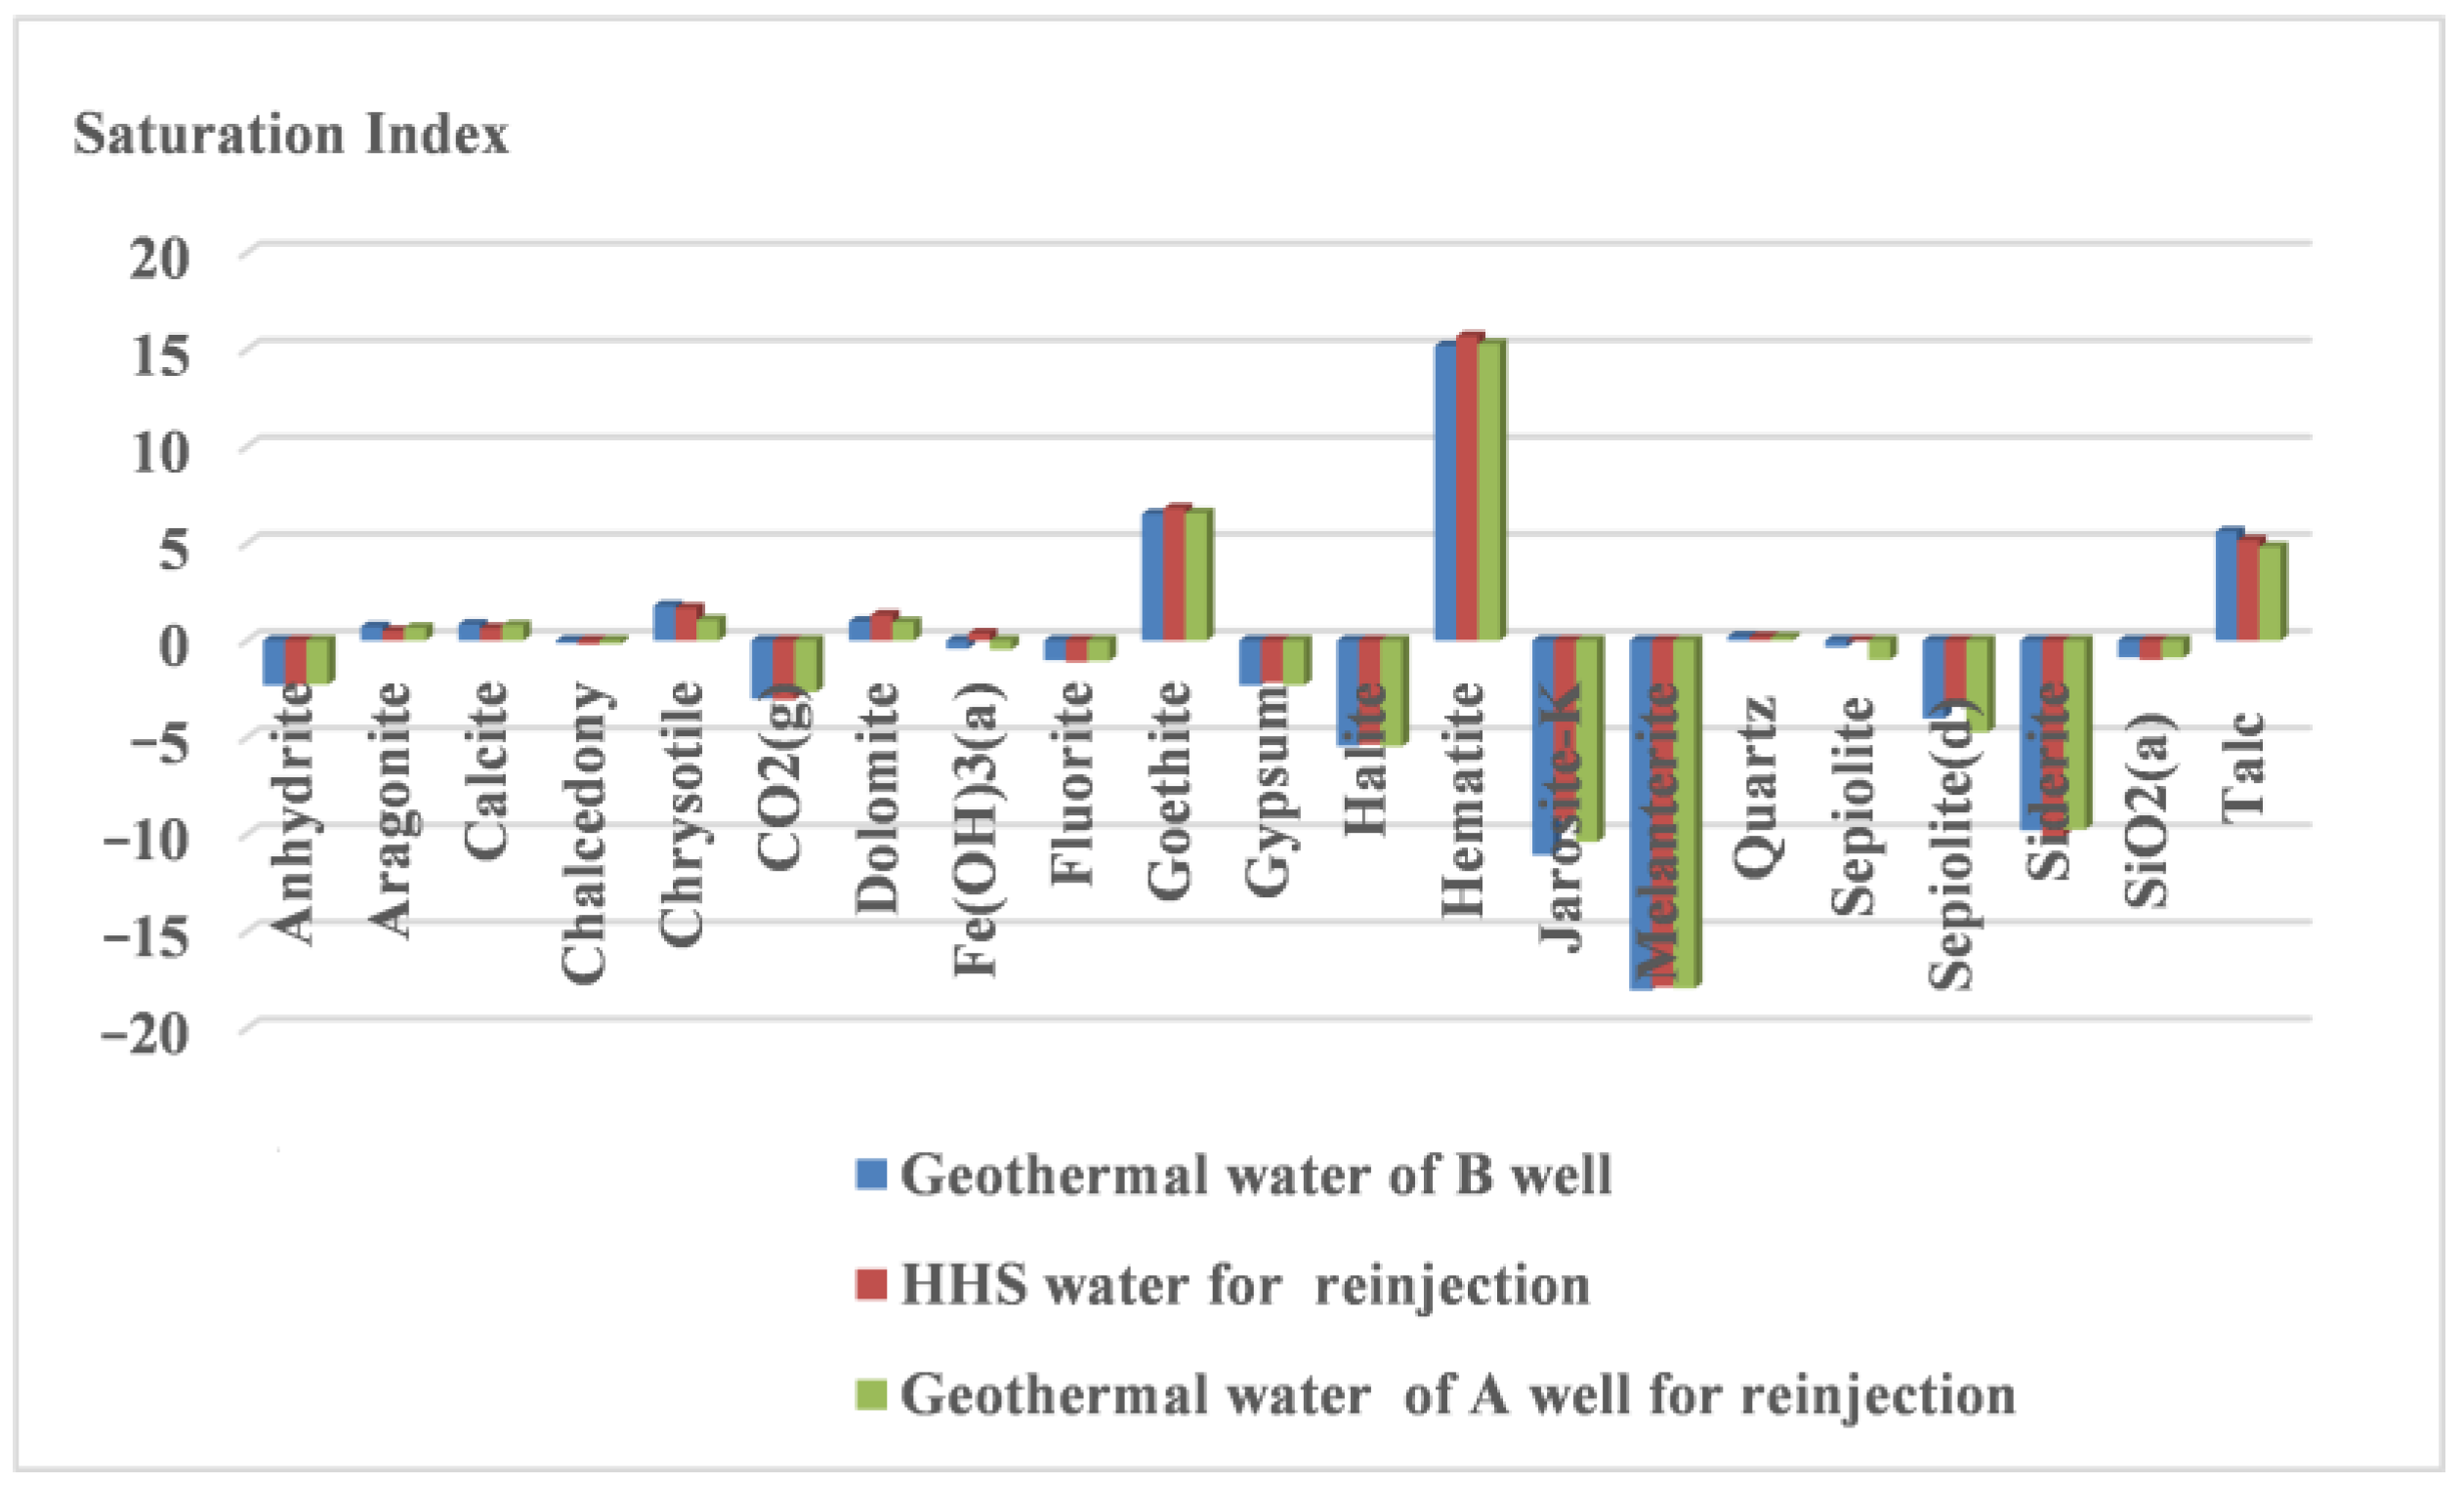
Figure 9 illustrates that, following the reinjection of the two water sources, the trends in the saturation index of minerals displayed similar patterns. Upon reaching equilibrium, carbonate minerals (aragonite, calcite, and dolomite), along with quartz, goethite, and hematite, became supersaturated, indicating a propensity for precipitation. The simulation results demonstrate that comparable hydrogeochemical changes occurred in the geothermal fluid after the reinjection of both types of water sources, thereby confirming the feasibility of reinjecting mixed water from sandstone geothermal reservoirs from a hydrogeochemical perspective.

4. Conclusions

(1)
The surface water treatment process for reinjection into sandstone geothermal reservoirs was established through water treatment simulation experiments. It is feasible to utilize the mixed water (HHS) produced from nanofiltration and intermediate water as a source for reinjection.
(2)
Following the reinjection of mixed water (HHS) into the sandstone reservoir, the pH of the water exhibited a downward trend, while the total dissolved solids (TDS) content decreased by 94.2 mg/L, indicating the production of acidic substances and precipitates. The hydrochemical type consistently remained Cl-Na. The variation in trace elements paralleled that of conventional hydrochemical components, suggesting that they are influenced by related water–rock reactions. The rock minerals enriched in oxygen isotopes precipitated from the solution, with the amount of precipitation being lower than that of dissolution.
(3)
Following the reinjection of mixed water (HHS) into the sandstone reservoir, the minerals within the reservoir exhibited minimal precipitation, primarily consisting of potassium feldspar and iron dolomite. During the experiment, a total of 28.3 mg of rock minerals was produced, accounting for only 0.08% of the debris involved in the reaction. This precipitation had a negligible impact on the reservoir.
(4)
Similar hydrogeochemical changes were observed in the geothermal fluid after the reinjection of mixed water (HHS) and geothermal water. From the perspective of laboratory experiments, the reinjection of treated surface water into the sandstone geothermal reservoir is feasible. Future efforts should concentrate on conducting field tests to validate these findings, establishing a long-term geothermal fluid dynamic monitoring network, and utilizing numerical simulations to evaluate the application effects.

Author Contributions

Conceptualization, B.W. and Y.C.; methodology, B.W. and S.Z.; investigation, Y.Z.; resources, B.Y.; data curation, F.L.; writing—original draft preparation, B.W.; writing—review and editing, Y.Z. and Y.C.; supervision, S.Z.; project administration, Y.C.; resources, B.W., Y.Z., Y.C., S.Z., B.Y., and F.L. All authors have read and agreed to the published version of the manuscript.

Funding

This research was funded by Tianjin Bureau of Geology and Minerals Exploration, grant number Bureau of Mines Science Mission [2024] No. 4.

Institutional Review Board Statement

Not applicable.

Informed Consent Statement

Not applicable.

Data Availability Statement

Data is contained within the article.

Conflicts of Interest

The authors declare no conflicts of interest.

References

  1. Wang, G.L.; Liu, Y.G.; Zhu, X.; Zhang, W. The status and development trend of geothermal resources in China. Earth Sci. Front. 2020, 27, 1–9. [Google Scholar]
  2. Liu, J.; Song, M.Y.; Tian, G.H. Development situation of the geothermal resources and suggestion on sustainable development utilization in Tianjin. Geol. Surv. Res. 2012, 35, 67–73. [Google Scholar]
  3. Cao, Q.; Fang, C.H.; Li, Y.; Wang, H.X.; Fang, Q.; Shi, X.Y. Development status of geothermal reinjection at home and abroad and its enlightenment. Oil Drill. Prod. Technol. 2021, 43, 203–211. [Google Scholar]
  4. Yang, J.L.; Wang, D.M.; Niu, W.C.; Xiang, Z.Q.; Liu, Y.; Zhao, Z.L.; Cheng, X.Y. Prospects and problems of geothermal resources exploitation and utilization in Tianjin. North China Geol. 2022, 45, 1–6. [Google Scholar]
  5. Yin, X.X.; Zao, S.M.; Cai, Y.; Yan, J.X.; Xu, L. Dynamic evolution of geothermal reservoir characteristics in Tianjin in the last three decades of large—Scale development. Acia Geothermal Sin. 2024, 98, 297–313. [Google Scholar]
  6. Zhao, S.M.; Cheng, W.Q.; Zhang, W. Analysis of the geothermal reinjection blockage problem in Neogene sandstone thermal reservoir. Geothermal Energy 2013, 7–12. [Google Scholar]
  7. Axelsson, G. Importance of Geothermal Reinjection. In Proceedings of the Workshop for Decision Makers on Direct Heating Use of Geothermal Resources in Asia, Tinjin, China, 11–18 May 2008. [Google Scholar]
  8. Capetti, G.; Parisi, L.; Ridolfi, A.; Stefani, G. Fifteen years of Reinjection in the Larderello-Valle Secolo Area: Analysis of the Production Data. In Proceedings of the World Geothermal Congress 1995, Florence, Italy, 18–31 May 1995. [Google Scholar]
  9. Stark, M.A.; Tom, W.; Beall, J.J.; Goyal, K.P.; Pingol, A.S. The Santa Rosa—Geysers Recharge Project, Geysers Geothermal Field, California, USA. In Proceedings of the Transactions Geothermal Resources Council 2005, Antalya, Turkey, 14–29 April 2005. [Google Scholar]
  10. Ungemach, P.; Antics, M. Sustainable Geothermal Reservoir Management Practice. In Proceedings of the International Course and EGEC Business Seminar on Organization of Successful Development of a Geothermal Project, Casta Papiernicka, Slovakia, 26–29 May 2009. [Google Scholar]
  11. Allen, A.; Milenic, D. Low-enthalpy geothermal energy resources from groundwater in fluvioglacial gravels of buried valleys. Appl. Energy 2003, 74, 9–19. [Google Scholar] [CrossRef]
  12. Bodvarsson, G.S.S.; Tefansson, V. Some theoretical and field aspects of reinjection in geothermal reservoirs. Water Resour. Res. 1989, 25, 1235–1248. [Google Scholar] [CrossRef]
  13. Darwis, R.S.; Tampubolon, T.; Simatupang, R.; Asdassah, D. Study of Water Reinjection on the Kamojang Geothermal Reservoir Performance, Indonesia. In Proceedings of the 17th NZ Geothermal Workshop 1995, Auckland, New Zealand, 1 January 1995. [Google Scholar]
  14. Diazr, A.R.; Kaya, E.; Zarrouk, S.J. Reinjection in geothermal fields—A worldwide review update. Renew. Sustain. Energy Rev. 2016, 53, 105–162. [Google Scholar]
  15. Kamila, Z.; Kaya, E.; Zarrouk, S.J. Reinjection in geothermal fields: An updated worldwide review 2020. Geothermics 2021, 89, 101970. [Google Scholar] [CrossRef]
  16. Zhao, S.M. Development and Utilization of Geothermal Field in Sedimentary Basin; Geology Press: Beijing, China, 2013. [Google Scholar]
  17. Wang, L.C. A Study of Geothermal Reinjection in the Guantao Reservoir in Tianjin; China University of Geosciences: Beijing, China, 2015. [Google Scholar]
  18. Wang, X.P.; Liu, H.; Jiang, S.J.; Deng, R.Q. Reinjection experimental research on sedimentary basin sandstone reservoir—A case study of Yucheng City’ Shandong. Geol. Rev. 2020, 66, 485–492. [Google Scholar]
  19. Zhou, X. Reinjection Plugging Mechanism Researching of Sedimentary Basin Type Porous Geothermal Water—As the Reinjection Well in Sanqiao of Xi’an for an Example; Chang’an University: Xi’an, China, 2013. [Google Scholar]
  20. Dai, Q.; Wang, C.; Luo, Y.; Xu, B.B.; Yin, W.T.; Wang, P.F. Research on sandstone geothermal reservoir reinjection plugging mechanism and measures against it. Adv. Fine Petrochem. 2017, 18, 10–13. [Google Scholar]
  21. Wu, D.D. Discussion on the countermeasures for blockage control of sandstone geothermal reinjection wells. Explor. Dev. 2022, 18, 166–167. [Google Scholar]
  22. Jiang, G.S.; Wang, G.H.; Zhao, N.; Huang, X.L.; Shen, J. Application of gravel-packed completion technology of Guantao geothermal reinjection well in the Western Binhai New Area. Geol. Surv. Res. 2014, 37, 149–154. [Google Scholar]
  23. Zhao, Y.T.; Shen, J.; Zhao, S.M.; Wen, S.; Zhang, S. Well completion technology optimization and application effect analysis of medium –deep sandstone reinjection wells: A case study of Minghuazhen Formation in Tianjin. Pet. Reserv. Eval. Dev. 2023, 13, 765–772. [Google Scholar]
  24. Feng, S.T.; Wang, C.M.; Yang, Y.B.; Song, W.H.; Liu, S.; Zhao, J.C. Evaluation of the impact of sandstone thermal reservoir recharge on reservoirs: Taking the geothermal region of the northwest Shandong Depression as an example. J. Geol. 2019, 93, 158–167. [Google Scholar]
  25. Wang, H.J.; Yu, M.; Zhao, S.M.; Gao, X.Z.; Liu, F. Microscopic analysis of pore characteristics and comparison of permeability of sandstone in geothermal wells of Neogene. Acta Energiae Solaris Sin. 2019, 40, 1790–1796. [Google Scholar]
  26. Li, S.; Sun, X.L.; Yang, B.M.; Gao, X.Z. Evaluation and analysis of heat reservoir reinjection ability of Neogene Guantao Formation in Tianjin. North China Geol. 2023, 46, 31–44. [Google Scholar]
  27. Chen, Z.Y. Modeling water-rock interaction of geothermal reinjection in the Tanggu low-temperature field, Tianjin. Earth Sci. J. China Univ. Geosci. 1998, 23, 513–518. [Google Scholar]
  28. Shi, X.F.; Zhang, W.J.; Wang, H.M.; Jiao, X.; He, H.Y. Modeling of water-rock interaction during the artificial recharge. J. Jilin Univ. Earth Sci. Ed. 2013, 43, 220–227. [Google Scholar]
  29. Wu, K.Y.; Xiong, Y.; Tan, X.C.; Liu, X.J.; Zhang, Y.F.; Chen, X.D.; Li, Y.F. Study of the crystallization kinetics for “water-rock” interactions in the reservoir pore-system: An overview. Acta Sedimentol. Sin. 2022, 40, 996–1009. [Google Scholar]
  30. Su, Y.J.; Yang, F.T.; Wang, B.; Jia, Z.; Duan, Z.F. Reinjection of cooled water into sandstone geothermal reservoirs in China: A review. Geosci. J. 2018, 22, 199–207. [Google Scholar] [CrossRef]
  31. Wang, B.; Xia, Y.B.; Liu, D.L.; Tian, G.H.; Cai, Y.; Zong, Z.H. Analysis on PHREEQC simulation surface water reinjection of Jxw geothermal wells in Baodi District, Tianjin. Geol. Prospect. 2015, 38, 317–320. [Google Scholar]
  32. Liu, D.L.; Li, Y.M.; Pang, Z.H.; Zhao, S.M.; Fan, Y.F. Geochemical responses of carbonate reservoir to untreated lake water reinjection. J. Eng. Geol. 2019, 27, 178–183. [Google Scholar]
  33. Li, Y.M.; Shen, J.; Zhao, S.M.; Pang, Z.H.; Liu, D.L. Feasibility study on high-effective co-reinjection of waste geothermal water and water from other sources into carbonate reservoir. Sci. Technol. Dev. 2020, 16, 332–337. [Google Scholar]
  34. Xia, Y.B.; Wang, B.; Zhang, F.N.; Jia, Z. Optimization and transformation of water treatment technology for surface water reinjection into geothermal reservoir in Dongli Lake area of Tianjin. Energy Rep. 2023, 9, 25–29. [Google Scholar] [CrossRef]
  35. Standardization Administration of China. GB/T 19772-2005. Available online: https://www.chinesestandard.net/PDF/English.aspx/GBT19772-2005 (accessed on 25 June 2024).
  36. National Energy Administration of China. SY/T 5329-2012. Available online: https://www.chinesestandard.net/PDF/English.aspx/SYT5329-2012 (accessed on 25 June 2024).
  37. Ministry of Natural Resources of the People’s Republic of China. DZ/T 0330-2019. Available online: https://www.chinesestandard.net/PDF/English.aspx/DZT0330-2019 (accessed on 25 June 2024).
  38. Guo, Y.L.; Xu, Y.H.; Wang, H.J.; Shen, J.; Zhao, S.M. Experimental investigation of water-rock reaction for the reinjection of sandstone geothermal reservoirs: A case from Neogene Guantao Formation in Tianjin. Renew. Energy 2023, 210, 203–214. [Google Scholar] [CrossRef]
  39. Jiang, W.J.; Wang, G.C.; Sheng, Y.Z.; Shi, Z.M.; Zhang, H. Isotopes in groundwater (2H, 18O, 14C) revealed the climate and groundwater recharge in the Northern China. Sci. Total Environ. 2019, 666, 298–307. [Google Scholar] [CrossRef]
  40. Jiang, W.J.; Meng, L.S.; Liu, F.T.; Sheng, Y.Z.; Chen, S.M.; Yang, J.L.; Mao, H.R.; Zhang, J.; Zhang, Z.; Ning, H. Distribution, source investigation, and risk assessment of topsoil heavy metals in areas with intensive anthropogenic activities using the positive matrix factorization (PMF) model coupled with self-organizing map (SOM). Environ. Geochem. Health 2023, 45, 6353–6370. [Google Scholar] [CrossRef] [PubMed]
  41. Ning, H.; Jiang, W.J.; Sheng, Y.Z.; Wang, K.L.; Chen, S.M.; Zhang, Z.; Liu, F.T. Comprehensive evaluation of nitrogen contamination in water ecosystems of the Miyun reservoir watershed, northern China: Distribution, source apportionment and risk assessment. Environ. Geochem. Health 2024, 46, 278. [Google Scholar] [CrossRef]
  42. Garrels, R.M.; Christ, C.L. Solutions, Minerals, and Equilibria; Jones and Bartlett Publishiers: Boston, MA, USA, 1965. [Google Scholar]
  43. Feng, G.; Wang, X.C.; Kang, Y.; Zhang, Z.T. Effect of thermal cycling-dependent cracks on physical and mechanical properties of granite for enhanced geothermal system. Int. J. Rock Mech. Min. Sci. 2020, 134, 104476. [Google Scholar] [CrossRef]
  44. Feng, G.; Zhu, C.; Wang, X.; Tang, S. Thermal effects on prediction accuracy of dense granite mechanical behaviors using modified maximum tangential stress criterion. J. Rock Mech. Geotech. Eng. 2023, 15, 1734–1748. [Google Scholar] [CrossRef]
  45. Zhu, D.F.; Yu, B.B.; Wang, D.Y.; Zhang, Y.J. Fusion of finite element and machine learning methods to predict rock shear strength parameters. J. Geophys. Eng. 2024, 21, 1183–1193. [Google Scholar] [CrossRef]
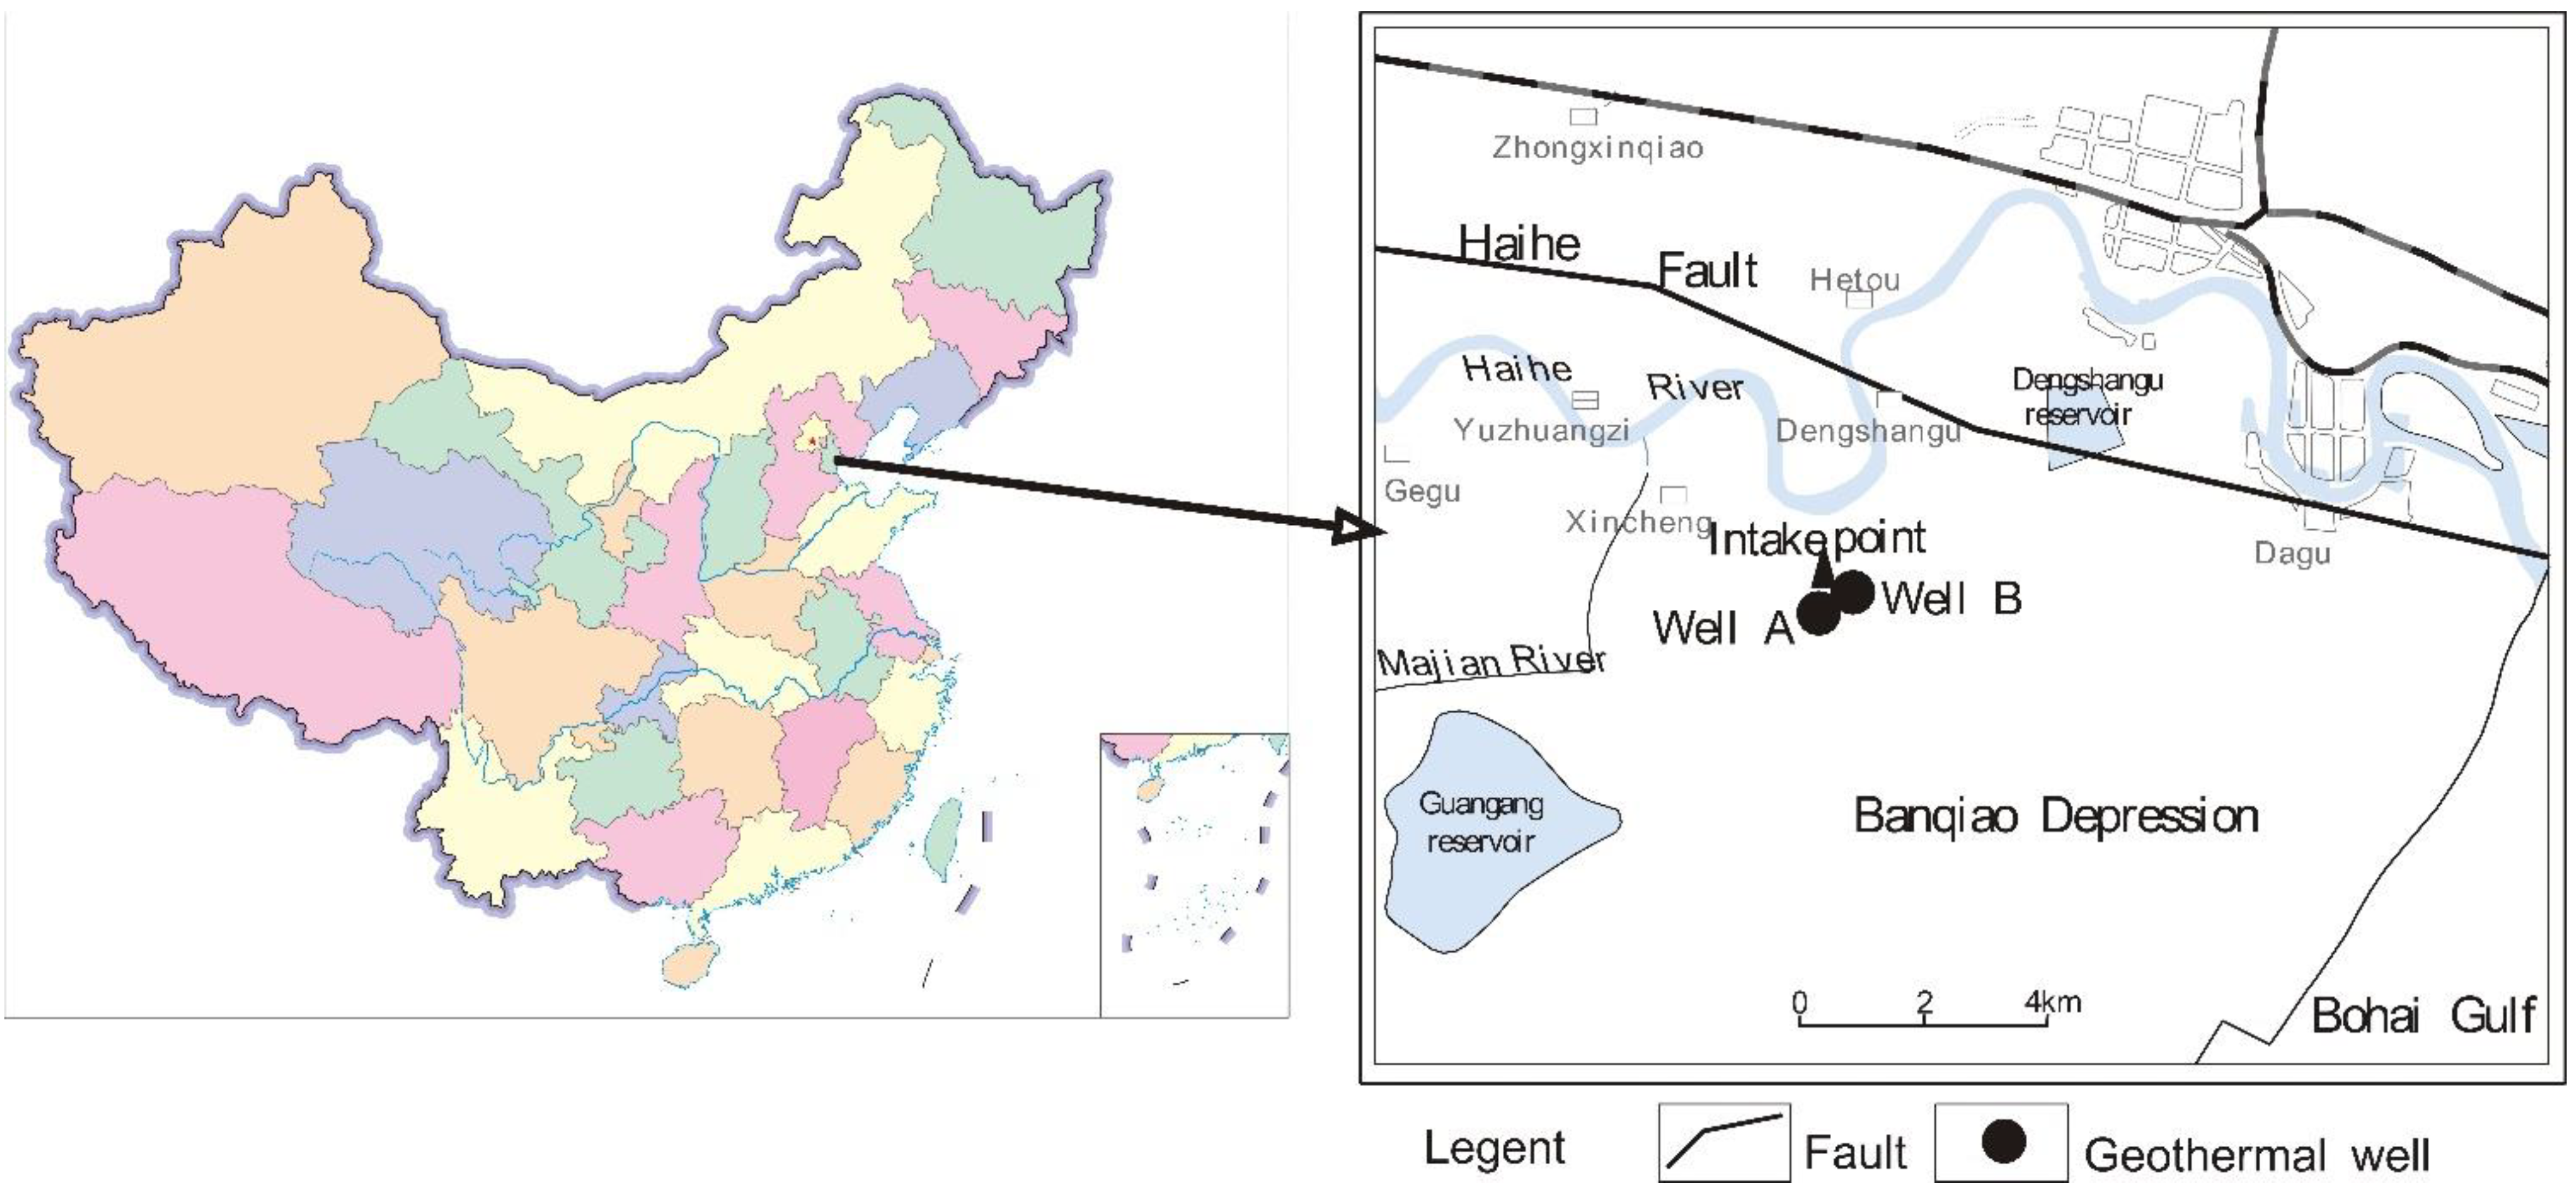
Figure 1. Location of the project.
Water 16 02475 g001
Figure 2. The experimental platform of the surface water treatment.
Water 16 02475 g002
Figure 3. Water treatment process flow.
Water 16 02475 g003
Figure 4. The variations in TDS and pH via the tests.
Water 16 02475 g004
Figure 5. The variations in chemistry analyses via reinjection. (HHS−1, HHS−2, HHS−3, and HHS−4 were samples of reactions lasting for 0, 5, 10, and 15 days, respectively.) (a,b) were variations of the chemical composition via reinjection; (c,d) were variations of the trace elements variations via reinjection.
Water 16 02475 g005
Figure 6. Saturation indices of some minerals via the tests.
Water 16 02475 g006
Figure 7. The behavior of δ18O (‰) and δ2H (‰) via reinjection.
Water 16 02475 g007
Figure 8. Contents of the mineral compositions via reinjection.
Water 16 02475 g008
Figure 9. The variations in the saturation index before and after the reinjection into Well B from different water sources.
Water 16 02475 g009
Table 1. Table of the chemical composition (unit: mg/L).
NameNa+K+Ca2+Mg2+ClNO3SO42−HCO3CO32−SiO2FTDSpH
A4903.610.50.936322.4231510627.74.71408.48.25
B503.63.49.50.6361.60.25266393.6633.65.461577.98.44
Lake787.0725.6931.6451.691072.42657.3306.03361.219.81.78-2657.38.67
Table 2. The analysis results of the water treatment processes and their water production outputs (unit: mg/L).
NameProcess FlowTDSSSDOPO43−pH
Process 1raw water–coagulation–sedimentation–intermediate tank–sand filtration–deoxygenation–precision filter–water production5752.546<0.027.83
Process 2raw water–coagulation–sedimentation–intermediate tank–tubular microfiltration membrane–nanofiltration–produced water62018<0.027.8
Process 3Raw water–coagulation–sedimentation–BAF–intermediate tank–tubular microfiltration membrane–produced water30500.988.25<0.028.1
Note: TDS: Total dissolved solids. SS: Suspended solids. DO: Dissolved oxygen.
Table 3. Chemical composition test results of the treated water (Unit: mg/L).
NameNa+K+Ca2+Mg2+ClNH4+SO42−HCO3SiO2FCO2TDSCODpH
RW787.0725.6931.6451.691072.40.28306.03361.21.782.35802657.320.698.67
NF201.494.1825.093.1264.10.0545.48137.31.120.15516.3681.947.77
HHS4067.522.111.2529.60.23106.111010.311.9114248.25
Table 4. Analysis results of the chemical composition of the mixed water (HHS) (unit: mg/L).
Time/dNa+K+Ca2+Mg2+ClSO42−HCO3NO3SiO2FTDSpH
04067.522.111.2529.6106.1110.04.310.311428.25
54187.944.66.1577.7156.1142.04012.70.713228.01
103517.4405.4416.3144.7104.132.712.70.710507.86
153257.238.35.7355.2130.8112.436.412.70.69567.81
Table 5. The analysis results of the trace elements of the mixed water (HHS) (unit: mg/L).
Time/dSrLiBaRbMoMnCuZnScVWEuCrTiCoNiGaPb
0161.023.315.32.22.81.81.40.80.90.51.10.0063.53.52.514.91.01.0
5650.0151.095.17.411.7113.05.77.43.47.96.20.03710.22.10.55.70.20.4
10496.0110.078.05.711.151.23.86.43.412.36.90.0265.41.80.44.00.20.3
15551.0137.080.07.410.866.04.57.84.08.26.00.0302.52.50.45.20.20.3
Table 6. The isotope analysis results of the mixed water (HHS).
Time/dδ18O (‰)δ2H (‰)
0−7.4−52.0
5−6.8−49.2
10−7.1−49.8
15−7.0−49.6
Disclaimer/Publisher’s Note: The statements, opinions and data contained in all publications are solely those of the individual author(s) and contributor(s) and not of MDPI and/or the editor(s). MDPI and/or the editor(s) disclaim responsibility for any injury to people or property resulting from any ideas, methods, instructions or products referred to in the content.