Article

Effect of In Situ Aeration on Ultrafiltration Membrane Fouling Control in Treating Seasonal High-Turbidity Surface Water

1
Heilongjiang Institute of Construction Technology, 999 Xueyuan Road, Hulan District, Harbin 150025, China
2
State Key Laboratory of Urban Water Resource and Environment (SKLUWRE), Harbin Institute of Technology, 73 Huanghe Road, Nangang District, Harbin 150090, China
*
Author to whom correspondence should be addressed.
Water 2024, 16(15), 2195; https://doi.org/10.3390/w16152195
Submission received: 18 June 2024 / Revised: 18 July 2024 / Accepted: 24 July 2024 / Published: 2 August 2024
(This article belongs to the Special Issue Application of Membrane-Based Technology in Water Treatment)

Abstract

:
Direct ultrafiltration (UF) is anticipated to be a promising technology for rural water supply due to its stable permeate quality and ease of automatic operation & maintenance. However, seasonal high turbidity in the surface water resources caused severe membrane fouling, resulting in the requirement of frequent cleaning of the UF process, and limiting the broad application of the direct UF in treating rural surface water. To address this issue, this study investigated the feasibility and mechanism of in situ aeration in alleviating the UF membrane fouling in treating surface water with high turbidity (200, 500, and 800 NTU). The results indicated that with the weak aeration (0.4 m3/(m2·min)), the concentration of polysaccharides accumulated on the membrane surface was high, and serious membrane fouling was observed. With medium aeration (0.8 and 1.2 m3/(m2·min)), bubble shear force could effectively reduce the foulants accumulated on the membrane surface to alleviate the membrane fouling. During the whole experiment, the optimal group (1.2 m3/(m2·min)) showed a 45% lower TMP compared to the control. However, strong aeration (1.6 m3/(m2·min)) caused floc breakage and was less conducive to the membrane fouling control compared to the medium aeration. Furthermore, under in situ aeration, the contents of polysaccharide accumulated on the membrane surface and deposited in the membrane pores were reduced by 8.85%~49.29%, and the structures of the cake layer turned out to be porous and permeable, implying that in situ aeration could significantly modify the structure and composition of the cake layer, contributing to the UF membrane fouling control in treating the seasonal high-turbidity surface water. These findings will provide novel approaches for the application of UF technology in rural water supply.

1. Introduction

In most rural areas, the conventional drinking water treatment processes (CDWTP), including coagulation, sedimentation, filtration, and disinfection, were employed. However, in the practical application of rural water supply, the CDWTP maintained some inescapable disadvantages, such as high investment in construction facilities, complex operation & maintenance, and high consumption of energy and chemicals [1,2]. Compared to the CDWTP, ultrafiltration (UF) technology has attracted increasing attention in rural drinking water treatment owing to its inherent advantages, such as superior rejections of particle matter, suspended substance, colloids, and microorganisms [3,4,5], small footprint, less economic cost, ease of standardization, easy to modularized installation, and automated operation [6,7].
Direct UF, as one-step membrane filtration, could further reduce the capital cost, footprint, auxiliary equipment, operation & maintenance, and was specifically developed for the rural water supply. However, since surface water was used as the feed water in rural areas, runoff scour occurred during the rainy season, resulting in short-term high turbidity in the feed water and severe membrane fouling in the direct UF process. These issues posed challenges, including the rapid reductions in water production and even large-scale water shutdowns [8]. As a consequence, addressing the membrane fouling during the short-term high-turbidity period was critical for guaranteeing a sustainable and stable drinking water supply in direct UF-based drinking water plants. Recently, many strategies have been developed to control the membrane fouling caused by high-turbidity water, including coagulation [9,10], sedimentation [11], excess chemicals input [12], and backwashing [13,14,15]. Although these strategies could effectively control membrane fouling, they induce some new challenges. Coagulation, sedimentation, and other pretreatment processes require new equipment and purification unit configurations [16], resulting in complex operation & maintenance, high costs, and significant chemical consumption [17]. Backwashing processes required higher flux and longer clean time [14], especially under high turbidity conditions, resulting in higher water wastage and reduced water production rates. These auxiliary processes weaken the advantages of direct UF processes. Therefore, there is an urgent need for strategies that do not affect water productivity and involve no chemicals.
Aeration without any chemical input is regarded as a green membrane fouling control method. In the aeration-based method, the membrane fouling control can be achieved by optimizing the aeration intensity [18], bubble size and direction [19], and bubble utilization rate [20], etc., which was a more flexible option according to the practical situation. In addition, the aeration primarily altered the water flow regime, surface shear intensity, and mass transfer efficiency, to prevent the deposition of foulants on the membrane surface. The Box–Behnken response surface methodology was employed to investigate the impacts of aeration intensity, aeration time, and position on the membrane bioreactor (MBR) technology membrane fouling control, and revealed that the effects of the three factors on membrane fouling were sequenced as follows: aeration intensity > aeration position > aeration time, indicating that aeration intensity was a vital control parameter for membrane fouling alleviation [21]. However, other studies reported that under high aeration intensity, both the extracellular polymeric substance (EPS) quantity of suspension and irreversible fouling resistance increased, indicating that strong aeration would aggravate the membrane fouling [22,23]. Consequently, it was found that both insufficient and excessive aeration often aggravate membrane fouling [24]. In consideration of the characteristics of high-turbidity surface water, aeration held promising prospects for addressing ultrafiltration membrane fouling issues caused by high-turbidity water. However, in surface water treatment, most studies on controlling the membrane fouling by aeration used raw water with turbidities below 20 NTU [25,26]. This was due to the fact that the turbidity of raw water in most water treatment plants does not exceed 20 NTU. The survey by Zhang et al. of 146 water treatment plants in China showed that nearly 75% of the plants had raw water turbidity between 0 and 20 NTU [27]. Additionally, in high-turbidity surface water treatment (raw water turbidity > 100 NTU), aeration is usually combined with other processes to ensure the treatment efficiency of the UF process [28,29,30]. As a result, few studies have been reported on the direct UF process in treating high-turbidity surface water, and the operational conditions and membrane fouling alleviating mechanisms for using in situ aeration alone to assist ultrafiltration in directly treating high-turbidity surface water are not yet clear, and require further study.
Therefore, this study explored the impacts of feed water turbidity (200 NTU, 500 NTU, 800 NTU) on the direct UF process. Meanwhile, the changes in transmembrane pressure (TMP) and membrane fouling characteristics were investigated during long-term operation with different aeration intensities (relatively weak aeration of 0.4 m3/(m2·min), medium aeration of 0.8 m3/(m2·min) and 1.2 m3/(m2·min), and strong aeration of 1.6 m3/(m2·min)). Furthermore, the structure and morphology of the cake layer attached to the membrane surface were analyzed to reveal the potential mechanism of membrane fouling alleviation by in situ aeration.

2. Materials and Methods

2.1. Characteristics of Feed Water

Compared to urban areas, most rural soils are less polluted. Additionally, in some rural areas, excessive farming and insufficient vegetation cover have led to a decline in soil organic matter [31]. Therefore, except for some fertile regions, the organic matter content in most rural soils is relatively low. To simulate the characteristics of raw water with high turbidity and low organic content during rural seasonal rainfall, the soil was collected from 2 m below the ground, containing low concentrations of organic substances and ammonia. This soil was then mixed with the dechlorinated tap water to prepare the high-turbidity feed water. To simulate the “frontal” characteristics caused by heavy rain (the phenomenon of rapid changes in water turbidity over a short period), the inflow turbidity was set at three stages: 200 NTU, 500 NTU, and 800 NTU, respectively. The characteristics of the feed water remained relatively constant, with a low content of organic matter: ultraviolet absorbance at 254 nm (UV254) values of 0.020–0.028 cm−1, permanganate index (CODMn) values of 2.455–3.057 mg/L, and ammonia nitrogen (NH4+-N) concentrations of 0.126–0.188 mg/L.

2.2. Experimental Setup

Figure 1 illustrates the direct UF system, mainly integrated with a feed water tank, peristaltic pump, membrane tank installed with hollow fiber membrane modules, overflow system, programmable logic controller (PLC) control system, air blower, aeration disk, mechanical mixer, and auxiliary components (such as pipelines, water flow meter, gas flow meter, and pressure sensor). An overflow was installed at the upper end of the membrane tank to maintain a consistent water level. To realistically simulate the condition of high-turbidity inflow faced by the drinking water treatment plants, the feed water was updated daily with a hydraulic retention time of 24 h. An aeration disk with gas flow meters was positioned at the bottom of the membrane tank to control the aeration intensity for each group. The direct UF procedure was performed as follows. High-turbidity water was pumped into the feed water tank, and then two mechanical agitators were adopted to further stir the high-turbidity feed water homogeneously for 24 h to stabilize its turbidity. Subsequently, the feed water was transferred into the membrane tank through a peristaltic pump. To simulate the real drinking water treatment conditions in villages and towns, numerous drinking water treatment plants in rural areas were surveyed, and it was found that their membrane flux generally ranged from 10 LMH to 20 LMH. Considering the fact that increasing water flux may exacerbate membrane fouling, this study set the water flux parameter to the upper limit of this range, 20 LMH, to ensure the experimental conditions can cover and adapt to a wider range of practical scenarios. The PLC control system was introduced to regulate the pump operation, ensuring a stable membrane flux of 20 LMH for each group. Ultimately, the treated water by the UF membrane directly flowed into the outlet tank.
As shown in Table 1, five bench-scale direct UF systems, defined as CG, R1, R2, R3, and R4, were established to directly treat the high-turbidity feed water in this experiment. In each UF system, aeration was introduced to assess the impacts of aeration intensity on the TMP development and membrane fouling control. The planar area of the single experimental unit in this study was 12.56 cm2. The aeration intensities for the systems were set at 0, 0.4, 0.8, 1.2, and 1.6 m3/(m2·min), respectively. The shock load of turbidity in the feed water was divided into three stages, i.e., 200 NTU, 500 NTU, and 800 NTU, with operations of 115, 53, and 114 h, respectively.
The polyvinylidene fluoride (PVDF) hollow fiber UF membrane (150 kDa) purchased by Jiangsu Nollet Intelligent Water Equipment Co., Ltd. (Nantong, China) was used. The membrane tubes had an inner diameter of 0.9 mm and an outer diameter of 1.2 mm. The membrane module consisted of 8 fibers, each 60 cm in length. The surface area of a single membrane fiber was 22.62 cm2, resulting in a total membrane module area of 180.96 cm2. Prior to installation, the membrane module should be soaked in low-concentration sodium hypochlorite solution (10 mg/L) for 24 h, and then soaked in pure water for 24 h (updated 3 times) to remove the potential contaminants.

2.3. Flux and Filtration Resistance Analyses

Darcy’s law describes the relationship between the membrane flux, TMP, and filtration resistance across the membrane. Thus, the filtration resistance can be calculated based on the following equation:
J = Δ P μ R
where J is the permeate flux, L·m−2·h−1; ΔP is the TMP, Pa; μ is the viscosity, Pa·s; R is the total resistance, m−1.

2.4. Analytical Methods

Turbidity was measured by a turbidimeter (2100Q portable turbidity, Hatch, Danaher Corporation, New York, NY, USA). The concentrations of CODMn and NH4+-N were determined according to the Chinese National Standard Method (GB/T 5750.4-2022). UV254 was determined using ultraviolet spectrophotometry (LH-3BA, Lianhua, Beijing, China) at a wavelength of 254 nm. Dissolved oxygen was assessed using a dissolved oxygen meter (multi 3420, WTW, Xylem Analytics Germany Sales GmbH & Co. KG, Weilheim, Germany). Fluorescent compounds were determined via excitation-emission matrix (EEM) spectroscopy (F7000, Hitachi, Tokyo, Japan).

2.4.1. Morphological Observation

After the experiment, the membrane samples were removed, and the morphology and distribution of the membrane were observed via an optical coherence tomography (OCT, Thorlabs, Dachau, Germany) and the stereoscopic microscope (Olympus C-7070 microscope, Olympus, Tokyo, Japan) based on a minimum of 13× and a maximum of 90× viewing magnification. After a 120 s gold sputtering process, the membrane samples were captured by a scanning electron microscope (SEM, ZEISS Sigma 500, Zeiss, Carl Zeiss Microscopy Limited, Cambridge, UK). The thickness, porosity, and roughness of the cake layer attached to the membrane surface were analyzed using ImageJ 1.53 software (National Institutes of Health, Bethesda, MD, USA). The concentration of EPS within the cake layer was determined by the anthrone-sulfuric acid method. Changes in functional groups on the membrane surface were analyzed using fourier transform infrared spectroscopy (FTIR), with a wavelength scanning from 650 nm to 4000 nm.

2.4.2. Composition Analysis

After the experiment, the membrane module was removed, and 30 cm of membrane fibers were cut for biomass extraction. The extraction content was divided into EPS and soluble microbial products (SMPs). The extraction steps were as follows: the cake layer was carefully scraped off the membrane with a pre-sterilized silica gel pad. The membrane surface was then rinsed with saline three times, and the cake layer along with the rinsing waste solution was collected into a 50 mL centrifuge tube. The volume was then adjusted with saline to 30 mL. The solution was vortex-shaken, then sonicated for 1 min at an intensity of 8% under the ice-water bath condition, and then the sonicated solution was recorded as the cake layer solution A. Afterwards, the cake layer solution A was centrifuged at 4 °C for 5 min at 3000× g, and the supernatant was collected as the SMP solution. After centrifugation, the accumulated sludge at the bottom was again filled to 30 mL with saline, vortexed for 15 min to mix well, and then sonicated at 25% intensity 3 times for 3 min each time in an ice-water bath. The sonicated solution was placed into a centrifuge and centrifuged at 10,000× g for 10 min, and after centrifugation, the supernatant was collected into a centrifuge tube, which was recorded as the extra-pore extracellular polymeric substances (Ex-EPS) solution. The membrane filaments with the cake layer scraping off were cut into 3~5 cm segments and soaked in 0.01 mol/L sodium hydroxide solution for 24 h to extract the EPS deposited in the membrane pores, and the solution was recorded as the intra-pore extracellular polymeric substances (In-EPS). The above SMP, Ex-EPS, In-EPS, and cake layer solution A were quickly placed into the refrigerator for low-temperature storage after extraction for subsequent polysaccharide, protein content, and ATP assays.

3. Results and Discussion

3.1. Effect of Aeration Intensity on TMP Development

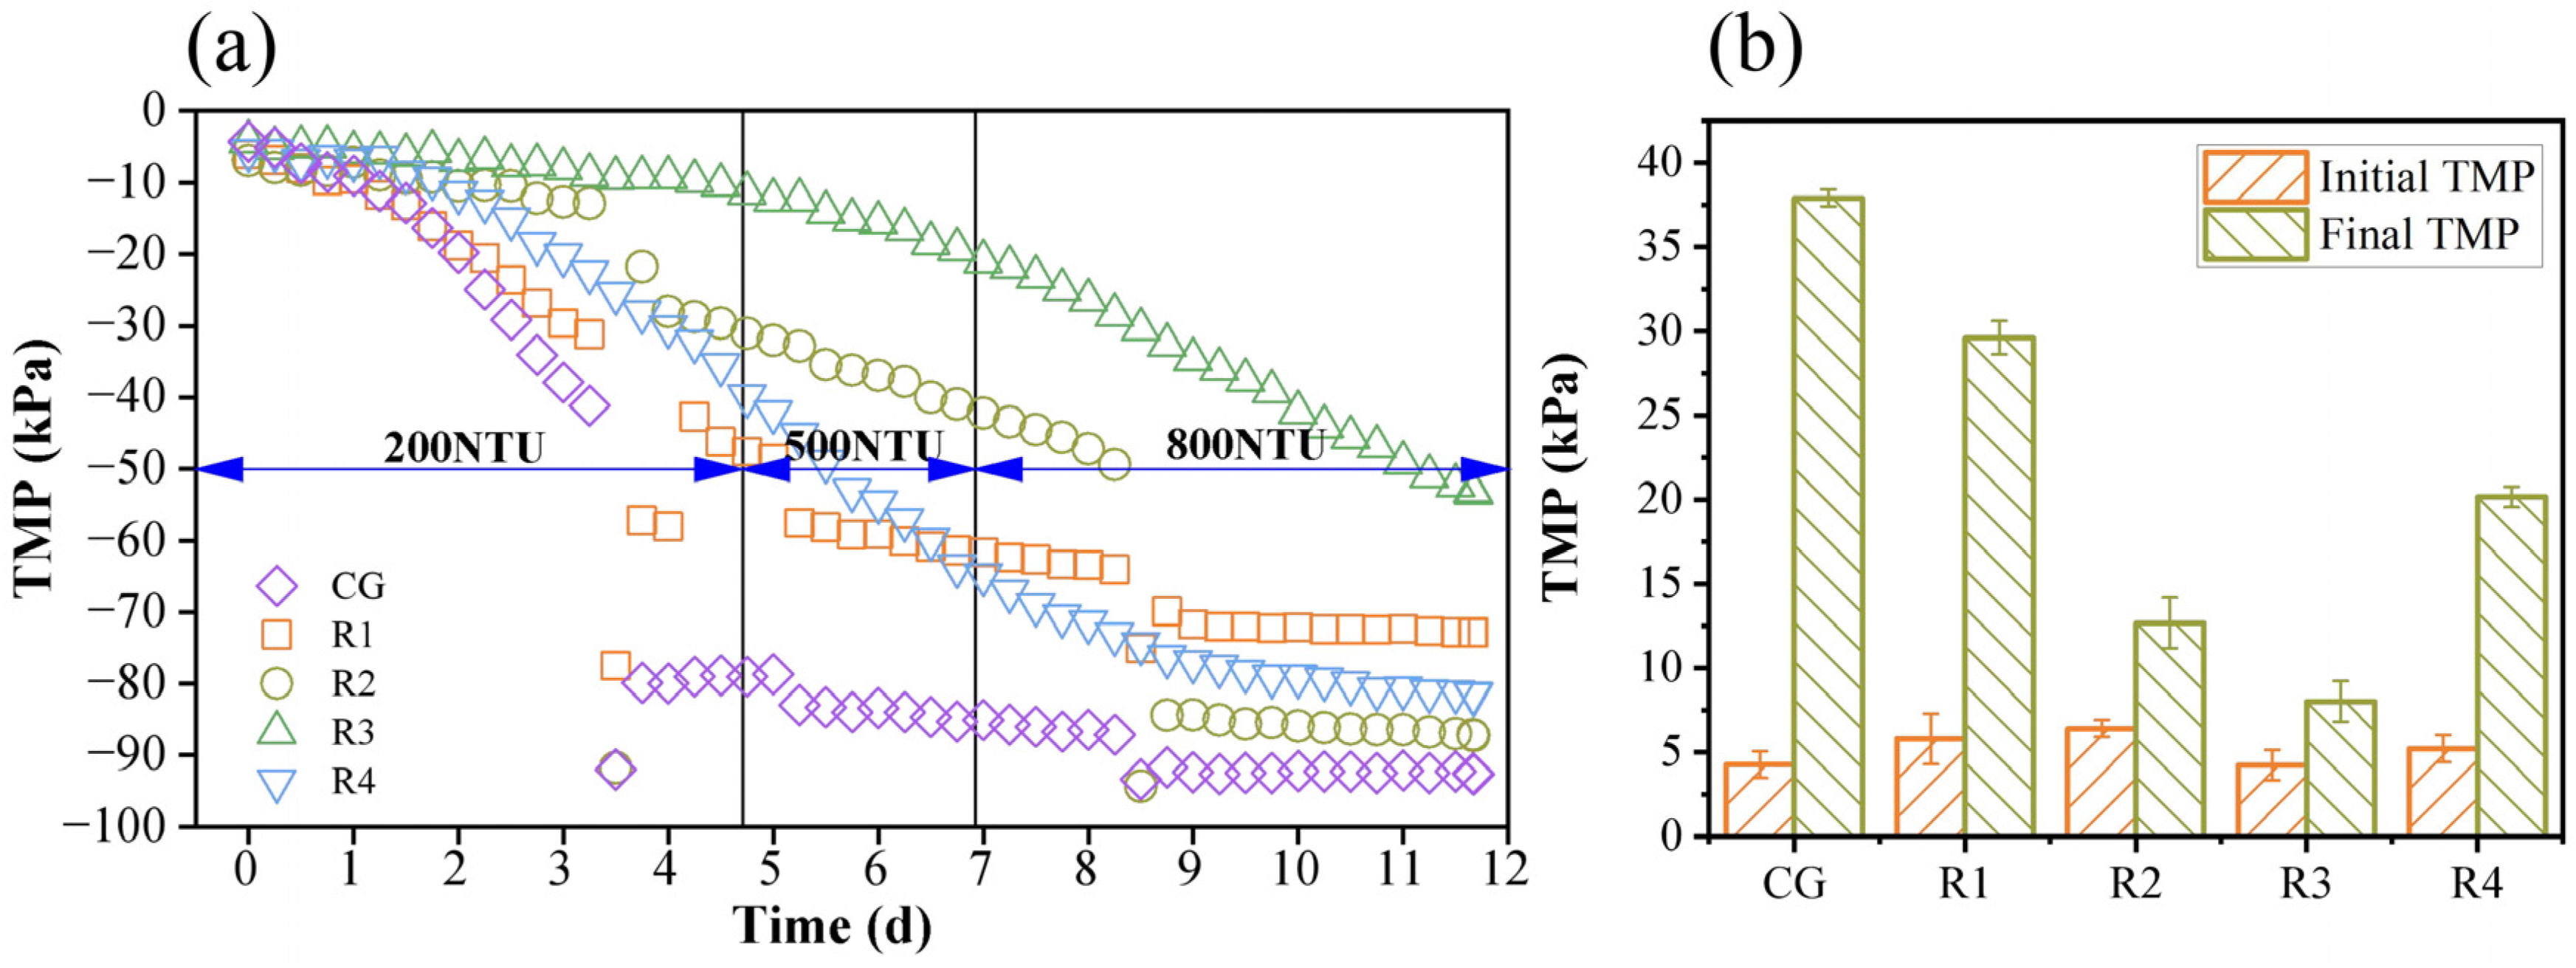
As illustrated in Figure 2a, the experimental procedure was segmented into three stages based on the influent turbidity levels of 200 NTU, 500 NTU, and 800 NTU, respectively. As shown in Figure 2b, after 72 h of operation at 200 NTU with aeration, the growth trend of TMP in R1, R2, R3, and R4 slowed down, accounting for only 70.47%, 18.64%, 11.23%, and 44.42% of that in CG. Membrane fouling was alleviated to a lesser extent under relatively weak aeration conditions (0.4 m3/(m2·min)). On the one hand, the generated bubbles could not provide sufficient shear force to remove pollutants on the membrane surface. On the other hand, limitations in the number and size of bubbles may lead to uneven distribution of shear forces on the membrane fibers [18], thus failing to alleviate the membrane fouling adequately. With moderate aeration intensities (0.8 and 1.2 m3/(m2·min)), the TMP decreased by approximately 90% relative to the control, since the continuous aeration can significantly reduce foulants accumulation on the membrane surface. According to the simulation based on fiber Bragg grating (FBG) sensing technology by Qin et al. [32], as the aeration intensity increased, the longitudinal shear force experienced by the membrane components closest or at medium distances from the source of aeration exhibited an overall increasing trend. Therefore, with the increase in the aeration intensity, the strong shear force generated by aeration bubbles postponed the rate of particle accumulation on the membrane surface [33]. However, the aeration intensity did not appear to be better the larger it was, and when the aeration intensity increased to 1.6 m3/(m2·min), the positive effect of aeration on the membrane fouling declined. The explanation may be that excessive transverse flushing force would destroy the cake layer and flocs on the membrane surface, reducing particle size and negatively influencing the “dynamic membrane” function of the cake layer [34,35,36]. Subsequently, under the pressure of water flow, the broken small particles would form a more compact cake layer on the membrane surface [37], and the shear force of aeration and the disturbance of bubbles cannot remove it, thereby resulting in the increase of TMP. The TMP developments of different UF systems under 500 NTU and 800 NTU were quite similar to the former phase. Throughout the entire operational phase, R3 (1.2 m3/(m2·min)) consistently showed the best membrane fouling control, with TMP growth rates (d(TMP)/dt) of 0.063 kPa/h, 0.252 kPa/h, and 0.284 kPa/h in Stages I, II, and III, respectively. In the end, the TMP of R3 increased by 49.05 kPa from the beginning, which was 55.48% of the TMP increase in the CG group, indicating that in situ aeration could effectively control the membrane fouling during the treatment of high-turbidity surface water. As shown in Table 2, in studies exploring the impact of aeration intensity on controlling membrane fouling in surface water or model water, most raw water turbidities were below 20 NTU. Additionally, some studies used pretreatment methods (e.g., oxidation, coagulation) or backwashing processes for assistance. In this study, despite the high raw water turbidity, in situ aeration still maintained effective membrane fouling control, with a lower TMP growth rate compared to most studies. These results indicated that using aeration alone to control ultrafiltration membrane fouling was feasible in treating the raw water with high turbidity and low organic matter.

3.2. Removal Performance

In Figure 3, though the turbidity values in the feed water increased from 200 NTU to 800 NTU, the turbidity in the membrane permeate of all UF systems always remained constant at an average value of approximately 0.2 NTU, indicating that the direct UF process was endowed with inherent capability in resisting the turbidity shock load in the feed water and can effectively address the problem of seasonal high-turbidity surface water in the rural water supply. In addition, under the influent condition of 200 NTU, due to the changes in dissolved oxygen (DO) and redox potential caused by aeration [42,43], the removal rates of NH4+-N, UV254, and CODMn in the aeration group were approximately 10%, 10%~20%, and 5%~10% higher than the control group, respectively. The enhancement of organic pollutant removal by aeration was beneficial for alleviating membrane fouling. However, it is worth noting that as the intensity of aeration increased, the removal rates of pollutants showed a trend of first increasing and then decreasing, and this trend was similar to the changing trend of TMP in each group. Many studies have confirmed that strong water flow disturbances would break down the large particles into fine flocs and release natural organic matter (NOM), exacerbating the membrane fouling or reducing the removal rates of contaminants [44]. Therefore, under high influent turbidity conditions, the selection of aeration intensity was crucial for in situ control of membrane fouling. Furthermore, under the conditions of 500 NTU and 800 NTU in the feed water, there was no significant difference among all UF groups.
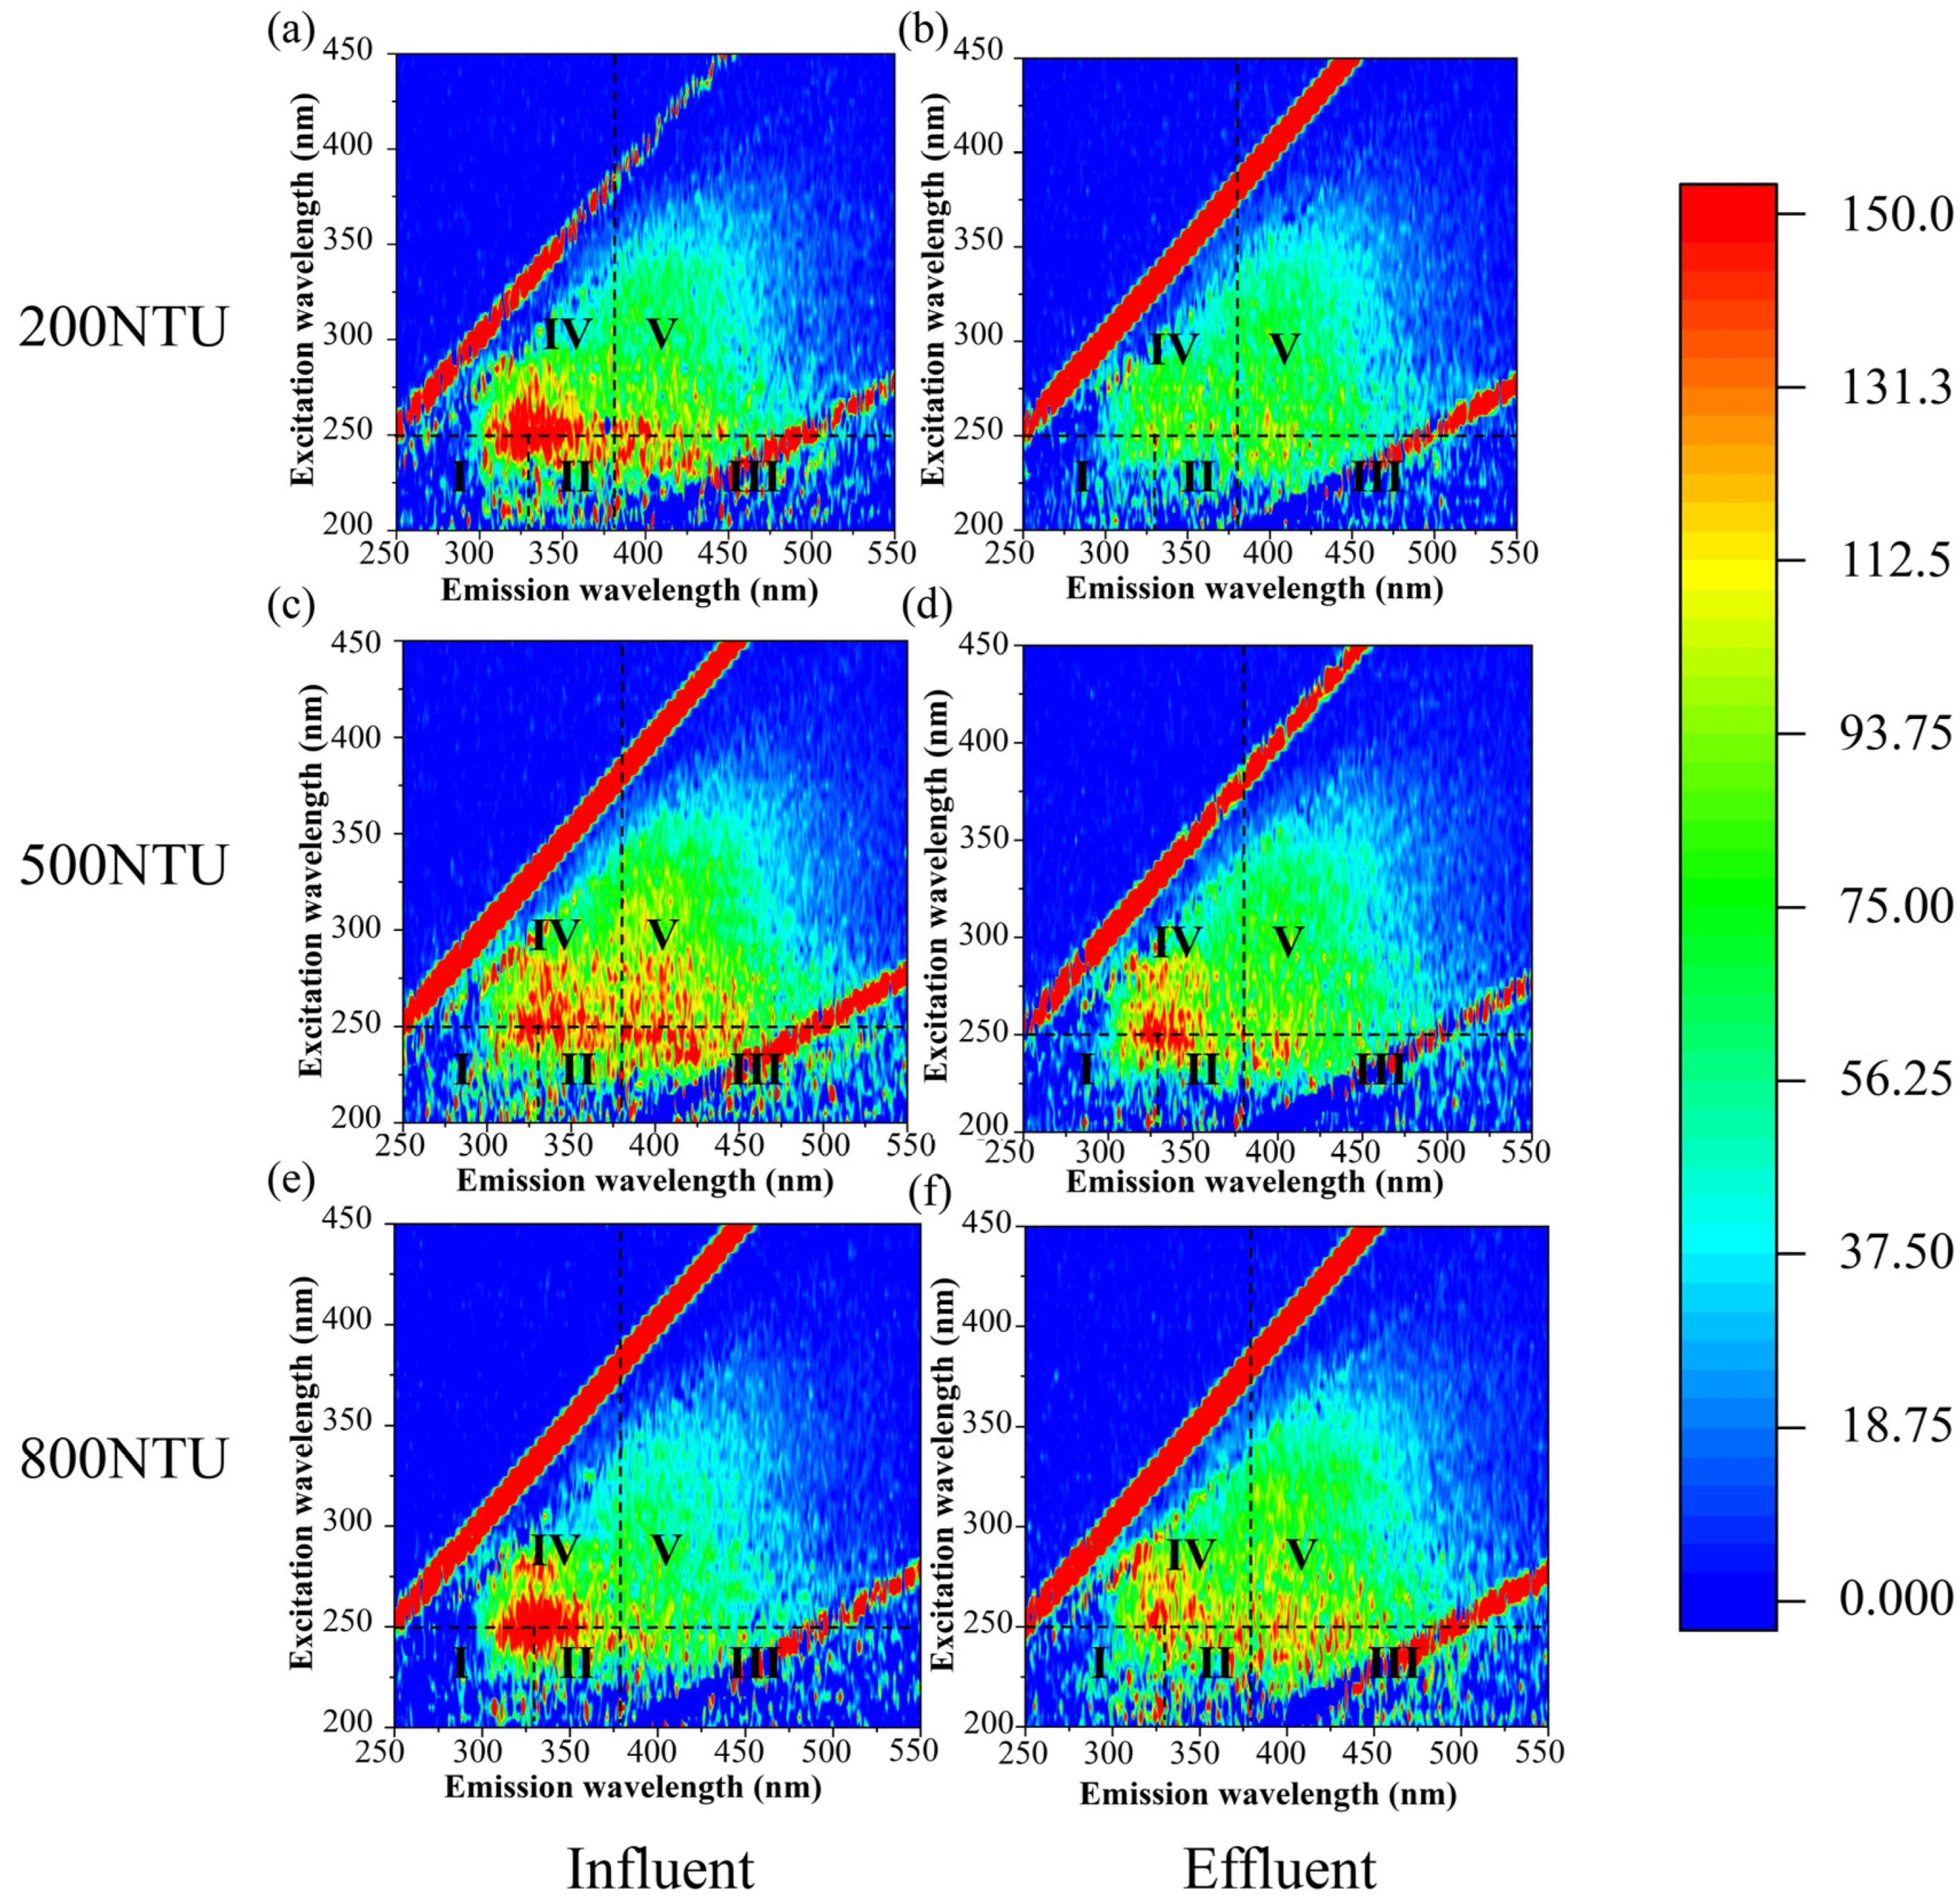
The fluorescent organic compounds in feed water and membrane permeate were characterized using EEM and were divided into five regions. Regions I and II corresponded to aromatic proteins, while regions III–V were related to fulvic acid-like components, soluble proteins, and humic acid-like substances, respectively [45]. Since the removal performance of fluorescent compounds in different UF systems appeared close to each other, the membrane effluent of just one UF system is illustrated, as shown in Figure 4. Compared with the feed water, the fluorescent intensity of the membrane permeates of the UF process decreased significantly. Under different influent turbidities, the strongest peak positions of three-dimensional fluorescence did not change in the influent, and all appeared at region I or IV (Ex/Em of 245~255/321~334 nm), indicating that the main organic pollutants were aromatic proteins and soluble proteins. After aeration, the average removal rates of fluorescent pollutants (regions I–V) by the UF process were approximately 42%, 34%, 32%, 19%, and 21%, respectively.

3.3. Cake Layer Structures

3.3.1. Morphologies of Cake Layer

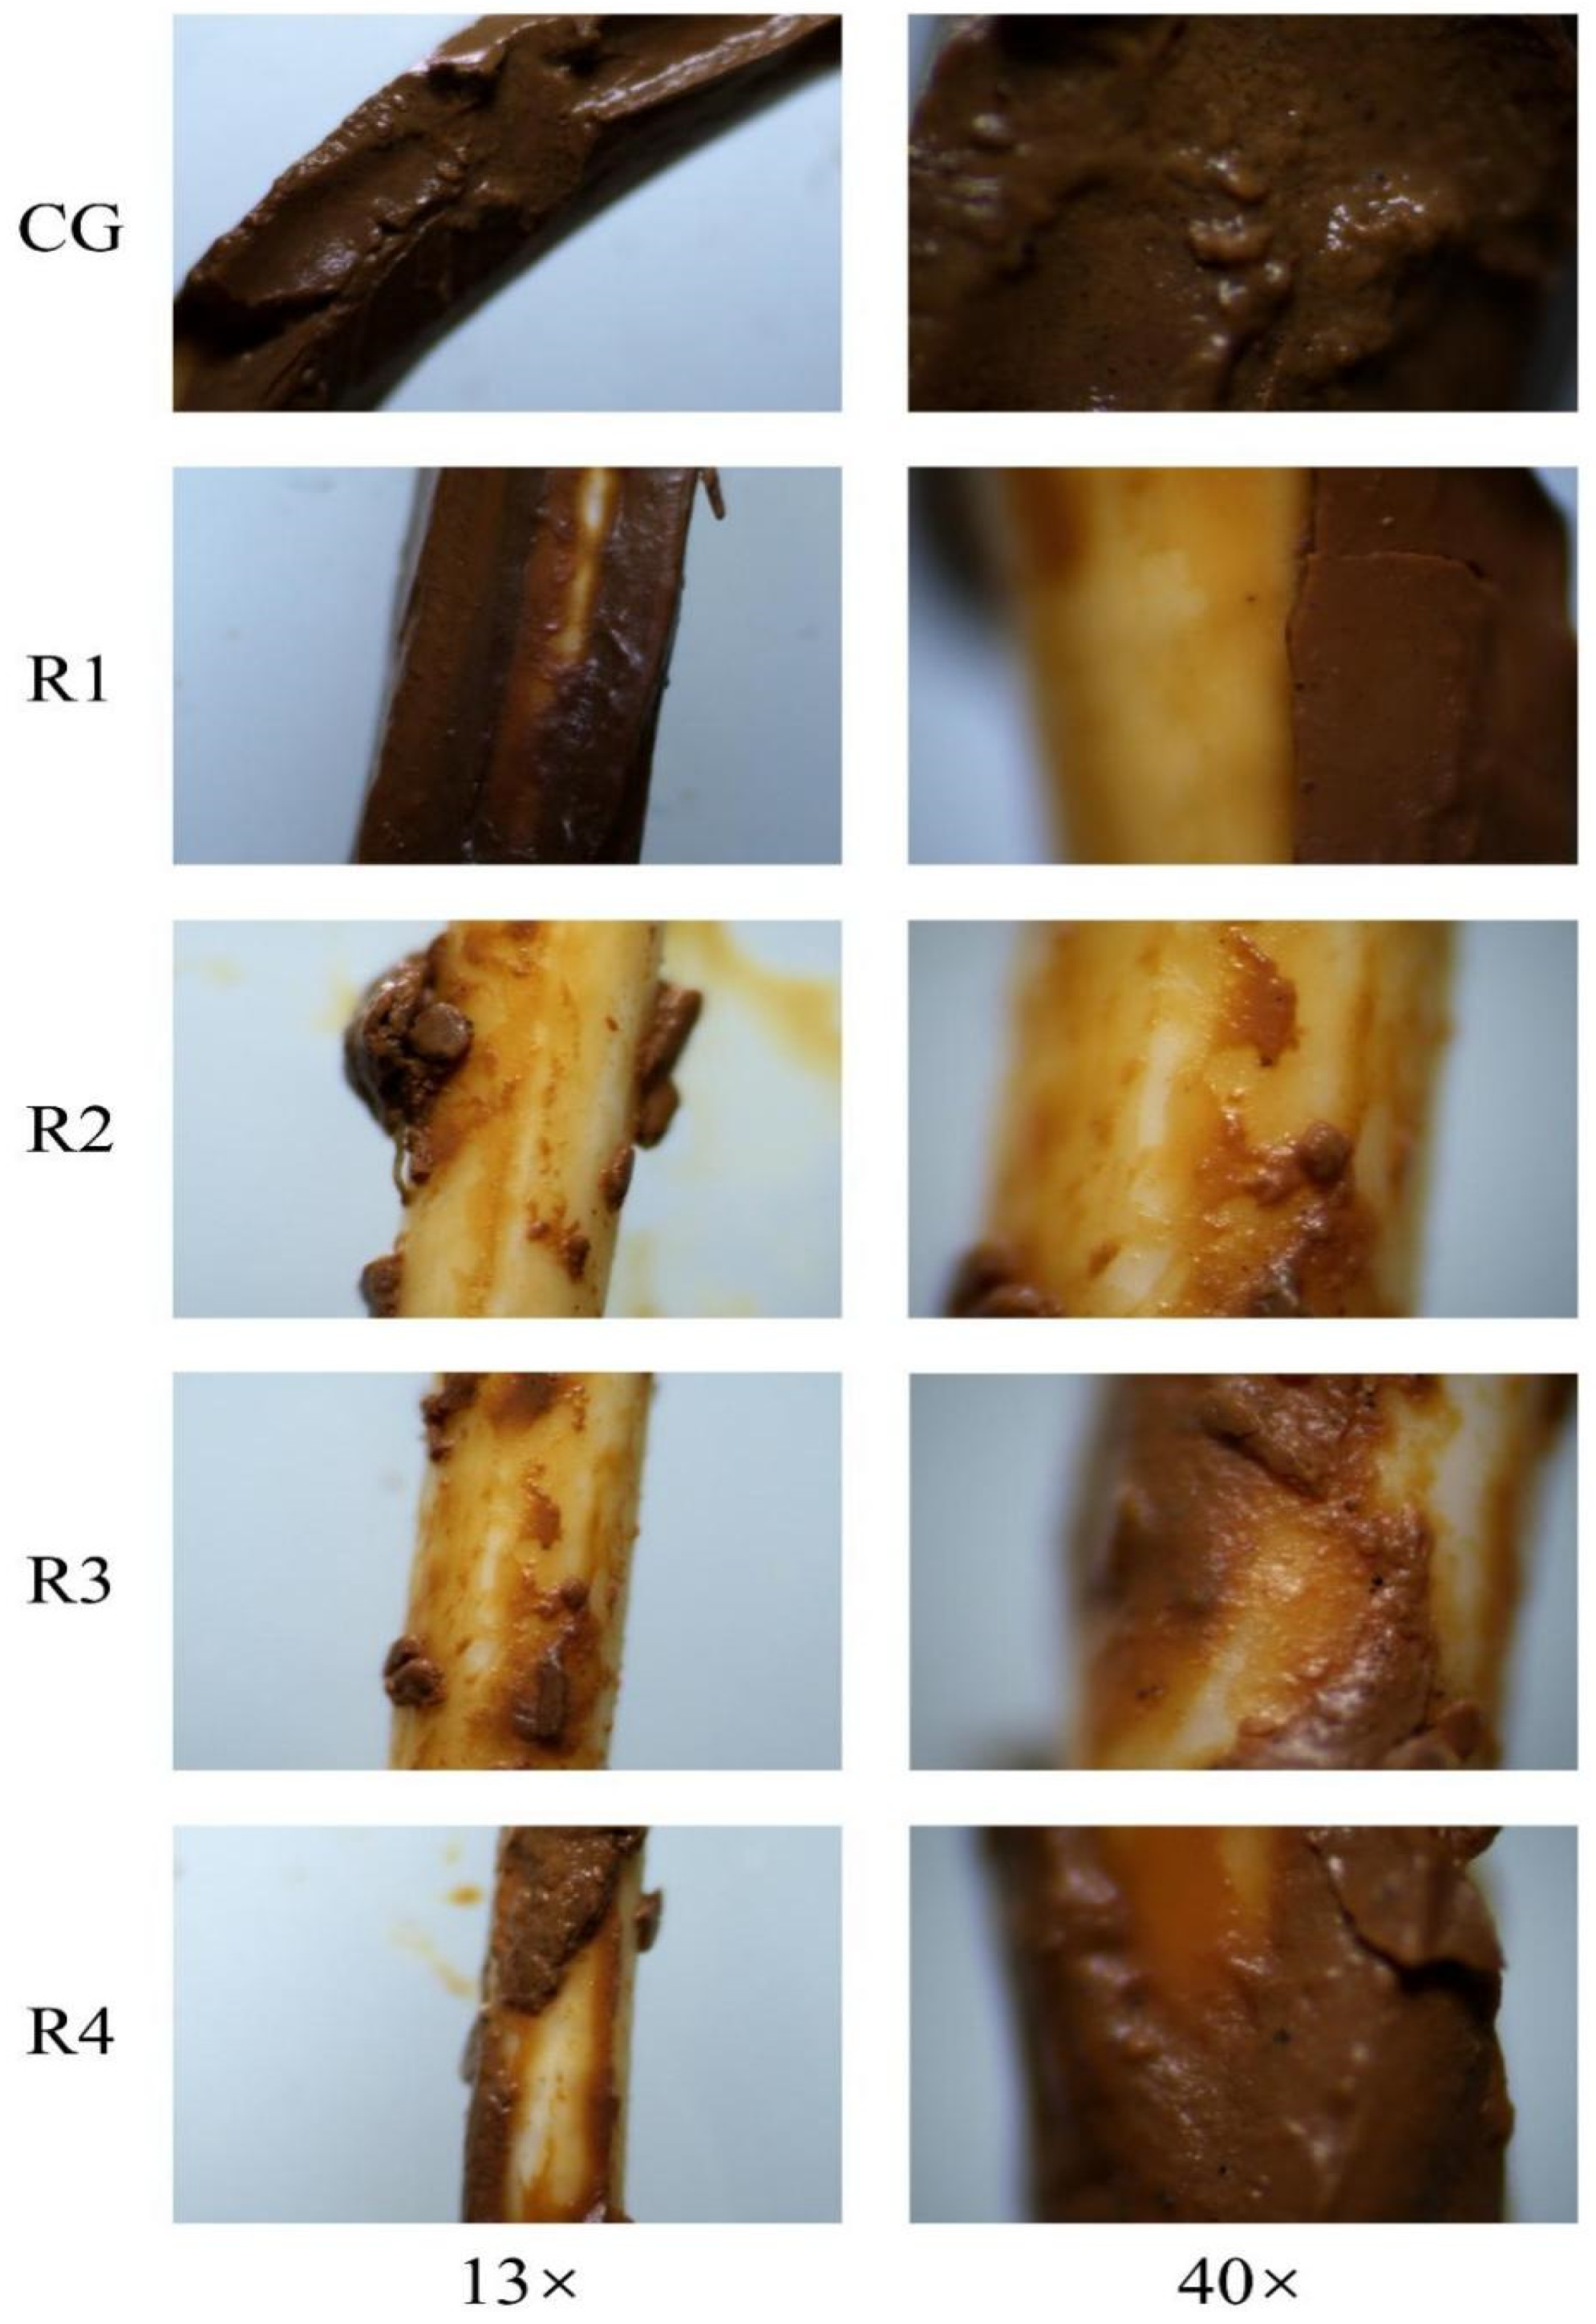
As shown in Figure 5, the cake layer formed on the membrane surface in the absence of aeration was dense and thick, leading to a rapid increase in the TMP. In contrast, with the assistance of in situ aeration, the cake layer became thinner, and even resulted in the exposure of the membrane surface to the influent, contributing to membrane fouling control. Moreover, with moderate aeration (0.8 and 1.2 m3/(m2·min)), the membrane fouling was effectively mitigated with slower TMP variations relative to the UF groups with relatively either weak or strong aeration intensity (0.4 or 1.6 m3/(m2·min)). The exposed membrane surface facilitated the passage of water, contributing to the decrease in transmembrane pressure.

3.3.2. Internal Structures of Cake Layer

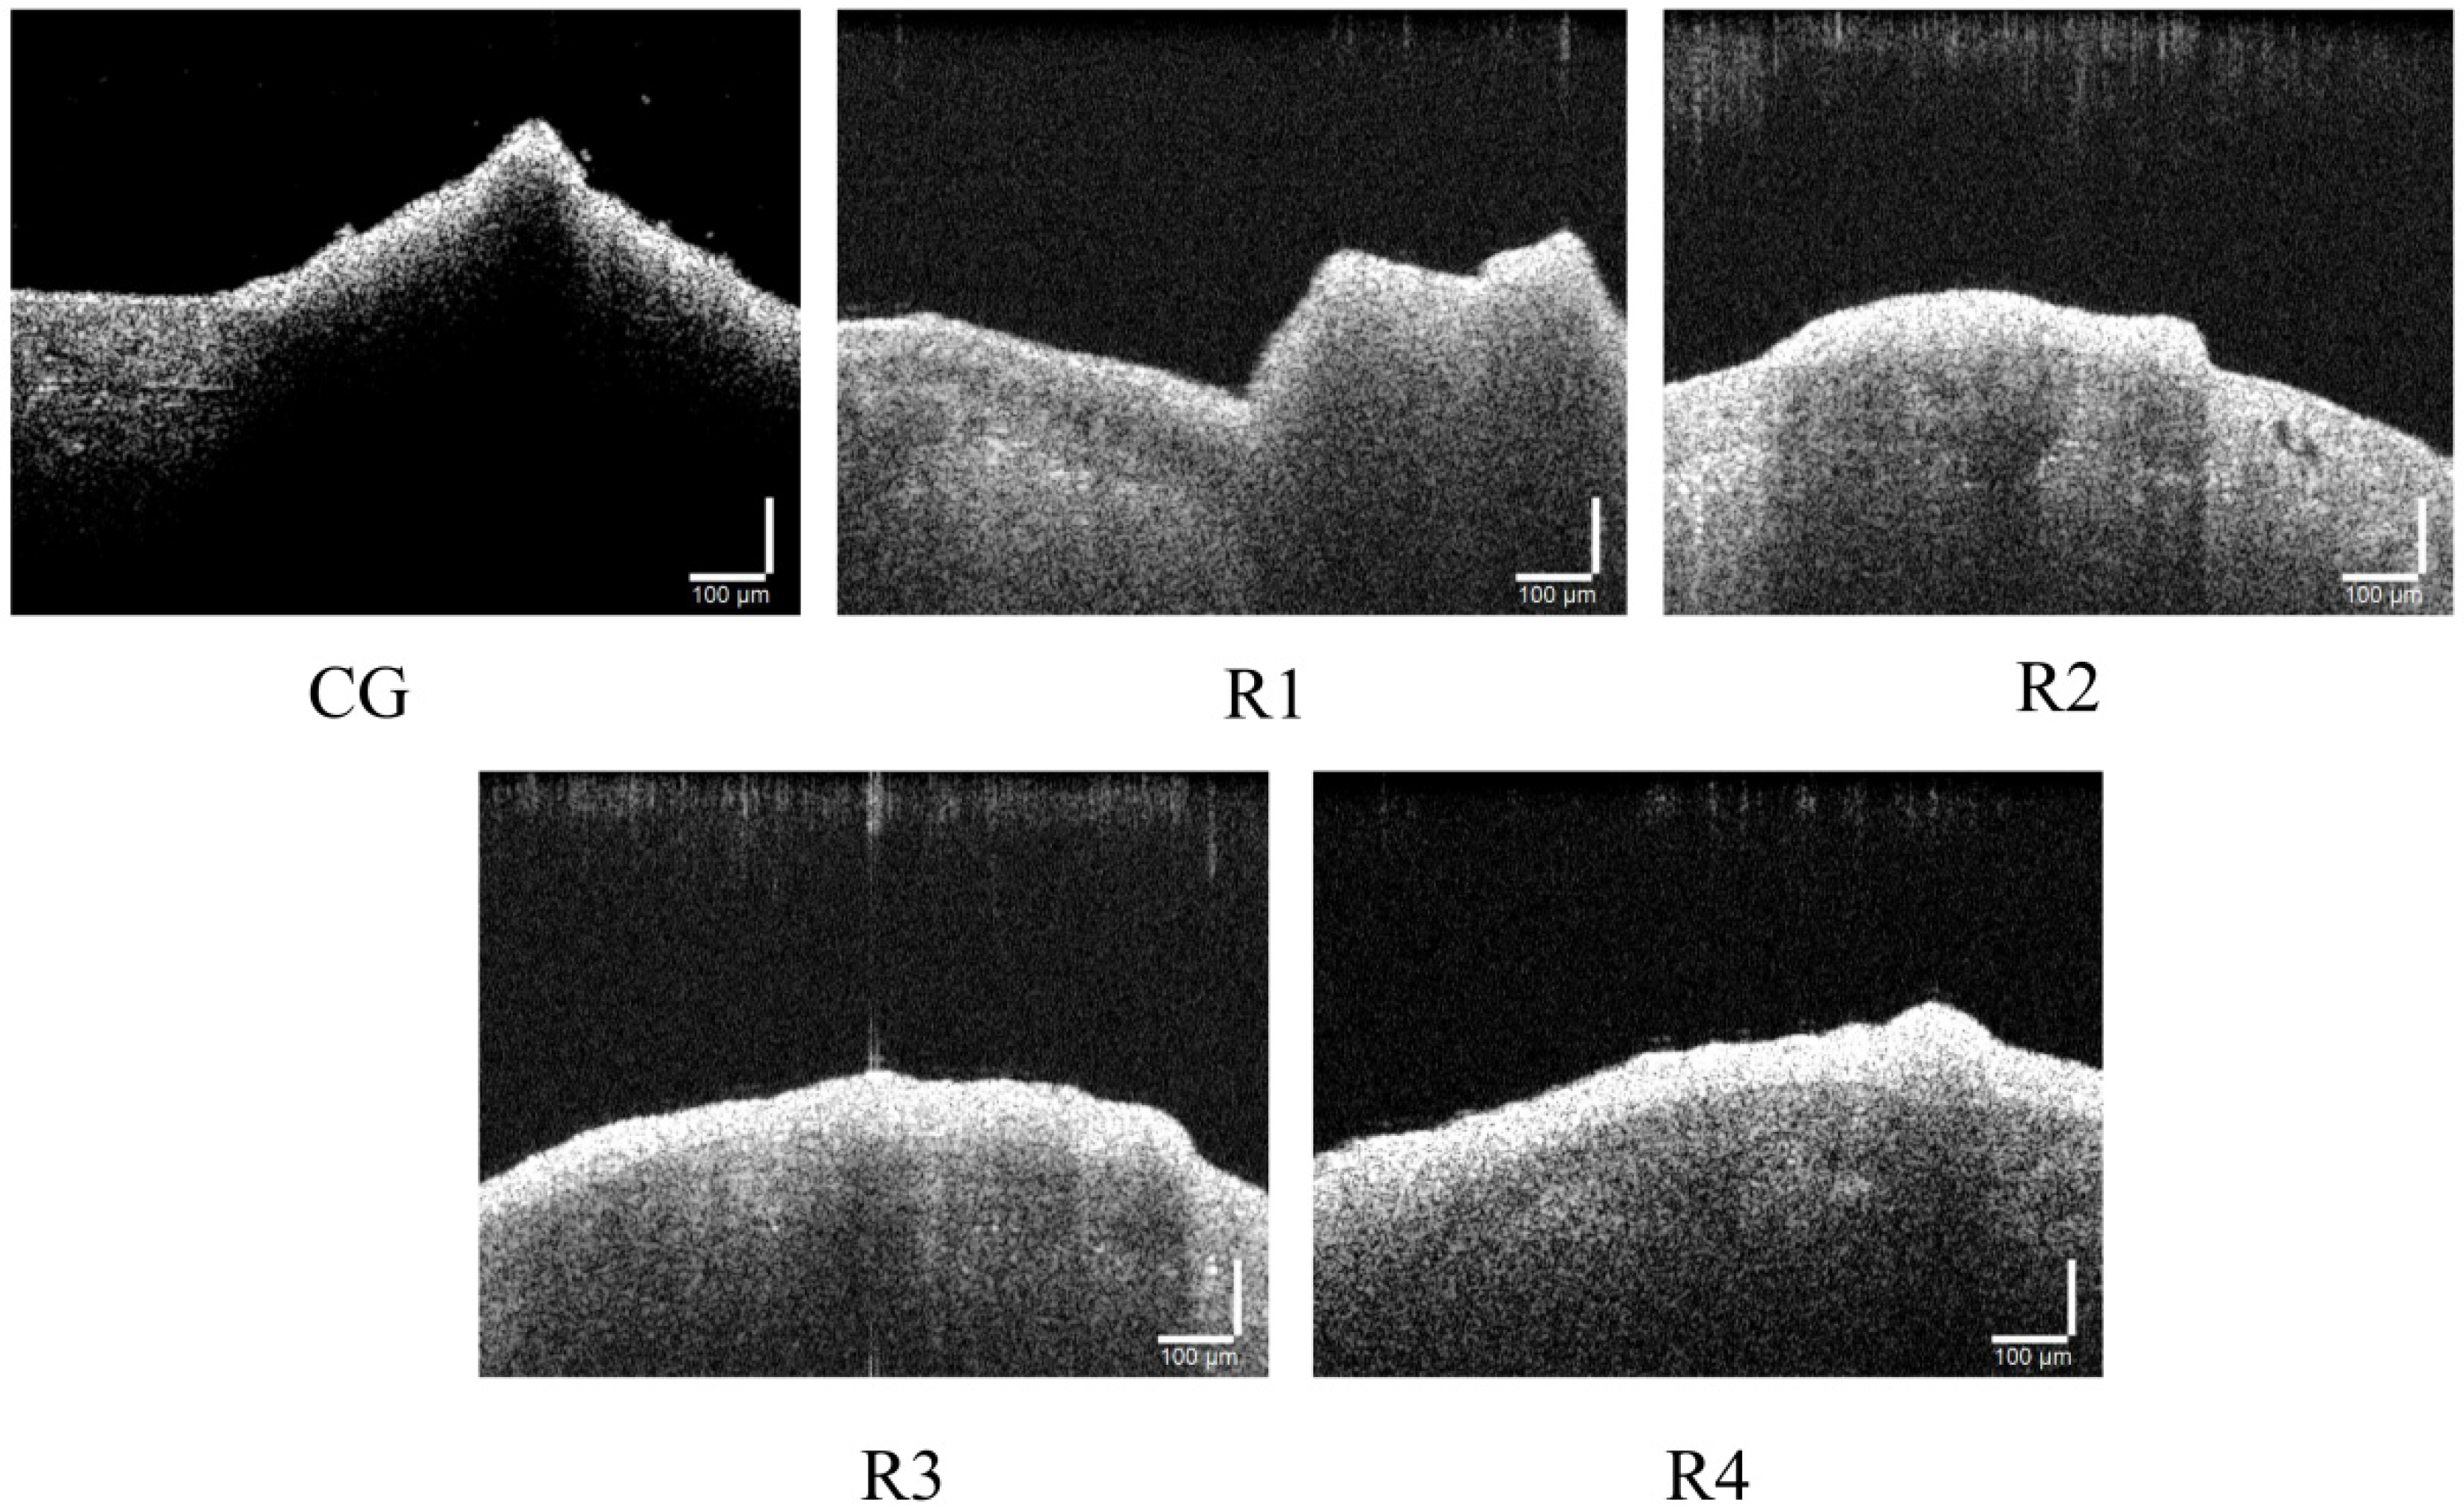
The internal structures of the cake layer attached to the membrane surface of the UF process after filtering high-turbidity water were captured by the OCT instrument, with the results shown in Figure 6. Compared to the control system, the cake layer in the aeration-based UF process was significantly reduced. This demonstrated that aeration could effectively remove the foulants accumulated on the membrane surface to alleviate the membrane fouling. In addition, under aeration conditions, the microstructure within the cake layer revealed a large number of “depressions” and “elevations”, particles, and cavities. These structures contributed to the reduction in filtration resistance of the UF process in filtering the high-turbidity water.

3.3.3. Microstructure of Cake Layer

The microstructures of the cake layer attached to the membrane surface were observed by SEM technology. As illustrated in Figure 7, the cake layer (500× magnification) attached to the membrane surface in the CG group appeared to be relatively dense, without any obvious pores or water channels. In contrast, other aeration-based UF groups had cracks and pores in the cake layer, and network structures and cracks appeared. At a higher magnification (2000×), it could be intuitively observed that the cake layer of the CG group was cake-like, with sand particles and small particles stacking together, resulting in a dense morphology. In comparison, in the aeration-based UF process, the cake layer structure of each group became noticeably rougher, with “bumps” and “pits”, and the structure was looser with more pores. Another study showed that open structures with cavities helped to improve membrane permeability [46]. Therefore, it was speculated that in situ aeration could significantly modify the structure of the cake layer formed on the membrane surface to control the membrane fouling and improve the membrane permeability.

3.4. Compositions of Cake Layer

3.4.1. EPS Concentration Analysis

EPS played a vital role in membrane fouling during long-term UF filtration [47]. The polysaccharides were extracted from the cake layer attached to the membrane surface and quantified as Ex-EPS, SMP, and In-EPS. As depicted in Figure 8, the total polysaccharide was 0.207 g/m2 in the CG, while the corresponding polysaccharide in the cake layer of R1~R4 was recorded as 0.176 g/m2, 0.161 g/m2, 0.135 g/m2, and 0.178 g/m2, respectively, with the decline of 14.98%, 22.22%, 34.78%, and 14.01%. Simultaneously, the In-EPS in R1~R4 were reduced by 24.71%, 41.09%, 49.29%, and 8.85% relative to the CG, which implied that in situ aeration could significantly reduce the concentration of polysaccharide deposited within membrane pores, thereby mitigating membrane fouling and contributing to the reduction in TMP. However, in R4 (1.6 m3/(m2·min)), the concentration of polysaccharides extracted from the cake layer increased compared to other aeration–UF groups. A potential explanation was that the higher shear stress was generated on the membrane surface under higher aeration, breaking the structures of the cake layer to destroy its “dynamic membrane” protection effects. This resulted in more contaminants contacting and depositing within the membrane pores.

3.4.2. Functional Group Characteristics

In Figure 9, compared to the new membrane, it can be seen that the membrane fouled by high-turbidity water changed significantly. The absorption peak at 3600 cm−1 was related to the O-H stretching vibration of phenolic alcohols, indicating that some aromatic hydrocarbon substances adhered to the membrane surface after treating the high-turbidity water. According to Smidt et al. [48], 1030 cm−1 was Si-O expansion vibration, which mainly represented clay minerals, 1140–1080 cm−1 was S-O expansion vibration, which primarily represented the inorganic sulfates, and 875 cm−1 was C-O expansion vibration, which mainly represented carbonates. It can be seen that the pollutants in the high-turbidity surface water in this experiment were dominated by inorganic and particulate pollutants. In the aeration groups, the peak at the wavenumber of 1030 cm−1 representing Si-O was noticeably smoother compared to the control system, indicating that aeration could effectively remove some clay substances. Additionally, at the wavenumber of 800–1150 cm−1, the overall peak intensity of R3 (1.2 m3/(m2·min)) was lower than that of the other groups, consistent with the results of TMP growth, indicating that moderate aeration reduced pollutant adhesion on the membrane surface to benefit to the membrane fouling alleviation.

4. Conclusions

Herein, the effect of in situ aeration on UF membrane fouling control in treating seasonal high-turbidity surface water was investigated. Seasonal high-turbidity water would cause severe membrane fouling for the rural direct UF water treatment process. Introducing in situ aeration could significantly alleviate membrane fouling and reduce the growth rate of TMP. At 200 NTU, by increasing the aeration intensity from 0.4 m3/(m2·min) to 1.2 m3/(m2·min), the membrane fouling mitigation could be obviously enhanced, and the growth of TMP of this group was 88.79% lower than that of the non-aeration UF process. With the turbidity further increasing to 800 NTU under the aeration intensity of 1.2 m3/(m2·min), the TMP increase was still reduced by 44.51% compared to the non-aeration UF process, indicating that in situ aeration effectively controlled membrane fouling under high turbidity raw water conditions. The aeration-induced bubble shear force effectively modulated the formed fouling cake layer, resulting in a thinner, rougher, and more heterogeneous structure, and simultaneously it mitigated the accumulation of organic pollutants on both the membrane surface and within its pores, both of which were beneficial to the membrane fouling alleviation and TMP stability of the UF process. Furthermore, the removals of various contaminants were improved through the in situ aeration UF, accounting for the removal efficiencies of NH4+-N, UV254, and CODMn increasing by 10%, 10%~20%, and 5%~10%, respectively. Although the turbidity increased from 200 NTU to 800 NTU in the feed water, the turbidity in the effluent of all UF systems remained constant at ~0.2 NTU. Overall, the direct UF process exhibited a robust capability in resisting the turbidity shock load in the feed water, and this study provides a feasible and practical strategy for UF technology in rural water supply.

Author Contributions

J.L. designed and performed the experiment, data analysis, and manuscript writing. Y.H., X.G., A.W. C.L., Y.Z., H.W. and Y.W. participated in the investigation experiment, measurement, discussion, and manuscript revision. X.T. provided the administration, funding, supervision, conceptualization, and editing. All authors have read and agreed to the published version of the manuscript.

Funding

This work was supported by the National Natural Science Foundation of China (52370007) and Excellent Youth Foundation of Heilongjiang Province of China (YQ2022E034), the State Key Laboratory of Urban Water Resource and Environment (Harbin Institute of Technology) (No. 2021TS27).

Data Availability Statement

The original contributions presented in the study are included in the article, further inquiries can be directed to the corresponding authors.

Conflicts of Interest

The authors declare that they have no known competing financial interests or personal relationships that could have appeared to influence the work reported in this paper.

References

  1. Li, Y.; Xi, T.; Zhou, L.-A. Drinking Water Facilities and Inclusive Development: Evidence from Rural China. World Dev. 2024, 174, 106428. [Google Scholar] [CrossRef]
  2. Song, W.; Gao, Z.; Hu, M.; Wu, X.; Jia, Y.; Li, X.; Hu, Y.; Liao, L. Development and Technology of Rural Drinking Water Supply in China. Irrig. Drain. 2020, 69, 187–198. [Google Scholar] [CrossRef]
  3. Cheng, X.; Liang, H.; Ding, A.; Qu, F.; Shao, S.; Liu, B.; Wang, H.; Wu, D.; Li, G. Effects of Pre-Ozonation on the Ultrafiltration of Different Natural Organic Matter (NOM) Fractions: Membrane Fouling Mitigation, Prediction and Mechanism. J. Membr. Sci. 2016, 505, 15–25. [Google Scholar] [CrossRef]
  4. Zhang, X.; Li, F.; Zhao, X. Treatment of Surfactants with Concentrations below Critical Micelle Concentration by Ultrafiltration: A Mini-Review. Water Cycle 2022, 3, 50–55. [Google Scholar] [CrossRef]
  5. Qadafi, M.; Wulan, D.R.; Notodarmojo, S.; Zevi, Y. Characteristics and Treatment Methods for Peat Water as Clean Water Sources: A Mini Review. Water Cycle 2023, 4, 60–69. [Google Scholar] [CrossRef]
  6. Bei, E.; Wu, X.; Qiu, Y.; Chen, C.; Zhang, X. A Tale of Two Water Supplies in China: Finding Practical Solutions to Urban and Rural Water Supply Problems. Acc. Chem. Res. 2019, 52, 867–875. [Google Scholar] [CrossRef] [PubMed]
  7. Chew, C.M.; Aroua, M.K.; Hussain, M.A. Advanced Process Control for Ultrafiltration Membrane Water Treatment System. J. Clean. Prod. 2018, 179, 63–80. [Google Scholar] [CrossRef]
  8. Huang, B.; Gu, H.; Xiao, K.; Qu, F.; Yu, H.; Wei, C. Fouling Mechanisms Analysis via Combined Fouling Models for Surface Water Ultrafiltration Process. Membranes 2020, 10, 149. [Google Scholar] [CrossRef] [PubMed]
  9. Mao, R.; Wang, Y.; Zhao, Y.; Gao, B.; Dong, M. Impact of Various Coagulation Technologies on Membrane Fouling in Coagulation/Ultrafiltration Process. Chem. Eng. J. 2013, 225, 387–393. [Google Scholar] [CrossRef]
  10. Huang, X.; Chen, K.; Zhang, Z.; Pang, H.; Huang, X.; Yang, J.; Wang, X.; Lu, J. Continuation of a Cleaning Process: Application of MNBs-Coagulation Process to Mitigate Ultrafiltration Membrane Fouling. Water Res. 2024, 250, 121032. [Google Scholar] [CrossRef]
  11. Ma, B.; Ding, Y.; Wang, B.; Qi, Z.; Bai, Y.; Liu, R.; Liu, H.; Qu, J. Influence of Sedimentation with Pre-Coagulation on Ultrafiltration Membrane Fouling Performance. Sci. Total Environ. 2020, 708, 134671. [Google Scholar] [CrossRef] [PubMed]
  12. Xing, J.; Liang, H.; Cheng, X.; Yang, H.; Xu, D.; Gan, Z.; Luo, X.; Zhu, X.; Li, G. Combined Effects of Coagulation and Adsorption on Ultrafiltration Membrane Fouling Control and Subsequent Disinfection in Drinking Water Treatment. Environ. Sci. Pollut. Res. 2019, 26, 33770–33780. [Google Scholar] [CrossRef] [PubMed]
  13. Cordier, C.; Stavrakakis, C.; Sauvade, P.; Coelho, F.; Moulin, P. Air Backwash Efficiency on Organic Fouling of UF Membranes Applied to Shellfish Hatchery Effluents. Membranes 2018, 8, 48. [Google Scholar] [CrossRef] [PubMed]
  14. Vroman, T.; Beaume, F.; Armanges, V.; Gout, E.; Remigy, J.-C. Critical Backwash Flux for High Backwash Efficiency: Case of Ultrafiltration of Bentonite Suspensions. J. Membr. Sci. 2021, 620, 118836. [Google Scholar] [CrossRef]
  15. De Almeida, H.G.; Da Silva Cavalcante, J.; De Aquino, M.D.; Mota, F.S.B.; Mierzwa, J.C. The Relevance of Critical Flux and Backwash Intervals Parameters for the Design of Ultrafiltration Process in the Treatment of Eutrophic Reservoirs: A Pilot Study for the Development of a Full-Scale Project. J. Water Process Eng. 2024, 61, 105348. [Google Scholar] [CrossRef]
  16. Chang, H.; Zhu, Y.; Yu, H.; Qu, F.; Zhou, Z.; Li, X.; Yang, Y.; Tang, X.; Liang, H. Long-Term Operation of Ultrafiltration Membrane in Full-Scale Drinking Water Treatment Plants in China: Characteristics of Membrane Performance. Desalination 2022, 543, 116122. [Google Scholar] [CrossRef]
  17. Ding, J.; Xiao, H.; Huang, X.; Zou, Y.; Ye, Z.; Wang, S.; Xie, P.; Chen, Y.; Ma, J. Application of Heat-Activated Peroxydisulfate Process for the Chemical Cleaning of Fouled Ultrafiltration Membranes. Chin. Chem. Lett. 2023, 34, 108316. [Google Scholar] [CrossRef]
  18. He, M.; Chen, C.; Guo, C.; Wang, S.; Chang, H.; Liu, B. Optimization of Aeration Conditions in the Hybrid Process of Coagulation-Ultrafiltration with Air Sparging. J. Water Supply Res. Technol. Aqua 2017, 66, 632–640. [Google Scholar] [CrossRef]
  19. Liu, X.; Wang, Y.; Waite, T.D.; Leslie, G. Numerical Simulations of Impact of Membrane Module Design Variables on Aeration Patterns in Membrane Bioreactors. J. Membr. Sci. 2016, 520, 201–213. [Google Scholar] [CrossRef]
  20. Abdullah, S.Z.; Wray, H.E.; Bérubé, P.R.; Andrews, R.C. Distribution of Surface Shear Stress for a Densely Packed Submerged Hollow Fiber Membrane System. Desalination 2015, 357, 117–120. [Google Scholar] [CrossRef]
  21. Fu, H.-Y.; Xu, P.-C.; Huang, G.-H.; Chai, T.; Hou, M.; Gao, P.-F. Effects of Aeration Parameters on Effluent Quality and Membrane Fouling in a Submerged Membrane Bioreactor Using Box–Behnken Response Surface Methodology. Desalination 2012, 302, 33–42. [Google Scholar] [CrossRef]
  22. Zhang, C.H.; Dong, Y.Y.; Sun, H.J. Effect of Aeration Intensity on Membrane Fouling of Non-Woven Fibers-MBR. Adv. Mater. Res. 2013, 726–731, 1695–1698. [Google Scholar] [CrossRef]
  23. Li, X.; Younas, M.; Rezakazemi, M.; Ly, Q.V.; Li, J. A Review on Hollow Fiber Membrane Module towards High Separation Efficiency: Process Modeling in Fouling Perspective. Chin. Chem. Lett. 2022, 33, 3594–3602. [Google Scholar] [CrossRef]
  24. Man, H.C.; Abdulsalam, M.; Ahmad Abdullahi, F.; Marlina Abd-Karim, M.; Faezah Yunos, K.; Aida Isma, M.I. Exploring the Effect of Aeration Intensity on a Modified PVDF-PEG Membrane Incorporated with Nano-MgO: Antifouling and AnT-POME Treatment. Sep. Sci. Technol. 2023, 58, 2189–2207. [Google Scholar] [CrossRef]
  25. Tian, J.; Xu, Y.; Chen, Z.; Nan, J.; Li, G. Air Bubbling for Alleviating Membrane Fouling of Immersed Hollow-Fiber Membrane for Ultrafiltration of River Water. Desalination 2010, 260, 225–230. [Google Scholar] [CrossRef]
  26. Liu, J.; Liu, B.; Liu, T.; Bai, Y.; Yu, S. Coagulation–Bubbling–Ultrafiltration: Effect of Floc Properties on the Performance of the Hybrid Process. Desalination 2014, 333, 126–133. [Google Scholar] [CrossRef]
  27. Zhang, K.; Chang, S.; Wang, E.; Zhang, Q.; Fan, Y.; Bai, Y.; Zhang, M.; Fu, Q.; Jia, W. Occurrence, Health Risk, and Removal Efficiency Assessment of Volatile Organic Compounds in Drinking Water Treatment Plants (DWTPs): An Investigation of Seven Major River Basins across China. J. Clean. Prod. 2022, 372, 133762. [Google Scholar] [CrossRef]
  28. Ruigómez, I.; González, E.; Guerra, S.; Rodríguez-Gómez, L.E.; Vera, L. Evaluation of a Novel Physical Cleaning Strategy Based on HF Membrane Rotation during the Backwashing/Relaxation Phases for Anaerobic Submerged MBR. J. Membr. Sci. 2017, 526, 181–190. [Google Scholar] [CrossRef]
  29. Ruigómez, I.; González, E.; Rodríguez-Gómez, L.; Vera, L. Fouling Control Strategies for Direct Membrane Ultrafiltration: Physical Cleanings Assisted by Membrane Rotational Movement. Chem. Eng. J. 2022, 436, 135161. [Google Scholar] [CrossRef]
  30. Moreira, V.R.; Lebron, Y.A.R.; De Paula, E.C.; Santos, L.V.D.S.; Amaral, M.C.S. Recycled Reverse Osmosis Membrane Combined with Pre-Oxidation for Improved Arsenic Removal from High Turbidity Waters and Retrofit of Conventional Drinking Water Treatment Process. J. Clean. Prod. 2021, 312, 127859. [Google Scholar] [CrossRef]
  31. Lal, R. Soil Organic Matter Content and Crop Yield. J. Soil Water Conserv. 2020, 75, 27A–32A. [Google Scholar] [CrossRef]
  32. Qin, Q.; Wang, J.; Cheng, Z.; Cui, Z.; Li, J. Investigation of Shear-Force Distribution in the Hollow Fiber Membrane Module Based on FBG Sensing Technology. Sep. Purif. Technol. 2020, 250, 116458. [Google Scholar] [CrossRef]
  33. Gao, W.; Liang, H.; Ma, J.; Han, M.; Chen, Z.; Han, Z.; Li, G. Membrane Fouling Control in Ultrafiltration Technology for Drinking Water Production: A Review. Desalination 2011, 272, 1–8. [Google Scholar] [CrossRef]
  34. Ersahin, M.E.; Ozgun, H.; Dereli, R.K.; Ozturk, I.; Roest, K.; van Lier, J.B. A Review on Dynamic Membrane Filtration: Materials, Applications and Future Perspectives. Bioresour. Technol. 2012, 122, 196–206. [Google Scholar] [CrossRef]
  35. Yao, W.; Wang, B.; Zhang, K. Comparative Study of Membrane Fouling with Aeration Shear Stress in Filtration of Different Substances. Membranes 2023, 13, 867. [Google Scholar] [CrossRef] [PubMed]
  36. Meng, F.; Yang, F.; Shi, B.; Zhang, H. A Comprehensive Study on Membrane Fouling in Submerged Membrane Bioreactors Operated under Different Aeration Intensities. Sep. Purif. Technol. 2008, 59, 91–100. [Google Scholar] [CrossRef]
  37. Drews, A.; Prieske, H.; Meyer, E.-L.; Senger, G.; Kraume, M. Advantageous and Detrimental Effects of Air Sparging in Membrane Filtration: Bubble Movement, Exerted Shear and Particle Classification. Desalination 2010, 250, 1083–1086. [Google Scholar] [CrossRef]
  38. Ma, B.; Wang, X.; Liu, R.; Jefferson, W.A.; Lan, H.; Liu, H.; Qu, J. Synergistic Process Using Fe Hydrolytic Flocs and Ultrafiltration Membrane for Enhanced Antimony(V) Removal. J. Membr. Sci. 2017, 537, 93–100. [Google Scholar] [CrossRef]
  39. Ma, B.; Liu, Y.; Lin, H.; Fan, H.; Lu, C.; Zhao, K.; Qi, J. A Pilot-Scale Study of the Integrated Floc-Ultrafiltration Membrane-Based Drinking Water Treatment Process. Sci. Total Environ. 2022, 830, 154809. [Google Scholar] [CrossRef]
  40. Du, X.; Qu, F.-S.; Liang, H.; Li, K.; Bai, L.-M.; Li, G.-B. Control of Submerged Hollow Fiber Membrane Fouling Caused by Fine Particles in Photocatalytic Membrane Reactors Using Bubbly Flow: Shear Stress and Particle Forces Analysis. Sep. Purif. Technol. 2017, 172, 130–139. [Google Scholar] [CrossRef]
  41. Wicaksana, F.; Fane, A.G.; Chen, V. Fibre Movement Induced by Bubbling Using Submerged Hollow Fibre Membranes. J. Membr. Sci. 2006, 271, 186–195. [Google Scholar] [CrossRef]
  42. Zhang, T.; Lu, J.; Ma, J.; Qiang, Z. Comparative Study of Ozonation and Synthetic Goethite-Catalyzed Ozonation of Individual NOM Fractions Isolated and Fractionated from a Filtered River Water. Water Res. 2008, 42, 1563–1570. [Google Scholar] [CrossRef] [PubMed]
  43. Zhang, M.; Guo, W.; Chen, Y.; He, D.; Isaev, A.B.; Zhu, M. Dissolved Oxygen in Aeration-Driven Piezo-Catalytic for Antibiotics Pollutants Removal in Water. Chin. Chem. Lett. 2023, 34, 108229. [Google Scholar] [CrossRef]
  44. Jarvis, P.; Jefferson, B.; Gregory, J.; Parsons, S.A. A Review of Floc Strength and Breakage. Water Res. 2005, 39, 3121–3137. [Google Scholar] [CrossRef] [PubMed]
  45. Chen, W.; Westerhoff, P.; Leenheer, J.A.; Booksh, K. Fluorescence Excitation−Emission Matrix Regional Integration to Quantify Spectra for Dissolved Organic Matter. Environ. Sci. Technol. 2003, 37, 5701–5710. [Google Scholar] [CrossRef] [PubMed]
  46. Guo, X.; Wang, Y.; Jiang, S.; Wang, Y.; Wang, J.; Liang, H.; Tang, X. Influence of Operation Modes on Gravity-Driven Membrane Process in Treating the Secondary Effluent: Flux Improvement and Biocake Layer Property. Chemosphere 2023, 310, 136692. [Google Scholar] [CrossRef]
  47. Meng, S.; Wang, R.; Meng, X.; Wang, Y.; Fan, W.; Liang, D.; Zhang, M.; Liao, Y.; Tang, C. Reaction Heterogeneity in the Bridging Effect of Divalent Cations on Polysaccharide Fouling. J. Membr. Sci. 2022, 641, 119933. [Google Scholar] [CrossRef]
  48. Smidt, E.; Meissl, K. The Applicability of Fourier Transform Infrared (FT-IR) Spectroscopy in Waste Management. Waste Manag. 2007, 27, 268–276. [Google Scholar] [CrossRef]
Figure 1. Schematic diagram of the UF filtration system.
Water 16 02195 g001
Figure 2. Effect of continuous aeration on the TMP of UF system: (a) TMP variation with the filtration time, (b) initial and final TMP during 0~72 h at 200 NTU.
Water 16 02195 g002
Figure 3. Concentration development of (a) turbidity, (c) ammonia, (e) UV254, and (g) CODMn in the feed water and membrane permeate. Removal efficiencies of (b) turbidity, (d) ammonia, (f) UV254, and (h) CODMn, respectively.
Water 16 02195 g003
Figure 4. Fluorescent excitation-emission matrix (EEM) analysis of the feed water and membrane permeate under different influent turbidity: (a) 200 NTU, influent, (b) 200 NTU, effluent, (c) 500 NTU, influent, (d) 500 NTU, effluent, (e) 800 NTU, influent, (f) 800 NTU, effluent, respectively.
Water 16 02195 g004
Figure 5. Stereomicroscope images of the cake layer under different aeration intensities.
Water 16 02195 g005
Figure 6. OCT plots of soil layer profiles at different aeration levels.
Water 16 02195 g006
Figure 7. SEM images of the cake layer under different aeration intensities.
Water 16 02195 g007
Figure 8. Effect of different aeration intensities on the polysaccharide concentration.
Water 16 02195 g008
Figure 9. FTIR of ultrafiltration membranes with different aeration levels.
Water 16 02195 g009
Table 1. The operation parameters of the system for stages 1, 2, and 3.
ParametersControl GroupReactor1Reactor2Reactor3Reactor4Time
Aeration intensity00.4
m3/(m2·min)
0.8 m3/(m2·min)1.2 m3/(m2·min)1.6
m3/(m2·min)
-
Stage I200 NTU200N TU200 NTU200 NTU200 NTU115 h
Stage II500 NTU500 NTU500 NTU500 NTU500 NTU53 h
Stage III800 NTU800 NTU800 NTU800 NTU800 NTU114 h
Table 2. Summary of aeration used in alleviating UF membrane fouling.
ProcessRaw WaterTurbidity (NTU)UV254
(cm−1)
COD
(mg/L)
Aeration Intensityd(TMP)/dtControl EffectRef.
Flocculation–UF (backwashing, aeration)Surface water (containing Sb)0.3–1.00.01–0.013-0.155 m3/(m2·min) 0.043 kPa/h**[38]
Oxidation-integrated floc-UF (backwashing, aeration)River water9.05–35.1-5–335 m3/h0.023 kPa/h**[39]
Coagulation–UF (aeration)Lake water1.08–2.270.030–0.052-40 mL/min0.30–0.80 kPa/h**[26]
UF (aeration)TiO2—HA suspension---3.2 L/min0.414 kPa/h***[40]
UF (aeration)River water11.3 ± 1.060.105 ± 0.006-0.083 m3/(m2·min)3 kPa/h**[25]
UF (aeration)Yeast suspension---0.083 m3/(m2·min)1.4 kPa/h***[41]
UF (aeration)Soil model water200–8000.020–0.0282.455–3.0571.2 m3/(m2·min)0.063–0.284 kPa/h***This study
Note: ** and *** indicates the positive effects of aeration on the membrane fouling control, the more, the better.
Disclaimer/Publisher’s Note: The statements, opinions and data contained in all publications are solely those of the individual author(s) and contributor(s) and not of MDPI and/or the editor(s). MDPI and/or the editor(s) disclaim responsibility for any injury to people or property resulting from any ideas, methods, instructions or products referred to in the content.