

Performance Study on Brackish Water Desalination Efficiency Based on a Novel Coupled Electrodialysis–Reverse Osmosis (EDRO) System


Abstract
1. Introduction
2. Materials and Methods
2.1. Materials
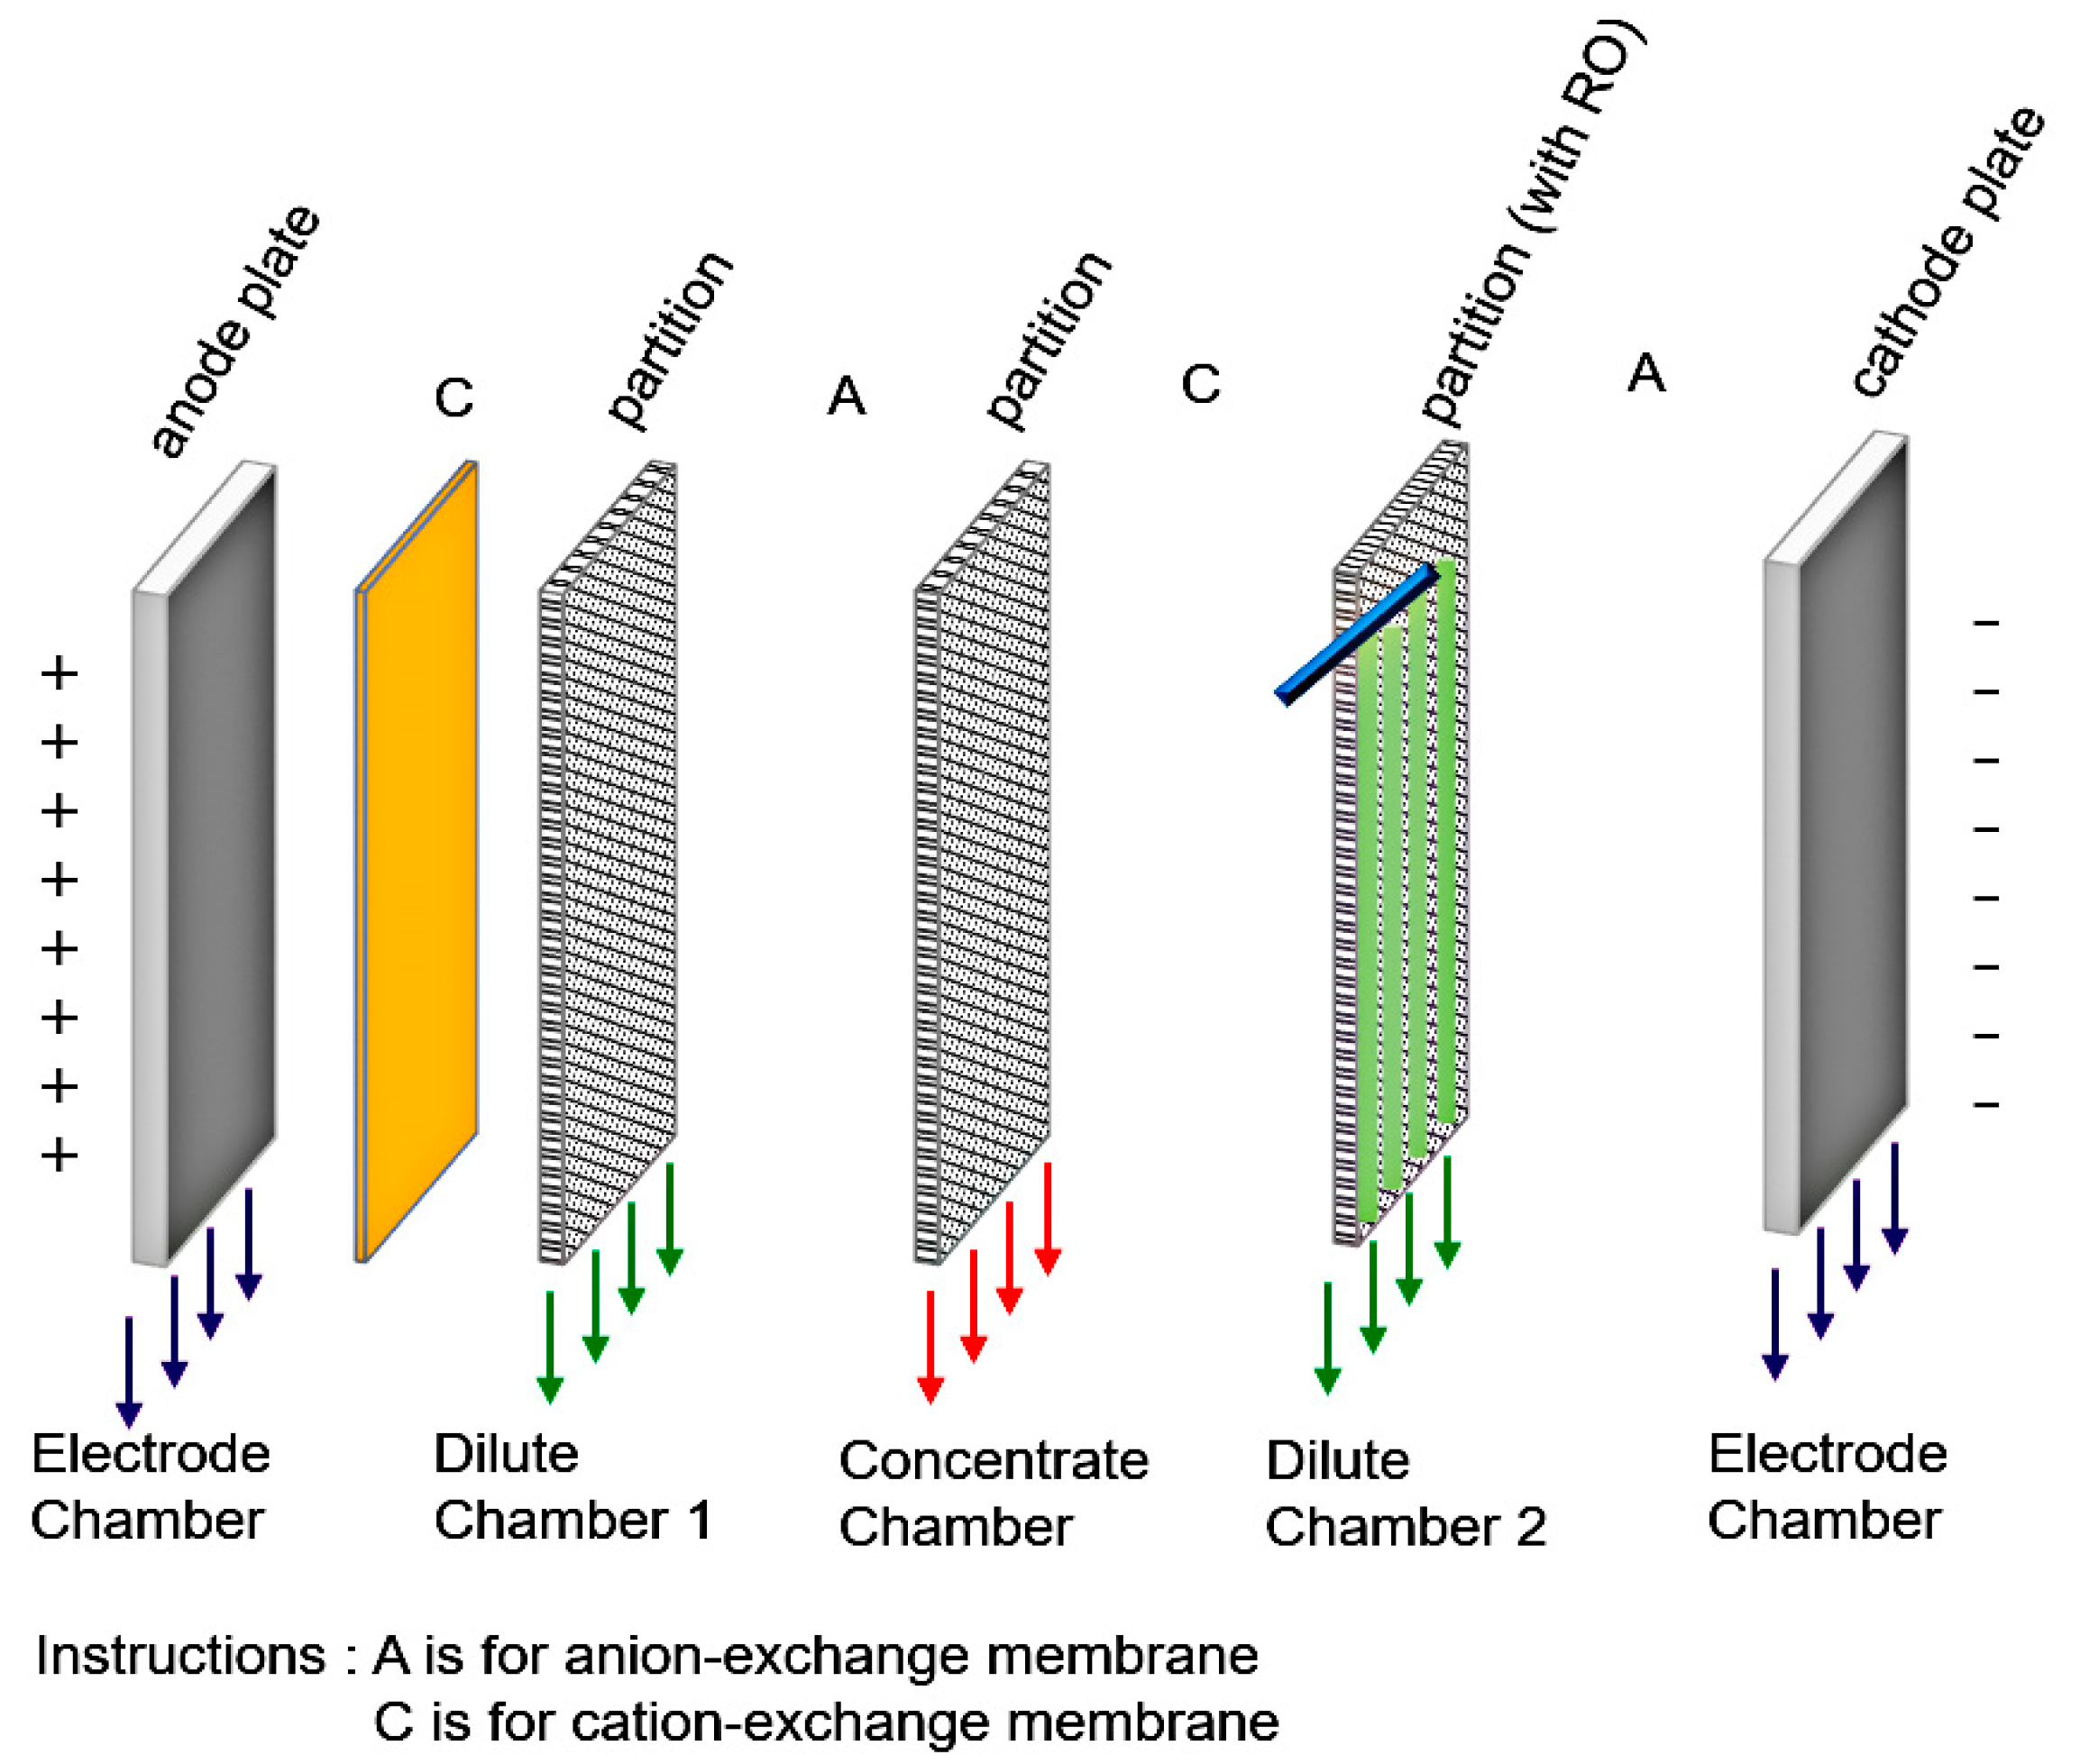
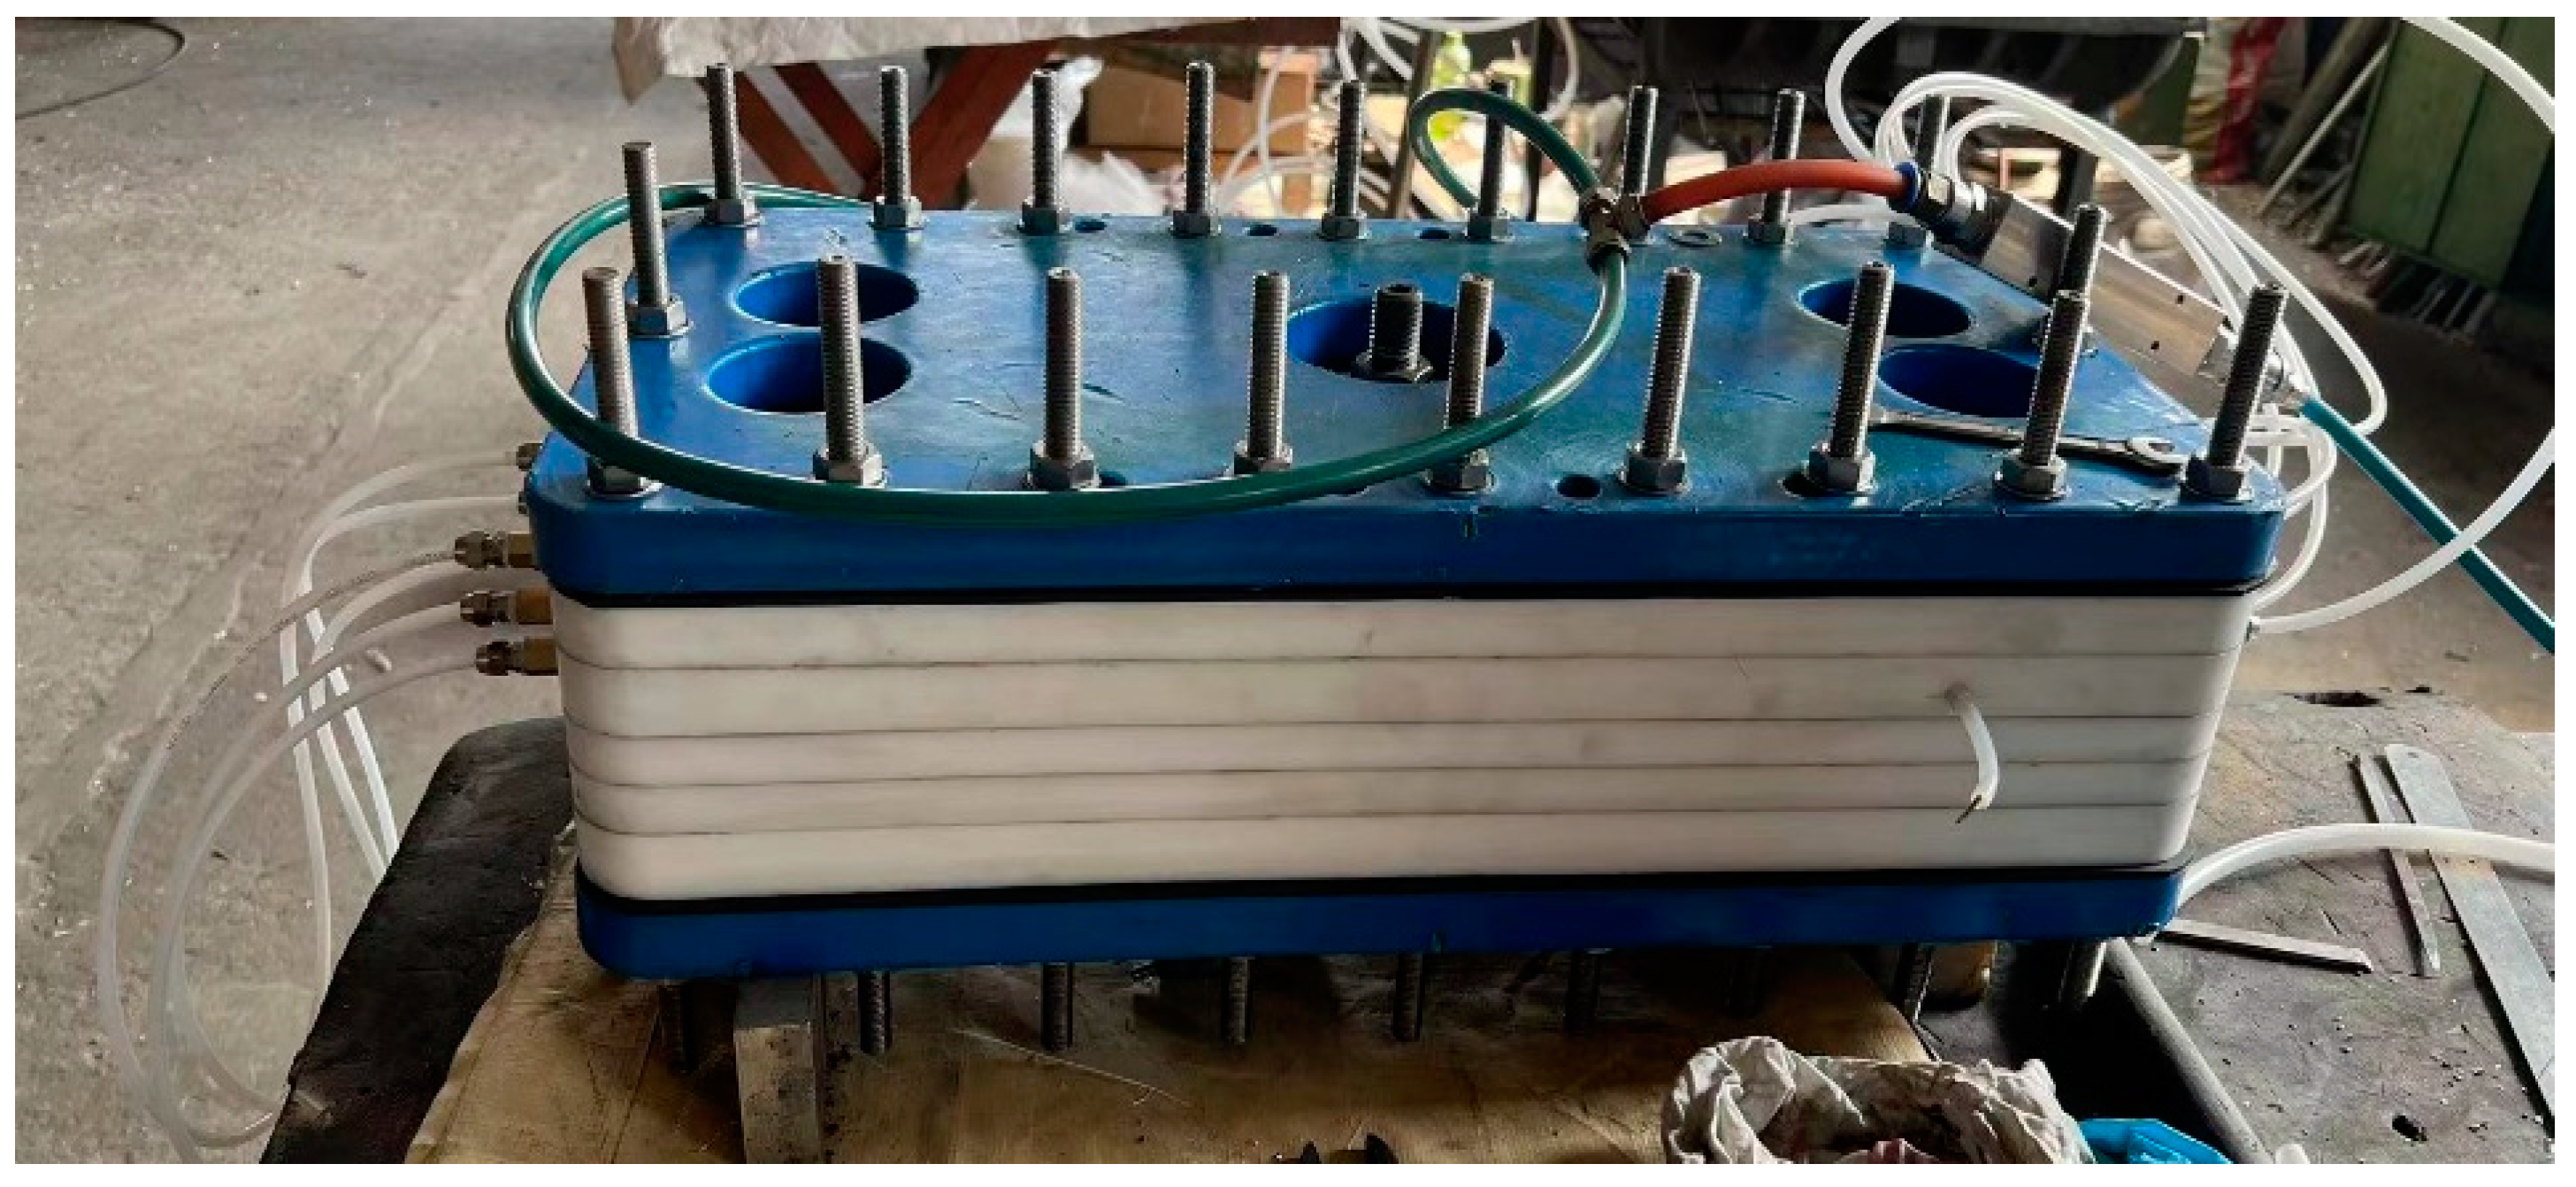
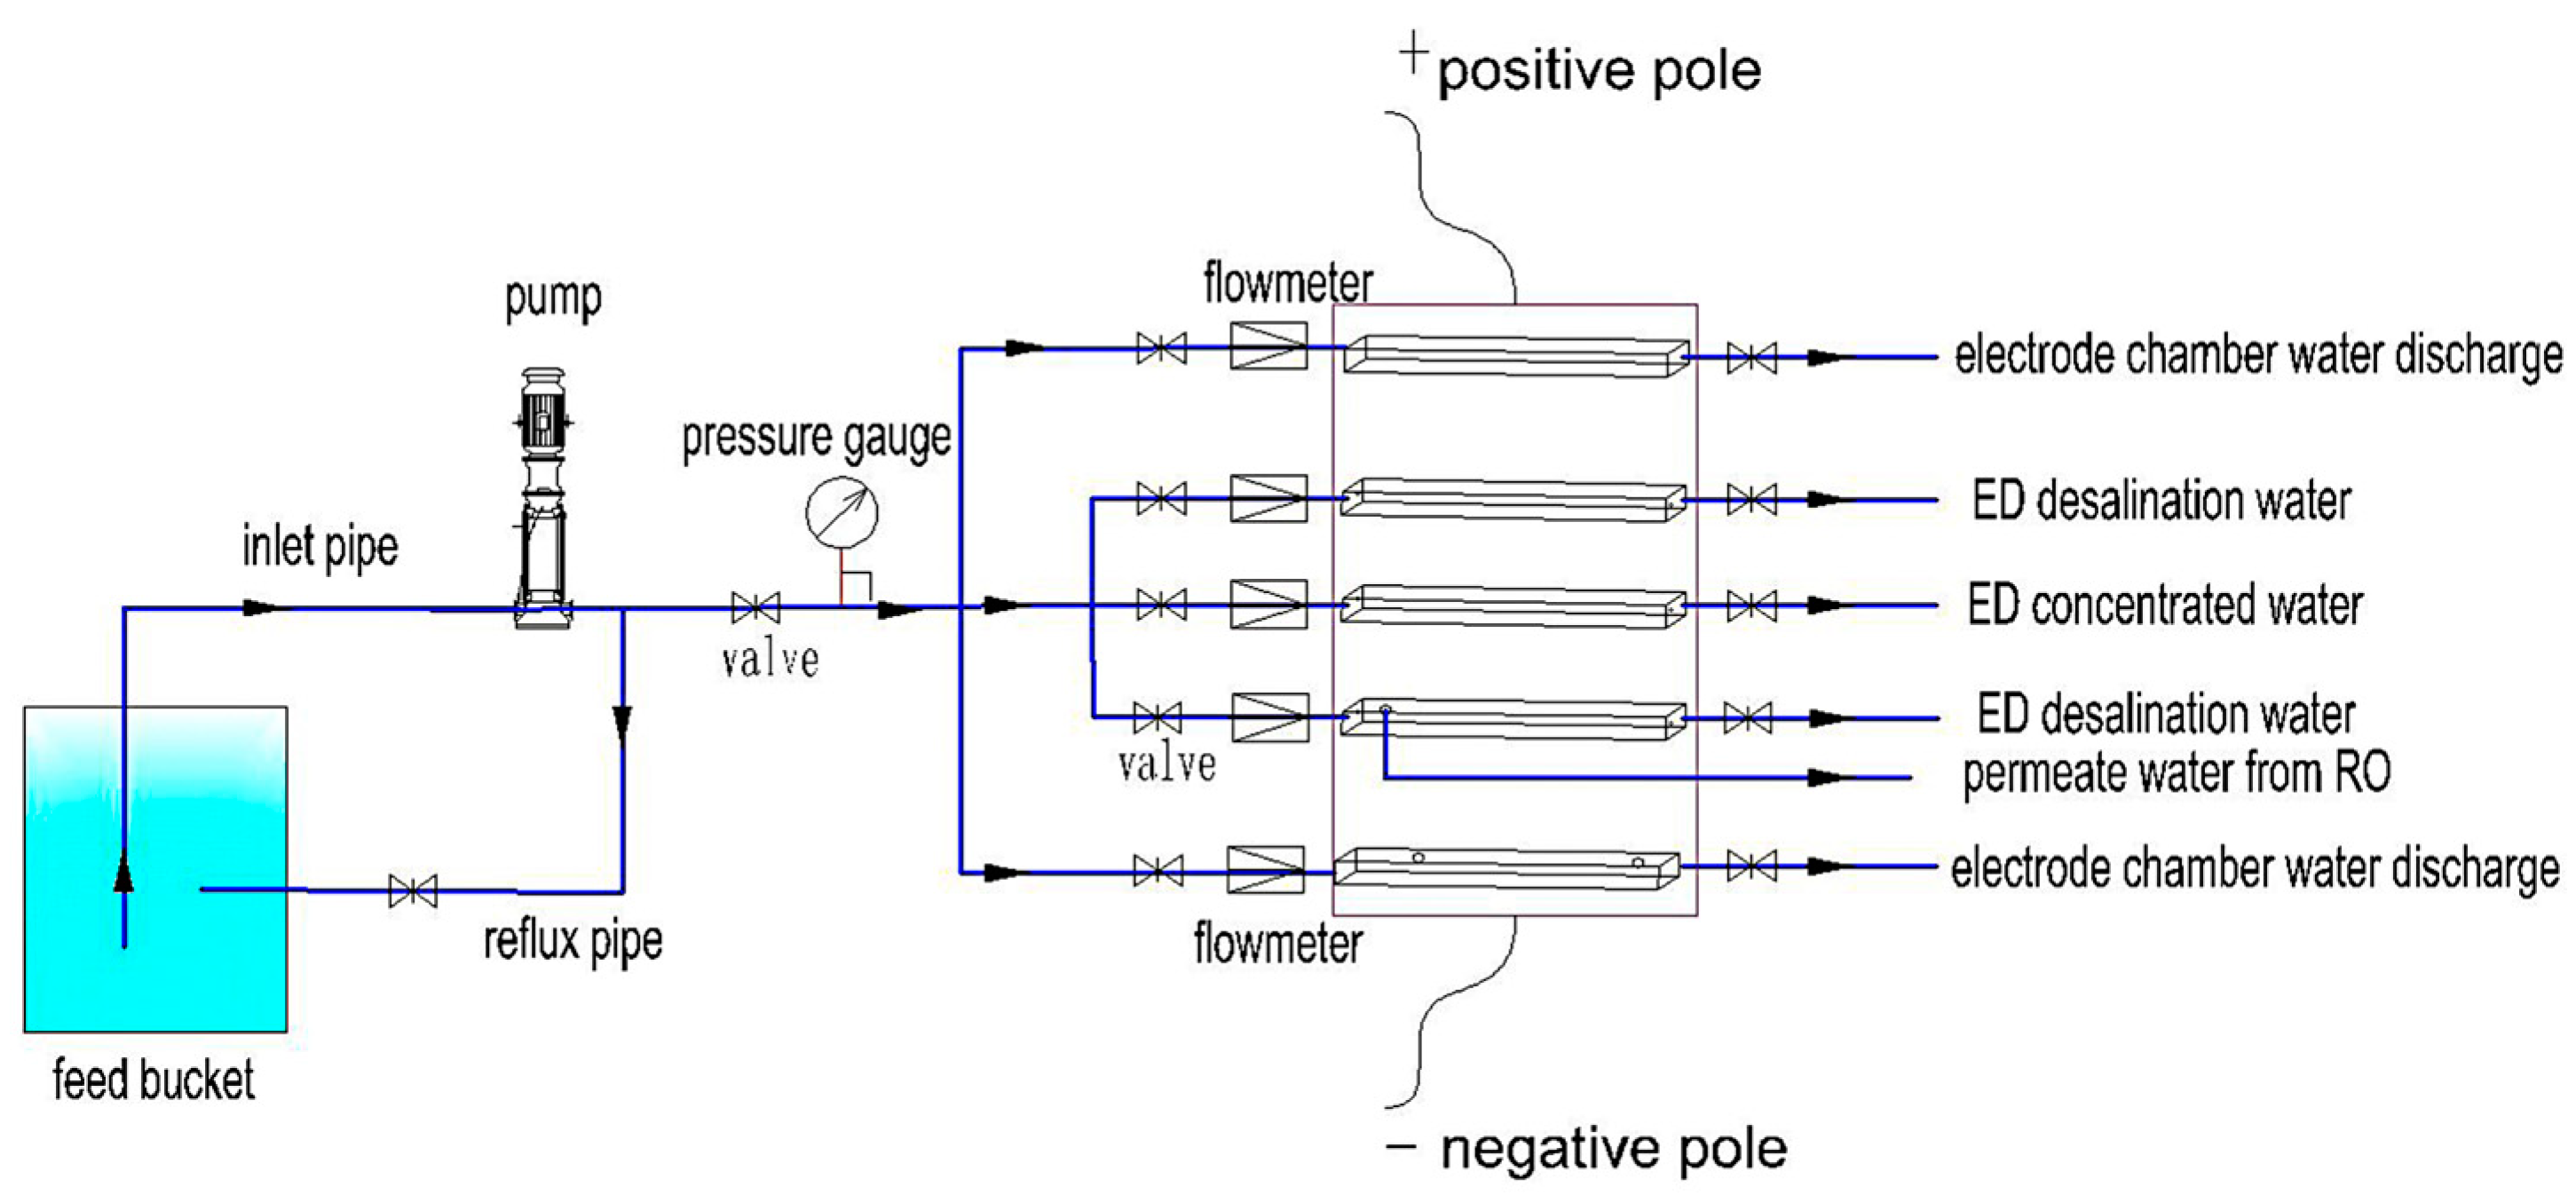
2.2. Test Equipment
2.3. Ion Migration Patterns in EDRO Systems
2.4. Experimental Design
2.5. Parametric Equation
2.6. Analytical Methods
3. Results and Discussion
3.1. Effect of Operating Pressure on Solute Removal and Permeate Flux in RO
3.2. Solute Removal and Current Efficiency of Ionic Membranes subject to Different Electric Fields and Concentrations
3.3. Effect of RO and Ion Membrane Performance in a Coupled System
3.3.1. Effect of Electric Field on Solute Removal and Permeate Flux in RO
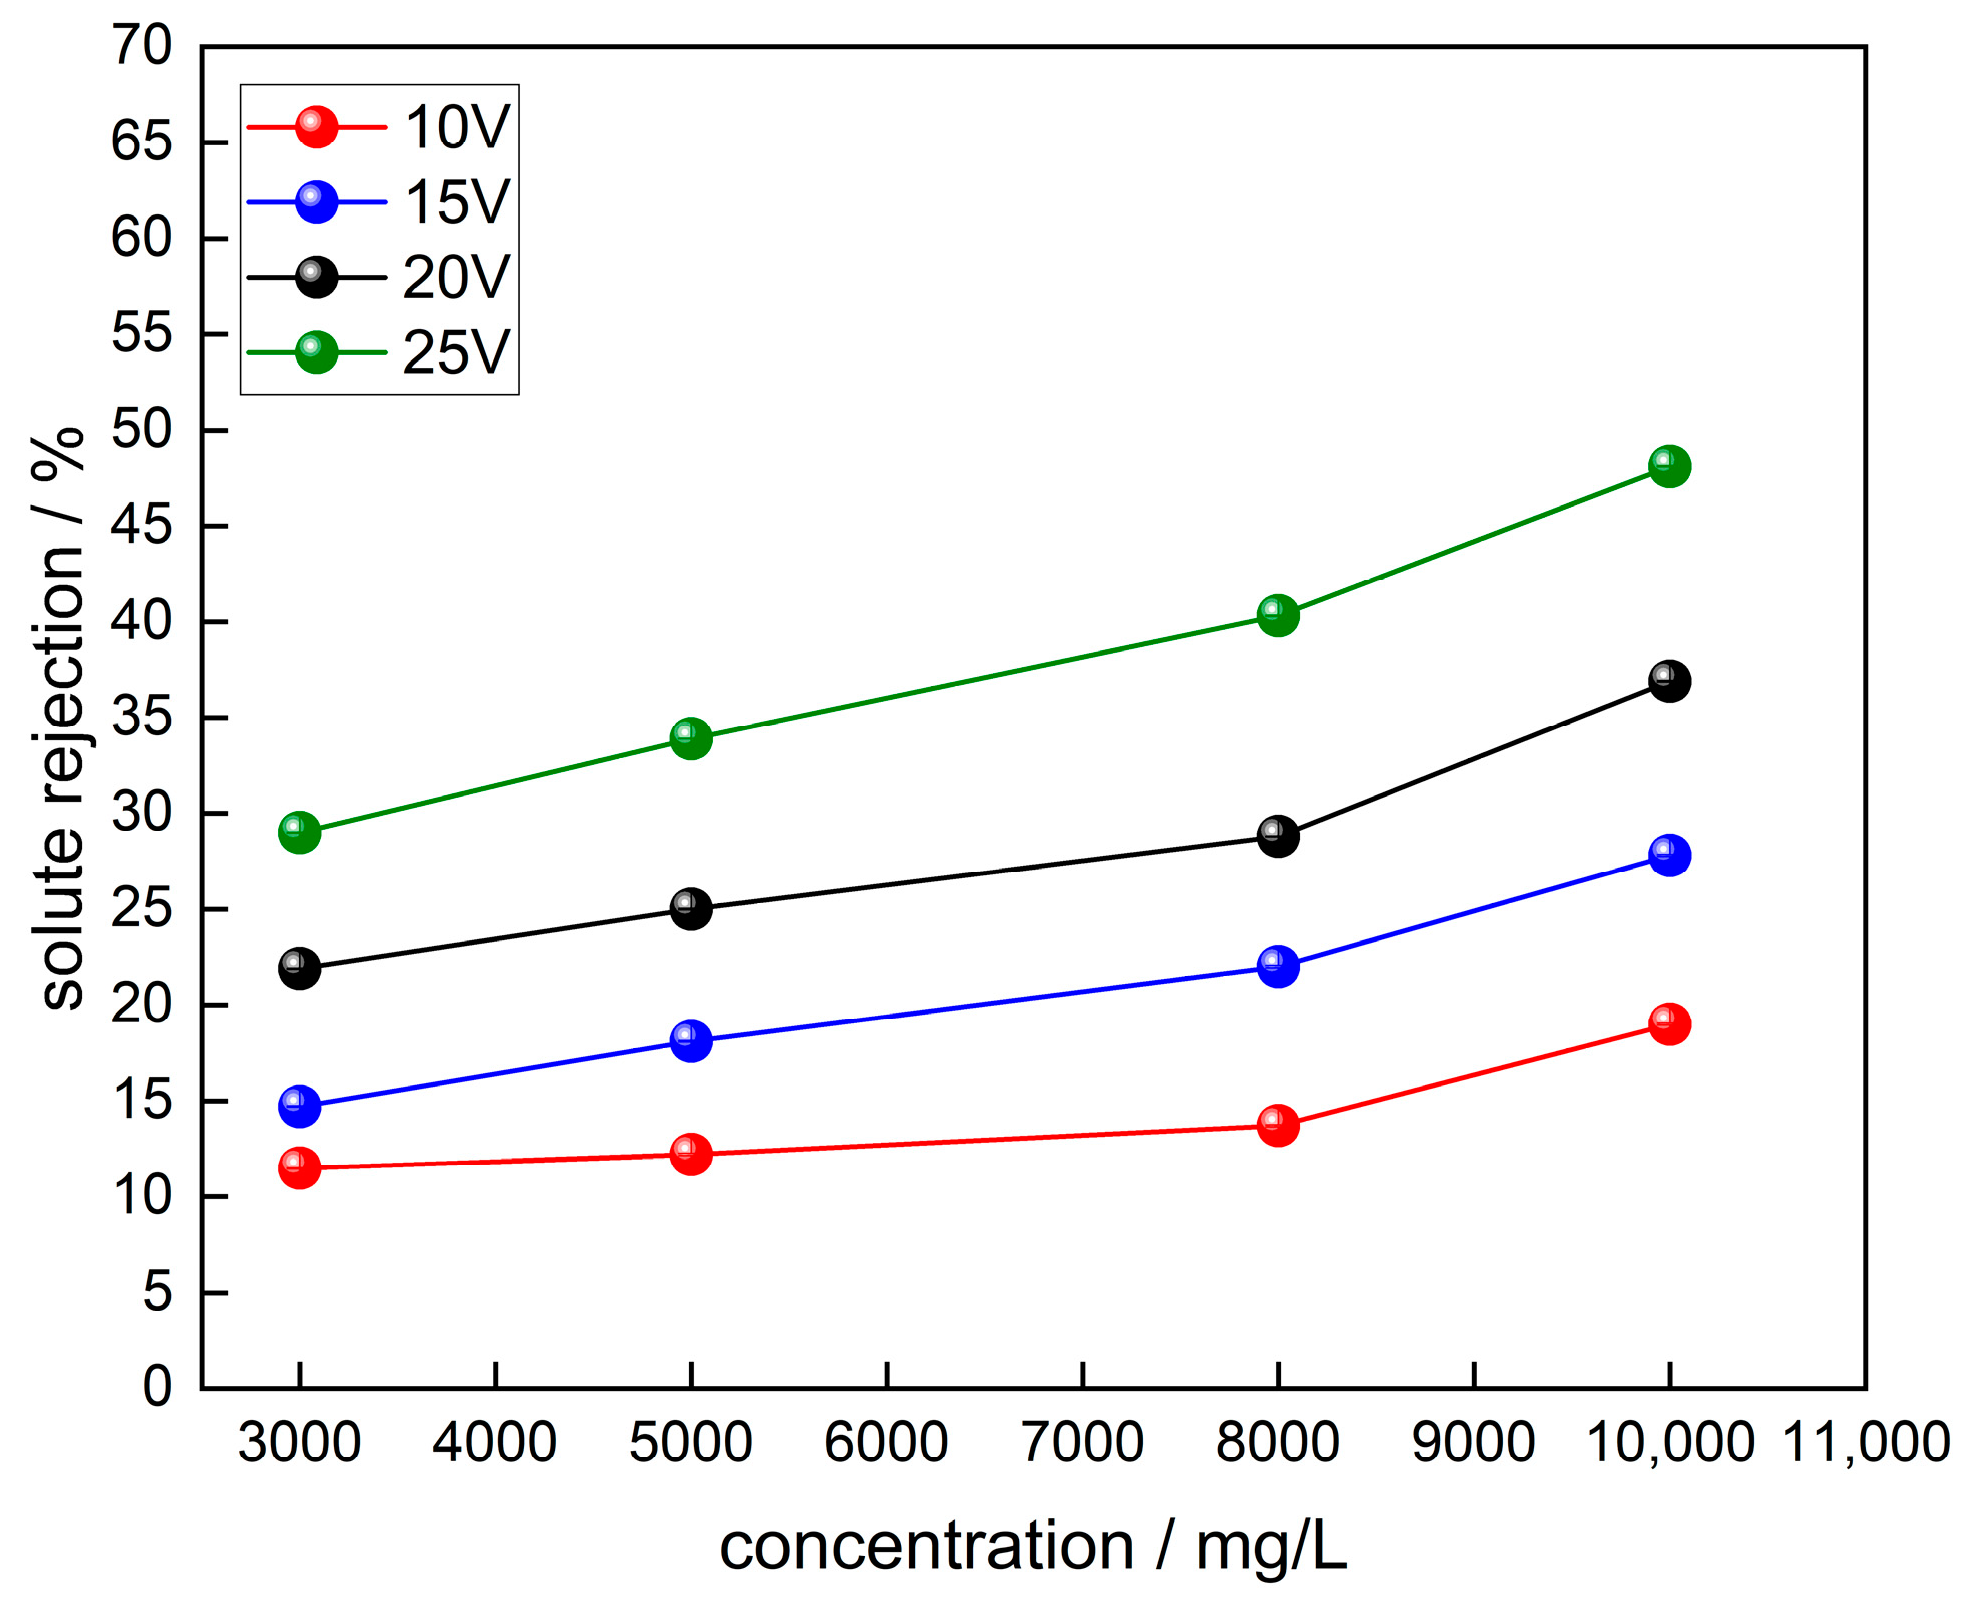
3.3.2. Effect of Electric Field on Solute Rejection Rate in RO
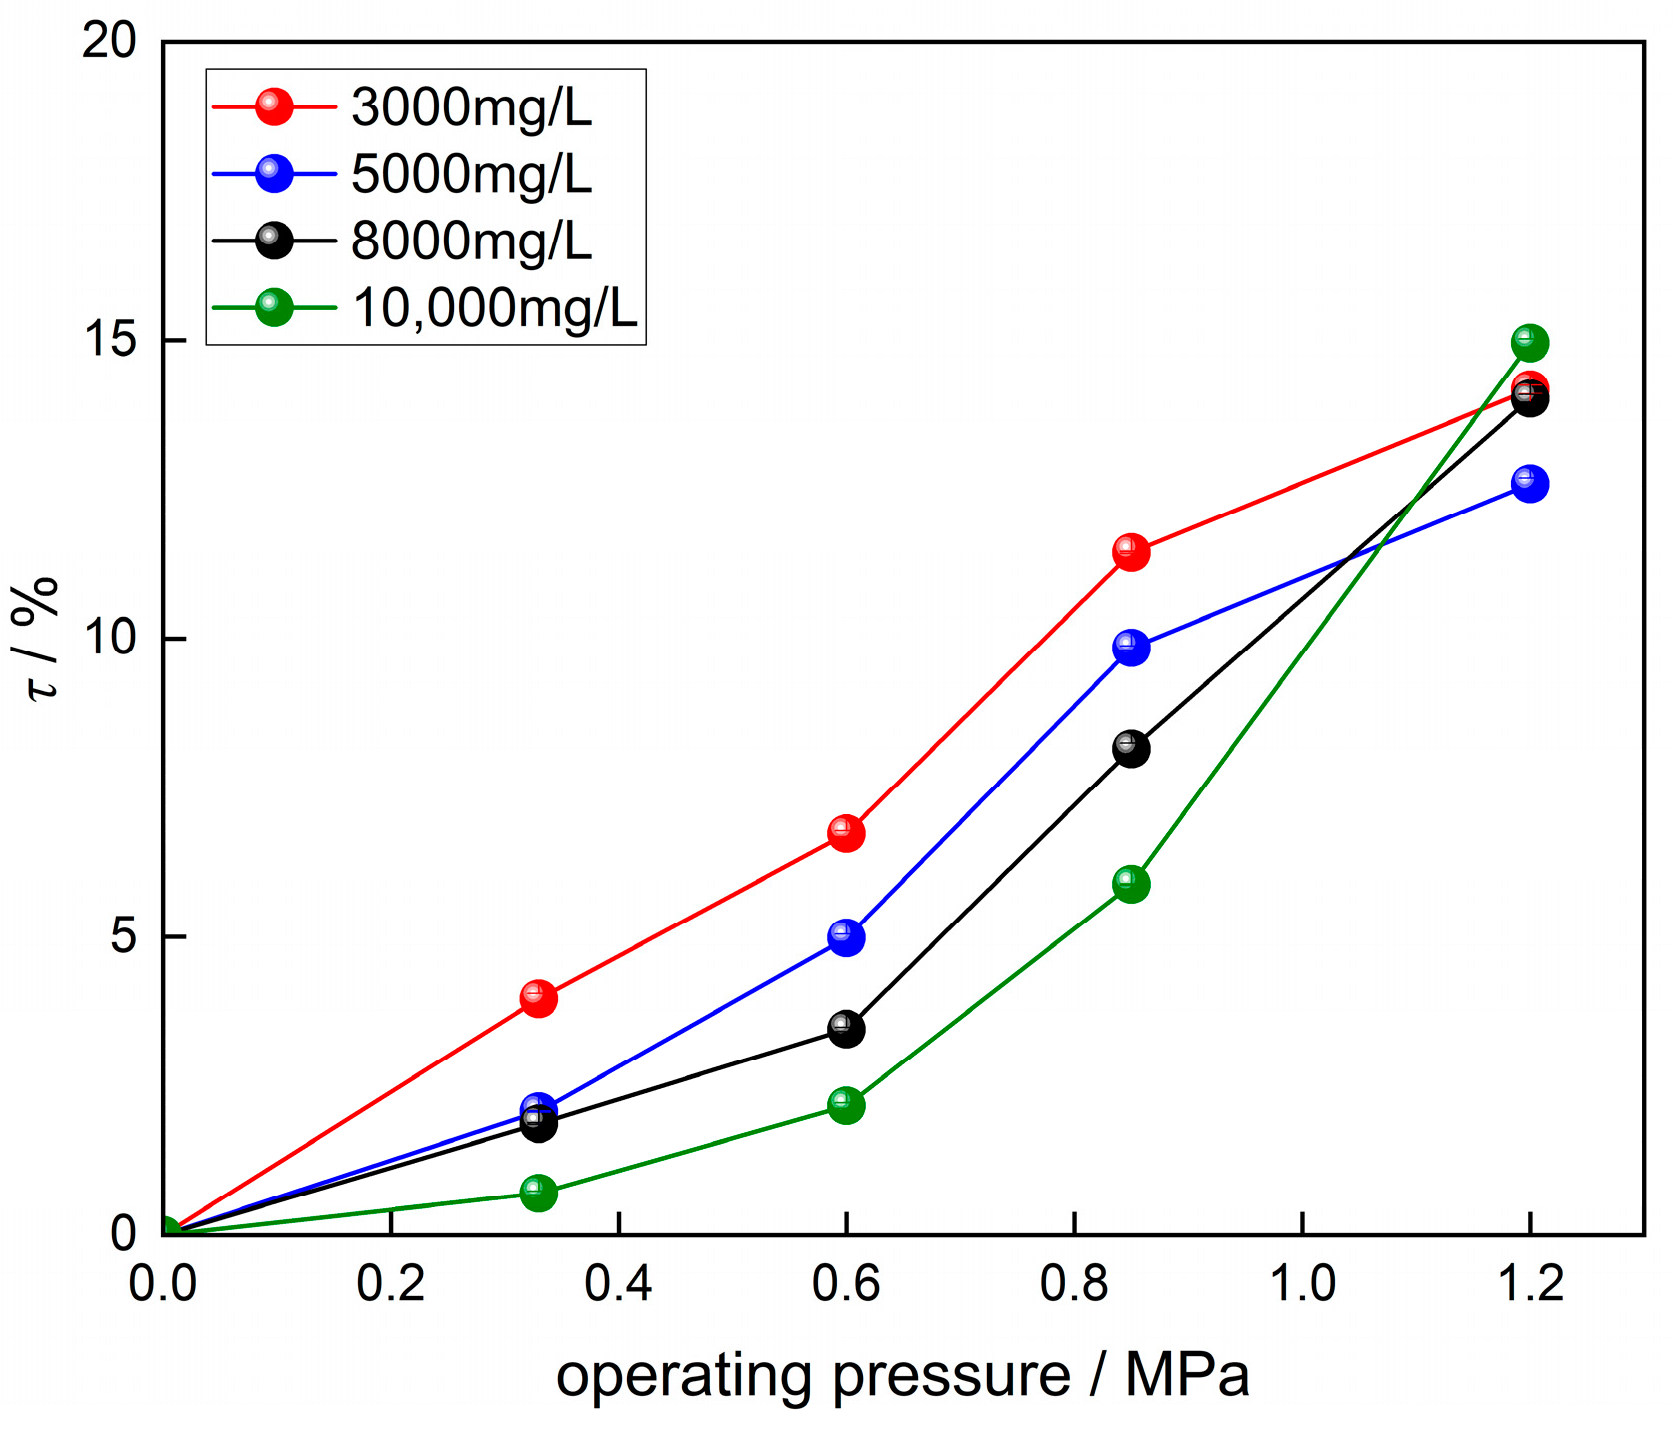
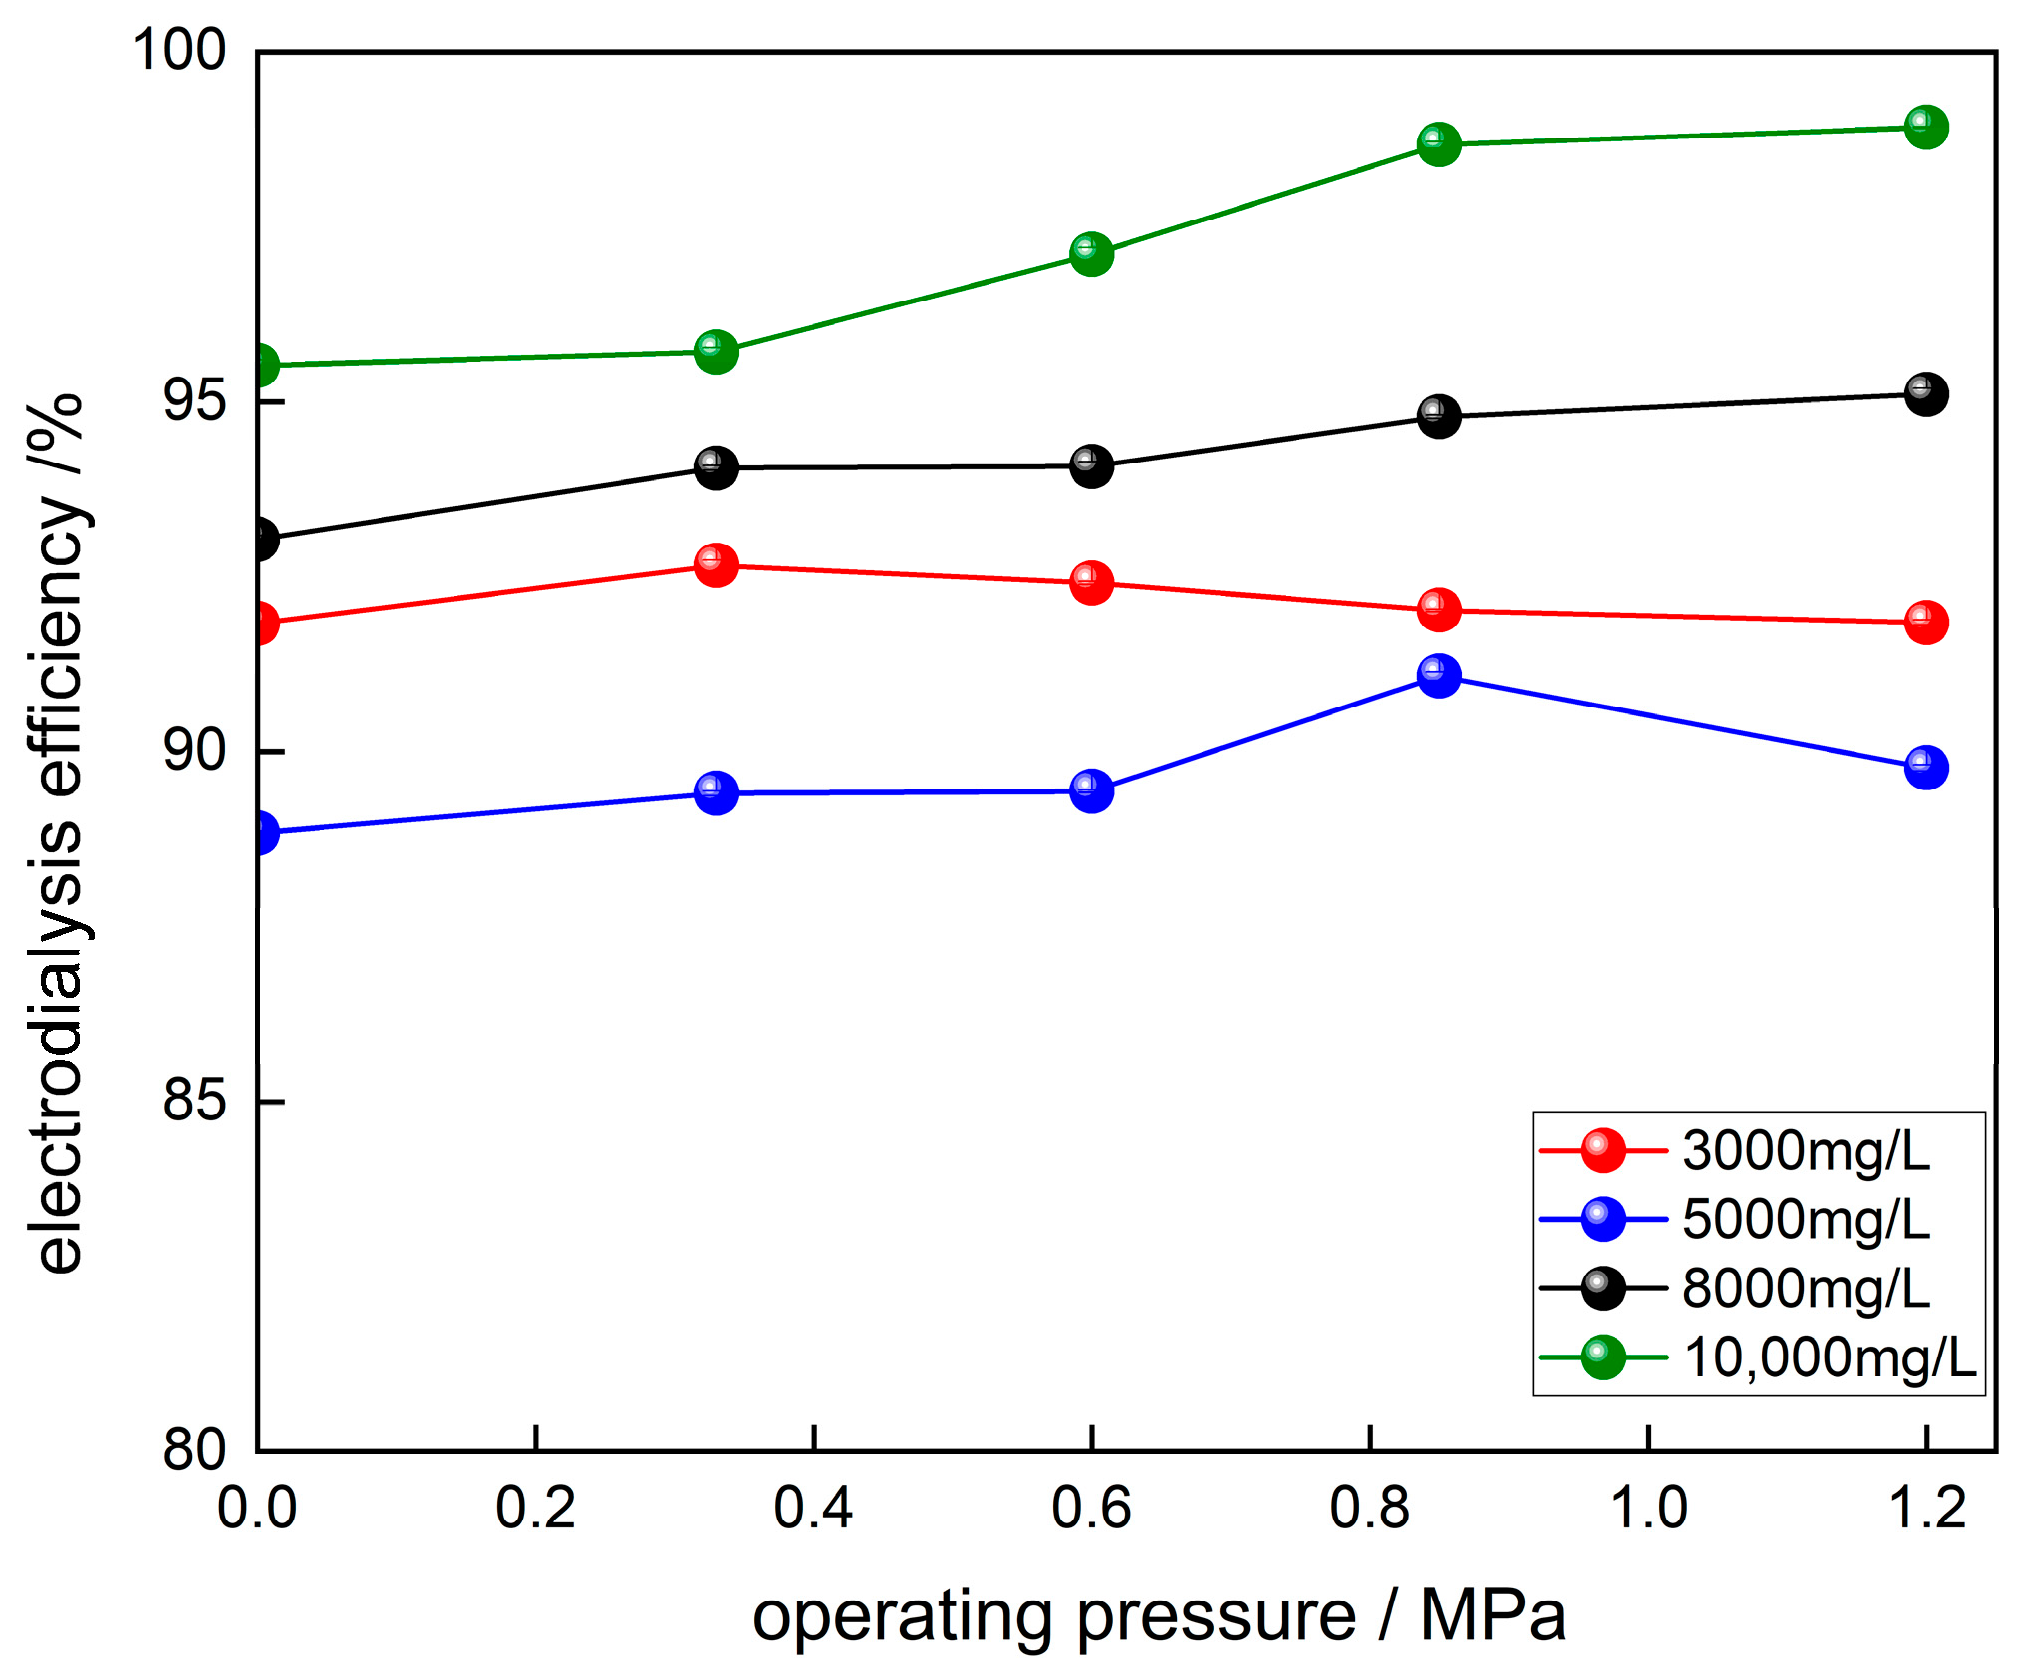
3.3.3. Effect of Pressure on Solute Rejection and Current Efficiency of Ionic Membranes
3.4. SEC Analysis
4. Conclusions
Author Contributions
Funding
Data Availability Statement
Acknowledgments
Conflicts of Interest
References
- Salehi, M. Global Water Shortage and Potable Water Safety; Today’s Concern and Tomorrow’s Crisis. Environ. Int. 2022, 158, 106936. [Google Scholar] [CrossRef] [PubMed]
- Koop, S.H.A.; Grison, C.; Eisenreich, S.J.; Hofman, J.; Van Leeuwen, K. Integrated Water Resources Management in Cities in the World: Global Solutions. Sustain. Cities Soc. 2022, 86, 104137. [Google Scholar] [CrossRef]
- Magri, A.; Berezowska-Azzag, E. New Tool for Assessing Urban Water Carrying Capacity (WCC) in the Planning of Development Programs in the Region of Oran, Algeria. Sustain. Cities Soc. 2019, 48, 101316. [Google Scholar] [CrossRef]
- Zhang, J.; Zhang, C.; Shi, W.; Fu, Y. Quantitative Evaluation and Optimized Utilization of Water Resources-Water Environment Carrying Capacity Based on Nature-Based Solutions. J. Hydrol. 2019, 568, 96–107. [Google Scholar] [CrossRef]
- Al-Amshawee, S.; Yunus, M.Y.B.M.; Azoddein, A.A.M.; Hassell, D.G.; Dakhil, I.H.; Hasan, H.A. Electrodialysis Desalination for Water and Wastewater: A Review. Chem. Eng. J. 2020, 380, 122231. [Google Scholar] [CrossRef]
- Feria-Díaz, J.J.; Correa-Mahecha, F.; López-Méndez, M.C.; Rodríguez-Miranda, J.P.; Barrera-Rojas, J. Recent Desalination Technologies by Hybridization and Integration with Reverse Osmosis: A Review. Water 2021, 13, 1369. [Google Scholar] [CrossRef]
- Zubair, M.M.; Saleem, H.; Zaidi, S.J. Recent Progress in Reverse Osmosis Modeling: An Overview. Desalination 2023, 564, 116705. [Google Scholar] [CrossRef]
- Moriyama, N.; Nagasawa, H.; Kanezashi, M.; Tsuru, T. Water Permeation in Gas and Liquid Phases through Organosilica Membranes: A Unified Theory of Reverse Osmosis, Pervaporation, and Vapor Permeation. Chem. Eng. Sci. 2022, 263, 118083. [Google Scholar] [CrossRef]
- Shah, K.M.; Billinge, I.H.; Chen, X.; Fan, H.; Huang, Y.; Winton, R.K.; Yip, N.Y. Drivers, Challenges, and Emerging Technologies for Desalination of High-Salinity Brines: A Critical Review. Desalination 2022, 538, 115827. [Google Scholar] [CrossRef]
- Bai, W.; Samineni, L.; Chirontoni, P.; Krupa, I.; Kasak, P.; Popelka, A.; Saleh, N.B.; Kumar, M. Quantifying and Reducing Concentration Polarization in Reverse Osmosis Systems. Desalination 2023, 554, 116480. [Google Scholar] [CrossRef]
- Lee, S.; Choi, J.; Park, Y.-G.; Shon, H.; Ahn, C.H.; Kim, S.-H. Hybrid Desalination Processes for Beneficial Use of Reverse Osmosis Brine: Current Status and Future Prospects. Desalination 2019, 454, 104–111. [Google Scholar] [CrossRef]
- Wang, Z.; Zhang, Y.; Wang, T.; Zhang, B.; Ma, H. Design and Energy Consumption Analysis of Small Reverse Osmosis Seawater Desalination Equipment. Energies 2021, 14, 2275. [Google Scholar] [CrossRef]
- Shahi, V.K.; Makwana, B.S.; Thampy, S.K.; Rangarajan, R. A Novel Electrodialyzer for the Production of Demineralized Water by Electrodialysis. Desalination 2003, 151, 33–42. [Google Scholar] [CrossRef]
- Tan, N.P.B.; Ucab, P.M.L.; Dadol, G.C.; Jabile, L.M.; Talili, I.N.; Cabaraban, M.T.I. A Review of Desalination Technologies and Its Impact in the Philippines. Desalination 2022, 534, 115805. [Google Scholar] [CrossRef]
- Sirivedhin, T.; McCue, J.; Dallbauman, L. Reclaiming Produced Water for Beneficial Use: Salt Removal by Electrodialysis. J. Membr. Sci. 2004, 243, 335–343. [Google Scholar] [CrossRef]
- Patel, S.K.; Biesheuvel, P.M.; Elimelech, M. Energy Consumption of Brackish Water Desalination: Identifying the Sweet Spots for Electrodialysis and Reverse Osmosis. ACS EST Eng. 2021, 1, 851–864. [Google Scholar] [CrossRef]
- Shestakov, K.V.; Lazarev, S.I.; Selivanov, Y.T.; Khokhlov, P.A.; Lomakina, O.V. Mathematical Description and Method of Calculating the Technological Parameters of an Electrodialysis Apparatus for Chemical Industrial Wastewater Treatment. Chem. Petrol. Eng. 2020, 56, 53–58. [Google Scholar] [CrossRef]
- Shi, J.; Gong, L.; Zhang, T.; Sun, S. Study of the Seawater Desalination Performance by Electrodialysis. Membranes 2022, 12, 767. [Google Scholar] [CrossRef]
- Voutetaki, A.; Plakas, K.V.; Papadopoulos, A.I.; Bollas, D.; Parcharidis, S.; Seferlis, P. Pilot-Scale Separation of Lead and Sulfate Ions from Aqueous Solutions Using Electrodialysis: Application and Parameter Optimization for the Battery Industry. J. Clean. Prod. 2023, 410, 137200. [Google Scholar] [CrossRef]
- Mir, N.; Bicer, Y. Integration of Electrodialysis with Renewable Energy Sources for Sustainable Freshwater Production: A Review. J. Environ. Manag. 2021, 289, 112496. [Google Scholar] [CrossRef]
- Elsaid, K.; Sayed, E.T.; Abdelkareem, M.A.; Mahmoud, M.S.; Ramadan, M.; Olabi, A.G. Environmental Impact of Emerging Desalination Technologies: A Preliminary Evaluation. J. Environ. Chem. Eng. 2020, 8, 104099. [Google Scholar] [CrossRef]
- La Cerva, M.; Gurreri, L.; Tedesco, M.; Cipollina, A.; Ciofalo, M.; Tamburini, A.; Micale, G. Determination of Limiting Current Density and Current Efficiency in Electrodialysis Units. Desalination 2018, 445, 138–148. [Google Scholar] [CrossRef]
- Generous, M.M.; Qasem, N.A.A.; Zubair, S.M. An Innovative Hybridization of Electrodialysis with Reverse Osmosis for Brackish Water Desalination. Energy Convers. Manag. 2021, 245, 114589. [Google Scholar] [CrossRef]
- Zhang, X.; Zhang, C.; Meng, F.; Wang, C.; Ren, P.; Zou, Q.; Luan, J. Near-Zero Liquid Discharge of Desulfurization Wastewater by Electrodialysis-Reverse Osmosis Hybrid System. J. Water Process Eng. 2021, 40, 101962. [Google Scholar] [CrossRef]
- Nayar, K.G.; Fernandes, J.; McGovern, R.K.; Dominguez, K.P.; McCance, A.; Al-Anzi, B.S.; Lienhard, J.H. Cost and Energy Requirements of Hybrid RO and ED Brine Concentration Systems for Salt Production. Desalination 2019, 456, 97–120. [Google Scholar] [CrossRef]
- Walker, W.S.; Kim, Y.; Lawler, D.F. Treatment of Model Inland Brackish Groundwater Reverse Osmosis Concentrate with Electrodialysis—Part I: Sensitivity to Superficial Velocity. Desalination 2014, 344, 152–162. [Google Scholar] [CrossRef]
- Gurreri, L.; La Cerva, M.; Moreno, J.; Goossens, B.; Trunz, A.; Tamburini, A. Coupling of electromembrane processes with reverse osmosis for seawater desalination: Pilot plant demonstration and testing. Desalination 2022, 526, 115541. [Google Scholar] [CrossRef]
- Reig, M.; Casas, S.; Aladjem, C.; Valderrama, C.; Gibert, O.; Valero, F.; Centeno, C.M.; Larrotcha, E.; Cortina, J.L. Concentration of NaCl from Seawater Reverse Osmosis Brines for the Chlor-Alkali Industry by Electrodialysis. Desalination 2014, 342, 107–117. [Google Scholar] [CrossRef]
- Zhang, Y.; Ghyselbrecht, K.; Meesschaert, B.; Pinoy, L.; Van Der Bruggen, B. Electrodialysis on RO Concentrate to Improve Water Recovery in Wastewater Reclamation. J. Membr. Sci. 2011, 378, 101–110. [Google Scholar] [CrossRef]
- Munshi, F.M.; Hwang, J.-H.; Park, J.; Sadmani, A.; Khan, M.A.; Jeon, B.-H.; Lee, W.H. Electric Field Forward Osmosis (EFFO) Fouling Mitigation in Algae Harvesting. Sep. Purif. Technol. 2023, 327, 124868. [Google Scholar] [CrossRef]
- Ji, Y.; Choi, Y.J.; Fang, Y.; Pham, H.S.; Nou, A.T.; Lee, L.S.; Niu, J.; Warsinger, D.M. Electric Field-Assisted Nanofiltration for PFOA Removal with Exceptional Flux, Selectivity, and Destruction. Environ. Sci. Technol. 2023, 57, 18519–18528. [Google Scholar] [CrossRef] [PubMed]
- Cao, S.; Wang, Y.; Zhang, Y.; Wang, G.; Su, T. Inhibition of Membrane Fouling by Frequency Agility Electric Field in Desalination. J. Environ. Chem. Eng. 2023, 11, 110740. [Google Scholar] [CrossRef]
- Zoungrana, A.; Çakmakci, M. Optimization of the Reverse Electrodialysis Power Output through the Ratio of the Feed Solutions Salinity. IET Renew. Power Gen. 2021, 15, 769–777. [Google Scholar] [CrossRef]
- Sadrzadeh, M.; Mohammadi, T. Sea Water Desalination Using Electrodialysis. Desalination 2008, 221, 440–447. [Google Scholar] [CrossRef]
- Banasiak, L.J.; Kruttschnitt, T.W.; Schäfer, A.I. Desalination Using Electrodialysis as a Function of Voltage and Salt Concentration. Desalination 2007, 205, 38–46. [Google Scholar] [CrossRef]
- Ansari, M.; Al- Obaidi, M.A.; Hadadian, Z.; Moradi, M.; Haghighi, A.; Mujtaba, I.M. Performance Evaluation of a Brackish Water Reverse Osmosis Pilot-Plant Desalination Process under Different Operating Conditions: Experimental Study. Clean. Eng. Technol. 2021, 4, 100134. [Google Scholar] [CrossRef]
- Sitterley, K.A.; Cath, T.J.; Jenne, D.S.; Yu, Y.-H.; Cath, T.Y. Performance of Reverse Osmosis Membrane with Large Feed Pressure Fluctuations from a Wave-Driven Desalination System. Desalination 2022, 527, 115546. [Google Scholar] [CrossRef]
- Al-Obaidi, M.A.; Alsarayreh, A.A.; Bdour, A.; Jassam, S.H.; Rashid, F.L.; Mujtaba, I.M. Simulation and Optimisation of a Medium Scale Reverse Osmosis Brackish Water Desalination System under Variable Feed Quality: Energy Saving and Maintenance Opportunity. Desalination 2023, 565, 116831. [Google Scholar] [CrossRef]
- Salahudeen, N. Process Simulation of Modelled Reverse Osmosis for Desalination of Seawater. Water Pract. Technol. 2022, 17, 175–190. [Google Scholar] [CrossRef]
- Du, J.R.; Du, W.; Feng, X.; Zhang, Y.; Wu, Y. Membrane Distillation Enhanced by an Asymmetric Electric Field. AIChE J. 2014, 60, 2307–2313. [Google Scholar] [CrossRef]
- Giri, A.K.; Teixeira, F.; Cordeiro, M.N.D.S. Salt Separation from Water Using Graphene Oxide Nanochannels: A Molecular Dynamics Simulation Study. Desalination 2019, 460, 1–14. [Google Scholar] [CrossRef]
- Phan, L.X.; Lynch, C.I.; Crain, J.; Sansom, M.S.P.; Tucker, S.J. Influence of Effective Polarization on Ion and Water Interactions within a Biomimetic Nanopore. Biophys. J. 2022, 121, 2014–2026. [Google Scholar] [CrossRef] [PubMed]


| No. | Feed Water Total Dissolved Solids (TDS) (mg/L) | Operating Pressure (MPa) | Sampling Methods |
|---|---|---|---|
| 1 | 3000 | 0.33, 0.60, 0.85, 1.20 | Each 1 h period is treated as a separate operational unit. During this time, three parallel samples are consistently collected for analysis. The salt concentration of each sample, as well as the total volume of permeate water within the 1 h duration, are carefully recorded. |
| 2 | 5000 | ||
| 3 | 8000 | ||
| 4 | 10,000 |
| No. | Feed Water TDS (mg/L) | Voltage (V) | Sampling Methods |
|---|---|---|---|
| 1 | 3000 | 10, 15, 20, 25 | Each 1 h period is considered as one operational unit. During this time, three parallel samples are continuously collected to detect the salt concentration in the dilute chamber. Additionally, the operational voltage and current are recorded. |
| 2 | 5000 | ||
| 3 | 8000 | ||
| 4 | 10,000 |
| No. | Feed Water TDS (mg/L) | Operating Voltage (V) | Operating Pressure (MPa) | Sampling Methods |
|---|---|---|---|---|
| 1 | 3000 | 10, 15, 20, 25 | 0.33 | Each 1 h period is considered as one operational unit. During this time, three parallel samples are continuously collected. The overall experimental duration for each set is 4 h. The TDS value of each sample is recorded, along with the total volume of permeate water for each 1 h interval. |
| 2 | 5000 | 0.60 | ||
| 3 | 8000 | 0.85 | ||
| 4 | 10,000 | 1.20 |
| No. | Feed Water TDS (mg/L) | Operating Voltage (V) | Operating Pressure (MPa) | Sampling Methods |
|---|---|---|---|---|
| 1 | 3000 | 15 | 0.33 | Each 1 h interval is treated as an operational unit, during which three consecutive parallel samples are taken. The aim is to measure the TDS value, as well as the voltage and current during each sample collection. |
| 2 | 5000 | 0.60 | ||
| 3 | 8000 | 0.85 | ||
| 4 | 10,000 | 1.20 |
| No. | Feed Water TDS (mg/L) | Operating Voltage (V) | Operating Pressure (MPa) | Sampling Methods |
|---|---|---|---|---|
| 1 | 5000 | 0, 10, 15, 20, 25 | 0, 0.6 | The total volume of treated water is 4.5 L and the treatment time is 3 h. Upon completion of the treatment, the amount of permeate water and TDS values produced by the RO system will be recorded, along with the TDS values and current in the dilute chamber of the ED system. |
| 2 | 10,000 | 0, 1.2 |
Disclaimer/Publisher’s Note: The statements, opinions and data contained in all publications are solely those of the individual author(s) and contributor(s) and not of MDPI and/or the editor(s). MDPI and/or the editor(s) disclaim responsibility for any injury to people or property resulting from any ideas, methods, instructions or products referred to in the content. |
© 2024 by the authors. Licensee MDPI, Basel, Switzerland. This article is an open access article distributed under the terms and conditions of the Creative Commons Attribution (CC BY) license (https://creativecommons.org/licenses/by/4.0/).
Share and Cite
Fu, C.; Li, F.; Li, H.; Yi, X. Performance Study on Brackish Water Desalination Efficiency Based on a Novel Coupled Electrodialysis–Reverse Osmosis (EDRO) System. Water 2024, 16, 794. https://doi.org/10.3390/w16060794
Fu C, Li F, Li H, Yi X. Performance Study on Brackish Water Desalination Efficiency Based on a Novel Coupled Electrodialysis–Reverse Osmosis (EDRO) System. Water. 2024; 16(6):794. https://doi.org/10.3390/w16060794
Chicago/Turabian StyleFu, Caixia, Fujun Li, Hui Li, and Xuenong Yi. 2024. "Performance Study on Brackish Water Desalination Efficiency Based on a Novel Coupled Electrodialysis–Reverse Osmosis (EDRO) System" Water 16, no. 6: 794. https://doi.org/10.3390/w16060794
APA StyleFu, C., Li, F., Li, H., & Yi, X. (2024). Performance Study on Brackish Water Desalination Efficiency Based on a Novel Coupled Electrodialysis–Reverse Osmosis (EDRO) System. Water, 16(6), 794. https://doi.org/10.3390/w16060794