Abstract
Ecological flow regime analysis through developing a novel ecohydraulic optimization method is the objective of this study in which three components are linked. Hydrological analysis is the first component in which average monthly flow is assessed in different hydrological conditions by applying a drought index in the selected control points or representative reaches in the river basin. Another component is the ecological model in which field ecological studies are used for selecting the target species, and habitat loss was modelled through the fuzzy method. The outputs of the hydrological analysis and hydraulic habitat simulation were then applied in the structure of the optimization model in which minimizing ecological impacts and water supply loss were defined as the purposes. Different evolutionary algorithms were used in the optimization process. A decision-making system was utilized to finalize ecological flow by selecting the privileged algorithm. According to the outputs, the proposed method can mitigate ecological impacts and water supply losses simultaneously. Either particle swarm optimization or differential evolution algorithm is the best approach for ecological flow in this research work. The outputs of optimization indicated that the reliability of the water supply in dry years is less than 32%, while it is more than 80% in wet years, which means that changing the hydrological condition will increase the portion of ecological flow regime significantly. In other words, the reliability of the water supply can be reduced by more than 50%. Hence, using other water resources such as groundwater is necessary in dry years in the study area.
1. Introduction
The ecological flow regime can provide enough instream flow to protect river health and provide sustainable ecological status in river ecosystems [1,2]. According to the literature, four main methods have been developed for ecological flow assessment including hydrological and ecological methods [3]. However, other combined methods might be proposed based on the complexities in the hydrological and ecological processes in rivers. Hydrologic desktop methods are inexpensive and straightforward for assessing ecological flow. For example, Tennant and flow duration curve analysis methods are simple and well-known methods in this regard [4]. The most well-known and popular hydraulic rating method is the wetted perimeter method that has been developed based on the relationship between the wetted perimeter and river flow [5]. Due to complexities in the ecological assessment of river ecosystems, it was essential to improve the assessment methods in this regard for greater focus on the habitats’ requirements [6]. Instream flow incremental methodology (IFIM) developed a habitat simulation method to assess ecological flow in which hydraulic habitat simulation has been introduced as the core of the method [7,8]. Protecting ecological flow is necessary to obtain the long-term purposes of water security [9].
Hydraulic habitat simulation was originally developed in the structure of the PHABSIM software (V4.1) by applying a univariate habitat model to simulate the suitability of hydraulic habitat parameters including depth, velocity and substrate. In fact, this method simulates the suitability of physical factors separately. Then, a mathematical model such as the multiply method is applied to simulate the combined suitability [10]. Given the inability of the univariate habitat method to simulate interactions between physical factors, other methods have been introduced in this regard that have been reviewed in the literature [11,12,13]. The fuzzy multivariate method or fuzzy logic approach is a robust method in which interactions between physical parameters could be simulated in hydraulic habitat selection by developing verbal fuzzy rules. Considering expert opinions in the development of physical suitability criteria is one of the requirements in the hydraulic habitat simulation due to complexities of the ecological assessment in the ecosystems. Fuzzy hydraulic habitat simulation has been used as the standalone method to assess and optimize ecological flow in recent studies [13].
Not only is IFIM not a model, but it also is not a rigid or fixed process to assess ecological flow. In other words, IFIM provides general guidelines to manage river ecosystems and the supply of its requirements in which a combination of simulations and judgements might be applied. Developers encouraged users to have innovation and creativity when generating ecological flow regimes in the rivers [14]. A significant drawback in all the developed ecological flow methods is the lack of an optimization model in the structure of the assessment methods. In fact, water resource engineers face many complexities in the management of water resources in river basins. In other words, experts need an optimization framework to balance the needs of the environment and water demands. Using optimization frameworks in water resource management has been highlighted in the literature [15]. Linear programming is the simplest optimization method that has been used in water resource management [16]. However, it is not robust due to the non-linear nature of water resource management, which needs efficient methods [17]. Hence, non-linear approaches have been recommended as well [18,19]. Two aspects should be considered for selecting the optimization method including robustness and efficiency. Hence, evolutionary algorithms have been proposed for the optimization of water resources as efficient and robust methods [20]. The classic, as well as the new, generation algorithms have been recommended for finding the optimal solutions [21]. Moreover, they might be classified based on the utilized methods for finding the best solutions. Some algorithms have been inspired by the social behaviour of animals [22]. In contrast, other algorithms follow natural laws in the optimization process such as the gravity search algorithm that applies the principals of the gravity law for finding the best solutions [23]. Many animal- and non-animal-inspired algorithms have been used in the water resource management problem for improving planning [24,25,26,27].
Some previous studies improved hydrologic methods by adding ecological indicators to the model to assess ecological flow [28]. However, these methods should be improved due to their lack of focus on the simulation of target species in the study area. Moreover, adding an optimization framework to the ecological flow assessment method is required to balance needs in the river basins, especially in the drought condition. Based on these requirements, this study proposes a novel ecohydraulic method in which field studies are linked to the fuzzy hydraulic habitat simulation and hydrological analysis to assess ecological flow in the structure of the optimization framework at the river basin scale. In fact, the optimization method considers two purposes including minimizing ecological impacts and water supply loss in the river basin. This novel method is developed at the river basin scale; this is a strength point. In fact, previous methods are only assessment tools that are mostly useable at the river reach scale. However, the proposed method is an optimization method that can mitigate the loss of water supply and ecological impacts at the river basin scale simultaneously. This novel method can demonstrate how converting assessment methods to simulation-optimization methods at the basin scale is necessary. In fact, water resource engineers face many ecological complexities in the management of river basins that might need integrated frameworks to balance needs fairly.
2. Materials and Methods
2.1. Framework
An overview of the proposed framework is essential. Figure 1 displays the flowchart of the framework in which some main parts are recognizable. First, sensitive river reaches are recognized in the stream network of the basin. The sensitive river reaches were defined based on two ecological considerations. First, they should be allocated downstream of the main rivers in the catchment, which means that if we can supply enough ecological flow in these reaches, upstream habitats of the rivers will be protected as well. Second, the initial study indicated that these reaches are highly vulnerable aquatic habitats in the study area.
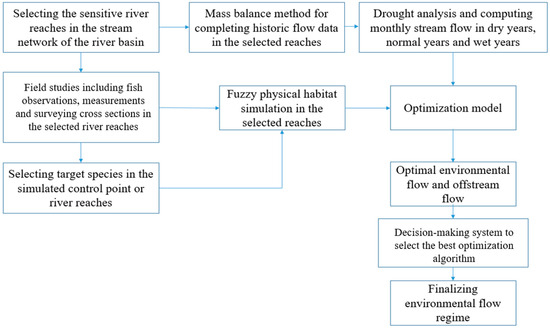
Figure 1.
Proposed framework.
Then, field observations were carried out in the sensitive river reaches considering two purposes including microhabitat study requirements and ecological zoning. The hydrological mass balance was used to estimate the river flow in the streams without hydrometric stations. Drought analysis was utilized to compute the average monthly flow for dry years, normal years and wet years in the sensitive river reaches. Then, fuzzy hydraulic habitat simulation was applied to develop the ecological impact function for selected target species. Outputs of the simulations and hydrologic analysis were used in the structure of the optimization model to assess ecological flow in the sensitive river reaches that were considered as the control point for the measurement of the ecological flow regime. The developed method proposes optimal ecological flow regimes for the control points in which ecological impacts and water supply losses are minimized simultaneously. More details regarding each part of the model are presented in the next sections. Selecting sensitive river reaches was carried out based on the expert opinions by the experienced ecologist. The fuzzy technique for order of preference by similarity to ideal solution (FTOPSIS) is the selected decision-making system for finding the best optimization approach.
2.2. Field Studies
Fishes were considered as the ecological index to simulate habitats in the river network. Observing and sampling of the fishes in their actual habitats might be a challenging issue in the ecological studies. Sampling methods have been categorized in two classes including direct and indirect methods. Direct methods directly observe the fishes in their actual habitats. Video telemetry is one of the known direct methods that has been highlighted in previous works [29]. However, some limitations such as high turbidity might be a hindrance when utilizing direct methods in some case studies. Thus, indirect methods have been addressed as well. The most important and well-known indirect method is electrofishing, which is able to shock fishes in a limited habitat area, for example, one square meter, as an observation point. Biometry might be the next stage in fish observation studies using the electrofishing method. There are some significant advantages for using the electrofishing method including reasonable cost and usability in turbid water. The main disadvantage of this method is its probability for perishing fish. We, however, used a low voltage to reduce perishing fish. Velocity and depth were measured in the microhabitats by the propeller. More details regarding the measurement of depth and velocity in the microhabitats have been highlighted in the previous research works [29]. Another stage of field studies was to survey the selected river reaches for simulating hydraulic habitats. Surveying river cross sections is a prerequisite for hydraulic habitat simulation. A known method was applied for surveying cross sections. More details have been highlighted in the previous research works [30].
2.3. Fuzzy Hydraulic Habitat Simulation
Figure 2 displays the workflow of the fuzzy hydraulic habitat simulation in this study. Expert opinions are applicable to develop fuzzy approach requirements. This study applied a combination of expert opinions and field observations to develop verbal fuzzy rules for selected target species. HEC-RAS 1D was used to simulate depth and velocity in the cross section of the selected reaches in the basin. Then, fuzzy rules were combined with velocity and depth distribution to develop the ecological impact function of habitat suitability. More details of the habitat simulation have been highlighted in the previous research works, as cited in the introduction.
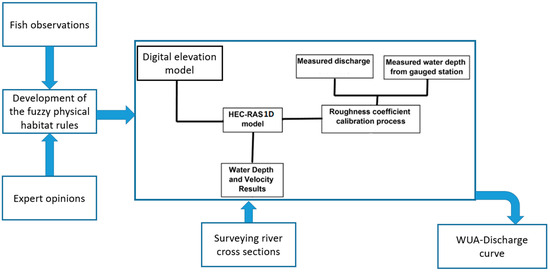
Figure 2.
Flowchart of the proposed method for assessing ecological flow.
2.4. Drought Analysis
The stream drought index was used to analyse the dry years; its workflow is shown in Figure 3.
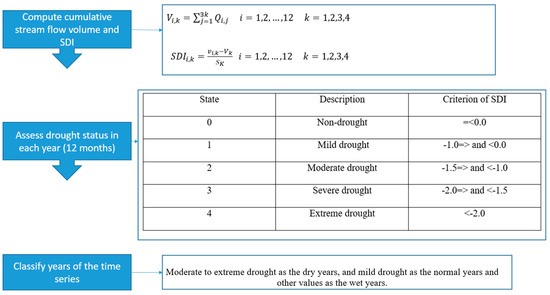
Figure 3.
Flowchart of drought analysis. K means the period of drought analysis (three to twelve months) and V and S are mean and standard deviation of cumulative stream flow volume, respectively [31].
2.5. Optimization Model
An environmental objective function was developed to assess the ecological flow regime. Equation (1) displays the objective function in which NNWUA is the mean normalized weighted useable area for the natural flow in the watershed scale, ONWUA is the optimal mean normalized weighted useable area in the watershed scale considering the water abstraction impact, NF is the natural stream flow at the outflow of the catchment and OF is the optimal offstream flow at the outflow of the catchment given the optimal abstracted discharge. T is the time horizon which is defined in the monthly step. The objective function contains two terms that are defined to minimize the ecological impact and water supply loss. The stakeholders are willing to divert the total available water in the river. Hence, minimizing the difference between natural flow and optimal offstream flow was considered as the water supply loss in the objective function. CI1 and CI2 are the weight of importance for each term which could be negotiated with the agricultural stakeholders before the optimization process. In this way, stakeholders will easily accept the results of the proposed model. However, this study defined both parameters as one. In other words, in our test, the same importance for both terms is considered.
Each optimization system might need some constraints that should be added to the system. Definition of the upper and lower limit needs to be considered for the constraints in the optimization system. In fact, ecological flow is the main variable in the optimization model. The lower limit is defined as the minimum discharge for cleaning the riverbed (keeping the riverbed clean or avoiding interruption of water continuity or stagnation in depression areas) and the upper limit is defined as the available flow or natural flow in the time step t.
This research work applied different evolutionary algorithms in the optimization process. The general steps of these algorithms are the same as displayed in Figure 4. However, they might use different strategies for finding the best solution. Five algorithms were utilized including the imperial competitive algorithm (ICA) [32], particle swarm optimization (PSO), differential evolution algorithm (DE) [33], shuffled complex evolution algorithm (SCE) [34] and biogeography-based optimization (BBO) [35].
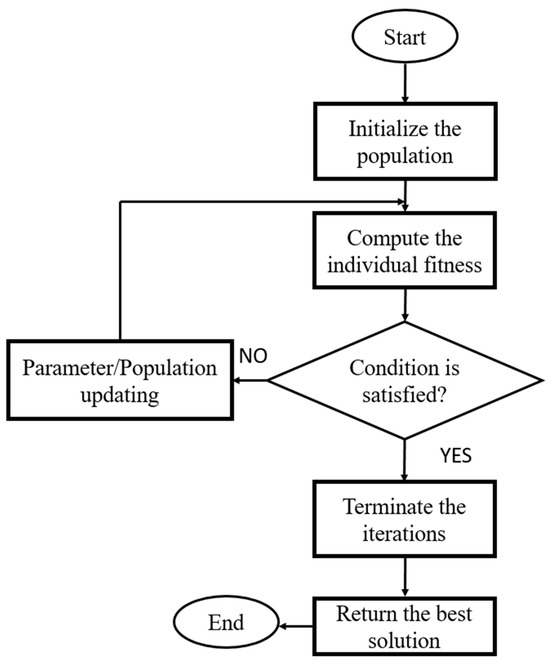
Figure 4.
General flowchart of the evolutionary algorithms.
Each optimization system might need to be measured in terms of the robustness of the optimization solution. Hence, many previous studies used appropriate indices to measure the performance of the optimization model. Defining these indices might be dependent on the purposes of the optimization system and requirements in each case study. Thus, two indices including root mean square error (RMSE) and reliability index (RI) based on the requirements in the case study were applied. It should be noted that it might be necessary to change the measurement indices in other cases. However, using the proposed indices, due to their robustness when measuring hydraulic habitat and water supply losses, is recommendable. Equations (2) and (3) display the RMSE for hydraulic habitat loss and water supply loss, respectively, where R is the release for water demand and D is the initial total water demand.
2.6. Selecting the Best Optimization Algorithm
Utilizing different evolutionary algorithms in the optimization process is essential. In fact, these algorithms might not be able to guarantee the global optimization. Thus, selecting the best optimal solution using the different algorithms might be a challenge in the proposed method. This study utilized the fuzzy technique of order preference similarity to the ideal solution (FTOPSIS) as a robust decision-making system to finalize the optimal ecological flow in the proposed framework. Figure 5 displays a flowchart of this method. Generally, a hierarchical structure is required to apply this method including goals, criteria and alternatives. Figure 6 displays the developed hierarchical structure for this study.
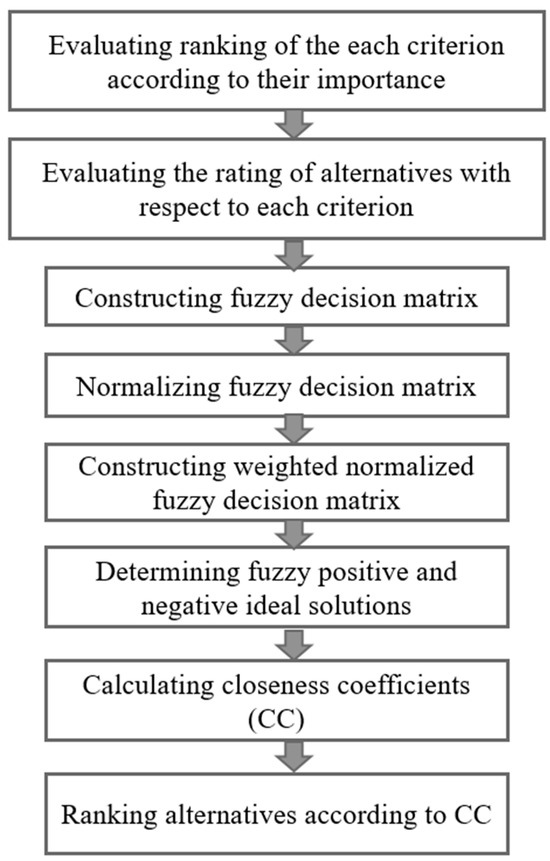
Figure 5.
Flowchart of FTOPSIS method as the decision-making system [36].
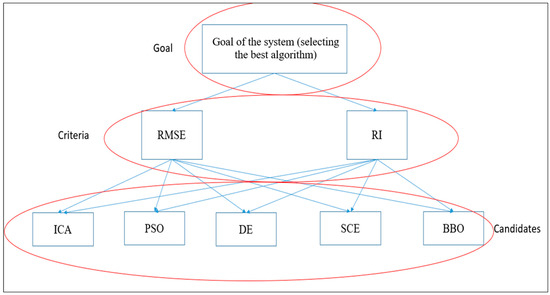
Figure 6.
Hierarchical structure of the FTOPSIS method in this study.
2.7. Case Study
The Talar River is one of the most important rivers in the Mazandaran Province, Iran, which was selected as the case study in this study. The main economic activity for the people in this river basin is agriculture. Hence, this river plays a key role in supplying irrigation demand in the basin. Moreover, the stream network of this basin is highly valuable in terms of ecological status. In fact, several native fish species utilize these habitats for reproduction and other biological activities such as searching for food. Due to considerable irrigation demand for the farms, there is a significant challenge in the ecological management of the river basin. On the one hand, farmers and the regional agricultural authority request maximum offstream flow, meaning instream flow might be reduced drastically. On the other hand, the Department of Environment tries to protect valuable river habitats by confining pumping in the river. Hence, negotiations between stakeholders and ecological managers are escalated in this regard. An assessment framework of the optimal ecological flow is required to mitigate water supply loss and ecological impacts at the river basin scale. In fact, farms are scattered in the basin and many pumping stations and diversion structures are installed to supply irrigation demand. Thus, it is necessary to use an advanced framework at the river basin scale to balance ecological impacts and water supply loss. Figure 7 displays the location of the Talar Basin, stream network and land use map.
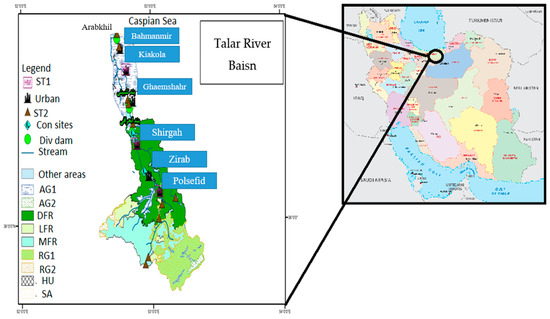
Figure 7.
Study area.
3. Results and Discussion
The results of implementing the proposed method in the case study are presented step by step in this section. Then, a full discussion of the results will be presented. Figure 8 displays a schematic view of the selected river reaches to identify the sensitive ecological reaches in which hydraulic habitat suitability should not be reduced considerably compared with the natural flow. As can be observed, five river reaches are selected for the hydraulic habitat simulation in the proposed method. Four tributaries are the main inflow to the river, which are reproduction habitats for the native fish species. Moreover, the selected reach downstream (simulated reach 5 or SR5) is the reproduction habitat for some species that need to migrate to the river for reproduction. In fact, if hydraulic habitat loss is minimized in the selected reaches, the river habitats can be protected. The simulation of hydraulic habitats in all the streams of the river network is ideal. However, it is not possible practically due to the required time and cost for simulating habitats. Hence, highly suitable areas in the selected river reaches could protect river habitats acceptably. This work carried out field observations in the simulated reach based on the proposed method in the previous section. Table 1 displays results of the field observations. Six main fish species have been recognized in the river basins, as displayed in Table 1. The normalized fish population of each species has been computed. The highest normalized fish population was considered as the target species for the hydraulic habitat simulation. It seems logical that the upstream tributaries are the habitats for cold-water fishes. For example, the brown trout (Salmo trutta) is the main species in the upstream tributaries and is one of the most well-known cold-water fishes. Based on the combination of microhabitat observations and expert opinions, verbal fuzzy rules were developed for the selected target species. For example, Table 2 shows part of the developed fuzzy rules for the Copoeta capoeta as the target species for SR4. According to the results of the verbal fuzzy rules, velocity might have a considerable effect on the hydraulic habitat suitability. However, the effect of depth and substrate on the hydraulic habitat suitability is undeniable. The results of this study corroborate the previous studies regarding the fuzzy hydraulic habitat simulation that highlighted the remarkable effect of velocity on the hydraulic habitat suitability.
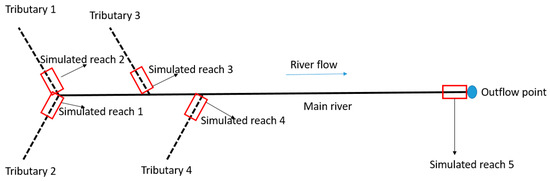
Figure 8.
Schematic view of the simulated reaches.

Table 1.
Results of selecting target species (normalized estimated population %).
Table 2.
Part of the developed verbal fuzzy rules for Capoeta capoeta (total number of rules is 27)—1, 2 and 3 mean low, medium and high, respectively.
Figure 9 displays the normalized weighted useable area (NWUA) functions as the main output of the hydraulic habitat simulation in the selected river reaches. The NWUA indicates the ideal ecological flow regime in the river. The regression model to develop final functions was used in the optimization system. The L3 regression model was the best correlated model for all the simulated reaches. The biological response of river habitats to the change in discharge in the rivers is not linear and demonstrates the necessity of using ecological-based methods to assess ecological flow. In other words, some methods such as hydrologic desktop methods consider a linear relationship between an increasing rate of flow and biological response in the habitats. In fact, these methods recommend that increasing ecological flow is appropriate in all hydrologic conditions. However, the developed NWUA functions in this study corroborate that hydrologic desktop methods are not reliable for assessing ecological flow.
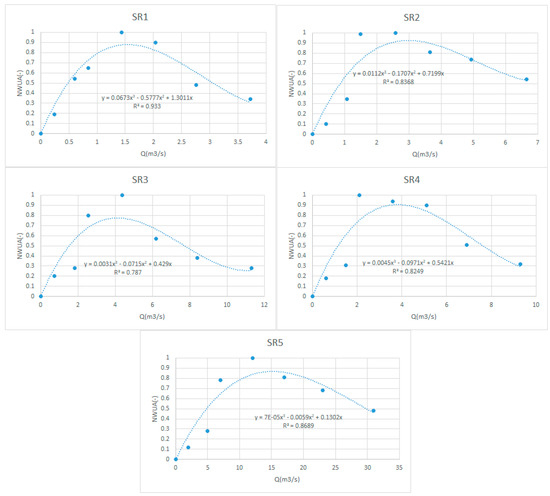
Figure 9.
Normalized weighted useable area function in the simulated reaches.
Another required input for the optimization model is the monthly flow time series of different hydrological conditions. Based on the stream drought index, Figure 10 displays a computed index in the long-term period that was used to calculate the average monthly time series in different hydrological condition including drought as well as normal. This study applied a long-term period in the past years in which instream flow was approximately the same as the natural flow. Thus, the outputs of the hydrological analysis might be reliable and robust for further applications. As presented, the mass balance method was utilized to generate flow time series in the selected reaches where hydrometric stations were not available. Figure 11 shows the flow time series at SR5 as a sample of the results of the hydrological analysis.
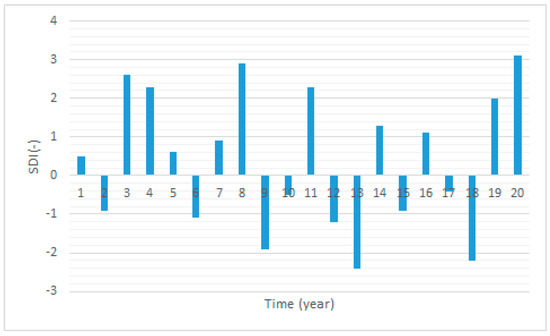
Figure 10.
Computed stream drought index in a long-term period.
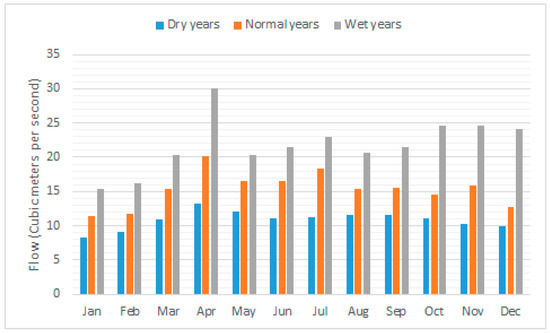
Figure 11.
Flow time series in the dry years, normal years and wet years.
Outputs of the optimization model are the main results of the developed model. As presented, this study utilized different evolutionary algorithms to optimize ecological flow in this study. Figure 12, Figure 13, Figure 14, Figure 15 and Figure 16 display the proposed ecological flow using different algorithms. The performance of the optimization algorithms might be very different in terms of ecological flow optimization in the developed method. However, the outputs of some algorithms are approximately similar. It demonstrates that utilizing a robust decision-making system is an important requirement for finalizing ecological flow regime in the developed method. As presented in the previous section, two indices were applied in the decision-making system including the RMSE for hydraulic habitat loss and reliability index for water supply in the river basin. Table 3 displays the RMSE for hydraulic habitat loss in the representative reaches in the case study. The performance of different algorithms is not similar in terms of hydraulic habitat loss. The highest RMSE is more than 0.5; this indicates that reducing the habitat suitability might be a serious concern in some simulated conditions. However, the optimization model can reduce the difference in habitat loss in the natural as well as real condition. In fact, a RMSE less than 0.2 might be considered as a perfect performance for the optimization model. Due to the significant difference between the performances of the optimization algorithms in terms of hydraulic habitat loss, the decision for finalizing the ecological flow regime should be based on the output of the FTOPSIS method. Furthermore, Table 4 displays the reliability index for water supply as another criterion in the decision-making system. It appears that the performance of the selected algorithms is approximately similar in terms of water supply. In fact, the performance of the algorithms is the same in terms of proposing total offstream flow. A lower reliability index in the dry years could be observed for all the algorithms, as seems logical. Changing the hydrological condition has a significant impact on the water supply. For example, the reliability index in the dry years is less than 40%, which is not favourable for the regional water authority. Conversely, the reliability index in the wet years is more than 75%, so is able to support most of the defined water demand in the case study. The weight of importance for the two criteria including the RMSE and reliability index were considered as very high and high, respectively. In fact, the priority of the optimization system is to protect river habitats. Hence, very high importance for the RMSE is logical and acceptable. However, water supply might be important as well. Thus, considering the reliability index to be of high importance might provide a fair balance between ecological requirements and water supply in the case study. Table 5 displays a rating of the alternatives in the case study as well. The solution for prioritizing the purposes in the optimization model is to determine CI1 and CI2 based on the weight of importance of each term in the objective functions. However, as highlighted, CI1 and CI2 were defined as one in this study, and the weight of importance was defined in the decision-making system to find the privileged optimization algorithm. Figure 17 displays the final ranking of the alternatives in the case study based on the closeness coefficient (CC) as the final output of the FTOPSIS method. Either PSO or DE is the privileged algorithm were used to assess the ecological flow regime in the case study. The final proposed ecological flow regime is shown in Figure 18.
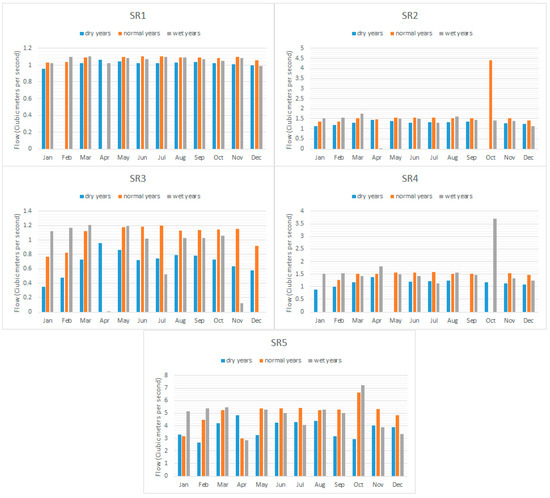
Figure 12.
Output of the optimization model proposed by ICA.
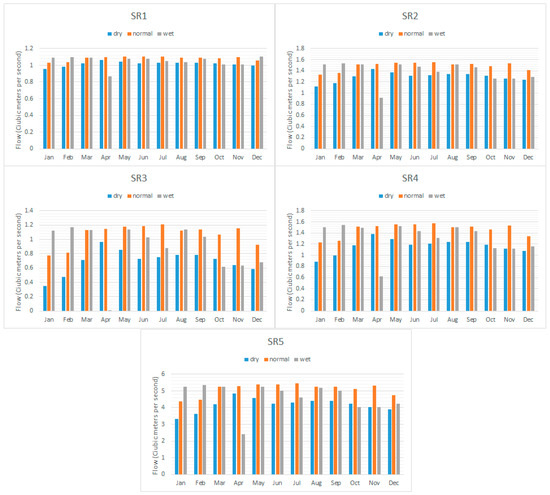
Figure 13.
Output of the optimization model proposed by PSO.
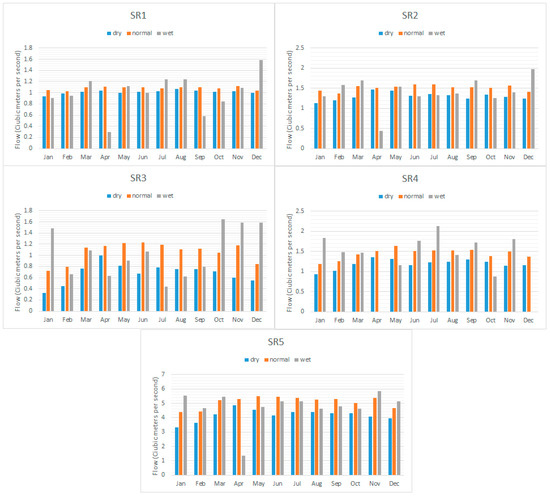
Figure 14.
Output of the optimization model proposed by DE.
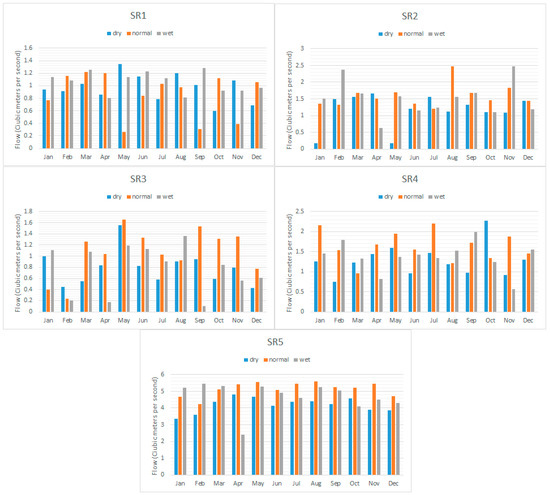
Figure 15.
Output of the optimization model proposed by SCE.
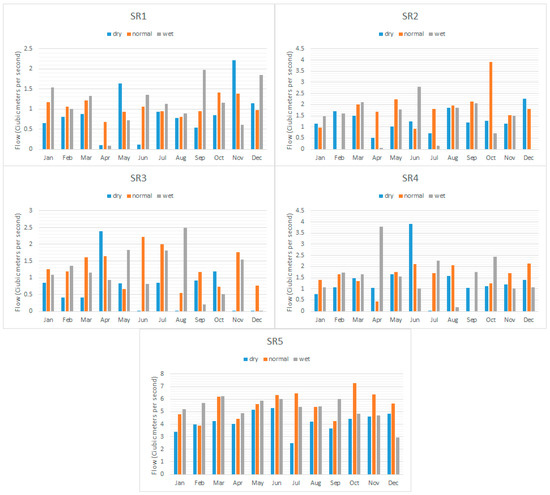
Figure 16.
Output of the optimization model proposed by BBO.
Table 3.
RMSE for hydraulic habitat loss in the simulated reaches.
Table 4.
RI for water supply loss by different algorithms.
Table 5.
Rating of alternatives in the case study using FTOPSIS method (VG, G and F mean very good, good and fair, respectively).
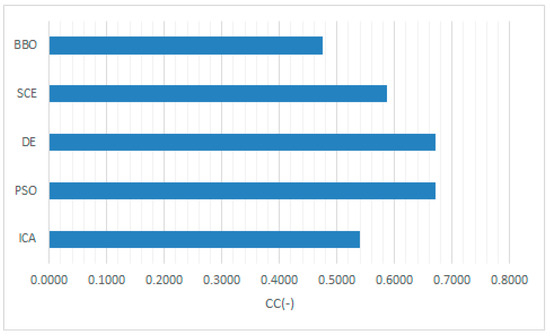
Figure 17.
Final ranking using the FTOPSIS method based on the closeness coefficient (CC).
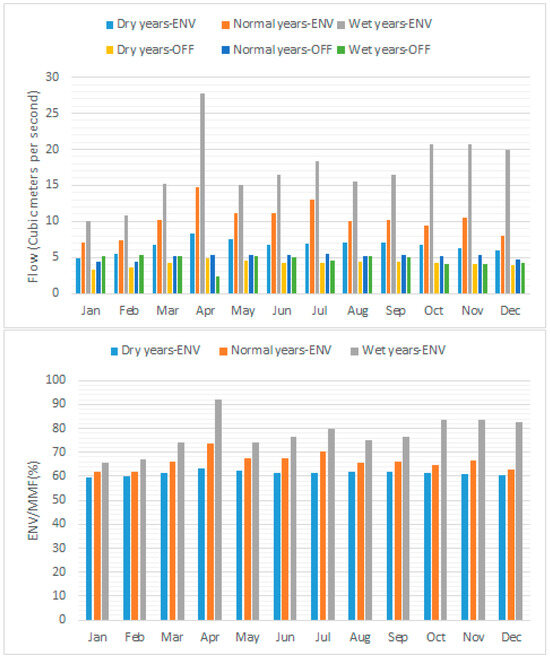
Figure 18.
Finalized ecological flow regime downstream of the river (SR5). MMF means monthly mean flow and ENV means ecological flow.
Due to using a complex method, a full discussion of the different aspects of the developed method is required. In fact, each system might have some advantages, drawbacks and limitations that should be noticed for use in practical projects. The fuzzy hydraulic habitat simulation used in the proposed method might be an appropriate option in many cases. However, other novel methods have been proposed in the literature that might be useable. For example, adaptive neuro-fuzzy inference systems (ANFIS)-based hydraulic habitat simulation is highlighted in the previous research works due to its robust performance in some case studies. One of the recommendations in the future studies for investigating technical aspects of the proposed method is to use ANFIS-based models instead of fuzzy hydraulic habitat simulation to compare the performance of the models for assessing ecological flow regimes. Using hydrological desktop methods should be stopped in future studies of ecological flow. In fact, these methods might generate incorrect optimal ecological flow due to their lack of ability to simulate the actual response of the river ecosystem to the changing rate of flow in the river.
The core of the proposed method is an optimization model that should be discussed in terms of technical considerations and computational aspects. This question as to why engineers should utilize decision-making systems in the optimization of ecological flow should be highlighted. The main shortcoming of evolutionary algorithms is their lack of ability to guarantee the global optimization, which means that these methods are not able to provide the optimal solution in the domain globally. This issue is highlighted especially in complex objective functions such as the developed function in this study. Thus, utilizing a robust decision-making system is inevitable in the optimization process. In fact, it is assumed that the optimization model is able to find the global optimization in the optimization process. However, it is not possible in practice. Hence, the decision-making system would come to be used as the post-processing step in the assessment of the ecological flow regime. The final output of the FTOPSIS method is only useable in the case study. In fact, defining the criteria and weight of importance is considerably effective on the final ranking of the methods. This study considered two criteria in this study based on the requirements of the case study. However, developing other criteria might be obligatory in other cases. Furthermore, the weight of importance should be considered based on the priorities in the case study. For instance, water supply might be more important than ecological flow in some cases. Hence, recommended optimization algorithms as the privileged algorithm for assessing ecological flow are only applicable for the case study.
Computational complexities are a critical aspect for utilizing the optimization system in water resources management. This term is defined as the required time and memory for finding the optimal solution in the domain. High computational complexities reduce the applicability and efficiency of the optimization model. In fact, a complex optimization system might need considerable running time to find the best solution. This might be a serious challenge for applying the optimization system in practice because it is needed to carry out numerous simulations or to cover a long-term period in practical projects. Hence, the required time and memory might increase drastically. One of the remarkable advantages of the proposed method is its low computational complexities. In fact, this research work used the final output of the fuzzy hydraulic habitat simulation in the optimization system to reduce the computational complexities. As discussed, using ANFIS-based models might be another option regarding hydraulic habitat simulation. One of the solutions is to apply an ANFIS-based model in the optimization directly. It might be applicable and robust in some cases. However, the computational complexities dramatically rise due to opening data-driven models in each time step. Hence, utilizing the proposed fuzzy hydraulic habitat method is advantageous in this regard.
As presented, the defined objective function in this study contains two main terms including ecological flow and water supply. The objective function tries to minimize water supply loss and ecological impacts simultaneously. Another option for developing the optimization model is to use a multi-objective model in which water supply and ecological flow terms could be defined as two objective functions. Then, an optimal solution could be obtained using multi-objective evolutionary algorithms such as multi-objective particle swarm optimization. In fact, aggregating two terms in a single-objective function might have some significant advantages. First, single-objective optimization algorithms might have lower computational complexities compared with the multi-objective algorithms. This study developed a flexible and upgradable system, which means that other types of data-driven models could be added to the system in future studies. Thus, it is important that complexities are minimized in practical projects. The proposed aggregated form is beneficial in this regard. Moreover, many classic and new generation algorithms have been developed in the form of the single objective. However, the limited number of algorithms has been addressed in the form of multi-objective algorithms. As discussed, one of the challenges in the application of evolutionary algorithms is that there is no guarantee for global optimization that indicates utilizing different algorithms is essential. The aggregated function is advantageous in this regard as well. In fact, applying different evolutionary algorithms is possible using the proposed objective function in this study.
The developed optimization model is applicable for river basins in which significant storage structures such as dams are not available. In the case study, no dam was available in the basin. However, many dams have been constructed on rivers in different countries. Thus, when using the proposed method for these basins, there is a need to revise the optimization model. In fact, the reservoir operation models should be combined with the developed method to optimize ecological flow in the basin scale. Reservoirs might be helpful for regulating ecological flow for time steps in which sufficient water is not available in the river. However, the construction of dams might have other significant impacts for the river ecosystem that should be addressed in the assessment of ecological flow.
Hydraulic habitat suitability should be considered in the assessment of ecological flow. Some previous studies demonstrate the considerable effect of hydraulic habitat suitability in the assessment of the ecological impacts in river basins. However, other factors might be effective as well. Other factors were not remarkably effective in our case study, though they should still be addressed in other case studies. For example, water quality might be a challenge for the management of many river basins which is effective in assessing ecological flow. Thus, water quality simulation should be added to the developed optimization system in these cases. Furthermore, sediment transport might change the geometry of the habitats in some cases. It is recommendable to add sediment transport modelling to the developed model in future studies. This work applied an improved IFIM model to assess ecological flow in which the optimization system and hydrologic analysis were added to the ecological flow model. However, other ecological-based methods have been highlighted in the previous research works as well. For example, building block methodology (BBM) is a known holistic method in which ecology, hydrology, groundwater issues and hydraulics could be considered in the assessment of ecological flow. This method originally could not be linked with optimization models. Utilizing this method might be advantageous in some cases. It is recommendable to focus on linking the BBM method with the developed optimization model in future studies.
The readers should consider that the daily flows are more important for aquatic life because the monthly flows can mask short periods of total lack of water in the riverbed. However, a daily approach is difficult in terms of computational effort as well as practical implementation. Hence, this research work applied the monthly approach. The environmental managers can design daily environmental flow regimes considering the recommended monthly flow regimes through the hydrological trends in each case study.
Climate change could be added to the optimization system as well. In fact, previous studies corroborate that the impact of climate change might alter stream flow significantly. Thus, the mean monthly flow in different hydrological conditions might be changed in future periods. The proposed method is advantageous in this regard. In fact, modified monthly flow due to the impact of climate change could be considered in the optimization model and might be helpful for long-term management of river basins. Moreover, connected river–wetland ecosystems might need other requirements in the assessment of ecological flow that should be added to the proposed system.
Hydrological desktop methods such as Tennant recommend 10% of mean annual flow as the minimum ecological flow in the rivers. However, this study demonstrates that 50% of mean monthly flow is the minimum assessed ecological flow. In contrast, some methods such as hydraulic rating methods might determine ecological flow without considering hydrological requirements in river basins. Thus, the proposed method is robust in terms of ecological and hydrological considerations. In fact, using integrated ecohydraulic methods is a reliable method to assess the ecological flow regime that should be utilized in the optimization model. In other words, assessment of ecological flow should be converted to the optimization of ecological flow. This study proposed a novel concept for assessing ecological flow by linking hydrology analysis, ecological modelling and optimization of water resources in river basins. This method is able to make the decision process easier in the basins. In fact, the lack of an optimization system might escalate conflicts of interest. In the proposed objective function, defining the weight of importance of each term (CI1 and CI2) based on the negotiations among stakeholders can be helpful to minimize conflicts. Finally, it should be discussed that most of the previous studies developed ecological flow models at the river reach scale, which might not be appropriate for use at the river basin scale because it is necessary to use acceptable mean habitat suitability at the watershed scale, which might not be assessable using the previous methods.
4. Concluding Remarks
This study developed an integrated ecohydraulic method to assess an ecological flow regime in which three components are linked. The first component is hydrological analysis in which the mean monthly flow in different hydrological conditions is assessed based on the stream drought index. The second component of the developed model is the ecological-based model in which fuzzy hydraulic habitat simulation is utilized to simulate hydraulic habitat loss in the selected reaches by considering selected target fish species. Finally, outputs of the hydraulic habitat simulation and hydrological analysis were used in the optimization model for the river basin in which minimizing ecological impacts and water supply loss were considered as the purposes. Based on the results in the case study, the optimization model is able to protect river habitats by assessing the ecological flow regime at all the control points. However, the RMSE for hydraulic habitat loss might not be perfect at all the control points. Furthermore, the reliability of water supply is acceptable especially in the normal years and wet years. In other words, the optimization system is able to balance the needs of the environment and water demand in the river basins fairly. Different algorithms were applied in the optimization process. Based on analysis of the decision-making system, either PSO or DE is the privileged algorithm used to optimize ecological flow in the case study.
Author Contributions
M.S. is responsible for writing the manuscript and the related programming and calculations, as well as data collection and curation. B.D. is responsible for reviewing and supervising the research work. All authors have read and agreed to the published version of the manuscript.
Funding
This research received no external funding.
Data Availability Statement
Some or all of the data and materials that support the findings of this study are available from the corresponding author upon reasonable request.
Conflicts of Interest
The authors declare no conflict of interest.
References
- Garrett, K.P.; McManamay, R.A.; Witt, A. Harnessing the power of environmental flows: Sustaining river ecosystem integrity while increasing energy potential at hydropower dams. Renew. Sustain. Energy Rev. 2023, 173, 113049. [Google Scholar] [CrossRef]
- Arthington, A.H.; Bunn, S.E.; Poff, N.L.; Naiman, R.J. The challenge of providing ecological flow rules to sustain river ecosystems. Ecol. Appl. 2006, 16, 1311–1318. [Google Scholar] [CrossRef] [PubMed]
- Tharme, R.E. A global perspective on ecological flow assessment: Emerging trends in the development and application of ecological flow methodologies for rivers. River Res. Appl. 2003, 19, 397–441. [Google Scholar] [CrossRef]
- Karimi, S.S.; Yasi, M.; Eslamian, S. Use of hydrological methods for assessment of ecological flow in a river reach. Int. J. Ecol. Sci. Technol. 2012, 9, 549–558. [Google Scholar]
- Karakoyun, Y.; Yumurtaci, Z.; Dönmez, A.H. Ecological flow assessment for energy generation sustainability employing different hydraulic evaluation methods: Çambaşi hydropower plant case study in Turkey. Clean Technol. Ecol. Policy 2016, 18, 583–591. [Google Scholar] [CrossRef]
- Sedighkia, M.; Ayyoubzadeh, S.A.; Hajiesmaeli, M. Modification of Tennant and Wetted Perimeter methods in Simindasht basin, Tehran province. Civ. Eng. Infrastruct. J. 2017, 50, 221–231. [Google Scholar]
- Sedighkia, M.; Abdoli, A.; Kaviani, S.; Nejat, F. Replacement of PHABISM univariate method by fuzzy approach as requirement for ecological flow assessment in rivers (case study, Jajrood river). J. Nat. Environ. 2020, 73, 327–339. [Google Scholar]
- Nikghalb, S.; Shokoohi, A.; Singh, V.P.; Yu, R. Ecological regime versus minimum ecological flow: Comparison of results for a river in a semi Mediterranean region. Water Resour. Manag. 2016, 30, 4969–4984. [Google Scholar] [CrossRef]
- Alvarez-Garreton, C.; Boisier, J.P.; Billi, M.; Lefort, I.; Marinao, R.; Barria, P. Protecting environmental flows to achieve long-term water security. J. Environ. Manag. 2023, 328, 116914. [Google Scholar] [CrossRef]
- Waddle, T. PHABSIM for Windows User’s Manual and Exercises; No. 2001-340; US Geological Survey: Reston, VA, USA, 2001. [Google Scholar]
- Railsback, S.F. Why it is time to put PHABSIM out to pasture. Fisheries 2016, 41, 720–725. [Google Scholar] [CrossRef]
- Noack, M.; Schneider, M.; Wieprecht, S. The Habitat modelling system CASiMiR: A multivariate fuzzy-approach and its applications. Ecohydraulics Integr. Approach 2013, 75–91. [Google Scholar]
- Sedighkia, M.; Abdoli, A.; Datta, B. Optimizing monthly ecological flow regime by a coupled fuzzy hydraulic habitat simulation–genetic algorithm method. Environ. Syst. Decis. 2021, 41, 425–436. [Google Scholar] [CrossRef]
- Stalnaker, C.B. The Instream Flow Incremental Methodology: A Primer for IFIM (Vol. 29); US Department of the Interior, National Biological Service, 1995. [Google Scholar]
- Tayfur, G. Modern optimization methods in water resources planning, engineering and management. Water Resour. Manag. 2017, 31, 3205–3233. [Google Scholar] [CrossRef]
- Azamathulla, H.M.; Wu, F.C.; Ab Ghani, A.; Narulkar, S.M.; Zakaria, N.A.; Chang, C.K. Comparison between genetic algorithm and linear programming approach for real time operation. J. Hydro-Environ. Res. 2008, 2, 172–181. [Google Scholar] [CrossRef]
- Ahmad, A.; El-Shafie, A.; Razali, S.F.M.; Mohamad, Z.S. Reservoir optimization in water resources: A review. Water Resour. Manag. 2014, 28, 3391–3405. [Google Scholar] [CrossRef]
- Bazaraa, M.S.; Sherali, H.D.; Shetty, C.M. Nonlinear Programming: Theory and Algorithms; John Wiley & Sons: Hoboken, NJ, USA, 2013. [Google Scholar]
- Zhao, T.; Zhao, J.; Lei, X.; Wang, X.; Wu, B. Improved Dynamic Programming for Reservoir Flood Control Operation. Water Resour. Manag. 2017, 31, 2047–2063. [Google Scholar] [CrossRef]
- Maier, H.R.; Razavi, S.; Kapelan, Z.; Matott, L.S.; Kasprzyk, J.; Tolson, B.A. Introductory overview: Optimization using evolutionary algorithms and other metaheuristics. Ecol. Model. Softw. 2019, 114, 195–213. [Google Scholar] [CrossRef]
- Dokeroglu, T.; Sevinc, E.; Kucukyilmaz, T.; Cosar, A. A survey on new generation metaheuristic algorithms. Comput. Ind. Eng. 2019, 137, 106040. [Google Scholar] [CrossRef]
- Jahandideh-Tehrani, M.; Bozorg-Haddad, O.; Loáiciga, H.A. A review of applications of animal-inspired evolutionary algorithms in reservoir operation modelling. Water Environ. J. 2021, 35, 628–646. [Google Scholar] [CrossRef]
- Rashedi, E.; Nezamabadi-Pour, H.; Saryazdi, S. GSA: A gravitational search algorithm. Inf. Sci. 2009, 179, 2232–2248. [Google Scholar] [CrossRef]
- Moeini, R.; Soltani-Nezhad, M. Extension of the Constrained Gravitational Search Algorithm for Solving Multi-Reservoir Operation Optimization Problem. J. Ecol. Inform. 2020, 36, 70–81. [Google Scholar] [CrossRef]
- Samadi-koucheksaraee, A.; Ahmadianfar, I.; Bozorg-Haddad, O.; Asghari-pari, S.A. Gradient evolution optimization algorithm to optimize reservoir operation systems. Water Resour. Manag. 2019, 33, 603–625. [Google Scholar]
- Dahmani, S.; Yebdri, D. Hybrid algorithm of particle swarm optimization and Grey Wolf optimizer for reservoir operation management. Water Resour. Manag. 2020, 34, 4545–4560. [Google Scholar] [CrossRef]
- Yaseen, Z.M.; Allawi, M.F.; Karami, H.; Ehteram, M.; Farzin, S.; Ahmed, A.N.; Koting, S.B.; Mohd, N.S.; Jaafar, W.Z.B.; Afan, H.A.; et al. A hybrid bat–swarm algorithm for optimizing dam and reservoir operation. Neural Comput. Appl. 2019, 31, 8807–8821. [Google Scholar] [CrossRef]
- Poff, N.L.; Richter, B.D.; Arthington, A.H.; Bunn, S.E.; Naiman, R.J.; Kendy, E.; Acreman, M.; Apse, C.; Bledsoe, B.P.; Freeman, M.C.; et al. The ecological limits of hydrologic alteration (ELOHA): A new framework for developing regional ecological flow standards. Freshw. Biol. 2010, 55, 147–170. [Google Scholar] [CrossRef]
- Le Coarer, Y.; Harby, A.; Baptist, M.; Dunbar, M.J.; Schmutz, S. State-of-the-Art in Data Sampling, Modelling Analysis and Applications of River Habitat Modelling. Ph.D. Thesis, Irstea, 2004. [Google Scholar]
- Harrelson, C.C. Stream Channel Reference Sites: An Illustrated Guide to Field Technique; US Department of Agriculture, Forest Service, Rocky Mountain Forest and Range Experiment Station: Fort Collins, CO, USA, 1994; Volume 245. [Google Scholar]
- Akbari, H.; Rakhshandehroo, G.; Sharifloo, A.H.; Ostadzadeh, E. Drought Analysis Based on Standardized Precipitation Index (SPI) and Streamflow Drought Index (SDI) in Chenar Rahdar River Basin, Southern Iran; American Society of Civil Engineers: Reston, VA, USA, 2015; pp. 11–22. [Google Scholar]
- Marini, F.; Walczak, B. Particle swarm optimization (PSO). A tutorial. Chemom. Intell. Lab. Syst. 2015, 149, 153–165. [Google Scholar] [CrossRef]
- Qin, A.K.; Huang, V.L.; Suganthan, P.N. Differential evolution algorithm with strategy adaptation for global numerical optimization. IEEE Trans. Evol. Comput. 2008, 13, 398–417. [Google Scholar] [CrossRef]
- Gao, X.; Cui, Y.; Hu, J.; Xu, G.; Wang, Z.; Qu, J.; Wang, H. Parameter extraction of solar cell models using improved shuffled complex evolution algorithm. Energy Convers. Manag. 2018, 157, 460–479. [Google Scholar] [CrossRef]
- Simon, D. Biogeography-based optimization. IEEE Trans. Evol. Comput. 2008, 12, 702–713. [Google Scholar] [CrossRef]
- Chen, C.T. Extensions of the TOPSIS for group decision-making under fuzzy environment. Fuzzy Sets Syst. 2000, 114, 1–9. [Google Scholar] [CrossRef]
Disclaimer/Publisher’s Note: The statements, opinions and data contained in all publications are solely those of the individual author(s) and contributor(s) and not of MDPI and/or the editor(s). MDPI and/or the editor(s) disclaim responsibility for any injury to people or property resulting from any ideas, methods, instructions or products referred to in the content. |
© 2023 by the authors. Licensee MDPI, Basel, Switzerland. This article is an open access article distributed under the terms and conditions of the Creative Commons Attribution (CC BY) license (https://creativecommons.org/licenses/by/4.0/).