

Peering into a Simplified Digestor for Households: Performance, Cost and Carbon-Neutral Niche

 ,
,
Abstract
:1. Introduction
2. Materials and Methodology
2.1. Source of Cattle Manure and Liquid Slurry
2.2. Configuration of Plastic Tank Modified Digestor
2.3. Substrate Feedings
2.4. Analytical Approach
2.5. Evaluation of Economic and Environmental Efficiency
3. Results
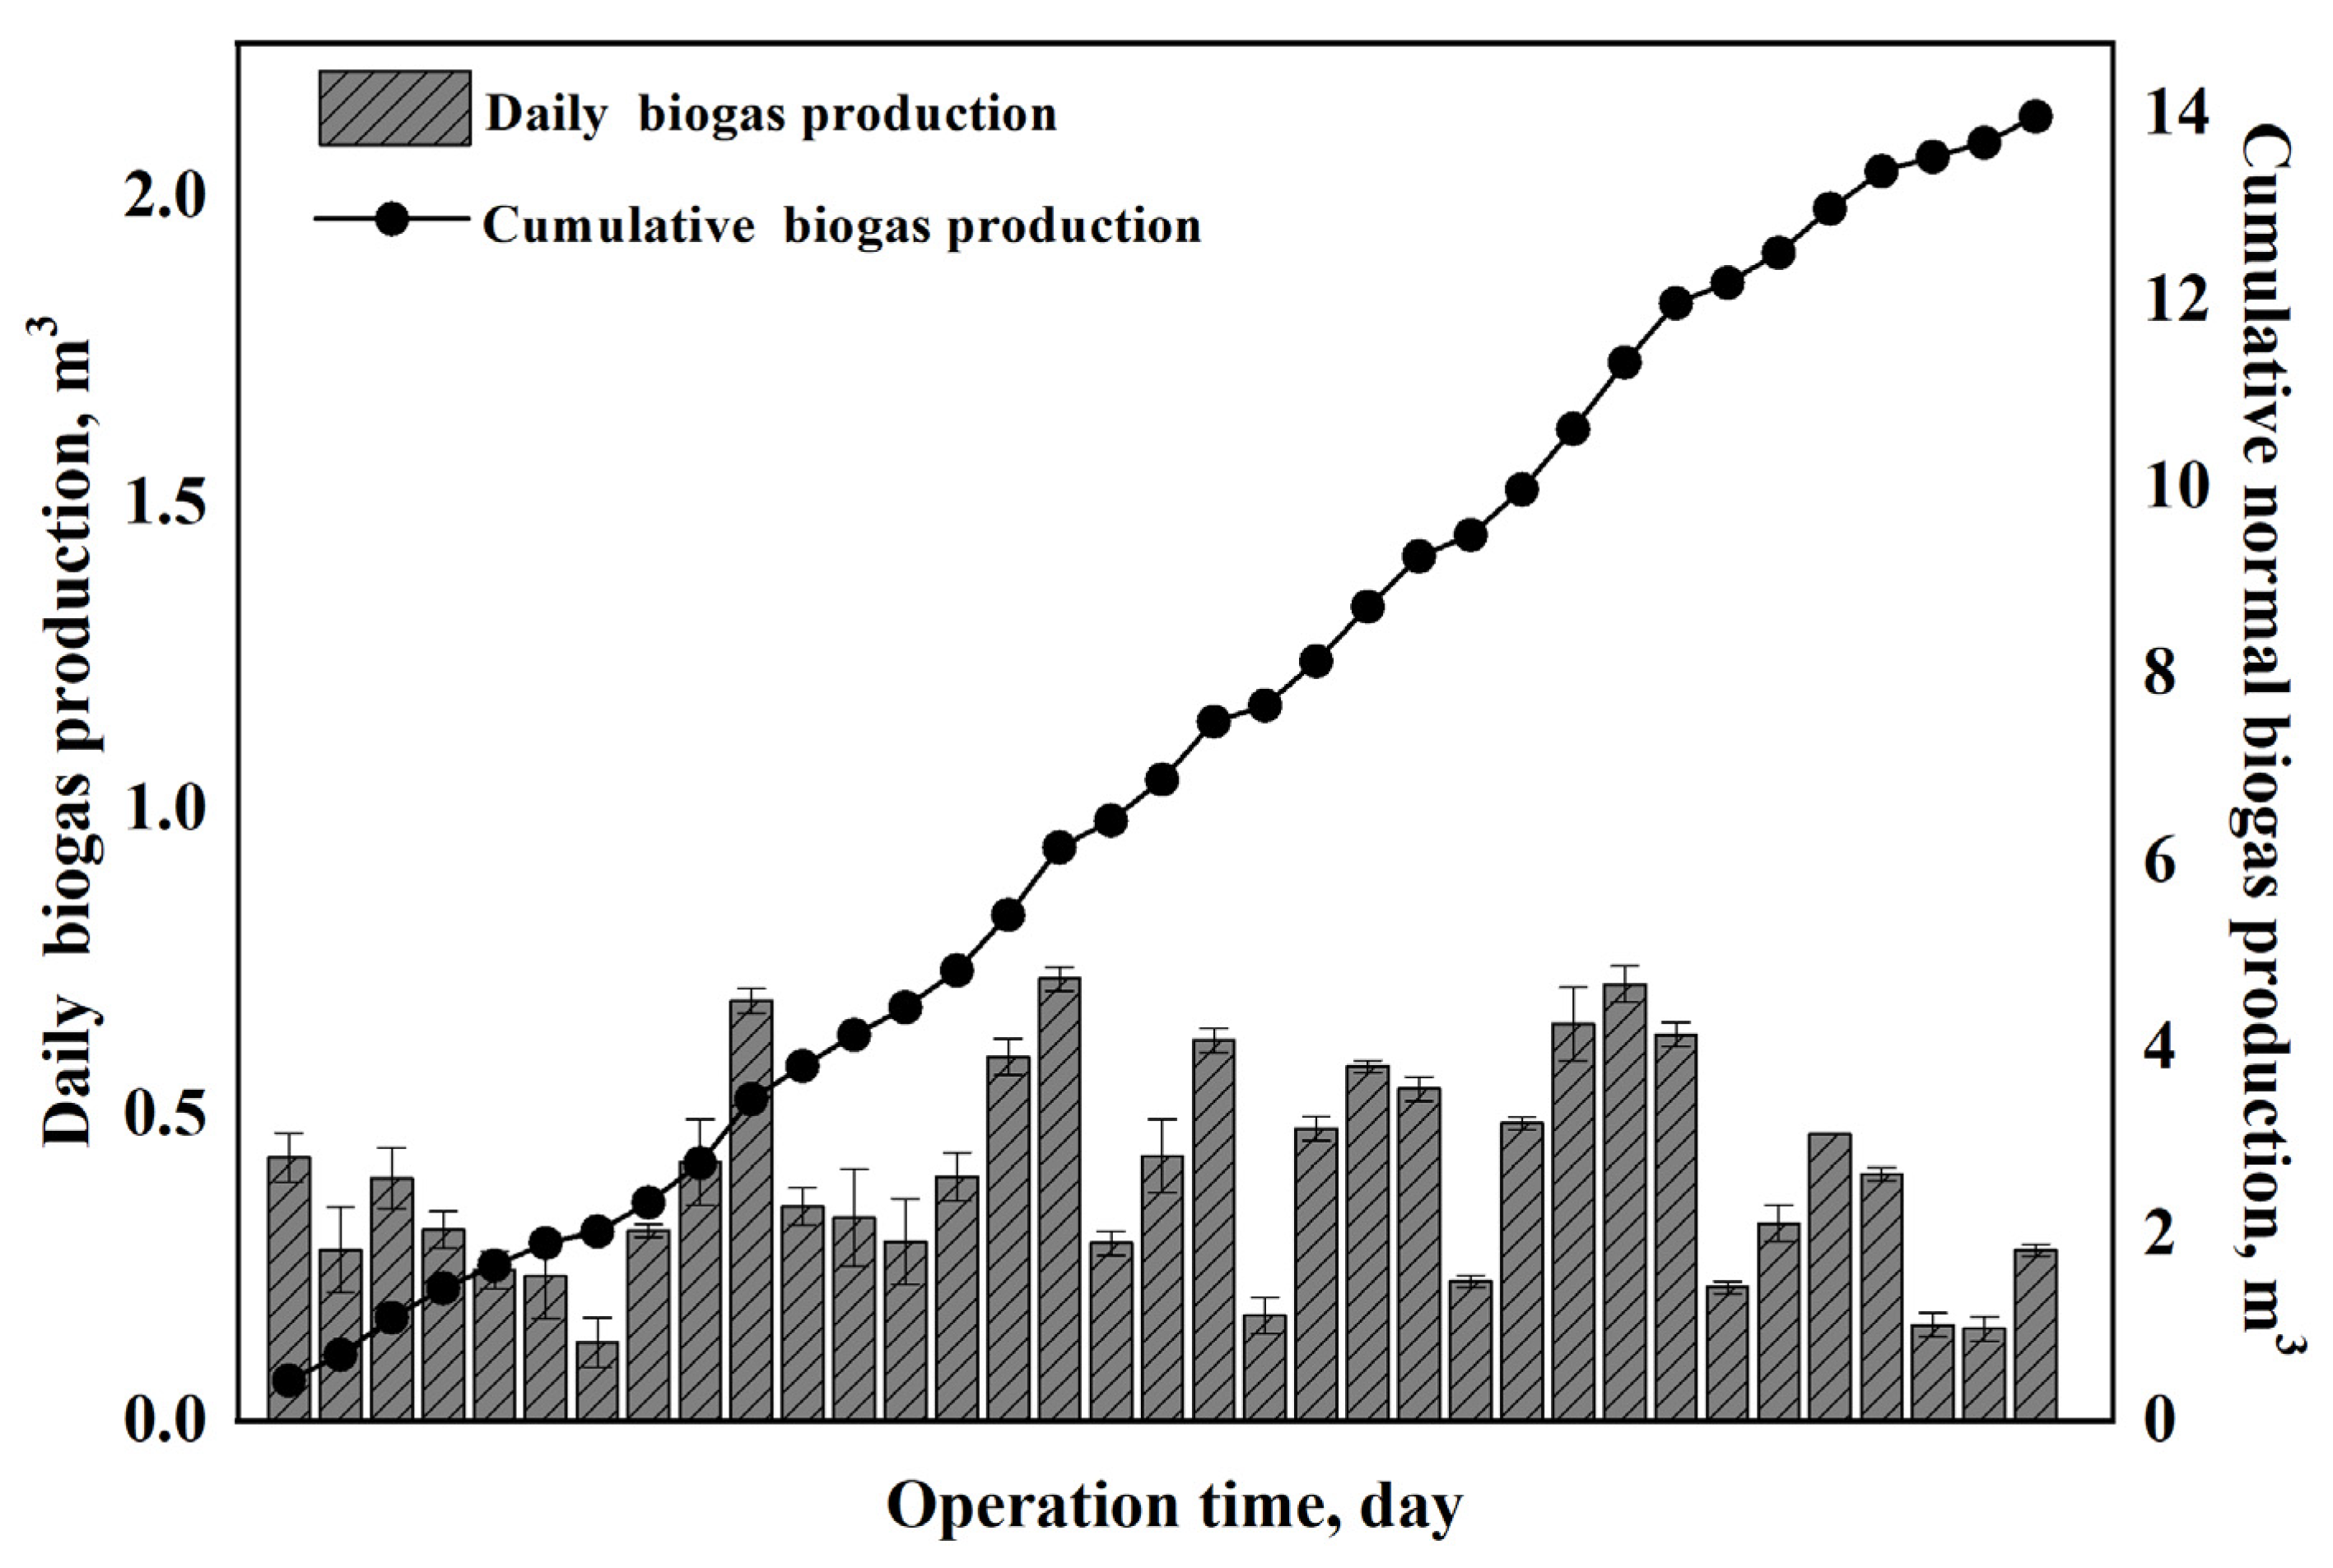
3.1. Biogas Yield
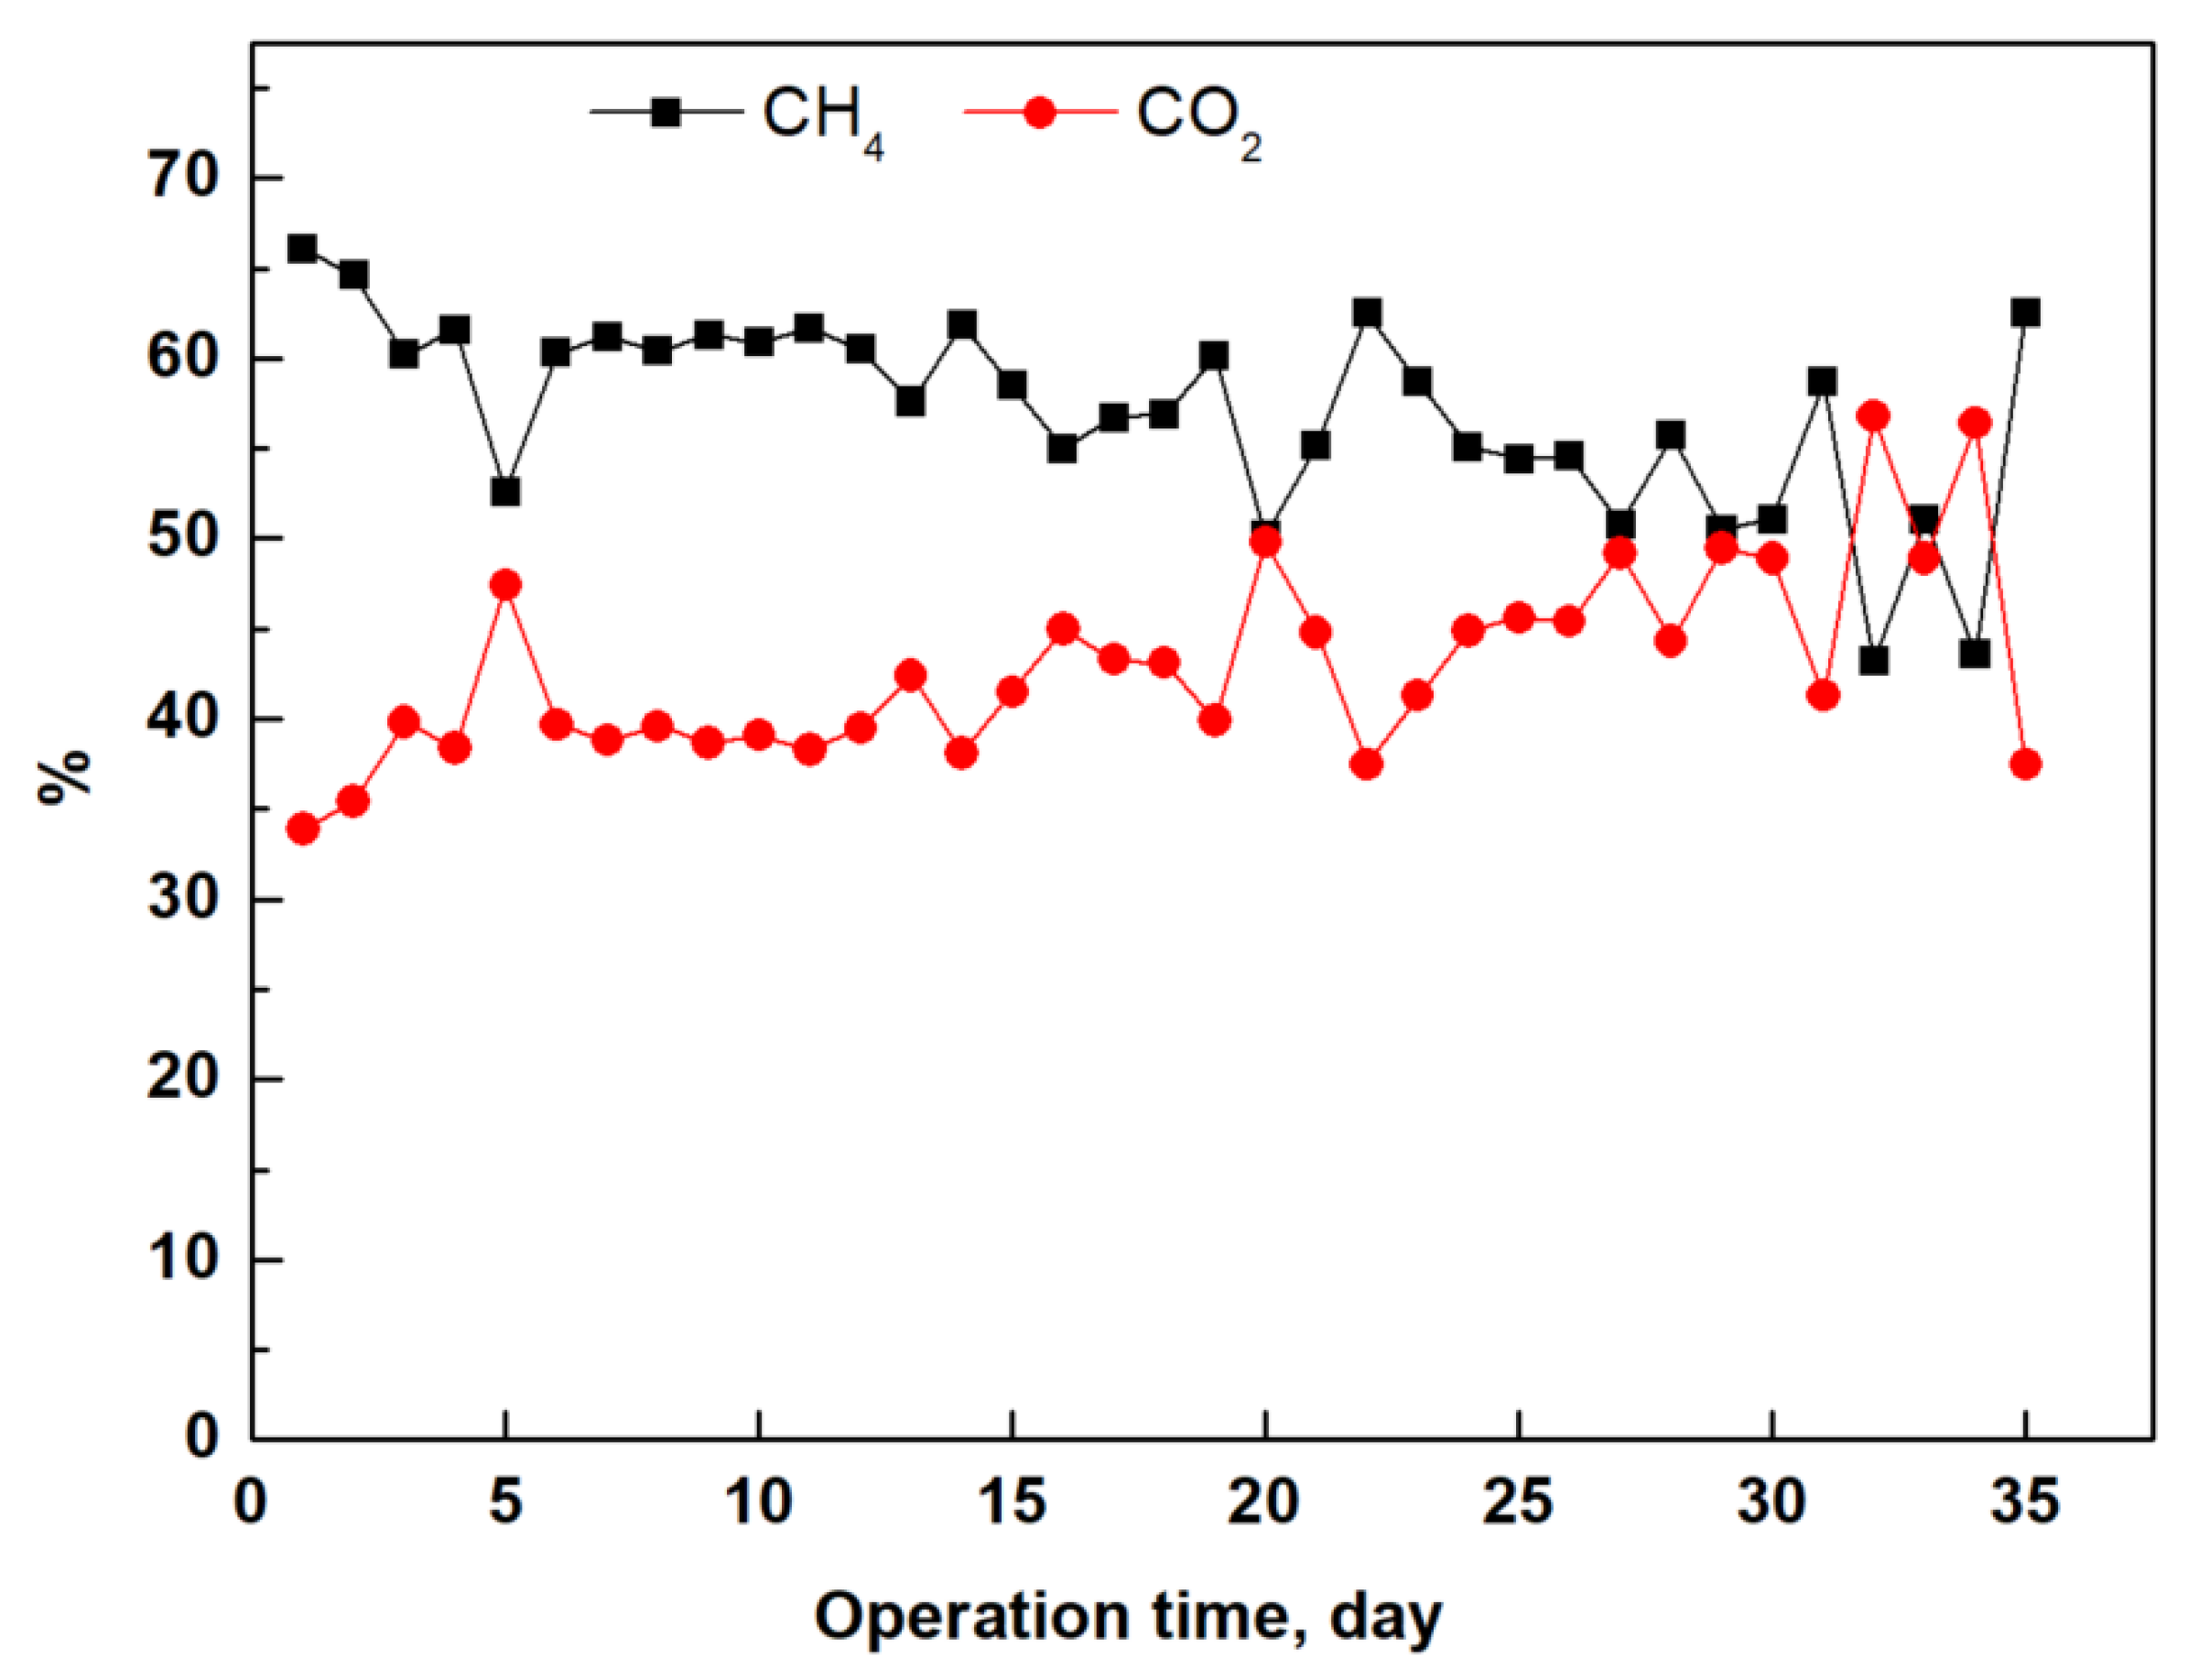
3.2. Biogas Characterization
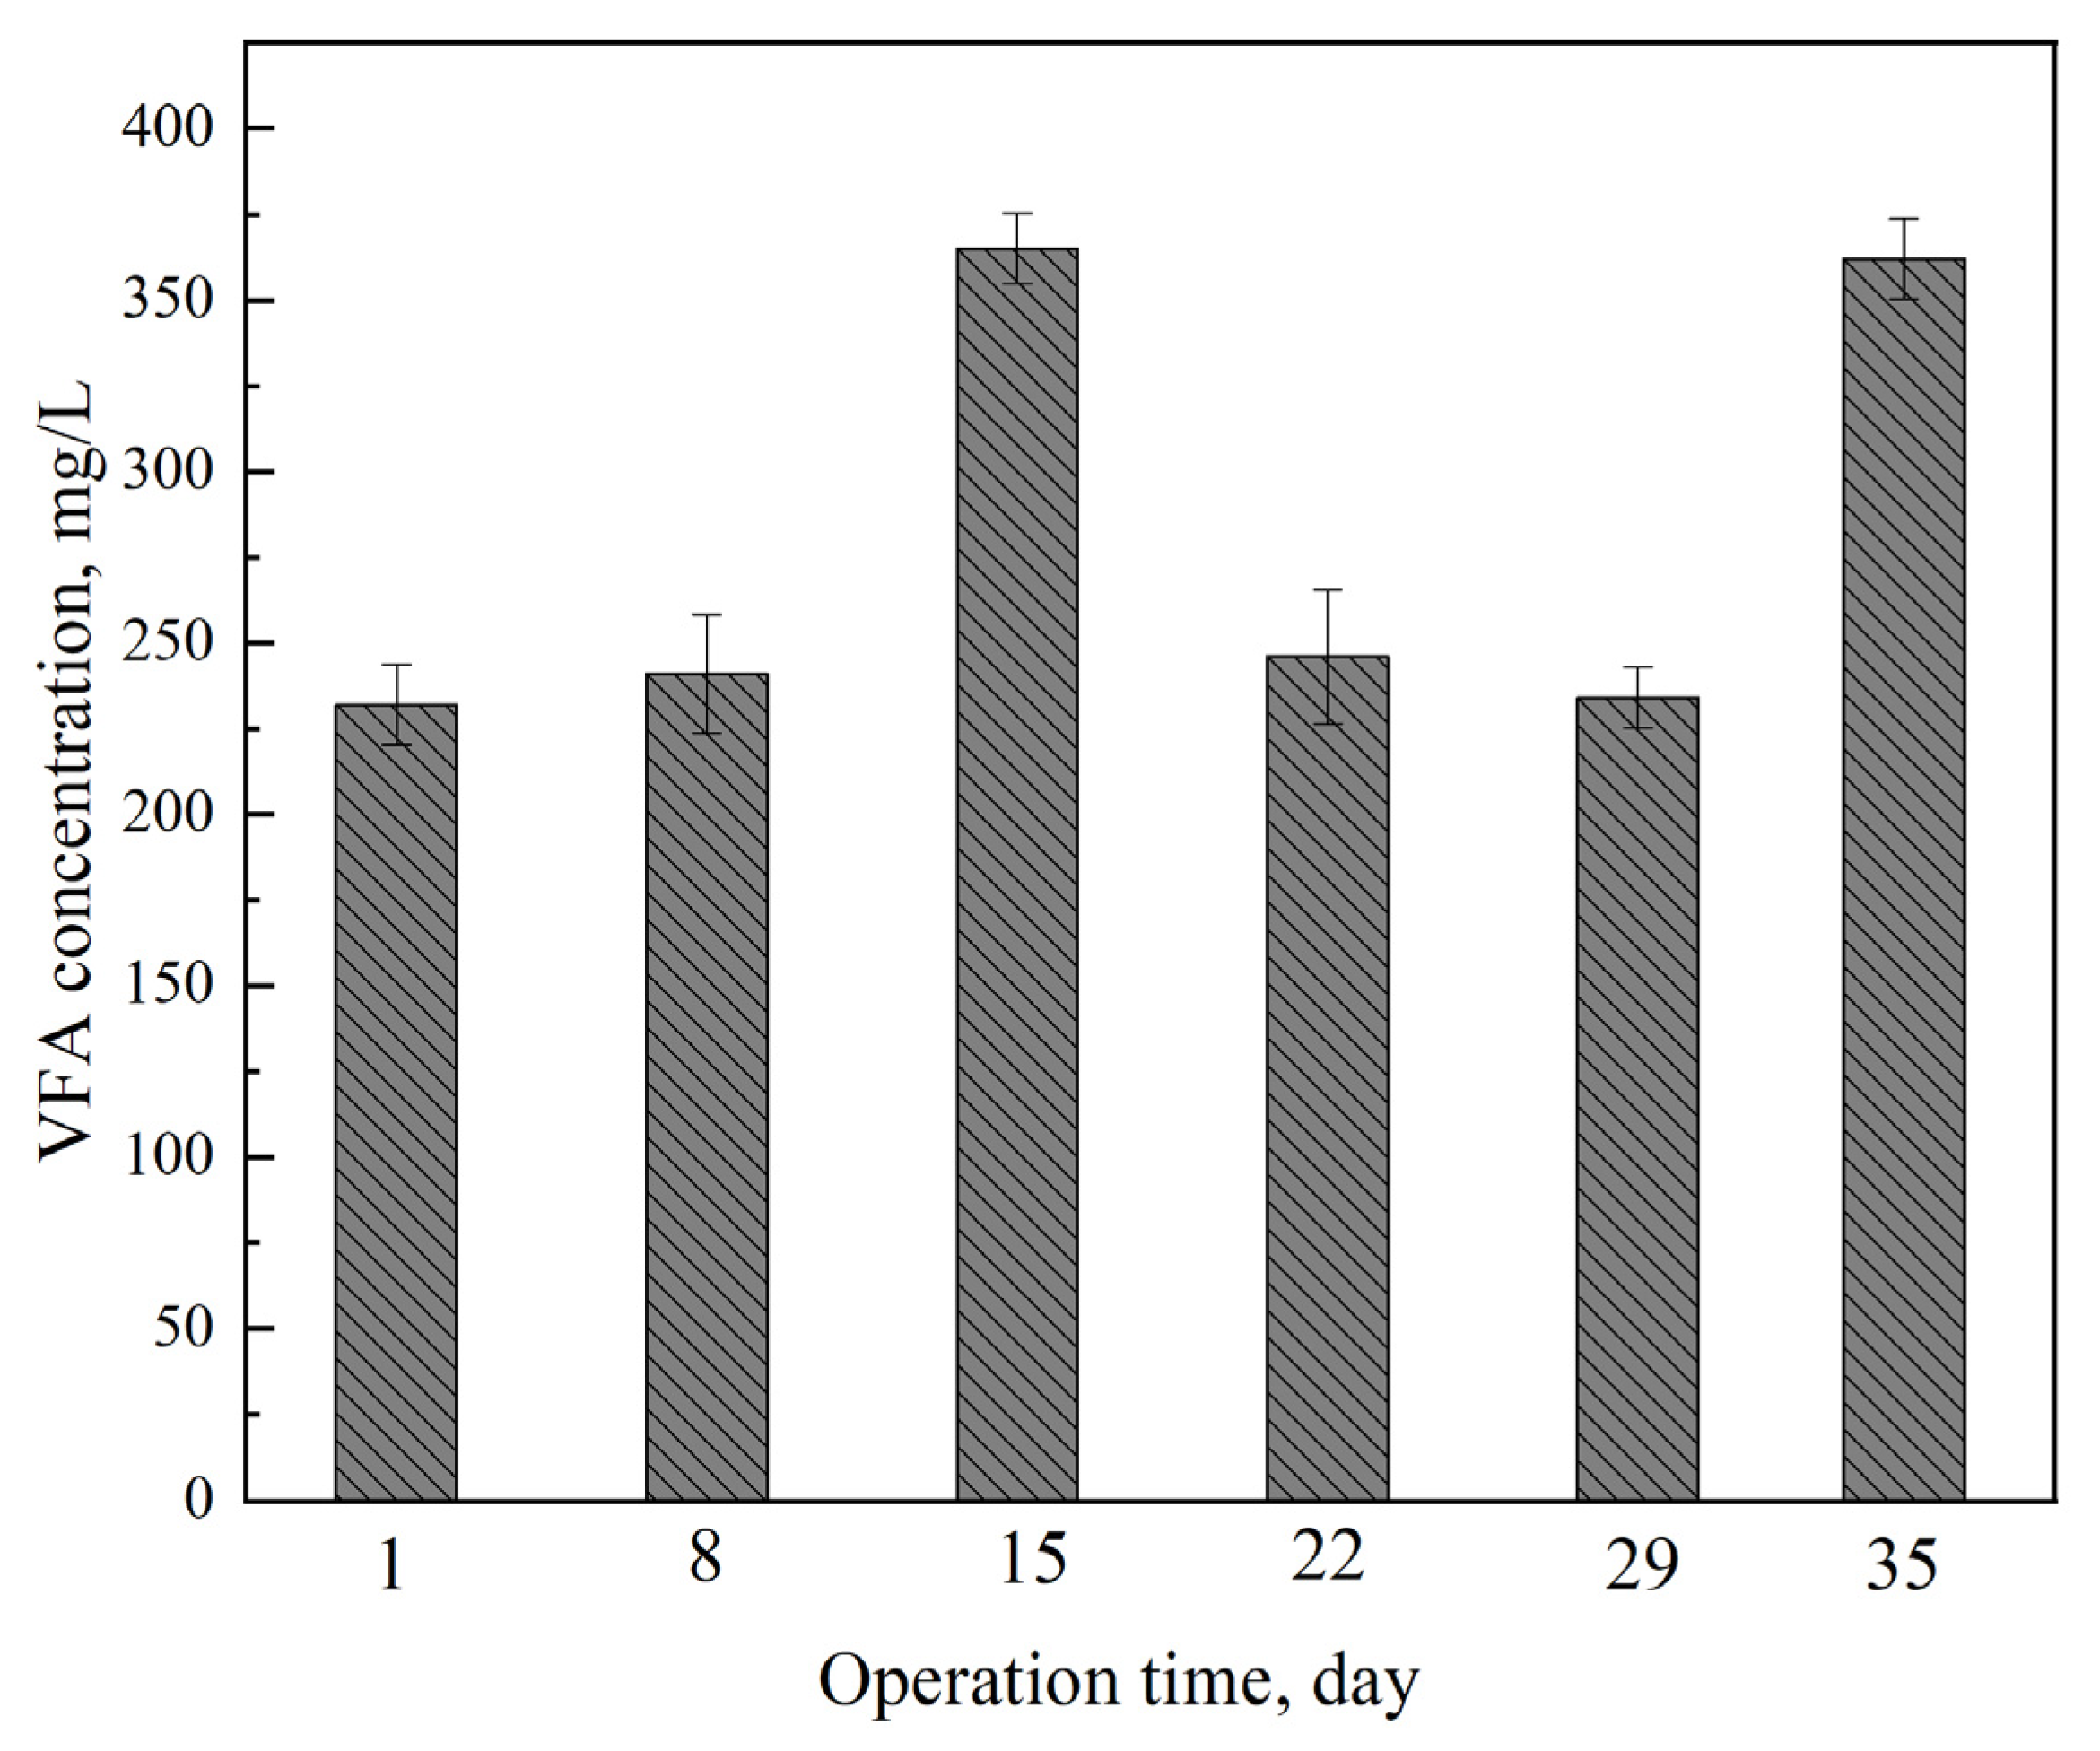
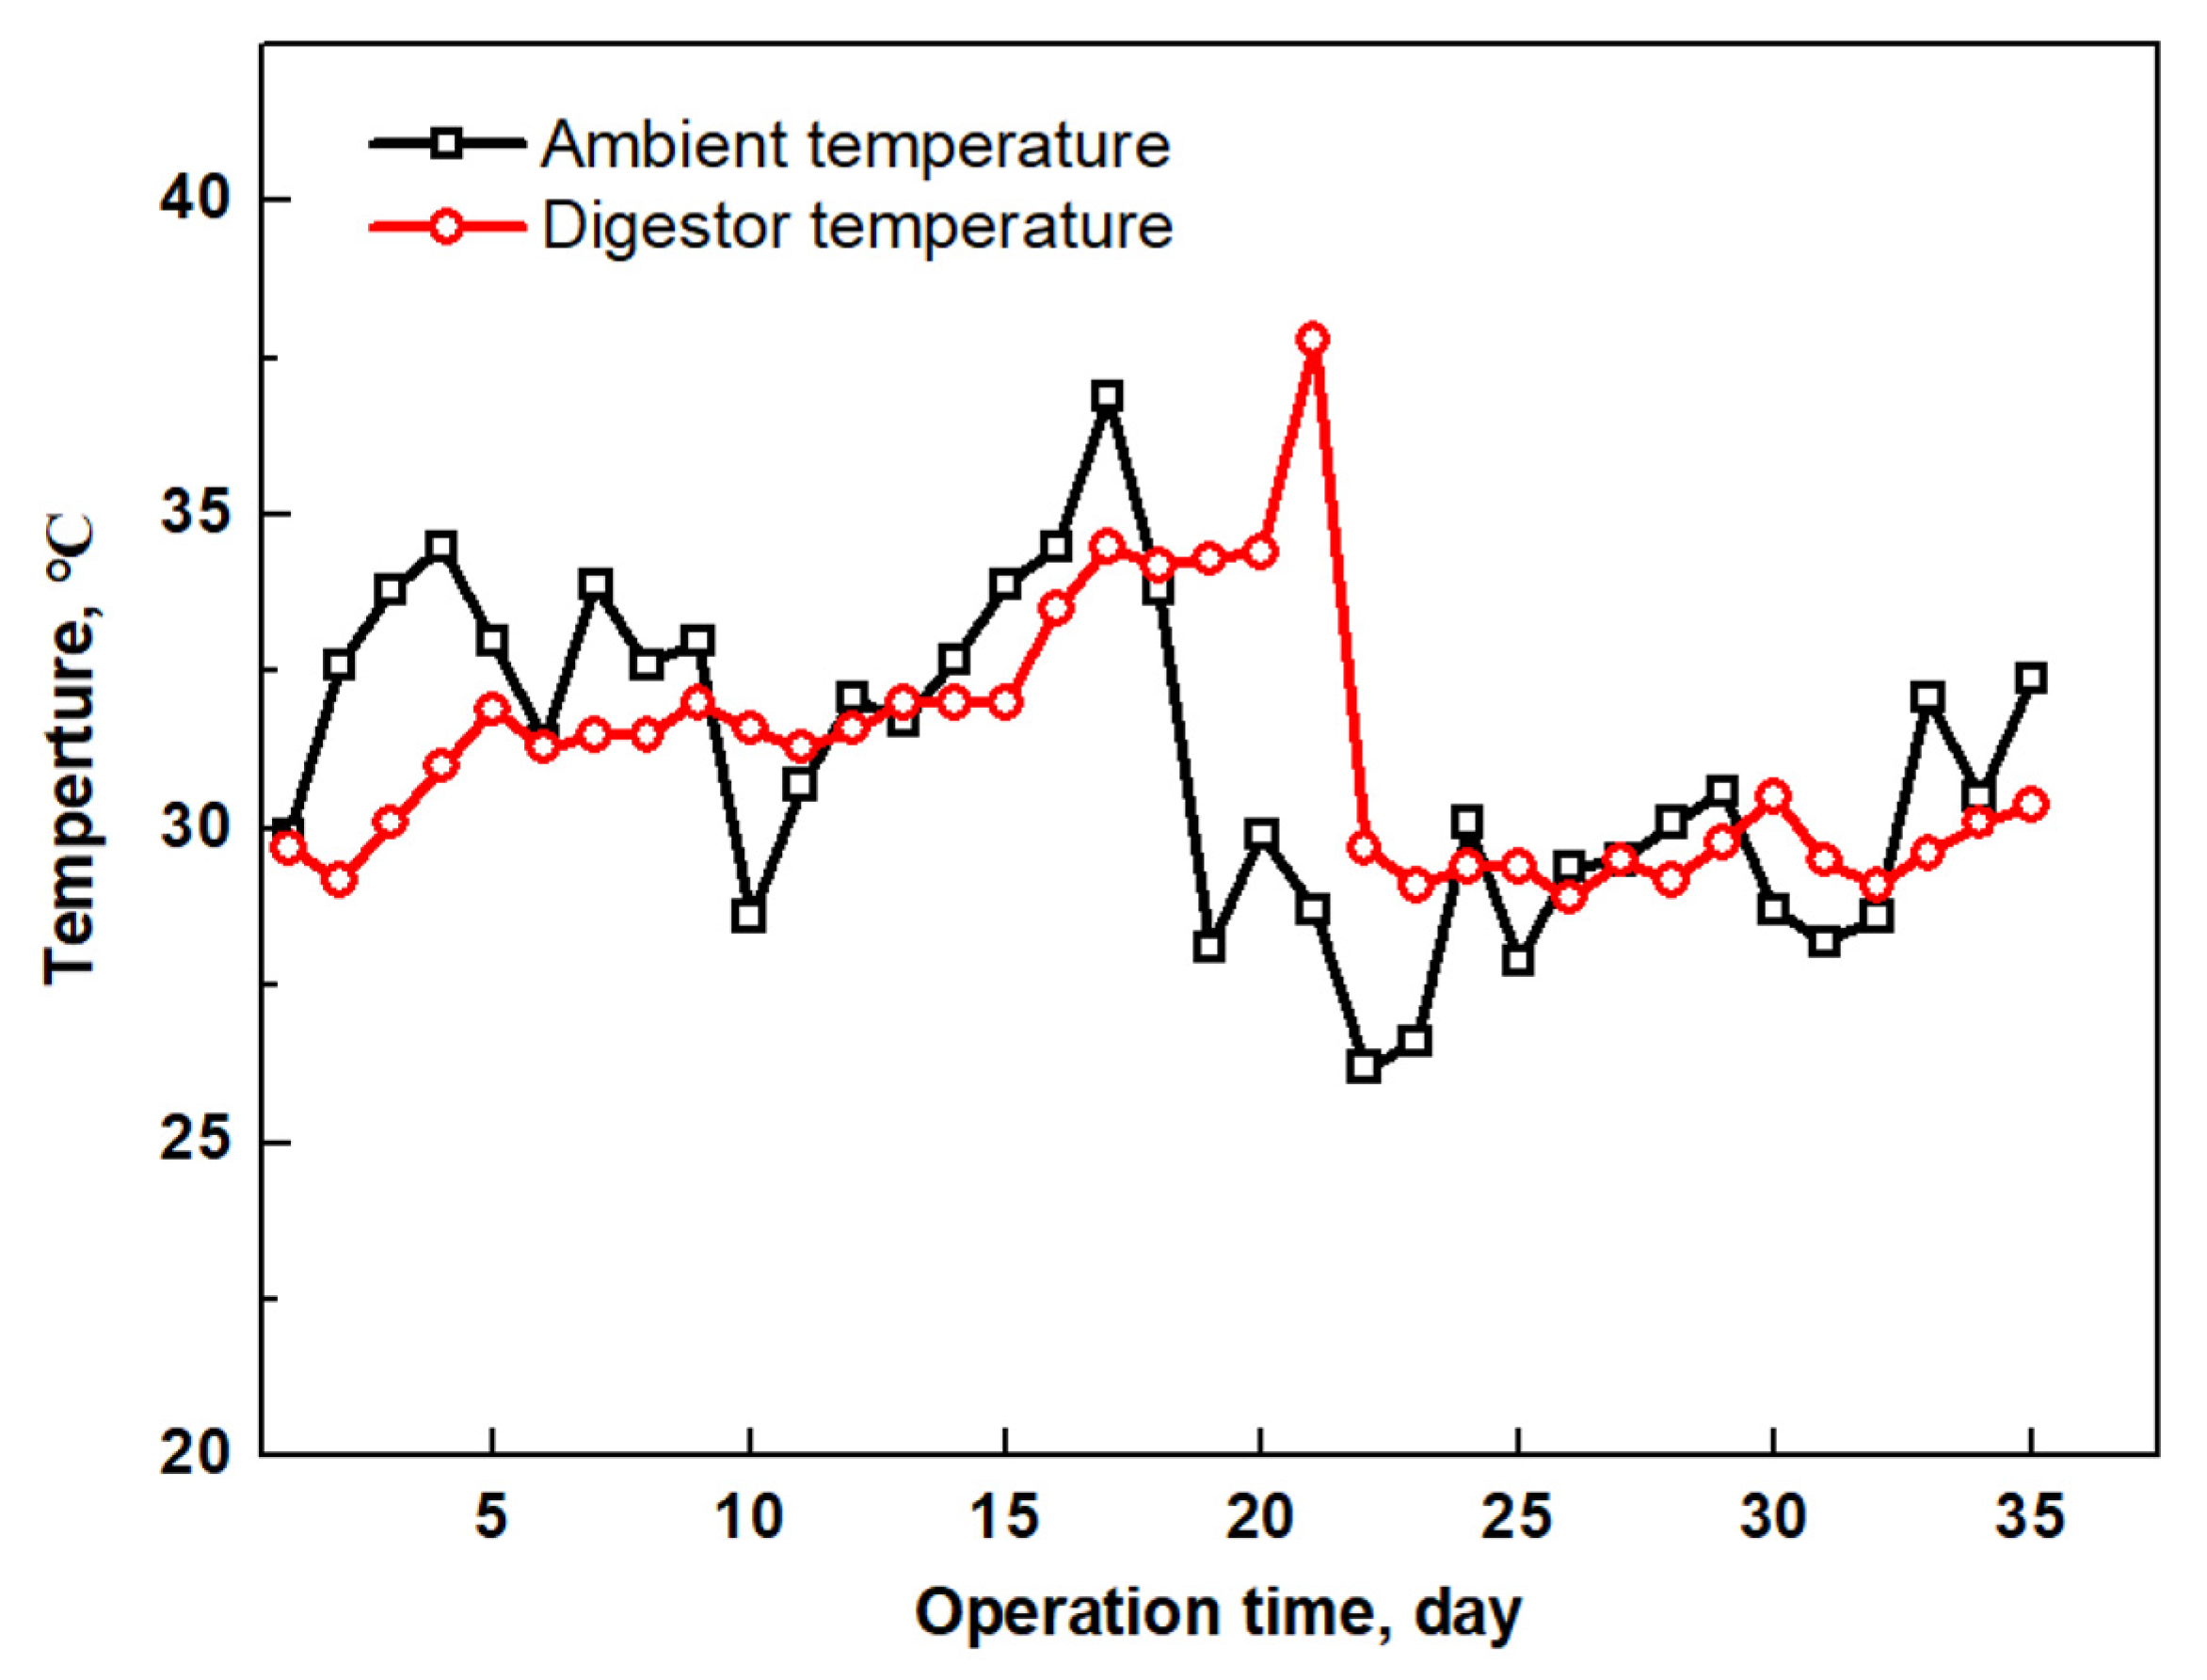
3.3. Temperature, Volatile Fatty Acid Variation
3.4. Economic and Environmental Efficiency
4. Discussion

| Digestor | Feedstock | Dilution | T | V | HRT | OLR | Biogas Production Rate | CH4 | Reference |
|---|---|---|---|---|---|---|---|---|---|
| (°C) | (m3) | (d) | kg VS/m3/d | Nm3biogas/m3digestor/d | (%) | No. | |||
| Cylindrical HDPE | Cow manure | Recirculated digestate | 37 | 1 | 35 | 1.11–2.11 | 0.42–0.49 | 54–61 | This work |
| Tubular PE or PVC | Cow manure | water | <25 | 2.4–7.5 | 60–90 | 0.22–1.29 | 0.07–0.47 | 65 | [14] |
| Tubular PVC | Pig manure | water | <25 | 7.5 | 75 | 0.59 | 0.04 | 60 | [29] |
| Tubular PVC | Cow/pig manure | water | <25 | 7.5 | 60–90 | 0.34–1 | 0.03–0.12 | 55–60 | [41] |
| Tubular neoprene | Cattle dung | water | <25 | 1.2 | 55 | <1 | 0.50 | 55 | [42] |
| Fixed dome | 0.68 | ||||||||
| Fixed dome | Cattle dung | water | <25 | 2.4 | 55 | <1 | 0.4–0.7 | 55–60 | [43] |
| Fixed dome | Cattle dung | water | <25 | 2 | 55 | <1 | 0.35–0.45 | 55–60 | [44] |
| Fixed dome | Cattle/sheep dung | water | <25 | 9.5 | 45 | 0.38 | 0.34–0.5 | 60 | [45] |
5. Conclusions
6. Highlights
- Field observation on a locally manufactured household digestor was carried out.
- The cattle manure-to-slurry ratio was optimized during operation.
- Biogas production efficiency and feasibility were revealed.
- The prototype’s cost-efficiency and carbon-neutral niche was evaluated in nationwide scope.
- Theoretical support was provided for low-cost anaerobic digestor development.
Author Contributions
Funding
Data Availability Statement
Acknowledgments
Conflicts of Interest
Abbreviations
| HDPE | High-density polyethylene |
| AD | Anaerobic digestion |
| TS | Total solids |
| VS | Volatile solids |
| HRT | Hydraulic retention time |
| VFA | Volatile fatty acid |
| TCOD | Total chemical oxygen demand |
| SCOD | Soluble chemical oxygen demand |
| BNR | Biological nutrient removal |
| OL | Organic loading |
| Nitrogen loading | |
| LCA | Life cycle analysis |
| GHG | Greenhouse gas |
| GWP | Global warming potential |
| EF | Emission factor |
| MT | Million ton |
| OLR | Organic loading rate |
References
- Salam, S.; Parvin, R.; Salam, M.A.; Azad, S.M. Feasibility study for biogas generation from household digesters in Bangladesh: Evidence from a household level survey. Int. J. Energy Econ. Policy 2020, 4, 23–30. [Google Scholar] [CrossRef]
- Siddiki, S.Y.A.; Uddin, M.N.; Mofijur, M.; Fattah, I.M.R.; Ong, H.C.; Lam, S.S.; Kumar, P.S.; Ahmed, S.F. Theoretical calculation of biogas production and greenhouse gas emission reduction potential of livestock, poultry and slaughterhouse waste in Bangladesh. J. Environ. Chem. Eng. 2021, 9, 105204. [Google Scholar] [CrossRef]
- Tasnim, F.; Iqbal, S.A.; Chowdhury, A.R. Biogas production from anaerobic co-digestion of cow manure with kitchen waste and Water Hyacinth. Renew. Energy 2017, 109, 434–439. [Google Scholar] [CrossRef]
- Huang, X.; Yun, S.; Zhu, J.; Du, T.; Zhang, C.; Li, X. Mesophilic anaerobic co-digestion of aloe peel waste with dairy manure in the batch digester: Focusing on mixing ratios and digestate stability. Bioresour. Technol. 2016, 218, 62–68. [Google Scholar] [CrossRef] [PubMed]
- Xiao, B.; Zhang, W.; Yi, H.; Qin, Y.; Wu, J.; Liu, J.; Li, Y.-Y. Biogas production by two-stage thermophilic anaerobic co-digestion of food waste and paper waste: Effect of paper waste ratio. Renew. Energy 2019, 132, 1301–1309. [Google Scholar] [CrossRef]
- Li, R.; Chen, S.; Li, X. Biogas Production from Anaerobic Co-digestion of Food Waste with Dairy Manure in a Two-Phase Digestion System. Appl. Biochem. Biotech. 2010, 160, 643–654. [Google Scholar] [CrossRef] [PubMed]
- Okuo, D.O.; Waheed, M.A.; Bolaji, B.O. Evaluation of Biogas Yield of Selected Ratios of Cattle, Swine, and Poultry Wastes. Int. J. Green Energy 2016, 13, 366–372. [Google Scholar] [CrossRef]
- Wang, X.; Li, Z.; Zhou, X.; Wang, Q.; Wu, Y.; Saino, M.; Bai, X. Study on the bio-methane yield and microbial community structure in enzyme enhanced anaerobic co-digestion of cow manure and corn straw. Bioresour. Technol. 2016, 219, 150–157. [Google Scholar] [CrossRef]
- Zhang, L.; Lee, Y.; Jahng, D. Anaerobic co-digestion of food waste and piggery wastewater: Focusing on the role of trace elements. Bioresour. Technol. 2011, 102, 5048–5059. [Google Scholar] [CrossRef]
- Chen, Y.; Yang, G.; Sweeney, S.; Feng, Y. Household biogas use in rural China: A study of opportunities and constraints. Renew. Sustain. Energy Rev. 2010, 14, 545–549. [Google Scholar] [CrossRef]
- Garfí, M.; Martí-Herrero, J.; Garwood, A.; Ferrer, I. Household anaerobic digesters for biogas production in Latin America: A review. Renew. Sustain. Energy Rev. 2016, 60, 599–614. [Google Scholar] [CrossRef]
- Raha, D.; Mahanta, P.; Clarke, M.L. The implementation of decentralised biogas plants in Assam, NE India: The impact and effectiveness of the National Biogas and Manure Management Programme. Energy Policy 2014, 68, 80–91. [Google Scholar] [CrossRef]
- Garfí, M.; Martí-Herrero, J.; Garwood, A.; Ferrer, I. Assessment of organic loading rate by using a water tank digester for biogas production in Bangladesh. J. Clean. Prod. 2020, 265, 121688. [Google Scholar]
- Ferrer, I.; Garfí, M.; Uggetti, E.; Ferrer-Martí, L.; Calderon, A.; Velo, E. Biogas production in low-cost household digesters at the Peruvian Andes. Biomass Bioenergy 2011, 35, 1668–1674. [Google Scholar] [CrossRef]
- Jeppu, G.P.; Janardhan, J.; Kaup, S.; Janardhanan, A.; Mohammed, S.; Acharya, S. Effect of feed slurry dilution and total solids on specific biogas production by anaerobic digestion in batch and semi-batch reactors. J. Mater. Cycles Waste 2022, 24, 97–110. [Google Scholar] [CrossRef]
- Jeppu, G.P.; Janardhan, J.; Kaup, S.; Janardhanan, A.; Mohammed, S.; Acharya, S. Solid anaerobic digestion batch with liquid digestate recirculation and wet anaerobic digestion of organic waste: Comparison of system performances and identification of microbial guilds. Waste Manag. 2017, 59, 172–180. [Google Scholar]
- Xue, S.; Qiu, L.; Guo, X.; Yao, Y. Effect of liquid digestate recirculation on biogas production and enzyme activities for anaerobic digestion of corn straw. Water Sci. Technol. 2020, 82, 144–156. [Google Scholar] [CrossRef]
- Hendroko, S.R.; Sasmito, A.; Adinurani, P.G.; Nindita, A.; Yudhanto, A.S.; Nugroho, Y.A.; Liwang, T.; Mel, M. The Study of Slurry Recirculation to Increase Biogas Productivity from Jatropha curcas Linn. Capsule Husk in Two Phase Digestion. Energy Procedia 2015, 65, 300–308. [Google Scholar] [CrossRef]
- Metcalf and Eddy, Inc. Wastewater Engineering, Treatment and Reuse, 4th ed.; McGraw-Hill: New York, NY, USA, 2003; pp. 714–732. [Google Scholar]
- Parravicini, V.; Svardal, K.; Krampe, J. Greenhouse gas emissions from wastewater treatment plants. Energy Procedia 2016, 97, 246–253. [Google Scholar] [CrossRef]
- Solomon, S. IPCC: Climate change the physical science basis. In Proceedings of the AGU Fall Meeting Abstracts, San Francisco, CA, USA, 10–14 December 2007. [Google Scholar]
- Ioannou-Ttofa, L.; Foteinis, S.; Moustafa, A.S.; Abdelsalam, E.; Samer, M.; Fatta-Kassinos, D. Life cycle assessment of household biogas production in Egypt: Influence of digester volume, biogas leakages, and digestate valorization as biofertilizer. J. Clean. Prod. 2021, 286, 125468. [Google Scholar] [CrossRef]
- Pérez, I.; Garfí, M.; Cadena, E.; Ferrer, I. Technical, economic and environmental assessment of household biogas digesters for rural communities. Renew. Energy 2014, 62, 313–318. [Google Scholar] [CrossRef]
- USEPA. Estimating Sludge Management Costs; USEPA: Cincinnati, OH, USA, 1985; pp. 687–699.
- Drosg, B. Process Monitoring in Biogas Plants; IEA Bioenergy: Paris, France, 2013. [Google Scholar]
- Khan, E.U.; Martin, A.R. Review of biogas digester technology in rural bangladesh. Renew. Sustain. Energy Rev. 2016, 62, 247–259. [Google Scholar] [CrossRef]
- Akhiar, A.; Guilayn, F.; Torrijos, M.; Battimelli, A.; Shamsuddin, A.H.; Carrère, H. Correlations between the composition of liquid fraction of full-scale digestates and process conditions. Energies 2021, 14, 971. [Google Scholar] [CrossRef]
- Akhiar, A.; Battimelli, A.; Torrijos, M.; Carrere, H. Comprehensive characterization of the liquid fraction of digestates from full-scale anaerobic co-digestion. Waste Manag. 2017, 59, 118. [Google Scholar] [CrossRef]
- Garfí, M.; Ferrer-Martí, L.; Velo, E.; Ferrer, I. Evaluating benefits of low-cost household digesters for rural Andean communities. Renew. Sustain. Energy Rev. 2012, 1, 575–581. [Google Scholar] [CrossRef]
- Feng, R.; Li, J.; Dong, T.; Li, X. Performance of a novel household solar heating thermostatic biogas system. Appl. Therm. Eng. 2016, 96, 519–526. [Google Scholar] [CrossRef]
- Lansing, S.; Martin, J.F.; Botero, R.B.; da Silva, T.N.; da Silva, E.D. Wastewater transformations and fertilizer value when co-digesting differing ratios of swine manure and used cooking grease in low-cost digesters. Biomass Bioenergy 2010, 34, 1711–1720. [Google Scholar] [CrossRef]
- Lungkhimba, H.M.; Karki, A.B.; Shrestha, J.N. Biogas Production from Anaerobic Digestion of Biodegradable Household Wastes. Nepal J. Sci. Technol. 2010, 11, 167–172. [Google Scholar] [CrossRef]
- Náthia-Neves, G.; Berni, M.; Dragone, G.; Mussatto, S.I.; Forster-Carneiro, T. Anaerobic digestion process: Technological aspects and recent developments. Int. J. Environ. Sci. Technol. 2018, 15, 2033–2046. [Google Scholar] [CrossRef]
- Shi, X.S.; Dong, J.J.; Yu, J.H.; Yin, H.; Hu, S.M.; Huang, S.X.; Yuan, X.Z. Effect of Hydraulic Retention Time on Anaerobic Digestion of Wheat Straw in the Semicontinuous Continuous Stirred-Tank Reactors. BioMed Res. Int. 2017, 2017, 2457805. [Google Scholar] [CrossRef]
- Awasthi, S.K.; Joshi, R.; Dhar, H.; Verma, S.; Awasthi, M.K.; Varjani, S.; Sarsaiya, S.; Zhang, Z.; Kumar, S. Improving methane yield and quality via co-digestion of cow dung mixed with food waste. Bioresour. Technol. 2018, 251, 259–263. [Google Scholar] [CrossRef] [PubMed]
- Mel, M.; Suhuli, N.M.; Avicenna; Ihsan, S.I.; Ismail, A.F.; Yaacob, S. Effect of Organic Loading Rate (OLR) of Slurry on Biogas Production Quality. Adv. Mater. Res. 2015, 1115, 325–330. [Google Scholar] [CrossRef]
- Deng, L.W.; Cao, W.P.; Sun, X.; Li, S.L.; Chen, Z.A. Impact of proportion of adding raw wastewater on post-treatment of digested piggery wastewater. Environ. Sci. 2007, 28, 588–593. [Google Scholar]
- Dębowski, M.; Szwaja, S.; Zieliński, M.; Kisielewska, M.; Stańczyk-Mazanek, E. The influence of anaerobic digestion effluents (ADEs) used as the nutrient sources for Chlorella sp. cultivation on fermentative biogas production. Waste Biomass Valorization 2017, 82, 1153–1161. [Google Scholar] [CrossRef]
- Chong, C.C.; Cheng, Y.W.; Ishak, S.; Lam, M.K.; Lim, J.W.; Tan, I.S.; Show, P.L.; Lee, K.T. Anaerobic digestate as a low-cost nutrient source for sustainable microalgae cultivation: A way forward through waste valorization approach. Sci. Total Environ. 2022, 803, 150070. [Google Scholar] [CrossRef] [PubMed]
- Azqandi, M.; Shahryari, T.; Fanaei, F.; Nasseh, N. Green construction of magnetic MnFe2O4/ZIF-8 nanocomposite utilizing extract of Melissa officinalis plant for the photo-degradation of tetracycline under UV illumination. Catal. Commun. 2023, 185, 106798. [Google Scholar] [CrossRef]
- Garfí, M.; Ferrer-Martí, L.; Perez, I.; Flotats, X.; Ferrer, I. Co-digestion of cow andguinea pig manure in low-cost tubular digesters at high altitude. Ecol. Eng. 2011, 37, 2066–2070. [Google Scholar] [CrossRef]
- Kanwar, S.S.; Guleri, R.L. Performance evaluation of a family-size, rubber-balloon biogas plant under hilly conditions. Bioresour. Technol. 1994, 50, 119–121. [Google Scholar] [CrossRef]
- Kalia, A.K.; Kanwar, S.S. Long-term evaluation of a fixed dome Janata biogas plant in hilly conditions. Bioresour. Technol. 1998, 65, 61–63. [Google Scholar] [CrossRef]
- Kanwar, S.S.; Gupta, R.K.; Guleri, R.L.; Singh, S.R. Performance evaluation of a 1 m3 modified, fixed-dome Deenbandhu biogas plant under hilly conditions. Bioresour. Technol. 1994, 50, 239–241. [Google Scholar] [CrossRef]
- Tasdemiroglu, E. Review of the biogas technology in Turkey. Biomass 1988, 17, 137–148. [Google Scholar] [CrossRef]


| Components | TS (%) | VS (%) | VFA (mg/L) | Slurry T (°C) | pH |
|---|---|---|---|---|---|
| Feedstock composition | 10.5 | 8.7 | 279 | 31.3 | 6.8 |
| Scenario A | Scenario B | Equation Sources | ||
|---|---|---|---|---|
| Mmanure-solid | (MT ts/yr) | 22.06 | 22.06 | |
| Dilution ratio | 1:2 | 1:2 | ||
| Vwater | m3/yr | 50,286,751 | −50,286,751 | Equation (1) |
| Vslurry-AD | m3/yr | 367,596,148 | 317,309,398 | Equation (2) |
| Mslurry-solid | (MT ts/yr) | 11.03 | 9.52 | |
| Mslurry-polymer | ton polymer/yr | 66,167.31 | 57,115.69 | Equation (3) |
| Costslurry-polymer | $/yr | 231,585,573 | 199,904,920 | Equation (4) |
| GHGslurry-polymer | MT CO2e/yr | 0.17 | 0.15 | Equation (11a) |
| GHGslurry-dewateriing | MT CO2e/yr | 1.60 | 1.38 | Equation (13a) |
| GHGslurry-storing | MT CO2e/yr | 0.71 | 0.61 | Equation (13a) |
| OLBNR | ton COD /yr | 563,157 | 486,118 | Equation (5) |
| NLBNR | ton N/yr | 625,730 | 540,131 | Equation (6) |
| MBNR-biosludge | ton ts/yr | 241,353 | 208,336 | Equation (7) |
| GHGBNR-denitrification | MT CO2e/yr | 1.40 | 0.08 | Equation (16) |
| GHGbiosludge-AD | MT CO2e/yr | 1.01 | 0.87 | Equation (10) |
| GHGbiosludge-storing | MT CO2e/yr | 0.01 | 0.01 | Equation (15a) |
| GHGbiosludge-dewatering | MT CO2e/yr | 0.02 | 0.02 | Equation (15b) |
| Mbiosludge-polymer | ton polymer/yr | 2172.18 | 1875.03 | Equation (8) |
| Costbiosludge-polymer | $/yr | 7,082,608 | 6,562,593 | Equation (9) |
| GHGbiosludge-polymer | MT CO2e/yr | 0.005 | 0.005 | Equation (11b) |
| GHGtotal | MT CO2e/yr | 3.38 | 3.13 | |
| Costtotal | $/yr | 222,827,855 | 206,467,513 |
Disclaimer/Publisher’s Note: The statements, opinions and data contained in all publications are solely those of the individual author(s) and contributor(s) and not of MDPI and/or the editor(s). MDPI and/or the editor(s) disclaim responsibility for any injury to people or property resulting from any ideas, methods, instructions or products referred to in the content. |
© 2023 by the authors. Licensee MDPI, Basel, Switzerland. This article is an open access article distributed under the terms and conditions of the Creative Commons Attribution (CC BY) license (https://creativecommons.org/licenses/by/4.0/).
Share and Cite
He, X.; Nasiruddin, S.M.; Zhou, X.; Li, Z.; Mang, H.-P.; Ryndin, R.; Kabir, H.; Uddin, S.M.N. Peering into a Simplified Digestor for Households: Performance, Cost and Carbon-Neutral Niche. Water 2024, 16, 36. https://doi.org/10.3390/w16010036
He X, Nasiruddin SM, Zhou X, Li Z, Mang H-P, Ryndin R, Kabir H, Uddin SMN. Peering into a Simplified Digestor for Households: Performance, Cost and Carbon-Neutral Niche. Water. 2024; 16(1):36. https://doi.org/10.3390/w16010036
Chicago/Turabian StyleHe, Xiaoqin, Sayed Mohammad Nasiruddin, Xiaoqin Zhou, Zifu Li, Heinz-Peter Mang, Roman Ryndin, Humayun Kabir, and Sayed Mohammad Nazim Uddin. 2024. "Peering into a Simplified Digestor for Households: Performance, Cost and Carbon-Neutral Niche" Water 16, no. 1: 36. https://doi.org/10.3390/w16010036
APA StyleHe, X., Nasiruddin, S. M., Zhou, X., Li, Z., Mang, H.-P., Ryndin, R., Kabir, H., & Uddin, S. M. N. (2024). Peering into a Simplified Digestor for Households: Performance, Cost and Carbon-Neutral Niche. Water, 16(1), 36. https://doi.org/10.3390/w16010036