1. Introduction
Drought is an area-wide natural disaster that occurs in almost all climatic regions [
1]. Hydrological drought occurs when the available water storage in water sources such as aquifers, lakes and reservoirs falls below locally important thresholds [
2]. The influencing factors of hydrological drought are complex, and it occurs slowly, which causes a greater degree of disaster. According to statistics, approximately 55 million people around the world are affected by drought every year, and drought is the most serious hazard faced by livestock and crops in almost every part of the world. Over the past 10 years, 80–90% of recorded natural disasters were primarily caused by drought. Up to 700 million people could be at risk of being displaced by drought by 2030 [
3].
Affected by climate change and human activities, China’s climate has changed, and extreme weather occurs frequently, resulting in the frequent occurrence of various disasters, especially drought disasters [
4]. Drought influences many of the processes within the hydrological cycle, such as precipitation, evaporation, infiltration, and confluence [
5]. Insufficient precipitation or excessive evaporation sustained over a prolonged period of time (several weeks to several years) can lead to meteorological drought [
6]. Hydrological drought is defined by inadequate surface and subsurface water resources [
7]. As such, inadequate runoff will lead to hydrological drought [
8]. Through the hydrological cycle, hydrological drought can contribute to a series of different drought types, including agricultural, vegetation and groundwater drought [
5,
9]. Therefore, it is greatly necessary to analyze the temporal and spatial evolution of hydrological drought in China and to identify the level of drought-induced disaster risk in order to reduce the social impact and economic loss caused by drought.
In recent years, many scholars have carried out studies on the monitoring of drought through remote sensing [
10,
11], drought index quantification and evaluation [
12,
13,
14], and propagation dynamics of meteorological drought to hydrological drought [
15]. Meteorological drought is described by the standardized precipitation and evapotranspiration index (SPEI) [
16] and the standardized precipitation index (SPI) [
6]. The SPEI is also defined as a meteorological drought index, but it is more suitable for studying water shortages by calculating the difference in precipitation and evaporation [
17]. Asadizak assessed global drought and found that the SPI is suitable for characterizing meteorological drought in different climate regions [
6]. Hydrological drought is described by the standardized runoff index (SRI) [
8,
18]. The SRI can describe hydrological processes related to the climate impacts on the seasonal fluctuations in runoff [
7]. However, against the background of climate change and human activities, the stationary hypothesis of precipitation and temperature has been challenged [
19]. Some non-stationary drought indexes have been constructed with non-stationary theory or models. However, studies found that the non-stationary SPI underestimated the true drought conditions [
20], and the meteorological drought change in the Yangtze using the NSPI and SPI was basically the same [
21]. Although these new indexes show some advantages, they lack extensive application and verification. Therefore, the traditional drought index remains an important method by which to evaluate drought [
22].
In terms of the temporal and spatial evolution of drought, Wang et al. analyzed the temporal and spatial evolution trends of drought in northern Shaanxi in China using the historical time period (1960–2018) and the future time period (2020–2100) [
23], and Chen et al. performed a comprehensive assessment of the drought in the Haihe River Basin of China using the comprehensive drought index [
24]. Pei et al. conducted a comparative analysis of drought in Inner Mongolia, China, using the SPI and SPEI on different time scales from 1981 to 2018 [
25], and so on. A substantial number of studies have been conducted on the occurrence mechanism and characteristics of meteorological drought. With the deepening of drought research, experts and scholars have conducted studies on hydrological drought and obtained some results. Hasan et al. systematically sorted out the published academic literature on hydrological drought from 2000 to 2019, and they found that there is an increasing trend of research and publications in the hydrological drought assessment, and the primary research themes are drought severity, drought vulnerability, and drought forecast [
26]. Xu et al. studied the relationship between meteorological drought and hydrological drought in the Luanhe River Basin in China, and they assessed the spatial transmission mechanism of meteorological drought to hydrological drought using the SPI and SRI, with results showing that during the pre-human disturbance period, the spread of drought was mainly influenced by the characteristics of the watershed [
27]. Ding et al. carried out research to analyze the relationship between hydrological and meteorological drought, as well as the transmission time from meteorological to hydrological drought, using the SPI and SRI in different climate zones in China, and they found that the transmission relationship in an arid environment is weaker than that in humid environments and the relationship between them in summer and autumn is closer than that in spring and winter [
22]. Bevacqua et al. analyzed the meteorological and hydrological drought in 457 watersheds in Brazil using the SPEI and SSI; meanwhile, they estimated the recovery time for meteorological and hydrological drought events. The results indicated that compared to meteorological drought, hydrological drought is usually more persistent, more severe, and takes longer to recover from. The recovery time of hydrological drought in arid regions may be four times that of meteorological drought [
28]. Li et al. studied the propagation law of meteorological drought to hydrological drought in the upper reaches of the Shaying River Basin, and they found that the propagation time from meteorological drought to hydrological drought varied significantly with the seasons, being longer in spring and winter and shorter in summer and autumn. There was a close correlation between hydrological drought and meteorological drought [
29]. Wang et al. conducted a comprehensive evaluation of the evolving characteristics of hydrological drought using the standardized runoff index (SSI) in the Yangtze River Basin from 1961 to 2015 [
30]. Meresa et al. investigated the spread of meteorological drought to hydrological drought in nine selected watersheds in the Awash River Basin in Ethiopia using standardized indexes of precipitation (SPI), soil water deficit (SPEI), streamflow (SRI), and base flow (SBI) [
31]. Li et al. systematically analyzed the relationship between the severity (S) and duration (D) of hydrological drought in the three catchments of the upper Haihe River Basin in China using the standardized runoff index (SRI) at the 3-month and 6-month scales [
32]. Kubiak-Wójcicka et al. performed a trend analysis of hydrological drought in the Noteć River Basin in Poland using standardized runoff indexes (SRI) at different time scales (1, 3, 6, 9, and 12 months) from 1981 to 2016 [
33]. Yao et al. used standardized indexes (SPI/SSI/SRI) to study the evolution and propagation characteristics of three types of droughts in different subregions of China at multiple time scales [
22,
34].
There is extensive literature that describes the use of the SRI for various regions of Europe and the world. However, the existing research on hydrological drought primarily concentrates on the watershed or regional scale in China [
27,
29,
30,
32]. However, the research by Ding et al. and Yao et al. mainly focused on the propagation patterns of different types of droughts in China and revealed the different propagation patterns of droughts at the Chinese scale [
16,
23]. Therefore, the research on large-scale hydrological drought in China remains an area with a research gap.
At the same time, there is also a lack of research on the level of the hydrological drought hazard in China. On the basis of accurately revealing the temporal and spatial evolution of hydrological drought, identifying the distribution of its disaster risk level is of great significance for improving the level of drought resistance and disaster reduction in China. Meanwhile, with the advancement of technology, more and more high-precision large models and satellite data are available, and the applicability of such data has also been confirmed. Therefore, this study uses big data to study the spatiotemporal evolution and disaster risk of drought for the whole China.
The standard precipitation index (SPI) and standardized runoff index (SRI) are widely used in drought analysis, which are standardized indicators with high accuracy and universality and can better reflect the drought conditions of the watershed/national levels [
35,
36]. Therefore, we calculated the SRI using multiscale hydrological data for China from 1948 to 2014, and classified the SRI (annual, monthly, or daily) into different grades according to drought classification criteria (
Table 1). On this basis, the multiscale spatiotemporal evolution of hydrological drought in China was analyzed, and the level of the hydrological drought hazard was analyzed using the SRI and the hydrological drought hazard index. The temporal and spatial variations in China over 66 years were revealed to provide a reference for drought resistance and disaster reduction, ensuring the agricultural production and sustainable utilization and management of water resources in China.
2. Materials and Methods
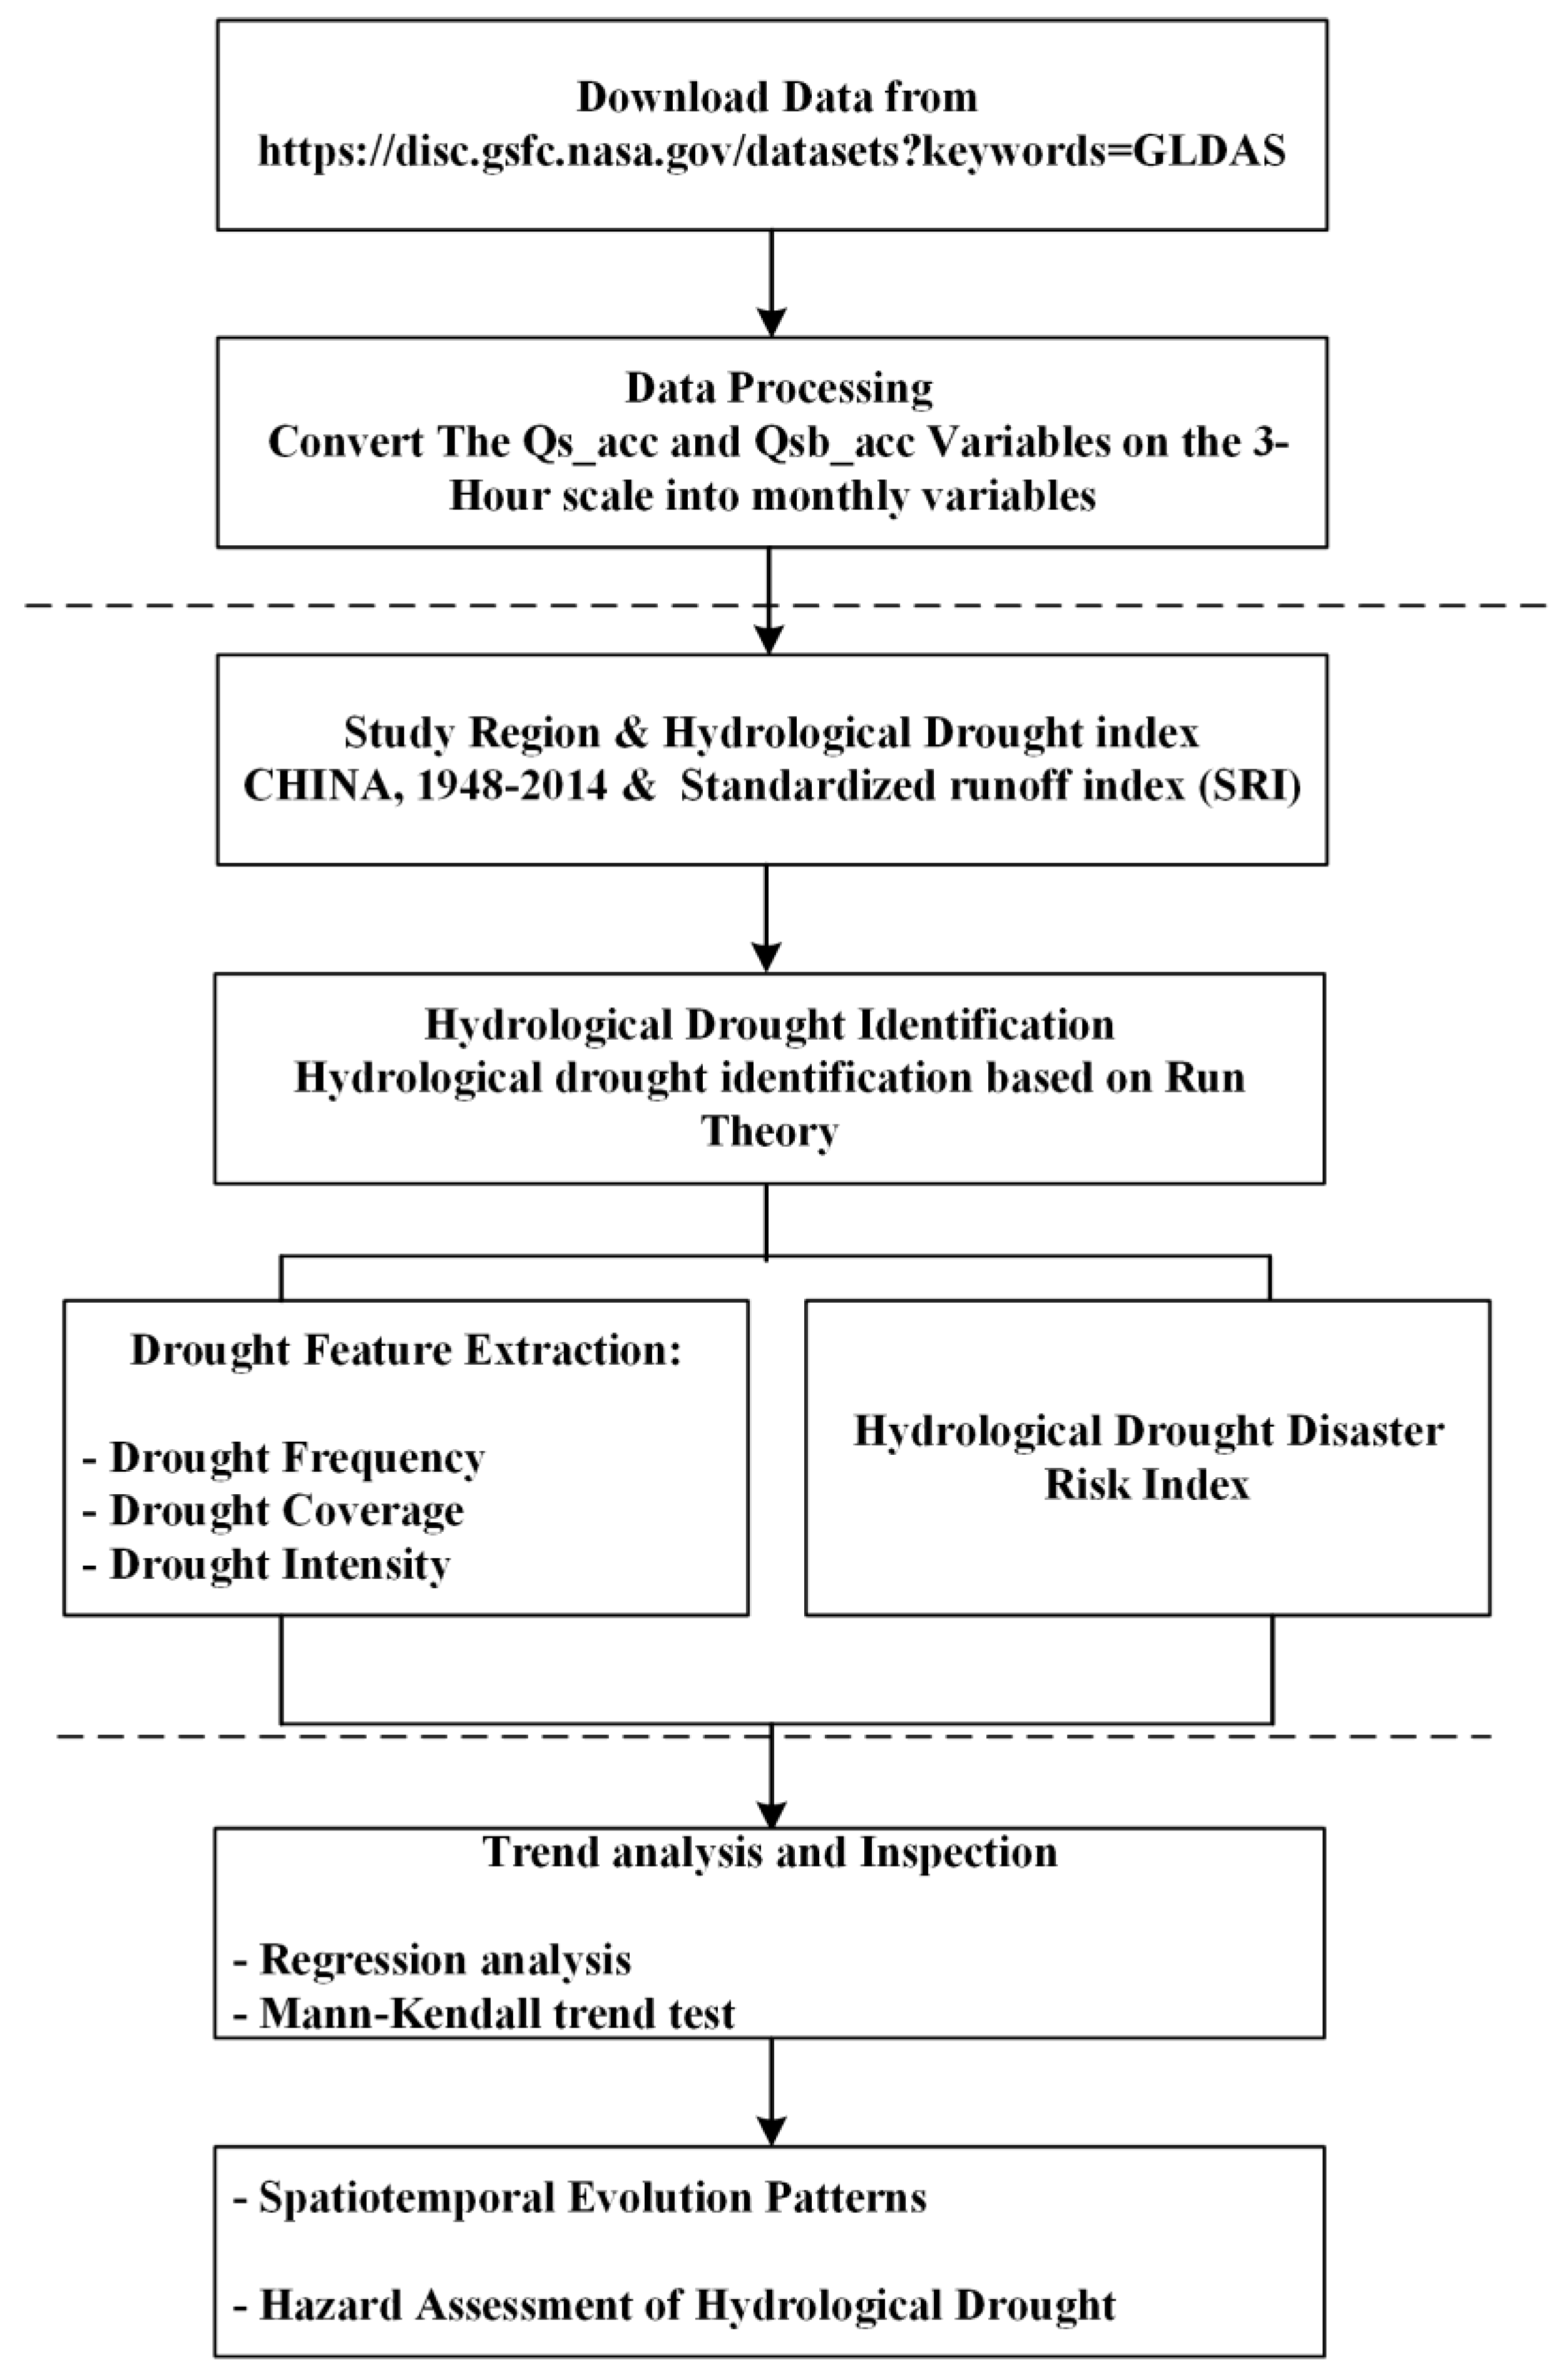
Based on spatiotemporal big data, this study studied the spatiotemporal evolution patterns of hydrological drought and the hazard assessment of hydrological drought in China from 1948 to 2014.
Figure 1 shows the framework for this approach.
2.1. Study Region
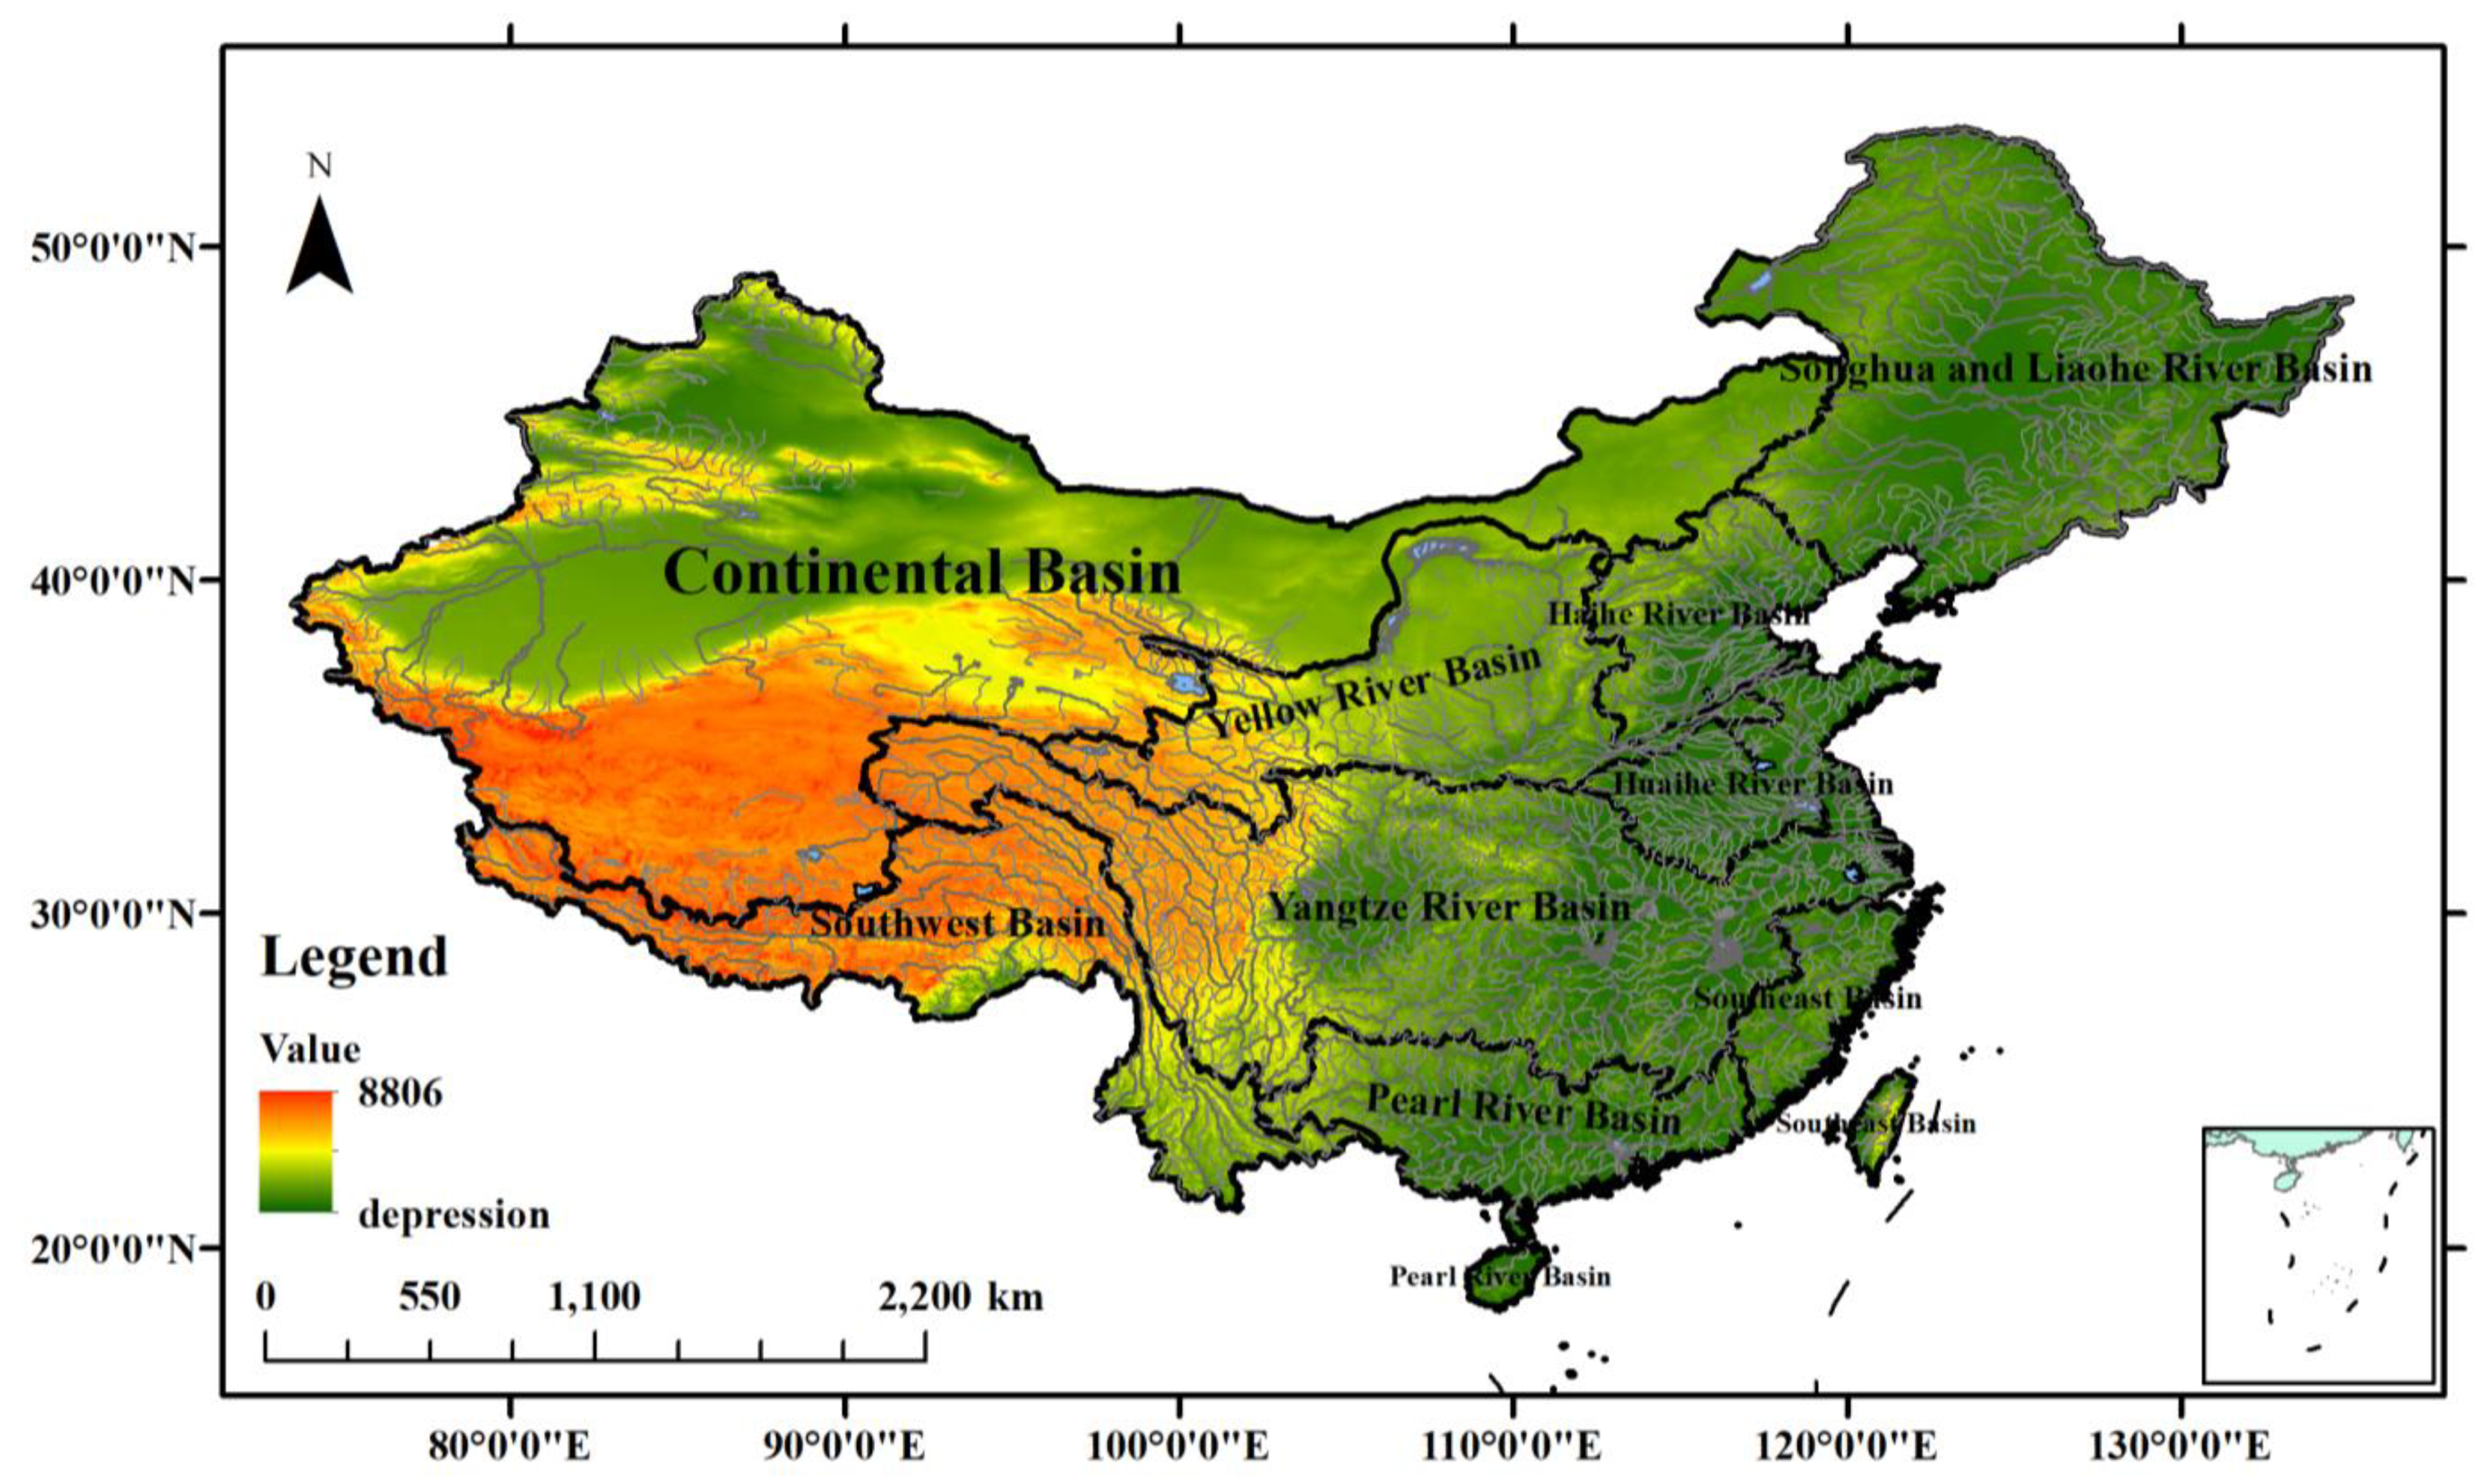
China is located between 73~136° E and 3~54° N. The east–west direction of China has a large span, as the easternmost point reaches the Chinese-controlled area of Heixiazi Island, and the westernmost point reaches the Pamir Plateau. China also has a vast land area, with almost all landforms, such as mountains, plains, plateaus, deserts, hills, basins, etc. The terrain of China is high in the east and low in the west, with a three-level decline from east to west, spanning multiple latitudes from north to south, resulting in a complex and diverse climate. China is mainly affected by the monsoon circulation and most areas have a monsoon climate, with high temperatures and abundant rainfall in summer, and low temperatures and little precipitation in winter.
The average annual temperature is 13.3 °C, ranging from −30.9 °C to 32.7 °C, and the average annual precipitation is 628 mm. The spatial and temporal distribution of precipitation in China is extremely uneven, with more precipitation in the south (annual average precipitation is between 1200 and 1500 mm) and less precipitation in the north (annual average precipitation is less than 5.9 mm). The multi-year average evaporation in China is 1100 mm, with the northwest region having the largest evaporation and the southeastern coastal areas having the smallest evaporation. The amount of evaporation in China is affected by factors such as the temperature, humidity, wind speed, and sunshine. It is generally largest in summer and smallest in winter. The water resources of China are rich, with numerous rivers and lakes. However, China has a vast territory, complex terrain, and extremely uneven distribution of rivers and lakes. China is an industrialized country and an open country. Foreign trade accounts for 38.4% of the national economy, and it is the largest goods trading country in the world.
Therefore, according to the boundary data provided by the Institute of Geographical Science and Natural Resources Research of the Chinese Academy of Sciences, China is divided into nine sub-basins, namely, the Continental Basin, the Songhua and Liaohe River Basin, the Haihe River Basin, the Huaihe River Basin, the Yellow River Basin, the Yangtze River Basin, the Pearl River basin, the Southwest Basin and Southeast Basin, which are shown in
Figure 2.
2.2. Data Sources
The data used in this study were obtained from the Global Land Surface Data Assimilation System (GLDAS-2.0,
https://search.earthdata.nasa.gov/search/granules?p=C1233767545-GES_DISC&pg[0][v]=f&pg[0][gsk]=-start_date&q=GLDAS&tl=1703646361!3!!), with a time resolution of 3 h from 1948 to 2014, including 36 hydrometeorological data such as the snowfall, precipitation, evaporation, surface runoff, groundwater runoff, and so on (see
Table 2). The GLDAS is jointly developed by NASA’s Goddard Space Flight Center (GSFC) and the National Center for Environmental Prediction (NCEP) of the National Oceanic and Atmospheric Administration (NOAA) [
37,
38]. To accurately monitor the hydrological drought conditions in the study area, the Qs_acc and Qsb_acc in the GLDAS-2.0 were used to characterize the runoff in the study area. At the same time, the runoff data with a time accuracy of three hours were converted into monthly runoff data by referring to the method in the literature. The time period from 1948 to 2014 includes the period when China’s hydrological data are scarce, the period when the impact of human activities is weak, and the period when climate change and human activities have intensified impacts on hydrology. It also includes historical periods with similar climate and human activity conditions to the present stage. This period covers climate change and human activity conditions in China’s modern hydrological history, so we used the 1948 to 2014 period as the studied period. In future studies, hydrological data from 2015 to 2022 will also be considered using another product. Wang et al. (2014) evaluated the applicability of monthly precipitation data from the GLDAS-2.0 in China, and the results proved that the GLDAS-2.0 rainfall data used in study have good consistency and data quality, and good applicability [
39]. Wang et al. (2017) also evaluated the applicability of hydrological products of the GLDAS Noah model in China, and the results showed that the quality of the hydrological products of the GLDAS-2.0 is higher than that of the GLDAS-1.0, and the runoff products of the GLDAS-2.0 have better applicability and can be applied to the relevant research in China [
40].
Big data include a large amount of data and contain richer information than conventional data. The rich spatial scale of big data provides data support for drought analysis in large-scale areas. Meanwhile, the resolution of existing big data is relatively high, and using it for drought research can obtain more refined drought simulation results. However, big data have huge data volumes and data types. When conducting drought simulation, more attention needs to be paid to the selection of fitting functions to avoid using inappropriate fitting functions and introducing errors into the drought simulation results.
2.3. Methods
2.3.1. SRI and Drought Classification
The standardized runoff index (SRI) is a multi-scale index used to detect, monitor, and analyzed drought. The SRI was developed by Shukla and Wood to assess hydrological drought considering stream flow data, and the calculation process for the SRI is shown in the appendix [
8,
18]. It involves the fitting of a suitable distribution to the flow records for a particular location. After this, the Probability Density Function (PDF) and Cumulative Distribution Function (CDF) are calculated, and it is transformed to a standardized Gaussian distribution with a mean zero and unit variation that gives the SRI. The SPI is a standardized indicator with high accuracy and universality, and it can better reflect the drought conditions of the region/national level. The SPI is recommended by the World Meteorological Organization as an indicator for meteorological drought monitoring. The SRI is calculated using the concept of the SPI, so the SRI has the advantages of the SPI. However, the SRI has certain challenges in terms of the distribution fitting, and a suitable distribution will affect the accuracy of the index. Therefore, this study applies ‘normal’, ‘gamma’, ‘lognormal’, ’Weibull’ and ‘Pearson’ to fit the suitable distribution of the SRI.
According to the calculated SRI value, the drought grade was divided referring to the relevant paper (
Table 1).
2.3.2. Drought Frequency, Coverage, and Intensity
The drought frequency includes the annual drought and monthly drought frequency. Zhang pointed out that at least one drought occurred in the study period (month, season or year), and the cumulative drought duration exceeded 1/4 of the study period, and it was determined that a drought event occurred during the study period [
41]. This study takes one year as the research period; if the accumulative duration of droughts exceeds 3 months, it is determined that a hydrological drought occurred in this year.
Annual drought frequency
P:
where
P is the frequency of hydrological drought;
nm is number of years with drought events;
N is the total number of years; and
nmi is the frequency of droughts occurring in year
k. The period of this study is 1948–2014, and
N is 67 when studying SRI1, while
N is 66 when studying SRI3, SRI6 and SRI12.
The drought coverage
F is calculated as follows:
where
y is the year (
y = 1948, …, 2014);
s is the number of grids where drought events occur each year in the study area; and
Z is the total number of grids in the study area.
Drought intensity:
- (1)
Regional average value of the drought intensity Iy is:
where
y is the year (
y = 1948, …, 2014);
Iy is the regional average value of the drought intensity in the study area;
Ngrids is the number of grids in the study area;
Sv is the cumulative value of the SRIs in the study area; and
Svi is the cumulative value of the SRIs in one grid of the study area.
- (2)
Multi-year mean of the drought intensity Ig is:
where
y is the year (
y = 1948, …, 2014);
Ig is the multi-year mean value of the drought intensity in the study area;
Ny is the total number of years;
Nm is the months in the study period (
Ny*12);
Sy is the cumulative value of the SRIs in the study period; and
Si is the value of the SRI in month
i.
2.3.3. Hydrological Drought Hazard Index
Li et al. (2020) and Wang et al. (2019) pointed out that regional drought hazards are closely related to the drought occurrence frequency and drought intensity [
42,
43]. This study proposes a hydrological drought hazard index based on the frequency of hydrological drought and the intensity of hydrological drought. The hydrological drought hazard index
Q is:
where
P is the occurrence frequency of hydrological drought of each grid; and
R is the hydrological drought intensity of each grid.
In order to improve the spatial comparability of
Q, referring to the standardized drought index,
Q is normalized, and the normalized calculation formula is:
where
Xi is the normalized value of the hydrological drought hazard index of the
i-th grid;
Qi is the hydrological drought hazard index of the i-th grid;
Qmin and
Qmax are the minimum and maximum values of the
Q sequence of the
i-th grid; and
i is the grid in the study area.
The normalized
Q index was used to divide the hazard level of the study area. The level of hydrological drought hazard is divided into five risk levels: lower risk, low risk, medium risk, high risk and higher risk (
Table 3).
2.3.4. Trend Analysis and Inspection
The regression analysis method is based on the correlation between the independent variable x and the dependent variable y and establishes a linear regression equation between
x and
y for the data analysis.
where
Z is the regression coefficient, which is usually used to analyze the trend of time series.
Z > 0 represents an upward trend, while
Z < 0 represents a downward trend.
The regression coefficient is estimated based on the existing data, showing the trend of the current time series. In order to test the trend of the full time series, this study uses the Mann–Kendall trend testing method (M–K) for significance testing.
- 2.
Mann–Kendall trend testing method
The M–K trend testing method does not require the assumption that the time series obeys a normal distribution and is not affected by missing values and outliers. Therefore, the M–K is suitable for the characteristic sequence analysis of hydrological drought [
44]. For a time series
T with a sample size of
m, the Mann–Kendall test statistics first calculate
S:
The variance is as follows:
where
p is the number of identical element groups in the time series
T; and
qk is the number of the
k-th same element group.
Transform
S into a test statistic
Z. For large sample data,
Z can approximately conform to the standard normal distribution.
Hypothesis Ha: There is an increasing or decreasing monotonic trend, if |Z|≥Z1−α/2, accept Ha. The Z values corresponding to the confidence levels of 90%, 95% and 99% are 1.28, 1.64 and 2.32, respectively.
2.3.5. Database of Big Data
The data of the GLDAS-2.0 is stored in a netcdf file, so the netCDF4 function in Python was used to read the data, and the Qs_acc and Qsb_acc in the GLDAS-2.0 were used to characterize the runoff in the study area. There are up to 15,300 grids within China at a time, so the GLDAS-2.0 has a huge amount of data. Thus, big data and data mining methods have been fully utilized, and a basic data and information database (wyl) for drought analysis has been established based on MySQL5.0. The database was used to store, analyze, and manage data. The data mainly include 36 key attributes, such as the average surface skin temperature, total precipitation rate, storm surface runoff, etc. The key attribute data scales of the database are all on a daily scale, with a time span from 1948 to 2014.
3. Results and Discussion
3.1. Temporal Evolution of Hydrological Drought in China
We calculated the SRI of China from 1948 to 2014 using high-precision hydrological products of the GLDAS-2.0, calculated the coverage, duration and intensity of hydrological drought of the nine watersheds, and analyzed the temporal evolution of hydrological drought in China and nine watersheds.
Based on the analysis of the spatiotemporal big data, the multi-year average coverage of hydrological drought in China is 58.11%, with a multi-year average drought intensity of −2.95 and a multi-year average duration of 4.55 months. Over 66 years (1948–2014), nearly half of the regions in mainland China have experienced hydrological drought. These areas, on average, faced hydrological drought for almost half of each year, and the average drought intensity during these hydrological drought events was categorized as extreme drought. This indicates that China is experiencing a significant severity of hydrological drought. China urgently needs to formulate disaster prevention and mitigation measures for hydrological drought to reduce economic losses in the agricultural sector.
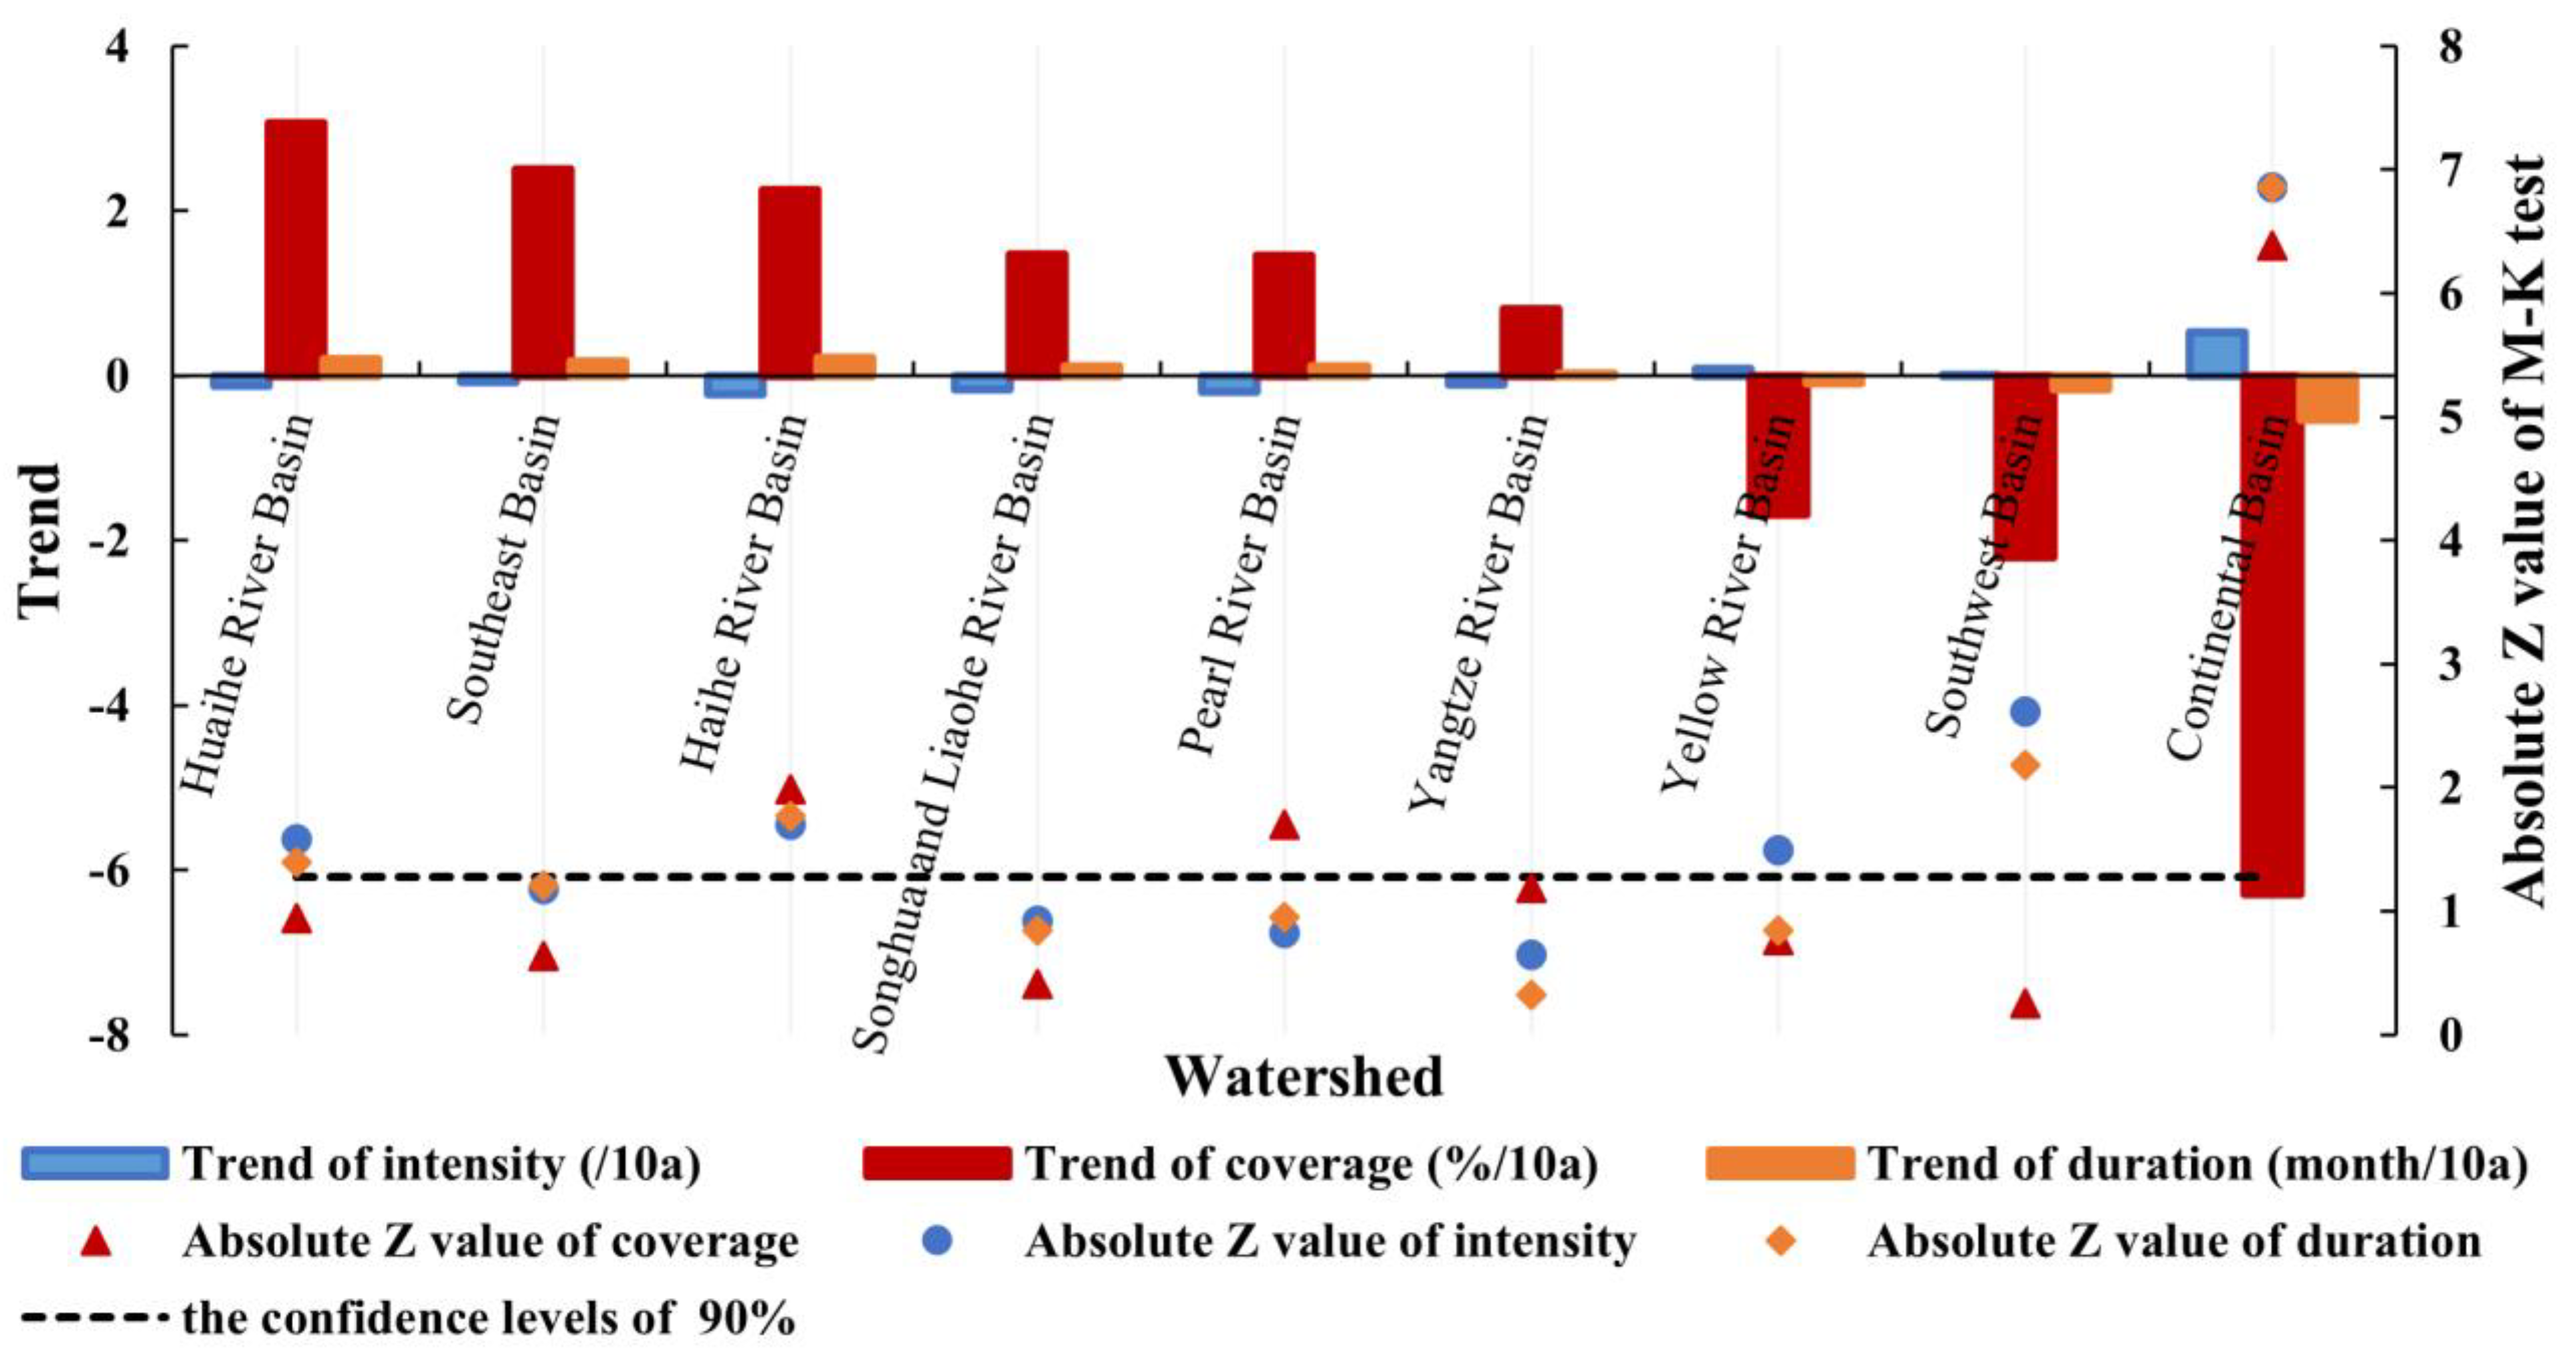
We further analyzed the temporal evolution of hydrological drought in nine major river basins in China.
Table 4 and
Figure 3 illustrate the trends in the hydrological drought characteristics.
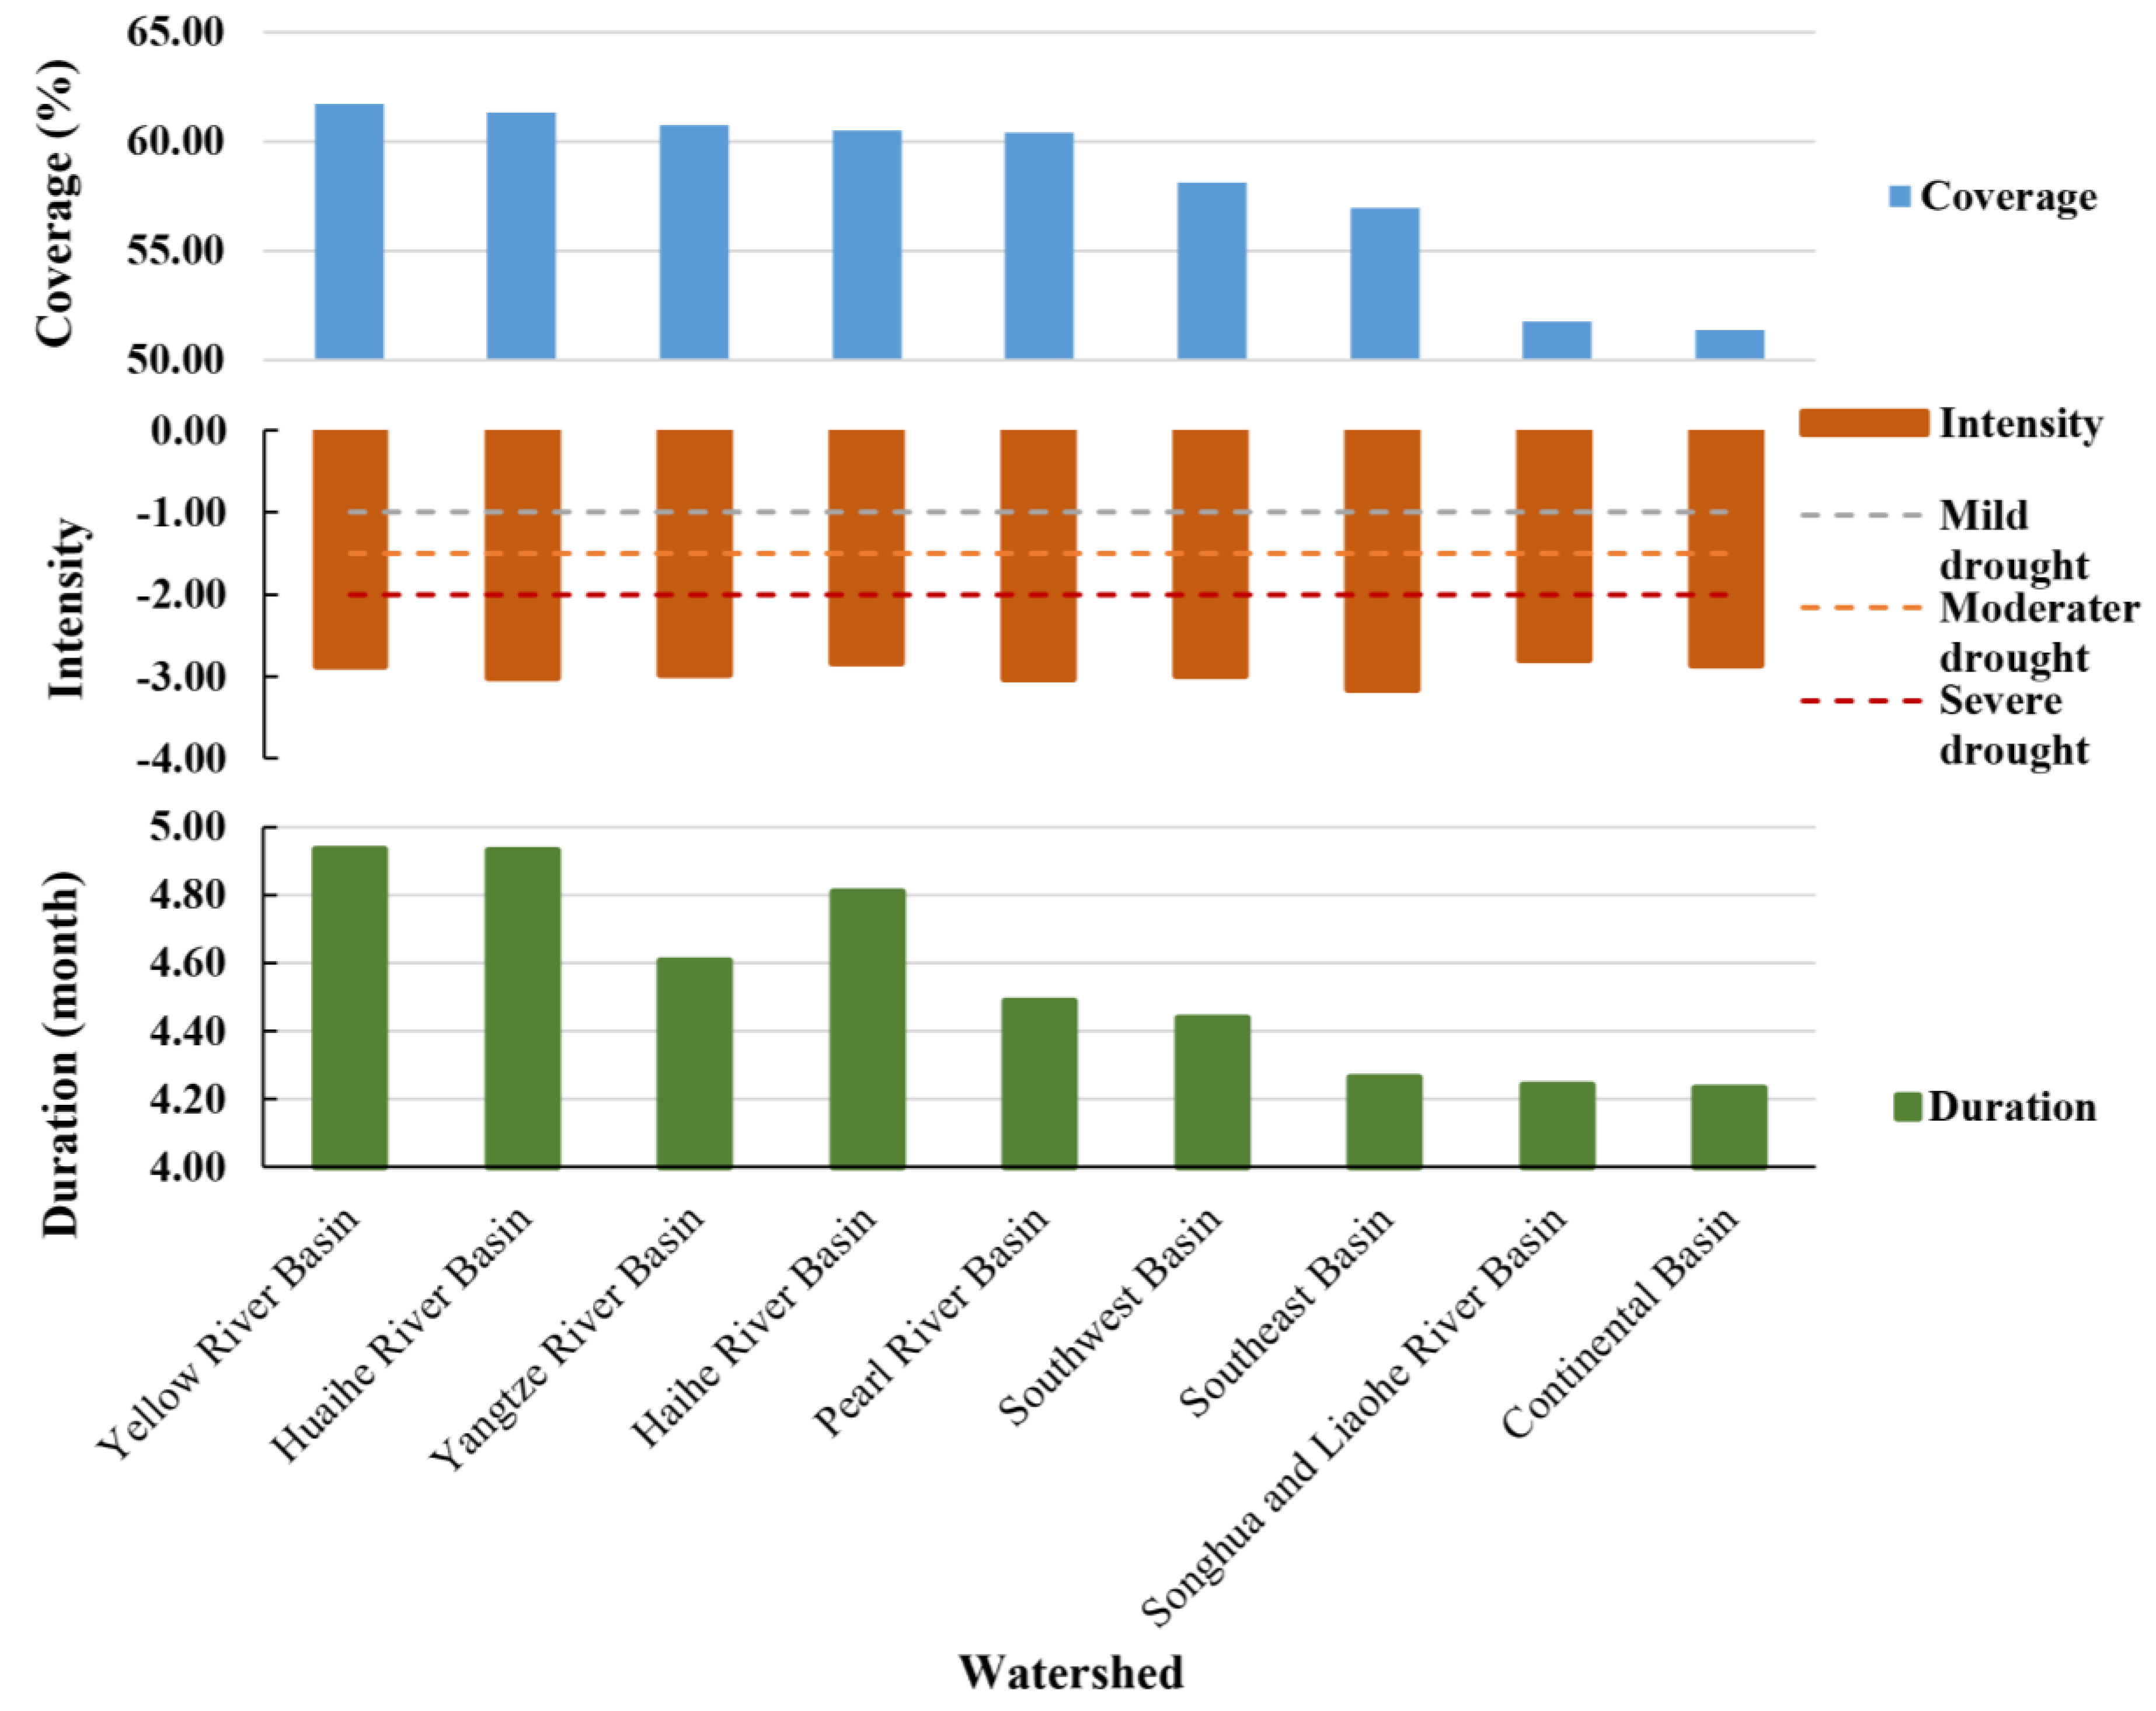
Figure 4 shows the multi-year average of the hydrological drought characteristics values in the nine major river basins in China. It can be observed that there is a significant decreasing trend in the interannual variation of drought coverage in the Yellow River Basin, while the trends in the drought intensity and duration are not statistically significant. Additionally, the multi-year averages of the hydrological drought characteristics in the Yellow River Basin are the highest among the nine major river basins (with a multi-year average of 61.72% for the drought coverage and 4.93 months for the duration). This indicates that the current hydrological drought situation of the Yellow River Basin is very serious, and the basin will experience a serious drought situation in the future. The Huaihe River Basin shows an upward trend in both the drought coverage and drought duration, and these trends have passed significance tests. The multi-year average of the hydrological drought characteristics in the basin ranks second among the nine major river basins (61.34% for the drought coverage and 4.93 months for the duration). This indicates that the current hydrological situation in the Huaihe River Basin is severe, and the situation will be worse in the future. The tends in the Yangtze River Basin did not pass significance tests. However, the values of the multi-year averages for the drought coverage and duration are relatively high (60.73% and 4.61 months, respectively). This indicates that the current hydrological drought situation in the Yangtze River Basin is severe and is expected to remain unchanged in the future. The Haihe River Basin exhibits relatively high values for the multi-year averages for the drought coverage and duration (60.50% and 4.81 months, respectively). Additionally, there is an upward trend in both the drought coverage and duration, while the drought intensity shows a decreasing trend. This suggests that the hydrological drought situation in the Haihe River Basin is quite severe and carries the risk of drought expansion and longer durations in the future. In the Pearl River Basin, the values of multi-year averages for the drought coverage and duration are 60.40% and 4.49 months, respectively. There is a significant decreasing trend in the drought intensity. However, the trends in the drought coverage and duration did not pass significance tests. This suggests that the basin is expected to experience a reduction in drought intensity in the future. In the Southwest River Basin of China, the values of the multi-year averages for the drought coverage and duration are relatively low at 58.12% and 4.44 months, respectively. Additionally, there is a significant downward trend in both the drought coverage and duration. This indicates that the current hydrological situation in the basin is relatively mild, and there is a trend toward reducing hydrological drought in the future. In the Southeast River Basin, the values of the multi-year averages for drought coverage and duration are relatively low, standing at 56.98% and 4.26 months, respectively. Additionally, the trends in drought characteristics did not pass significance tests. This suggests that the current hydrological situation in the basin is relatively mild, and there is no indication of a worsening trend in hydrological drought in the future. In the Songhua and Liaohe River Basin, the values of the multi-year averages for the drought coverage and duration are relatively low at 51.76% and 4.24 months, respectively. However, there is an upward trend in both the drought coverage and duration, indicating that the current hydrological drought situation in the basin is not severe, although the situation of drought will be worse in the future. In the Continental Basin, the values of the multi-year averages for the drought coverage and duration are 51.40% and 4.23 months, respectively. Both the drought coverage and duration show significant downward trends, indicating a decrease in hydrological drought severity. However, there is an upward trend in the drought intensity, suggesting an increase in the intensity of hydrological drought events in the basin.
In
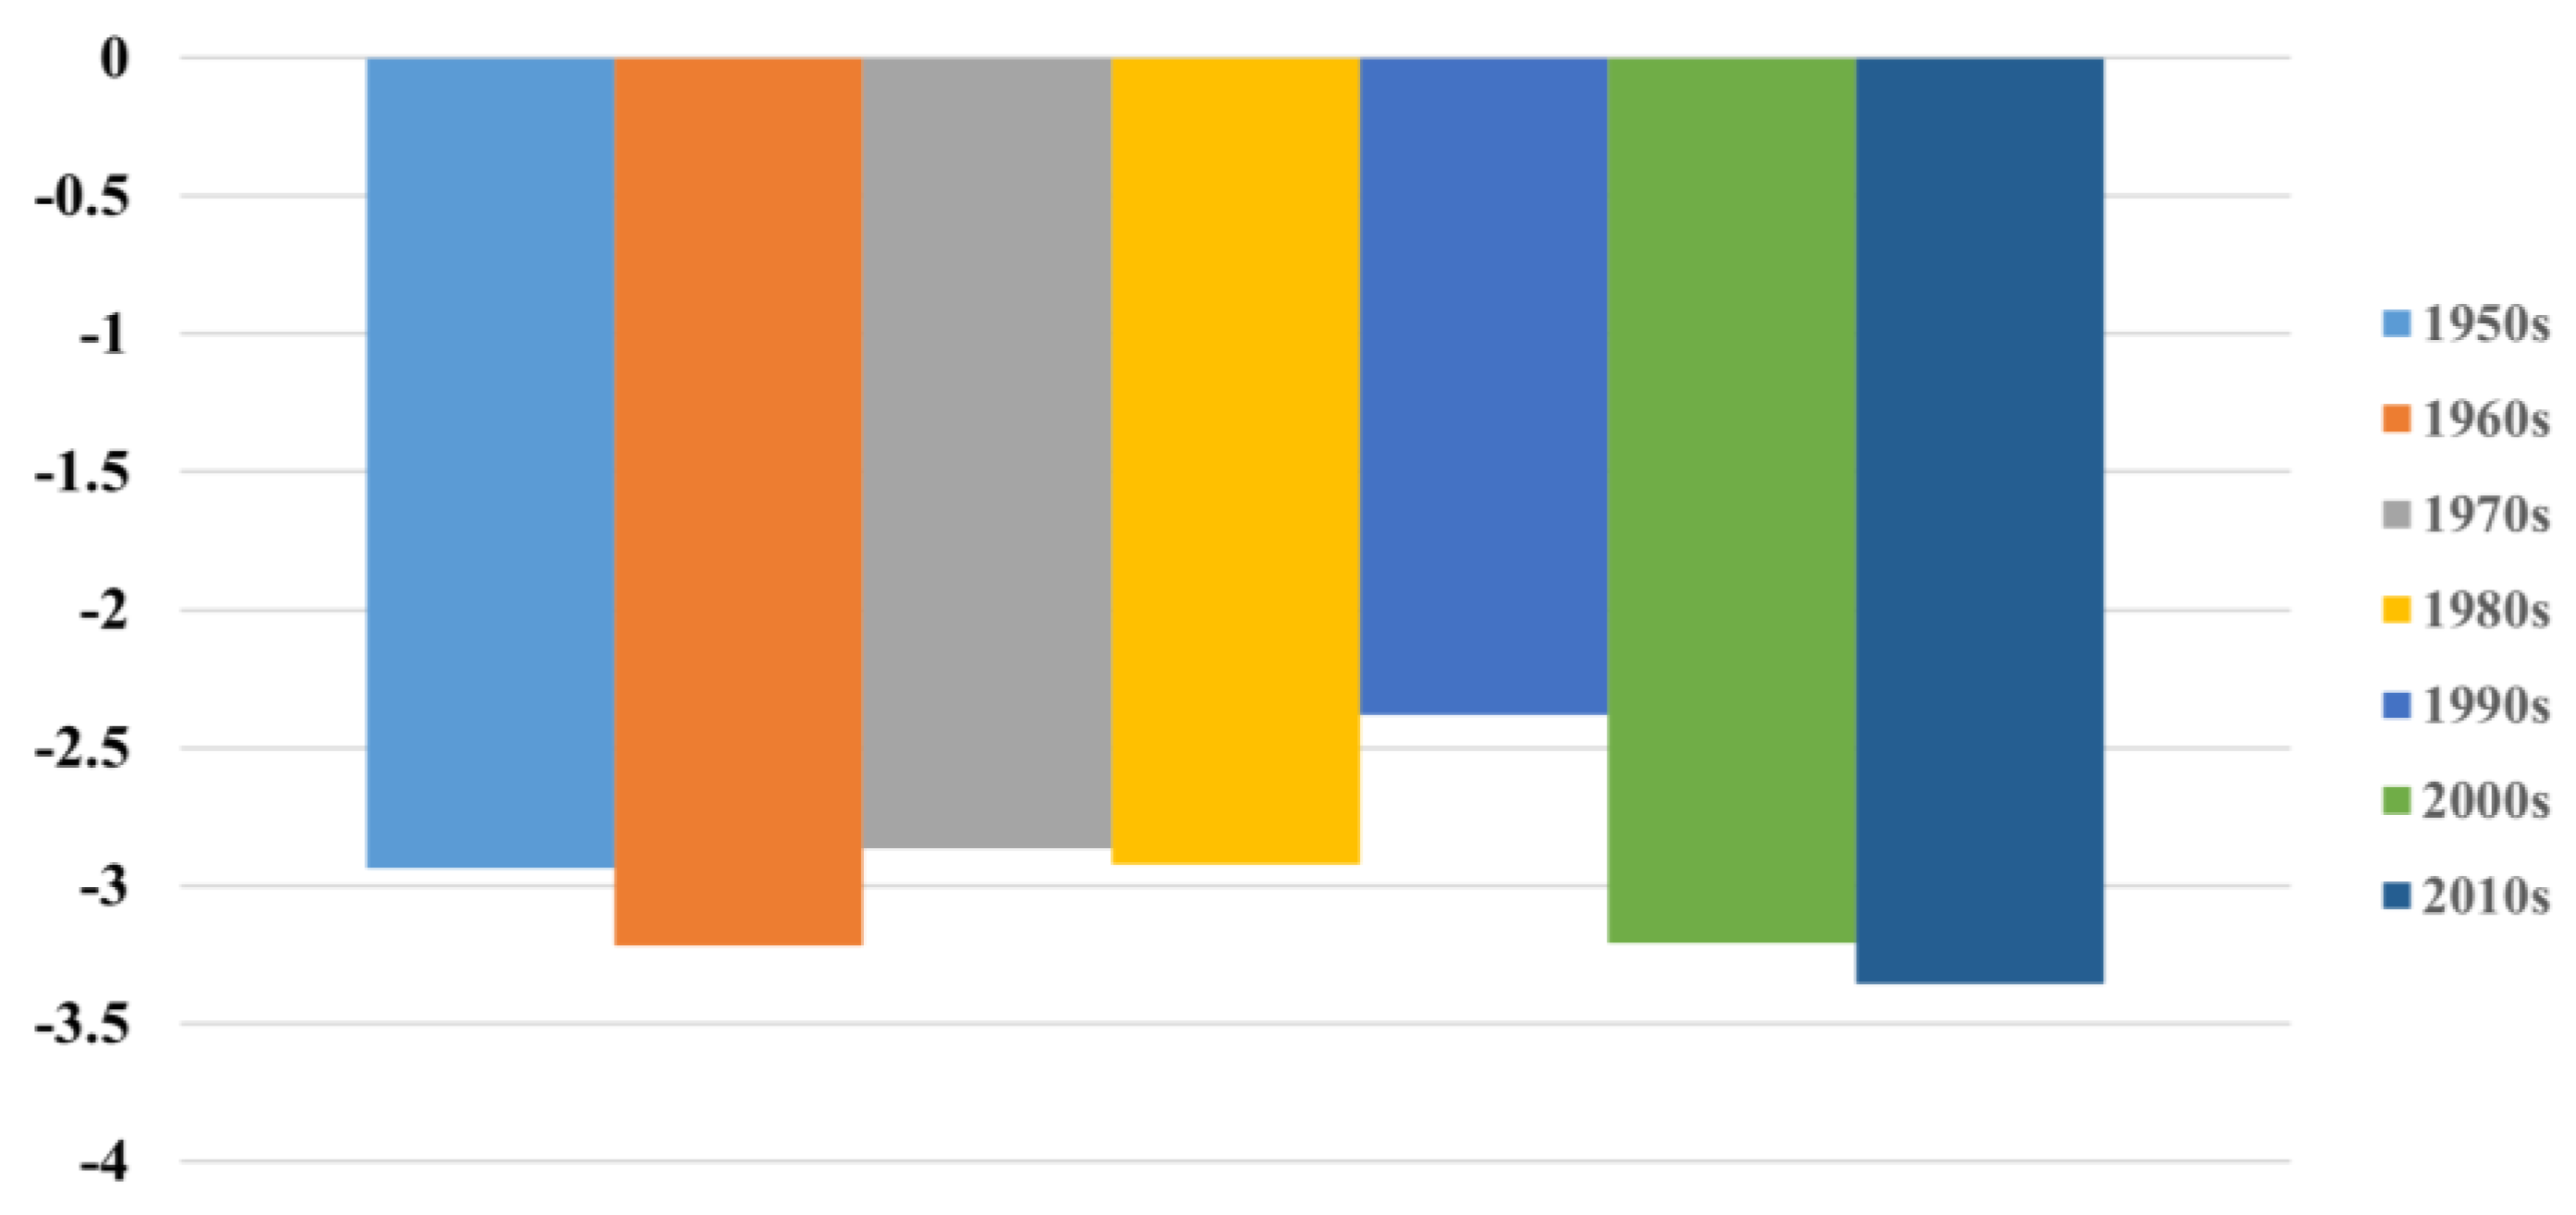
Figure 5, it also can be found from
Figure 5 that the drought situation in China was severe in the 1950s and 1960s, gradually reduced in the 1970s, 1980s, and 1990s, and the drought situation was the lightest in the 1990s. After entering the 21st century, the drought situation began to worsen sharply. Therefore, the current situation of hydrological drought is severe, and the government needs to strengthen disaster prevention and reduction.
3.2. Spatial Evolution of Hydrological Drought in China
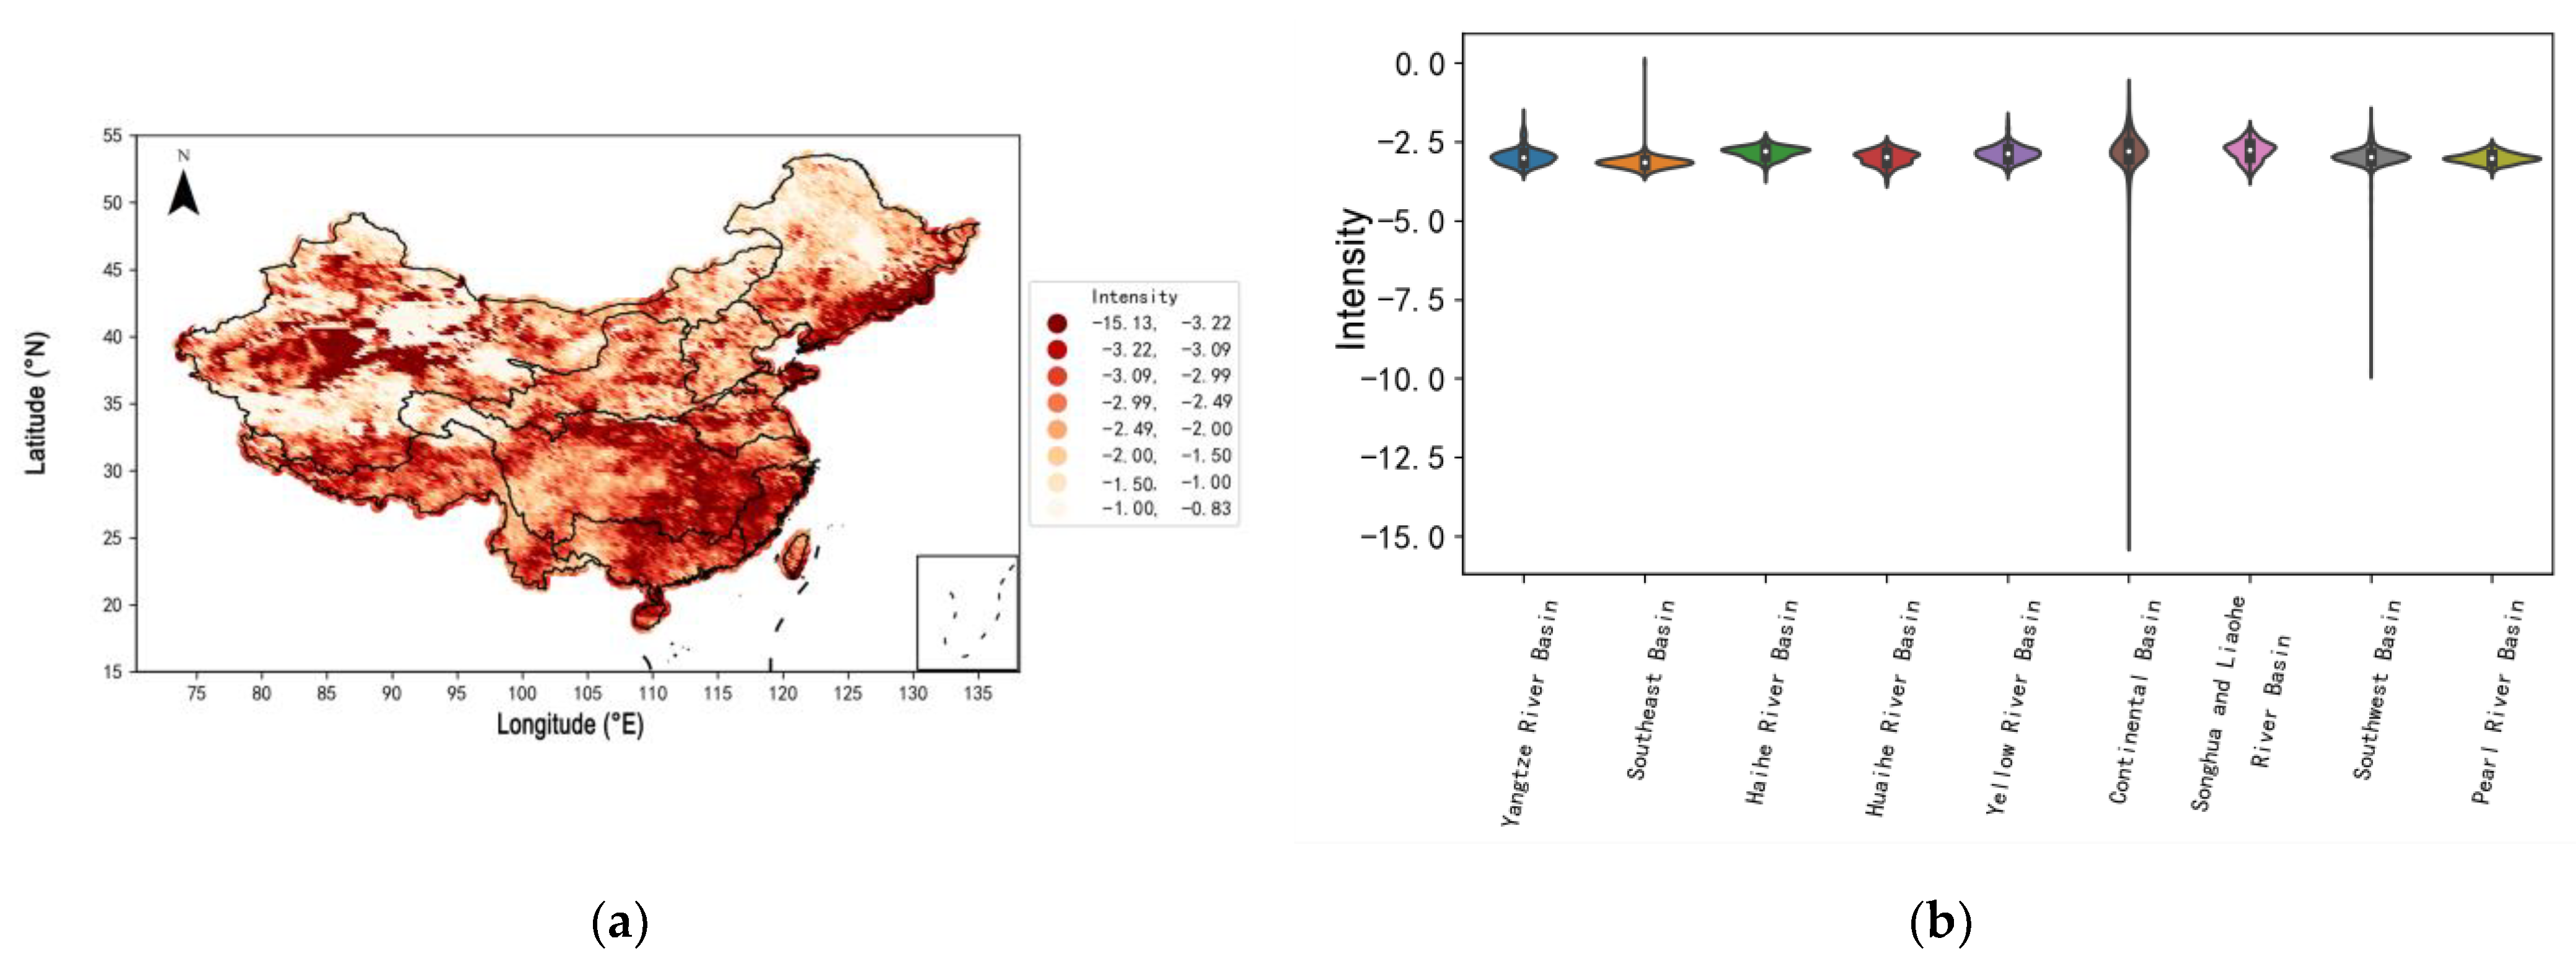
Further analyzing the spatial distribution characteristics of hydrological drought in China,
Figure 6a,b indicate that the hydrological drought intensity in China ranges from −15.13 to −0.83. Most regions in China have experienced relatively severe hydrological drought (with an average intensity above −2.0). Some areas in the southeastern part of China have encountered severe hydrological drought (with average intensities ranging from −3.22 to −15.13). The Continental Basin exhibits the widest range of hydrological drought intensity values, ranging from −15.13 to −0.83. Within the basin, approximately 5.53% of grid points have hydrological drought intensities ranging from −15.13 to −3.09, and these grid points are primarily located in the central part of the Inland River Basin. About 45.05% of the basin’s area experiences relatively mild hydrological drought conditions (above −2.0 in intensity). The Southwest River Basin also exhibits a relatively wide range of hydrological drought intensity values, ranging from −9.77 to −1.62. Grid points with hydrological drought intensities between −9.77 and −3.69 are less common, accounting for approximately 1.87%, and these grid points primarily located in the western part of the Southwest River Basin. The main distribution of the hydrological drought intensity in the basin falls between −3.69 and −2.00, covering approximately 97.97% of the total area.
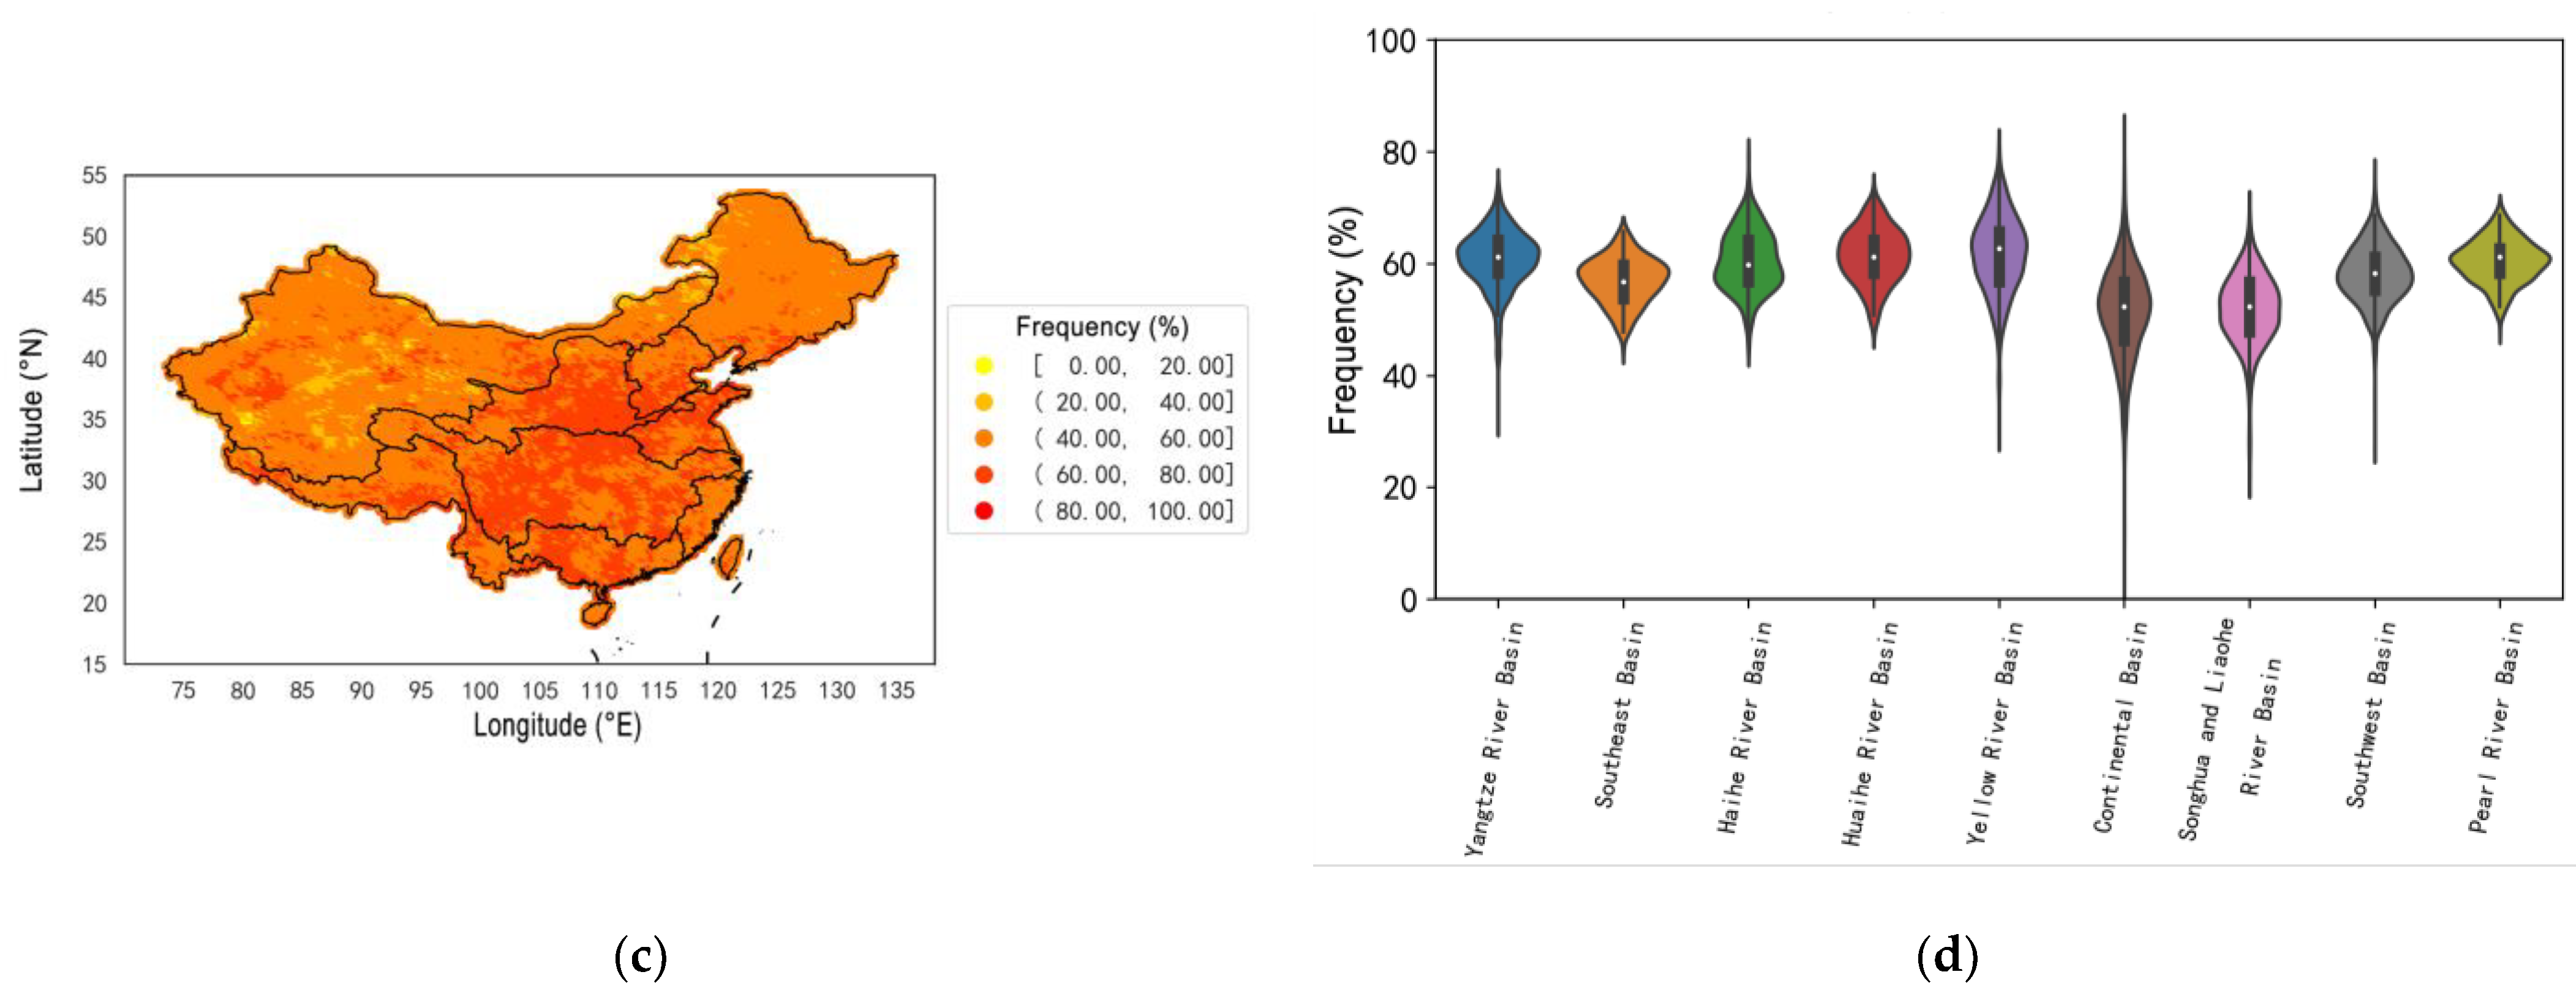
Based on
Figure 6c,d, it can be observed that the multi-year average hydrological drought frequency in China ranges from 1.49% to 83.58%. The Yellow River Basin has the highest average hydrological drought frequency (61.72%), followed by the Huaihe River Basin (61.35%). The other basins, ranked in descending order of the average hydrological drought frequency, are the Yangtze River Basin (60.73%), Haihe River Basin (60.50%), Pearl River Basin (60.40%), Southwest River Basin (58.12%), Southeast River Basin (56.96%), Songhua and Liaohe River Basin (51.78%), and Inland River Basin (51.40%). The Continental Basin exhibits the widest range of multi-year average hydrological drought frequency values, ranging from 1.49% to 83.58%. Areas with frequencies below 40% are primarily located in the central and eastern parts of the Inland River Basin, while areas with frequencies above 60% are mainly distributed in the western, central, and southeastern parts of the Inland River Basin. The majority of the basin’s areas have frequencies ranging from 40% to 60%.
3.3. The Spatial Distribution of Levels of Hydrological Drought Hazard
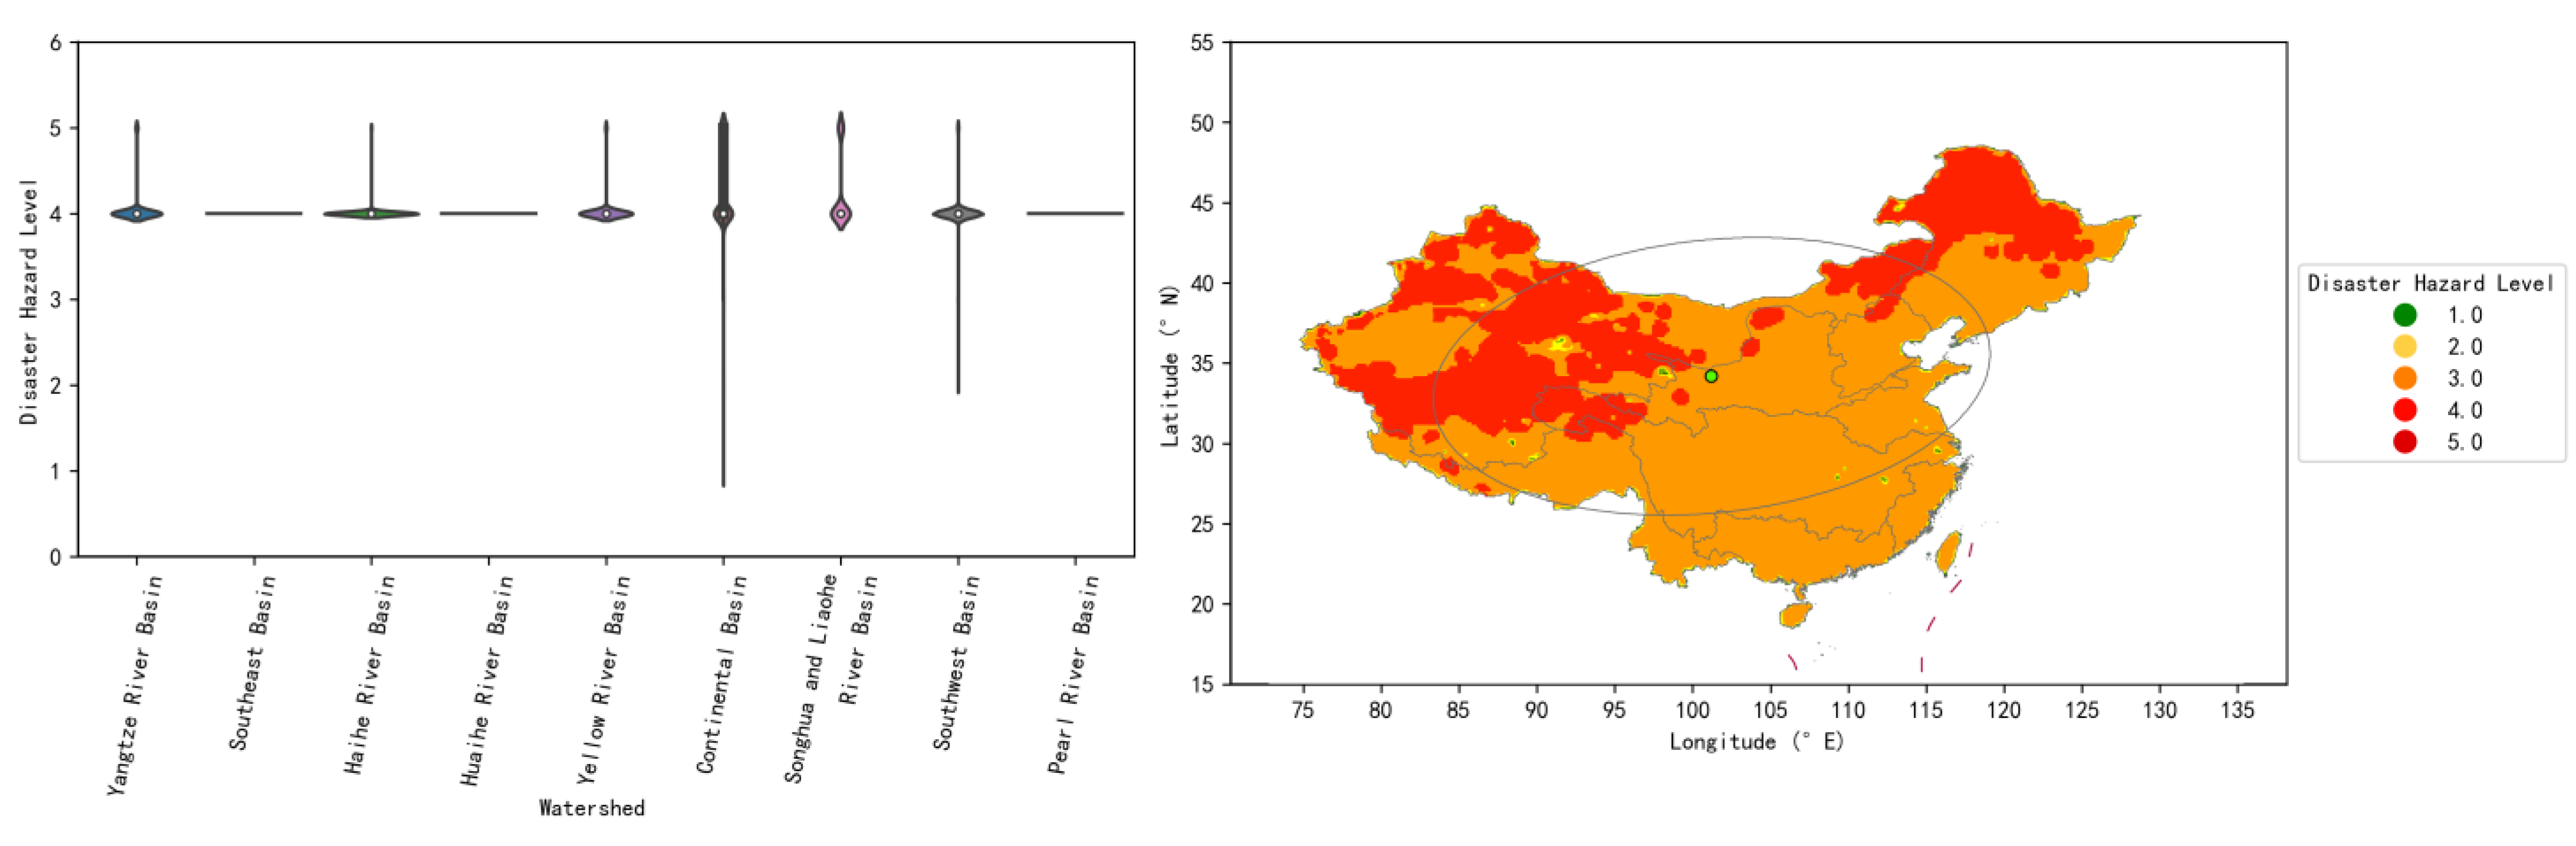
Figure 7 displays a violin plot and a spatial distribution map of the hydrological drought hazard levels in China over 66 years (1948–2014). In the figure, green represents low hazard levels, khaki represents relatively low hazard levels, orange represents moderate hazard levels, red represents relatively high hazard levels, and deep red represents high hazard levels. GeoPandas’ spatial visualization tools and standardized disaster risk indexes are used to create a nationwide high-precision spatial distribution map of the hydrological drought hazard levels in China. Standardized indexes provide spatial comparability and enable an objective assessment of the hazard levels for each pixel. The standardized index offers spatial comparability and enables an objective assessment of the disaster risk levels in various geographic units.
Upon further analysis of the spatial distribution characteristics of the hydrological drought hazard levels, it is evident that the national average of the hydrological drought hazard levels is 4.06 (relatively high hazard), with the center of the hazard levels located in the northern part of China, near the junction of the Yellow River and the Inland River Basins. Among the nine major river basins, the Continental Basin has the highest average hazard level at 4.26, which is 4.93% higher than the national average. This is followed by the Songhua and Liaohe River Basin (4.22), Yangtze River Basin (4.04), Yellow River Basin (4.03), Southwest River Basin (4.01), Haihe River Basin (4.01), Pearl River Basin (4.00), Huaihe River Basin (4.00), and Southeast River Basin (4.00). At the pixel scale of 0.25° × 0.25°, the maximum average hazard level is 5, and the minimum is 1. The spatial differences in the hydrological drought hazard levels are relatively small among the Yangtze River Basin, Haihe River Basin, Yellow River Basin, Songliao River Basin, and Southwest River Basin. Most areas within these basins are classified as relatively high hazard levels. Among these basins, the western part of the Yangtze River Basin, the northern part of the Yellow River Basin, the northern part of the Songliao River Basin, and the northern part of the Southwest River Basin are situated in high-level hydrological drought hazard areas. The western part of the Southwest River Basin experiences relatively lower hazard levels. The Continental Basin exhibits relatively large spatial differences in the hydrological drought hazard levels, with the majority of the basin falling into higher hazard levels (accounting for 26.80%). The northern, western, southwestern, and southeastern regions of the Continental Basin are in high-level hazard areas, while the central part of the basin experiences lower hazard levels.
3.4. Discussion
Lv and Jia pointed out that between 1961 and 2019, precipitation in China showed a non-significant upward trend, with only the Continental Basin showing a significant upward trend [
45]. The precipitation–runoff relationship partly reflects the correlation coefficient between meteorological and hydrological drought [
46]. The water resources of continental basins are mainly replenished by rainfall and ice and snow meltwater. Therefore, the hydrological drought situation in the continental basins is relatively mild with the upward trend of precipitation in the continental basins. The Continental Basin in China is influenced by the monsoonal climate and faces water scarcity issues, making it susceptible to hydrological drought. However,
Table 5 show that there is a significant increasing trend in rainfall in the inland river region, suggesting a tendency toward wetter conditions in the future. Therefore, hydrological drought in the Continental Basin is expected to be alleviated. In contrast, southern China has abundant water resources with many rivers, resulting in overall milder hydrological drought conditions.
Miao et al. found that the water resources in the Songhua and Liaohe Basin present obvious declining trends [
47]. The water resources are rich from 1955 to 2004 [
47]. So, the situation of hydrological drought is milder from 1948 to 2014 and there is a upward trend in the basin’s drought situation.
The Southeast Basin is a typical distribution area of cone, pinnacle, and tower karsts. The storage space of the basin water of different sizes is formed for selected dissolution and erosion of soluble water using soluble water-bearing media to make a certain water storage capacity for the drainage basin [
48]. Therefore, the overall situation of the basin’s hydrological drought is milder. However, the spatial structural combination and its spatial distribution of water storage media on the underlying surface of karst drainage basins are relatively complex; thus, the water storage capacity is quite different in different areas [
48]. Therefore, the spatiotemporal distribution of drought in the basin is complex. In future studies, the watershed needs to be taken as a research object to study the spatiotemporal evolution of hydrological drought.
Precipitation variability significantly affects the drought frequency in the Haihe Basin [
49]. Due to the periodic changes in atmospheric circulation, precipitation in the basin shows an alternating pattern of dry and wet years, with obvious inter-annual changes [
50]. The rate of precipitation decrease is growing, and it has been particularly significant since 1980 [
50]. In some areas of the basin, extreme heavy rains first decreased then increased. In some areas, the frequency of extreme heavy rains decreased as the drought intensified. In general, the situation of drought is milder in the basin. However, there is a upward trend in drought because of the significant downward trend in precipitation.
Between 2021 and 2100, the overall water resources in China will show a slight increase due to climate change [
45]. They also showed that the Huai River Basin, Hai River Basin, Yangtze River Basin, Pearl River Basin, and the Southeast River Basins are predicted to show different rates of water resource increases, while the water resources of the Songhua and Liaohe River Basin, the Continental Basin, and the Yellow River Basin are predicted to gradually decrease under different climate change scenarios [
45]. Hydrological drought is defined by inadequate surface and subsurface water resources [
7]. Referring to the definition of hydrological drought, the trend in regional water resources can support the analysis of regional hydrological drought trends.
The results proved that the hydrological drought of the Huai River basin, Yangtze River basin, and Pearl River Basin is severe, and the trend of hydrological drought of the Continental Basin and the Yellow River Basin is downtrend.
4. Conclusions
In summary, from an annual variation perspective:
The current hydrological drought situation in the Huaihe River Basin of China is severe, and the overall trend in the basin suggests the increasing severity of hydrological drought.
The hydrological drought situation in the Yangtze River Basin is currently severe, and the severity of hydrological drought in the basin is expected to persist for a considerable period.
The hydrological drought situation in the Pearl River Basin, Yellow River Basin, and Continental Basin is currently severe, although there is a tendency for hydrological drought to alleviate in the future.
The Songhua and Liaohe River Basin currently experiences relatively mild drought conditions, but there is an overall trend of increasing severity in hydrological drought.
The hydrological drought situation in the Southeast River Basin and Haihe River Basin is currently mild, with no significant trend in hydrological drought expected in the near future.
The Southwest River Basin currently has a mild hydrological drought situation, and there is a tendency for hydrological drought to decrease in the near future.
From the spatial pattern of hydrological drought in China, it is observed that:
The Continental Basin experiences the most severe hydrological drought overall.
The Huaihe River Basin, Yellow River Basin, and Southwest River Basin also face relatively severe hydrological drought.
The Yangtze River Basin, Southeast River Basin, Haihe River Basin, Songhua and Liaohe River Basin, and Pearl River Basin have relatively weaker hydrological drought conditions.
In terms of the spatial distribution of the levels of hydrological drought hazard in China, there is a general pattern of higher hazard levels in the west and north, and lower hazard levels in the east and south. Most regions exhibit a relatively high hazard level. Specifically, the Continental Basin and Songhua and Liaohe River Basin have an overall high hazard level for hydrological drought. The Huaihe River Basin, Yellow River Basin, and Southwest River Basin have a moderately high hazard level for hydrological drought. The Yangtze River Basin, Southeast River Basin, Haihe River Basin, and Pearl River Basin have an overall lower hazard level for hydrological drought.
However, there are some shortcomings in this research. The GLDAS-2.0 product was used in this study to study the spatiotemporal evolution of hydrological drought and the drought hazard assessment in China. The time period of the product is 1948–2014, so this study lacks analysis of the drought situation after 2014. In future work, multi-product integration research will be carried out to expand the research period. In this study, the SRI index is used to characterize hydrological drought for drought research in China. Using one indicator to conduct drought research in large-scale areas can easily introduce uncertainty. Our next research will consider combining new indicators such as comprehensive drought indicators to conduct drought research to further improve the accuracy of the research results.


