Abstract
This research aims to assess the clogging process of geotextiles within silt fences. For that purpose, the filtering efficiency, flow rate, and clogging of three geotextiles (GTX-1, GTX-2, and GTX-3) employing two distinct soils and under three sediment discharge cycles were investigated. The analysis adhered to the American standard D5141-11 and, as further analyses, qualitative and quantitative inspections were conducted through microscopic images of the materials. The results showed greater clogging of the nonwoven geotextile, GTX-1, with higher retention efficiency (approximately 100%) and better turbidity removal for both soils, equal to a reduction of around 94%. For GTX-2, a woven geotextile with a larger pore opening, less intense clogging and lower retention efficiency were observed after the third discharge; the average was 96% for both soils. GTX-3, a woven geotextile with a smaller apparent opening, exhibited a behavior similar to GTX-1: as the number of cycles increased, the material experienced more clogging and higher retention efficiency for soil 1 (approximately 98.5%). Based on these findings, it can be inferred that the discharge cycles impact the tested geotextiles in diverse ways and, therefore, the selection of the material should be contingent on project requirements.
1. Introduction
Soil erosion and sedimentation are natural processes consisting of separation, transport, and deposition of sediments [1]. This process occurs through erosive agents such as rainfall, ice, and wind, and can be accelerated by civil construction activities [2]. Problems caused by soil erosion and subsequent sedimentation are responsible for environmental impacts on slopes of reservoirs and silted-up rivers, especially in regions with intense rainfall and fine cohesionless soils [3]. Witheridge [4] highlights some of the main impacts of erosion and surface runoff: clogging of stormwater pipes and culverts, sedimentation and increased turbidity in water bodies, erosion due to raindrop impact, and laminar erosion. Therefore, it is crucial to prevent and control erosion to minimize its consequences. Controlling erosion aims to curb or restrain the soil’s gradual and sudden wear and tear [3]. In this context, the implementation of a sediment control system, such as a sediment barrier, incurs lower financial costs than repairing the damages [5].
There are several methods for soil erosion control, such as mulching, contour seeding, check dams, soil correction, stone dikes, chemical stabilizers, and sediment barriers (silt fences) [6]. In this context, geosynthetics with the function of erosion control products have become increasingly popular. Tests on the efficiency of different geosynthetic materials in restraining erosion have been carried out by laboratory and field evaluation [7,8,9].
A silt fence is a linear structure installed along the contours of a slope, serving as a solution for temporary sediment containment. It is composed of geotextiles supported by wooden or metal posts. Its function is to reduce the speed of laminar surface runoff and the deposition of sediments transported from disturbed soil, such as that found in a construction site, through retention. This method is cost-effective and easy to remove [5,10,11]. By preventing the transport of sediments into water bodies, it avoids sedimentation processes, clogging of drainage system pipes, and deterioration of the aquatic environment [5]. According to Koerner [12], silt fences act as efficient filters until the lower region becomes clogged, hindering water passage. This, in turn, leads to sediment accumulation in the area, causing water with fine particles to reach points above the obstructed zone.
Among the materials comprising this solution, geosynthetics, specifically geotextiles, are the main element. Over the past five decades, geotextiles have been used for filtration in engineering, primarily because they are a cost-effective and an environmentally superior solution to traditional granular filters [13]. The primary mechanism of this method is filtration which, according to the International Geosynthetics Society Guide for Geosynthetic Specification [14], concerns retaining soil or other particles subjected to hydrodynamic forces and allowing the passage of fluids through or around the geosynthetic. The guide also emphasizes that the filtration properties of a geotextile depend on hydraulic conditions and soil characteristics (particle size, density, and plasticity). The filtration process differs between the two types of geotextiles—woven and nonwoven. In the former, it happens two-dimensionally within the fabric of the geotextile, whereas in the latter, it takes place three-dimensionally, with retention occurring throughout its thickness [15].
Urashima [16] and Muller et al. [17] discuss the dimensioning and construction methods of silt fences to formulate recommendations for installations and usage. The authors suggest that, in addition to evaluating the filter’s retention capacity, simulations should be conducted to analyze the variation in the system’s permeability over time. Furthermore, Whitman et al. [18,19,20] and Cooke et al. [21] focused on a study to improve the design aspects of silt fences, and showed the efficiency of a silt fence depends on its design and maintenance. Zech et al. [22] studied the use of tiebacks in silt fences. The efficiency of structures, both with and without these reinforcements, was analyzed using an intermediate-scale laboratory apparatus built for the study of erosive processes. The results showed that the incorporation of tiebacks increases barrier efficiency, allowing for sedimentation and filtration, and removing up to 90% of transported sediments. Bugg et al. [23] performed full-scale testing in three silt fence practices and showed that the structural performance is the most important performance factor in retaining sediment, since it allows a large quantity of suspended soil particles to settle out. In a follow-up study, Zech et al. [24] sought to develop a rational numerical method for designing silt fences with tiebacks on highway construction sites. The method empowers designers to select the most appropriate configuration of tiebacks and spacing for the sediment barrier.
In addition to evaluating the installation and maintenance of silt fences, the efficiency of sediment removal also is an important design parameter. Wyant [25] conducted one of the first laboratory studies on silt fences, and his work led to development of ASTM D5141-11 [26]. The standard examines the filtering efficiency and flow rate of the filtering material, assessing the use of geosynthetics in silt fences. The standard provides information to select a geotextile for a particular condition. Based on ASTM D5141-11 [26], the works of Risse et al. [27] and Barbosa et al. [28] evaluated flow-through and sediment removal from different geotextiles and soils. The results showed that geotextiles with lower permeability and apparent opening size exhibited elevated water levels. In general, the sediment removal efficiency for all fabrics was above 90%.
Cavalhieri [29] assessed the performance of nonwoven geotextiles in sediment barriers using two distinct types of samples, in used and unused conditions. The findings revealed that employing previously used nonwoven geotextiles resulted in enhanced turbidity removal, accompanied by lower turbidity levels associated with reduced flow rates. These observed behaviors can be attributed to the presence of sediments in the previously used samples, reducing the permeability and apparent opening of the materials, thereby enhancing the particle retention process. Furthermore, it was noted that new specimens exhibited a more pronounced increase in turbidity removal with each repetition compared to used ones. Gogo-Abite and Chopra [30] investigate the performance of woven and nonwoven geotextiles in a field-scale tilting test-bed. The results showed that the woven geotextile achieved lower performance efficiencies than the nonwoven geotextile concerning turbidity and sediment concentration reduction, due to smaller apparent opening size and formation of filter cake on the fabric. As observed by the previous studies, the mechanism of physical clogging is not fully understood and remains incompletely defined. Miszkowska et al. [31] created an artificial clogging system to study the cyclic water flow and filtration characteristics of geotextiles. The authors reported it was difficult to establish a linear correlation between the geotextile properties and hydraulic conditions.
Building upon the findings of the aforementioned studies, this study aimed to analyze the clogging process and filtering efficiency of three geotextiles according to ASTM D5141-11 [26]. The analysis involved two soils with different particle size distributions and three sediment discharge cycles. The assessment encompassed filtering efficiency, material flow rate, and turbidity of the percolate, as well as microscopic analyses and a quantitative evaluation of soil impregnation in the geotextiles based on images obtained after each discharge cycle.
2. Materials and Methods
2.1. Soils Tested
For this study, two distinct soil samples representative of the Vale do Paraíba region in São Paulo, Brazil, were collected. Soil 1 corresponded to a young residual soil, identified as silty sand and classified by the USCS as SW (well-graded sand). Soil 2, characterized as a colluvial clay of sandy nature, fell under the classification MH (high plasticity silt), as established by Pereira [32]. In this work, the author evaluated the soil’s erodibility based on laboratory tests compared to classic geotechnical characterizations. The results obtained showed that the soil studied had a medium to medium-high erosion susceptibility.
The essential characteristics of both soils are summarized in Table 1.

Table 1.
Main physical properties of the tested soils.
2.2. Geotextiles
In order to assess the efficiency and clogging of sediment barriers, three types of geotextiles were tested, using a total of 18 samples distributed equally across three groups: GTX-1, GTX-2, and GTX-3 (therefore, 6 samples for each one). Table 2 includes the materials’ specifications.
Table 2.
Geotextiles’ specifications.
The materials were selected to enrich the discussions on the behavior of geotextiles in sediment barriers, especially woven and nonwoven, from materials of different specifications and usual applications.
GTX-1 represents the most widely used type of geotextile in Brazil for erosion control as a sediment barrier. This material was chosen as an example of a non-woven geotextile, showing clogging in all three dimensions.
Among the woven geotextiles, both with a bi-directional weave, the one most used commercially as a sediment barrier and studied in previous research [17,28] for erosion control, filtering and separating materials was GTX-2, with a flat weave.
Finally, GTX-3, which has a diamond-type weave and is characterized by its high permeability and sediment retention capacity; due to the lack of previous studies on this material in this application, it was decided to carry out tests with this geotextile. Therefore, this work sought to evaluate the behavior of this woven geotextile, already widely used in sludge dewatering.
2.3. Laboratory Tests with the Sediment Barrier
The tests conducted to determine the filtering efficiency and flow rate of the geosynthetics were carried out following ASTM D5141-11 [26], which allows for the calculation of filtering efficiency and material flow rate. Modifications were made to the protocol for this study to adapt it to the available conditions in three respects: homogenization of the samples before discharge, filtration of the effluent to determine the mass of soil passing through the geosynthetic and turbidity measurement.
In this regard, Figure S1 illustrates the general scheme of the equipment used, including its dimensions, and Figure 1 provides a photograph of the apparatus assembled in the laboratory.
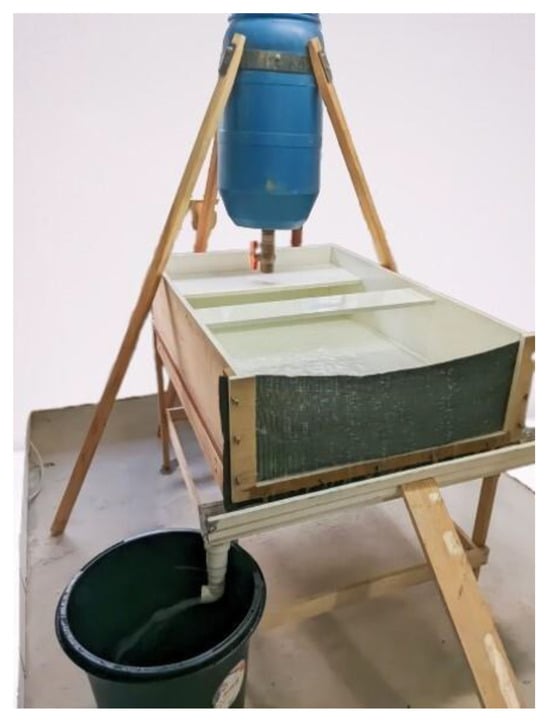
Figure 1.
Photo of the apparatus used in this study with the geotextile assembled.
Due to the geometry of the upper reservoir, it was found that manual mixing was sufficient to be able to mix the sediments homogeneously in a simplified manner. Therefore, this was the technique used in all the experiments.
To quantify the soil that passed through the geotextile, we opted to substitute the filter proposed with the 400 mesh sieve(38 μm). The mesh opening of the sieve (38 μm) and the filter (20 μm) were within the same range in silt grain size, leading to the conclusion that the amount of passing soil retained on the sieve would not be significantly different compared to that on the filter. The soil retained on the sieve and passing through the geosynthetic was placed in capsules and subjected to heating in an oven at 105 °C for a minimum of 24 h to determine the weight of the total dry soil that passed through the geotextile. In this step, a balance with a precision of 0.01 g was used.
As turbidity is a metric often used by regulatory agencies to quantify the quality of stormwater discharges from construction sites [23], this measurement was added to this research. We measured the turbidity of the water with sediments in the initial state—before the filtration process and after collecting the effluent from each test passing through the sieve. The selected value, in both instances, was the arithmetic mean of three consecutive readings. The TU 43 model instrument was employed for these measurements, allowing readings up to 1000 NTU with an accuracy of ±(0.5 NTU + 5%).
From these data, we computed the samples’ filtering efficiency (FE) and flow rate (Ft) utilizing the equations and nomograms recommended by the standard. The filtering efficiency of the geotextile was determined through Equation (1).
in which A—capsule + residue weight (g); B—weight of the capsule (g); and 150—the initial sediment mass (g).
For test durations less than 25 min, i.e., where complete drainage occurred before reaching t = 25 min, Equation (2) was applied.
in which Ft—flow rate (m3/m2/min); t—test duration (min).
For test durations equal to 25 min, i.e., where the water depth measured at the instant t = 25 min was not zero, Equation (3) was used.
in which Ft—flow rate (m3/m2/min); xf—water depth at t = 25 min (mm); t—test duration (min).
To correct the flow rate to a temperature of 20 °C, Equation (4) was applied.
in which T—water temperature measured in the laboratory (°C); Ft—filtering efficiency at temperature T (m3/m2/min); Ut/U (20 °C)—viscosity ratio at temperature T and 20 °C.
The Ut/U (20 °C) ratio was obtained using the chart provided in ASTM D5141-11 [26].
The geotextile samples were cut to dimensions of 95 cm in length and 35 cm in height to ensure proper placement at the entrance opening of the channel, preserving the geotextile’s integrity by avoiding holes and preventing any structural damage.
To assess pore clogging in the geotextiles, up to three cycles were conducted— equivalent to three repetitions of the standard test—on the same material. Consequently, 36 tests were performed for the research, since the microscopic analysis required the samples to be cut, significantly impacting their behavior upon reuse.
For systematic organization and control, each sample was assigned a standardized code, GTX-I S.C, where GTX-I denotes the geotextile type, S the soil used, and C the total number of cycles performed. For instance, a sample of geotextile type 1, subjected to three cycles of tests with soil 1, was labeled as GTX-1 1.3.
Between each test repetition, there was a minimum 24 h interval, with the sample being moistened only in the first cycle. This approach was adopted to simulate the functioning of the geotextile in a real-world scenario, taking into consideration the time factor and the enhanced soil adhesion in its dry state and thus allowing for an analysis of potential increased clogging in the geotextile openings.
2.4. Microscopic Analysis
The microscopic analyses were conducted using the Zeiss Axio Imager Z2M Microscope, Zeiss Group, Germany. To enhance contrast between soils and geotextiles, the Darkfield option was employed with 5× and 10× lenses.
Due to spatial limitations of the instrument, it was necessary to select representative areas of each tested material for cutting. Consequently, the microscopic analysis of geotextiles was not performed between each cycle of testing. Instead, the final state was analyzed after 1, 2, and 3 cycles in different samples, as cutting would significantly impact their performance.
The lower central region was adopted as the standard, as visualized in Figure S2, defined by a rectangle of dimensions 7 × 5 cm, approximately. The chosen area visually represented the region with the greatest soil impregnation, as can be seen later in the results. It is important to note that despite the limitations of the area analyzed, the standardization of the area (central region of the geosynthetic) visually ensured that the clogging effect could be assessed.
Initially, a map was generated with 81 images captured in 9 rows and 9 columns, with a scale of 0.69 μm/pixel at 5× magnification. Additionally, to assess specific details, particularly related to the geotextile openings and possible clogging, one point from each map was selected for enlargement at 10× magnification, with a scale of 0.34 μm/pixel.
The qualitative outcomes derived from the maps of each material—for both soils subjected to three testing cycles—were employed to quantify (through FIJI Image J software, win 64-bit) the soil impregnation in the geotextile. The segmentation-trainable Weka plugin was applied, which utilizes machine learning techniques to categorize distinct classes within the provided images. This plugin transforms the segmentation problem into a pixel classification problem in which each pixel can be classified as belonging to a specific segment or class [35].
This technique has been used in several studies with considerable success [35,36,37]. Staniewicz and Midgley [36] pointed out that the machine learning method provides a much more accurate image classification than conventional thresholding and does not require altering the source data with image filters before processing.
Segmentation used the software’s existing training features: Gaussian blur, the Hessian matrix, Sobel filter, membrane projection, and differences of Gaussians, by means of the random forest method, dividing the map into two classes: soil and geotextile. Following a classification training to check the results were visually appropriate, the plugin offered quantification for each class, enabling the assessment of the evolution of soil impregnation in the tested materials.
3. Results and Discussions
The evolution of the discharge cycles in each analyzed geotextile, for both studied soils, was assessed based on the parameters obtained in the tests, namely percolate turbidity, filtering efficiency, flow rate, and clogging in the pore openings.
3.1. Turbidity
The change in turbidity over cycles for each geotextile in both soils is depicted in Figure 2. It is important to highlight that across all groups a substantial decrease in initial turbidity was evident starting from the first cycle for both examined soils. The turbidity values for soil 1 consistently exceeded those for soil 2, primarily attributed to the initial turbidity of the samples before undergoing filtration by the geotextile (initial condition).
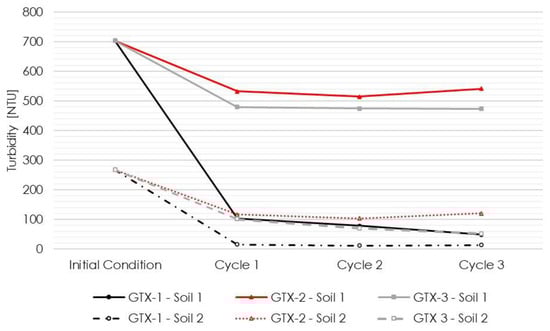
Figure 2.
Turbidity evolution throughout discharge cycles examined for the two tested soils across the three evaluated geotextiles.
We considered the geotextile retention criteria according to Christopher and Holtz [38], as expressed in Equation (5).
in which O95—percentage opening size of geotextile; D85—diameter, for which 85% in mass of the remaining soil particles are smaller than that diameter; B—parameter that depends on the characteristics of the soil (soil 1 = 1; soil 2 = 1—woven geotextile, and 1.8—nonwoven geotextile).
It is noted that the maximum diameters (D85) of the particles of soil 2 (Table 1) were lower than the apparent opening sizes of GTX-2 and had similar values to GTX-3 (Table 2). In general, for the particle size and geotextile opening dimensions involved, the coarser the soil, the greater the diameter of the particles that piped through the geotextiles [9].
For GTX-1, optimal performance was observed, showing a substantial decrease in initial turbidity for both soil types. A continuous decrease in turbidity was noted, directly proportional to the number of cycles conducted on the same sample. In terms of the percentage difference between the initial and final turbidity values, there was a gradual increase in reduction from 85% to 93% for soil 1. For soil 2, there was a practically constant average reduction in turbidity of 95%.
According to Cavalhieri [29], prolonged use of the geotextile led to the adherence of dissolved solids, causing a reduction in the diameter of its pore openings and, consequently, enhancing turbidity removal. This phenomenon became more apparent when multiple cycles were conducted on the same sample. However, the present study observed that this occurrence was not uniform across all sample types, likely due to the limited number of cycles conducted and variations in material characteristics, such as pore opening.
GTX-2 exhibited the least favorable performance, displaying the smallest reduction in turbidity among the three geotextile types: around a 25% reduction for soil 1 and a 57% reduction for soil 2. In this sample, a slight decrease in turbidity was noted in the second cycle. Conversely, during the third cycle, an increase in turbidity was noted in both types of soil, surpassing even the levels observed in the first cycle. Despite the few cycles tested and the difficulty in understanding the behavior, a greater deformation of this material was observed throughout the tests.
Furthermore, as mentioned in the material specifications (item 2.2), among the materials tested, this woven geotextile had the largest opening size. Analyzing the soils tested, this opening size is larger than the D50 of soil 1 and the D85 of soil 2.
A possible explanation for the lower reduction in turbidity in GTX-2 with soil 1 may be associated with the fact that this soil showed greater sedimentation of the coarse fractions on the apparatus ramp. As a result, a pre-filter was not formed, and the entire fine portion of the soil passed through the geotextile. As turbidity is related to the suspended solids in the solution, the change was not very significant. On the other hand, it is believed that in soil 2, due to a significant percentage of clay and sand, a better pre-filter was established, increasing the reduction in turbidity.
GTX-3 showed the same trend as GTX-2, where there was no substantial reduction in turbidity for soil 1 (around 33% reduction). However, for soil 2, a decrease in turbidity was noted, reaching a reduction of around 80% after the third cycle. The same explanations can be associated with the phenomenon; however, as the pore opening size was a little smaller, the retention process was better.
When comparing the results obtained with nonwoven geotextiles, on a small scale, with the results reported in the literature, on a large scale, there is a divergence in behavior. Whitman et al. [18] and Bugg et al. [23] evaluated the upstream and downstream water quality during the performance of the tests. Both researchers indicate that none of the silt fences evaluated provided an improvement in turbidity between the upstream and downstream sampling points. Moreover, turbidity upstream was less than downstream during the testing period. This phenomenon can be attributed to upstream impoundment formation, which allows soil particle sedimentation to occur [18]. This phenomenon was not observed in this study.
A similar pattern to that in this study was observed by Faucette et al. [39], who found that the silt fence reduced turbidity by up to 70%. It is important to explain that in both works, the turbidity measurements were taken after the water samples had been homogenized.
3.2. Filtering Efficiency
Regarding filtering efficiency results (Figure 3), it was observed that the nonwoven geotextile GTX-1 exhibited greater solids retention compared to the woven geotextiles GTX-2 and GTX-3.
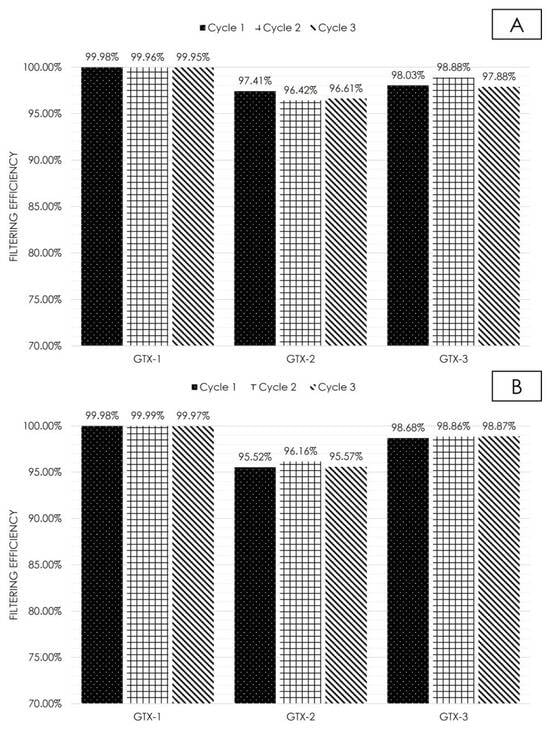
Figure 3.
Filtering efficiency throughout discharge cycles examined for the two tested soils across the three evaluated geotextiles. (A) Soil 1. (B) Soil 2.
This was an expected result, as GTX-1 was the only nonwoven geotextile among the materials studied and the one with the smallest apparent pore opening size. Nonwoven geotextiles have a different distribution of filaments to woven geotextiles: they have randomly distributed filaments that form a planar structure. Woven geotextiles, on the other hand, are composed of two sets of linear elements systematically intertwined, with defined and standardized pore openings. As a result of this difference in configuration, they have a greater number of confrontation points, i.e., a greater likelihood of retaining sediment throughout their thickness, which increases their filtration efficiency. In woven geotextiles, where filtration takes place only in the weave region, i.e., only clashes on the surface, the number of clashes is lower and therefore clogging is less intense.
The results obtained in the laboratory are in line with those verified in the field by Whitman et al. [20], where sediment retention capabilities for nonwoven wire-reinforced silt fence installations that did not experience overtopping flows or undermining ranged between 90% and 100%.
As noted in Cavalhieri’s study [29], nonwoven geotextiles exhibit higher efficiency compared to new ones. Additionally, Palmeira et al. [40] showed that the retention capacity of nonwoven geotextiles increased due to the flow conditions and impregnation by soil particles. This hypothesis was not confirmed in the three cycles carried out in this research, since the filtering efficiency remained practically constant and very close to 100% in the two soils analyzed.
The GTX-2 group’s filtering efficiency value, although similar to that of the other groups, was the lowest. As this was the material with the largest apparent pore opening size, it is natural that the particle retention process was more difficult than that of the others. In addition, there was a noteworthy deformability of the material during the tests, which may have altered the pore opening size, even if only minimally, with each cycle carried out. The efficiency of the material for the two types of soil was similar, with no significant variation.
For GTX-3, intermediate filtering efficiency values were observed, with almost constant values when comparing the two types of soil. There was no significant variation in the parameter when the tests were repeated.
In summary, it is emphasized that all three materials demonstrated efficiencies surpassing 95%, with no significant variation in efficiency observed among different geotextile types based on soil type.
3.3. Flow Rate
Initially, focusing on flow rate and accounting for the correction factor stipulated by the standard, there was a noteworthy impact of temperature on the obtained results. Water viscosity varied according to temperature, interfering with the results, even if not significantly. The results were adjusted according to the ASTM D5141 standard [26], which corrects the data based on the relationship between the viscosity at the temperature at which the test was carried out and the standard temperature of 20 °C. As the test temperature increased, the applied correction factor decreased, leading to reduced flow rate values.
Throughout this study, the average temperature maintained during the tests was 23.2 °C. Overall, thermal fluctuations between cycles were minimal, except for those associated with GTX-2, exhibiting an approximate variation of 2.5 °C. Despite the small impact observed, the ideal way to get around this variation is to standardize the test temperature through thermal control in the laboratory.
In terms of the flow rate results, an inversely proportional relationship to efficiency was observed, wherein an increase in efficiency corresponds to a decrease in the flow rate. This observation aligns with findings from Gogo-Abite and Chopra [30], who linked lower turbidity values to reduced flow rates. The GTX-1 group exhibited this behavior most prominently, with the lowest flow rate values decreasing with each cycle. This outcome was anticipated due not only to the lower permeability within the groups but also to the material’s increased susceptibility to clogging, attributed to its weave type, smaller pore openings, and substantial thickness.
It is also important to point out that in the field, in addition to the characteristics of high soil impregnation, other conditions must be considered in the specification of the geotextile, such as mechanical and endurance properties. When the product meets such requirements, a very cost-effective and quick-to-install barrier for sediments can be employed [40].
Concerning geotextile GTX-2, in line with previous turbidity and efficiency results, an increase in the flow rate was observed for soil 1. As mentioned above, this is possibly due to the significant percentage of sand and silt in soil 1, which gave the mixture greater mass, enhancing the sedimentation process on the apparatus ramp. As the soil remained partially on the surface of the ramp, the flow rates were higher. It was also found that the flow rates increased as the cycles were repeated. On the other hand, for soil 2 there was a decrease in flow rates as the cycles were carried out, due to the probable formation of a pre-filter; i.e., retention of particles by larger particles retained by the geotextile because of the gradation of the soil.
For geotextile GTX-3, the highest flow rate was observed in soil 1, showing a gradual decrease with each cycle. In contrast, soil 2 exhibited consistent values across cycles, with a slight decrease as the cycles progressed.
The results in Table 3 and Figure 4 illustrate the inversely proportional relationship between water level and flow rate. This is primarily attributed to sediment accumulation in the material’s pores, hindering the mixture’s passage in the lower region and consequently elevating the water level and decreasing the flow rate, as explained in [12].
Table 3.
Flow rate results.
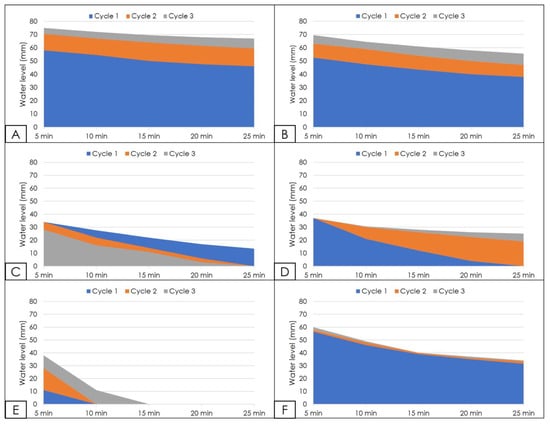
Figure 4.
Water level throughout the test. (A) GTX-1, soil 1. (B) GTX-1, soil 2. (C) GTX-2, soil 1. (D) GTX-2, soil 2. (E) GTX-3, soil 1. (F) GTX-3, soil 2.
For the GTX-1 sample (Figure 4A,B), the observed lower flow rate was intimately linked to blinding and clogging phenomena, both characteristic of nonwoven geotextiles.
Regarding geotextile GTX-2 (Figure 4C,D), the water level exhibited variation based on the soil type. For soil 1, there was a reduction in the water table over the cycles. This behavior was linked to the increase in flow rate, caused by the increase in flow velocity due to the reduced mass of sediment. For soil 2, the behavior was similar to that of the other materials, with an increase in the water table as the cycles were carried out.
Lastly, in the case of geotextile GTX-3 (Figure 4E,F), a similar trend to that of GTX-1 was observed, featuring an increase in water level with each cycle, with less clogging, especially in the case of soil 1. It is noteworthy that GTX-1 exhibited a distinctive behavior in soil 1, likely attributable to its smaller pore openings. Additionally, the clogging of pore openings occurred faster with soil 1, leading to a more pronounced decline in the flow rate. For soil 2, the clogging of pore openings was evident from the initial cycle, resulting in similar flow rate values across subsequent conducted cycles.
The flow rate and water level are important parameters to evaluate, since in practice they are associated with stresses on the geotextile and upstream impoundment formation. This formation decreases turbidity along the surface of the impoundment water column, similar to the processes that take place within sediment basins [18].
3.4. Clogging
The examination of clogging took place at both macroscopic and microscopic levels. Initially, through visual inspection of the tests on the three geotextiles, it was observed that GTX-1 experienced a quicker onset of obstruction compared to woven geotextiles, commencing within the initial minutes of the first pass. This led to a gradual decrease in the water level and incomplete drainage throughout the test period (t = 25 min), with the most substantial layer of adhered sediments observed in this particular sample.
More intense clogging of the material requires more frequent washing or replacement of the filter. According to Urashima [15], this is enhanced by very fine particles, due to the low hydraulic conductivity barrier they quickly create.
Secondly, GTX-3 encountered obstruction midway through the test, exhibiting a less substantial layer of sediments compared to the nonwoven fabric. Nevertheless, in subsequent cycles, a gradual reduction in the water level was observed from the initial minutes.
GTX-2 exhibited the lowest level of clogging among the three groups, with soil impregnation at its bottom in the three cycles conducted on the sample. Additionally, it was observed that soil adhesion to the geotextile occurred on the weave, without interfering with pore openings. There was a higher degree of clogging in soil 2, due to the characteristics of the grains, which explains the higher flow rates in this soil.
Considering only the woven geotextiles, more clogging was visually observed in the material with the smallest apparent opening size. As a result, different degrees of clogging can be observed on a macroscopic scale in Figure 5.
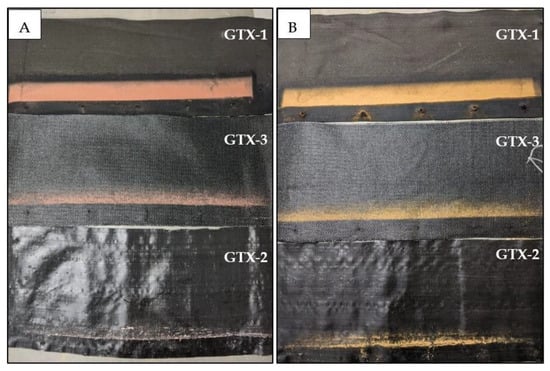
Figure 5.
Photos of the geotextile samples after the third sediment discharge. (A) Soil 1. (B) Soil 2.
The distinction between the filtration processes for the two types of materials, woven and nonwoven geotextile, as described earlier, is apparent in these findings. Nonwoven clogging was more pronounced owing to the higher number of contact points, as particle retention occurred three-dimensionally, and its structure comprised randomly distributed filaments. In contrast, the filtration process in woven geotextiles was confined to their weave, making it less substantial.
Furthermore, in alignment with the previously discussed findings, the images captured by the optical microscope illustrate the progression of discharge cycles for the three materials in the two examined soils (Figure 6, Figure 7 and Figure 8). To provide a more detailed insight into material impregnation within the pores, Figure 9, Figure 10 and Figure 11 showcase images from the third discharge cycles, with emphasis on the respective areas of the material.
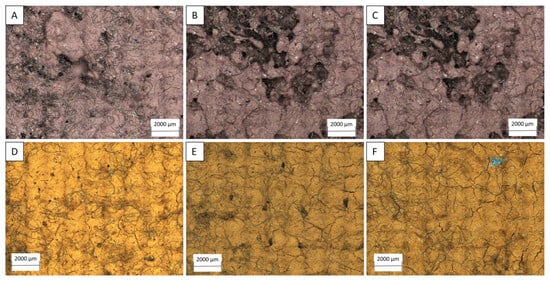
Figure 6.
Map of photos taken with the optical microscope—GTX-1. (A) Soil 1, cycle 1. (B) Soil 1, cycle 2. (C) Soil 1, cycle 3. (D) Soil 2, cycle 1. (E) Soil 2, cycle 2. (F) Soil 2, cycle 3.
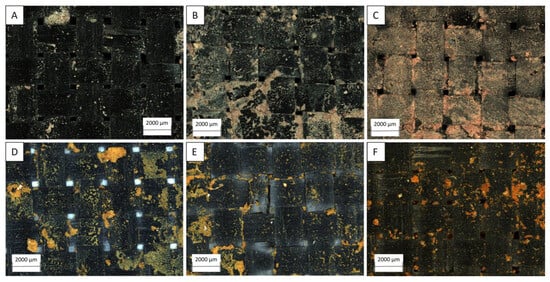
Figure 7.
Map of photos taken with the optical microscope—GTX-2. (A) Soil 1, cycle 1. (B) Soil 1, cycle 2. (C) Soil 1, cycle 3. (D) Soil 2, cycle 1. (E) Soil 2, cycle 2. (F) Soil 2, cycle 3.
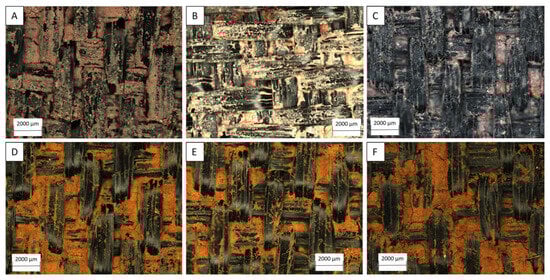
Figure 8.
Map of photos taken with the optical microscope—GTX-3. (A) Soil 1, cycle 1. (B) Soil 1, cycle 2. (C) Soil 1, cycle 3. (D) Soil 2, cycle 1. (E) Soil 2, cycle 2. (F) Soil 2, cycle 3.
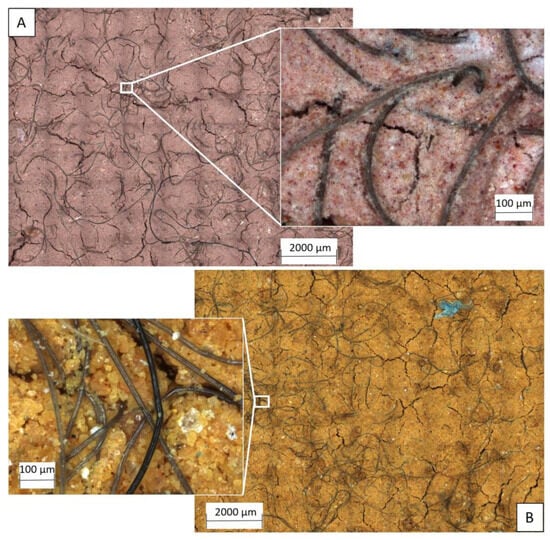
Figure 9.
Details of soil impregnation in the geotextiles after the third cycle—GTX-1. (A) Soil 1. (B) Soil 2.
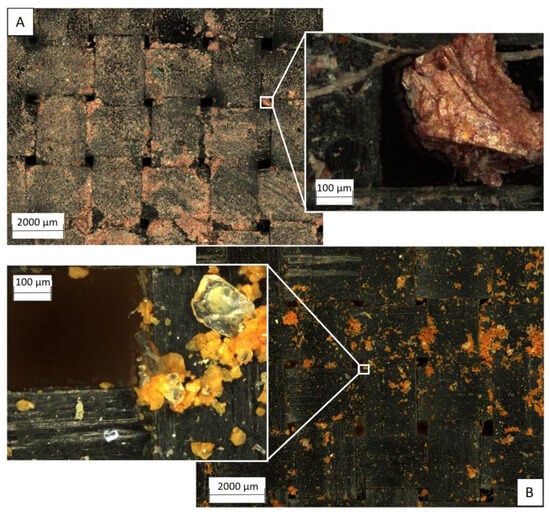
Figure 10.
Details of soil impregnation in the geotextiles after the third cycle—GTX-2. (A) Soil 1. (B) Soil 2.
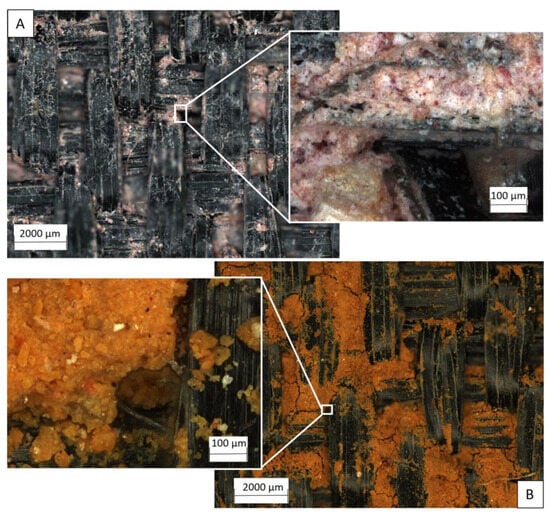
Figure 11.
Details of soil impregnation in the geotextiles after the third cycle—GTX-3. (A) Soil 1. (B) Soil 2.
As outlined in Section 2.4, the quantification of soil in the geotextile, conducted through FIJI Image J software, win 64-bit, is detailed in Table 4. From this, it is possible to assess the percentage of soil impregnated in the geotextile during each cycle for each sample and soil type.
Table 4.
Quantification of soil in the geotextile by segmentation plugin in FIJI Image J, win 64-bit.
In the case of GTX-1, a swift adhesion of soil to the nonwoven fabric was noted in both soil types from the initial cycle, showing an inclination to escalate due to induced clogging.
For GTX-2, within the microscopically examined area, it was observed that in soil 1, impregnation occurred in the weave, essentially staining the material with fine soil particles. Despite the increased impregnation with cycles, this phenomenon was not associated with the obstruction of pore openings by coarse soil particles. As for soil 2, soil impregnation did not stain the weave, resulting in a small percentage of material adhered to the geotextile for the three analyzed cycles. It is worth noting that for both soil types, despite soil impregnation in the geotextile, there was no clogging in the pore openings.
Lastly, GTX-3 exhibited an overall soil impregnation of approximately 40% of the area for both soils across the three evaluated cycles. Notably, in soil 1, there was an observable trend of decreasing soil impregnation with cycles. Conversely, for soil 2, it can be concluded that the discharge cycles did not exert a significant influence on soil impregnation.
3.5. Joint Analysis of Evaluated Parameters
Firstly, for a more precise analysis of the behavior of the materials, a greater number of cycles should be carried out on the same sample, to simulate the situation of the sediment barrier in the field. In addition, it is recommended to study possible installation damage and degradation of the materials, which affect their performance. Rosa et al. [41] point out that the soil can contain sediments that are harmful to the elements of the sediment barrier, affecting its resistance and durability over time. In addition, standardizing the temperature of laboratory tests would be recommended for future research.
Table 5 summarizes the characteristics obtained for each material group tested in the two soils.
Table 5.
Summary of evaluated characteristics for each geotextile type.
From this, it is evident that the nonwoven geotextile (GTX-1) showed the most effective performance in terms of turbidity removal, regardless of the soil type. The observed difference in effectiveness was attributed to the lower apparent opening size from the GTX-1, which was 0.1 mm and was lower than the D85 of both soils. Nevertheless, this efficacy was accompanied by a reduction in flow rate and an increase in material clogging. It was noted that this clogging became apparent from the initial sediment discharge cycle for both examined soils.
Despite their good performance, it should be noted that the greater potential for clogging requires more frequent filter changes or washing. In addition, the greater deformability under traction of nonwoven geotextiles compared to woven ones, although making it easier to accommodate uneven terrain, may require a greater number of support points or the installation of other material to compensate [41].
Regarding woven geotextiles, it is important to highlight that GTX-2 showed the least effective performance in turbidity removal. However, in contrast, it presented an average flow rate and lower clogging. In essence, the discharge cycles had a minimal impact on the material’s performance, as it maintained a more consistent operation across the three tested cycles in the two evaluated soils.
GTX-3 exhibited a moderate performance in removing turbidity during sediment discharge and in material clogging across the cycles. Despite its moderate performance, the filtering efficiency values were high, particularly for soil 1, which had a coarse granulometry, and demonstrated higher flow rates.
Finally, another aspect to consider is the cost of materials, which are listed in ascending order of cost as follows: GTX-2, GTX-1, and GTX-3. Despite showing a lower performance than that of the other geotextiles, GTX-2 was the most affordable, as well as requiring less frequent washing and replacement.
4. Conclusions
The purpose of this study was to assess the performance of silt fences using various geotextiles in two different soil types over three sediment discharge cycles. Analyses conducted on both macroscopic and microscopic scales indicated that the clogging process was, overall, minimally affected by the soil type.
The influence of discharge cycles was more pronounced when evaluating the water level behind the barrier and the flow rate, with the soil type notably affecting the results, particularly in woven geotextiles. However, in order to better understand the effect of cycles on the behavior of materials, it is necessary to carry out more tests. A more complete assessment of the effect should involve a greater number of cycles, analysis of geotextile degradation and practical application on a large scale.
Based on the summarized findings, it can be deduced that selecting the most appropriate geotextile for silt fence applications hinges on the specific requirements of each project. In scenarios emphasizing improved effluent clarification, particularly in locations near water bodies, GTX-1 proved to be a more suitable choice. However, being a nonwoven geotextile, it is susceptible to clogging, requiring more frequent material exchanges and, consequently, incurring higher maintenance costs. In situations where effluent clarification and material cost are not decisive factors, GTX-3 could be a viable option due to its performance, despite the higher unit cost. As the most economically feasible product, GTX-2 excels in scenarios where achieving high turbidity removal is not the primary objective, and cost is of greater significance. It is crucial to emphasize, however, the importance of analyzing the compatibility between soil particle size and the apparent opening of this material.
Supplementary Materials
The following supporting information can be downloaded at: https://www.mdpi.com/article/10.3390/w16010107/s1, Figure S1: Scheme of the apparatus used in the study, according to ASTM D5141-11 [26]; Figure S2: Highlighted geotextile area that was used in the analysis with the optical microscope.
Author Contributions
V.Y.G.A.: data curation, writing original draft, methodology and conceptualization; J.S.F.R.: data curation, writing original draft, methodology and conceptualization; M.F.B.M.: supervision, conceptualization, writing original draft, review and editing; G.O.M.P.: conceptualization, writing original draft, review and editing; L.R.d.O.H.: conceptualization, review and editing; E.F.F.: review and editing. All authors have read and agreed to the published version of the manuscript.
Funding
This study was financed in part by São Paulo State University (UNESP), through Edital 06/2023.
Data Availability Statement
The data presented in this study are available on request from the corresponding author.
Acknowledgments
The authors acknowledge Huesker Ltda. for donating the geotextiles used in the research.
Conflicts of Interest
The authors declare no conflict of interest.
References
- Morgan, R.P.C. Soil Erosion and Conservation; Blackwell Science: Oxford, UK, 2005; p. 11. [Google Scholar]
- Government of Alberta. Field Guide for Erosion and Sediment Control, 2nd ed.; Government of Alberta: Edmonton, AB, Canada, 2011; Section 4; p. 1. [Google Scholar]
- Toy, T.J.; Foster, G.R.; Renard, K.G. Soil Erosion: Processes, Prediction, Measurement, and Control; John Wiley and Sons: New York, NY, USA, 2002; pp. 10–20. [Google Scholar]
- Witheridge, G. Erosion and Sediment Control—A Field Guide for Construction Site Managers; Version 4; Catchments & Creeks Pty Ltd.: Brisbane, Australia, 2012; pp. 7–15. [Google Scholar]
- EPA. Stormwater Best Management Practice; Office of Water: Washington, DC, USA, 2012; p. 1. [Google Scholar]
- Kumarasinghe, U. A review on new technologies in soil erosion management. J. Res. Technol. Eng. 2021, 2, 120–127. [Google Scholar]
- Theisen, M.S. The role of geosynthetics in erosion and sediment control: An overview. Geotext. Geomembr. 1992, 11, 535–550. [Google Scholar] [CrossRef]
- Lins da Silva, J.; Valentin, C.A.; Kobelnik, M.; Pedroso, G.O.M.; Aparício-Ardila, M.A.; Araújo Júnior, L.P.V.D.; Luz, M.P.D. Mechanical and Thermoanalytical Study of Polypropylene Geomats Exposed in the Field and the Laboratory. Materials 2023, 16, 4148. [Google Scholar] [CrossRef] [PubMed]
- Farias, R.J.C.; Palmeira, E.M.; Carvalho, J.C. Performance of geotextile silt fences in large flume tests. Geosynth. Int. 2006, 13, 133–144. [Google Scholar] [CrossRef]
- Caltrans Storm Water Quality Handbooks. In Construction Site Best Management Practices Manual; State of California: Sacramento, CA, USA, 2003; SC-1.
- Horsley Witten Group. CNMI and Guam Stormwater Management Manual; Commonwealth of the Northern Mariana Islands and the Territory of Guam: Territory of Guam, GU, USA, 2017; Appendix A-25. [Google Scholar]
- Koerner, R.M. Designing with Geosynthetics, 5th ed.; Pearson: Upper Saddle River, NJ, USA, 2005; p. 257. [Google Scholar]
- Palmeira, E.M. A review on some factors influencing the behaviour of nonwoven geotextile filters. Soils Rocks 2020, 43, 351–368. [Google Scholar] [CrossRef]
- International Geosynthetics Society. Guide to the Specification of Geosynthetics; IGS Secretariat: Easley, SC, USA, 2006; pp. 7–9. [Google Scholar]
- Urashima, D.C. Simulação do Processo de Retenção de Partículas por Filtros Têxteis. Ph.D. Thesis, Technological Institute of Aeronautics (ITA), São José dos Campos, Brazil, 2002. (In Portuguese). [Google Scholar]
- Urashima, D.C.; Vidal, D. Barreiras de Sedimento: Definição e Dimensionamento. In Proceedings of the Seminário Nacional sobre Geossintéticos na Geotecnia Ambiental, São José dos Campos, Brazil, 26–27 November 2001. (In Portuguese). [Google Scholar]
- Müller, M.; Vidal, D.; Andrade, E.M. Construction methodology and dimensioning of silt fences: Scientific, normative and laboratorial review. In Proceedings of the 11th International Conference on Geosynthetics, Seoul, Republic of Korea, 16–21 September 2018. [Google Scholar]
- Whitman, J.B.; Perez, M.A.; Zech, W.C.; Donald, W.N. Practical Silt Fence Design Enhancements for Effective Dewatering and Stability. J. Irrig. Drain. Eng. 2021, 147, 04020039. [Google Scholar] [CrossRef]
- Whitman, J.B. Improving the Design and Performance of Double-Row Sediment Barriers Used During Highway Construction. Transp. Res. Rec. 2023, 2677, 1241–1252. [Google Scholar] [CrossRef]
- Whitman, J.B.; Zech, W.C.; Donald, W.N.; LaMondia, J.J. Full-Scale Performance Evaluations of Various Wire-Backed Nonwoven Silt Fence Installation Configurations. Transp. Res. Rec. 2018, 2672, 68–78. [Google Scholar] [CrossRef]
- Cooke, S.J.; Chapman, J.M.; Vermaire, J.C. On the Apparent Failure of Silt Fences to Protect Freshwater Ecosystems from Sedimentation: A Call for Improvements in Science, Technology, Training and Compliance Monitoring. J. Environ. Manag. 2015, 164, 67–73. [Google Scholar] [CrossRef] [PubMed]
- Zech, W.C.; Halverson, J.L.; Clement, T.P. Intermediate-Scale Experiments to Evaluate Silt Fence Designs to Control Sediment Discharge from Highway Construction Sites. J. Hydrol. Eng. 2008, 13, 497–504. [Google Scholar] [CrossRef]
- Bugg, R.A.; Donald, W.; Zech, W.; Perez, M. Performance Evaluations of Three Silt Fence Practices Using a Full-Scale Testing Apparatus. Water 2017, 9, 502. [Google Scholar] [CrossRef]
- Zech, W.C.; Halverson, J.L.; Clement, T.P. Development of Silt Fence Tieback Design Methodology for Highway Construction Installations. Transp. Res. Rec. J. Transp. Res. Board 2007, 2011, 21–28. [Google Scholar] [CrossRef]
- Wyant, D.C. Evaluation of filter fabrics for use as silt fences. Transp. Res. Rec. 1981, 832, 6–12. [Google Scholar]
- ASTM D5141-11; Standard Test Method for Determining Filtering Efficiency and Flow Rate of the Filtration Component for a Sediment Retention Device. ASTM International: West Conshohocken, PA, USA, 2011; pp. 1–6.
- Risse, L.M.; Thompson, S.A.; Governo, J.; Harris, K. Testing of new silt fence materials: A case study of a belted strand retention fence. J. Soil Water Con. 2008, 63, 265–273. [Google Scholar] [CrossRef]
- Barbosa, J.S.; Ramiro, C.P.; Motta, M.F.B.; Bassanelli, H.R.; Muller, M. Utilização de Geossintéticos como Barreira de Sedimentos para Retenção de Escoamento Superficial. In Proceedings of the XX Congresso Brasileiro de Mecânica dos Solos e Engenharia Geotécnica, Campinas, Brazil, 15–18 September 2020. (In Portuguese). [Google Scholar]
- Cavalhieri, C.P. Avaliação de Geotêxteis Não-Tecidos Utilizados em Cercas-Silte Para Remoção de Turbidez. Master’s Thesis, Campinas State University, Campinas, Brazil, 2013. (In Portuguese). [Google Scholar]
- Gogo-Abite, I.; Chopra, M. Performance evaluation of two silt fence geotextiles using a tilting test-bed with simulated rainfall. Geotext. Geomembr. 2013, 39, 30–38. [Google Scholar] [CrossRef]
- Miszkowska, A.; Lenart, S.; Koda, E. Changes of Permeability of Nonwoven Geotextiles due to Clogging and Cyclic Water Flow in Laboratory Conditions. Water 2017, 9, 660. [Google Scholar] [CrossRef]
- Pereira, C.R.B. Avaliação de Erodibilidade em um Solo do Bairro Pingo de Ouro, Guaratinguetá/SP. Bachelors’ Thesis, São Paulo State University, Guaratinguetá, Brazil, 2022. (In Portuguese). [Google Scholar]
- ISO 12956:2019; Geotextiles and Geotextile-Related Products — Determination of the Characteristic Opening Size. International Organization for Standardization: Geneva, Switzerland, 2019; pp. 1–15.
- NBR ISO 11058:2021; Geotextiles and Geotextiles-Related Products - Determination of Water Permeability Characteristics Normal to the Plane, without Load. ABNT: Rio de Janeiro, RJ, Brazil, 2021; pp. 1–18.
- Arganda-Carreras, I.; Kayning, V.; Rueden, C.; Eliceiri, K.W.; Schindelin, J.; Cordona, A.; Seung, H.S. Trainable Weka Segmentation: A machine learning tool for microscopy pixel classification. Bioinformatics 2017, 33, 2424–2426. [Google Scholar] [CrossRef] [PubMed]
- Staniewicz, L.; Midgley, P.A. Machine learning as a tool for classifying electron tomographic reconstructions. Adv. Struct. Chem. Imaging 2015, 1, 9. [Google Scholar] [CrossRef]
- Salum, P.; Güven, O.; Aydemir, L.Y.; Erbay, Z. Microscopy-Assisted Digital Image Analysis with Trainable Weka Segmentation (TWS) for Emulsion Droplet Size Determination. Coatings 2022, 12, 364. [Google Scholar] [CrossRef]
- Christopher, B.R.; Holtz, R.D. Geotextile Engineering Manual; Report n. FHWA-TS-86/203; Federal Highway Administration: Washington, DC, USA, 1985; 1044p. [Google Scholar]
- Faucette, F.L.B.; Sefton, K.A.; Sadeghi, A.M.; Rowland, R.A. Sediment and phosphorus removal from simulated storm runoff with compost filter socks and silt fence. J. Soil Water Conserv. 2008, 63, 257–264. [Google Scholar] [CrossRef]
- Palmeira, E.M.; Farias, R.J.C.; Carvalho, J.C. Geotextile sediment barriers for erosion control in tropical soils. In Proceedings of the 4th European Conference on Geosynthetics–EuroGeo4, Edinburgh, UK, 20–21 December 2008. [Google Scholar]
- Rosa, F.A.; Vidal, D.; Hemsi, P. Aspectos do Dimensionamento e Eficiência das Barreiras de Sedimentos. In Proceedings of the VII Congresso Brasileiro de Geossintéticos e VIII Congresso Brasileiro de Geotecnia Ambiental, Brasília, Brazil, 19–21 July 2015. (In Portuguese). [Google Scholar]
Disclaimer/Publisher’s Note: The statements, opinions and data contained in all publications are solely those of the individual author(s) and contributor(s) and not of MDPI and/or the editor(s). MDPI and/or the editor(s) disclaim responsibility for any injury to people or property resulting from any ideas, methods, instructions or products referred to in the content. |
© 2023 by the authors. Licensee MDPI, Basel, Switzerland. This article is an open access article distributed under the terms and conditions of the Creative Commons Attribution (CC BY) license (https://creativecommons.org/licenses/by/4.0/).