Article

An Integrated Approach for Saturation Modeling Using Hydraulic Flow Units: Examples from the Upper Messinian Reservoir

by
Nader H. El-Gendy
1,
Walid M. Mabrouk
2,
Mohamed A. Waziry
3,
Thomas J. Dodd
4,
Fathy A. Abdalla
5,
Dimitrios E. Alexakis
6,* and
Moataz Khairy Barakat
1
1
Geology Department, Faculty of Science, Tanta University, Tanta 31527, Egypt
2
Department of Geophysics, Faculty of Science, Cairo University, Giza 12613, Egypt
3
Dana Gas Company, Cairo 11774, Egypt
4
British Geological Survey, Lyell Center, Research Avenue South, Edinburgh EH21 6ER, UK
5
College of Science, King Saud University, Riyadh 11451, Saudi Arabia
6
Laboratory of Geoenvironmental Science and Environmental Quality Assurance, Department of Civil Engineering, School of Engineering, University of West Attica, 250 Thivon & P. Ralli Str., GR 12241 Athens, Greece
*
Author to whom correspondence should be addressed.
Water 2023, 15(24), 4204; https://doi.org/10.3390/w15244204
Submission received: 2 November 2023 / Revised: 29 November 2023 / Accepted: 30 November 2023 / Published: 5 December 2023
(This article belongs to the Special Issue Application of Geophysical Methods for Hydrogeology)

Abstract

:
The Upper Messinian reservoirs located in the Salma Field of the Nile Delta area contain variable facies. The key reservoir interval of the Abu Madi Formation was deposited in fluvial to deltaic environments. These fine-grained facies form significant reservoir heterogeneity within the reservoir intervals. The main challenges in this study are reservoir characterizing and predicting the change in reservoir water saturation (SW) with time, while reservoir production life based on the change in reservoir capillary pressure (Pc). This work applies petrophysical analysis to enable the definition and calculation of the hydrocarbon reserves within the key reservoir units. Mapping of SW away from the wellbores within geo-models represents a significant challenge. The rock types and flow unit analysis indicate that the reservoir is dominated by four hydraulic flow units. HFU#1 represents the highest flow zone indicator (FZI) value. Core analysis has been completed to better understand the relationship between SW and the reservoir capillary pressure above the fluid contact and free water level (FWL), which is used to perform saturation height function (SHF) analysis. The calculated SW values that are obtained from logs are affected by formation water resistivity (Rw) and log true resistivity (RT), which are influenced by the volume of clay content and mud salinity. This study introduces an integrated approach, including evaluation of core measurements, well log analysis covering cored and non-cored intervals, neural analysis techniques (K-mode algorithm), and permeability prediction in non-cored intervals. The empirical formula was predicted for direct calculation of dynamic SW profiles and predicted within the reservoir above the FWL based on the change in reservoir pressure.

1. Introduction

The reservoir evaluation is necessary to identify reservoir units and to better understand their relevant reservoir properties [1]. Calculating porosity, permeability, and the study of dynamic flow is necessary to obtain more accurate estimates of reservoir storage volumes and gain an improved understanding of flow performance. Characterizing water saturation (SW) within reservoirs is a key challenge of the hydrocarbon reserves estimation, which strongly influences the creation of static and dynamic reservoir models [2,3,4,5,6].
Reservoir classification techniques that include combined core analysis and well log data can also be used to characterize reservoir flow unit parameters [7,8,9]. Advanced rock typing techniques, which are based on flow zone indicators (FZI), can be used to calculate flow unit identification and characterization [10,11,12]. Reservoir parameters such as porosity and permeability have been used to define reservoir hydraulic flow units during the construction of reservoir models [13,14]. Additionally, applying artificial intelligence techniques can potentially deliver solutions for predicting petrophysical parameters in the non-core areas of the reservoir.
The Salma Field is a significant hydrocarbon province in the Nile Delta region [15,16,17,18]. Within the Salma Field, the clastic late Messinian Abu Madi Formation is considered as the primary gas-producing interval (Figure 1). Previous studies include comprehensive reservoir analysis, property modeling of petrophysical parameters of the reservoir, and identifying various facies of the flow [19,20,21,22,23]. Calculating water saturation variability within the model based on reservoir flow units can reduce the uncertainty in reservoir flow performance and volumetric evaluation in the Salma Field.
This study analyzes critical data from the Salma Field and provides an innovative method that links reservoir flow units with reservoir water saturation. In order to achieve this, this study (a) provides permeability calculations that are defined by a flow unit-dependent porosity–permeability correlation; (b) establishes multiple saturation height function (SHF) by using key reservoir parameters; and (c) considers the variation in rock quality in relation to the reservoir flow performance.
This method for calculating water saturation is successful and more precise in the example of the Salma Field, mainly as it decreases the uncertainty in the SW results calculated from resistivity tool readings, which are influenced by shale distribution and/or variation in reservoir water salinity. Fundamentally, this study and proposed methodology are more practical within fields worldwide, mainly when saturation modeling is conducted within heterogeneous reservoirs containing abundant clastic mudstone facies.

2. Geological Setting

This study examines a suite of Messinian-aged sedimentary strata from the Delta region of Egypt (Figure 2). The Messinian section, which comprises the Abu Madi and Qawasim formations, hosts the most potential reservoirs in the Delta area [24]. The Messenian section in the Nile Delta comprises a complexly layered incised valley filled with various facies forming the reservoir and sealing lithological units [24]. These sedimentary successions of the Abu Madi Formation have been interpreted as fluvial to the coastal marine in origin, deposited in a subsiding basin undergoing transgression. The Abu Madi Baltim trend in West El Manzala is defined as a sequence of back-stepping fluvial channels [16,25,26]. The basin follows the same strike as the overall trend of the adjacent gas-producing system of Abu Madi to the west [27].
The Abu Madi Formation is a fluvial–estuarine sedimentary rock unit with erosive-based channel sandstones at the base of the sequence. In the Salma Field, the Miocene cycle is characterized by the Messinian sandstones, mudstones (shales), and sandy mudstones (shales) of the Abu Madi Formation, which overlay the marine sedimentary rocks of the Sidi Salim Formation. It varies in composition and comprises different lithologies, but mainly is made up of siltstones and sandstones with variable sedimentary structures. The formation ranges from fluvial to deltaic environments with various depositional conditions [28,29]. The lithofacies associations indicate subfeldspathic arenite-wacke, sub-lithic arenite, and lithic arenites distributed across the reservoir; they also indicate reservoir heterogeneity [30].

3. Materials and Methods

A complete set of well log data from six available wells are used in this study. Fifty-eight core plugs of the Salma-2 well and ninety core plugs of the Salma-4 well were analyzed at the Corex Laboratories in Egypt. Obtained measurements from the core plugs include porosity, grain density, and permeability. Additionally, special core analysis (SCAL) was performed on 32 core plugs of the Salma-2 well and 56 plugs of the Salma-4 well.
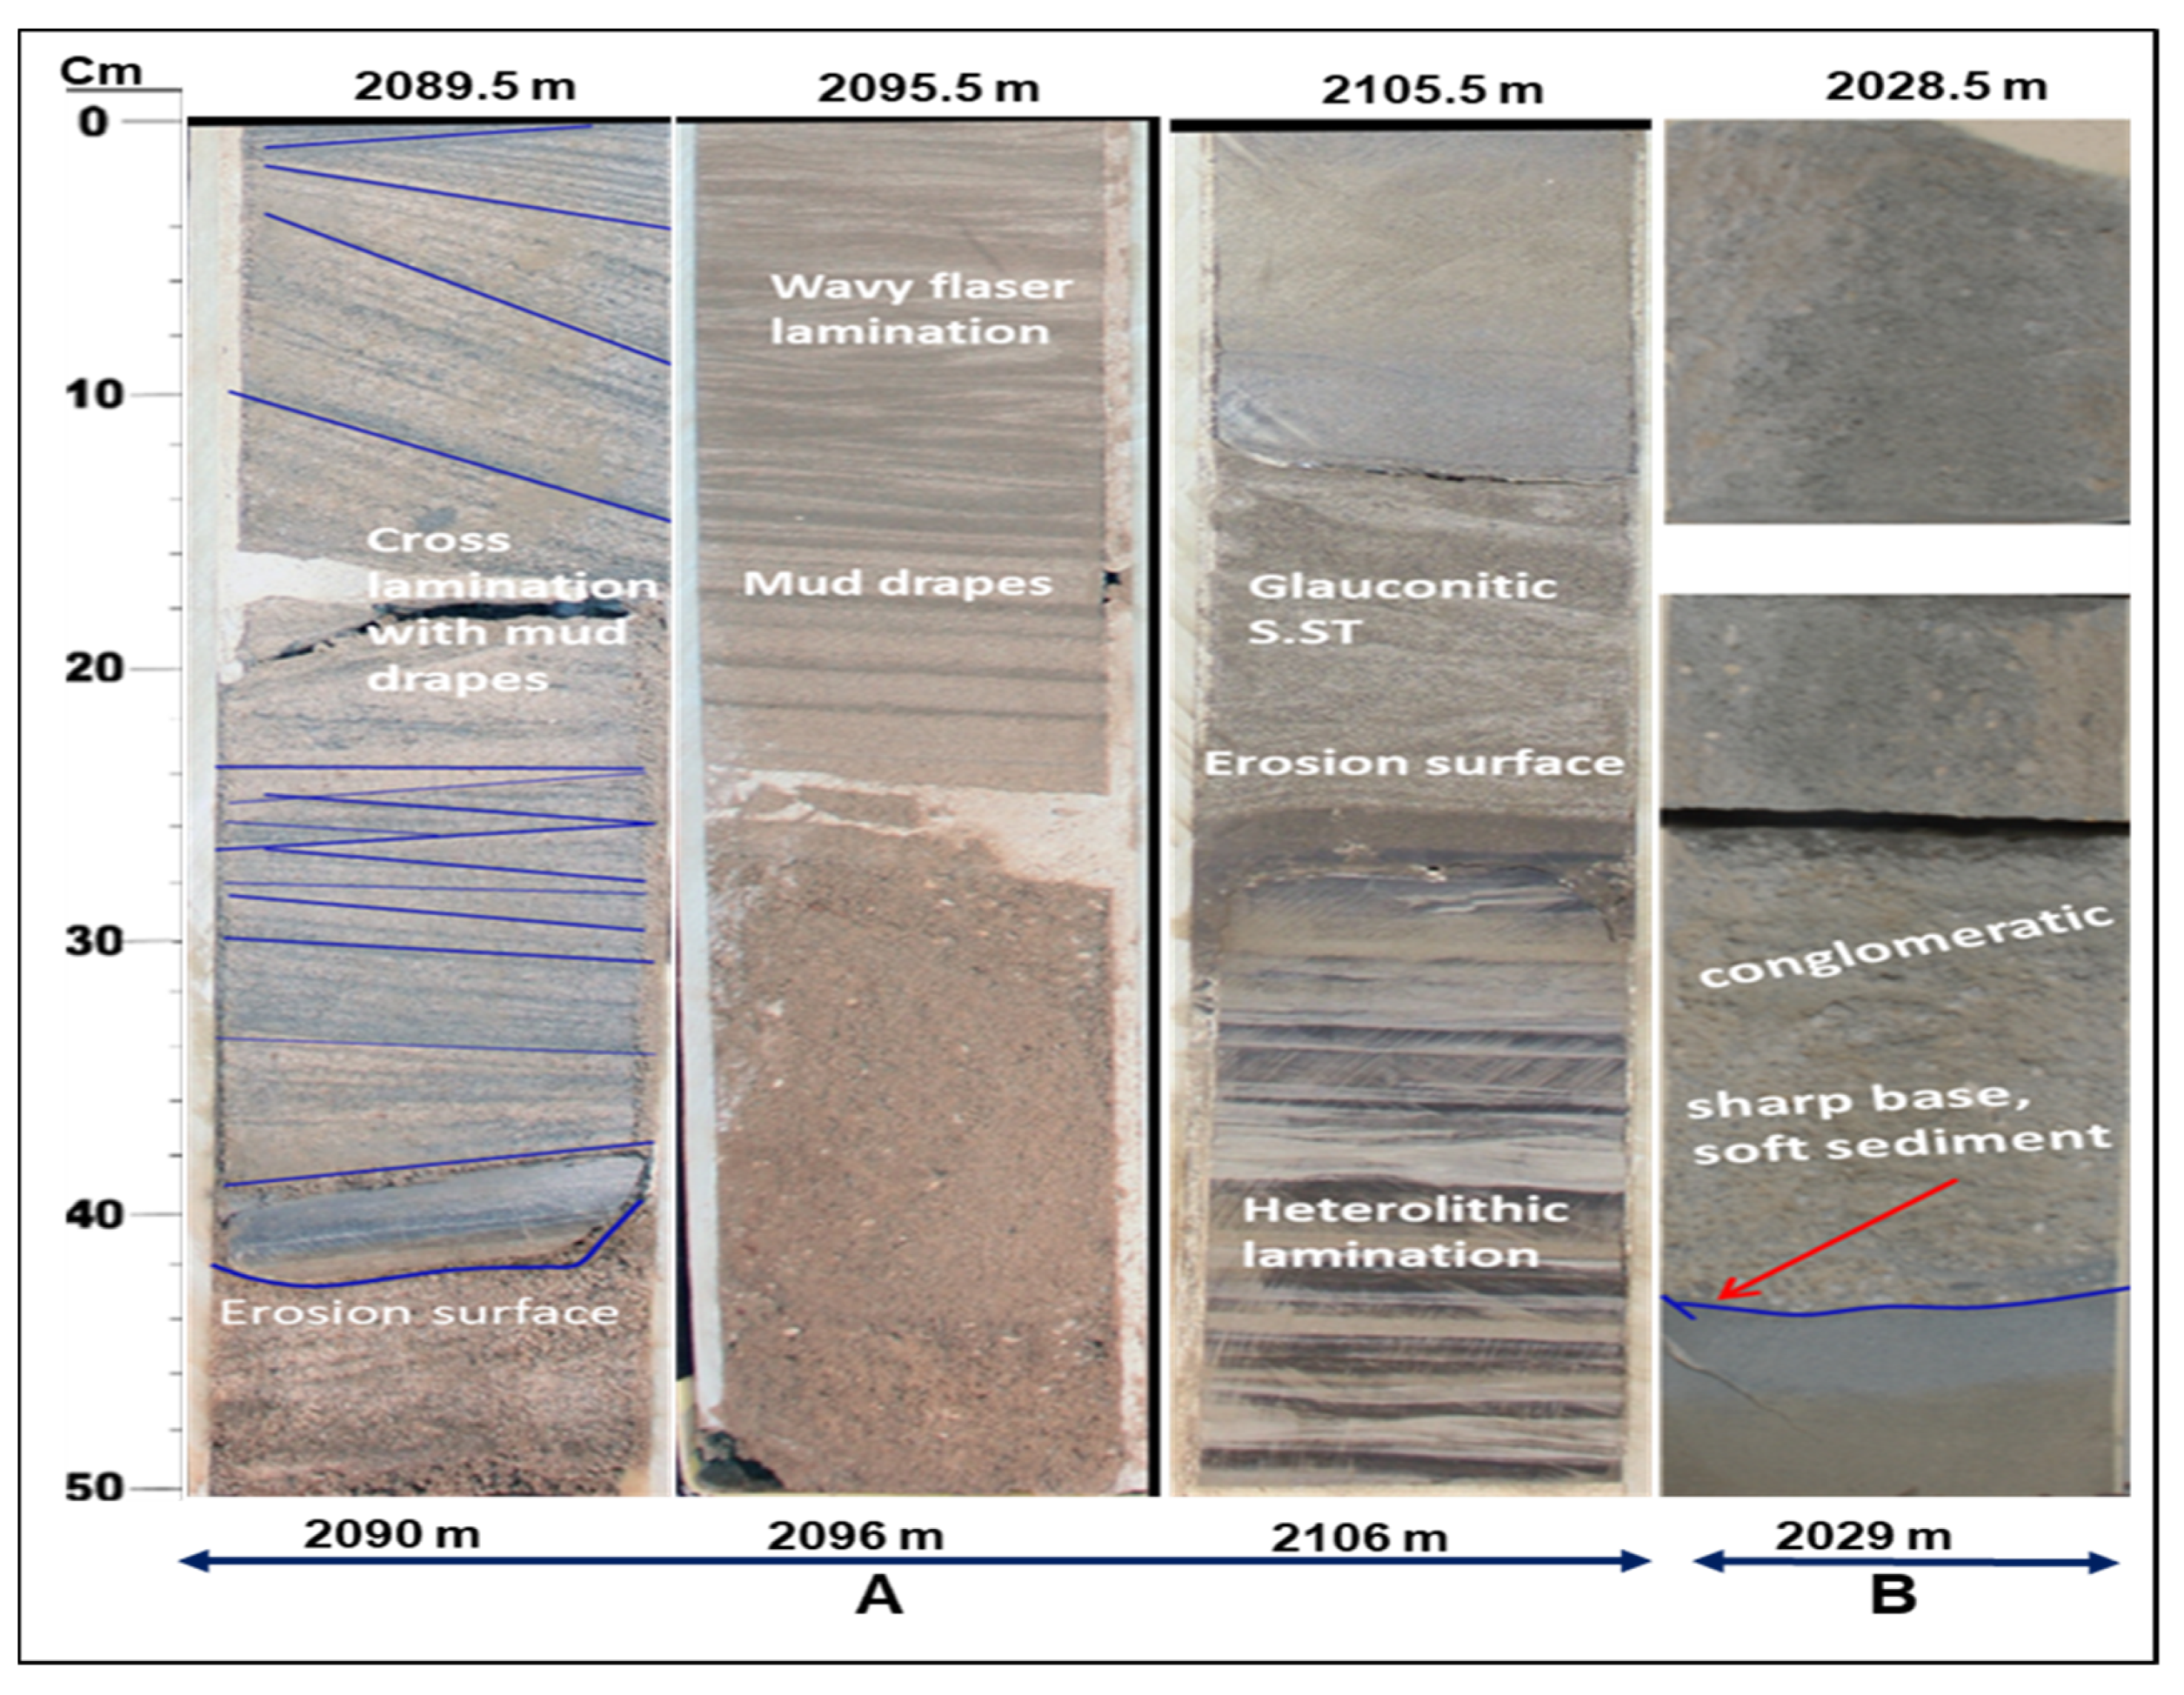
Pore throat analysis and capillary pressure measurements were performed on eight samples obtained by covered mercury injection by Corex, from which data was made available for the Salma-2 and Salma-4 wells. Porosity and permeability data were corrected to reservoir net overburden pressure to replicate in situ values [31]. The sedimentology of the core data was investigated (described and interpreted) (Figure 3), and the reservoir interval was divided and characterized based on sedimentary facies and depositional environments (Figure 4). Applying combined and integrated datasets during reservoir characterization provides a robust methodology for static and dynamic reservoir properties attribution and modeling [32,33,34].

3.1. Reservoir Hydraulic Flow Units (HFUs)

Reservoir facies were classified into rock units based on their dynamic behavior [35]. Facies are categorized and defined based on their reservoir quality index (RQI; [36]) and value of flow zone indicator (FZI) [10,37,38]. The RQI formula is based on the theory that a package of capillary tubes can represent a flow within a porous medium with an average radius. The Kozeny–Carman realistic porous media theory was modified by [39]. The technique to characterize the reservoir quality index (RQI) and determine the FZI was developed by [10] and can be expressed as follows:
K = Φ 3 1 Φ 2 × F Z I 2
( K / Φ ) = [ Φ ( 1 Φ ) ] × F Z I
By defining RQI in µm
RQI   ( µ m ) = 0.0314 ( K / Ø )
F Z I   ( µ m ) = R Q I Φ z
Φ z = Φ ( 1 Φ )
where
  • Øz = the normalized porosity in a fraction, and
  • Φ = porosity in a fraction, K = permeability in milli Darcy (mD).
The hydraulic flow concept is used to divide a reservoir into distinct units with unique FZI values [40]. The hydraulic flow unit (HFU) is defined as a representative reservoir volume with consistent petrophysical and fluid properties [10].

3.2. Well Log Analysis

Petrophysical analysis (i.e., lithology, clay content, and reservoir fluid saturations) was carried out for six wells from the Salma Field. A quantitative reservoir evaluation requires accurately determining shale volume (VSH). Based on mudstone (shale) distribution, mud-rich sandstones possess different properties under different conditions and constraints [41]. Effective porosity (PHIE) was calculated using a neutron-density end point matrix cross-plot [42], which was corrected for VSH and gas effects. The lithology and grain density, which was determined from the core, was used in the evaluation. For reservoir water saturation, the ‘Indonesian Model’ was applied [43,44,45]. The calculations were corrected to clay content, as this can reduce resistivity and increase irreducible water saturation values [46].

3.3. Neural Log Analysis

An artificial neural network determined the FZI in non-cored intervals and wells. This was performed using FZIs that were calculated using core analysis and well log prediction [31]. Reservoir flow unit classification and identification were performed for all reservoir intervals, and geological models were produced using the TechlogTM software (Version 2015). Statistical data for reservoir parameters was obtained from the petrophysical analysis of the well logs [47,48]. FZI measurements were obtained from the core and used to predict the FZI curve logistically within non-cored intervals.

3.4. Free Water Level (FWL) and Fluid Contacts

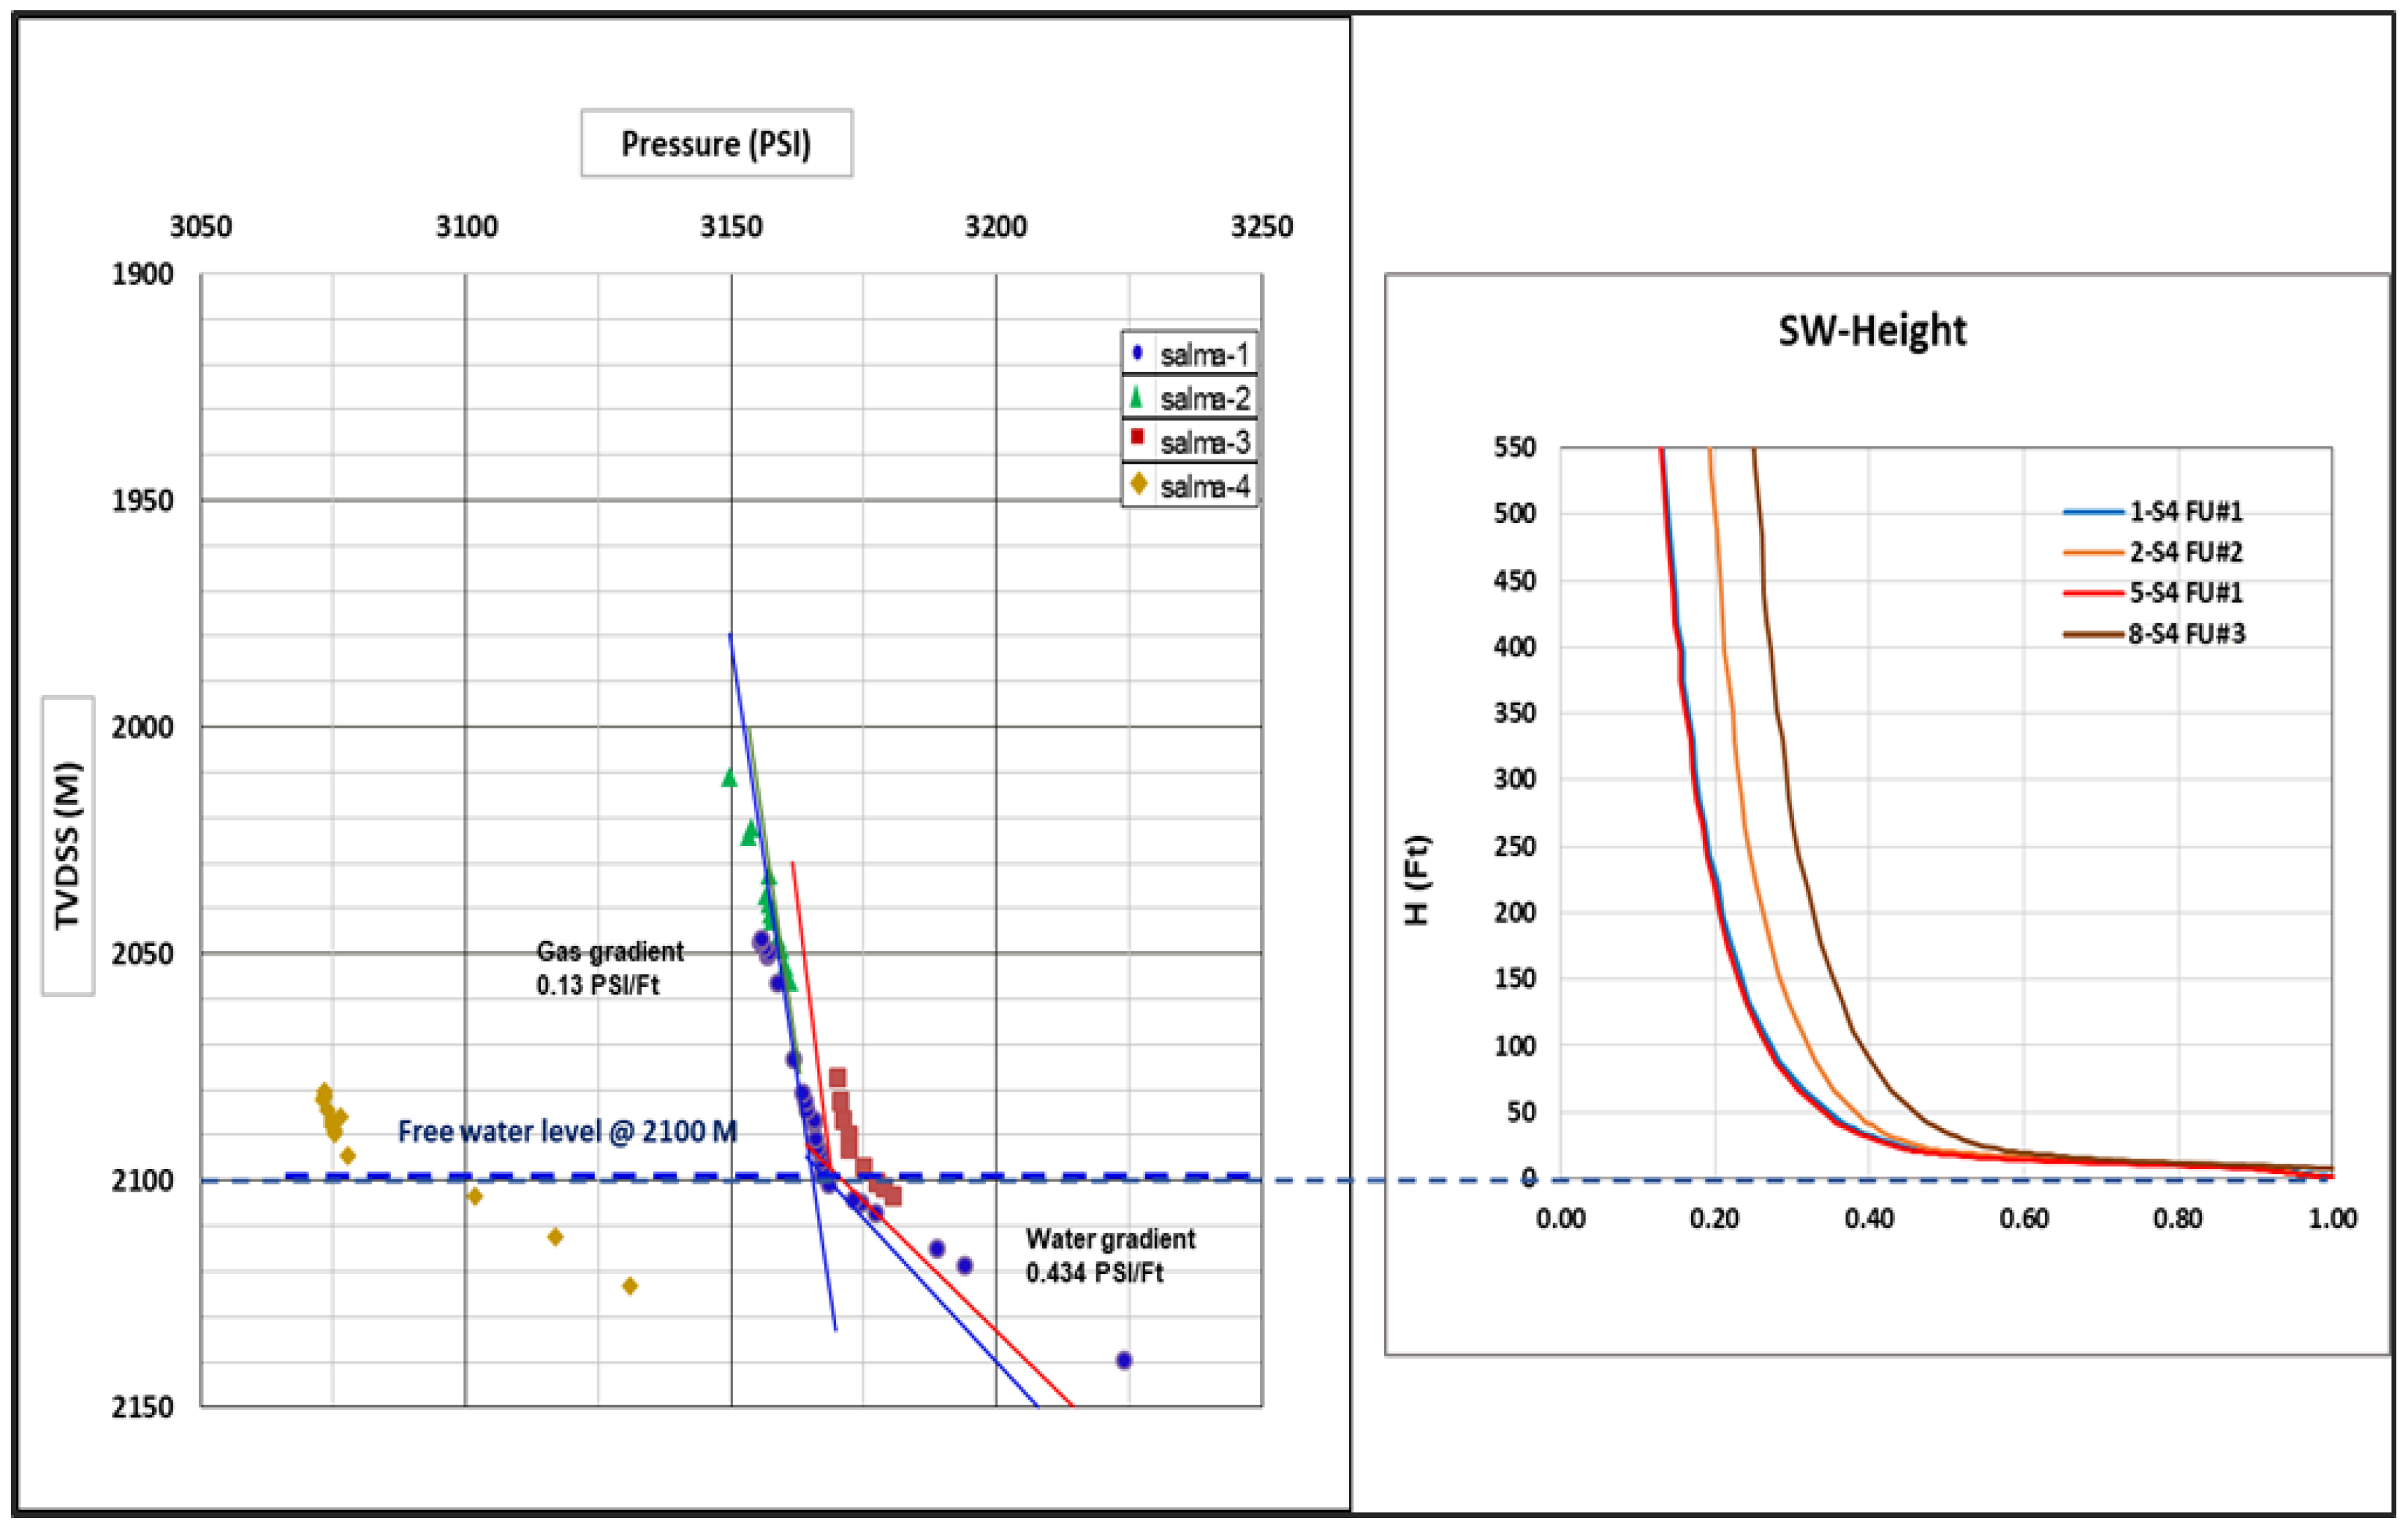
The FWL in a water-wet rock is defined as the lower contact level of fluid at which capillary pressure (CP) is zero [49]. A FWL was used as a reference in modeling the upper SWH functions, where capillary pressure exceeds zero and, therefore, water can be displaced by hydrocarbons. The FWL was defined by plotting formation pressure data against true vertical depth to define different fluid gradients. This is the point at which formation water pressure gradient lines intersect the hydrocarbon pressure gradient (Figure 5).
The CP–SW curve can be predicted and converted into water saturation against height above the free water contact H–SW curve [50,51]. This point represents a fluid contact level, where the capillary pressure was more significant than zero, with the height above FWL. The various contacts’ positions may differ from those of the FWL due to rock pore throat sizes, typically where tiny pore throat sizes formed fluid contacts that were marginally above the FWL.

3.5. Mercury Injection Capillary Pressure (MICP)

The mercury injection capillary pressure (MICP) technique was effectively used to determine pore throat size distribution [52]. This method uses mercury as a non-wetting liquid with solids. By applying a pressure up to 2000 psi, mercury can penetrate the pores spaces of the studied samples. The pore volume distribution was established as a function of pore throat radius. The interfacial forces were the source of the fluid rise to what is known as capillary pressure when rock pore volume is occupied with two immiscible fluids. The relationship between pore size and a given pressure was derived by [53], as
P c = 2 σ c o s θ r
where
  • r = pore radius, σ = the interfacial tension, θ = contact angle,
  • Pc = capillary pressure (absolute applied pressure).
Capillary pressure represents the interaction of rock and fluid and is controlled by the pore size, interfacial tension, and wettability [54]. The free water level (FWL) from water saturation within the transition zone (the height relation; [49]) is also assumed, as follows:
P c = 2 σ c o s θ r = ρ w ρ o g h
h   ( ft . ) = Pc / 0.434   ( ρ b ρ c )
where
  • Pc = capillary pressure (absolute applied pressure), σ = the interfacial tension,
  • ρ = the density of water and hydrocarbon (gas or oil), g = the gravitational acceleration,
  • h = the height above FWL,  ρ b  = specific gravity of brine,
  • ρ c = specific gravity of hydrocarbons, 0.434 psi/ft = gradient of water.
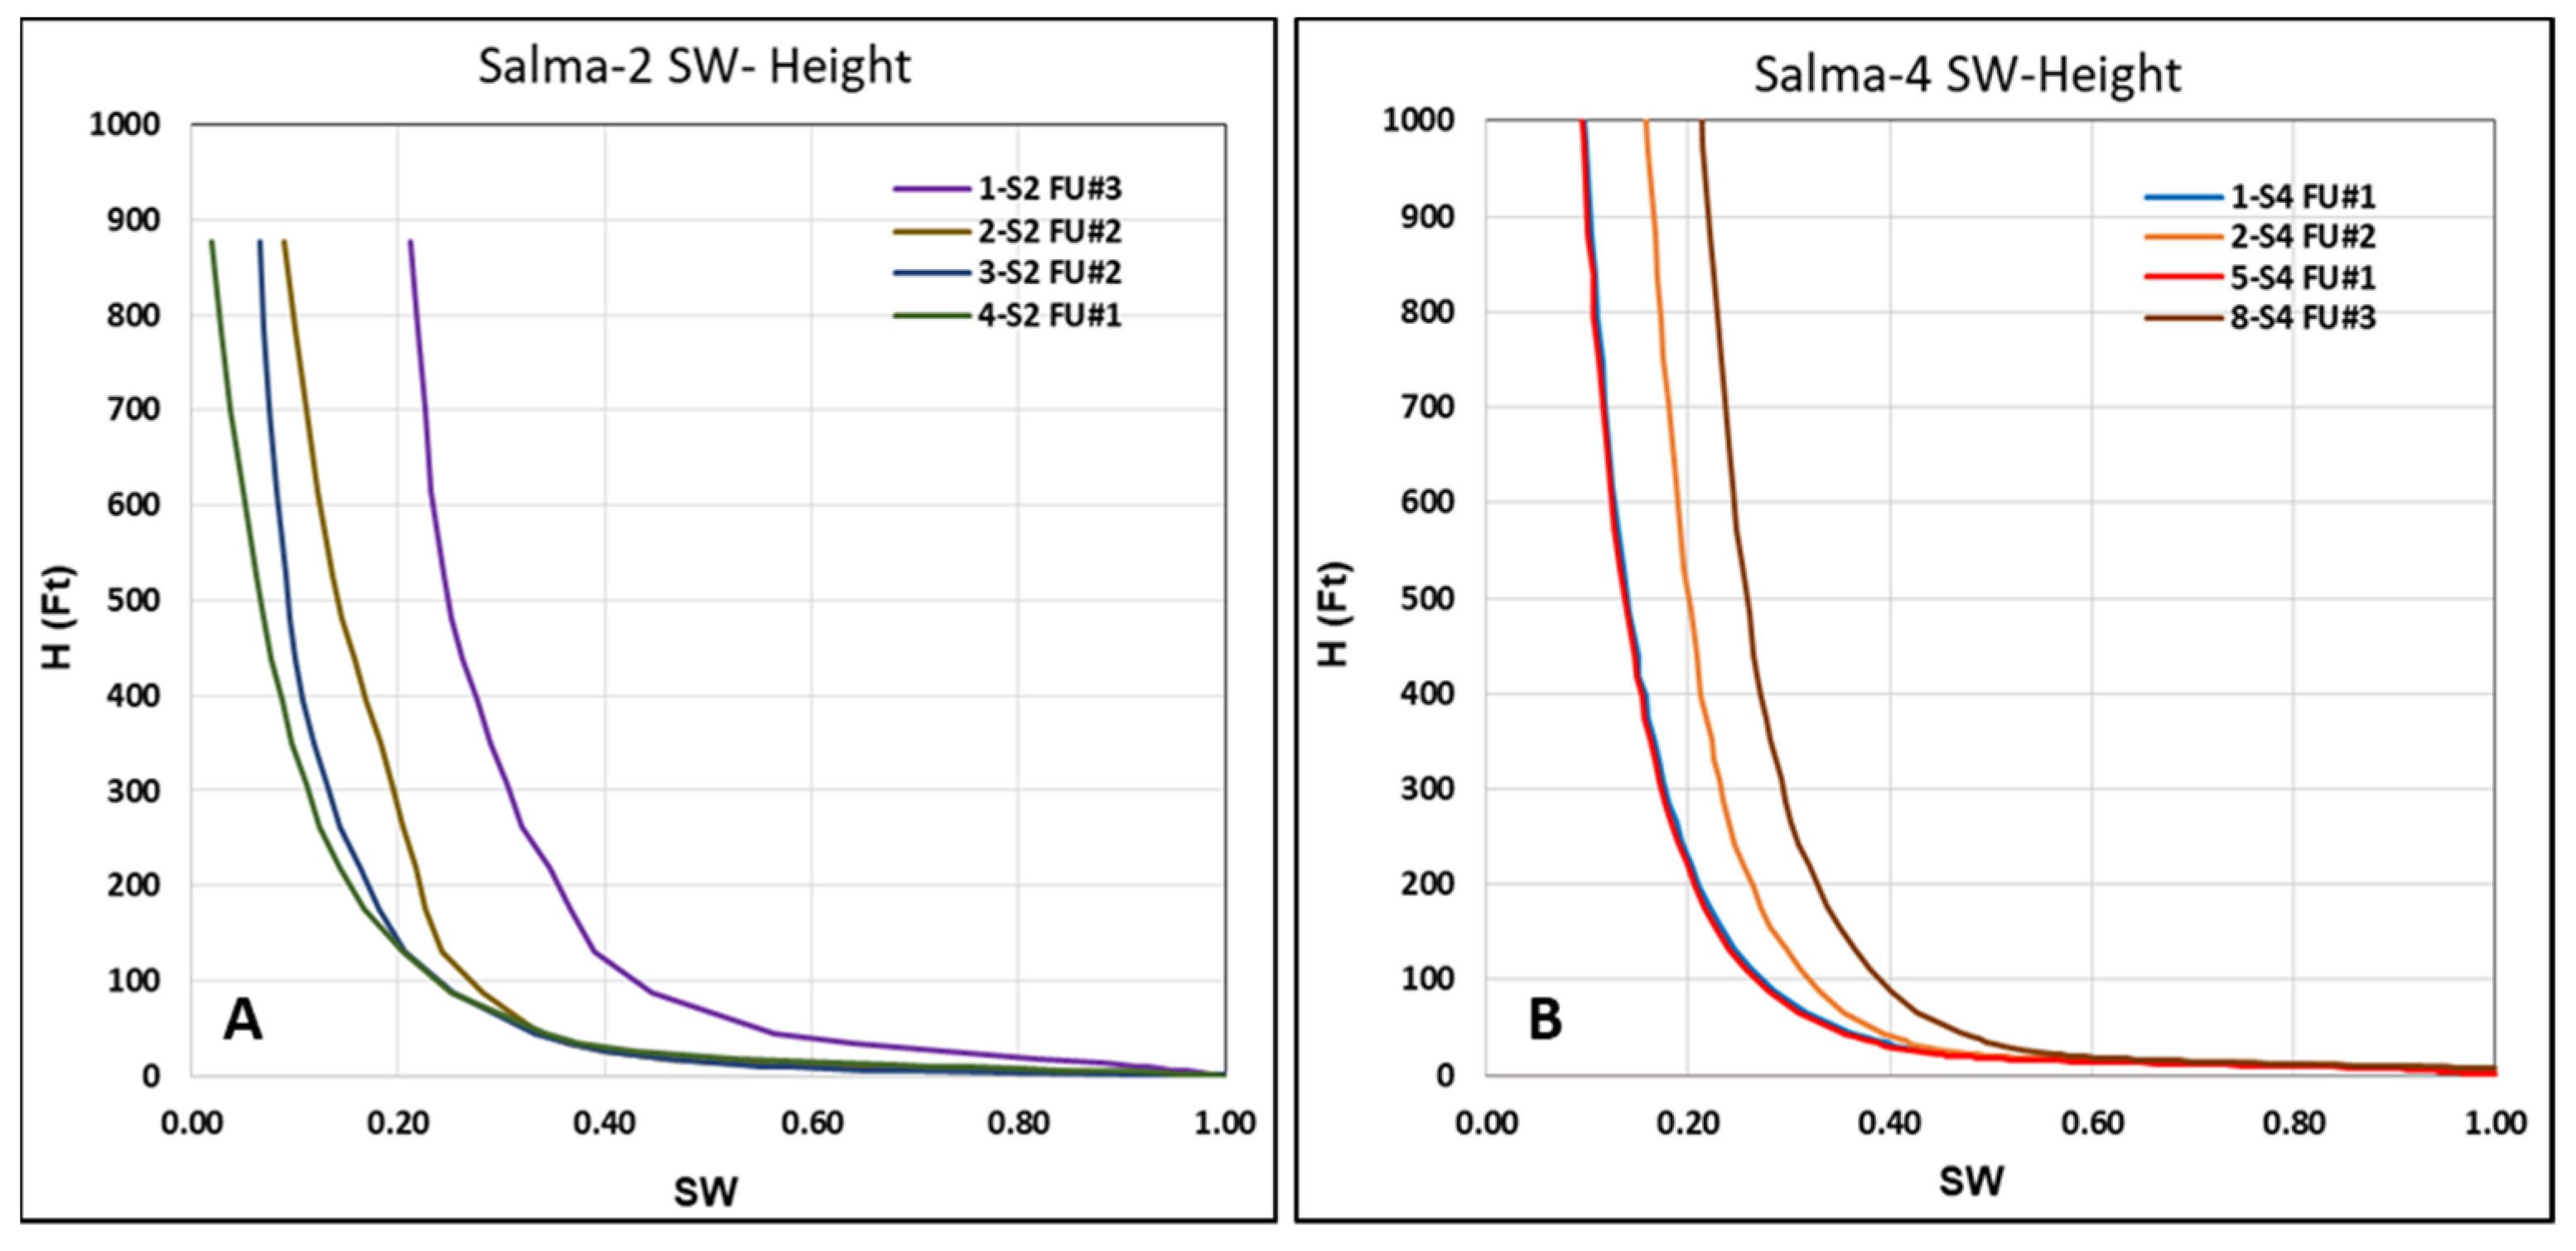
MICP and mercury saturation analysis were performed and plotted for samples assigned to different flow units for the Salma-2 (Figure 6A) and the Salma-4 wells (Figure 6B).

3.6. Reservoir Capillary Pressure and Saturation Height Function

Several studies on saturation height were developed and provided different methods to calculate SW through saturation height (SWH) modeling [51,54]. Different rock types are linked with different saturation height relationships [55]. A flow unit was defined for each sample by applying Equations (3)–(5), with laboratory-measured capillary pressure using mercury injection, where data was corrected from the laboratory fluid system to the reservoir fluid system using Equation (6) and data in Table 1 to convert Pc from lab to reservoir condition. Pc data for the reservoir fluid system were converted to a height above free water level (HAFWL) using Equation (8) and applying a field-free water level at 3100 m TVDSS (using mean sea level as the mean datum). Finally, samples from two wells were used to demonstrate the saturation height function. Data for SW-HAFWL were plotted for the Salma-2 well (Figure 7A) and for the Salma-4 well (Figure 7B).

3.7. Leverett J-Function

The capillary pressure measurements of the core samples represent a limited and small interval of the overall reservoir of the Salma Field. Therefore, additional capillary data must be collected and combined with the saturation curves to represent different reservoir facies and units to create a general equation that can define different reservoir units. Leverett (1941) [36] created a dimensionless capillary pressure–saturation function that they termed the “J-function”. This can be used to develop a general equation that represents all typical capillary pressure curves and their dependent factors, including porosity, interfacial tension, and average pore radius. This can be expressed as follows:
J = 0.2166   ×   Pc / ( σ   × cos θ ) × ( K / Φ )
where
  • J = Leverett J-function, Pc = capillary pressure, σ = the interfacial tension, θ = contact angle,
  • Φ = porosity in a fraction, K = permeability in mile Darcie’s (mD).
In this study, the Leverett J-function was used to convert all capillary-pressure data to a universal curve for the same formation and remove the variances in Pc–SW curves, whilst considering the variations in porosity and permeability for reservoir units. However, J-function SW correlations cannot obtain different formations with a single universal curve and are unable to represent all the reservoir units, so each flow unit should have its own independent J-function.
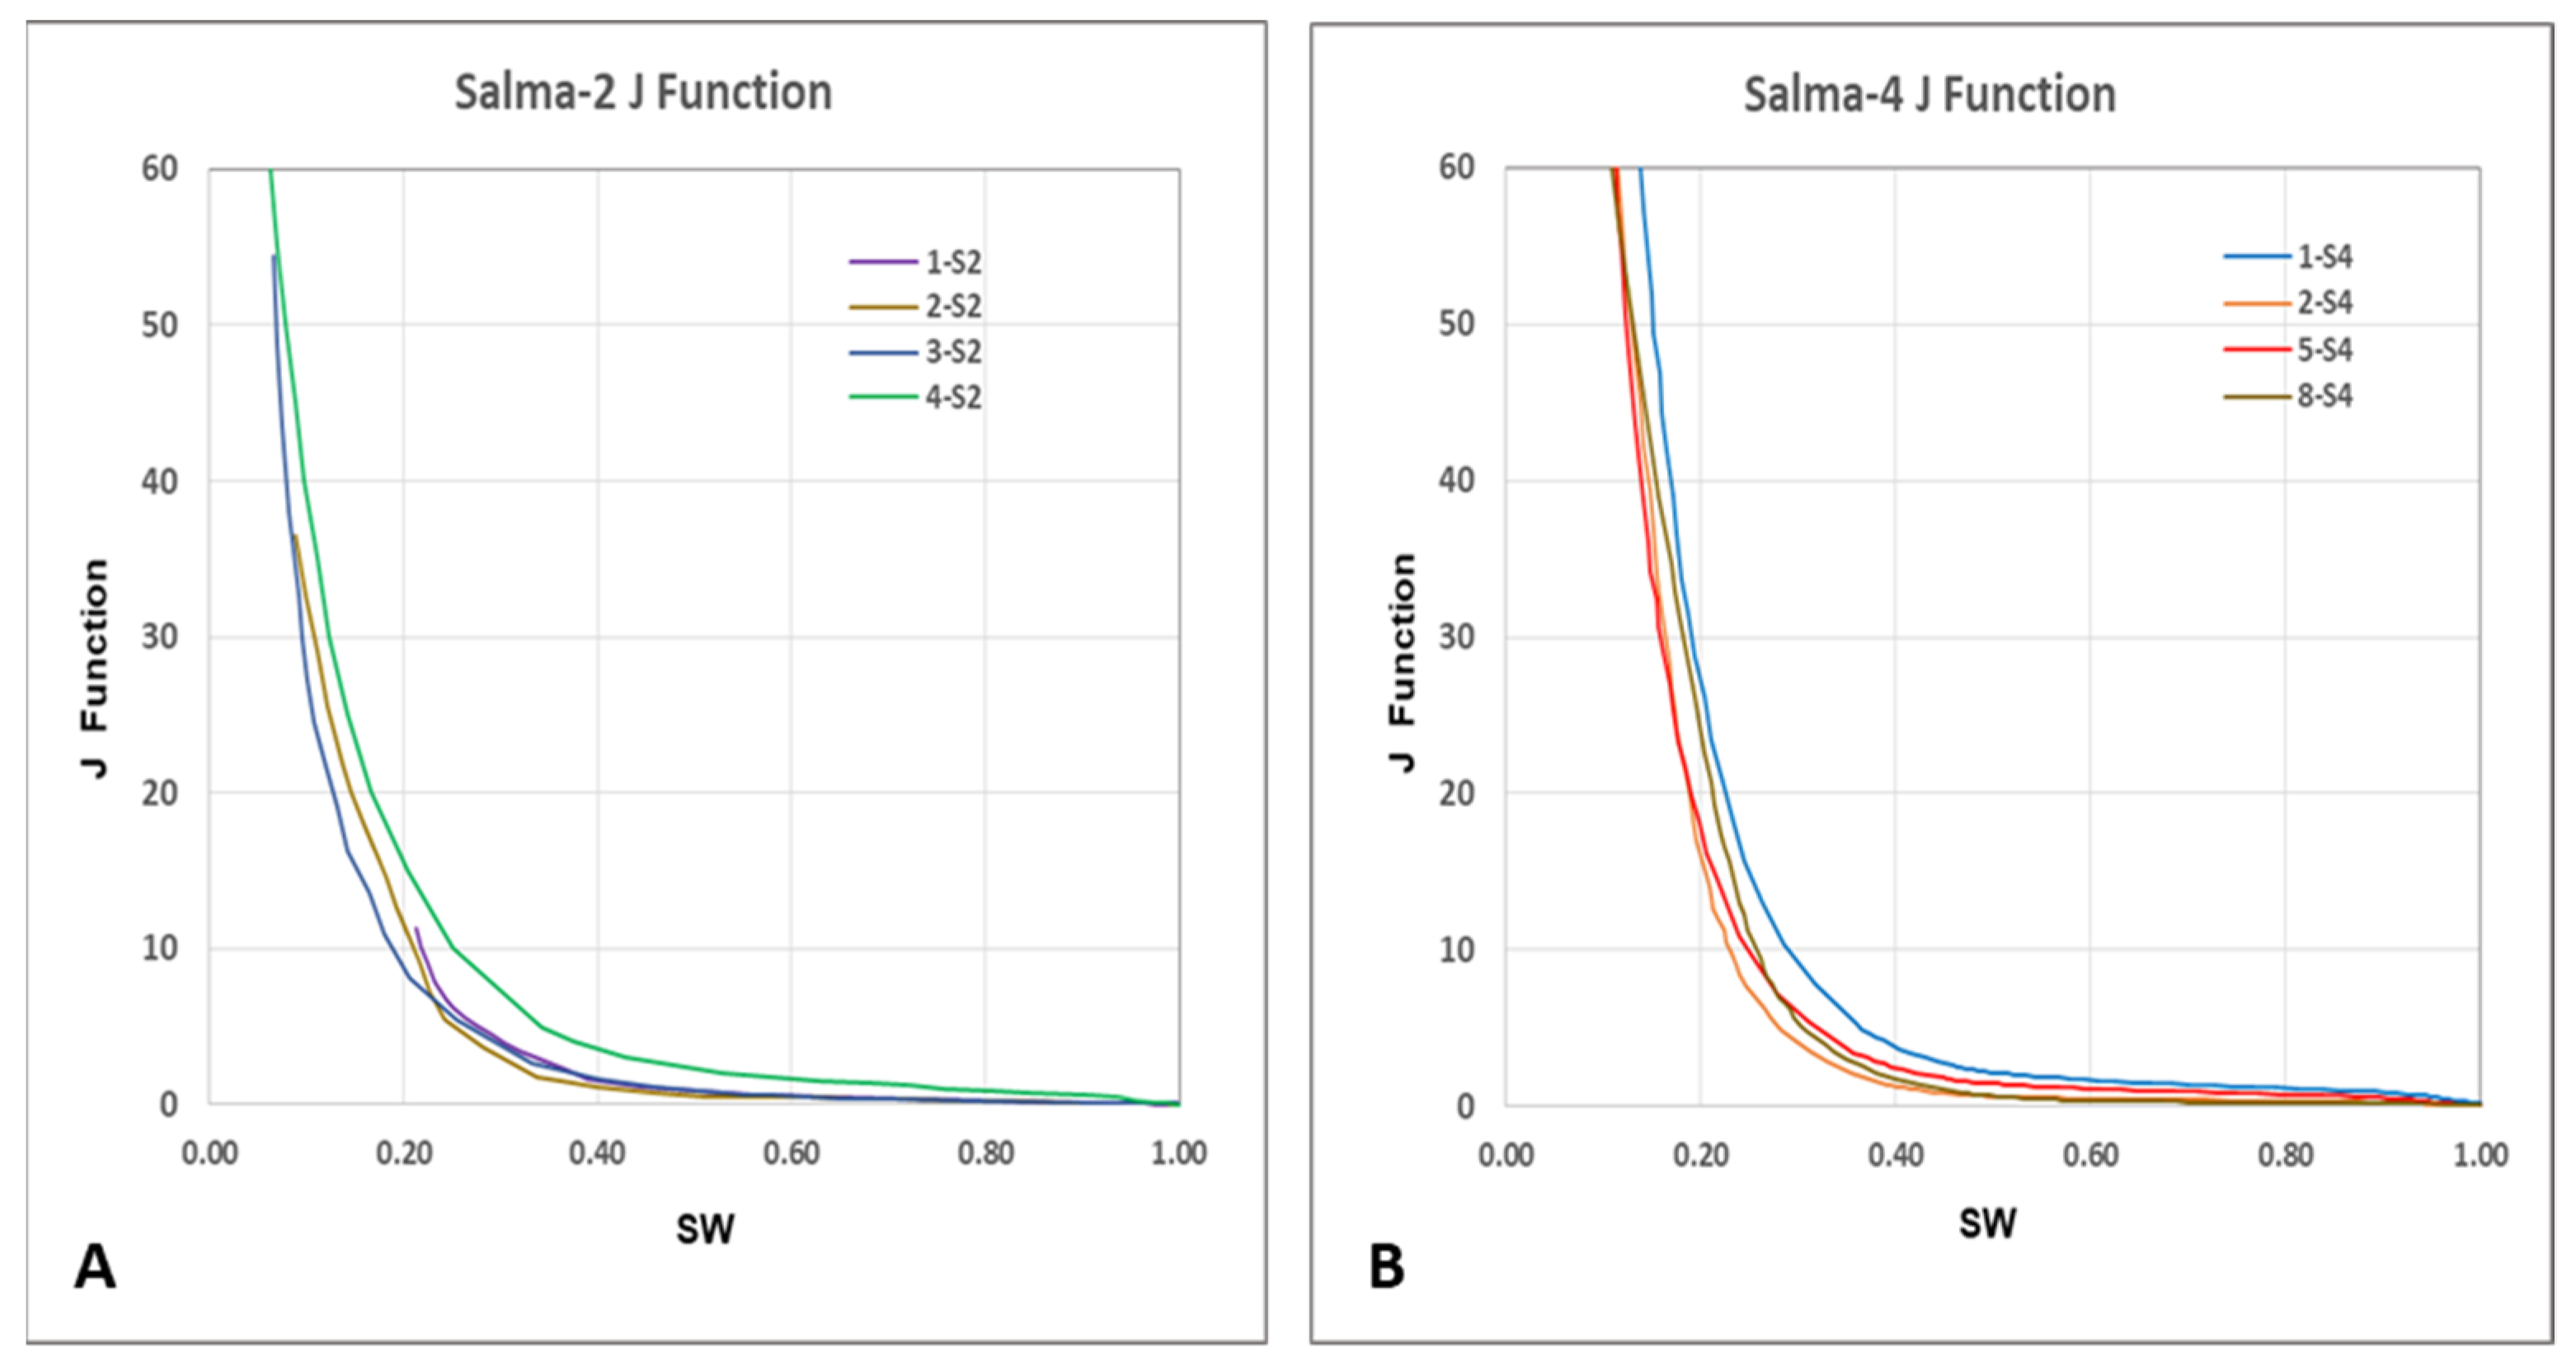
Finally, the Pc data was converted to a J-function using Equation (9) to normalize Pc within the reservoir system. This included a gas/water fluid system, gas gradient of 0.13 PSI/Ft, and a water gradient 0.434 PSI/ft, which were obtained from the results of pressure data evaluation. J–SW relationships were plotted for the Salma-2 well (Figure 8A) and the Salma-4 well (Figure 8B), which represent the variation related to different HFU.

4. Results

4.1. Facies Evaluation

Analysis of the core samples and integration with the well log data indicated that four key depositional environments represent the Abu Madi Formation facies and environment. These environments are defined on the basis of multiple sedimentary facies and/or facies associations that collectively represent that particular environment.

4.1.1. Flood Plain Environment

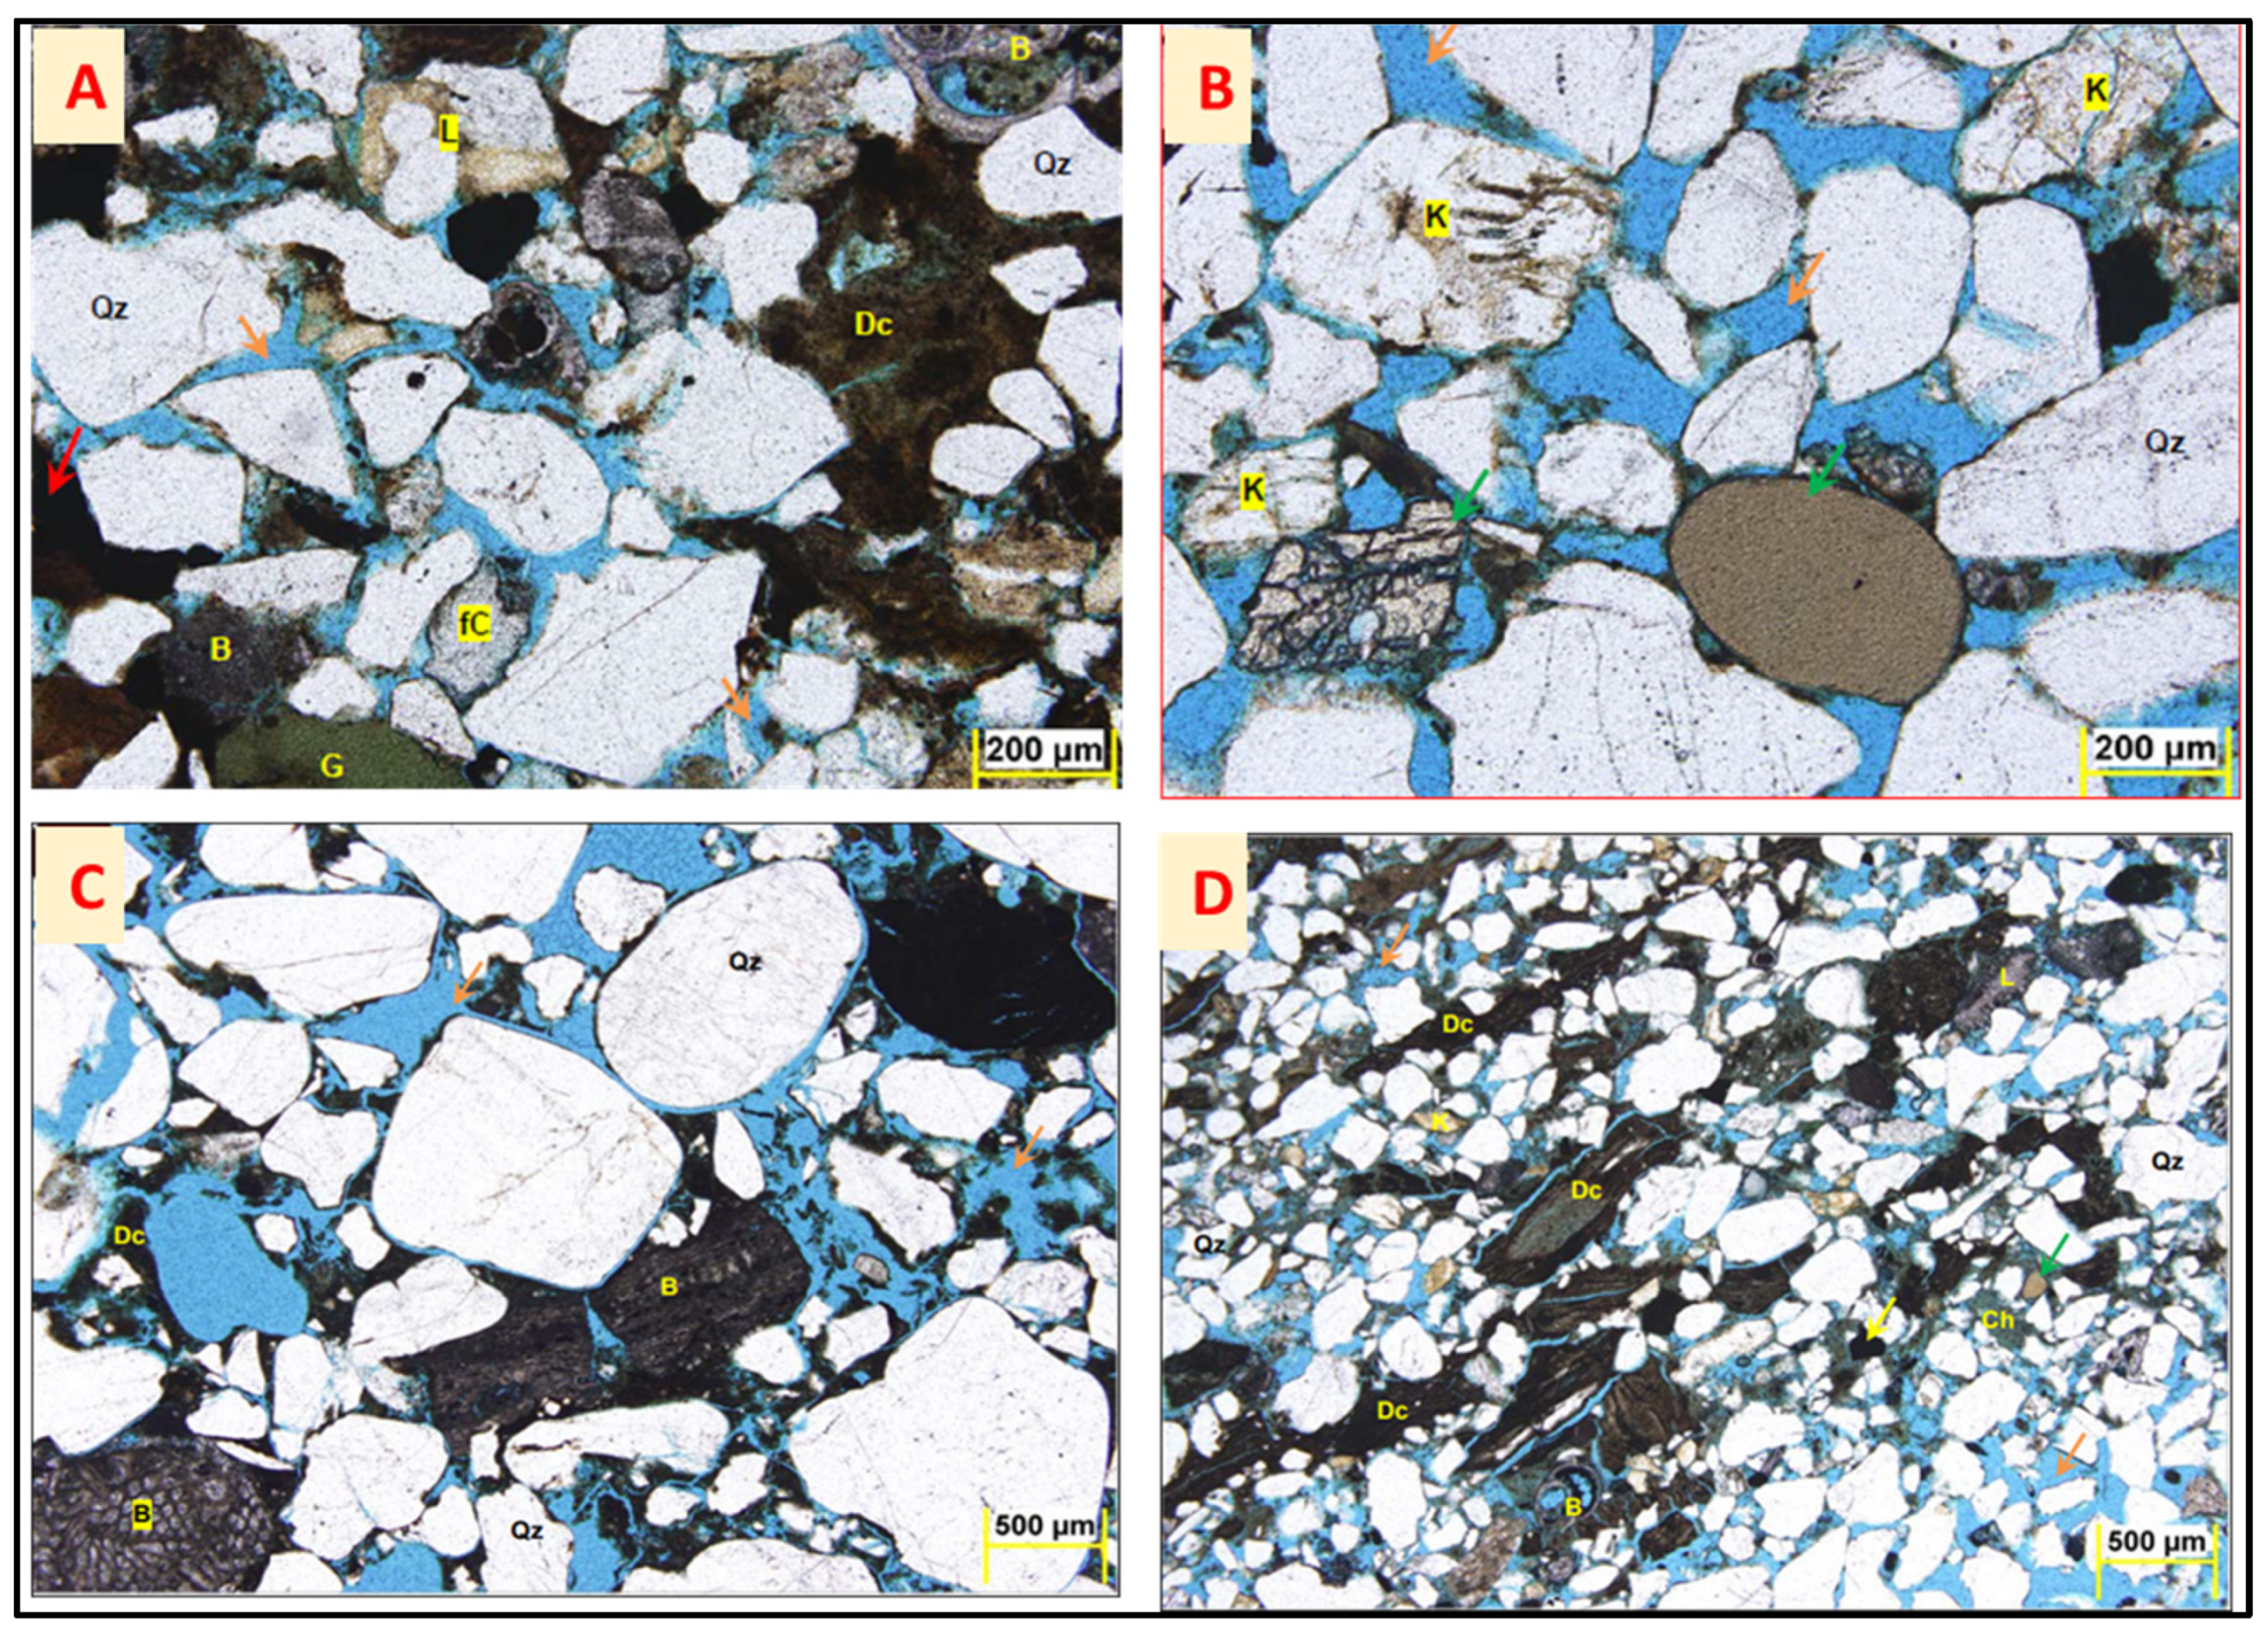
Description: Very fine-grained sandstone with symmetrical and asymmetrical ripple cross-lamination. Heterolithic lamination, tidal mud drapes, and reactivation surfaces are common (Figure 3A). These facies comprise poorly cemented, moderately compacted subfeldspathic arenites and wacke stones (Figure 4A; 2105.7–2106 m). They contain abundant monocrystalline quartz grains and small amounts of K-feldspar and display moderate to good pore interconnectivity.
Interpretation: The heterolithic lamination, tidal mud drapes, and reactivation surfaces indicate the deposition from alternating high and low flow energies and/or changes in flow direction/regime [56]. The recognition of tidal influence on sedimentation indicates a transition from fluvial to marine conditions.

4.1.2. Tidally Influenced Fluvial Channel Environment

Description: Fine- to very fine-grained sandstones with wave ripple cross lamination, wavy bedding, flaser lamination, and abundant reactivation surfaces with mud drapes (Figure 3A), (2095.5–2096 m). These sediments are characterized by fining-upwards successions with erosive bases. These facies are composed of silt to poorly sorted and sub-angular to rounded granule grade sediments (Figure 4B). The sandstones are poorly cemented and moderately compacted, with common pore-filling and grain-coating detrital clays.
Interpretation: The presence of fining-upwards sequences with erosive bases suggests deposition by a sudden event that decelerated rapidly and was erosional at the front and/or base of the flow. The presence of wave ripples cross lamination, wavy bedding, falser lamination, and abundant reactivation surfaces suggest a tidal influence on sedimentation. This suggests that these sediments were deposited in a tidally influenced fluvial channel setting [57,58].

4.1.3. Fluvial Channel Environment

Description: This environment is composed of massively bedded conglomeratic kaolinitic pebbly sandstones with sharp bases that generally lack interbedded mudstones (Figure 3B). The sandstones are poorly cemented and moderately compacted, with common pore-filling and grain-coating detrital clays (Figure 4C). The sandstones are characterized by moderate to good pore interconnectivity. There are some minor instances where light brown parallel laminated mudstones (shales), without bioturbation or trace fossils, exist within the succession.
Interpretation: The massively bedded conglomerates may have been deposited by a high sediment load fluvial current [56,59]. The common scour surfaces and absence of mudstone interbeds between the channel-fill deposits indicate a stacked channel element formed from multiple channel incision and infill stages [60]. The instances where light brown horizontal laminates shales are present, and, in particular, the absence of bioturbation or trace fossils, potentially suggest a continental freshwater depositional setting.

4.1.4. Tidal Channel Environment

Description: The sandstones are very fine-grained and glauconitic and display ripple cross-lamination and trough cross-bedding (Figure 3A; 2089.5–2090 m). The sandstones display fining-upwards sequences and mud drapes along the sedimentary fore sets (for ripple cross-lamination and trough cross-bedding); the presence of mud drapes increases upwards within these intervals. The sandstones are moderately to poorly sorted, sub-rounded to sub-angular, poorly cemented, and poorly compacted subfeldspathic arenites and wacke stones (Figure 4D). These facies display good to moderate pore interconnectivity.
Interpretation: The presence and abundance of bioturbation, an upwards increase of mud drapes, and glauconite, indicate that these sediments were formed in a shallow water setting, with significant tidal influence [57,58]. The presence of trough-cross bedding and ripple cross-lamination suggests that deposition possibly occurred in a channelized setting, with varying flow rates. Overall, these deposits are deposited in a tidal channel environment, with glauconite suggesting the marginal marine nature of this facies.

4.2. Hydraulic Flow Units (HFU)

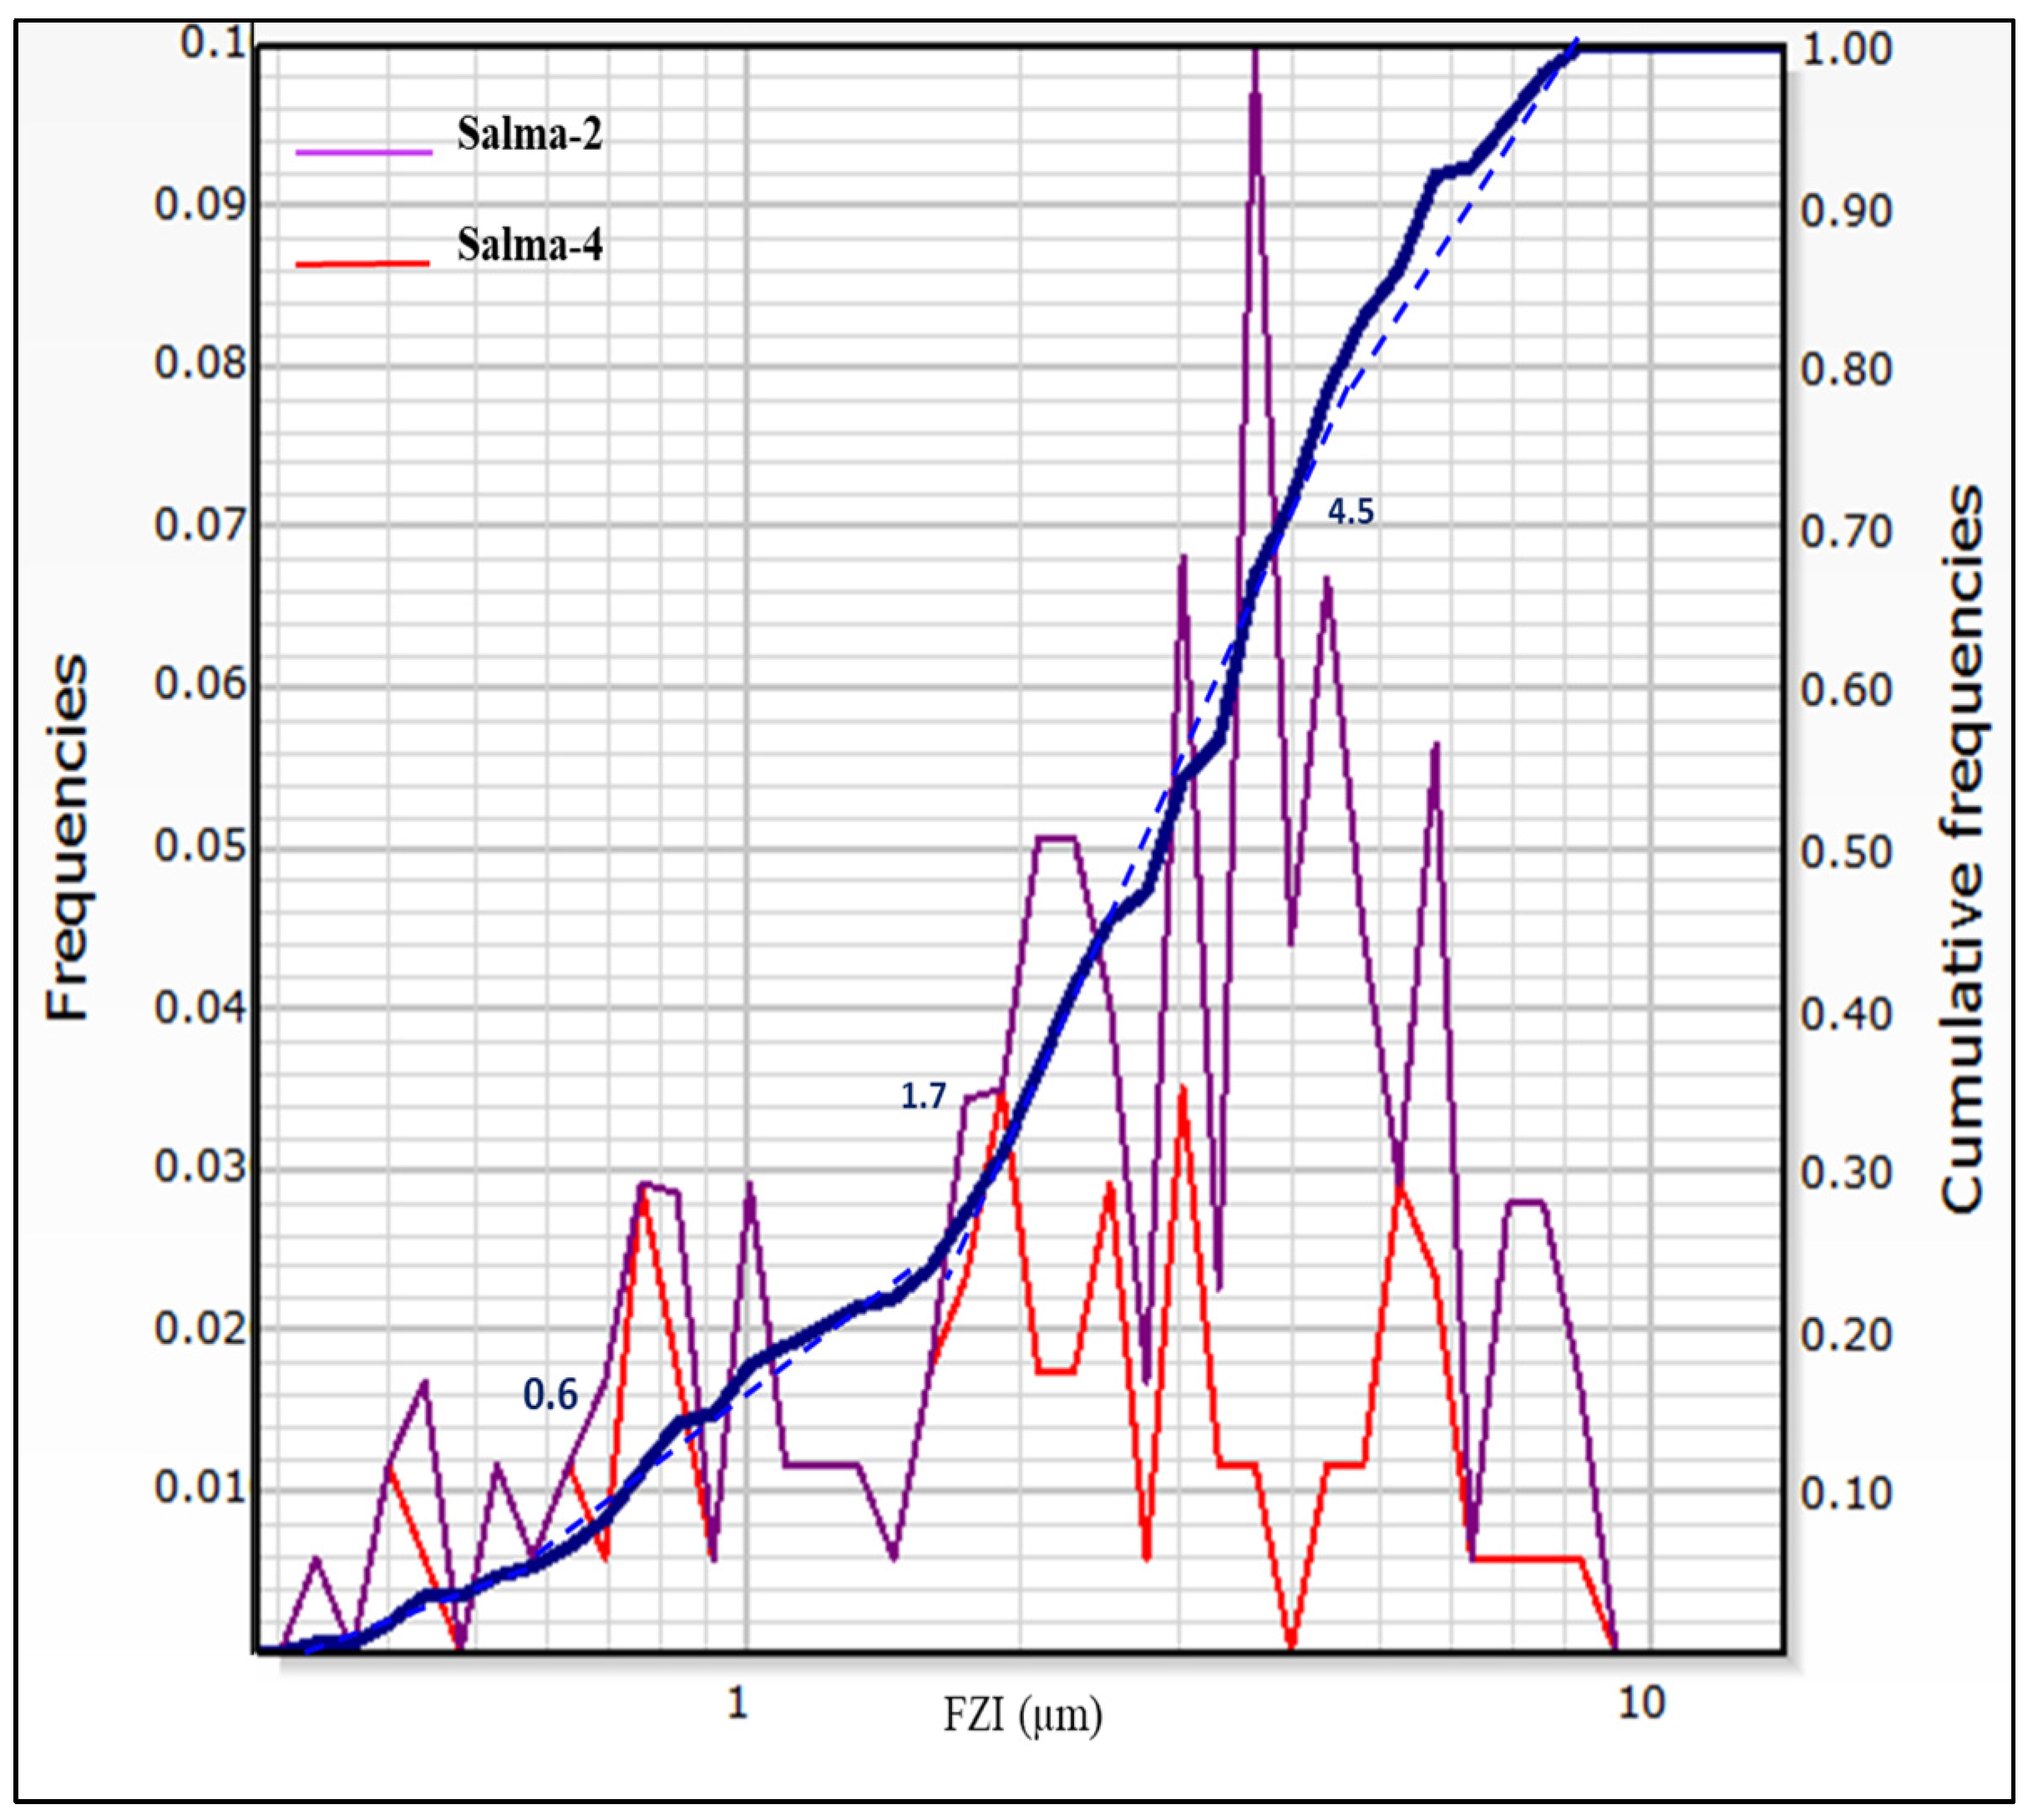
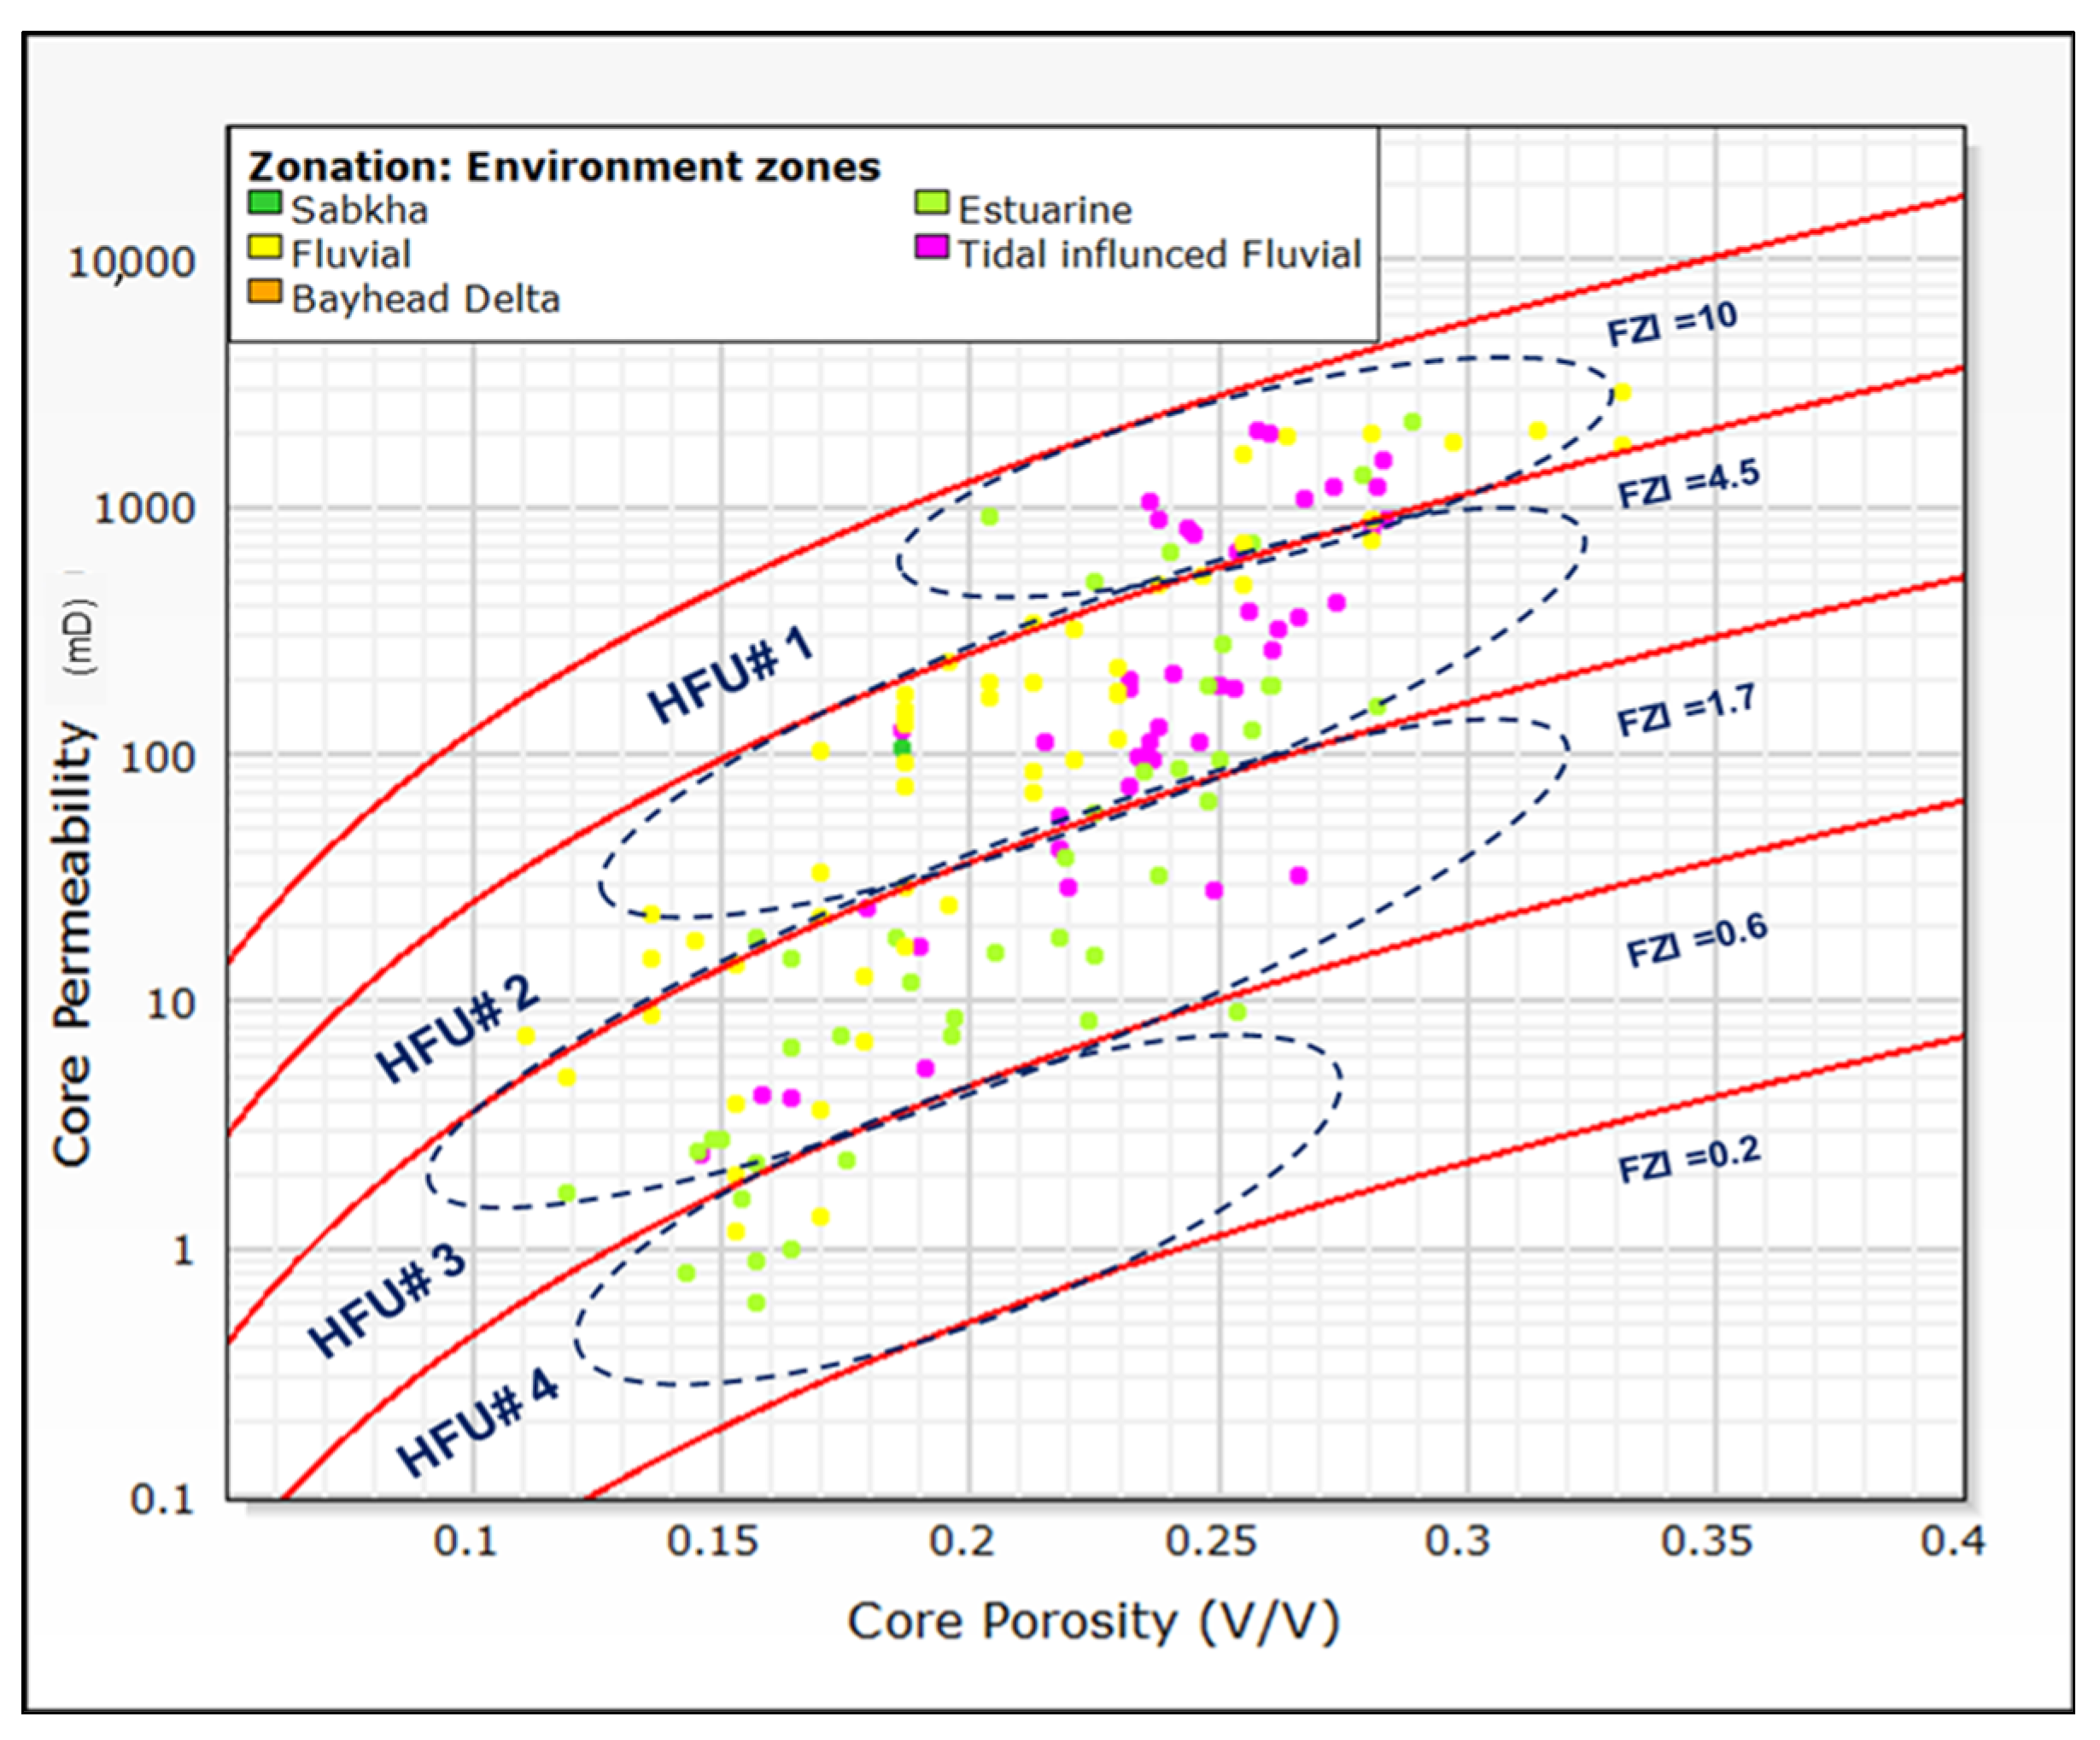
The FZI was calculated using RQI and normalized porosity, using the normal distribution of the FZI values and the cumulative curve of FZI. HFUs were defined where the change in the slope of the cumulative curve was interpreted as a change in flow unit bound by the inflexion point. Measured core data for Salma-2 and Salma-4 wells (Figure 9) show four main HFUs controlling reservoir performance in the Abu Madi Formation reservoir. The defined HFUs, reservoir facies (Figure 10), and associated data are summarized in Table 2.
HFU#1: The FZI average value (4.5 to 10 µm) indicates an excellent-quality sandstone reservoir with a porosity range of 25–33% and a permeability of >900 mD. It suggests the occurrence of fluvial channel and tidally influenced fluvial channel facies within the reservoir.
HFU#2: The FZI average value (1.7 to 4.5 µm) is a very good- to good-quality sandstone reservoir, with a porosity range of 17–33% and a permeability of 70–900 mD. This implies the presence of fluvial channel and tidally influenced fluvial channel facies within the reservoir.
HFU#3: The FZI average value (0.6 to 1.7 µm) indicates moderate-quality sandstone reservoirs, with a porosity range of 12–33% and a permeability of 4–100 mD. It is related to the occurrence of tidal channel and floodplain deposits.
HFU#4: The FZI average value (0.2 to 0.6 µm) represents a low-quality sandstone reservoir, with a porosity range of 15–30% and a permeability of 0.6–8 mD. This is likely an indicative of tidal channel and floodplain facies.

4.3. Formation Evaluation

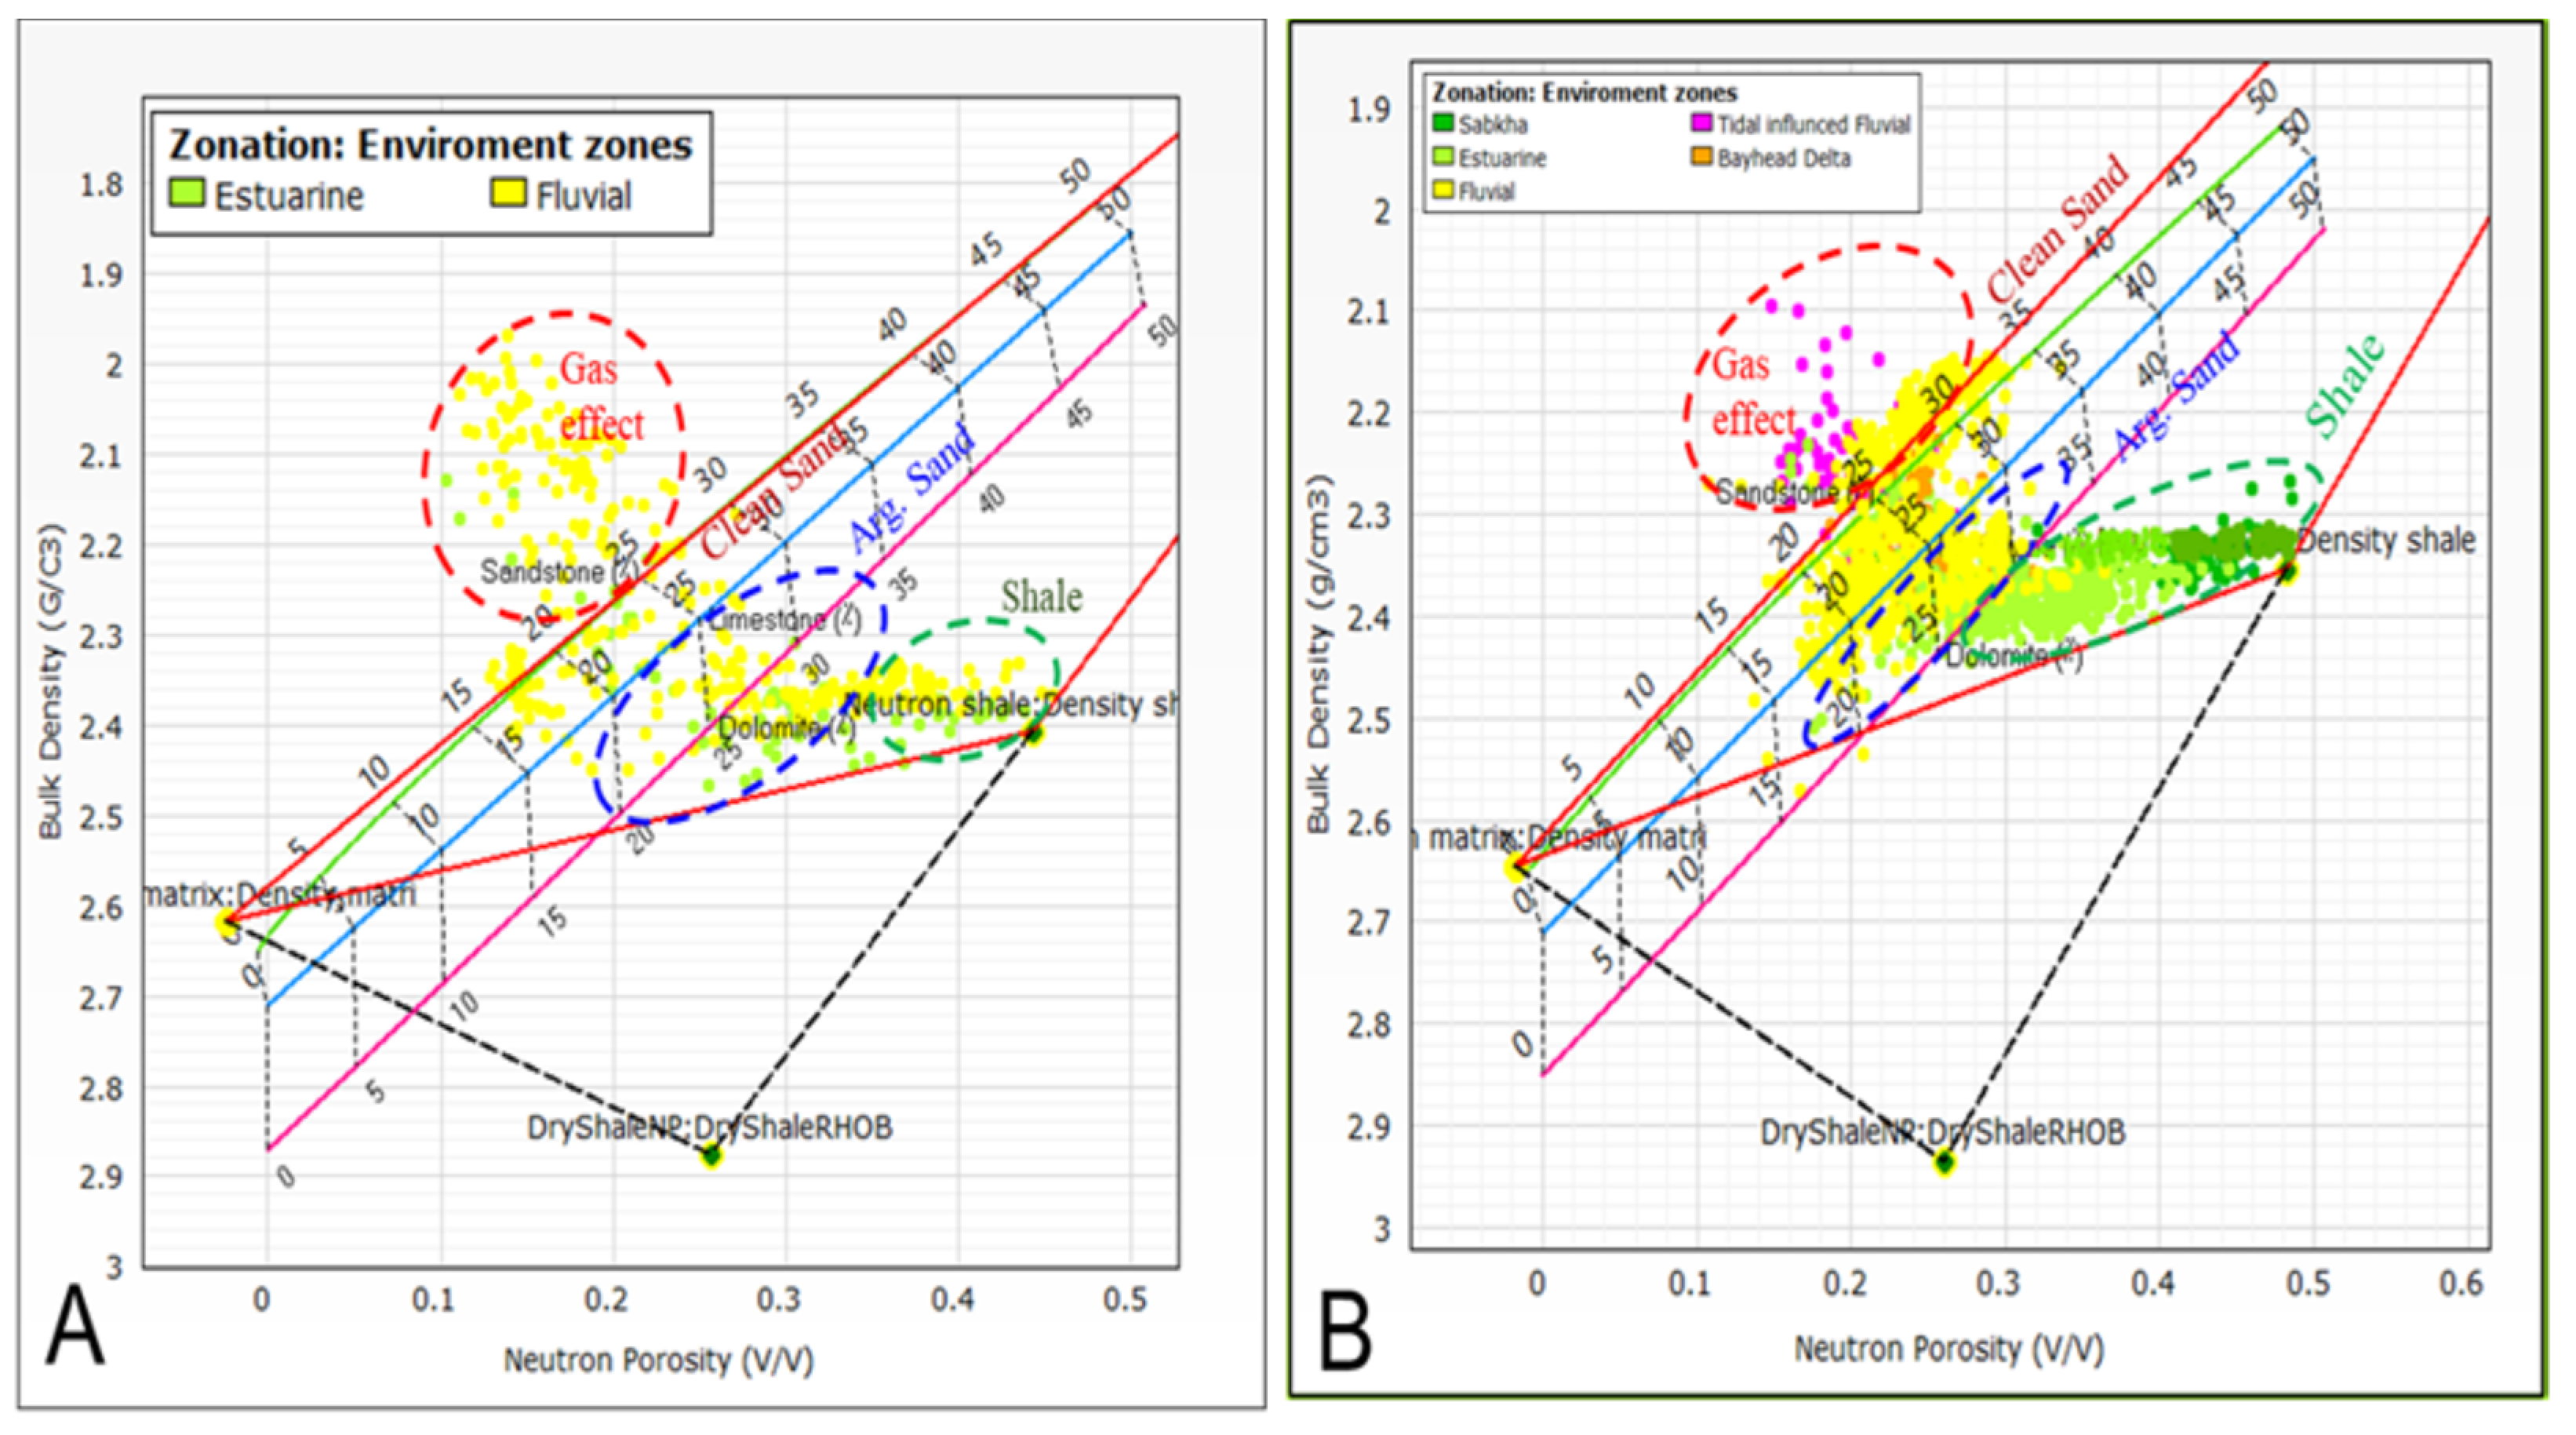
Graphical and computational methods were used to determine the petrophysical properties of the Abu Madi Formation reservoir. TechlogTM software (Version 2015) was used to identify various reservoir parameters, including shale volume, lithology, effective porosity, and water saturation. The raw data of neutron-density cross-plots for the Salma-2 and Salama-4 wells show that many of the data points lie on or close to the sandstone line (Figure 11).
Points plotted near the limestone lines suggest the presence of calcareous cements. Other points lie below the dolomite line as they are composed of 100% shale. Due to the gas effect, some neutron-density points plot away from the sandstone line [28,61,62].
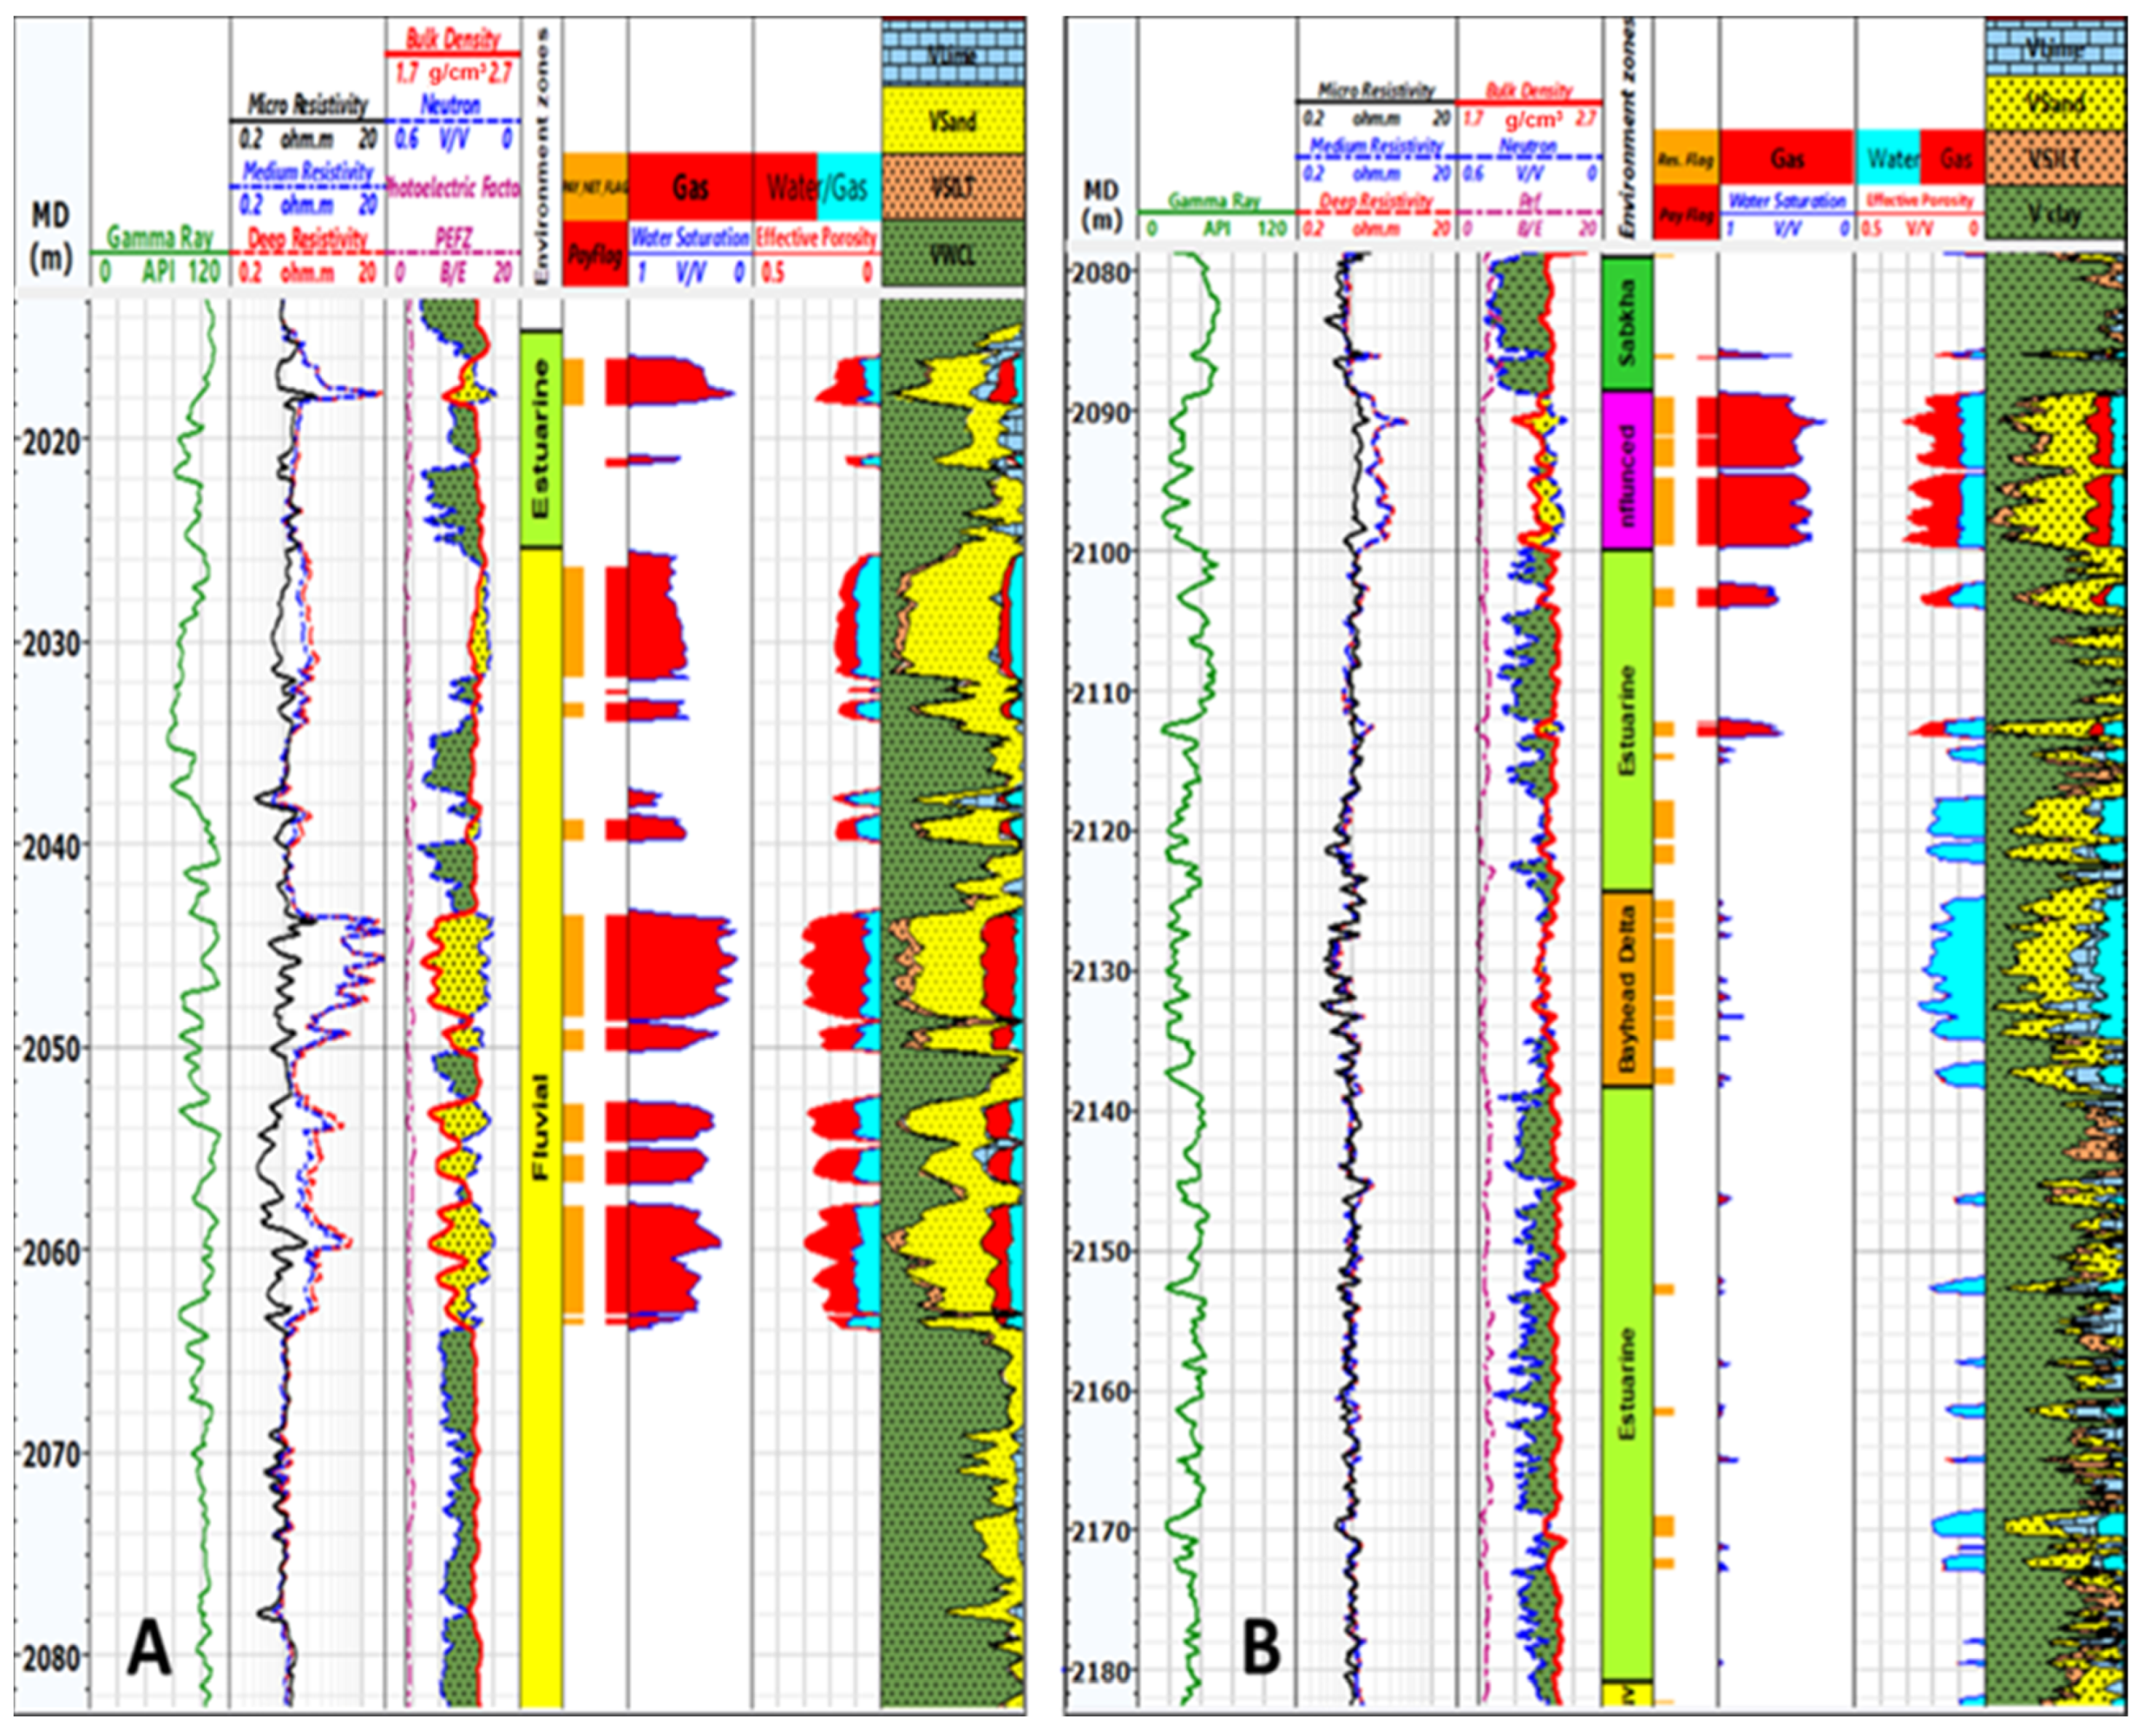
The core data and well log analysis indicate that the reservoirs are composed mainly of sandstone and mudstone (shale) intercalations. Sandstone intervals are characterized by excellent reservoir quality in the Salma-2 well, which is composed of the coarser-grained sandstones of the fluvial channel (Figure 12A) that have an average porosity of 22%, low clay content (average shale volume of 18%), and water saturation of 30–42%. The Abu Madi Formation reservoirs in the Salma-4 well (Figure 12B) vary from argillaceous to clean sandstone intervals, which were deposited in estuarine, tidal, and fluvial environments. These display excellent reservoir parameters within the pay zone, with an average porosity of 24%, an average shale volume of 21%, and water saturations of 35–43%.

4.4. Neural Log FZI and Permeability Prediction

The neural log application (K-mode) was originally a statistical technique, but its results are showing to be geologically consistent [28]. Neural log techniques were applied to data from 148 core samples as input data (PHIE and FZI from the data of core analysis), to extrapolate and predict FZI values and define HFUs in the non-cored intervals within the wells using log data (PHIE, Pef, and VSH). Using log and core data within the cored intervals, as well as applying the neural analysis method to FZI on the log, the values were then predicted within non-cored intervals [31]. The results of the FZI curve correlated with the curves produced from the cored intervals after a reasonable number of iterations were conducted (5 runs; each run included 100 iterations in the internal process), until it reached a minimum constant accepted error. Permeability (K) values were calculated in the non-cored intervals as a function of porosity  ( Φ ) and FZI. Re-write Equation (2) in new format as follows [10]:
K = 1014   F Z I 2 × Φ 3 / ( 1 Φ ) 2
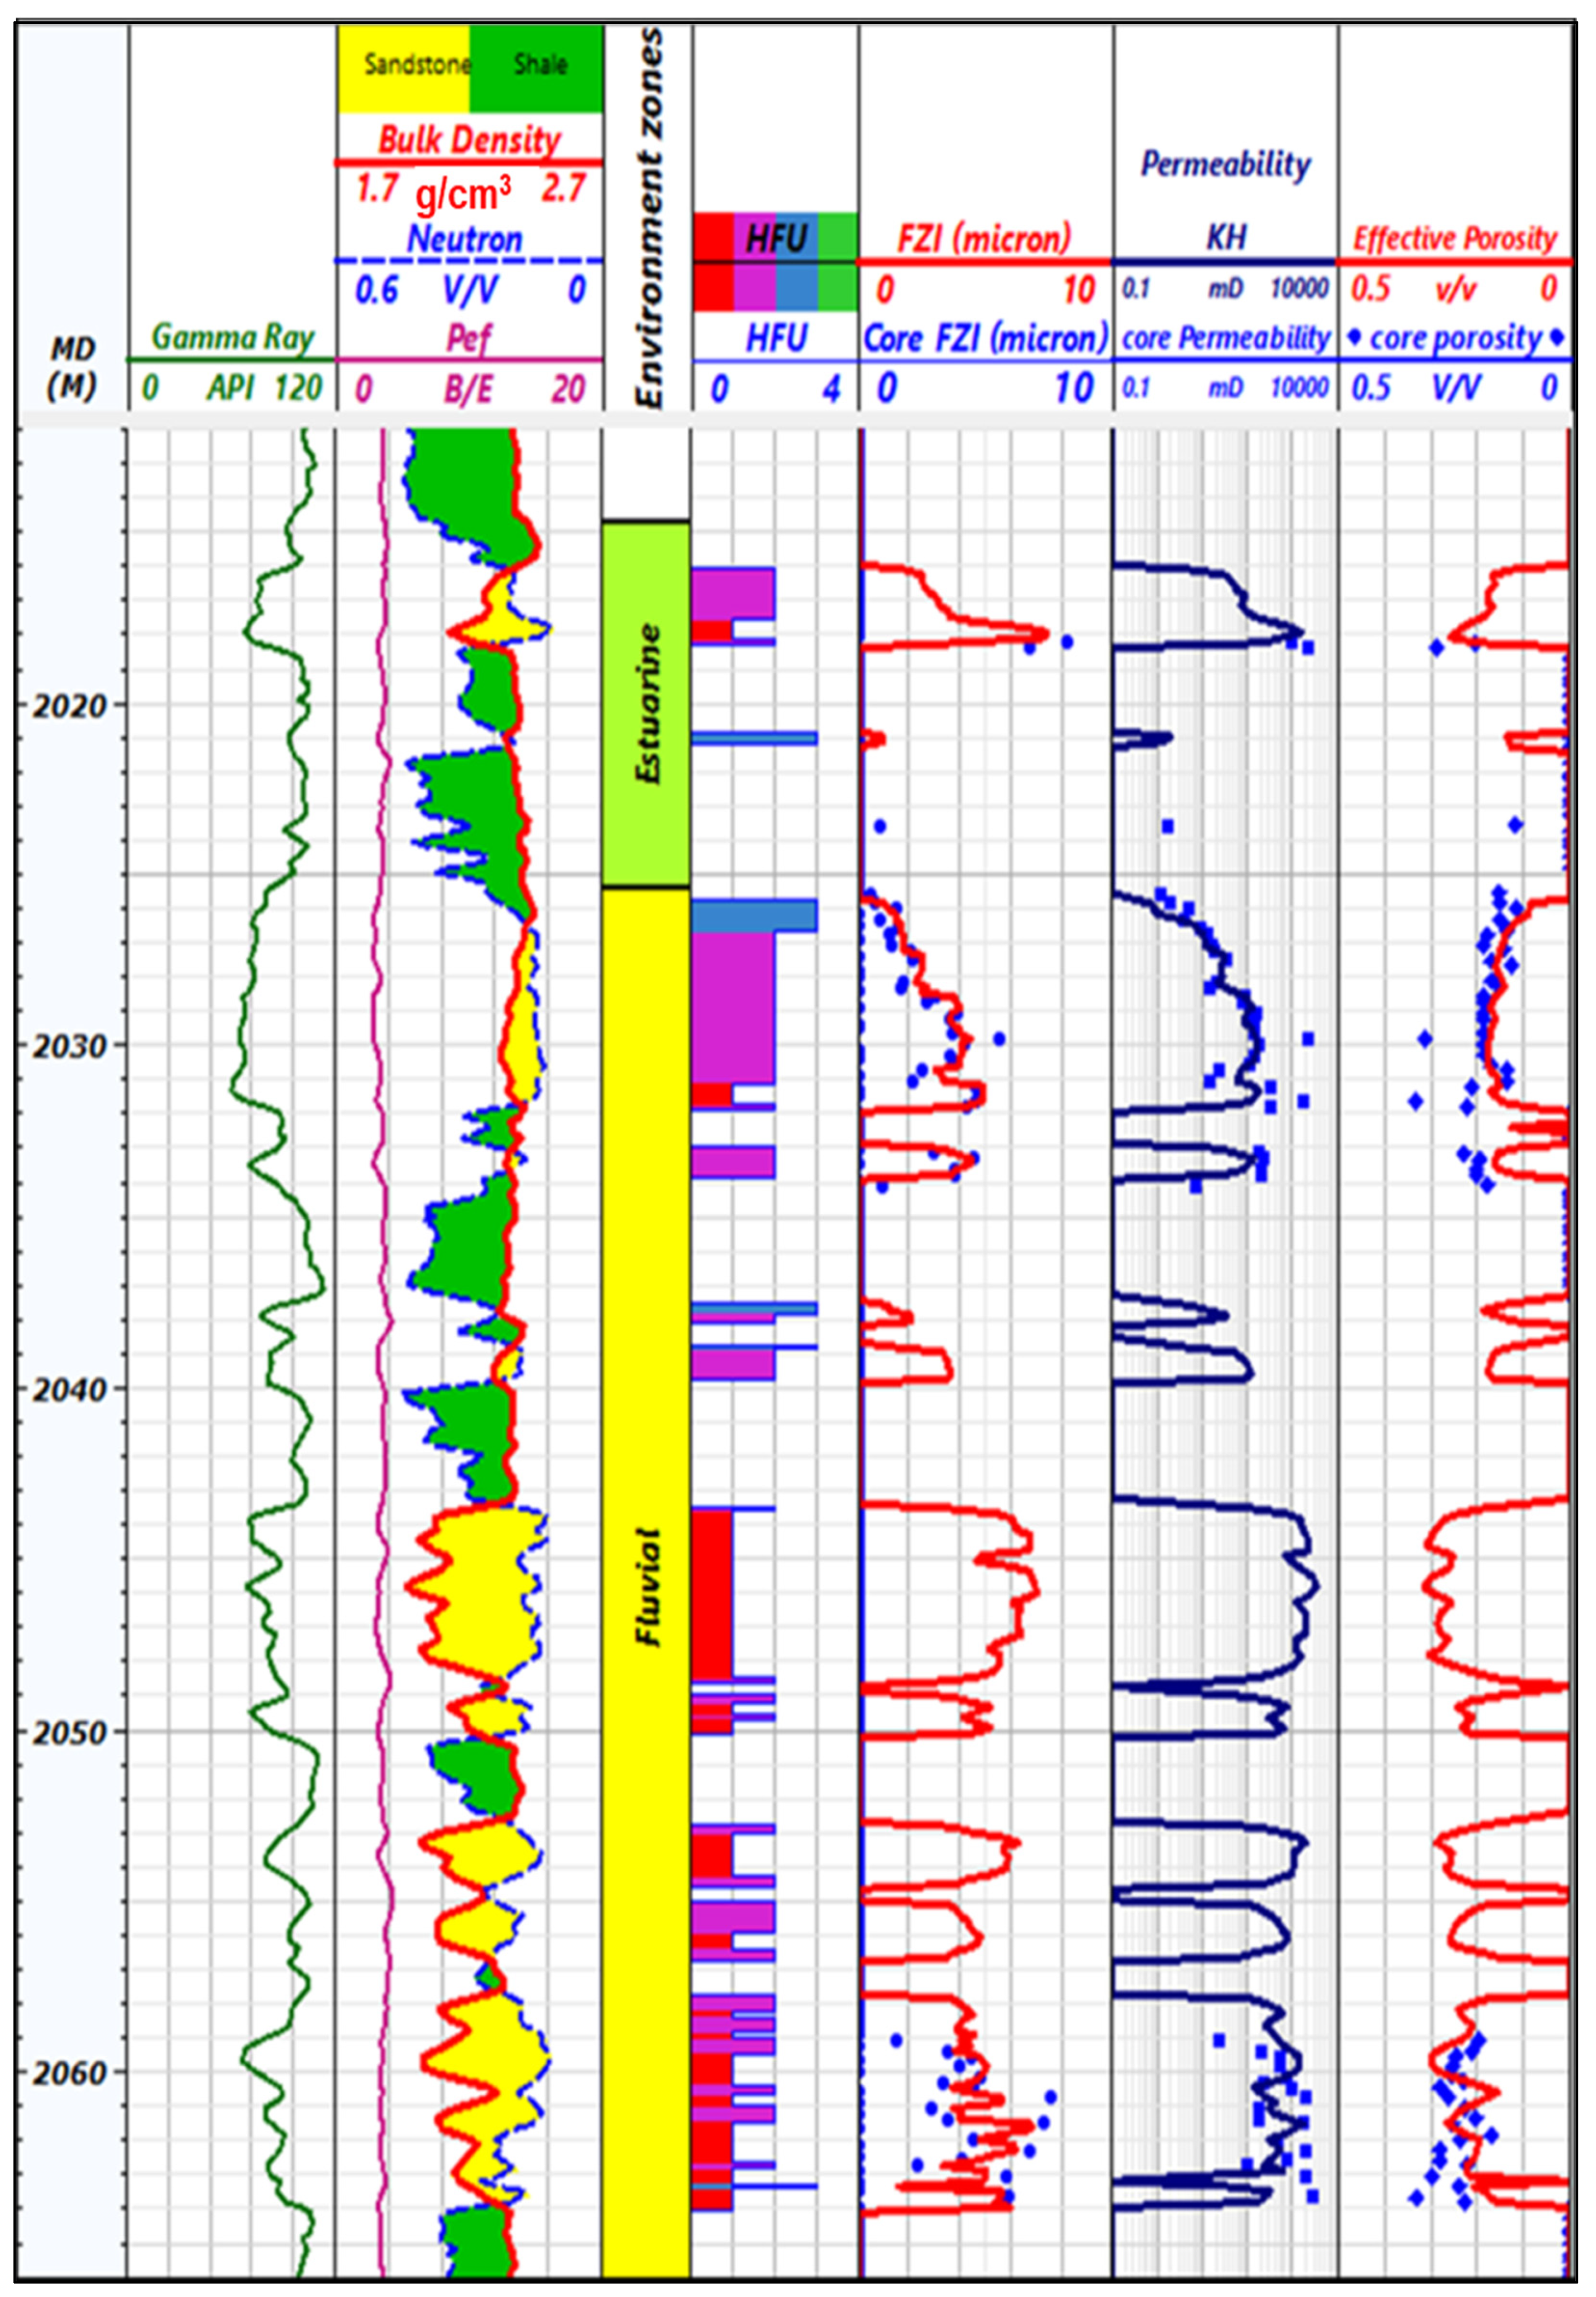
The same procedure was applied to the other wells (Salma-1, Salma-3, Salma-5, and Salma N-1), which only have well logs that predict FZI in the non-cored intervals (i.e., those ‘other wells’ are non-cored throughout). The result of predicted FZI on log bases and permeability calculations (Figure 13 and Figure 14) are summarized in Table 3. Although the HFUs are defined by different ranges of FZI, each flow unit may display a wide range of porosity and permeability. Reservoir property model distribution within the entire reservoir is provided by the distributions of FZI values and is defined by the flow unit model. The flow units are used as the basis for the distribution of the porosity and permeability within the range of each unit.

4.5. Saturation Height Model

The saturation height function was defined on the flow unit’s bases to predict water saturation at different reservoir points based on its position above the free water level.
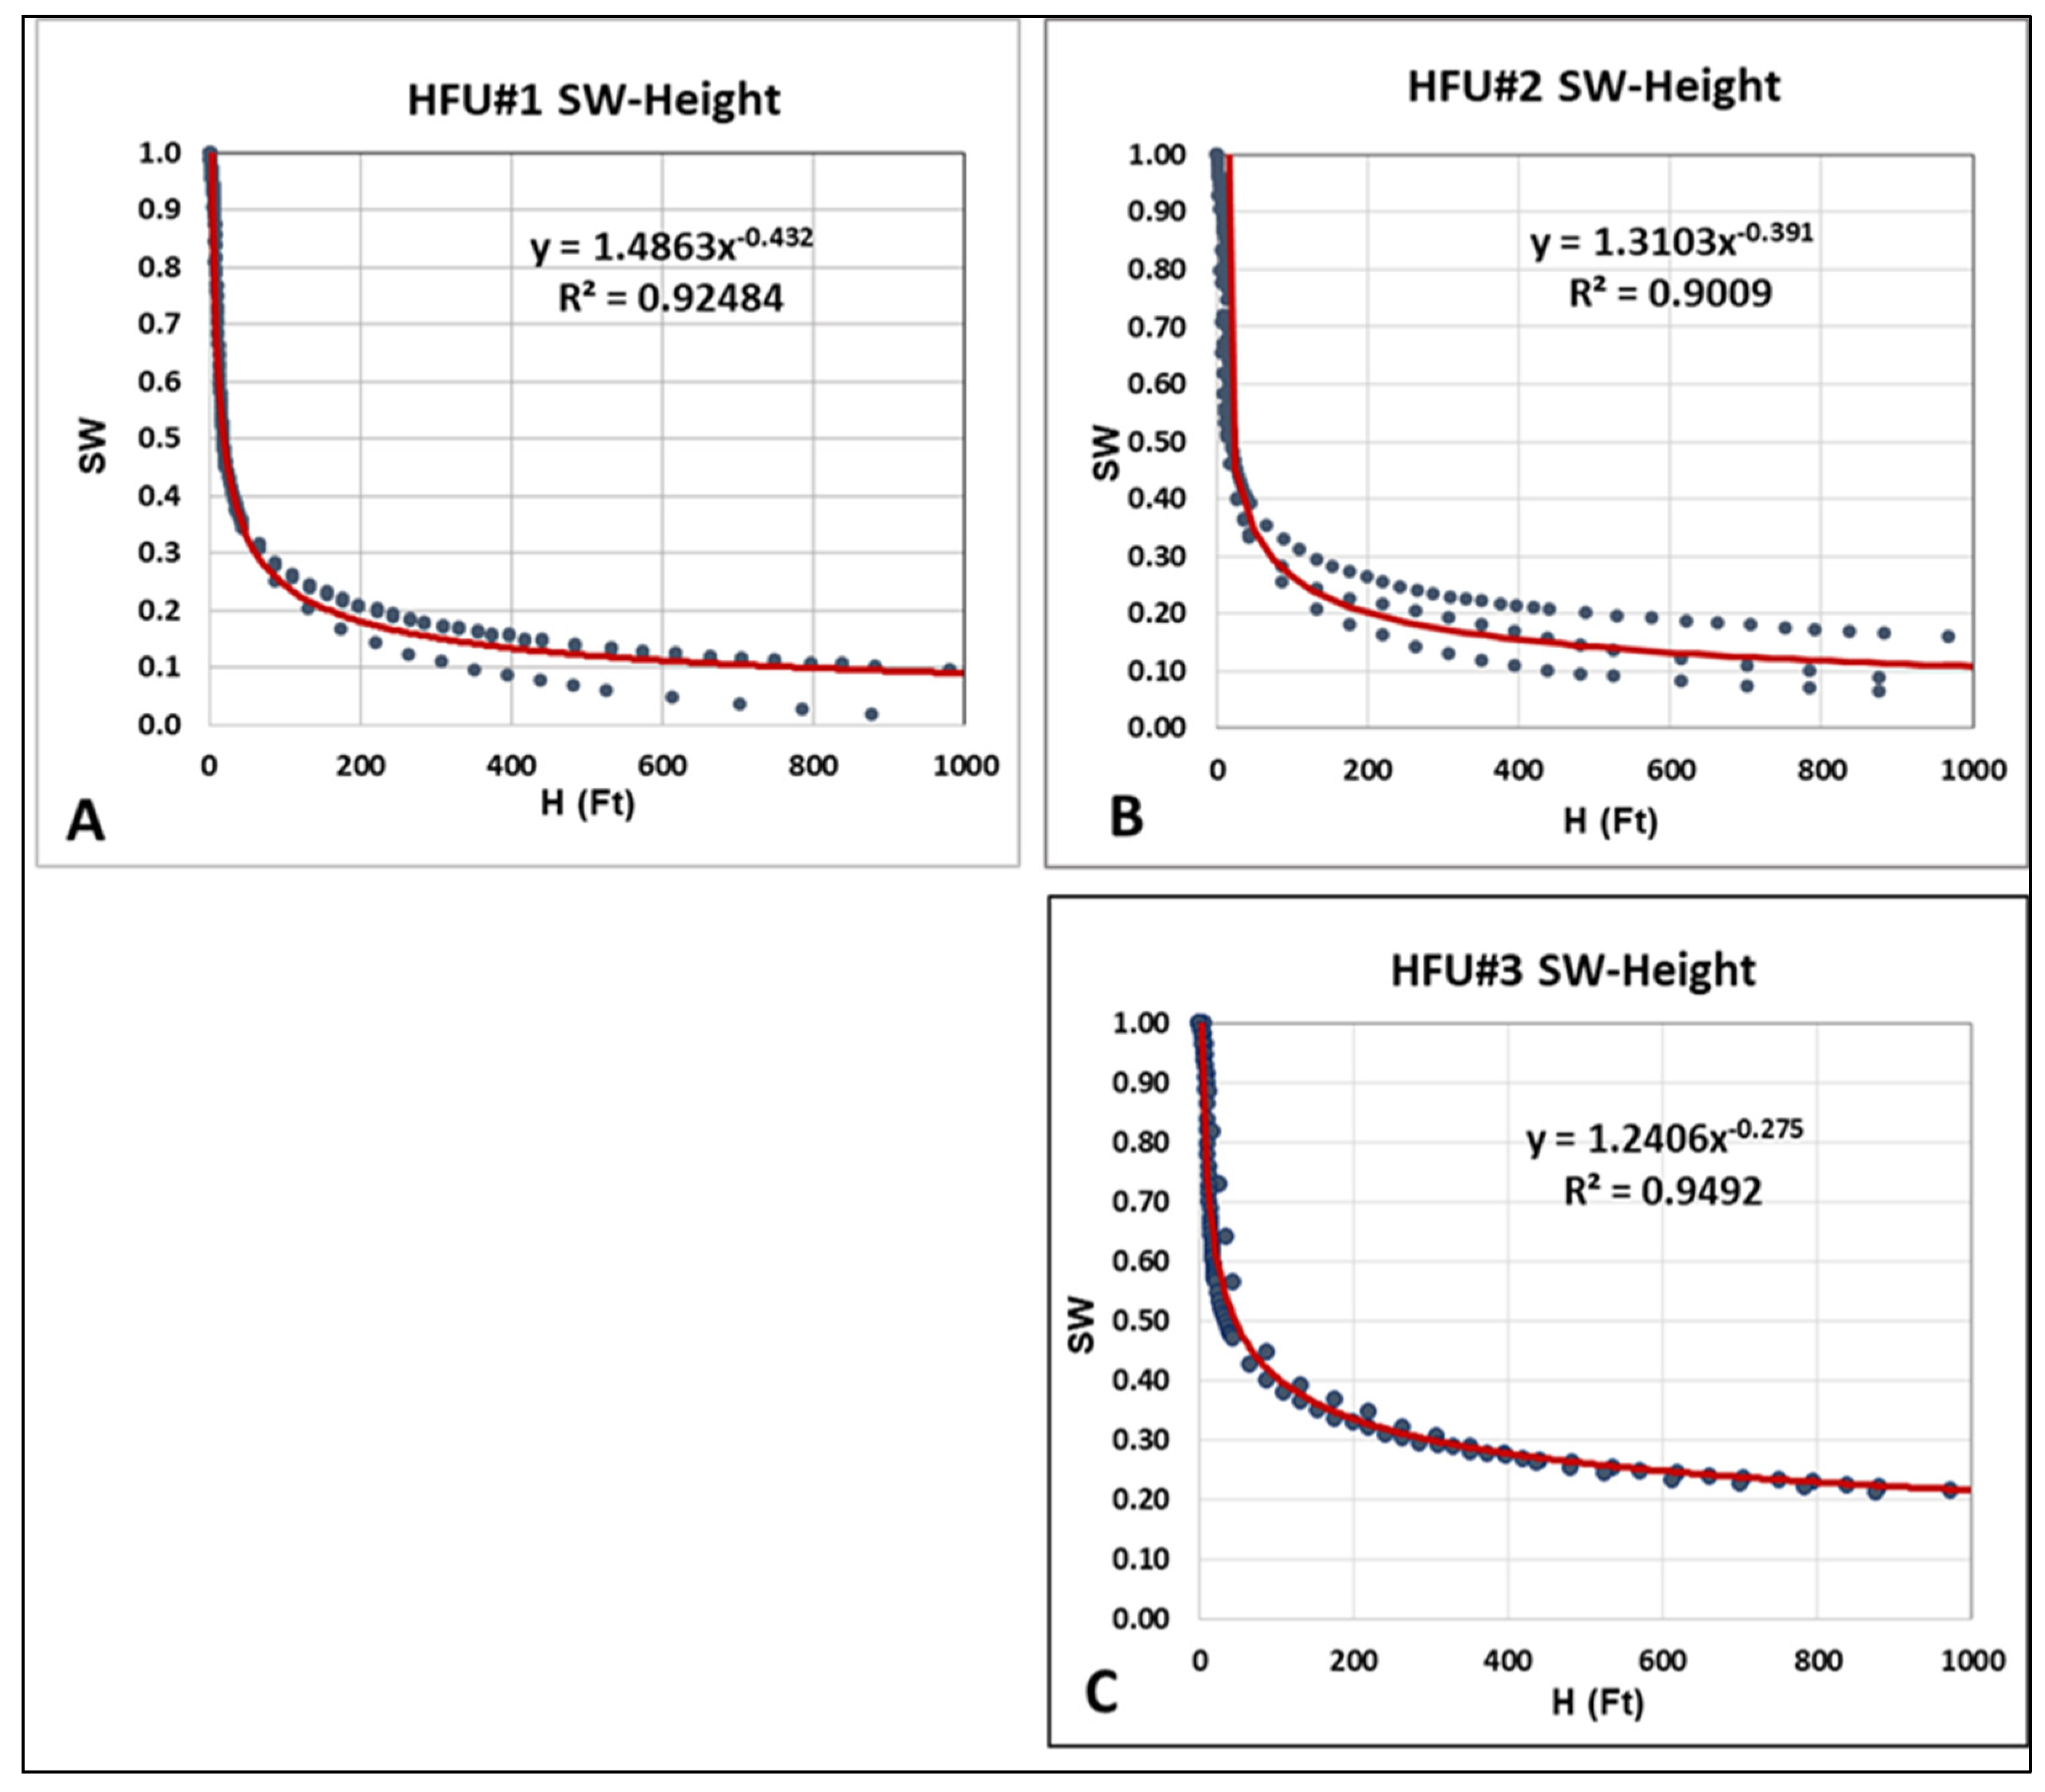
The goal was to create a saturation model that was more relevant to the change in facies and reservoir parameters. Firstly, a single equation was created for each flow unit by registration, to represent the relationship between SW and height above FWL. Secondly, data were plotted, and the resulting curves were compared to the data for each flow unit (Figure 15). The red line represents the best linear fit to the data trend. Finally, this study developed an equation for a water saturation calculation with a direct relation for HAFWL without detection for capillary pressure and incorporated this for each flow unit as follows:
SW = a × hb
  • a = 1.4863, b = (−0.432) for HFU#1
  • a = 1.3103, b = (−0.391) for HFU#2
  • a = 1.2406, b = (−0.275) for HFU#3 and 4
  • SW = water saturation (v/v); h = height above free water level (ft).
On this basis, the water saturation (SW) was determined for all wells in the Salma Field.
Figure 15. SW–H-function curves for Abu Madi Formation: (A) HFU#1, (B) HFU#2, (C) HFU#3. (Dot blue line = core data, solid red line = predicted best fit line).
Water 15 04204 g015

4.6. Water Saturation Using J-Function

The Leverett J-function was calculated by considering the change of reservoir porosity and permeability values within the flow unit and Pc. The values of J–SW data for different flow units are plotted (Figure 16) and a regression was performed to fit the normalized data using a single equation to fit the J–SW data for each flow unit (HFU#1 to HFU#3), with different parameters (Figure 16A–C). The best fit is represented by the red line.
Finally, this study developed an equation with the different parameter for each flow unit, which is as follows:
J = a × Wb        or SW = (J/a)1/b
  • a = 0.4618, b = (−2.127) for HFU#1
  • a = 0.1465, b = (−2.8) for HFU#2
  • a = 0.100, b = (−3.12) for HFU#3 and 4
  • where SW = water saturation (v/v); J = Leverett J-function.
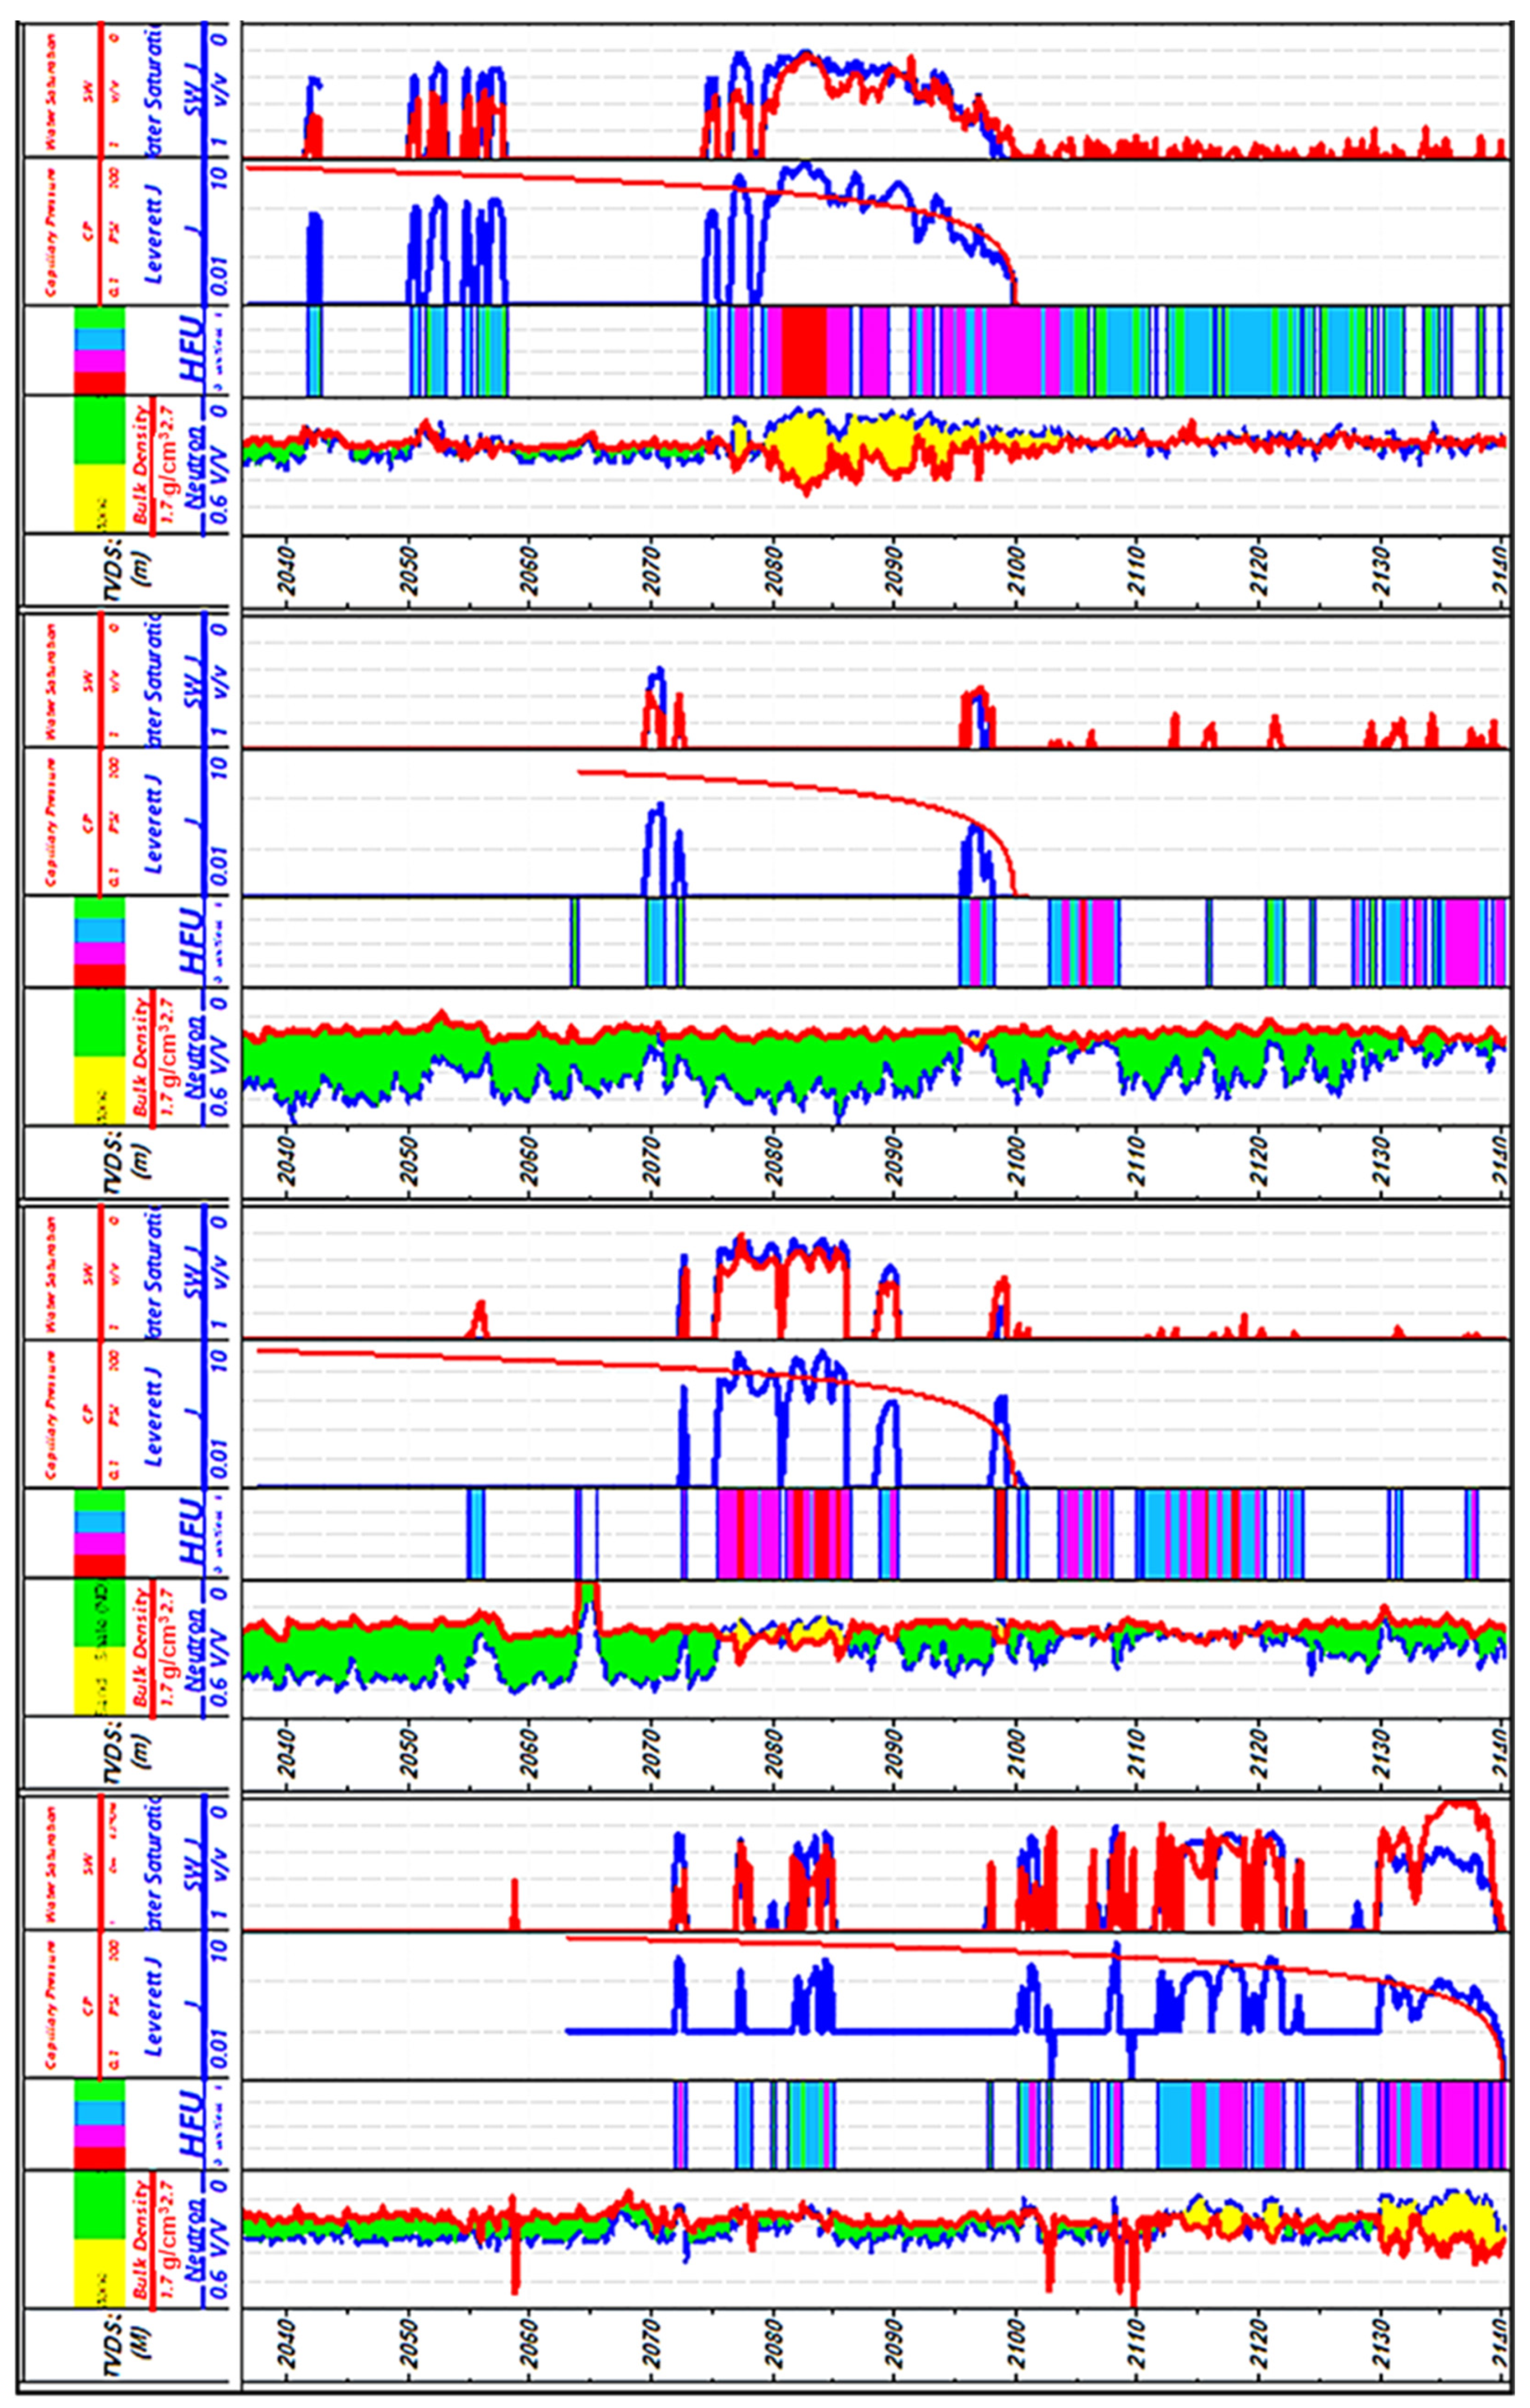
The water saturation (SW_JF) was computed for all wells in the Salma Field and was based on predefined flow units, with calculated Pc, and J-function above free water level. Calculated SW_JF was plotted and correlated with previous SW calculated from resistivity (Figure 17). When we compared the water saturation predicted by the saturation height function and the J-function, the J-function was interpreted to be more reliable, largely as the values were variable depending on the porosity and permeability of the reservoir. In comparison, the saturation height function varied in response to changes in porosity and permeability.

5. Discussion

5.1. Depositional Environments, Flow Units, and Control upon Reservoir Quality

A wide range of facies and different flow units characterize the Abu Madi Formation reservoir. The variation in the depositional environments principally controls the reservoir parameters of these flow units. The fluvial channel and tidal channel deposits form the highest-quality reservoir facies, in which grain sizes range from silt- to granule-grade sandstones that are occasionally conglomeratic. This variability in grain sizes (poor-sorting) is typically formed at the base of these facies, with beds becoming moderately sorted in the upper parts. The sandstone of the fluvial channel facies has very good pore interconnectivity. The high FZI values indicate very good-quality reservoirs with an effective pore system dominated by HFU#1 and HFU#2.
However, when the reservoir’s depositional environment transitions into more estuarine conditions, the sedimentary deposits are dominated by siltstone, mudstone (shale), and some mud-rich sandstones. Despite the higher mud content, these types of deposits have moderate FZI values (HFU-#3). Abundant in mudstone (shale) and highly argillaceous sandstone intervals present heterolithic facies of the estuarine environment, with poor reservoir quality. The reservoir is characterized by low FZI values, with an ineffective pore system dominated by HFU#4.

5.2. Flow Unit Identification and Validation of Irreducible Water Saturation and SW Estimation

Two methods were used to build the saturation model: the saturation height function and the J-function. Based on different flow units, three models for each method were applied. Data from the two methods show that small pores retain a fluid volume regardless of any existing pressure (irreducible water saturation). Data from the SW–H model (Figure 15) show that HFU#1 has a minimum irreducible water saturation (10%) and is lower in SW versus height above free water level. HFU#2 has a minimum irreducible water saturation (11%) and low to moderate SW values versus height above free water level. HFU#3 has a minimum irreducible water saturation (20%), with high SW values versus height above free water level. J–SW curves with different parameters related to different flow units (Figure 16) and water saturation (SW_JF) were computed for all wells in the Salma Field based on predefined flow units. Generally, there is a good match between SW predicted by the two methods and SW calculated based upon the resistivity log data. The Salma-2 and the Salma-4 well data show good agreement between modelled and calculated SW.
The predicted SW_J show reasonable matching in the deeper and middle zones above the free water level, where most of the reservoir is blocky and clean sandstones of HFU#1 and HFU#2 are present. SW_J is almost lower than SW in the upper pay zone based on the resistivity log (Figure 17). The difference in observed value is interpreted to be from an overestimation of SW from resistivity, largely due to the low-resistivity values of thin beds, resulting from the shoulder effect of adjacent shale layers, or low resistivity for interbedded sandstone and mudstones (heterolithic).

6. Conclusions

Rock typing classification, reservoir quality assessment, and petrophysical characterization aid in the subdivision of the reservoirs into fluid flow units and rock types.
Based on the results of this study, it is concluded that four HFUs control the reservoirs of the Salma Field in Egypt. These are HFU#1 (excellent reservoir facies), HFU#2 (very good to good reservoir quality), HFU#3 (moderate quality), and HFU#4 (low quality). The neural log technique (K-mode) has succeeded in predicting FZI, permeability, and petrophysical parameters in the un-core interval in the study wells. The capillary pressure analysis and output of a water saturation curve independent of a resistivity log measurement provided a more consistent method than the conventional log-based analysis in low-resistivity zones, the latter having issues around the undefined effect of clay content and shale distribution within the reservoir.
Understanding and prediction of the current fluid contacts was achieved by applying the saturation height and J-function models, and the technique has been shown to be a successful method for extrapolating water saturation for reservoir zones away from the well and can predict throw reservoir production life and be used as a base of reservoir dynamic model.

Author Contributions

Conceptualization, N.H.E.-G., M.A.W. and M.K.B.; methodology, N.H.E.-G., W.M.M., M.A.W. and M.K.B.; software, M.A.W. and M.K.B.; investigation writing—original draft preparation, N.H.E.-G., M.A.W., W.M.M., M.K.B. and F.A.A.; reviewing and editing, M.A.W., M.K.B., F.A.A., T.J.D. and D.E.A.; supervision and visualization, N.H.E.-G., W.M.M., M.K.B., F.A.A. and D.E.A. All authors have read and agreed to the published version of the manuscript.

Funding

This research was funded by the Researchers Supporting Project number (RSPD2023R1120), King Saud University, Riyadh, Saudi Arabia.

Data Availability Statement

Restrictions apply to the access of the data, which were utilized under permission for the current study and are therefore not publicly available. The data supporting the findings of this investigation can be obtained from [the EGPC]. However, data are accessible from the authors upon justifiable request and with [the EGPC’s] consent.

Acknowledgments

The authors extend their appreciation to King Saud University for funding through Researchers Supporting Project number (RSPD2023R1120), King Saud University, Riyadh, Saudi Arabia. Thanks are due to EGPC, (DANA GAS) Company, and El-Wastani Petroleum Company for providing the required data.

Conflicts of Interest

The authors confirm that there is no conflict of interest between all authors even Mohamed who is affiliated with the Dana Gas Company and that there is no commercial or financial relationships in the present work.

References

  1. Leila, M.; Kora, M.A.; Ahmed, M.A.; Ghanem, A. Sedimentology and reservoir characterization of the upper Miocene Qawasim Formation, El-Tamad oil field onshore Nile Delta, Egypt. Arab. J. Geosci. 2016, 9, 17. [Google Scholar] [CrossRef]
  2. Novak, K.; Malvik, T.; Velic, J.; Simon, K. Increased hydrocarbon recovery and CO2 storage in Neogene sandstones, a Croatian example: Part II. Environ. Earth Sci. 2014, 71, 3641–3653. [Google Scholar] [CrossRef]
  3. Abdel Aal, A.; Price, R.; Vital, J.; Sharallow, J. Tectonic evolution of the Nile delta, its impact on sedimentation and hydrocarbon potential. In Proceedings of the 12th EGPC Exploration and Production Conference, Cairo, Egypt, 12–15 November 1994; pp. 19–34. [Google Scholar]
  4. Abdullah, E.; Al-Areeq, N.; Elmahdy, M.; Barakat, M.K. A new insight into the structural architecture of Sharyoof field, Say’un–Masilah basin, Yemen. Arab. J. Geosci. 2021, 14, 1977. [Google Scholar] [CrossRef]
  5. Ali, A.M.; Radwan, A.E.; Abd El-Gawad, E.A.; Abdel-Latief, A.A. 3D Integrated Structural, Facies and Petrophysical Static Modeling Approach for Complex Sandstone Reservoirs: A Case Study from the Coniacian–Santonian Matulla Formation, July Oilfield, Gulf of Suez, Egypt. Nat. Resour. Res. 2021, 31, 385–413. [Google Scholar] [CrossRef]
  6. Radwan, A.E. Modeling the Depositional Environment of the Sandstone Reservoir in the Middle Miocene Sidri Member, Badri Field, Gulf of Suez Basin, Egypt: Integration of Gamma-Ray Log Patterns and Petrographic Characteristics of Lithology. Nat. Resour. Res. 2021, 30, 431–449. [Google Scholar] [CrossRef]
  7. Beiranvand, B.; Kamali, M.R. Petrophysical evaluation and determination of rock types in a carbonate reservoir in SW Iran with interpretation of petrography and geophysical well logs. Iran. Int. J. Sci. 2004, 5, 203–221. [Google Scholar]
  8. Al-Ibadi, H.; Al-Jawad, S.N. Permeability Evaluation of Carbonate Reservoir Using Hydraulic Unit Analyse: Case Study from Middle East Region. In Proceedings of the 82nd EAGE Conference & Exhibition, Amsterdam, The Netherlands, 8–11 December 2020; pp. 1–5. [Google Scholar]
  9. Dolson, J.; Shann, M.; Matbouly, S.; Harwood, C.; Rashed, R.; Hammouda, H. The petroleum potential of Egypt. AAPG Mem. 2001, 74, 453–482. [Google Scholar]
  10. Amaefule, J.; Altunbay, M.; Tiab, D.; Kersey, D.; Keelan, D. Enhanced reservoir description, using core and log data to identify hydraulic (flow) units and predict permeability in uncored intervals/wells. In Proceedings of the SPE 26436, Annual Technical Conference and Exhibition, Houston, TX, USA, 3–6 October 1993; pp. 3–6. [Google Scholar]
  11. El-Sharawya, M.; Leila, M.; Bakr, A.; Kamela, A. Petrophysical evaluation of the Messinian Abu Madi Formation in Salma delta gas field, northeastern onshore Nile Delta, Egypt. J. Environ. Sci. 2020, 49, 46–53. [Google Scholar]
  12. El-Adl, H.; Leila, M.; Ahmed, A.; Anan, T.; El-Shahat, A. Integrated sedimentological and petrophysical rock-typing of the Messinian Abu Madi Formation in South Batra gas field, onshore Nile Delta, Egypt. Mar. Pet. Geol. 2021, 124, 104835. [Google Scholar] [CrossRef]
  13. Mirzaei-Paiaman, A.; Ostadhassan, M.; Rezaee, R.; Saboorian, H.; Chen, Z. A new approach in petrophysical rock typing. J. Pet. Sci. Eng. 2018, 166, 445–464. [Google Scholar] [CrossRef]
  14. Abdullah, E.; Al-Areeq, N.; Al-Masgari, A.; Barakat, M.K. Petrophysical evaluation of the Upper Qishn clastic reservoir in Sharyoof oil Field, Sayun-Masilah Basin, Yemen. ARPN J. Eng. Appl. Sci. 2021, 16, 2375–2394. [Google Scholar]
  15. EGPC (Egyptian General Petroleum Corporation). Nile Delta and North Sinai, Field Discoveries and Hydrocarbon Potentials (A Comprehensive Overview); EGPC: Cairo, Egypt, 1994; p. 387. [Google Scholar]
  16. Barakat, M.K. Modern Geophysical Techniques for Constructing a 3D Geological Model on the Nile Delta, Egypt. Ph.D. Dissertation, Technical University of Berlin, Berlin, Germany, 2010. [Google Scholar] [CrossRef]
  17. Hassan, S.; Darwish, M.; Tahoun, S.S.; Radwan, A.E. An integrated high-resolution image log, sequence stratigraphy and palynofacies analysis to reconstruct the Albian–Cenomanian basin depositional setting and cyclicity: Insights from the southern Tethys. Mar. Pet. Geol. 2022, 137, 105502. [Google Scholar] [CrossRef]
  18. El-Gendy, N.H.; El-Nikhely, A.H.; Zakaria, A.H.; Hellish, H.M.; Nabawy, B.S.; Barakat, M.K. Pre-Stack Imaging for the Messinian Sub Salt Sequences in the Levantine Basin of the East Mediterranean: A Case Study, Offshore Lebanon. Iraqi Geol. J. 2023, 56, 1–18. [Google Scholar] [CrossRef]
  19. Corbett, P. Petroleum Geoengineering: Integration of static and dynamic models. In Society of Exploration Geophysicists and European Association of Geoscientists and Engineers; European Association of Geoscientists & Engineers: Amsterdam, The Netherlands, 2009. [Google Scholar]
  20. Soleimani, M.; Shokri, B.J. 3D static reservoir modeling by geostatistical techniques used for reservoir characterization and data integration. Environ. Earth Sci. 2015, 74, 1403–1414. [Google Scholar] [CrossRef]
  21. Ghandra, V.; Barnett, A.; Corbett, P.; Geiger, S.; Wright, P.; Steele, R.; Milroy, P. Effective integration of reservoir rock-typing and simulation using near-wellbore upscaling. Mar. Pet. Geol. 2015, 67, 307–326. [Google Scholar] [CrossRef]
  22. Corbett, P.W.M.; Duarte, G.L.B. Understanding subsurface fluvial architecture from a combination of geological well test models and well test data. Geol. Soc. 2019, 488, 237–257. [Google Scholar] [CrossRef]
  23. Aadland, A.I.; Hassan, A.A. Hydrocarbon potential of the Abu El Gharadig basin in the Western Desert, Egypt. In Proceedings of the 8th Arab Petroleum Congress, Algiers, Algeria, 2 June 1972; p. 19. [Google Scholar]
  24. Leila, M.; Moscariello, A. Seismic stratigraphy and sedimentary facies analysis of the pre- and syn-Messinian salinity crisis sequences, onshore Nile Delta, Egypt. Implications for reservoir quality prediction. Mar. Petrol Geol. 2019, 101, 303–321. [Google Scholar] [CrossRef]
  25. Barakat, M.K.; Dominik, W. Seismic studies on the Messinian rocks in the onshore Nile Delta, Egypt. In Proceedings of the 72nd EAGE Conference, and Exhibition, Barcelona, Spain, 14–17 June 2010; pp. 5422–5426. [Google Scholar]
  26. Hamouda, A.Z.; El-Gendy, N.; El-Gharabawy, S.; Salah, M.; Barakat, M.K. Marine geophysical surveys and interpretations on the ancient Eunostos Harbor Area, Mediterranean Coast, Egypt. Egypt. J. Pet. 2023, 32, 47–55. [Google Scholar] [CrossRef]
  27. Leila, M.; El Sharawy, M.; Bakr, A.; Mohamed, A.K. Controls of facies distribution on reservoir quality in the Messinian incised-valley fill Abu Madi Formation in Salma delta gas field, northeastern onshore Nile Delta, Egypt. J. Nat. Gas Sci. Eng. 2022, 97, 104360. [Google Scholar] [CrossRef]
  28. El-Gendy, N.; Radwan, A.; Waziry, M.; Dodd, T.; Barakat, M.K. An integrated sedimentological, diagenesis, rock typing, image logs, artificial neural networks, and well logging analysis for reservoir quality assessment of the heterogeneous fluvial-deltaic Messinian Abu Madi reservoirs of the Salma Field, onshore East Nile Delta, Egypt. Mar. Pet. Geol. 2022, 145, 105910. [Google Scholar]
  29. Abu El-Ata, A.S.; El-Gendy, N.H.; El-Nikhely, A.H.; Raslan, S.; El-Oribi, M.; Barakat, M.K. Seismic characteristics and AVO response for non-uniform Miocene reservoirs in offshore eastern Mediterranean region, Egypt. Sci. Rep. 2023, 13, 8897. [Google Scholar] [CrossRef] [PubMed]
  30. Gunter, G.; Finneran, H.; Hartmann, D.; Miller, J. Early determination of reservoir flow units using an integrated petrophysical method. In Proceedings of the SPE Annual Technical Conference and Exhibition, San Antonio, TA, USA, 5–8 October 1997. [Google Scholar]
  31. Dubois, M.K.; Byrnes, A.P.; Bhattacharya, S.; Bohling, G.C.; Doveton, J.H.; Barba, R.E. Hugoton Asset Management Project (HAMP): Hugoton Geo Model Final Report; KGS Open File Report; 2006; Available online: https://www.kgs.ku.edu/PRS/publication/2007/OFR07_06/index.html (accessed on 28 November 2023).
  32. Jones, R.R.; McCaffrey, K.J.W.; Clegg, P.; Wilson, R.W.; Holliman, N.S.; Holdworth, R.E. Integration of regional to outcrop digital data: 3D visualization of multiscale geological models. Comput. Geosci. 2009, 35, 4–18. [Google Scholar] [CrossRef]
  33. El-Nikhely, A.; El-Gendy, N.H.; Bakr, A.M.; Zawra, M.S.; Ondrak, R.; Barakat, M.K. Decoding of seismic data for complex stratigraphic traps revealing by seismic attributes analogy in Yidma/Alamein concession area Western Desert, Egypt. J. Petrol Explo. Prod. Technol. 2022, 12, 3325–3338. [Google Scholar] [CrossRef]
  34. Radwan, A.E. Three-dimensional gas property geological modeling and simulation. In Sustainable Geoscience for Natural Gas Sub-Surface Systems; Wood, D.A., Cai, J., Eds.; Elsevier: Amsterdam, The Netherlands, 2022; pp. 29–45. [Google Scholar]
  35. Varavur, S.; Shebl, H.; Salman, S.M.; Shibasaki, T.; Dabbouk, C. Reservoir rock type definition in a giant cretaceous carbonate. In Proceedings of the SPE Middle East Oil and Gas Show and Conference, Manama, Bahrain, 12–15 March 2005. [Google Scholar]
  36. Leverett, M.C. Capillary behavior in porous solids. Trans. AIME 1941, 142, 159–172. [Google Scholar] [CrossRef]
  37. Barakat, M.K.; Nooh, A.Z. Reservoir quality using the routine core analysis data of Abu Roash “C” in Badr El Din-15 oil field, Abu Gharadig basin, North Western Desert, Egypt. J. Afr. Earth Sci. 2017, 129, 683–691. [Google Scholar] [CrossRef]
  38. Nabawy, B.S.; Shehata, A.M. Integrated petrophysical and geological characterization for the Sidi Salem-Wakar sandstones, off-shore Nile Delta, Egypt. J. Afr. Earth Sci. 2015, 110, 160–175. [Google Scholar] [CrossRef]
  39. Carman, P.C. Fluid flow through a granular bed. Trans. Inst. Chem. Eng. 1937, 15, 150–156. [Google Scholar] [CrossRef]
  40. Al-Ajmi, F.A.; Holditch, S.A. Permeability estimation using hydraulic flow units in a central Arabia reservoir. In Proceedings of the SPE Annual Technical Conference and Exhibition. SPE 63254, Dallas, TX, USA, 1–4 October 2000. [Google Scholar]
  41. Hamada, G.M.; AL-Awad, M.N.; Alsughayer, A. Variable Saturation Exponent Effect on the Determination of Hydrocarbon Saturation. In Proceedings of the SPE Asia Pacific Oil and Gas Conference and Exhibition, Melbourne, Australia, 8–10 October 2002. [Google Scholar] [CrossRef]
  42. Bateman, R.M. Openhole Log Analysis and Formation Evaluation; Schlumberger Education Services: Houston, TX, USA, 1985. [Google Scholar]
  43. Archie, G. The electric resistivity logs as an aid in determining some reservoir characteristics. Trans. Am. Int. Mech. Eng. 1942, 146, 54–62. [Google Scholar]
  44. Poupon, A.; Leveaux, J. Evaluation of Water Saturation in Shaly Formations. Log Anal. 1971, 12, SPWLA-1971-vXIIn4a1. [Google Scholar]
  45. Bhatt, A.; Helle, H.B.; Ursin, B. Application of committee machines in reservoir Characterization while drilling: A novel neural network approach in log analysis. In Proceedings of the 6th Nordic Symposium on Petrophysics, Trondheim, Norway, 15–16 May 2001. [Google Scholar]
  46. Tiab, D.; Donaldson, E.C. Petrophysics: Theory and Practice of Measuring Reservoir Rock and Fluid Transport Properties; Gulf Publishing: Houston, TX, USA, 1996; 926p. [Google Scholar]
  47. Gandhi, A.; Torres-Verdín, C.; Voss, B.; Gabulle, J.; Seminario, F. Construction of Reliable Static and Dynamic Multi-Layer Petrophysical Models in Camisea Gas Reservoirs, Peru. In Proceedings of the SPWLA 51st Annual Logging Symposium, Perth, Australia, 19–23 June 2010. [Google Scholar]
  48. Heidari, Z.; Torres-Verdín, C.; Mendoza, A.; Wang, G.L. Assessment of residual hydrocarbon saturation with the combined quantitative interpretation of resistivity and nuclear logs. Petrophysics 2011, 52, 217–237. [Google Scholar]
  49. Wardlaw, N.; Taylor, R. Mercury Capillary Pressure Curves and the Interpretation of Pore Structure and Capillary Behaviour in Reservoir Rocks. Bull. Can. Pet. Geol. 1976, 24, 225–262. [Google Scholar]
  50. Skelt, C.; Harrison, B. An Integrated Approach to Saturation Height Analysis. In Proceedings of the SPWLA 36th Annual Logging Symposium, Paris, France, 26–29 June 1995; pp. 1–6. [Google Scholar]
  51. Wiltgen, N.A.; Le Calvez, J.; Owen, K. Methods of Saturation Modeling Using Capillary Pressure Averaging and Pseudos. In Proceedings of the SPWLA 44th Annual Logging Symposium, Galveston, TX, USA, 22–25 June 2003; pp. 22–25. [Google Scholar]
  52. Jennings, R. Unsystematic security price movements, management earnings forecasts, and revisions in consensus analyst earnings forecasts. J. Account. Res. 1987, 25, 90–110. [Google Scholar] [CrossRef]
  53. Siddique, J.I.; Landis, F.A.; Mohyuddin, M.R. Dynamics of Drainage of Power-Law Liquid into a Deformable Porous Material. Open J. Fluid Dyn. 2014, 4, 403. [Google Scholar] [CrossRef]
  54. Harrison, B.; Jing, X.D. Saturation height methods and their impact on volumetric hydrocarbon in place estimates. In Proceedings of the SPE Annual Technical Conference and Exhibition, New Orleans, LA, USA, 30 September–3 October 2001. [Google Scholar] [CrossRef]
  55. Lucia, F.J. Carbonate Reservoir Characterization; Springer: Berlin/Heidelberg, Germany, 1999. [Google Scholar]
  56. Miall, A. A review of the braided river depositional environment. Earth Sci. 1977, 13, 1–62. [Google Scholar] [CrossRef]
  57. Terwindt, J. Litho-facies of inshore estuarine and tidal-inlet deposits. Geol Mijnb. 1971, 50, 515–526. [Google Scholar]
  58. Van den Berg, J.; Boersma, J.; Van Gelder, A. Diagnostic sedimentary structures of the fluvial-tidal transition zone- evidence from deposits of the Rhine and Meuse. Neth. J. Geosci. 2007, 86, 306–387. [Google Scholar] [CrossRef]
  59. Tucker, M. Sedimentary Petrology; Blackwell Scientific: Oxford, UK, 2001; p. 272. [Google Scholar]
  60. Bridge, J. Fluvial facies models, recent Developments. Facies Model. Revisit. 2006, 84, 85–170. [Google Scholar] [CrossRef]
  61. Vandré, C.; Cramer, B.; Gerling, P.; Winsemann, J. Natural gas formation in the western Nile delta (Eastern Mediterranean): Thermogenic versus microbial. Org. Geochem. 2007, 38, 523–539. [Google Scholar] [CrossRef]
  62. Nabawy, B.S.; Lashin, A.; Barakat, M.K. Implementation of lithofacies and microfacies types on reservoir quality and heterogeneity of the Late Cretaceous Upper Bahariya Member in the Shurouk Field, Shoushan Basin, North-Western Desert, Egypt. J. Asian Earth Sci. 2022, 224, 105014. [Google Scholar] [CrossRef]
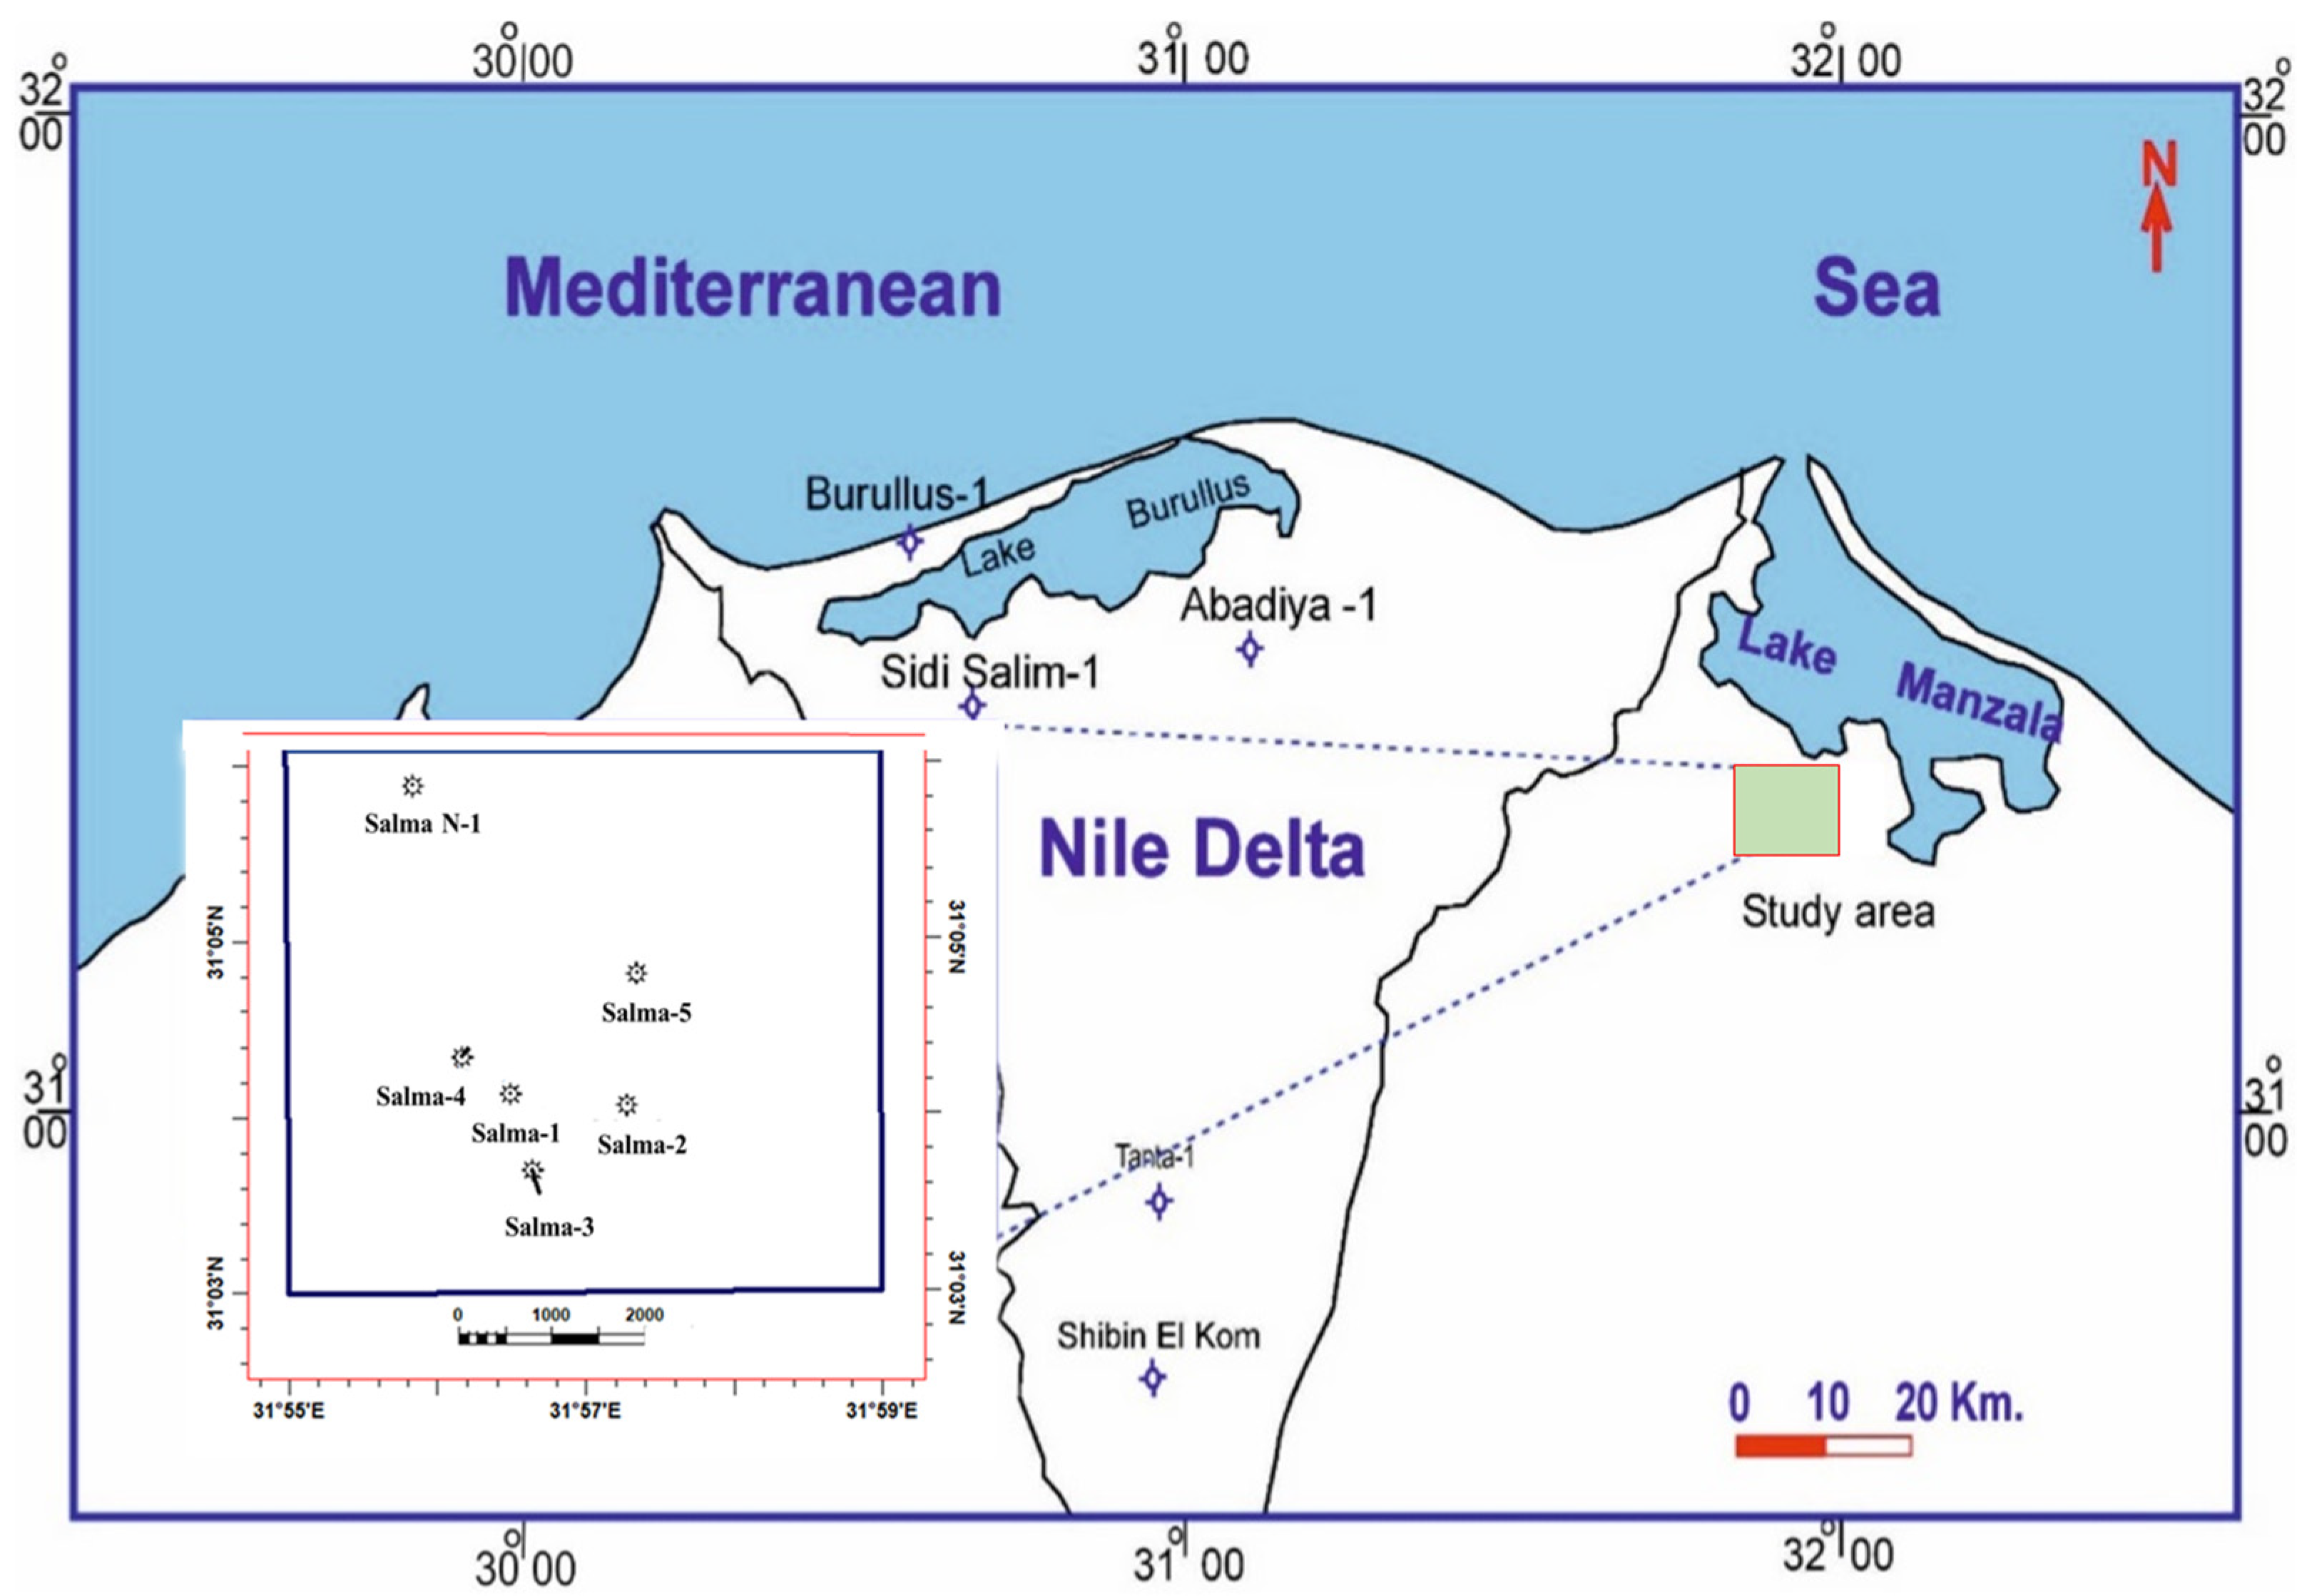
Figure 1. Location map of Salma field.
Water 15 04204 g001
Figure 2. The stratigraphic chart of Egypt includes subsurface sediments and tectonic sequences [16].
Water 15 04204 g002
Figure 3. Core photos show Abu Madi Formation’s sedimentary facies (A) Salma-4 and (B) Salma-2 wells.
Water 15 04204 g003
Figure 4. Thin section microphotographs illustrating different sandstones microfacies of Abu Madi Formation: (A) Feldspathic arenites and wacke stones, (B) Fine- to very fine-grained sandstones, (C) poorly cemented, conglomeratic kaolinitic pebbly sandstones, (D) subfeldspathic arenites and wacke stone. Mineral symbols: Anhydrite, An; Quartz, Qz; K-feldspars, K; Glauconite, G; Bioclasts, B; Plagioclase feldspars, Ps; Lithic fragments, L; Detrital clays, Dc; Porosity (Orange Arrows); Heavy Minerals (Green Arrows); Residual Hydrocarbons (Red Arrows).
Water 15 04204 g004
Figure 5. Fluid contact (gas/water contact) and free water level for Salma field.
Water 15 04204 g005
Figure 6. Mercury capillary pressure and saturation test (A) Salma-2 well, (B) Salma-4 well.
Water 15 04204 g006
Figure 7. Water saturation (SW) and height above free water level (H) X-Y plot, (A) Salma-2 and (B) Salma-4.
Water 15 04204 g007
Figure 8. J-function and saturation plot, (A) Salma-2 well and (B) Salma-4 well.
Water 15 04204 g008
Figure 9. Core FZI distribution and cumulative curves for Abu Madi in Salma-2 and Salma-4 wells. (cumulative curve is bold blue line, slop line is dot blue line).
Water 15 04204 g009
Figure 10. Porosity vs. horizontal permeability X-Y plot for (HFU) of Abu Madi Formation.
Water 15 04204 g010
Figure 11. Neutron-density X-Y plot, (A) Salma-2 well, (B) Salma-4 well. (Red tringle lines represent the area of clay line to clean sand line).
Water 15 04204 g011
Figure 12. Composite logs showing porosity, water saturation, lithology, and depositional environment for Abu Madi Formation: (A) Salma-2 well, (B) Salma-4 well. (track-1: Depth, track-2: GR, track-3: resistivity, track 4: density-neutron curves, track-7: SW, track-8: Φ in a fraction).
Water 15 04204 g012
Figure 13. Composite log from neural log showing porosity, permeability, FZI, HFU, and depositional environment for Abu Madi Formation in Salma-2 well. (track-1: Depth, track-2: GR, track-3: density-neutron curves, track-5: HFU, track-6: FZI, track-7: KH, track-8: Φ in a fraction, dot for core data).
Water 15 04204 g013
Figure 14. Composite log from neural log showing porosity, permeability, FZI, HFU, and depositional environment for Abu Madi Formation in Salma-4 well. (track-1: Depth, track-2: GR, track-3: density-neutron curves, track-5: HFU, track-6: FZI, track-7: KH, track-8: Φ in a fraction, dot for core data).
Water 15 04204 g014
Figure 16. SW–J-function curves for Abu Madi Formation: (A) HFU#1, (B) HFU#2, (C) HFU#3. (Dot blue line= core data, solid red line= predicted best fit line).
Water 15 04204 g016
Figure 17. SW–H, and SW–J-function for Salma Field wells. (track-1: Depth, track-2: density-neutron curves, track-3: HFU, track-4: J-Function, track-5: SW of J-Function, for each well).
Water 15 04204 g017
Table 1. MICP interfacial tension values, contact angles, and descriptions used for laboratory and reservoir conditions.
ParameterContact Angles (°)Parameter Description
σ Res50interfacial tension in the reservoir (gas–water)
θ Res0contact angle in the reservoir (gas–water)
σ Lab70interfacial tension in lab (air–water)
θ Lab0contact angle in lab (air–water)
σ Lab485interfacial tension in the lab (mercury–air)
θ Lab140contact angle in the lab (mercury–air)
Table 2. HFU data for the Abu Madi Formation.
Hydraulic Flow UnitFZI (µm)Porosity (%)Permeability (mD)Reservoir Quality
HFU# 14.5 to 1025–33>900Excellent
HFU# 21.7 to 4.517–3370–1000Good–Very Good
HFU# 30.6 to 1.712–334–100Moderate–Good
HFU# 40.2 to 0.615–300.6–8Low
Table 3. Petrophysical and neural analysis of Abu Madi Formation.
WellZoneTop
(m)
Bottom (m)Gross (m)Net (m)Shale (%)PHIE (%)SW (%)FZI (µm)KH (mD)
Salma-2Estuarine20142025112.324.518.935.93.9357
Fluvial202520886323.318.921.543.04.5636
Salma-4Tidally influenced Fluvial20882100129.821.423.938.93.7677
Estuarine210021816710.825.218.889.92.2171
Bayhead Delta212421381410.224.418.499.41.984
Fluvial2181229111064.921.019.799.83.5684
Disclaimer/Publisher’s Note: The statements, opinions and data contained in all publications are solely those of the individual author(s) and contributor(s) and not of MDPI and/or the editor(s). MDPI and/or the editor(s) disclaim responsibility for any injury to people or property resulting from any ideas, methods, instructions or products referred to in the content.