Article

Dynamic Characteristics of Meteorological Drought and Its Impact on Vegetation in an Arid and Semi-Arid Region

1
Yinshanbeilu Grassland Eco-Hydrology National Observation and Research Station, China Institute of Water Resources and Hydropower Research, Beijing 100038, China
2
Institute of Water Resources of Pastoral Area Ministry of Water Resources, Hohhot 010020, China
3
School of Water Conservancy, North China University of Water Resources and Electric Power, Zhengzhou 450046, China
4
State Key Laboratory of Eco-Hydraulics in Northwest Arid Region of China, Xi’an University of Technology, Xi’an 710048, China
*
Authors to whom correspondence should be addressed.
Water 2023, 15(22), 3882; https://doi.org/10.3390/w15223882
Submission received: 26 September 2023 / Revised: 31 October 2023 / Accepted: 4 November 2023 / Published: 7 November 2023

Abstract

:
Under the background of global climate warming, meteorological drought disasters have become increasingly frequent. Different vegetation types exhibit varying responses to drought, thus, exploring the heterogeneity of the impact of meteorological drought on vegetation is particularly important. In this study, we focused on Inner Mongolia (IM) as the research area and employed Standardized Precipitation Evapotranspiration Index (SPEI) and Vegetation Health Index (VHI) as meteorological drought and vegetation indices, respectively. The Breaks for Additive Seasons and Trend algorithm (BFAST) was utilized to reveal the dynamic characteristics of both meteorological drought and vegetation changes. Additionally, the Pixel-Based Trend Identification Method (PTIM) was employed to identify the trends of meteorological drought and vegetation during spring, summer, autumn, and the growing season. Subsequently, we analyzed the correlation between meteorological drought and vegetation growth. Finally, the response of vegetation growth to various climate factors was explored using the standardized multivariate linear regression method. The results indicated that: (1) During the study period, both SPEI and VHI exhibited a type of interrupted decrease. The meteorological drought was aggravated and the vegetation growth was decreased. (2) Deserts and grasslands exhibited higher sensitivity to meteorological drought compared to forests. The strongest correlation between SPEI-3 and VHI was observed in desert and grassland regions. In forest areas, the strongest correlation was found between SPEI-6 and VHI. (3) The r between severity of meteorological drought and status of vegetation growth was 0.898 (p < 0.01). Vegetation exhibits a more pronounced response to short-term meteorological drought events. (4) Evapotranspiration is the primary climatic driving factor in the IM. The findings of this study provide valuable insights for the rational utilization of water resources, the formulation of effective irrigation and replenishment policies, and the mitigation of the adverse impacts of meteorological drought disasters on vegetation growth in the IM.

1. Introduction

With the intensification of global warming, the intensity and frequency of droughts are increasing. The series of chain disasters triggered by droughts have severe impacts on terrestrial ecosystems [1,2,3]. VegetationInner Mongolia, as a key component in the cycling of carbon, water, and energy in terrestrial ecosystems, plays a crucial role in maintaining ecosystem functions and protecting biodiversity [4,5]. Its changes are considered as fingerprints of environmental change. Meteorological drought acts as a limiting factor for plant transpiration and photosynthesis, and drought determines the distribution and structure of vegetation to a certain extent [6,7,8]. The comprehensive response of vegetation to meteorological drought and its impact is a critical issue in current drought research. Due to the complexity of the mechanisms behind drought-induced disasters and their extensive interactions with the external environment, our understanding of the response mechanisms of different vegetation types to drought is limited. The response of terrestrial vegetation to drought is of great scientific significance for global drought and ecological research [9]. It should be noted that under the background of climate warming, the regional drought conditions and vegetation growth exhibit a complex changing pattern [10]. Clearly, there is a definite link between meteorological drought and vegetation growth. Therefore, gaining in-depth understanding of the dynamic characteristics of meteorological drought and vegetation is of significant importance in improving the understanding of the coordinated relationship between regional vegetation and drought conditions, as well as in developing effective strategies for ecological conservation [11,12].
It is well known that meteorological drought has a significant impact on vegetation growth [13,14]. Numerous scholars have focused on this issue and have gained valuable scientific insights [15,16,17]. Under extreme drought conditions at a global scale, vegetation with poor drought resistance experiences inhibited survival and reproduction [6]. Additionally, different stages of plant growth exhibit varying responses to drought [12]. Li et al. determined, based on meteorological drought indices and different carbon flux datasets, that seasonal droughts in 2009–2010 led to a substantial decrease in the total gross primary productivity (GPP) in southwestern China, with forests and shrubs exhibiting stronger drought resistance compared to cultivated land and grassland [18]. Some meteorological drought indices, such as the Standardized Precipitation Index (SPI) and the Crop Moisture Index (CMI), have been widely used for drought assessment across various time periods [19]. However, these indices have certain limitations as they are more suitable for dry weather conditions and become ineffective when weather data are unavailable [20]. Mupepi and Matsa compared three methods, i.e., VCI, SPI, and visual observations, for monitoring moderate and extreme droughts and found that vegetation indices were the most effective for drought monitoring [21]. Weng et al. pointed out that compared to other drought indices, remote sensing vegetation indices have advantages such as continuous and real-time data acquisition and wide coverage, making them important tools for effectively monitoring vegetation dynamics [11]. Bento et al. used the Vegetation Health Index (VHI) to characterize severe drought events in global arid regions, and the results demonstrated that VHI is effective in monitoring drought in terrestrial systems [22]. Based on the findings of the aforementioned studies, it has been determined that forests can obtain a more abundant supply of groundwater through their root system advantage, while agricultural land can alleviate the negative impacts of drought through irrigation. However, for natural vegetation in arid and semi-arid regions, precipitation serves as its sole source of replenishment. Therefore, the occurrence of meteorological drought has profound effects on vegetation [23].
Vegetation plays an important role in global terrestrial ecosystems and is the most sensitive component in response to climate change, serving as an indicator of climate change [4,24]. Moreover, studies have indicated that vegetation is not only influenced by concurrent drought conditions but is also affected by accumulated and lagged impacts of early-stage drought [25,26]. Ecological vegetation exhibits a certain resistance to meteorological drought induced by previous precipitation deficits, manifested as a lagged response of vegetation to drought. Furthermore, during the growing season, vegetation has high water demand and may rely heavily on changes in water availability [27]. However, the vegetation–precipitation correlation decreases during non-growing seasons. Current research predominantly focuses on the response of individual vegetation types to drought, and the cumulative and lag effects of drought on different vegetation types remain unclear. Given the significant differences in the responses of vegetation to precipitation changes during different phenological periods, it is necessary to determine the vegetation’s lagged response time during each season within a year [28,29]. Satellite remote sensing data, with its advantages of temporal and spatial continuity, have become an important data source in vegetation–climate research [30,31]. Due to its ease of data acquisition and broad coverage, remote sensing technology fills the gaps in site observation data and has been widely applied in monitoring vegetation dynamics.
Inner Mongolia (IM) is located in the transitional zone from the humid region to the arid and semi-arid region in northern China. The vegetation types in the IM transition from forests in the northeast to grasslands and deserts in the west, making it a globally sensitive area to climate change [32]. The ecological environment in the IM is extremely fragile, and changes in regional vegetation also have a significant impact on climate change. Therefore, it is an ideal area to study the response of vegetation changes to drought. Additionally, the IM has the largest desert grassland area in China, where the growth of grassland vegetation is significantly inhibited by arid climate conditions [33]. Since the 21st century, with the increase in temperature, the trend of precipitation increase has slowed down, which may lead to a continuous increase in the level of drought in the IM. Based on soil moisture data, Cai et al. explored the characteristics of agricultural drought variations in the IM from 1981 to 2019 and found that long-term gridded soil moisture has the potential to accurately monitor agricultural drought [34]. Kang et al. investigated compound heatwave events and their relationship with atmospheric circulation factors in the IM, and the results showed an upward trend in heatwaves over the past 40 years [35]. Wang et al. proposed a variable time scale grassland drought monitoring index and analyzed the evolution characteristics of grassland drought in the IM. They found that drought had a 17-year cycle and showed a slight attenuation trend after 2017 [23]. Although the above studies have explored drought in the IM from different perspectives, they rarely discuss the important role of drought in vegetation growth. Currently, there is limited research on the impact of drought on different vegetation types in pastoral areas and its spatial heterogeneity. In addition, as a strong signal of climate change, climate factors are important driving factors for drought occurrence and vegetation changes. However, the research on the cumulative effects of different climate factors on vegetation is relatively lacking.
In view of this, this study focuses on the area of the IM, using the Standardized Precipitation Evapotranspiration Index (SPEI) and VHI as meteorological indicator and status of vegetation growth (SVG), respectively, to study the meteorological drought and SVG in different vegetation zones. Based on the analysis of meteorological drought and vegetation dynamics, the driving role of meteorological drought in SVG changes is clarified, and the impacts of various climate factors on vegetation dynamics are revealed. The results can provide scientific guidance for drought resistance planning, vegetation restoration and protection, and reduction of ecological and economic losses in the area of the IM.

2. Materials and Methods
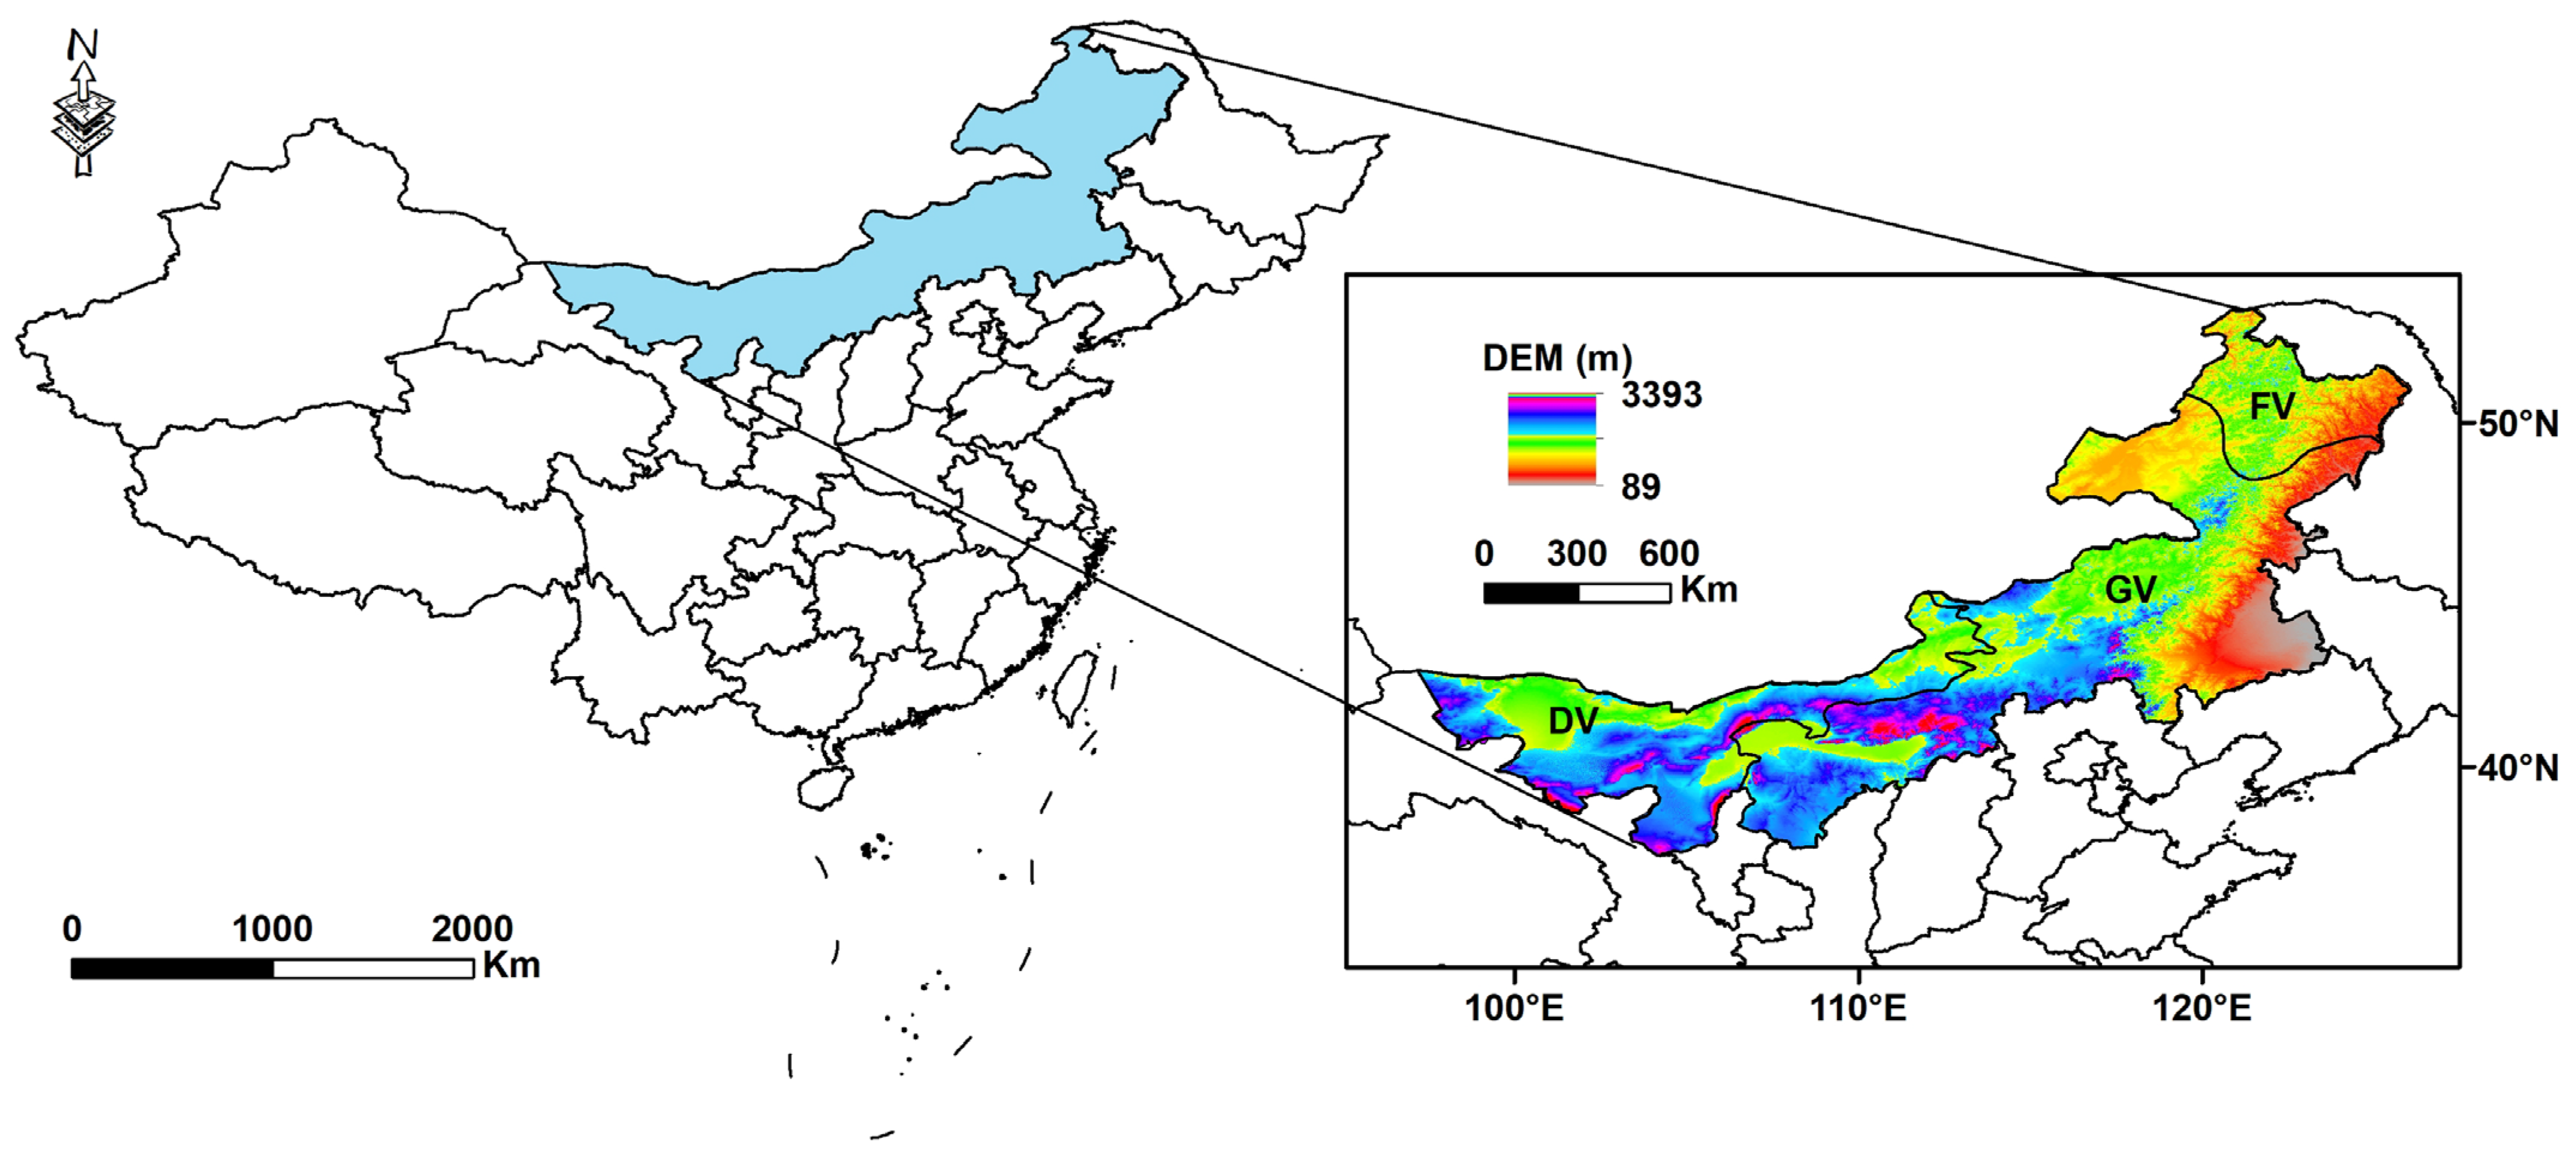
2.1. Study Region

The IM is located in the north of China, spanning across Northeast, North China, and Northwest. The topography of the IM is characterized by a west-high and east-low terrain, with higher elevations in the south and lower elevations in the north. The region falls within the temperate continental zone, featuring unfavorable water and heat conditions along with scarce precipitation. The IM lies in the transition zone of monsoonal circulation, with precipitation decreasing from southeast to northwest. The temperature gradually increases from the Greater Khingan Mountains towards the southeast and southwest directions. The main precipitation occurs in July and August, with an annual average precipitation ranging from 50 to 450 mm, and an average annual temperature ranging from −4 °C to 9.2 °C [21]. Furthermore, the IM is home to the largest desert and grassland area in China, characterized by high ecological vulnerability. Drought has greatly constrained local socio-economic development. Based on different vegetation types, this study divides the IM into three parts: Desert Vegetation zone (DV), Grassland Vegetation zone (GV), and Forest Vegetation zone (FV), as shown in Figure 1.

2.2. Datasets

Famine Early Warning Systems Network Land Data Assimilation System (FLDAS) is one of the important datasets in Earth system modeling, which plays a significant role in climate change and drought research. As a global high-resolution dataset based on land surface information system outputs, FLDAS is crucial in evaluating the occurrence and development of extreme weather events such as climate-related droughts and floods [36]. In this study, the monthly FLDAS dataset (1982–2020) is used to calculate the meteorological drought index SPEI, with a spatial resolution of 0.1° × 0.1°. Additionally, the STAR dataset contains various hydro-meteorological information related to the atmosphere, cryosphere, and land surface on Earth, and it has been widely employed in fields such as ecology, vegetation, and soil [37]. Furthermore, we have selected the monthly VHI data (4 km × 4 km) from 1982 to 2020 to characterize SVG. Prior to analysis, we performed preprocessing of the raw data using ArcGIS software 10.2, generating monthly, seasonal, and annual scale VHI datasets for the study area. Importantly, we employed several resampling methods to ensure that VHI and FLDAS have the same resolution. The vegetation type data is sourced from the China Vegetation Classification Dataset, which provides a complete and continuous spatial representation. By considering different vegetation types, we can demonstrate the regional variation of vegetation characteristics and help identify the regularity of vegetation distribution in relation to the environment.

2.3. Methods

2.3.1. Meteorological Drought Index

Meteorological drought is the source of hydrological, agricultural, and socioeconomic drought. The SPEI offers simplicity in calculation and advantages for spatial comparisons, making it a reliable measure for evaluating meteorological drought characteristics. Furthermore, SPEI comprehensively considers the impacts of both precipitation and evaporation, enabling the reflection of cumulative effects arising from imbalances between precipitation and atmospheric water demand (potential evapotranspiration) [38]. In this study, we employed various scales of SPEI, namely SPEI-1, SPEI-3, SPEI-6, and SPEI-12, to represent distinct temporal extents of meteorological drought. To evaluate seasonal meteorological drought, we specifically used SPEI-3 values for May, August, and November, denoting spring, summer, and autumn drought conditions, respectively. Given that the vegetation growing season in the IM primarily occurs from April to September, we utilized SPEI-6 value for September to characterize meteorological drought during the growing season [39].

2.3.2. Vegetation Index

Based on the spectral characteristics of vegetation, various vegetation indices have been constructed by combining satellite visible and near-infrared wavelengths. The VHI is commonly employed for qualitative and quantitative assessments of vegetation coverage and growth vigor, providing an effective indication of SVG [40]. It encapsulates both the greenness and temperature properties of vegetation canopies, making it suitable for identifying vegetation and measuring its health and vitality. Additionally, VHI is highly sensitive to SVG and productivity, often used to describe vegetation physiological conditions and estimate parameters such as total green biomass and vegetation productivity. Therefore, we selected VHI to characterize SVG in the IM.

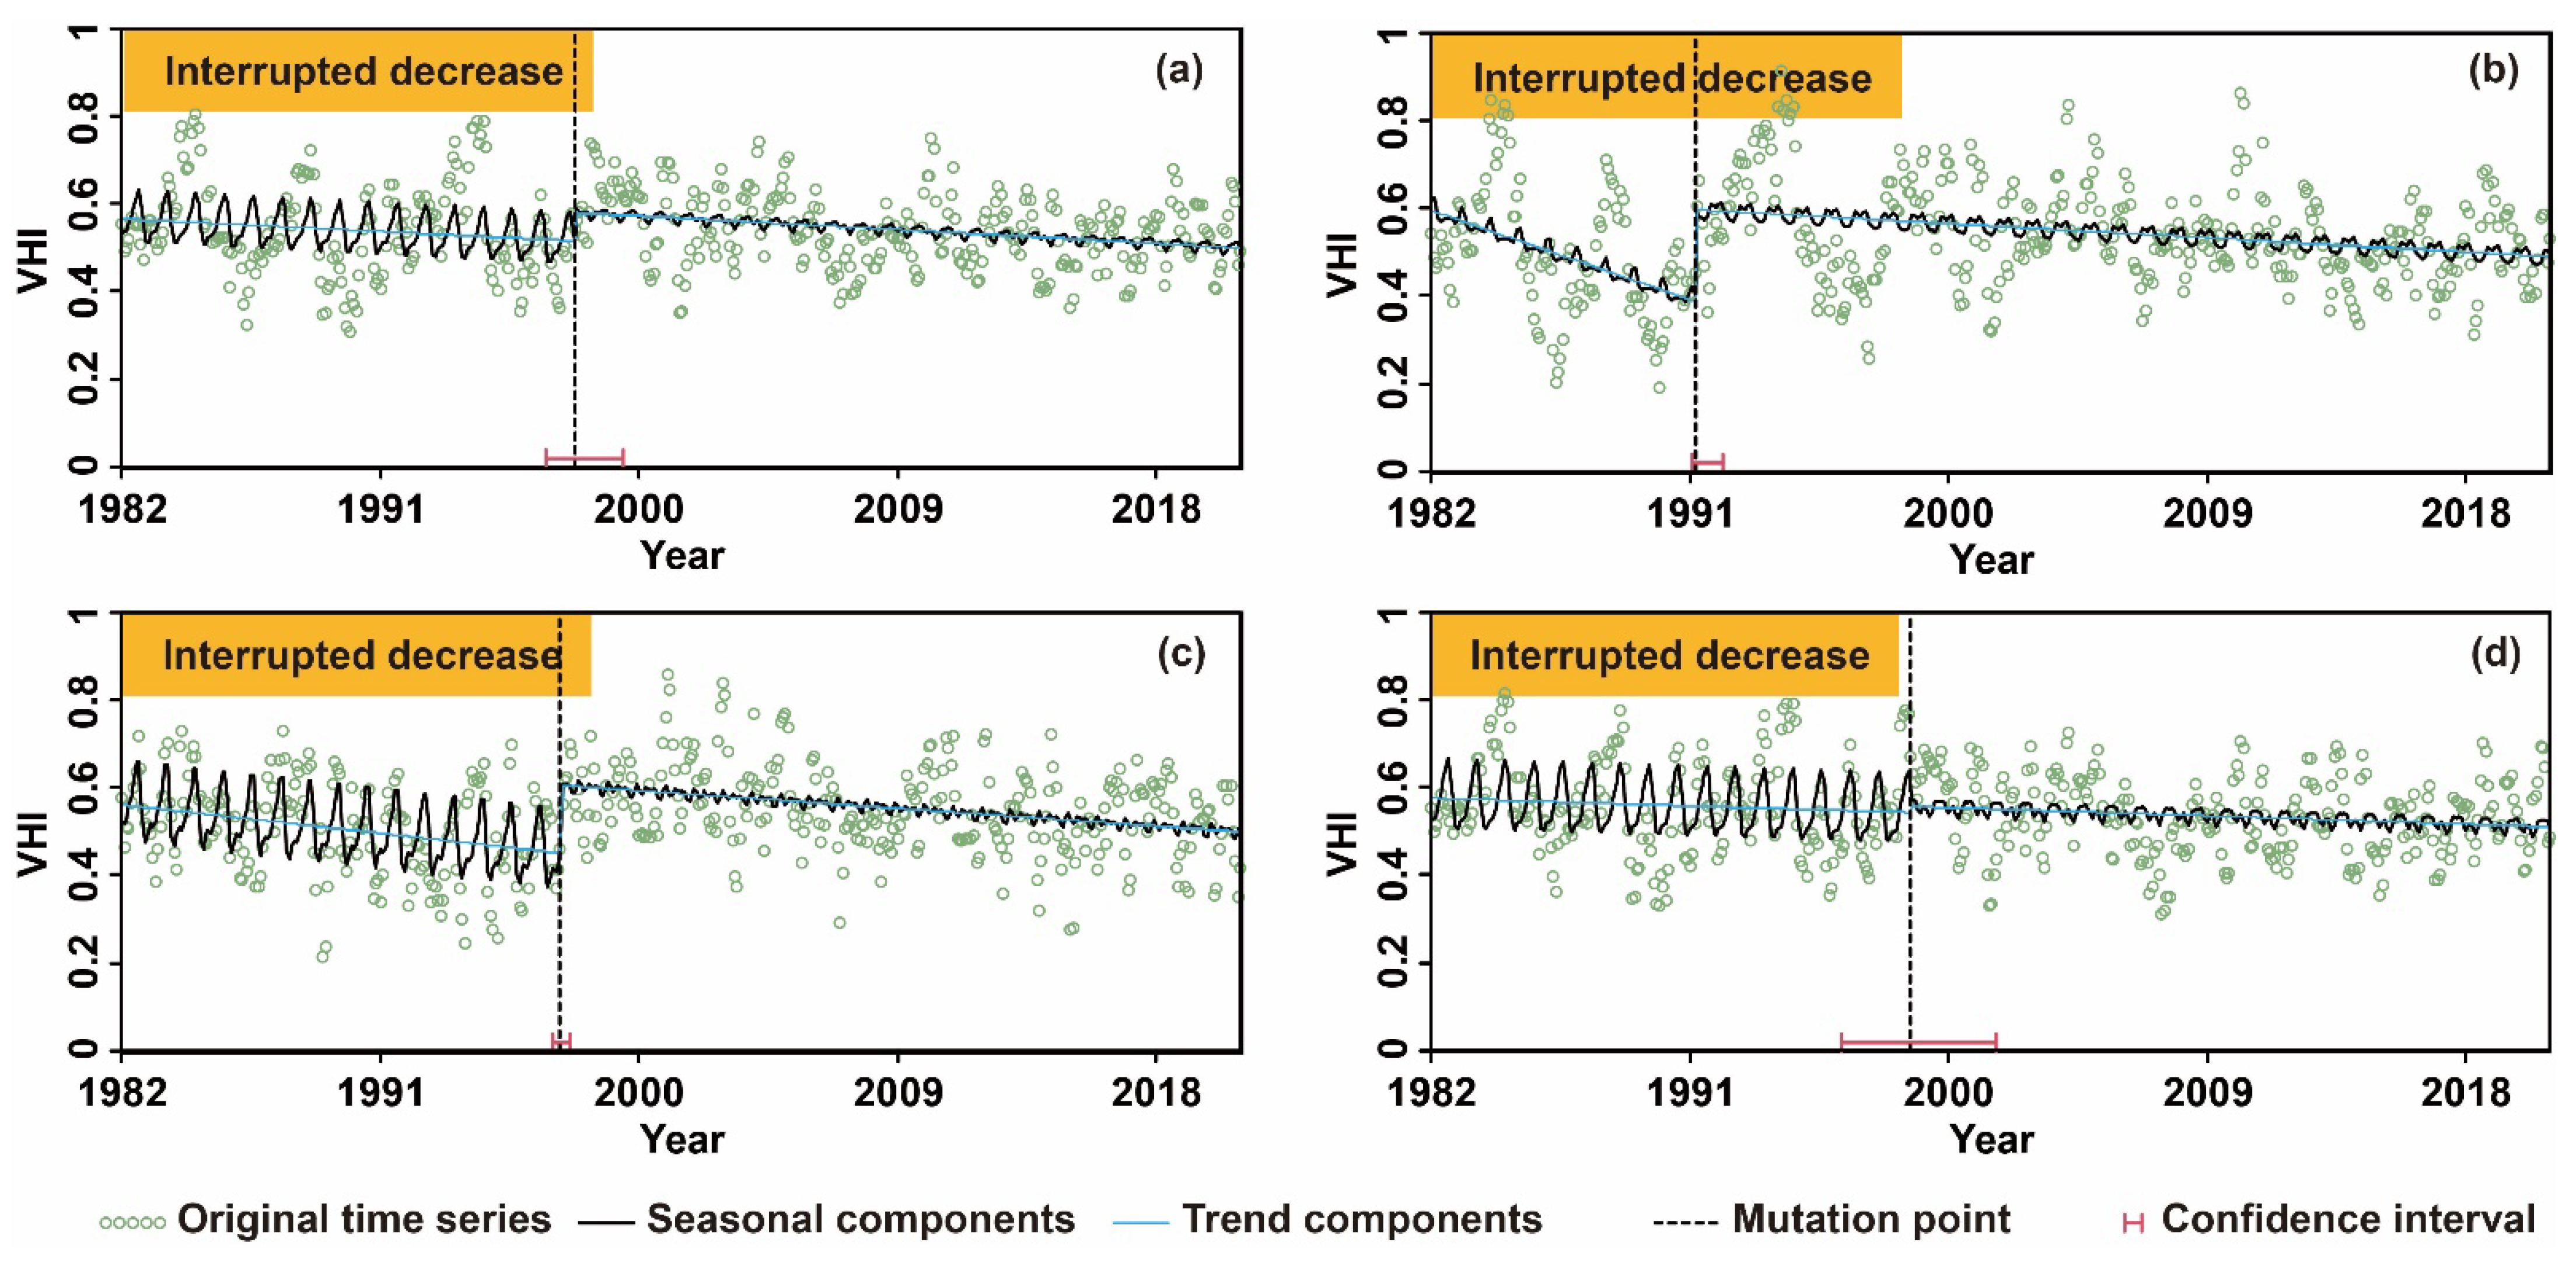
2.3.3. Breaks for Additive Seasons and Trend Algorithm

Remote sensing data records surface dynamics in a time series manner. By studying these changes, disturbances on the Earth’s surface can be detected in both temporal and spatial dimensions, allowing the investigation of the natural environment and the evolution of ecosystems. The Breaks for Additive Seasons and Trend algorithm (BFAST) can relatively reduce detection errors and enhance the ability to detect continuous surface changes by utilizing high-frequency temporal data, enabling more accurate and near-real-time detection of surface disturbances [37,41]. Therefore, BFAST has advantages in remote sensing time series change analysis. In this study, we applied the BFAST algorithm to detect trends in SPEI and VHI. It identifies the most influential change point in the sequence, dividing the entire trend into two segments instead of multiple smaller segments. Through BFAST analysis, the time series can be decomposed into seasonal components, trend components, and residuals. The specific calculation formulas are as follows:
Y t = T t + S t + e t t = 1 , , n
T t = a i + b i t 3 τ i 1 t < τ i i = 1 , , m
S t = j = 1 k γ j sin 2 π j t f + δ j     j = 1 , , k
where Yt is the observed value at time t. Tt, St, and et are the trend component, seasonal component, and residual component, respectively. And ai and bi are the coefficient of trend term. γ j and f are the amplitude and frequency, respectively.

2.3.4. Pixel-Based Trend Identification Method (PTIM)

As a non-parametric statistical test, the improved Pixel-based Trend Identification Method (PTIM) eliminates autocorrelation in time series data, thereby possessing unique advantages in trend analysis of climate-related variables [42]. The PTIM was employed to reveal trends in meteorological drought and vegetation changes at the grid scale. The specific procedure of this method is as follows:
First, calculate the mean of the time series XT and divide each data point in the sequence by this mean, resulting in a new set of time series Xt with a mean of 1. The rank-based trend estimator β of Xt is computed using the following equation:
β = median [ x i x j / i j ]     1 i < j n
where β > 0 represents an increasing trend in Xt and β < 0 represents a decreasing trend in Xt.
Assuming that the trend term of Xt is linear Tt, removing the trend term within Xt yields a stationary sequence Yt:
Y t = X t T t = X t β × t
Find the rank sequence corresponding to Yt and calculate its autocorrelation coefficient ri:
r i = k = 1 n i R k R ¯ R k + i R ¯ k = 1 n R k R ¯ 2
Calculate the variance var*(S) of the trend statistic S of the autocorrelation sequence based on ri:
η = 1 + 2 n n 1 n 2 × i = 1 n 1 n i n i 1 n i 2 r i
var * S = η × n n 1 2 n + 5 18
The statistics S > 0, S < 0, and S = 0 are:
Z * = S 1 v a r * S   S > 0   0         S = 0 S + 1 v a r * S   S < 0

2.3.5. Run Theory

Drought, unlike floods, is often difficult to precisely define in terms of its onset and end time or even characterize its features. Typically, the duration, severity, intensity, and spatial extent are considered as characteristic variables of a drought event. Run theory provides an effective approach for defining drought events by examining their temporal patterns [43]. Based on run theory, information such as the duration and intensity of drought can be extracted from the time series of drought indices, thereby revealing several fundamental attributes of drought. In this study, we employed run theory to identify meteorological drought events in the IM from 1982 to 2020. Additionally, the severity of meteorological drought (SMD) and peak severity of meteorological drought (PSMD) were adopted to represent the magnitude of meteorological drought, where larger values of SMD and PSMD indicate more serious drought events.
Furthermore, we defined the SVG to represent the status of vegetation growth during each meteorological drought event. Higher SVG values indicate poorer vegetation growth status. The specific methodology is as follows:
S M D = i = 1 n S P E I i   i = 1 , , n
P S M D = m a x S P E I i   i = 1 , , n
S V G = i = 1 n ( 1 V H I )   i = 1 , , n
where SMD is the severity of each meteorological drought event, PSMD is the peak severity of meteorological drought, SVG is the status of vegetation growth in the period of meteorological drought events, and n is the duration of meteorological events.

2.3.6. Standardized Multiple Linear Regression

In practical situations, phenomena are often related to multiple factors. By considering the optimal combination of multiple independent variables, better prediction or estimation of the dependent variable can be achieved. Therefore, multiple linear regression is widely used. Moreover, since the units of the various factors are not necessarily the same, standardization in multiple linear regression eliminates the dimensional differences and allows for comparability among different variables [44]. In this study, at the raster scale, we employed the standardized multiple linear regression approach to investigate the driving effects of different climate factors on vegetation and reveal the climate factors with the highest contribution rates. The specific methodology is as follows:
All climate factors and VHI were standardized as follows:
Z i j = x i j x i / s i
where Z i j is the standardized variable values. x i j , x i and s i are the original value, expected value, and standard deviation of variable values, respectively.
A standardized multiple linear regression equation was constructed using the standardized independent variables and dependent variable.
Z V H I = β j z j + B + ε
where Z V H I is the standardized VHI, zj is the standardized climate factors and βj, B and ε are the regression coefficient, constant term, and residual term, respectively.
Finally, the contribution rates of each climate factor to VHI were calculated:
C j = | β j | / | β j | × 100 %
where C j is the contribution rates of climate factors, %.

3. Results

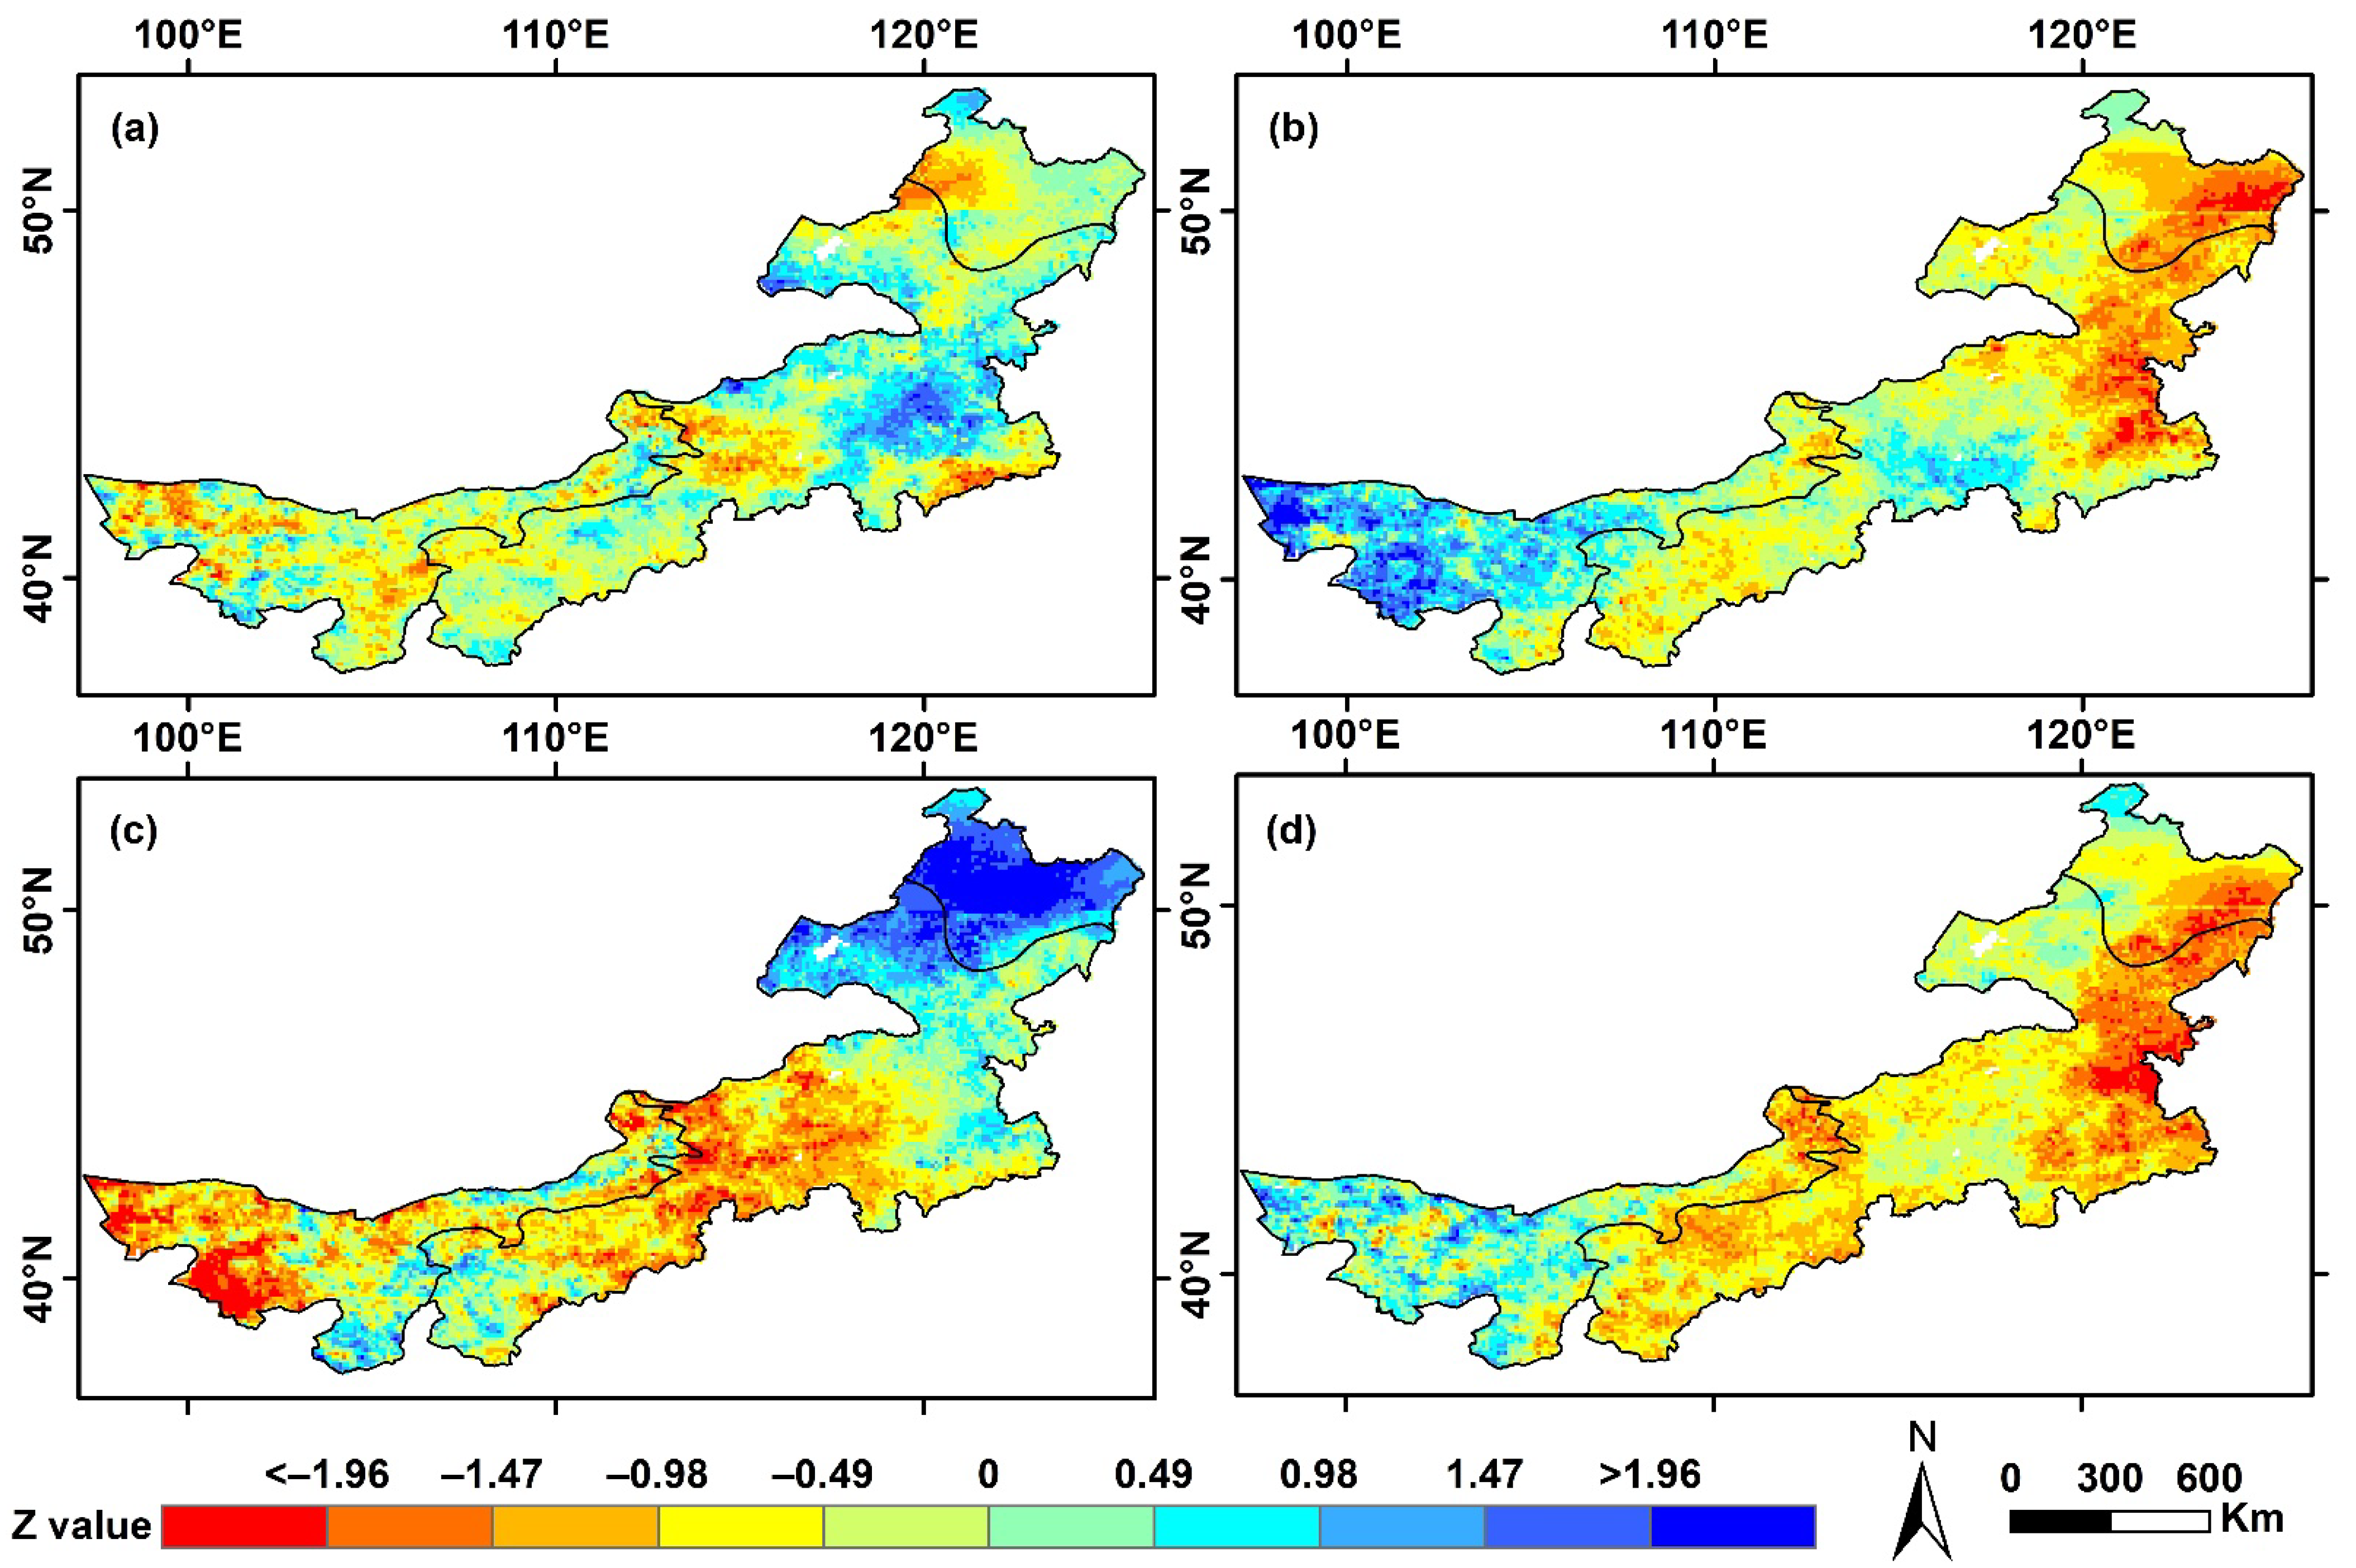
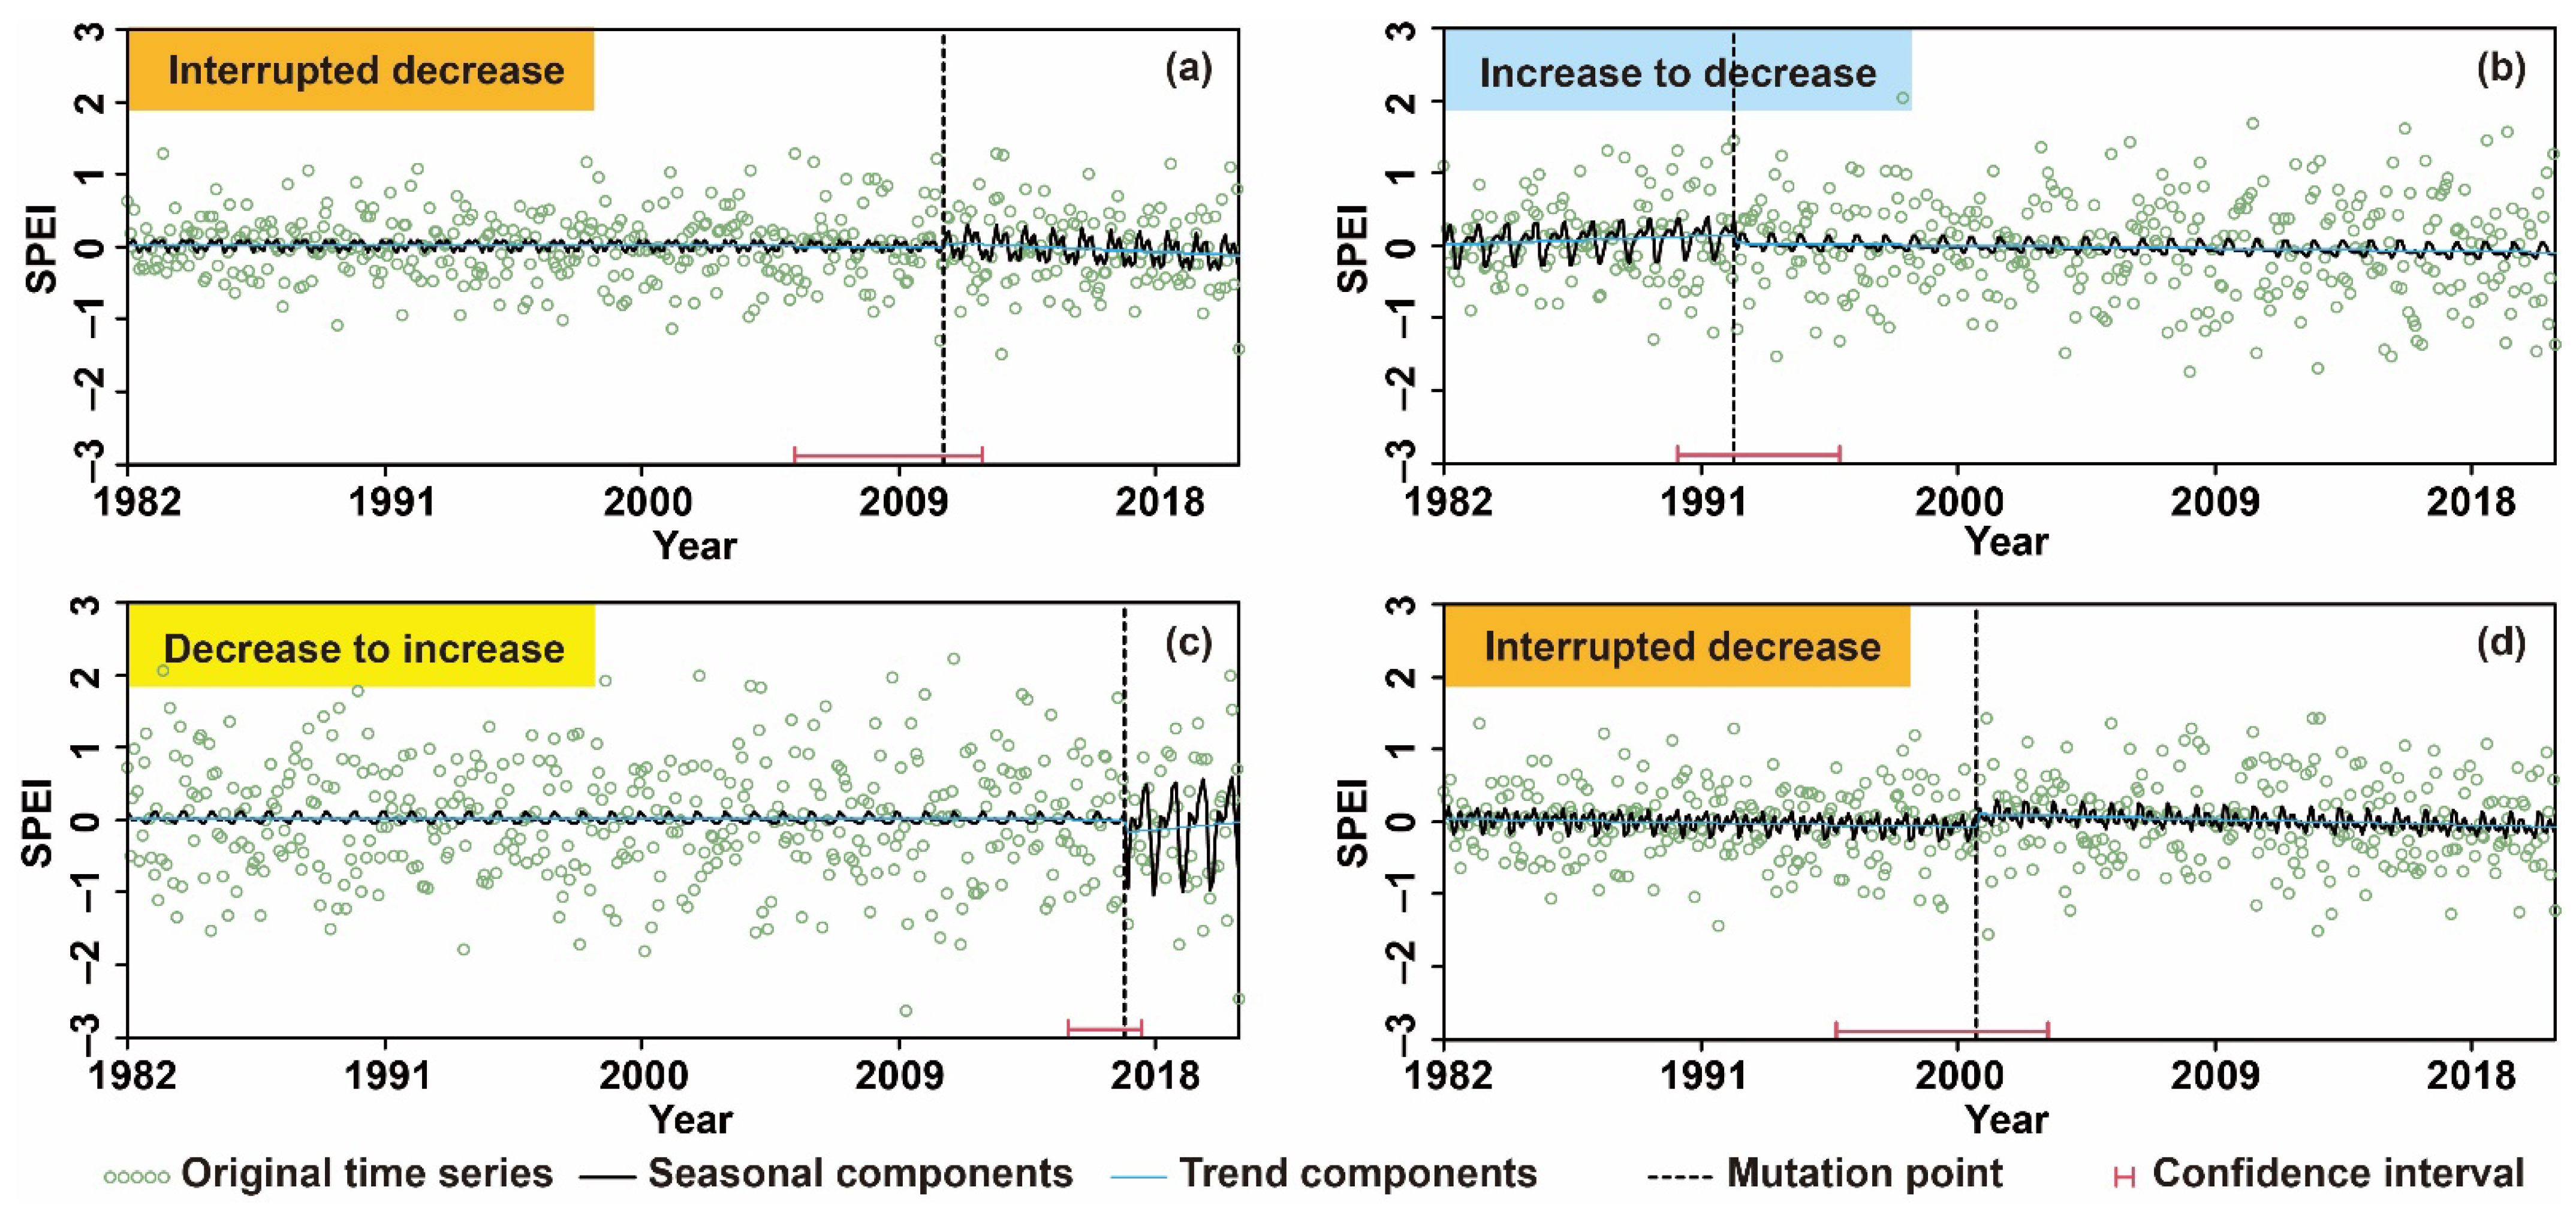
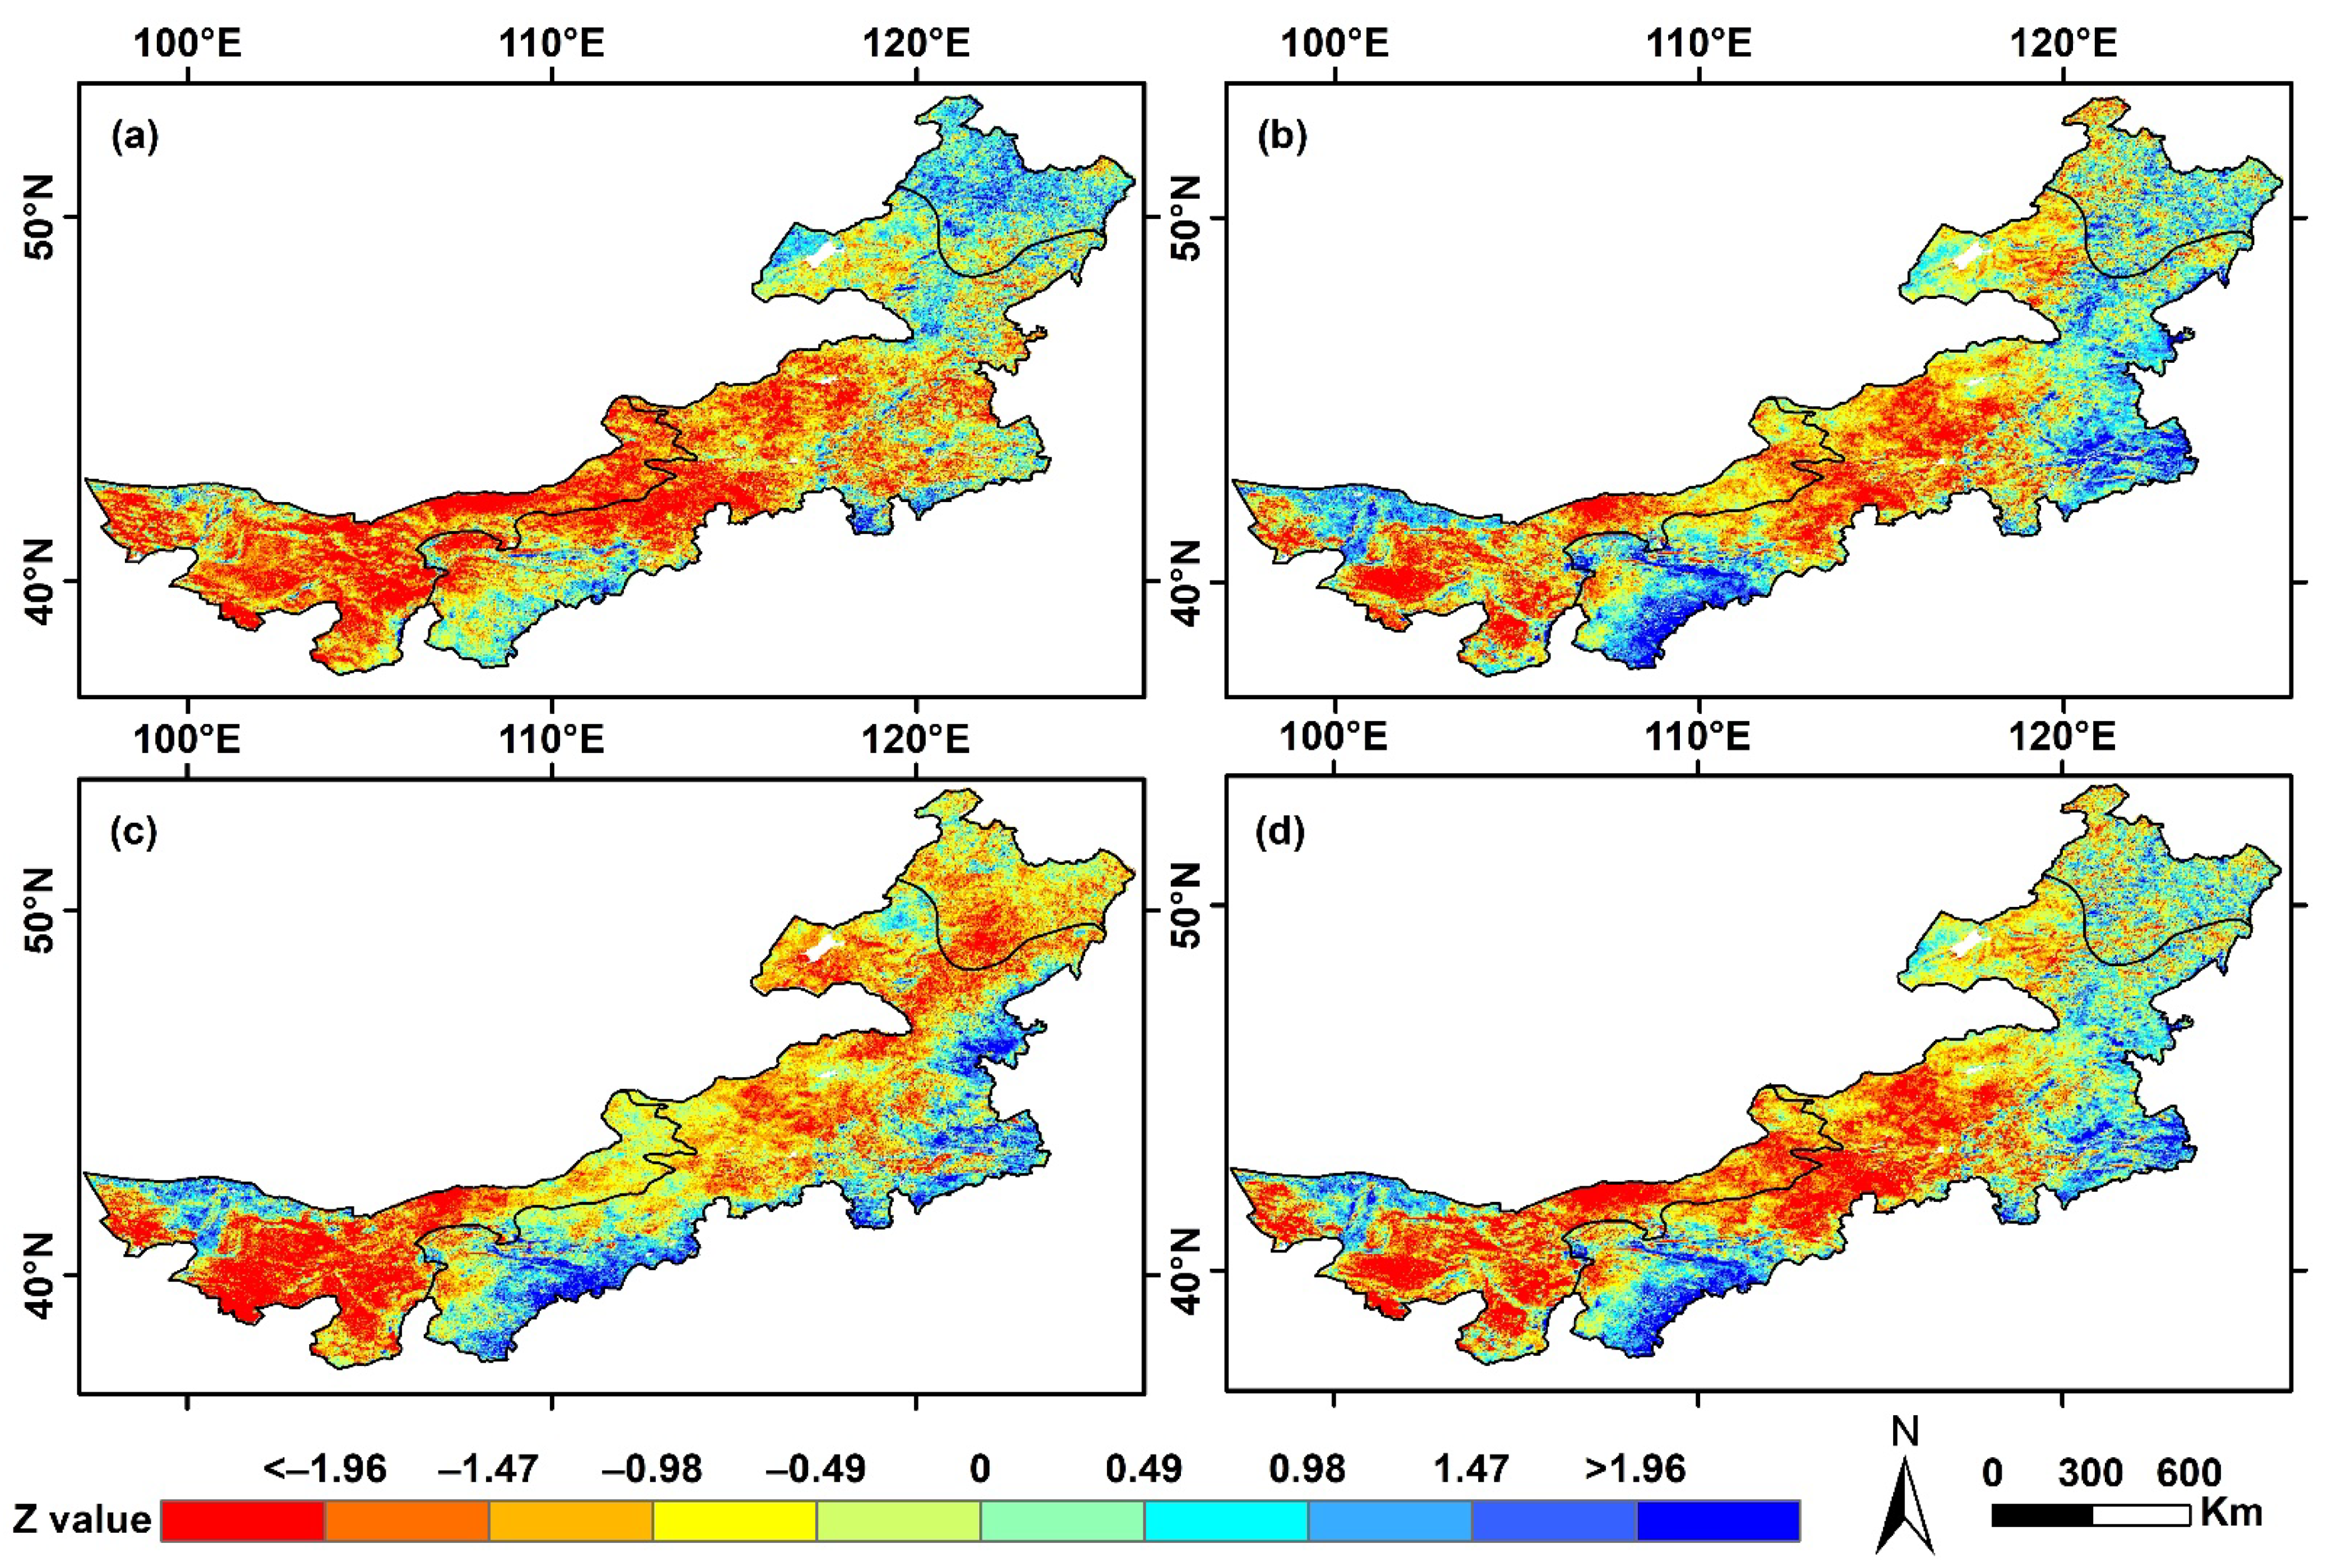
3.1. The Changing Characteristics of Meteorological Drought

Based on the BFAST algorithm, we identified the segmented trends and mutations of SPEI series to elucidate the changing characteristics of meteorological drought in the IM and its subdivisions from 1982 to 2020. The results of the identification are shown in Figure 2. Obviously, the SPEI changes in the IM belonged to a type of interrupted decrease changes, indicating an overall downward trend in SPEI during the study period and an exacerbation of meteorological drought (Table 1). It was worth noting that in August 2010, an interrupted positive change occurred in SPEI, with insignificant decreasing trend observed before or after the mutation, with slopes of −0.0001 and −0.0013, respectively. Among the subdivisions, SPEI trend in the GV subdivision was consistent with that of the IM, both displaying a type of interrupted decrease changes. The slopes of the two segments were −0.0005 and −0.0007, respectively, with an insignificant trend. The DV subdivision exhibited an insignificant change type from increase to decrease, with a negative mutation occurring in March 1992, and the slopes before and after the mutation were 0.0012 and −0.0004, respectively. The FV subdivision displayed a change type from decrease to increase, with a negative mutation occurring in November 2016, and the slopes before and after the mutation were −0.0001 and 0.0021, respectively, both insignificant. It can be found that during the study period, the meteorological drought in the IM and each sub region showed an insignificant worsening trend.
We further evaluated the spatiotemporal trends of meteorological drought at the grid scale in the IM using the PTIM. Figure 3 displays the temporal variations of SPEI during spring, summer, autumn, and the growing season. Overall, from 1982 to 2020, there was an insignificant downward trend in SPEI for all periods in the IM (p > 0.05). The average Z-values for spring, summer, autumn, and the growing season were −0.099, −0.265, −0.184, and −0.629, respectively, indicating a non-significant worsening trend in meteorological drought. When examining different vegetation types, the absolute Z-values for DV, FV, and GV in each season did not exceed 1.96, indicating non-significant changes in drought. However, SPEI showed a non-significant increasing trend during summer (Z = 0.607) and the growing season (Z = 0.002) in DV, during spring (Z = 0.044) in GV, and during autumn (Z = 1.759) in FV, suggesting a slight alleviation of meteorological drought. In addition, SPEI in other seasons for DV, FV, and GV exhibited non-significant decreasing trends, consistent with the overall trend in the IM. This indicated that there was no significant change in meteorological drought in the IM during the study period (p > 0.05), which was consistent with the results obtained using the BFAST algorithm.

3.2. Dynamic Variations in Vegetation

Based on the BFAST algorithm, the trend types and mutations detected in VHI sequences for the IM and its sub-regions are shown in Figure 4. Both the IM and the sub-regions exhibited an interrupted decrease trend type, indicating a weakening of vegetation growth in the study period (Table 2). Specifically, the mutation for VHI in the IM occurred in October 1997. The slopes before and after the mutation were approximately −0.0003, and both segment changes were significant (p < 0.05). For the DV sub-region, the mutation for VHI occurred in March 1991, and the slopes before and after the mutation were −0.0019 and −0.0003, respectively, with both segment changes being significant (p < 0.05). In the FV sub-region, the mutation for VHI occurred around April 1997, and the slopes before and after the mutation were −0.0006 and −0.0004, respectively. As for the GV sub-region, the mutation for VHI occurred around September 1998, and the slopes before and after the mutation were approximately −0.0002. Only the second segment change was significant (p < 0.05). Overall, except for the first segment of VHI in the GV sub-region, which showed a non-significant downward trend, VHI segment changes in the other zones showed significant downward trend (p < 0.05). This indicated a certain degree of weakening in vegetation growth in the IM from 1982 to 2020.
As shown in Figure 5, we analyzed the variations in vegetation cover in the IM during spring, summer, autumn, and growing seasons from 1982 to 2020. The results revealed an overall declining trend in VHI, with mean Z of −0.808, −0.366, −0.661, and −0.585 for spring, summer, autumn, and growing seasons, respectively. These findings suggested that the vegetation conditions in the IM did not improve over time. Furthermore, the percentage of pixels exhibiting a declining trend in VHI for the entire region during spring, summer, autumn, and growing seasons were found to be 73.08%, 62.35%, 72.59%, and 67.17%, respectively. The declining trend was consistent with the observed overall trend in the IM. With respect to different vegetation types, except for FV during spring (Z = 0.564) and summer (Z = 0.097), which showed an upward trend, the remaining regions showed a downward trend in all seasons. Comparing the trends of meteorological droughts and vegetation in the IM, we found that meteorological drought had worsened over time, as evidenced by an increase in frequency, and the vegetation growth had also shown a declining trend. These results indicated a potential correlation between meteorological drought and vegetation growth trends and suggested that the meteorological drought in the IM had not improved, which may lead to a trend of deteriorating vegetation growth.

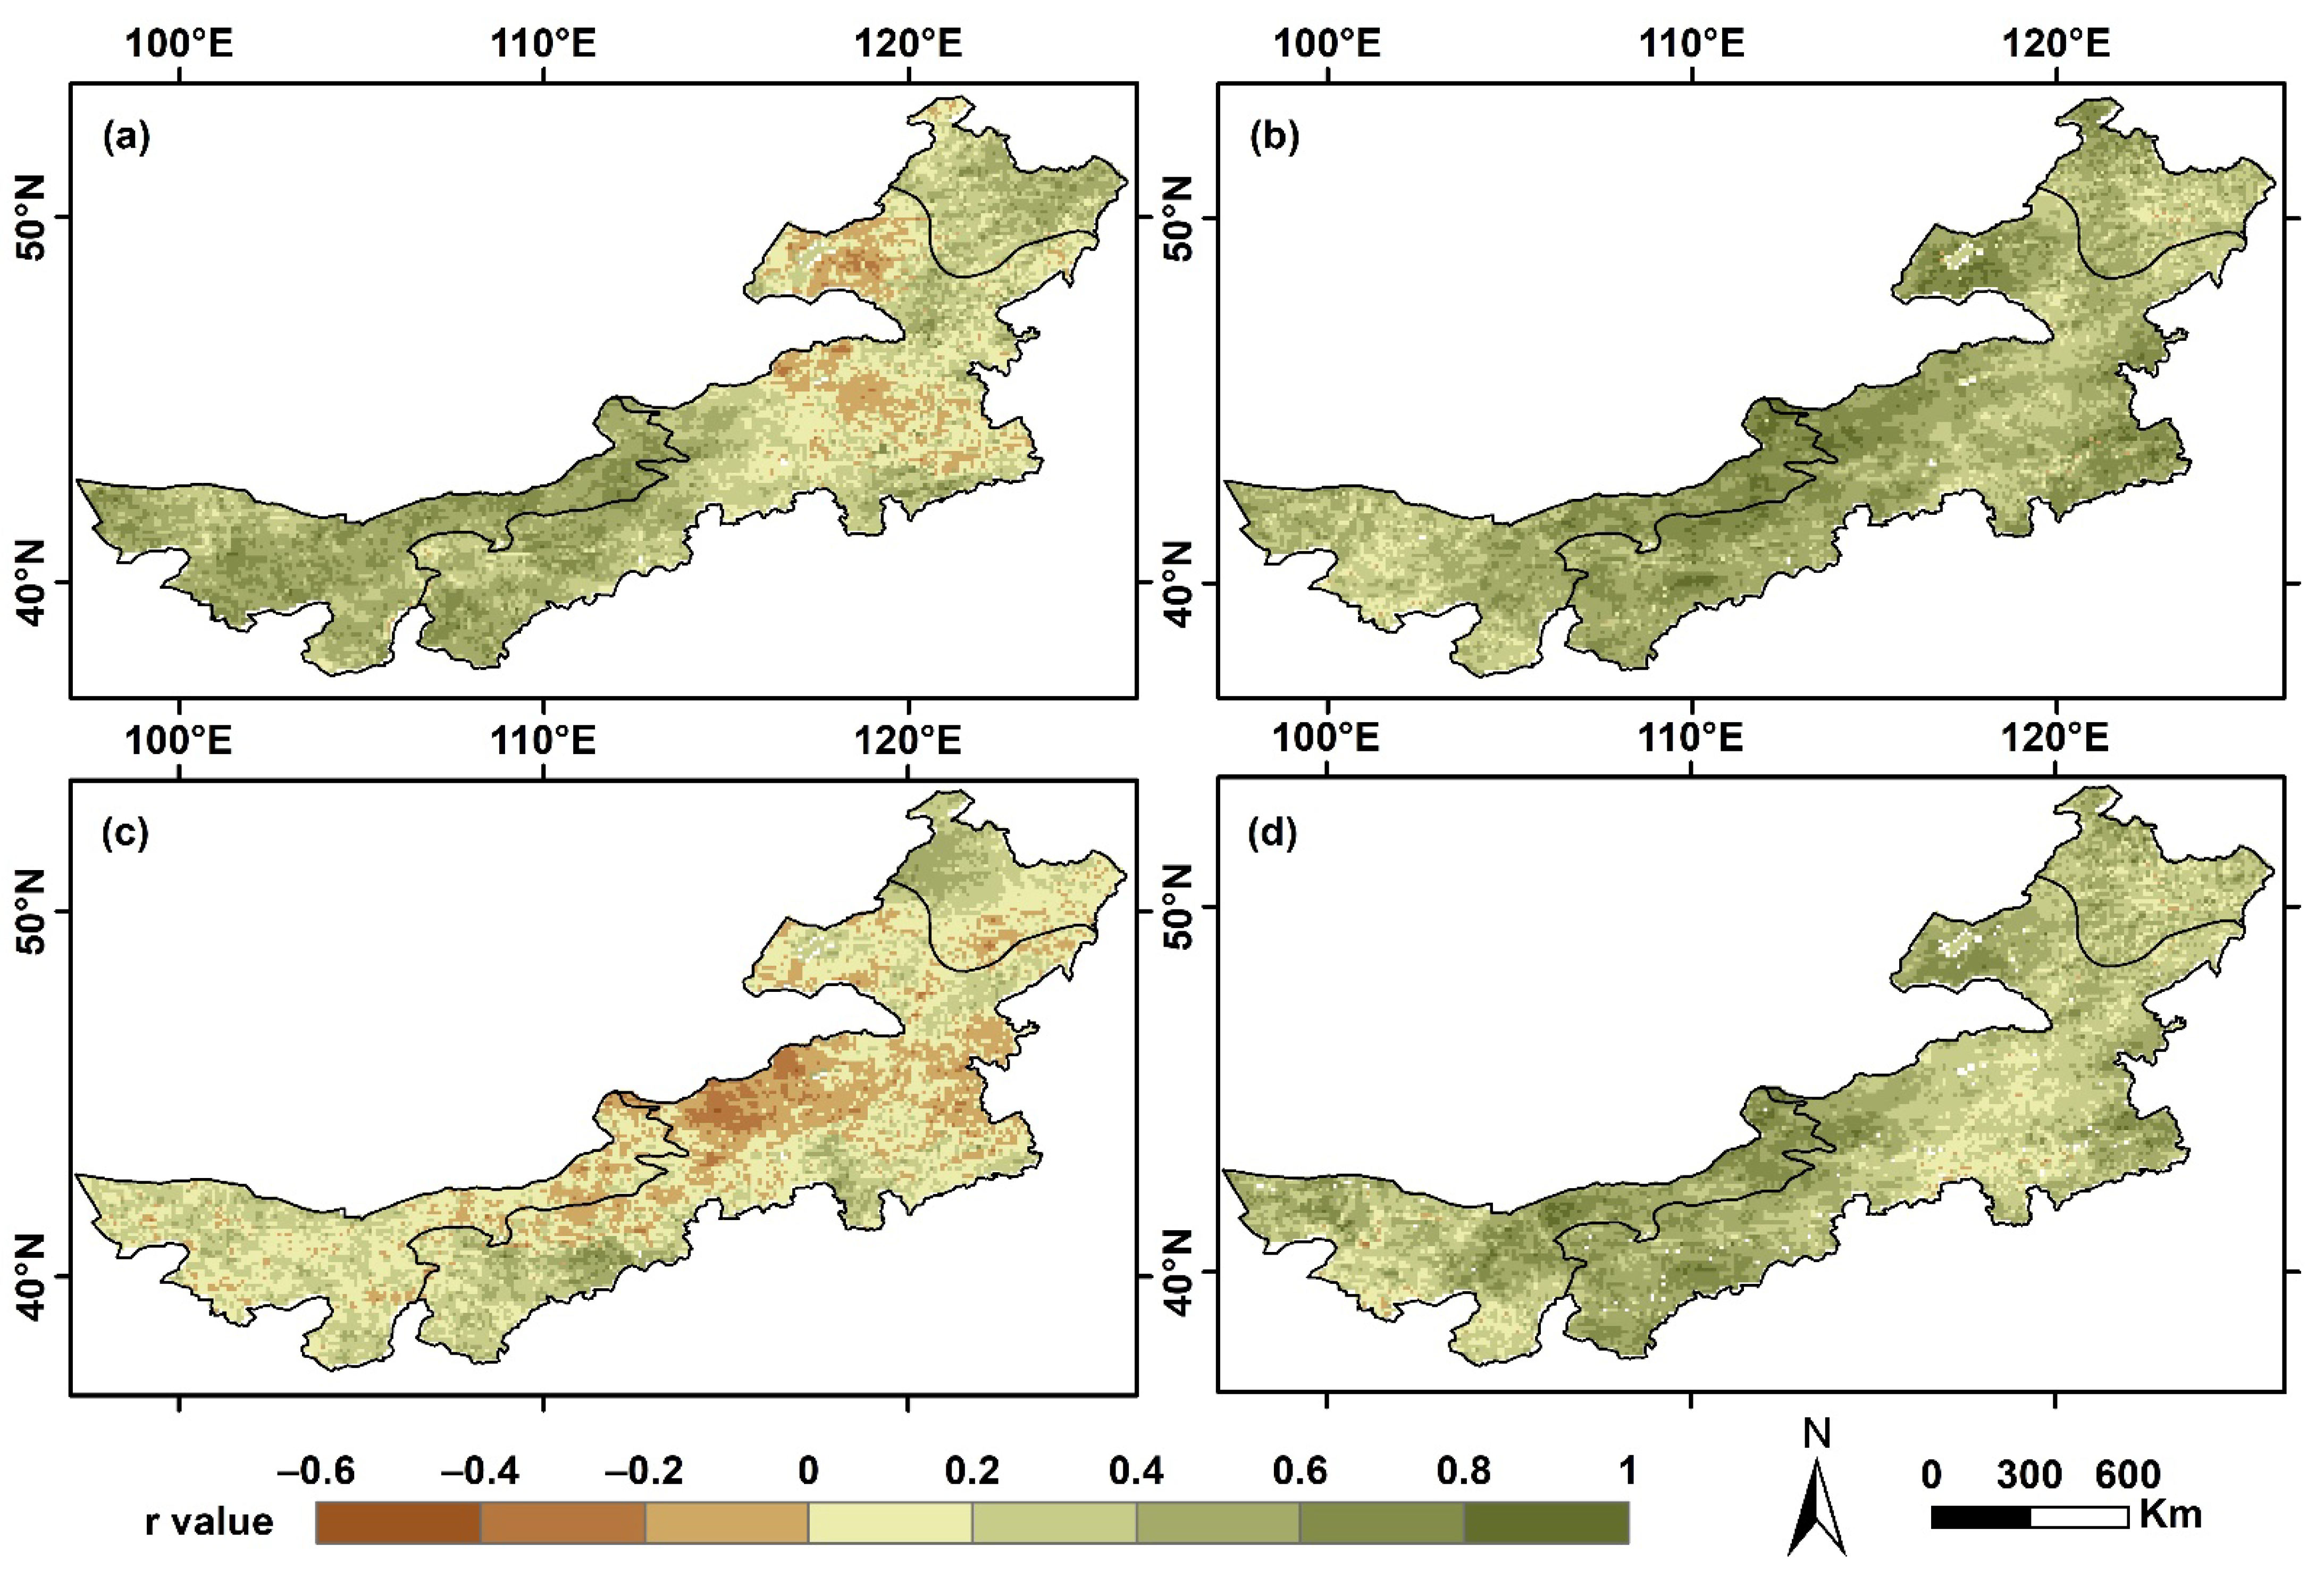
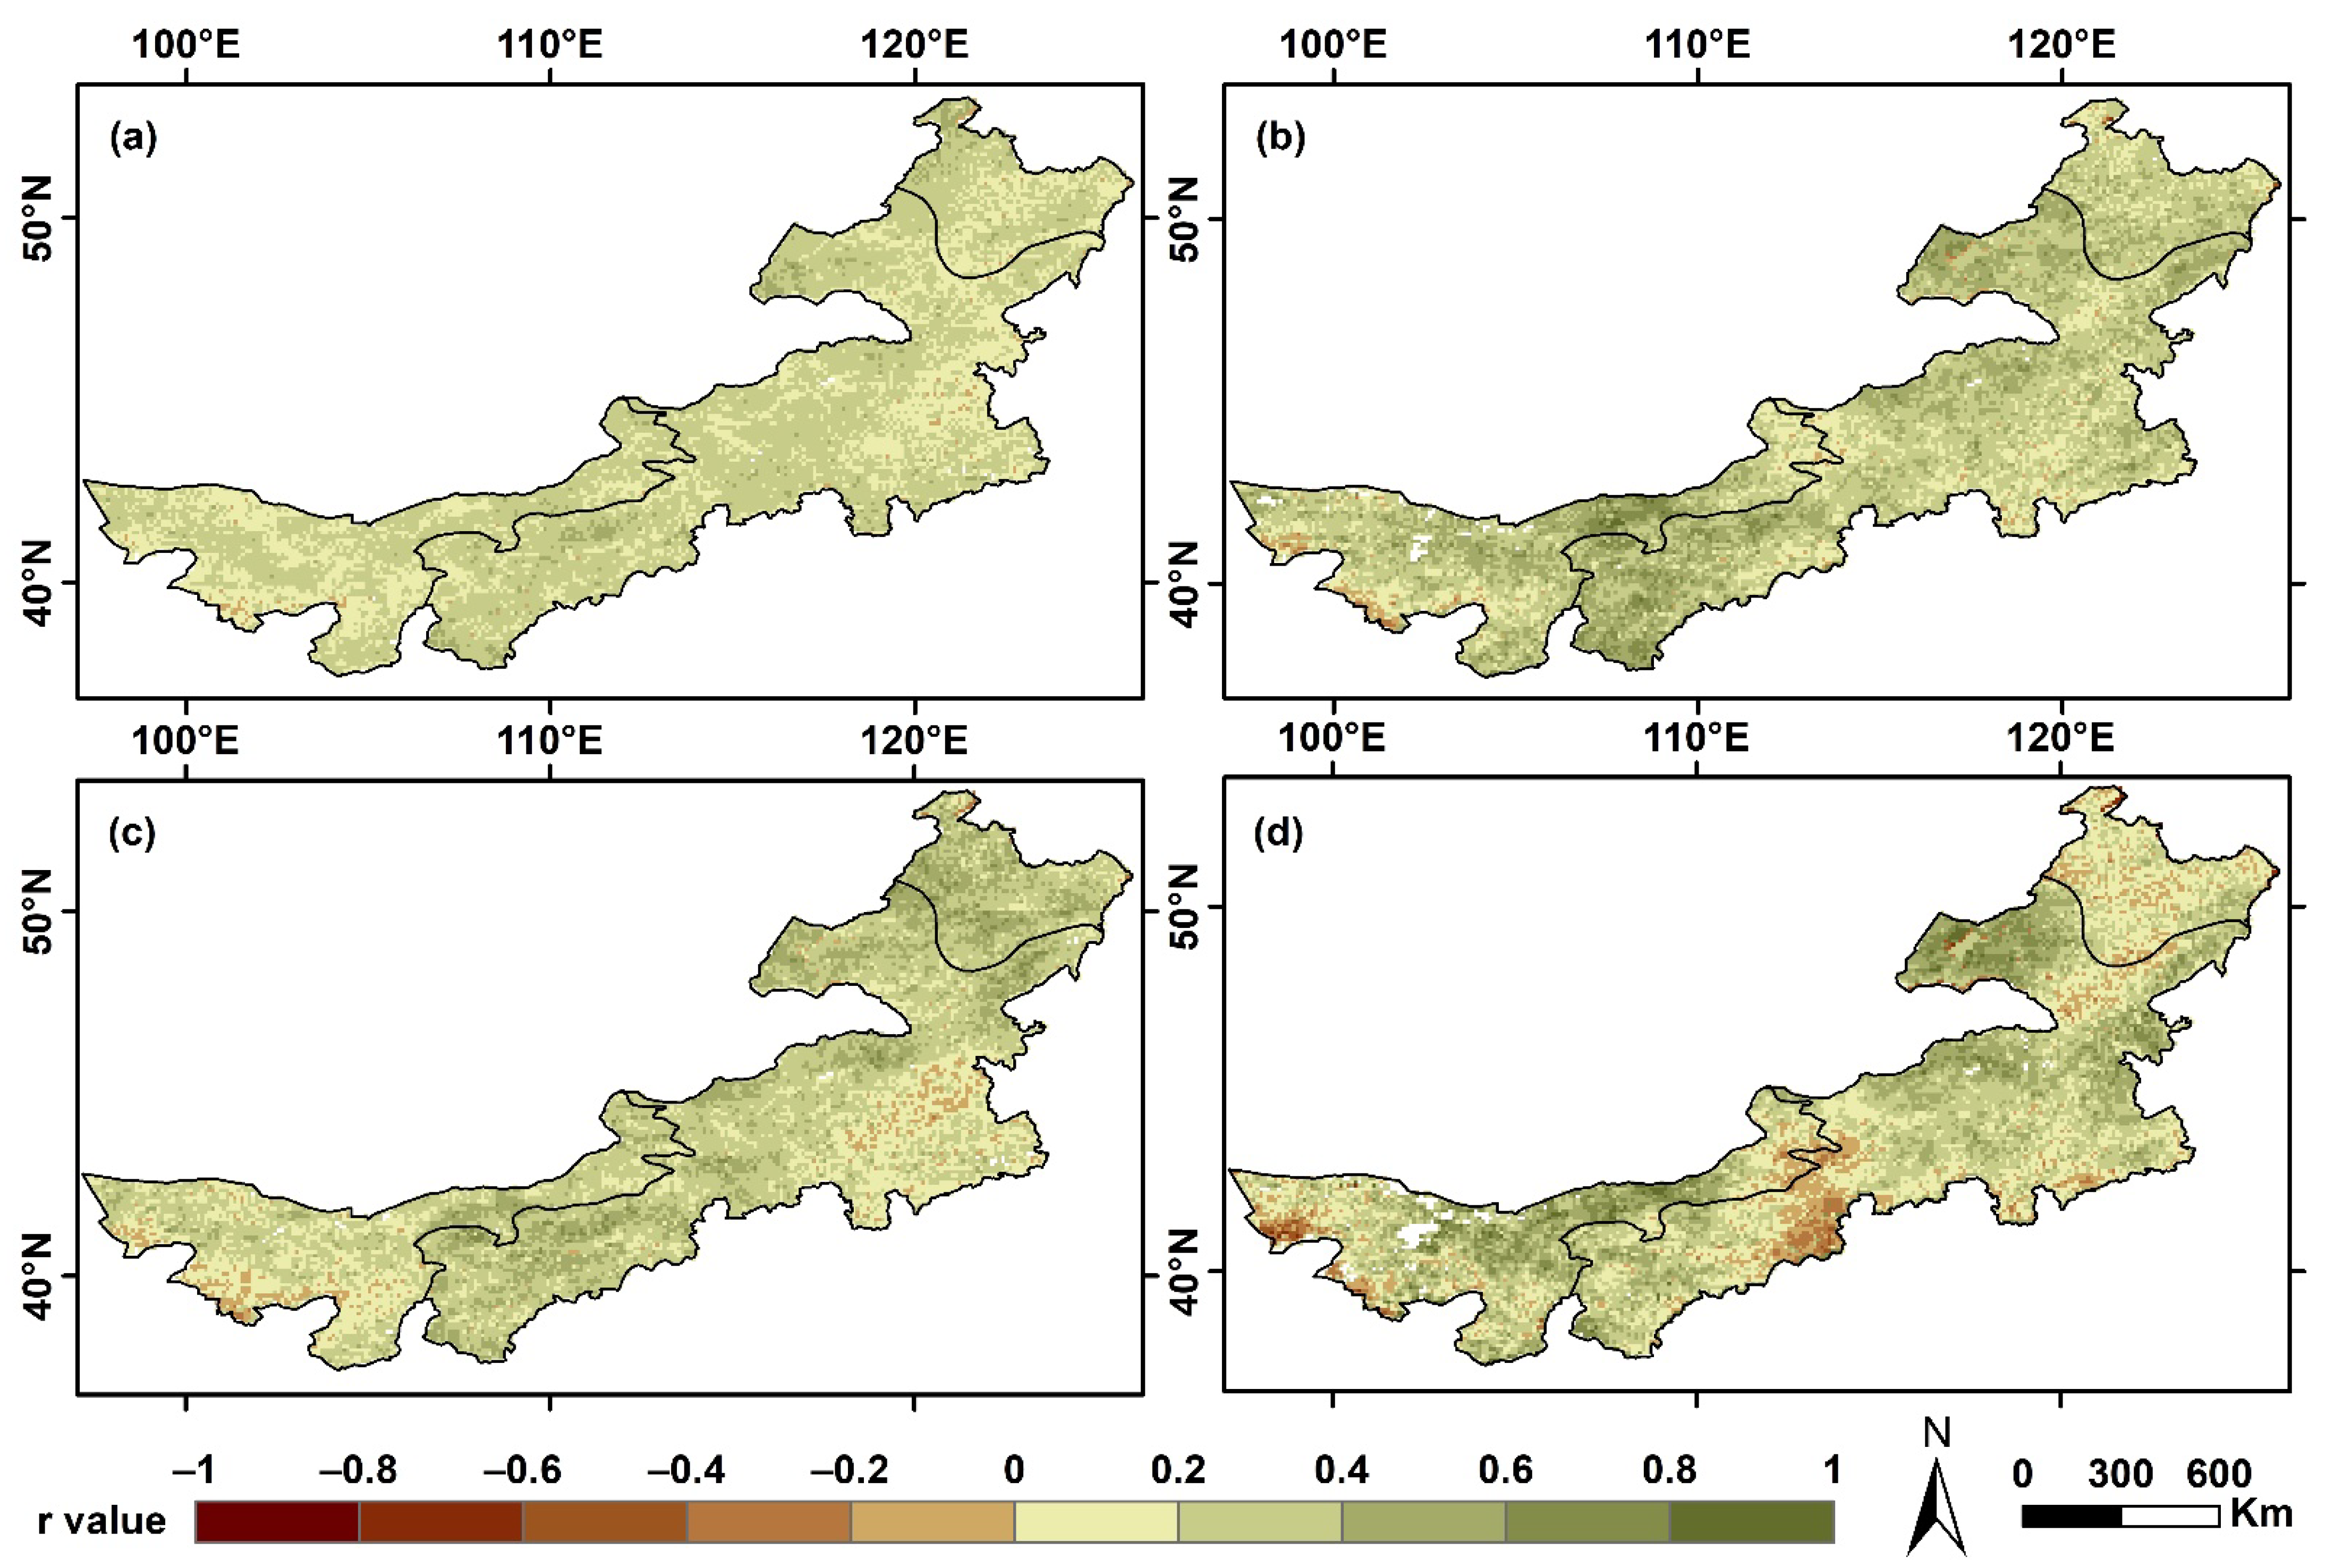
3.3. The Correlation between Vegetation Change and Meteorological Drought

Based on the temporal and spatial variations of SPEI and VHI, we further investigated the correlation between SPEI and VHI during different periods using correlation analysis (Figure 6), to clarify the relationship between vegetation growth and meteorological drought in the IM during this period. Overall, there was a positive correlation between SPEI and VHI in the IM, indicating that vegetation growth deteriorated with the aggravation of meteorological drought. We calculated the mean values of SPEI and VHI for each season in the IM and different regions and found spatial variations in the relationship between vegetation growth and meteorological drought across different regions. For the entire IM, the correlation between SPEI and VHI was strongest in summer, with average r of 0.487, while it was weakest in autumn, with average r of 0.339. Among different regions, the correlation between SPEI and VHI was strongest in DV during spring (r = 0.509), FV during summer (r = 0.402), and GV during summer (r = 0.516), while it was weakest in DV during autumn (r = 0.357), FV during autumn (r = 0.296), and GV during spring (r = 0.257). The analysis confirmed that there was a certain correlation between meteorological drought and vegetation growth, but the response relationship varied between different vegetation types and meteorological drought.
Through the above research, we found that different vegetation types may exhibit varying sensitivities to meteorological drought. Therefore, we separately calculated the correlation between SPEI and VHI at 1, 3, 6, and 12-month scales (Figure 7), to analyze the impact of meteorological drought at different temporal scales on vegetation. Overall, in the IM, the average r values between SPEI and VHI at 1, 3, 6, and 12-month scales were 0.329, 0.420, 0.374, and 0.362, respectively. Thus, the strongest correlation was observed at the 3-month scale, suggesting a lag effect of VHI in response to SPEI. When considering different vegetation types, in the DV region, the average r between SPEI and VHI at 1, 3, 6, and 12-month scales were 0.308, 0.406, 0.314, and 0.382, respectively, with the strongest correlation also observed at the 3-month scale, consistent with the IM. This region was mainly characterized by sparse vegetation composed of xerophytic or ultra-xerophytic trees, shrubs, semi-shrubs, and succulent plants. In the GV region, the strongest correlation between SPEI and VHI occurred at the 3-month scale, with average r of 0.435. In the FV region, the strongest correlation was observed at the 6-month scale, with average r of 0.455. Therefore, we inferred that desert and grassland exhibited higher sensitivity to meteorological drought compared to forests.

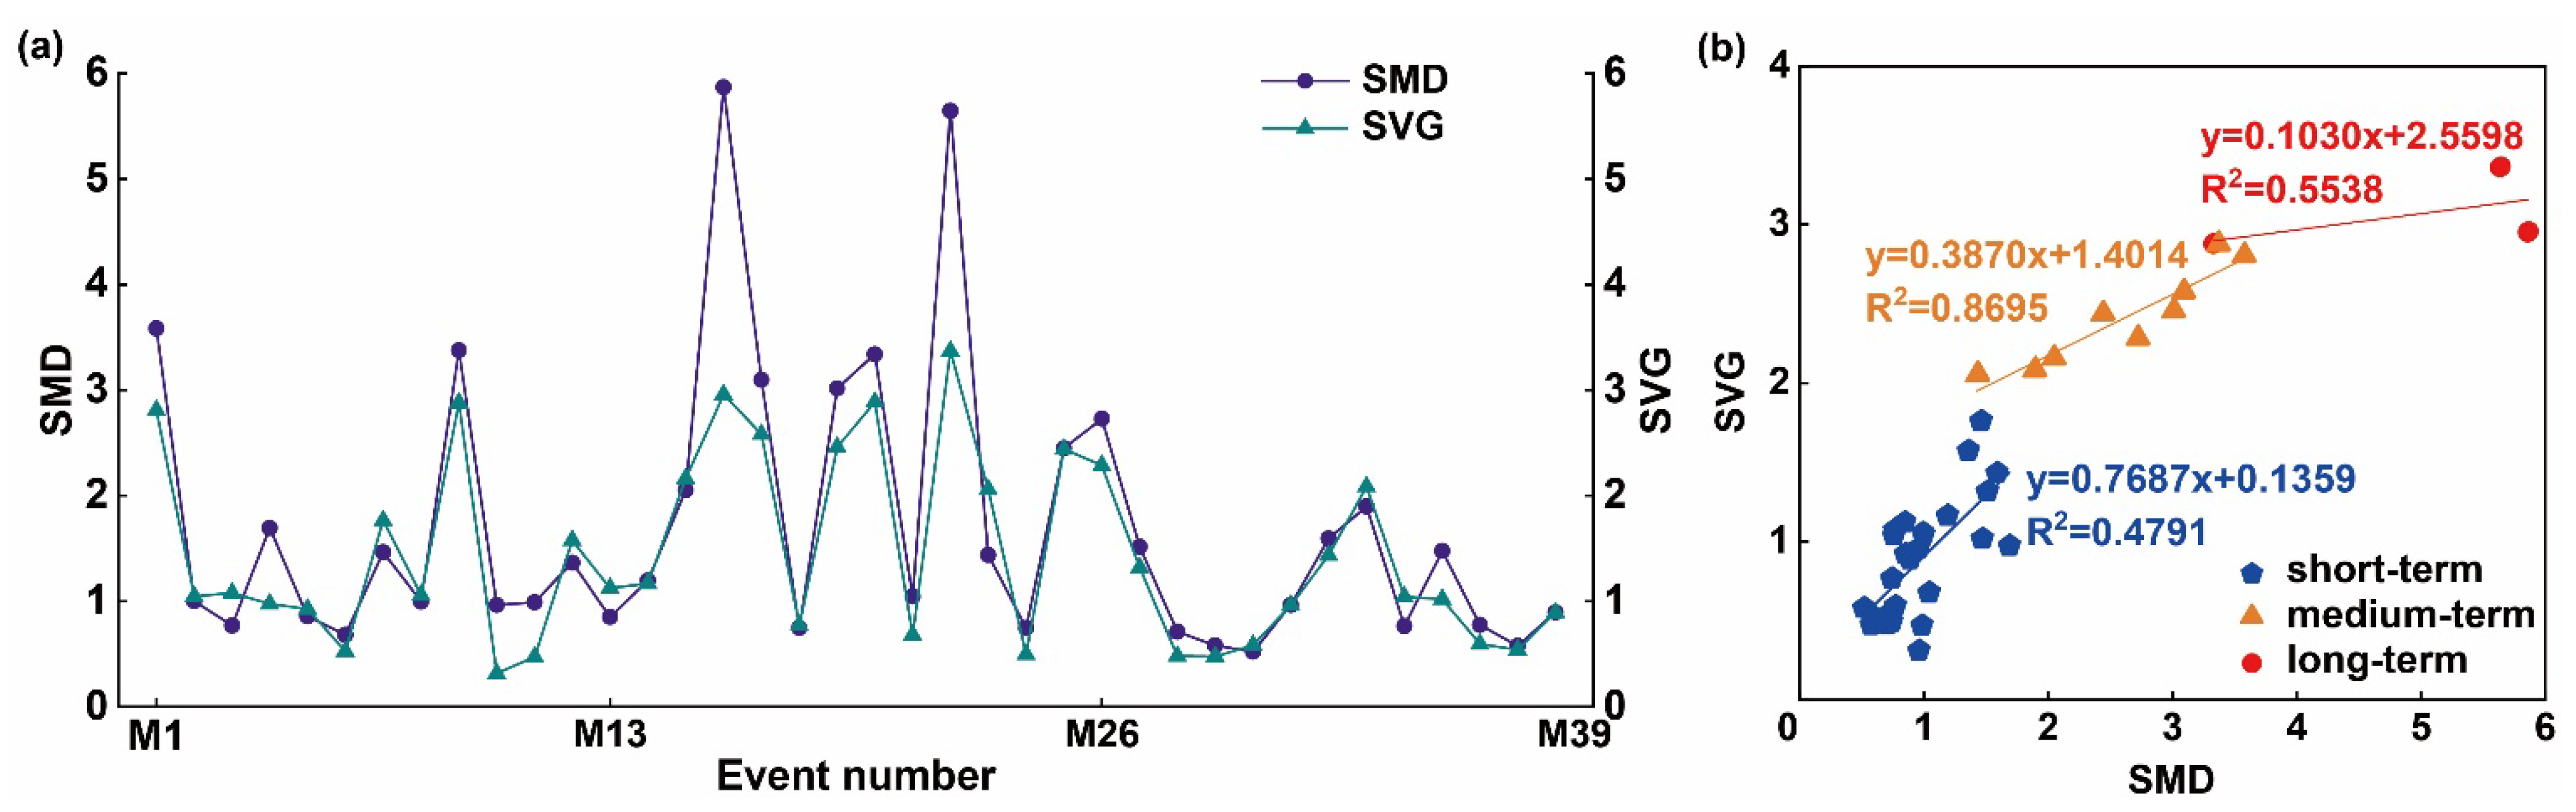
3.4. The Impact of Meteorological Drought Events on Vegetation Change

As the correlation between SPEI and VHI was highest at the 3-month scale, we used SPEI-3 from 1982 to 2020 to identify meteorological drought events in the IM. During the study period, a total of 38 drought events were identified, with 16 and 22 events occurring around 2000, respectively. The average SMD was 1.690, and the average PSMD 0.682. Table 3 shows the top 10 meteorological drought events ranked by severity. The event with the highest severity in the IM between 1982 and 2020 was No. M16, with a drought severity of 5.869. This event was also the longest-lasting drought event in the IM during the study period, lasting from May to December 1999 for a duration of 8 months. In addition, event No. M22 had the highest PSMD of 1.259. This drought lasted for 7 months (from July 2005 to January 2006), and its severity was 5.646.
Based on the identification of meteorological drought events in the IM during this period, we analyzed the vegetation growth variations within each drought event, as shown in Figure 8. As depicted in Figure 8a, in 38 meteorological drought events, SMD and SVG exhibited similar patterns of change. Additionally, their values show minimal differences in each event. The SMD and SVG exhibited a high level of consistency, with an r of 0.898 (p < 0.01). This result strongly demonstrated the correlation between meteorological drought and vegetation growth, suggesting that meteorological drought events may directly impact vegetation growth. To further investigate the influence of meteorological drought events on vegetation growth, we categorized them into three types: short-term (lasting 1–3 months), medium-term (lasting 4–6 months), and long-term (lasting more than 6 months), and analyzed the distribution of SMD and SVG under different types of meteorological drought events (Figure 8b). The SVG responded more intensely to short-term meteorological drought events, with a slope of 0.7687. As the duration of meteorological drought events increased, the response of SVG gradually leveled off. For medium-term and long-term meteorological drought events, the slopes obtained from the fitting of SVG with SMD were 0.3870 and 0.1030, respectively.

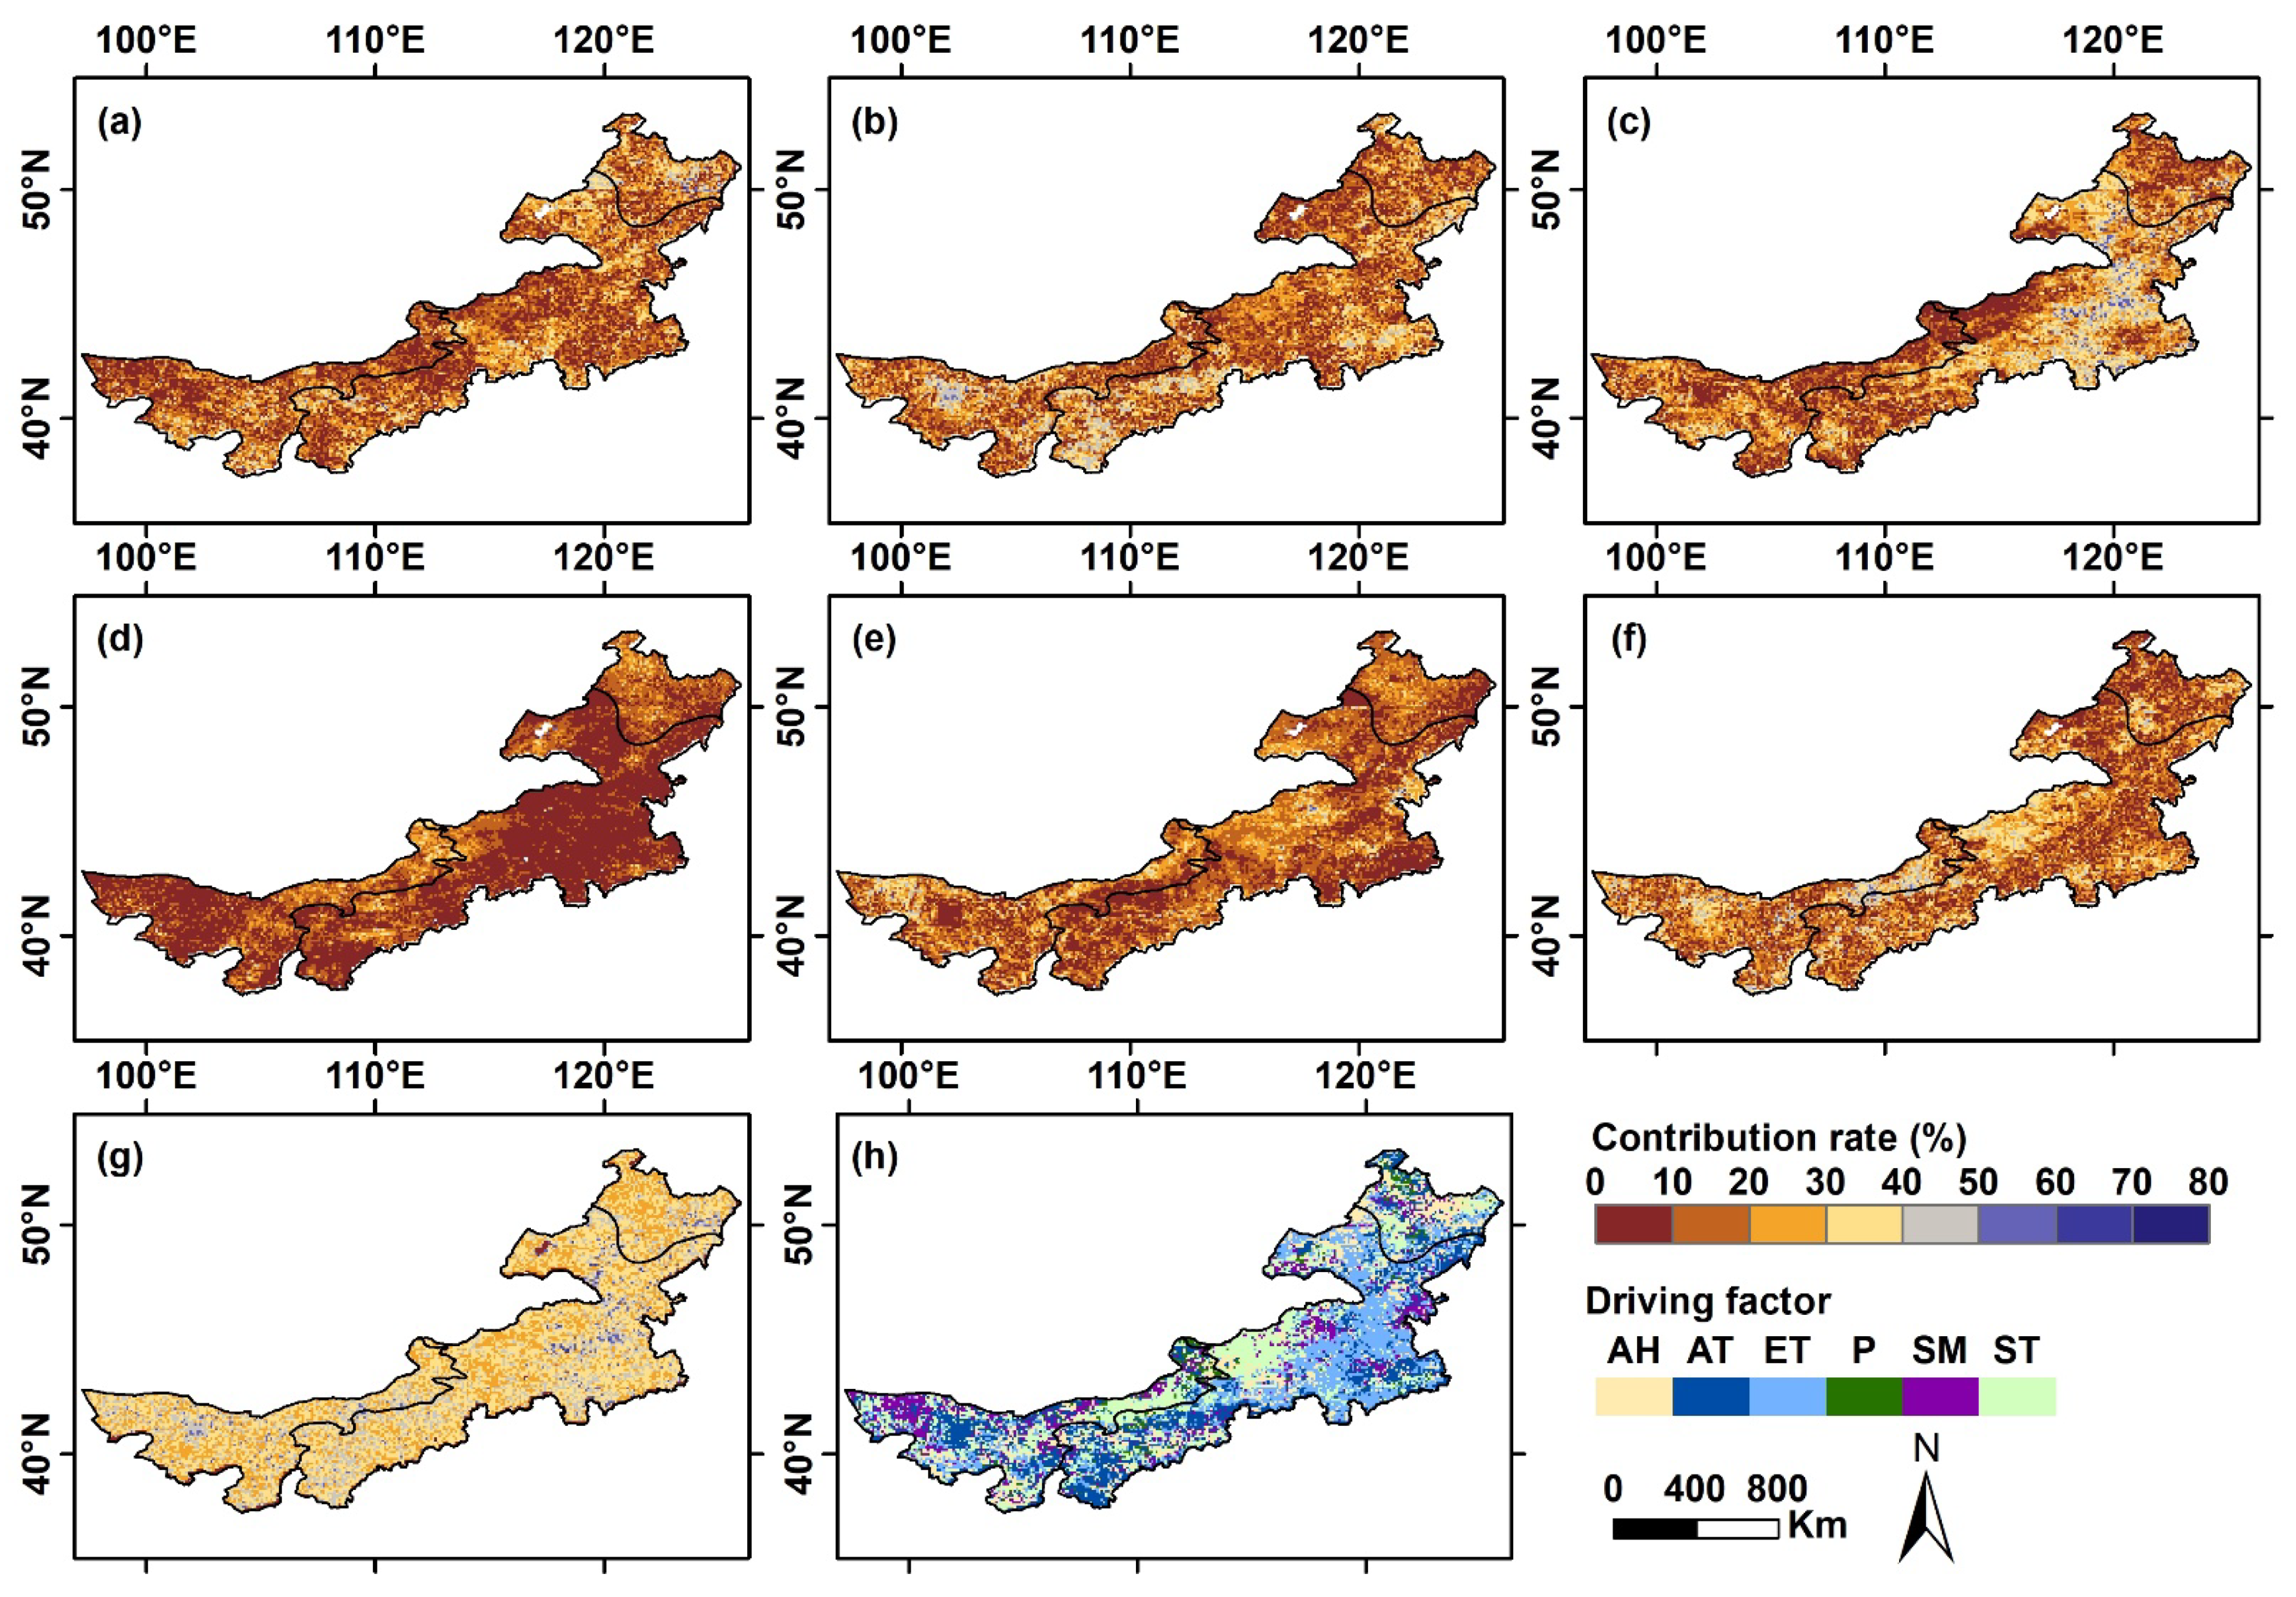
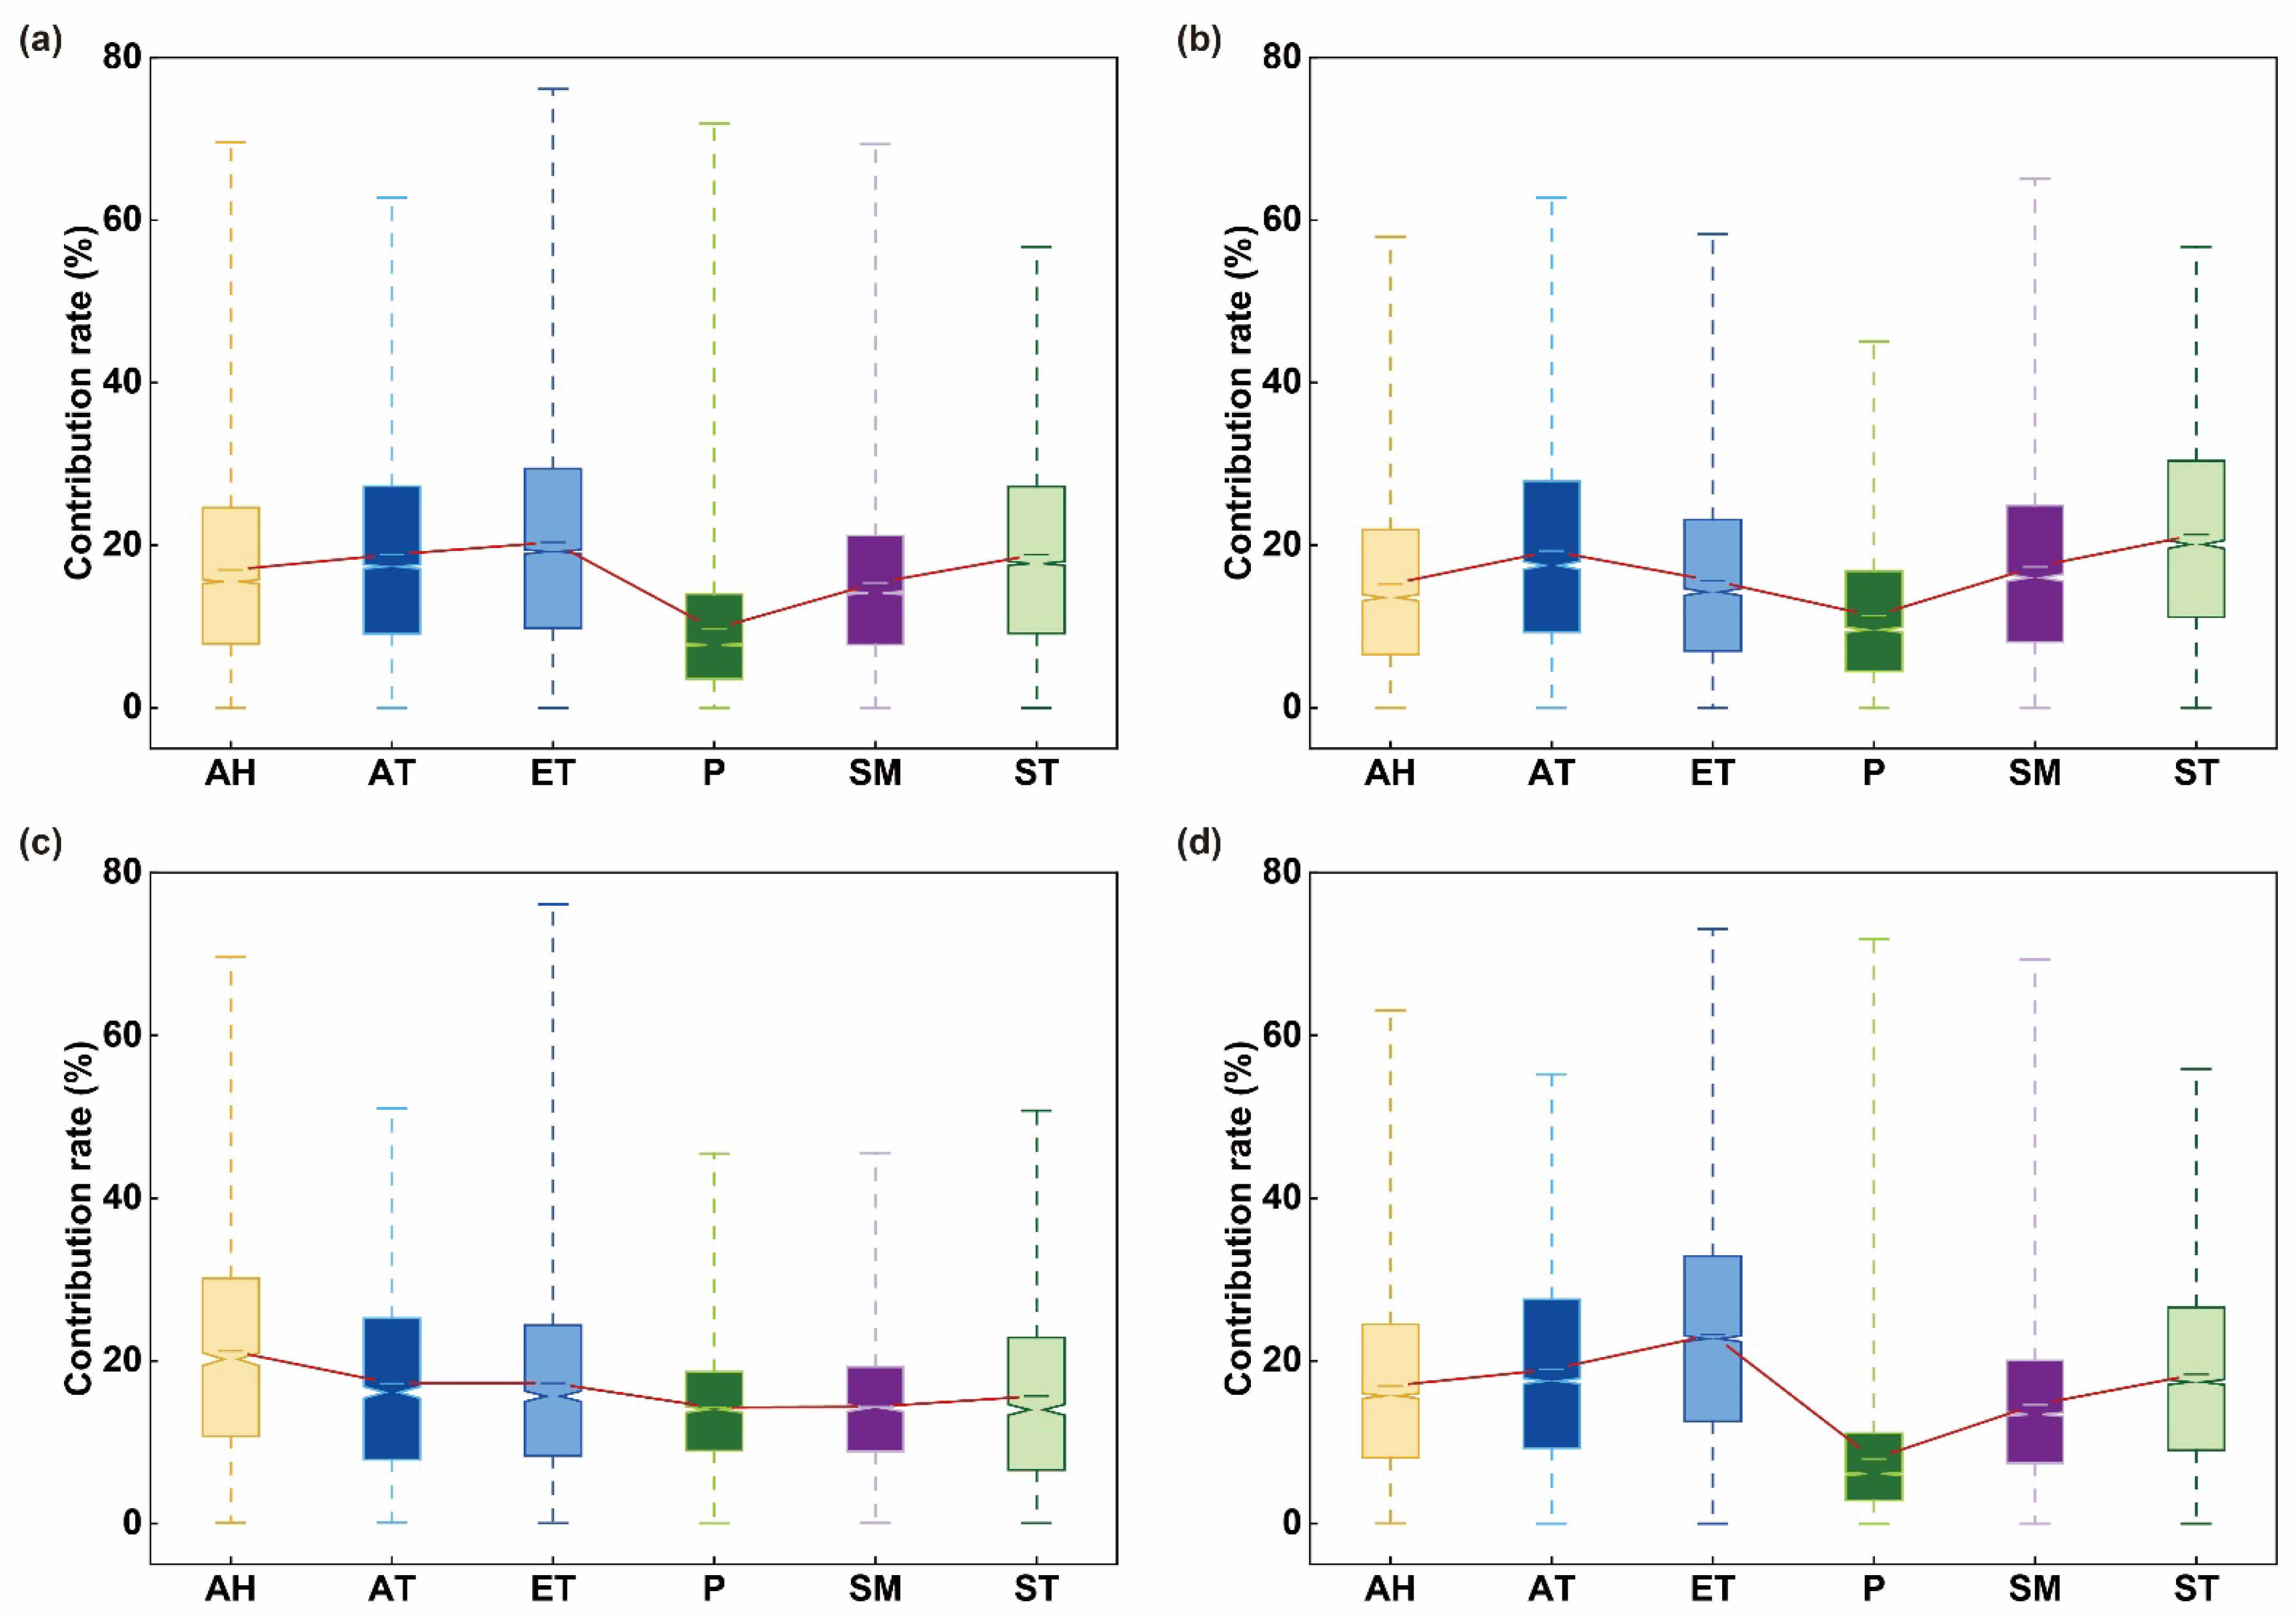
3.5. The Driving Role of Climate Factors

Vegetation growth is influenced by multiple factors, and different climatic factors may have varying impacts on vegetation growth. Therefore, we employed a standardized multiple linear regression method to calculate the contribution rates of various climate factors to VHI, including air humidity (AH), air temperature (AT), evapotranspiration (ET), precipitation (P), soil moisture (SM), and soil temperature (ST) (Figure 9). For the entire IM region, the average contribution rates of AH, AT, ET, P, SM, and ST to VHI were 16.96%, 18.84%, 20.34%, 9.67%, 15.34%, and 18.86%, respectively, indicating that ET had the largest impact on vegetation growth. Moreover, the range of maximum contribution rates was 0–76.12%, with a mean of 33.73%. Among these climate factors, the percentage area of driving influence was 16.18%, 24.27%, 24.40%, 2.90%, 10.93%, and 21.32%, respectively. Clearly, the percentage area of the key driving factor, ET, also reached its maximum value at 24.40%. Therefore, ET was the most significant climatic driving factor in the IM region.
Undoubtedly, climate factors play a key role in the process of vegetation growth and serve as significant determinants. The response of VHI to climatic factors varies among different vegetation types, including desert, forest, and grassland (Figure 10). In terms of different zones, within the DV, ST had the greatest impact on vegetation growth with a contribution rate of 21.29%. In the FV, AH exerted the most significant effect on vegetation growth, with a contribution rate of 21.23%. Within the GV, ET had the highest impact on vegetation growth, with a contribution rate of 23.23%. Additionally, within the DV, FV, and GV zones, the climate factors ST (26.31%), AH (31.76%), and ET (31.56%) accounted for the largest percentage of area coverage. Therefore, it can be inferred that different vegetation types may exhibit varied responses to climate factors.

4. Discussion

As a natural link between water, atmosphere, and soil interactions, vegetation is a key component of terrestrial ecosystems [25,27]. Currently, most studies use remotely-sensed vegetation indices to identify drought phenomena in terrestrial systems. Vegetation changes and their dynamic responses to meteorological drought are the focus of drought research [11,12]. Therefore, accurately identifying meteorological drought and its impact on vegetation growth is crucial for rational water resource utilization and the development of effective irrigation policies. In this study, VHI, which combines the advantages of the TCI and VCI, was used to measure changes in vegetation growth caused by differences in meteorology. The VHI is closely related to plant transpiration, solar radiation interception, and photosynthesis, and is a primary indicator for monitoring large-scale vegetation growth and vegetation cover [8,22,40]. Since 2000, the number of global droughts has increased by 29% [44]. This study identified meteorological drought and vegetation changes in the IM from 1982 to 2020 based on meteorological and vegetation index data. The findings revealed a decreasing trend in both the SPEI and VHI, indicating the meteorological drought was aggravated and the vegetation growth was decreased. It can be seen that the drought changes in IM are consistent with the global trend. This result is consistent with the previous by Wang et al. [45] and Javed et al. [46]. Importantly, when resampling VHI dataset, the mean of the results obtained from various resampling methods was used to reduce data uncertainty [20,47]. Furthermore, the study results indicated that among all meteorological factors, ET had the most significant impact on vegetation growth in the IM (Figure 9). ET serves as a link in the global water-carbon-energy coupling cycle and plays a crucial role in quantifying vegetation response to hydrological cycles [48]. ET serves as the basis for the ecosystem water balance in the IM and is one of the key parameters for vegetation during the growing season [34]. Therefore, revealing changes in ET and its feedback on vegetation contributes to the assessment of freshwater resource sustainability, the formulation of agricultural irrigation systems, and ecosystem monitoring.
Furthermore, the magnitude of the correlation between drought indices and vegetation indices effectively reflects the sensitivity of vegetation to drought [49]. In most regions of the IM, vegetation changes are positively correlated with meteorological drought indices, indicating that vegetation activity is strongly limited by water availability (Figure 6). Vegetation has self-regulatory capabilities and is closely related not only to the degree of drought and water scarcity during the same period but also to the cumulative and lag effects of previous droughts [25,26,50]. The research on the response of different types of vegetation to these cumulative and lag effects is relatively scarce. In this study, we investigated the sensitivity of vegetation to drought in different regions and found that the response duration of vegetation to meteorological drought was approximately three months in the IM (Figure 7). Additionally, different types of vegetation have varying capacities to obtain water from the soil. In the IM, different vegetation types show differences in sensitivity to meteorological drought. In Section 3.3, it was found that grasslands are more sensitive to meteorological drought compared to forests. Under the SM stress caused by drought, grasslands only absorb surface SM to satisfy their growth conditions, making them more sensitive to drought [22,33]. Forests can tap into deep SM, resulting in a weaker response sensitivity to drought stress [51].
Vegetation growth is a complex process influenced by climate factors, as well as other factors such as human activities [5,52]. In the IM, grazing intensity is also an important factor influencing vegetation changes. However, this study did not account for the important influence of extreme weather events and climate change caused by human activities on vegetation changes. In the future, with the emergence of higher-resolution and longer time series remote sensing data, it will help us understand the relationship between vegetation physiological activity and meteorological drought in different ecosystems [53]. In addition to meteorological drought, the coupling impact of soil drought and groundwater drought on vegetation is also worth studying [54]. Furthermore, the resistance and resilience of natural vegetation to drought events are areas that need further in-depth research [55].

5. Conclusions

This study evaluates the dynamic changes and correlations between meteorological drought and vegetation growth from 1982 to 2020 in the IM and examines the response of vegetation growth to different climate factors. The main findings are as follows:
(1) Based on the results from BFAST analysis, both SPEI and VHI exhibited an interrupted decrease trend in the study area. Meteorological drought has been aggravated to some extent, resulting in a decline in vegetation growth. Meanwhile, the trends of meteorological drought and vegetation growth are consistent.
(2) There are variations in the responses between different vegetation types and meteorological drought. In the DV and GV, SPEI-3 showed the strongest correlation with VHI, with average r of 0.406 and 0.435, respectively. In the FT, SPEI-6 exhibited the strongest correlation with VHI, with average r of 0.455. Compared to forests, deserts and grasslands are more sensitive to meteorological drought.
(3) Meteorological drought events may have a more direct impact on vegetation growth. During the study period, r between SMD and SVG was 0.898 (p < 0.01). In specific, vegetation growth shows a more pronounced response to short-term meteorological drought events.
(4) The ET is the primary climatic driving factor in the IM. Additionally, different vegetation types exhibit varying responses to climate factors. In the DV, FV, and GV, the climate factor with the greatest influence on vegetation growth is ST, AH, and ET, respectively, with contribution rates of 21.29%, 21.23%, and 23.23%.

Author Contributions

Conceptualization, F.W. and S.H.; data interpretation and methodology, H.L. and R.M.; validation, Z.W. and Z.Z.; software, K.F.; original draft preparation, W.Z.; funding acquisition, Q.Q. (Qingqing Qi) and Q.Q. (Qiang Quan). All authors have read and agreed to the published version of the manuscript.

Funding

This research was supported by the Yinshanbeilu Grassland Eco-hydrology National Observation and Research Station, China Institute of Water Resources and Hydropower Research (grant number YSS202118, YSS202101, YSS202112, and YS2022020), National Natural Science Foundation of China (grant number 42301024 and 52179015), Major Science and Technology Projects in Henan Province (grant number 201300311400), and Key Special Project of “Science and Technology Revitalizing Inner Mongolia” Action in Inner Mongolia Autonomous Region (grant number 2022EEDSKJXM004).

Data Availability Statement

Data can be requested from the corresponding author upon request.

Acknowledgments

Thanks for the support provided by Zezhong Zhang in language polishing.

Conflicts of Interest

The authors declare no conflict of interest.

References

  1. Mishra, A.K.; Singh, V.P. A review of drought concepts. J. Hydrol. 2010, 391, 202–216. [Google Scholar] [CrossRef]
  2. Mishra, A.K.; Singh, V.P. Drought modelling—A review. J. Hydrol. 2011, 403, 157–175. [Google Scholar] [CrossRef]
  3. Tian, Q.Q.; Wang, F.; Tian, Y.; Jiang, Y.Z.; Weng, P.Y.; Li, J.B. Copula-based comprehensive drought identification and evaluation over the Xijiang River Basin in South China. Ecol. Indic. 2023, 154, 110503. [Google Scholar] [CrossRef]
  4. Qi, X.; Jia, J.; Liu, H.; Lin, Z. Relative importance of climate change and human activities for vegetation changes on China’s silk road economic belt over multiple timescales. Catena 2019, 180, 224–237. [Google Scholar] [CrossRef]
  5. Shi, Y.; Jin, N.; Ma, X.; Wu, B.; He, Q.; Yue, C.; Yu, Q. Attribution of climate and human activities to vegetation change in China using machine learning techniques. Agric. For. Meteorol. 2020, 294, 108146. [Google Scholar] [CrossRef]
  6. Kogan, F.N. Remote sensing of weather impacts on vegetation in non homogeneous areas. Int. J. Remote Sens. 1990, 11, 1405–1419. [Google Scholar] [CrossRef]
  7. Brown, J.F.; Wardlow, B.D.; Tadesse, T.; Hayes, J.H.; Reed, B.C. The Vegetation Drought Response Index (VegDRI): A new integrated approach for monitoring drought stress in vegetation. Gisci. Remote Sens. 2008, 45, 16–46. [Google Scholar] [CrossRef]
  8. Bento, V.A.; Gouveia, C.M.; Da Camara, C.C.; Trigo, I.F. A climatological assessment of drought impact on vegetation health index. Agric. For. Meteorol. 2018, 259, 286–295. [Google Scholar] [CrossRef]
  9. Ding, Y.; Li, Z.; Peng, S. Global analysis of time-lag and -accumulation effects of climate on vegetation growth. Int. J. Appl. Earth Obs. 2020, 92, 102179. [Google Scholar] [CrossRef]
  10. Ma, Y.J.; Shi, F.Z.; Hu, X.; Li, X.Y. Climatic Constraints to Monthly Vegetation Dynamics in Desert Areas over the Silk Road Economic Belt. Remote Sens. 2021, 13, 995. [Google Scholar] [CrossRef]
  11. Weng, Z.; Niu, J.; Guan, H.D.; Kang, S.Z. Three-dimensional linkage between meteorological drought and vegetation drought across China. Sci. Total Environ. 2023, 859, 160300. [Google Scholar] [CrossRef] [PubMed]
  12. Zhou, Z.Q.; Liu, S.N.; Ding, Y.B.; Fu, Q.; Wang, Y.; Cai, H.J.; Shi, H.Y. Assessing the responses of vegetation to meteorological drought and its influencing factors with partial wavelet coherence analysis. J. Environ. Manag. 2022, 311, 114879. [Google Scholar] [CrossRef] [PubMed]
  13. Wang, Z.J.; Xu, M.Z.; Hu, H.C.; Zhang, X.P. Characteristics of vegetation changes and their drivers in the Yellow River basin from 1982 to 2020. Adv. Water Sci. 2023, 34, 499–509. [Google Scholar]
  14. Martínez-Vilalta, J.; Lloret, F. Drought-induced vegetation shifts in terrestrial ecosystems: The key role of regeneration dynamics. Glob. Planet. Chang. 2016, 144, 94–108. [Google Scholar] [CrossRef]
  15. Ge, C.H.; Sun, S.; Yao, R.; Sun, P.; Li, M.; Bian, Y.J. Long-term vegetation phenology changes and response to multi-scale meteorological drought on the Loess Plateau, China. J. Hydrol. 2022, 614, 128605. [Google Scholar] [CrossRef]
  16. Ma, M.; Wang, Q.; Liu, R.; Zhao, Y.; Zhang, D. Effects of climate change and human activities on vegetation coverage change in northern China considering extreme climate and time-lag and -accumulation effects. Sci. Total Environ. 2023, 860, 160527. [Google Scholar] [CrossRef]
  17. Marvel, K.; Cook, B.I.; Bonfils, C.J.W.; Durack, P.J.; Smerdon, J.E.; Williams, A.P. Twentieth-century hydroclimate changes consistent with human influence. Nature 2019, 569, 59–65. [Google Scholar] [CrossRef]
  18. Li, X.Y.; Li, Y.; Chen, A.P.; Gao, M.D.; Slette, I.J.; Piao, S.L. The impact of the 2009/2010 drought on vegetation growth and terrestrial carbon balance in Southwest China. Agric. For. Meteorol. 2019, 269–270, 239–248. [Google Scholar] [CrossRef]
  19. Huang, Y.F.; Ng, J.L.; Fung, K.F.; Weng, T.K.; AlDahoul, N.; Ahmed, A.N.; Sherif, M.; Chaplot, B.; Chong, K.L.; Elshafie, A. Space–time heterogeneity of drought characteristics in Sabah and Sarawak, East Malaysia: Implications for developing effective drought monitoring and mitigation strategies. Appl. Water Sci. 2023, 13, 205. [Google Scholar] [CrossRef]
  20. Chong, K.L.; Huang, Y.F.; Koo, C.H.; Najah Ahmed, A.; El-Shafie, A. Spatiotemporal variability analysis of standardized precipitation indexed droughts using wavelet transform. J. Hydrol. 2022, 605, 127299. [Google Scholar] [CrossRef]
  21. Mupepi, O.; Matsa, M.M. A combination of vegetation condition index, standardized precipitation index and human observation in monitoring spatio-temporal dynamics of drought. A case of Zvishavane District in Zimbabwe. Environ. Dev. 2023, 45, 100802. [Google Scholar] [CrossRef]
  22. Bento, V.A.; Gouveia, C.M.; DaCamara, C.C.; Libonati, R.; Trigo, I.F. The roles of NDVI and Land Surface Temperature when using the Vegetation Health Index over dry regions. Glob. Planet. Chang. 2020, 190, 103198. [Google Scholar] [CrossRef]
  23. Wang, Q.; Liu, X.; Wang, Z.Y.; Zhao, L.; Zhang, Q.P. Time scale selection and periodicity analysis of grassland drought monitoring index in Inner Mongolia. Glob. Ecol. Conserv. 2022, 36, e02138. [Google Scholar] [CrossRef]
  24. Duo, A.; Zhao, W.J.; Qu, X.Y.; Jing, R.; Xiong, K. Spatio-temporal variation of vegetation coverage and its response to climate change in North China plain in the last 33 years. Int. J. Appl. Earth Obs. 2016, 53, 103–117. [Google Scholar]
  25. Zhao, J.; Huang, S.; Huang, Q.; Wang, H.; Leng, G.; Fang, W. Time-lagged response of vegetation dynamics to climatic and teleconnection factors. Catena 2020, 189, 104474. [Google Scholar] [CrossRef]
  26. Kong, D.; Miao, C.; Wu, J.; Zheng, H.; Wu, S. Time lag of vegetation growth on the Loess Plateau in response to climate factors: Estimation, distribution, and influence. Sci. Total Environ. 2020, 744, 140726. [Google Scholar] [CrossRef] [PubMed]
  27. Wen, Y.; Liu, X.; Xin, Q.; Wu, J.; Xu, X.; Pei, F.; Li, X.; Du, G.; Cai, Y.; Lin, K.; et al. Cumulative Effects of Climatic Factors on Terrestrial Vegetation Growth. J. Geophys. Res. Biogeosci. 2019, 124, 789–806. [Google Scholar] [CrossRef]
  28. Yuan, Y.; Bao, A.; Jiapaer, G.; Jiang, L.; De Maeyer, P. Phenology-based seasonal terrestrial vegetation growth response to climate variability with consideration of cumulative effect and biological carryover. Sci. Total Environ. 2022, 817, 152805. [Google Scholar] [CrossRef]
  29. Shi, S.; Wang, P.; Zhang, Y.; Yu, J. Cumulative and time-lag effects of the main climate factors on natural vegetation across Siberia. Ecol. Indic. 2021, 133, 108446. [Google Scholar] [CrossRef]
  30. Xie, F.; Fan, H. Deriving drought indices from MODIS vegetation indices (NDVI/EVI) and Land Surface Temperature (LST): Is data reconstruction necessary? Int. J. Appl. Earth Obs. 2021, 101, 102352. [Google Scholar] [CrossRef]
  31. Kuri, F.; Murwira, A.; Murwira, K.S.; Masocha, M. Predicting maize yield in Zimbabwe using dry dekads derived from remotely sensed Vegetation Condition Index. Int. J. Appl. Earth Obs. 2014, 33, 39–46. [Google Scholar] [CrossRef]
  32. Wang, S.N.; Li, R.P.; Wu, Y.J.; Zhao, S.X. Vegetation dynamics and their response to hydrothermal conditions in Inner Mongolia, China. Glob. Ecol. Conserv. 2022, 34, e02034. [Google Scholar] [CrossRef]
  33. Wei, P.; Xu, L.; Pan, X.B.; Hu, Q.; Li, Q.Y.; Zhang, X.T.; Shao, C.X.; Wang, C.C.; Wang, X.X. Spatio-temporal variations in vegetation types based on a climatic grassland classification system during the past 30 years in Inner Mongolia, China. Catena 2020, 185, 104298. [Google Scholar] [CrossRef]
  34. Cai, S.H.; Song, X.N.; Hu, R.H.; Leng, P.; Li, X.T.; Guo, D.; Zhang, Y.N.; Hao, Y.B.; Wang, Y.F. Spatiotemporal characteristics of agricultural droughts based on soil moisture data in Inner Mongolia from 1981 to 2019. J. Hydrol. 2021, 603, 127104. [Google Scholar] [CrossRef]
  35. Kang, Y.; Guo, E.L.; Wang, Y.F.; Bao, Y.L.; Bao, Y.H.; Mandula, N.; Runa, A.; Gu, X.L.; Jin, L. Characterisation of compound dry and hot events in Inner Mongolia and their relationship with large-scale circulation patterns. J. Hydrol. 2022, 612, 128296. [Google Scholar] [CrossRef]
  36. Albarakat, R.; Le, M.H.; Lakshmi, V. Assessment of drought conditions over Iraqi transboundary rivers using FLDAS and satellite datasets. J. Hydrol. Reg. Stud. 2022, 41, 101075. [Google Scholar] [CrossRef]
  37. Wang, F.; Lai, H.X.; Li, Y.B.; Feng, K.; Tian, Q.Q.; Guo, W.X.; Zhang, W.J.; Di, D.Y.; Yang, H.B. Dynamic variations of terrestrial ecological drought and propagation analysis with meteorological drought across the mainland China. Sci. Total Environ. 2023, 896, 165314. [Google Scholar] [CrossRef]
  38. Vicente-Serrano, S.M.; Beguería, S.; López-Moreno, J.I. A multiscalar drought index sensitive to global warming: The Standardized Precipitation Evapotranspiration Index. J. Clim. 2010, 23, 1696–1718. [Google Scholar] [CrossRef]
  39. Ji, B.W.; Qin, Y.B.; Zhang, T.B.; Zhou, X.B.; Yi, G.H.; Zhang, M.T.; Li, M.L. Analyzing driving factors of drought in growing season in the Inner Mongolia based on Geodetector and GWR models. Remote Sens. 2022, 14, 6007. [Google Scholar] [CrossRef]
  40. Kogan, F.; Salazar, L.; Roytman, L. Forecasting crop production using satellite-based vegetation health indices in Kansas, USA. Int. J. Remote Sens. 2012, 33, 2798–2814. [Google Scholar] [CrossRef]
  41. Verbesselt, J.; Hyndman, R.; Newnham, G.; Culvenor, D. Detecting trend and seasonal changes in satellite image time series. Remote Sens. Environ. 2010, 114, 106–115. [Google Scholar] [CrossRef]
  42. Hamed, K.H.; Ramachandra Rao, A. A modified Mann-Kendall trend test for autocorrelated data. J. Hydrol. 1998, 204, 182–196. [Google Scholar] [CrossRef]
  43. Wang, F.; Wang, Z.M.; Yang, H.B.; Di, D.Y.; Zhao, Y.; Liang, Q.H.; Hussain, Z. Comprehensive evaluation of hydrological drought and its relationships with meteorological drought in the Yellow River basin, China. J. Hydrol. 2020, 584, 124751. [Google Scholar] [CrossRef]
  44. Li, C.; Chen, J.; Wu, X.; Zhou, M.; Wei, Y.; Liu, Y.; Liu, L.; Peng, L.; Dou, T.; Li, L. Persistent effects of global warming on vegetation growth are regulated by water in China during 2001–2017. J. Clean. Prod. 2022, 381, 135198. [Google Scholar] [CrossRef]
  45. Wang, S.N.; Li, R.P.; Wu, Y.J.; Zhao, S.X. Effects of multi-temporal scale drought on vegetation dynamics in Inner Mongolia from 1982 to 2015, China. Glob. Ecol. Indic. 2022, 136, 108666. [Google Scholar] [CrossRef]
  46. Javed, T.; Li, Y.; Rashid, S.; Li, F.; Hu, Q.Y.; Feng, H.; Chen, X.G.; Ahmad, S.; Liu, F.G.; Pulatov, B. Performance and relationship of four different agricultural drought indices for drought monitoring in China’s mainland using remote sensing data. Sci. Total Environ. 2021, 759, 143530. [Google Scholar] [CrossRef]
  47. Accadia, C.; Mariani, S.; Casaioli, M.; Lavagnini, A.; Speranza, A. Sensitivity of precipitation forecast skill scores to bilinear interpolation and a simple nearest-neighbor average method on high-resolution verification grids. Weather Forecast. 2003, 18, 918–932. [Google Scholar] [CrossRef]
  48. Wang, Y.F.; Liu, G.X.; Guo, E.L. Spatial distribution and temporal variation of drought in Inner Mongolia during 1901–2014 using Standardized Precipitation Evapotranspiration Index. Sci. Total Environ. 2019, 654, 850–862. [Google Scholar] [CrossRef]
  49. Zeng, J.Y.; Zhang, R.R.; Qu, Y.P.; Bento, V.A.; Zhou, T.; Lin, Y.H.; Wu, X.P.; Qi, J.Y.; Shui, W.; Wang, Q.F. Improving the drought monitoring capability of VHI at the global scale via ensemble indices for various vegetation types from 2001 to 2018. Weather Clim. Extrem. 2022, 35, 100412. [Google Scholar] [CrossRef]
  50. Zhan, C.; Liang, C.; Zhao, L.; Jiang, S.Z.; Niu, K.J.; Zhang, Y.L. Drought-related cumulative and time-lag effects on vegetation dynamics across the Yellow River Basin, China. Ecol. Indic. 2022, 143, 109409. [Google Scholar] [CrossRef]
  51. Wang, H.S.; Vicente-serrano, S.M.; Tao, F.L.; Zhang, X.D.; Wang, P.X.; Zhang, C.; Chen, Y.Y.; Zhu, D.H.; Kenawy, A.E. Monitoring winter wheat drought threat in Northern China using multiple climate-based drought indices and soil moisture during 2000–2013. Agric. Forest Meteorol. 2016, 228–229, 1–12. [Google Scholar] [CrossRef]
  52. Yang, S.K.; Liu, J.; Wang, C.H.; Zhang, T.; Dong, X.H.; Liu, Y.L. Vegetation dynamics influenced by climate change and human activities in the Hanjiang River Basin, central China. Ecol. Indic. 2022, 145, 109586. [Google Scholar] [CrossRef]
  53. Sun, H.; Xu, Z.H.; Liu, H. An evaluation of the response of vegetation greenness, moisture, fluorescence, and temperature-based remote sensing indicators to drought stress. J. Hydrol. 2023, 625, 130125. [Google Scholar] [CrossRef]
  54. Huang, F.X.; Liu, L.L.; Gao, J.B.; Yin, Z.Y.; Zhang, Y.B.; Jiang, Y.; Zuo, L.Y.; Fang, W.G. Effects of extreme drought events on vegetation activity from the perspectives of meteorological and soil droughts in southwestern China. Sci. Total Environ. 2023, 903, 166562. [Google Scholar] [CrossRef] [PubMed]
  55. Liu, Y.; Ding, Z.; Chen, Y.N.; Yan, F.Q.; Yu, P.J.; Man, W.D.; Liu, M.Y.; Li, H.; Tang, X.G. Restored vegetation is more resistant to extreme drought events than natural vegetation in Southwest China. Sci. Total Environ. 2023, 866, 161250. [Google Scholar] [CrossRef] [PubMed]
Figure 1. Geographical scope and sub-zone in the IM.
Water 15 03882 g001
Figure 2. Segmented trend and mutation identification of SPEI sequence in the IM and its subregions based on the BFAST. (ad) represent segmented trend and mutation on the IM, DV, FV, and GV, respectively.
Water 15 03882 g002
Figure 3. Spatial distribution of the PTIM-based gridded trend characteristics of SPEI on seasonal scales in the IM from 1982 to 2020. (ad) represent the spatial distribution of Z values on spring, summer, autumn and growing season, respectively.
Water 15 03882 g003
Figure 4. Segmented trend and mutation identification of VHI sequence in the IM and its subregions based on the BFAST. (ad) represent segmented trend and mutation on the IM, DV, FV, and GV, respectively.
Water 15 03882 g004
Figure 5. Spatial distribution of the PTIM-based gridded trend characteristics of VHI on seasonal scales in the IM from 1982 to 2020. (ad) represent the spatial distribution of Z values on spring, summer, autumn and growing season, respectively.
Water 15 03882 g005
Figure 6. Correlations of SPEI with VHI in different periods. (ad) represent the spatial distribution of r values on spring, summer, autumn and growing season, respectively.
Water 15 03882 g006
Figure 7. Correlations of SPEI with VHI in different time scales. (ad) represent the spatial distribution of r values between 1-month SPEI, 3-month SPEI, 6-month SPEI, 12-month SPEI and VHI, respectively.
Water 15 03882 g007
Figure 8. Impact of meteorological drought events on vegetation growth. (a) Represents the changes in the SMD and the SVG. (b) Represents the distribution of SMD and SVG under different types of meteorological drought events.
Water 15 03882 g008
Figure 9. Contribution rate of climate factors to vegetation growth in the IM. (af) denote the contribution rate of AH, AT, ET, P, SM and ST, respectively, (g) denotes the maximum contribution rate, and (h) denotes the key driving factors.
Water 15 03882 g009
Figure 10. Box plots of the contribution rate in the IM and different subregions. (ad) Represent the IM, DV, FV, and GV, respectively.
Water 15 03882 g010
Table 1. BFAST-based segment trend and mutation point of SPEI in each region.
RegionSegment 1Segment 2Mutation PointTrend Type
IM+Interrupted decrease
DV+Increase to decrease
FV+Decrease to increase
GV+Interrupted decrease
Table 2. Bfast-based segment trend and mutation point of VHI in each region.
RegionSegment 1Segment 2Mutation PointTrend Type
IM+Interrupted decrease
DV+Interrupted decrease
FV+Interrupted decrease
GV+Interrupted decrease
Table 3. Top 10 meteorological drought events by severity.
Event NumberDateDDSMDPSMD
M161999.05–1999.1285.8690.958
M222005.07–2006.0175.6461.259
M11982.07–1982.1263.5840.710
M91991.08–1992.0163.3770.704
M202004.03–2004.0973.3390.633
M172000.07–2000.1263.0980.673
M192002.08–2003.0163.0160.784
M262010.07–2010.1152.7280.900
M252009.04–2009.0852.4480.794
M151997.04–1997.0742.0520.859
Disclaimer/Publisher’s Note: The statements, opinions and data contained in all publications are solely those of the individual author(s) and contributor(s) and not of MDPI and/or the editor(s). MDPI and/or the editor(s) disclaim responsibility for any injury to people or property resulting from any ideas, methods, instructions or products referred to in the content.

