Article

Modeling Morphodynamic Impacts and Optimization of Marine Hydrokinetic Arrays in Shallow Offshore Environments

by
Hanieh Moghadam
1,† and
Alejandra C. Ortiz
2,*,†
1
Department of Civil, Construction, and Environmental Engineering, North Carolina State University, Raleigh, NC 27695, USA
2
Environmental Studies, Colby College, Waterville, ME 04358, USA
*
Author to whom correspondence should be addressed.
These authors contributed equally to this work.
Water 2023, 15(22), 3884; https://doi.org/10.3390/w15223884
Submission received: 6 July 2023 / Revised: 23 October 2023 / Accepted: 3 November 2023 / Published: 7 November 2023
(This article belongs to the Section Water Erosion and Sediment Transport)

Abstract

:
Marine hydrokinetic (MHK) devices hold the promise of expanding renewable energy production by tapping into the power of waves and currents for electricity generation. However, these devices remain in the developmental stage, necessitating research to understand their environmental impacts, lower operational costs, and prevent equipment failures. In this study, we investigate various MHK array configurations to gain insights into their effects on wave patterns, water flow, and sediment conditions, considering both short-term and long-term morphodynamic changes under average and extreme conditions in shallow offshore environments. Our objectives encompass understanding the influence of mean and extreme environmental conditions on MHK devices, evaluating their impact on the bathymetry of the ocean floor, and exploring the role of different array configurations in morphodynamic evolution. Our findings, based on modeling these devices as static lumps, reveal that sediment erosion downstream of MHKs increases by 50% after one year of average conditions. When accounting for the absorption of 30% of the energy by MHK devices, downstream sediment deposition surges by almost 125%. Moreover, alterations in MHK arrays, such as spacing, size, and number, result in noticeable changes in sedimentation magnitudes during storm conditions. While long-term mean wave conditions have minimal effects on sedimentation, extreme wave conditions, akin to large storm events, bring about significant alterations in ocean floor bathymetry, potentially leading to costly maintenance of the MHK arrays. Our research provides a valuable framework for site analysis, enabling the estimation of maintenance needs and the optimization of array configurations to minimize sedimentation-related issues.

1. Introduction

Ocean energy, a promising renewable resource, is harnessed via marine hydrokinetic (MHK) technologies in regions with rapid tidal flow, substantial wave heights, and consistent currents, such as North America [1], particularly the United States, which boasts abundant hydroelectric energy resources and relevant technologies for energy extraction [2]. However, the near- and far-field hydrodynamic and morphodynamic impacts of MHK technology remain incompletely understood. Investigating the local morphological changes resulting from MHK device deployment necessitates comprehensive assessments involving field tests, laboratory experiments, and numerical analyses. Numerical simulation, being a relatively swift, safe, and cost-effective method, proves invaluable for assessing the effects of varying MHK parameters. In this study, we employ the hydrodynamic and morphodynamic numerical model, Delft3D, along with its coupled wave module, SWAN, to investigate the morphological alterations of the shallow ocean floor in response to bed-mounted MHK arrays.

2. Background

2.1. MHK Types and Hydrodynamic Impacts

Within MHK energy technology systems, water’s kinetic energy propels a generator, transforming mechanical energy into clean, renewable electricity [3]. These technologies primarily harness three key resources: tidal streams, ocean currents, and ocean waves. The former two are current-based, often referred to as Current Energy Converters (CECs), while the latter, wave-based, is known as Wave Energy Converter (WEC) hydrokinetic power. Both CECs and WECs offer a diverse array of configurations, design sizes, electrical generation capacities, and foundation types [4,5]. Some CEC designs bear a resemblance to conventional small-scale sub-aqueous wind turbines, boasting efficiency levels between 50% and 59%, while certain WEC devices exhibit estimated efficiencies surpassing 70% [6]. It is important to note that all MHK devices influence their surrounding environment, impacting hydrodynamic conditions and local morphology. The dimensions of the device, along with its energy dissipation rate, wield direct influence over near-field hydrodynamics and sediment transport. The numerical simulations and analyses of hydrodynamic and morphodynamic responses vary in accordance with the specific device and array characteristics. In the following sections, we will review the most common approaches found in prior studies.
Owing to the limited deployment of devices in the United States, prior studies have predominantly consisted of either laboratory-based experimental tests or numerical simulations [7]. In our review, we will primarily focus on similar numerical simulations. Within these numerical models, the device is typically represented as an energy absorption object, with its physical structure often omitted within the model domain [8,9,10,11].
Ahmadian et al. [8] delved into the far-field hydrodynamic consequences of tidal stream turbines by adapting a depth-integrated 2D hydrodynamic model. In their study, the tidal turbines were characterized both as a structural drag force and in terms of the reaction of turbine-induced thrust in shallow water momentum equations. Their findings indicated that alterations in the water level were minimal, but substantial shifts in flow velocity were observed. These shifts were notable within a 5 km upstream range, a 500 m downstream area, and within the array itself, showcasing reductions in velocity exceeding 25%.
In the study by Nash et al. [12], the authors optimized array layouts by representing turbines as momentum sinks, akin to the approach by Ahmadian et al. [8], who integrated turbine thrust and structural drag terms into directional momentum equations. They systematically evaluated optimal turbine spacing in multi-row arrays to enhance energy extraction. Their methodology involved employing an extension of the multi-scale nested model to calculate water surface velocity and depth-averaged velocities through the solution of continuity and momentum equations. Their results revealed that a staggered array configuration effectively mitigated the wake interference from neighboring turbines, optimizing energy extraction with recommended cross-stream and along-stream spacings of three to four rotor diameters and one to four rotor diameters, respectively. Notably, both studies focused on energy extraction from the flow without considering the flow direction and device efficiency, a methodology well-recognized among researchers, including Plew and Stevens [13] and Fallon et al. [14]. In contrast to our investigation, these studies solely accounted for the impact of turbines on the system’s energy through thrust and drag forces, overlooking their structural presence on the seabed. Incorporating this structural element has a significant impact on all friction terms, yielding a more realistic response.
The choice of method for incorporating hydrokinetic devices into flow simulations plays a critical role in accurately representing these devices within the model. A comparative analysis of different approaches for incorporating momentum sinks derived from Marine Hydrokinetic (MHK) technologies in Delft3D-FLOW revealed that utilizing an actuator disc tool (based on the Momentum Actuator Disc) produced more realistic far-field flow velocities than the Porous Plate tool. In both methods, the estimation of momentum loss terms relies on the thrust coefficient of the turbines, as established by Ramos [10]. In our investigation, we consider the impact of these devices on momentum due to their physical presence as non-erodible seabed protrusions, which represents a novel and distinct perspective in this context.
In addition to incorporating these devices into momentum equations, it is essential to account for the effects of Marine Hydrokinetic Devices (MHKs) on wave conditions and, consequently, the resulting wave-current interactions. A study conducted by Li et al. [15] addressed this by utilizing the OBSTACLE feature within the wave model in FVCOM-SWAN to simulate wave energy dissipation within the MHK array. This feature allows for the representation of obstacles as lines, each assigned a specific transmission coefficient ( K t ), defined as the downstream significant wave height relative to the upstream significant wave height. Using a constant transmission coefficient of 0.98, their findings demonstrated a 3% reduction in local wave height.
The inclusion of wave energy dissipation terms in the governing equations has a more pronounced hydrodynamic impact when modeling Wave Energy Converters (WECs) in comparison to tidal turbines. This influence can obscure signals related to bathymetric effects, yet a comprehensive consideration of both effects, including wave energy dissipation and friction, yields a more accurate representation of these devices. In prior research, the SWAN OBSTACLE transmission coefficient for modeling WEC arrays was established at 0.76, signifying a 24% energy dissipation from the incident waves, as documented by Abanades [16] and Bergillos [17]. Sandia National Laboratories introduced SNL-SWAN (Sandia National Laboratories—Simulating WAves Nearshore), a modified version of SWAN, allowing for comparisons between constant wave transmission coefficients and frequency-dependent coefficients. As observed in this study [11], the adoption of frequency-dependent coefficients resulted in a notable reduction of wave heights by up to 30% in the presence of various WEC arrays.
The methods employed in Computational Fluid Dynamics for simulating energy extraction by Marine Hydrokinetic Devices (MHKs) encompass the incorporation of momentum sink terms, augmentation of bed roughness, and wave energy dissipation. Among these techniques, momentum sink terms exhibited a dominant influence on hydrodynamic conditions when modeling Current Energy Conversion (CEC) devices. Conversely, in the context of modeling Wave Energy Conversion (WEC) devices, the removal of wave energy from the system exerted a proportionally greater impact on flow characteristics. Notably, a common limitation in these studies involved the omission of the physical structures of the turbines in simulations, which could potentially compromise result accuracy. Subsequently, the following section provides a review of studies that delve into alterations in near-field hydrodynamic characteristics, exploring sediment deposition and erosion patterns.

2.2. MHK Morphodynamic Impacts

The presence of Marine Hydrokinetic (MHK) devices induces changes in hydrodynamic conditions, affecting bed shear stress, and subsequently influencing sediment transport, both in near-field and far-field environments. Prior investigations have examined the morphological responses to MHK devices and arrays, employing both experimental [18] and numerical [19,20] approaches.
Neill et al. [21] were among the earliest investigators of the influence of Tidal Energy Converters (TECs) on morphodynamic evolution. They developed a 1D morphologic model for the Bristol Channel, employing the continuity equation, the Soulsby-Van Rijn sediment transport method [22,23,24], and the Exner Equation. Their findings indicated that tidal energy extraction could be effectively represented as heightened bed friction, potentially resulting in a 20% increase in the magnitude of bed level fluctuations within estuarine systems. This seminal research sparked a burgeoning interest in exploring the morphodynamic impact of TECs, a trend that has since extended to investigations in both coastal and fluvial systems [19,20].
In their research, Robins et al. [20] assessed the effects of energy absorption by tidal turbines on sedimentation. They utilized an unstructured morphodynamic and hydrodynamic model, specifically the TELEMAC Modelling System V6.1 [25] and the SWAN wave model, simulating the Irish Sea. Their findings revealed that the installation of Marine Hydrokinetic (MHK) arrays comprising 20 devices resulted in a marginal reduction in local flow velocity, bed shear stress, and bed load transport, estimated at approximately 2–3%. When comparing these outcomes to the modeled natural variability of morphology, the impact of energy absorption on sedimentation was deemed insignificant for smaller arrays. It is noteworthy that, unlike our study, their investigation did not consider the influence of device support structures, and each device’s presence was solely represented by the amount of energy absorbed.
Previous research investigating energy extraction from tidal turbines and its influence on sediment transport patterns has observed a reduction in bed shear stress, the primary driver of sediment transport [26]. This reduction has been reported to reach up to 7.5 Nm−2 in the proximity of the turbine array [27,28]. In the study conducted by Haverson et al. [27], a tidal turbine array composed of nine converters was simulated using the Telemac2D hydrodynamic model. They introduced thrust and drag forces into the momentum equation, and their results indicated that the reduction in near-field bed shear stress extended up to 12 km from the array, leading to increased local sediment deposition. Martin-Short et al. [26] employed a Computational Fluid Dynamics model, Fluidity, to model tidal arrays with varying numbers of turbines. Their findings demonstrated a notable alteration in local sediment transport patterns, particularly when utilizing arrays with a high number of turbines, where mean bed shear stress was impacted, resulting in the accumulation of fine gravel and sand, particularly within the array. This emphasizes the critical importance of accurately modeling the physical presence of the devices in high-density arrays, a factor that has often been overlooked in prior studies.
Auguste et al. [29] conducted a comprehensive study involving the development of 2D and 3D sediment transport models, examining the presence and absence of tidal turbines to gain a deeper understanding of sediment interactions within tidal farms. These models were implemented using the MIKE21/3 software from DHI, and sediment transport rates were computed utilizing the formulations by Engelund and Fredsøe (EF) and Van Rijn (VR), under both equilibrium and non-equilibrium conditions. The tidal turbines were represented within the model as sub-grid objects, with their impact on hydrodynamics incorporated based on actuator disc theory. Following a four-day model run, the researchers observed that bed level changes associated with the EF approach were lower than those in the case of the VR Non-Equilibrium formulae, particularly when current speeds were less than 1.54 m/s. Notably, the study did not explore the impact of the turbines’ presence on bed level when they were not operational. Similarly, in a fluvial environment Musa et al. [30], physical modeling was employed within a flume to simulate the potential influence of Marine Hydrokinetic Devices (MHKs) on river system morphodynamics. Their work unveiled that the placement of MHKs led to heightened scour and deposition patterns akin to those observed around bridge piers, and this placement triggered both local and far-field morphodynamic instabilities.
Our contributions in this study are: (1) Developing equilibrium bathymetry under mean wave conditions. (2) Investigation of local morphologic response to MHK array emplacement under storm and mean wave conditions while the devices are statically represented as non-erodible bathymetric bumps. (3) Accounting for the devices’ energy absorption individually in the numerical modeling under storm and mean wave conditions. (4) Investigation of the sensitivity of sediment transport to the array characteristics: size, spacing, and the number of the devices. (5) Providing a systematic approach for site analysis to evaluate the potential impacts of MHKs on the surrounding ocean morphology. This approach aids in optimizing MHK arrays to mitigate potential scour or burial caused by sediment, thereby reducing maintenance concerns in both storm and mean wave conditions.

3. Methods

The coastal region of North Carolina has been recognized as a promising site for harnessing both wave and current energy, thus serving as an idealized test case for our study. We began by conducting an analysis of the Wave Information Studies (WIS) data to assess the extreme and mean wave climate off the Atlantic Coast of North Carolina. Subsequently, we created a numerical simulation using Delft3D and derived the equilibrium bathymetry as the initial phase of our modeling. In the final stage, we strategically emplaced Marine Hydrokinetic (MHK) devices on the equilibrium bed level, previously determined in the modeling process, and examined the hydrodynamic and subsequent morphodynamic responses to the presence of these devices.

3.1. Wave Climate Analyses

To simulate the wave climate off the coast of North Carolina, we conducted an analysis of 34 years’ worth of hindcasted wave data. These data were sourced from the Wave Information Studies (WIS) database provided by the US Army Corps and spanned the North Carolina coastal region, serving as a basis for estimating both mean and extreme wave conditions to serve as boundary conditions for our idealized model. We identified and selected five virtual WIS buoys for data extraction (Figure 1), focusing on the significant wave height ( H s ) and peak period ( T p ) time series. After back-shoaling to deep water and accounting for refraction, we computed the mean and storm conditions at each selected site. The extreme storm wave height ( H 3 σ ) was determined as wave heights exceeding 99.96% of the time series, representing extreme storm conditions [31]. Our analysis revealed that mean wave conditions were characterized by wave heights of  1.5 ± 0.1  m with periods of  8 ± 0.2  s, while major storm events were associated with wave heights of  6 ± 0.6  m and periods of  13 ± 0.7  s (Table 1). These mean wave conditions were utilized to derive equilibrium bathymetry, while the  H 3 σ  data were employed to drive our numerical modeling, facilitating a comprehensive understanding of the morphological impact of major storm events on the vicinity of the Marine Hydrokinetic (MHK) devices.

3.2. Numerical Model

To comprehensively assess the short-term and long-term efficiency of bed-mounted Marine Hydrokinetic (MHK) devices and their consequential impacts on local morphology, we developed an idealized numerical model aimed at predicting sediment transport patterns in the vicinity of these structures. In this study, we employed Delft3D, a coupled hydrodynamic and morphodynamic model [32], well-recognized for its utility in comprehending long-term coastal evolution [33,34]. Delft3D employs a finite difference method to solve the shallow water equations on a structured grid. Prior research has effectively applied Delft3D to examine responses of shorefaces to submerged breakwaters at varying offshore distances and to distinguish between erosive and accretionary breakwaters [35]. For this investigation, we coupled the Delft3D wave module, SWAN, with the hydrodynamic and morphodynamic modules to comprehensively examine the morphological response of the ocean bed to MHK devices. This thorough investigation of sediment transport processes surrounding bed-mounted MHK devices significantly enhances our understanding of their potential survivability and efficiency during deployment. Additionally, it provides valuable insights for estimating maintenance costs under varying site conditions and facilitates the optimization of MHK array design to minimize potential issues related to burial or scour around the devices.
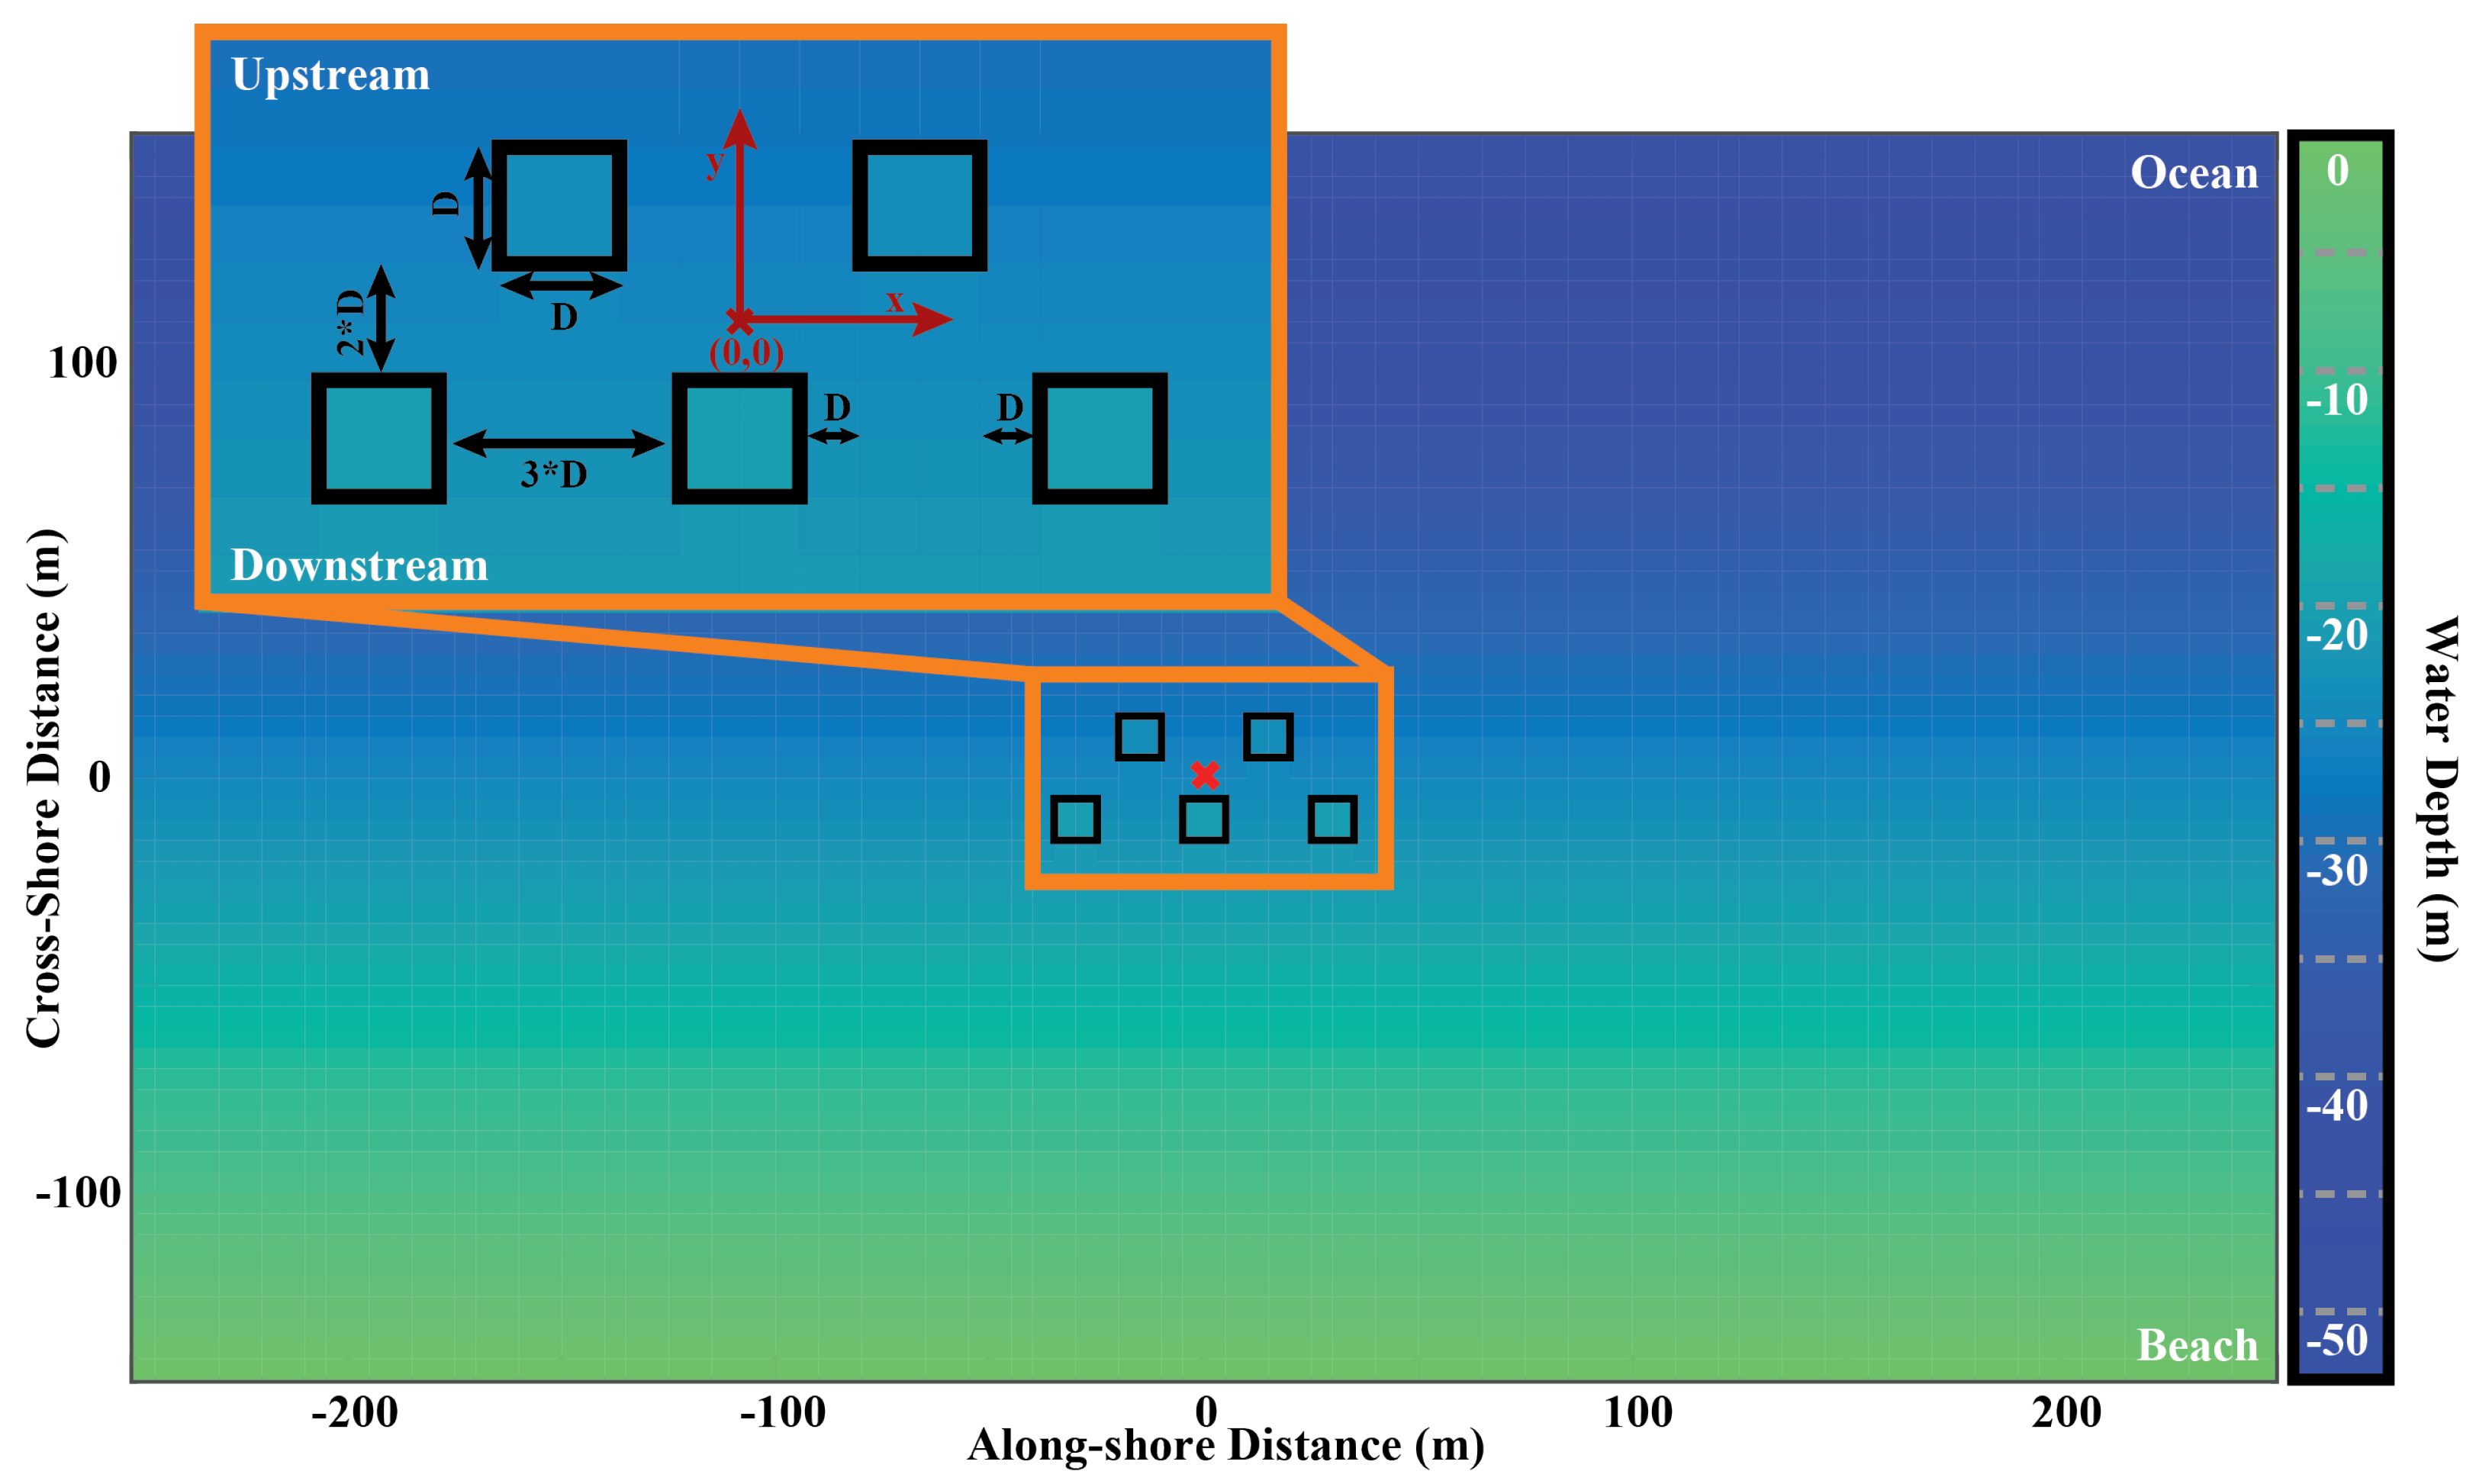
Our model offers fine-resolution characterization of behavior in the near-field, which extends within a radius of 15 diameters around the Marine Hydrokinetic (MHK) devices. Simultaneously, it accurately depicts the far-field shoaling of waves by incorporating local grid refinements, achieving an increased resolution (0.5 m) in the immediate vicinity of the devices, while maintaining a coarser resolution (5 m) in the far field. The grid encompasses a spatial extent of 500 m × 300 m, extending from offshore depths exceeding 50 m and gradually shallowing towards the shoreline. The simplified representation of the MHK structure assumes the form of a 2 m × 2 m box positioned 1.5–2 m below the sediment surface and elevated 1.5–2 m above the sediment surface in water depths of approximately 22 m (Figure 2). Within the Delft3D model, this structure is realized as a non-erodible sediment section within a 10 m deep layer of erodible, non-cohesive medium-sized sand. To enhance model efficiency, we employed a single grain size of 300 mm D50 grain size, characterized by a critical shear stress of 0.2 Nm−2.

3.3. Equilibrium Shoreface Bathymetry

To comprehensively model the sediment dynamics response to MHK devices, it is essential to first investigate the system’s reaction to the mean wave climate. To assess the devices’ influence on wave climate and sediment transport under extreme conditions, we initiated the process by establishing equilibrium bathymetry under the mean wave climate. Achieving morphodynamic equilibrium involves a gradual adjustment of the bed level and associated hydrodynamics that govern sediment transport processes [36]. In this endeavor, we conducted a model simulation employing initially linearly sloped bathymetry under mean wave conditions characterized by a significant wave height ( H s ) of 1.5 m and a peak period ( T p ) of 8 s, extending over a period of 7 days. To enhance computational efficiency while preserving accuracy, we incorporated the Morphodynamic Acceleration Factor (MORFAC) of 50 into our modeling framework. MORFAC is a widely employed tool designed to expedite morphodynamic computations and amplify bed level changes [32,33]. The MORFAC approach entails the multiplication of the bathymetry values computed after each hydrodynamic time step by a factor ( 50 × 7   days  equivalent to 350 morphodynamic days but only 7 hydrodynamic days), producing an upscaled bed level that is employed in the subsequent hydrodynamic steps [34]. The application of a MORFAC value greater than 1 is a common practice in morphodynamic modeling, offering a balance between computational efficiency and the accurate representation of shoreface evolution [37].
Following an extensive 300-day model run, we observed that no discernible changes in erosion or deposition occurred in areas with water depths exceeding 30 m. However, in shallower regions, bathymetric adjustments relative to the initial linear bathymetry exhibited notable variations, ranging from 3 m of erosion to 2 m of deposition. To assess the quantity of sediment deposited or eroded around the proposed MHK deployment site at a depth of approximately 20 m, we evaluated the slope within a distance of 5–20 m (perpendicular to the coastline) at this specific water depth. The slope progressively increased from the initial 10-degree linear slope embedded in the simulation (Figure 3A). Nevertheless, the rate of the slope change in the vicinity of our designated MHK location remained quite modest (< 3.6 × 10 5 m m ) and gradually approached asymptotic levels, nearing zero, after 150 days (Figure 3B). Consequently, the bathymetry following 150 days of exposure to mean wave conditions was deemed the equilibrium bathymetry, serving as the initial bathymetry for all subsequent model runs.

3.4. MHK Modeling on Equilibrium Bathymetry

We strategically positioned five Marine Hydrokinetic (MHK) devices, each with dimensions of 2 m × 2 m, in a staggered arrangement in accordance with the layout recommended by Nash et al. [12]. The spacing between these devices was set at 6 m, equivalent to three times the device diameter (3 × D), within a water depth of approximately 22 m, on the equilibrium bathymetry (Figure 4). Our model was subjected to constant offshore wave conditions, with wave heights of 6 m and periods of 13 s, along with 1.5 m and 8 s, in line with the prior assessments of  H 3 σ  and  H m  along the North Carolina coastline. For the storm scenario, MORFAC was set to 1 with a spin-up time of 1 min, the model was executed for 36 h, consistent with the typical duration of storms in the North Carolina region, which typically range from 32 to 44 h. We compared the outcomes of these scenarios with our base case, which represents the same simulation but excludes the presence of the MHK array within the model domain. The simulations were conducted using a time-step of 0.01 min, encompassing coupled interactions between waves, currents, and morphodynamic evolution, while maintaining a constant offshore wave height originating from the north (ocean side).
We conducted an in-depth analysis of all results using MATLABTM. In all presented plots, a comparative evaluation was made between the base case, which signifies the absence of Marine Hydrokinetic (MHK) devices, and the experimental scenario involving the deployment of a MHK array. Our analysis was structured into distinct sections, with the initial focus on modeling the static array structure and evaluating sedimentation response, considering the devices to be inactive (Section 4.1). Subsequently, we delved into an examination of the potential impact of MHK devices’ energy absorption efficiency and their representation within our numerical model (Section 4.2). Lastly, we conducted sensitivity tests on the numerical model concerning array layout and characteristics, which are detailed in Section 5.1 and Section 5.2.

4. Results

Commencing from the state of equilibrium bathymetry, we characterized the structures of the MHK devices as non-erodible protrusions situated on the ocean bed within the flow and morphology module of Delft3D. Additionally, the array was portrayed within the wave module of Delft3D, i.e., SWAN, through a discrete bed shoaling process due to the presence of the devices. In models featuring the static representation of the devices, no energy loss was associated with the system, akin to inactive MHK turbines, thereby not absorbing any energy. However, when the model incorporated the wave energy dissipation attributable to the turbines, we employed the OBSTACLE feature within SWAN, a methodology consistent with previous studies by Ruehl et al. [11] and Bergillos et al. [17]. This feature was configured to absorb wave energy, employing a constant transmission coefficient ( K t ) [38]. In our model, the OBSTACLE feature within SWAN for a single turbine extended for 2 m, corresponding to the width of the device. The magnitude of energy dissipation in the model was set at 30% ( K t = 0.7 ), a value that aligns closely with established findings within the literature [11,16,17].
Our analysis addresses short-term and long-term morphology responses to the presence of device structures, with a distinct examination of scenarios both without accounting for energy loss (method A and B—Figure 5 and Figure 6) and utilizing energy absorption (method C and D—Figure 7 and Figure 8). For the short-term assessment, we subjected the system to extreme wave conditions over a duration of 36 h, while the long-term case involved mean wave conditions extending across 454 days. Subsequently, we conducted investigations into MHK arrays featuring variations in device sizes, numbers, and spacings, while focusing on the near-field outcomes. To gauge the influence of an MHK array, we established a baseline scenario, denoted as the control or base case, wherein no device was present. Each experimental configuration was evaluated by expressing the model results as a percentage change relative to the corresponding base case, enabling a comprehensive assessment of the effects of MHK devices on the system’s morphology.

4.1. Morphodynamic Response to MHKs

4.1.1. Short-Term Morphologic Response

The initial approach, shown as method A (Figure 5), involves the exclusive representation of Marine Hydrokinetic (MHK) devices as stationary bed-mounted structures without any capacity for energy absorption. Figure 5 illustrates the percentage disparities in various parameters following the installation of these devices in comparison to the base case, which simulates the scenario without any devices.
For instance, Figure 5(A3) outlines the percentage change in cumulative sedimentation (erosion or deposition) observed in the vicinity of these devices, characterized by their dimensions of 2 m × 2 m × (1–2 m) (length × width × height). During a storm lasting 36 h, with significant wave heights ( H s ) of 6 m, the presence of the array’s structures leads to a reduction in significant wave height by 2–4% within 2–10 m downstream (Figure 5(A1); note that Figure 5(A1) and Figure 6(B1) share the same colorbar limits for ease of visual comparison). As a consequence, the near-bed orbital velocity and ensuing bed shear stress exhibit a noticeable decrease (Figure 5(A2)). Furthermore, the cumulative sedimentation response reveals around a 50% increase in erosion, increasing from 80 cm of erosion to 120 cm when the MHK devices are present. This heightened erosion predominantly occurs along the downstream edge of the devices, gradually tapering off approximately 10 m downstream. Conversely, on the upstream edge of the devices, cumulative erosion decreases from around 60 cm to approximately 40 cm (Figure 5(A3)).

4.1.2. Long-Term Morphologic Response

The model is executed under mean wave conditions for a duration of 1.25 years (454 days) to assess the influence of the structural presence of the MHK array on near-field morphodynamics. The introduction of the MHK array exerts a minimal effect on significant wave height and the subsequent bed shear stress, with changes amounting to less than 1%. Consequently, the near-field morphodynamic conditions do not exhibit significant alterations in the long term (Figure 6(B1–B3)). Over the course of 454 days, a net deposition of approximately 10 cm is observed downstream of the designated location for the devices. This deposition undergoes a marginal increase, on the order of millimeters, following the array’s deployment, constituting an increase in deposition of approximately 0.3% (Figure 6(B3)).
Our examination of the static modeling of the MHK array reveals that near-field morphology is notably more susceptible to alterations during a severe North Carolina (NC) storm condition, characterized by significant wave heights ( H s ) of 6 m and peak periods ( T p ) of 13 s, sustained over a 36 h period, compared to the effects observed over the course of a year under average NC wave conditions. To provide a more comprehensive morphodynamic analysis, we further explored the array’s impact on local bed levels, taking into account energy dissipation due to MHK energy absorption.

4.2. Modeling Energy Dissipation

In this section, we represented the MHK devices on the bathymetric grid within Delft3D as non-erodible 2 m × 2 m boxes, employing the same approach as in Method A. Additionally, we incorporated these devices as OBSTACLE elements within the wave module of our model, SWAN, with a 30% energy sink. In this study, we opted to model each device’s energy loss within the array individually, in alignment with previous research [11,27,39], as opposed to treating the entire array as a collective energy absorber. Our model of energy loss resulted in a wave height reduction of over 25% downstream of the devices (Figure 7(C1)). Subsequently, bed shear stress and the cumulative sedimentation, significantly influenced by the energy absorption, exhibited notable changes (Figure 7(C2,C3)). We also conducted experiments involving energy absorption under mean wave conditions for a duration of 454 days (Figure 8).
In mean wave conditions, we observe consistent trends in wave height and bed shear stress reduction downstream of the MHK devices, driven by energy absorption (Figure 8(D1,D2)). However, when subjected to mean wave conditions over the course of a year, the energy absorption by the MHKs results in substantial, large-scale erosion around the devices. Consequently, depending on the frequency of storms, the maintenance of these devices may require a specific focus on sediment removal or the implementation of a robust anchoring mechanism to prevent scour-induced failures.
Method A, which represents the devices as static lumps, exhibited a distinct trend of slightly increased wave height (Figure 5(A1)) and bed shear stress (Figure 5(A2)) in the downstream wakes of the devices. This trend contrasted with the findings from Method C (where the devices are represented as dynamic energy sinks, as shown in Figure 7(C1,C2)) and Method D (Figure 8(D1,D2)). The increase in the wave height observed in Method A was primarily due to shoaling effects when the device was modeled solely as a static box on the seafloor, resulting in a reduction in water depth over the device compared to the surrounding ocean floor depths. However, the energy sink of the MHK array as modeled in Methods C and D significantly increased impacts on the surrounding morphology under both mean and storm conditions.

5. Discussion

In this research, we conducted a comprehensive investigation into the hydrodynamic and morphodynamic implications of various MHK arrays using the Delft3D numerical model. Initially, the devices were represented as non-erodible bed-anchored boxes, and their morphodynamic effects were examined under both extreme and mean wave conditions (Method A and B). Subsequently, we introduced the consideration of wave energy absorption, incorporating a 30% energy loss for each device in the array (Method C and D). Under storm conditions and without accounting for energy absorption (Method A), the findings indicated a 50% increase in scour downstream of the devices after a 1.5-day storm (from 0.8 m of net erosion in the base case to 1.2 m of net erosion in Method A). However, when the predominant influence of energy loss was factored in, we observed a significant enhancement of deposition and reduction in erosion downstream (from 0.8 m of net erosion in the base case to 0.2 m of net deposition in Method C). This substantial impact of energy absorption on sedimentation, especially during extreme conditions, holds the potential to mitigate maintenance costs and enhance the devices’ resilience against the forces of large waves.
In the context of prolonged mean wave conditions, our base case revealed a deposition of 10 cm at a water depth of 20 m over the course of a year. When employing the static device structures (Method B), we observed a minor decrease in deposition of 0.5% upstream of the array, accompanied by a slight increase of approximately 0.3% in deposition downstream of the array, translating to net sedimentation changes of less than 1 cm. The introduction of energy absorption in the low-energy mean conditions resulted in a substantial 25–30% reduction in bed shear stress. However, sedimentation changes relative to the base case remained negligible.

5.1. Sensitivity Analysis: Array Scale

MHK devices come in various sizes, ranging from 0.5 m to 180 m in length. In order to examine how local morphology responds to different device sizes at the array scale, we simulated an array comprising five 10 m × 10 m MHK devices with a spacing of 3 × D under storm conditions. Subsequently, we compared the results to our base case storm model (which used 2 m × 2 m MHK devices, as detailed in Section 4.2, Method C). Both the structural presence of the 10 m × 10 m devices and their energy loss were modeled and are presented in normalized forms relative to the device width (Figure 9).
The introduction of a 30% energy loss from the water column resulted in a significant impact on sedimentation. This led to a substantial increase of up to 100% in deposition downstream in the near-field and more than a 50% increase in erosion both upstream and within the array. When considering both energy absorption and structural presence, the sedimentation pattern resembled that of the base case model with smaller-sized devices (Figure 9A), but with varying magnitudes. This indicates that the sedimentation pattern is independent of the size of the MHK devices within the array, while the magnitude of erosion and deposition is influenced by the device size. Furthermore, larger MHK devices were found to affect local morphology extending closer to the coastline (up to 250 m), compared to the 50 m range observed with smaller-scale MHKs.
The sedimentation patterns in the near-field, both upstream and downstream of the MHK devices, were found to be more significantly influenced by the smaller 2 m × 2 m devices compared to the larger 10 m × 10 m devices (Figure 9A,B). This can be explained by considering the Keulegan–Carpenter number ( K C ), given by  K C = U b T D , where  U b  represents the wave-induced near-bed velocity, T is the wave period, and D is the diameter of uniformly spaced hemispheres in an infinite array. In a study by Yu et al. [40], it was demonstrated that a lower  K C  (corresponding to larger D) results in reduced flow separation and, consequently, less sedimentation impact. This explains the observed higher deposition within and around the smaller array.
Another factor to consider for larger MHK devices or devices with wider spacing is the influence of Bragg Resonance on periodically spaced perturbations of the ocean bathymetry [41]. Recent work has focused on better understanding how different topographic bedforms might be used to minimize the potential harbor resonance [42,43]. Bragg resonance is typically relevant when the wavelength of the ocean floor perturbations is approximately half the wavelength of incoming surface waves [44]. However, since our model simulation involved longer period waves (8–13 s) and relatively small MHKs (2 m × 2 m) closely spaced (i.e. 3 × D), Bragg resonance is not expected to be applicable in our scenarios. Nevertheless, it may become significant when examining specific site conditions or configurations involving differently sized MHKs.

5.2. Sensitivity Analysis: Device Number and Spacing

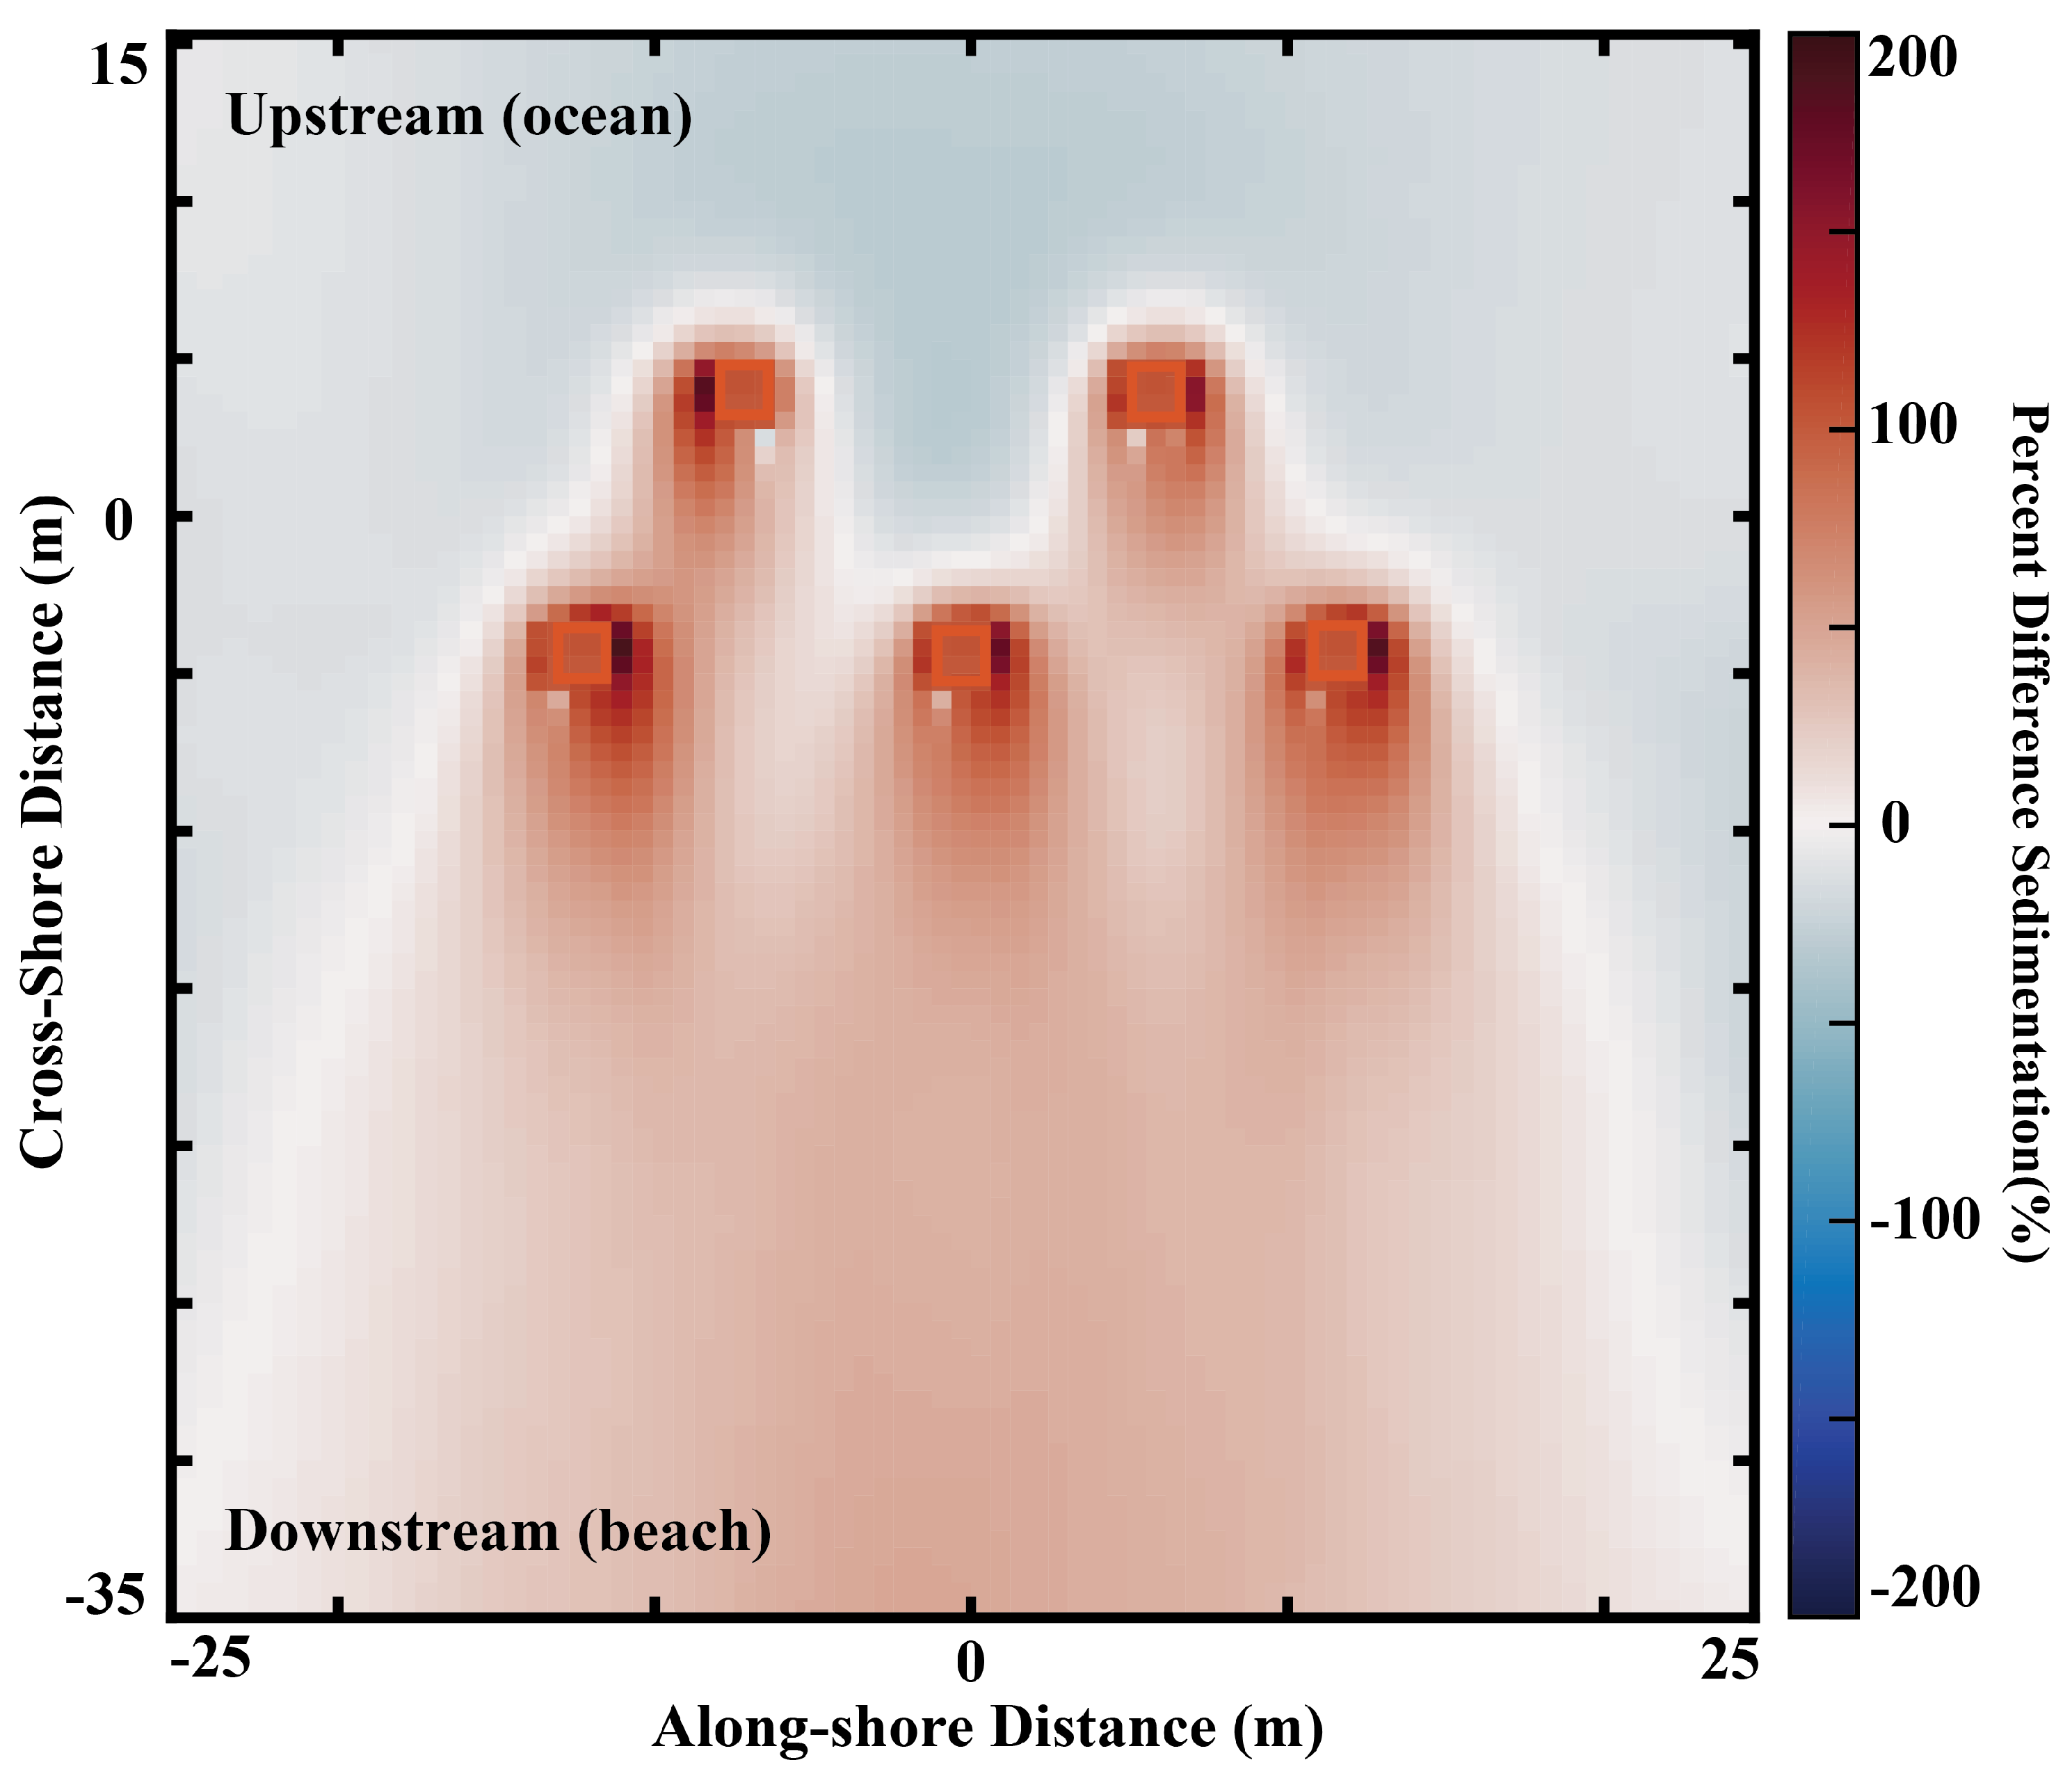
In the realm of numerical modeling, the economic feasibility of Marine Hydrokinetic (MHK) turbine deployment hinges on the configuration of multiple-device arrays [12]. The optimal number of devices in an array and their respective spacing are intrinsically linked to site-specific factors, encompassing environmental conditions, available energy resources, and the characteristics of the Wave Energy Converters (WECs) employed. In this context, we conducted a comparative analysis of sedimentation patterns within and around a larger MHK array comprising twenty-five devices, in contrast to our previous model featuring a smaller five-device array (Figure 10). Notably, the sediment transport dynamics around individually modeled devices in the larger array exhibited a consistent pattern with the small array. With both static and dynamic representations of the devices, a substantial reduction (200%) in deposition was observed around the downstream row of devices when compared to the base case. This elevated level of sediment deposition, exceeding 1.5 m, raises concerns about the potential burial of the downstream devices, particularly in extreme conditions. Consequently, this outcome may prompt emergency decision-makers to consider deactivating part or the entire array as a precautionary measure.
Upon establishing the number of devices within an array, the task of defining their optimal spacing and arrangement becomes paramount. Existing literature offers valuable insights into this aspect, proposing turbine spacings of three to four diameters for cross-stream orientation and one to four diameters for along-stream positioning [12]. Moreover, a range of spacings spanning from 0.5 × D to 6 × D has been employed in array modeling as reported by Chang et al. [45] and Fallon et al. [14]. In the course of our study, we observed that increasing the spacing from 3 × D to 5 × D led to a reduction in lateral sedimentation interactions (Figure 11). Nonetheless, it is noteworthy that the overarching sedimentation patterns remained largely unaffected by variations in device spacing during storm conditions (Figure 11). Analogous to the sedimentation dynamics behind submerged vegetation patches [46,47], it becomes evident that closely spaced MHK devices exhibit a distinctive pattern of overlapping enhanced sedimentation downstream of the devices (Figure 9A), a phenomenon conspicuously absent in the case of more widely spaced devices (Figure 11).
Lastly, our work is idealized numerical modeling, created to investigate potential impacts of Marine Hydrokinetic devices on the surrounding morphology under varying wave conditions, as well as the impact of the environment on these devices. Given the purely idealized nature of our research and the lack of a specific validation dataset, we have designed our study to focus on the theoretical understanding of the system and its implications rather than attempting direct model validation. Our primary objective is to provide insights into how MHK devices may affect their environment under different conditions. We understand that in future research, a validation dataset may be considered if available, to further enhance the reliability of our findings.

6. Conclusions

Our research leveraged a high-spatial resolution hydrodynamic and morphodynamic numerical model to comprehensively investigate the influence of marine hydrokinetic (MHK) devices on near-field sediment transport. Our approach marked a departure from prior studies by explicitly considering the physical presence of the devices in the model, affording a more holistic understanding of the array’s impact in both active and inactive states. To account for the wave energy absorption by the MHK devices, we incorporated the Delft3D wave module (SWAN) and OBSTACLE method. We also explored a range of MHK array configurations to assess the influence of each parameter on near-field morphology. The base MHK array consisted of five devices measuring 2 m × 2 m, with heights ranging from 1.5 m to 2 m, and was positioned with a spacing equivalent to three times the device’s diameter (3 × D). We conducted simulations for both static representation (non-erodible bed-mounted lumps) and dynamic representation (considering 30% energy loss) of the array, shedding light on the sensitivity of local morphology to layout characteristics. We found that:
  • Energy absorption by MHK devices exerts a notable influence on the wave field and sedimentation, with a 30% energy uptake per device resulting in an increased sediment deposition, particularly downstream of the array.
  • During extreme conditions, MHK-induced energy reduction significantly impacts the wave height and subsequent bed shear stress, altering the sedimentation pattern and leading to increased deposition around, over, and downstream of the devices.
  • The pattern of morphodynamic response remains insensitive to array configurations, but the magnitude of this response displays sensitivity to various parameters.
  • Larger arrays of turbines, such as those with 25 devices, are more susceptible to burial and instability for devices positioned downstream, especially during extreme events.
  • Our study underscores the importance of deactivating MHK energy absorption during strong storm conditions to prevent substantial burial and potential escalation of maintenance costs. Conversely, deploying MHK devices during storms may offer coastal protection by reducing wave heights and energy.
  • Lastly, increasing the spacing between MHK devices emerges as a crucial factor in minimizing the long-term risk of burial due to enhanced sedimentation around these devices.
Our simulations were conducted within an idealized domain to facilitate the exploration of various conditions and parameters. Furthermore, we have devised a relatively straightforward method for assessing the potential morphodynamic effects of MHKs on their surroundings and estimating the impacts of wave climate on array maintenance. Subsequent research endeavors could delve into situating the array within a larger domain, incorporating site-specific conditions, and delving into the near- and far-field ramifications on hydrodynamics and morphology. These insights can serve as potential means to address issues related to coastal erosion, flooding, and other hazards while upholding the integrity of the natural environment. To validate this approach, an optimized array layout could be deployed off the North Carolina coastline and subjected to the same wave conditions employed in this investigation.

Author Contributions

Conceptualization, A.C.O. and H.M.; methodology, A.C.O. and H.M.; software, H.M.; validation, A.C.O. and H.M.; formal analysis, H.M.; investigation, A.C.O. and H.M.; resources, A.C.O.; data curation, H.M.; writing—original draft preparation, H.M.; writing—review and editing, A.C.O. and H.M.; visualization, H.M.; supervision, A.C.O.; project administration, A.C.O.; funding acquisition, A.C.O. All authors have read and agreed to the published version of the manuscript.

Funding

This research was financially supported by Coastal Studies Institute/East Carolina University as part of North Carolina Renewable Ocean Energy Program.

Data Availability Statement

All model input data to re-create our analyses can be found at OSF.IO/WMA8R, these can be run with Delft3D 4, an open-source computational model.

Acknowledgments

We gratefully thank Shamim Rahman (North Carolina State University), Mo Gabr (North Carolina State University), and Amin Rafiei (North Carolina State University) for their expert advice throughout this study.

Conflicts of Interest

The authors declare no conflict of interest.

References

  1. Shields, M.A.; Woolf, D.K.; Grist, E.P.; Kerr, S.A.; Jackson, A.C.; Harris, R.E.; Bell, M.C.; Beharie, R.; Want, A.; Osalusi, E.; et al. Marine renewable energy: The ecological implications of altering the hydrodynamics of the marine environment. Ocean Coast. Manag. 2011, 54, 2–9. [Google Scholar] [CrossRef]
  2. VanZwieten, J.; McAnally, W.; Ahmad, J.; Davis, T.; Martin, J.; Bevelhimer, M.; Cribbs, A.; Lippert, R.; Hudon, T.; Trudeau, M. In-stream hydrokinetic power: Review and appraisal. J. Energy Eng. 2015, 141, 1–16. [Google Scholar] [CrossRef]
  3. Güney, M.S.; Kaygusuz, K. Hydrokinetic energy conversion systems: A technology status review. Renew. Sustain. Energy Rev. 2010, 14, 2996–3004. [Google Scholar] [CrossRef]
  4. Laws, N.D.; Epps, B.P. Hydrokinetic energy conversion: Technology, research, and outlook. Renew. Sustain. Energy Rev. 2016, 57, 1245–1259. [Google Scholar] [CrossRef]
  5. Muljadi, E.; Yu, Y.H. Review of Marine Hydrokinetic Power Generation and Power Plant. Electr. Power Components Syst. 2015, 43, 1422–1433. [Google Scholar] [CrossRef]
  6. Aderinto, T.; Li, H. Review on power performance and efficiency of wave energy converters. Energies 2019, 12, 4329. [Google Scholar] [CrossRef]
  7. Nash, S.; Phoenix, A. A review of the current understanding of the hydro-environmental impacts of energy removal by tidal turbines. Renew. Sustain. Energy Rev. 2017, 80, 648–662. [Google Scholar] [CrossRef]
  8. Ahmadian, R.; Falconer, R.; Bockelmann-Evans, B. Far-field modelling of the hydro-environmental impact of tidal stream turbines. Renew. Energy 2012, 38, 107–116. [Google Scholar] [CrossRef]
  9. Gillibrand, P.A.; Walters, R.A.; McIlvenny, J. Numerical simulations of the effects of a tidal turbine array on near-bed velocity and local bed shear stress. Energies 2016, 9, 852. [Google Scholar] [CrossRef]
  10. Ramos, V.; Carballo, R.; Ringwood, J.V. Application of the actuator disc theory of Delft3D-FLOW to model far-field hydrodynamic impacts of tidal turbines. Renew. Energy 2019, 139, 1320–1335. [Google Scholar] [CrossRef]
  11. Ruehl, K.; Porter, A.; Chartrand, C.; Smith, H.; Chang, G.; Roberts, J. Development, Verification and Application of the SNL-SWAN Open Source Wave Farm Code. In Proceedings of the 11th European Wave and Tidal Energy Conference, Nantes, France, 6–11 September 2015. [Google Scholar]
  12. Nash, S.; Olbert, A.I.; Hartnett, M. Towards a low-cost modelling system for optimising the layout of tidal turbine arrays. Energies 2015, 8, 13521–13539. [Google Scholar] [CrossRef]
  13. Plew, D.R.; Stevens, C.L. Numerical modelling of the effect of turbines on currents in a tidal channel—Tory Channel, New Zealand. Renew. Energy 2013, 57, 269–282. [Google Scholar] [CrossRef]
  14. Fallon, D.; Hartnett, M.; Olbert, A.; Nash, S. The effects of array configuration on the hydro-environmental impacts of tidal turbines. Renew. Energy 2014, 64, 10–25. [Google Scholar] [CrossRef]
  15. Li, X.; Li, M.; Jordan, L.B.; McLelland, S.; Parsons, D.R.; Amoudry, L.O.; Song, Q.; Comerford, L. Modelling impacts of tidal stream turbines on surface waves. Renew. Energy 2019, 130, 725–734. [Google Scholar] [CrossRef]
  16. Abanades, J.; Greaves, D.; Iglesias, G. Wave farm impact on the beach profile: A case study. Coast. Eng. 2014, 86, 36–44. [Google Scholar] [CrossRef]
  17. Bergillos, R.J.; López-Ruiz, A.; Medina-López, E.; Moñino, A.; Ortega-Sánchez, M. The role of wave energy converter farms on coastal protection in eroding deltas, Guadalfeo, southern Spain. J. Clean. Prod. 2018, 171, 356–367. [Google Scholar] [CrossRef]
  18. Ramírez-Mendoza, R.; Amoudry, L.O.; Thorne, P.D.; Cooke, R.D.; McLelland, S.J.; Jordan, L.B.; Simmons, S.M.; Parsons, D.R.; Murdoch, L. Laboratory study on the effects of hydro kinetic turbines on hydrodynamics and sediment dynamics. Renew. Energy 2018, 129, 271–284. [Google Scholar] [CrossRef]
  19. Neill, S.P.; Jordan, J.R.; Couch, S.J. Impact of tidal energy converter (TEC) arrays on the dynamics of headland sand banks. Renew. Energy 2012, 37, 387–397. [Google Scholar] [CrossRef]
  20. Robins, P.E.; Neill, S.P.; Lewis, M.J. Impact of tidal-stream arrays in relation to the natural variability of sedimentary processes. Renew. Energy 2014, 72, 311–321. [Google Scholar] [CrossRef]
  21. Neill, S.P.; Litt, E.J.; Couch, S.J.; Davies, A.G. The impact of tidal stream turbines on large-scale sediment dynamics. Renew. Energy 2009, 34, 2803–2812. [Google Scholar] [CrossRef]
  22. Van Rijn, L.C. Sediment transport, part I: Bed load transport. J. Hydraul. Eng. 1984, 110, 1431–1456. [Google Scholar] [CrossRef]
  23. van Rijn, L.C. Sediment transport, part II: Suspended load transport. J. Hydraul. Eng. 1984, 110, 1613–1641. [Google Scholar] [CrossRef]
  24. Soulsby, R. Dynamics of Marine Sands; Thomas Telford Services Limited: London, UK, 1997. [Google Scholar]
  25. Zaichik, L.; Alipchenkov, V.M.; Sinaiski, E.G. Particles in Turbulent Flows; Wiley: Hoboken, NJ, USA, 2008. [Google Scholar]
  26. Martin-Short, R.; Hill, J.; Kramer, S.C.; Avdis, A.; Allison, P.A.; Piggott, M.D. Tidal resource extraction in the Pentland Firth, UK: Potential impacts on flow regime and sediment transport in the Inner Sound of Stroma. Renew. Energy 2015, 76, 596–607. [Google Scholar] [CrossRef]
  27. Haverson, D.; Bacon, J.; Smith, H.C.; Venugopal, V.; Xiao, Q. Modelling the hydrodynamic and morphological impacts of a tidal stream development in Ramsey Sound. Renew. Energy 2018, 126, 876–887. [Google Scholar] [CrossRef]
  28. Thiébot, J.; Bailly du Bois, P.; Guillou, S. Numerical modeling of the effect of tidal stream turbines on the hydrodynamics and the sediment transport - Application to the Alderney Race (Raz Blanchard), France. Renew. Energy 2015, 75, 356–365. [Google Scholar] [CrossRef]
  29. Auguste, C.; Nader, J.R.; Marsh, P.; Cossu, R.; Penesis, I. Variability of sediment processes around a tidal farm in a theoretical channel. Renew. Energy 2021, 171, 606–620. [Google Scholar] [CrossRef]
  30. Musa, M.; Hill, C.; Guala, M. Interaction between hydrokinetic turbine wakes and sediment dynamics: Array performance and geomorphic effects under different siting strategies and sediment transport conditions. Renew. Energy 2019, 138, 738–753. [Google Scholar] [CrossRef]
  31. Ortiz, A.C.; Ashton, A.D. Understanding the Timescales of Morphologic Evolution in the Crossshore and Long-shore of Sandy Wave-Dominated Coast. Geophys. Res. Lett. in preprint.
  32. Lesser, G.; Roelvink, J.; van Kester, J.; Stelling, G. Development and validation of a three-dimensional morphological model. Coast. Eng. 2004, 51, 883–915. [Google Scholar] [CrossRef]
  33. Roelvink, J.A. Coastal morphodynamic evolution techniques. Coast. Eng. 2006, 53, 277–287. [Google Scholar] [CrossRef]
  34. Ranasinghe, R.; Swinkels, C.; Luijendijk, A.; Roelvink, D.; Bosboom, J.; Stive, M.; Walstra, D.J. Morphodynamic upscaling with the MORFAC approach: Dependencies and sensitivities. Coast. Eng. 2011, 58, 806–811. [Google Scholar] [CrossRef]
  35. Vlijm, R.J. Process-Based Modelling of Morphological Response to Submerged Breakwaters. Ph.D. Thesis, TU Delft, Delft, The Netherlands, 2011. [Google Scholar]
  36. Wright, L.D.; Thom, B.G. Coastal depositional landforms: A morphodynamic approach. Prog. Phys. Geogr. Earth Environ. 1977, 1, 412–459. [Google Scholar] [CrossRef]
  37. Dissanayake, D.; Ranasinghe, R.; Roelvink, J. The morphological response of large tidal inlet/basin systems to relative sea level rise. Clim. Chang. 2012, 113, 253–276. [Google Scholar] [CrossRef]
  38. Booij, N.; Holthuijsen, L.; Ris, R. The“ SWAN” wave model for shallow water. In Coastal Engineering 1996: Proceedings of the Twenty-Fifth International Conference, September 2–6, 1996, the Peabody Hotel, Orlando, Florida (Proceedings of the Coastal Engineering Conference); Amer Society of Civil Engineers: Reston, VA, USA, 1997; pp. 668–676. [Google Scholar]
  39. Li, X.; Li, M.; McLelland, S.J.; Jordan, L.B.; Simmons, S.M.; Amoudry, L.O.; Ramirez-Mendoza, R.; Thorne, P.D. Modelling tidal stream turbines in a three-dimensional wave-current fully coupled oceanographic model. Renew. Energy 2017, 114, 297–307. [Google Scholar] [CrossRef]
  40. Yu, X.; Rosman, J.H.; Hench, J.L. Interaction of Waves with Idealized High-Relief Bottom Roughness. J. Geophys. Res. Ocean. 2018, 123, 3038–3059. [Google Scholar] [CrossRef]
  41. Davies, A. On the interaction between surface waves and undulations on the seabed. J. Mar. Res. 1982, 40, 331–368. [Google Scholar]
  42. Gao, J.; Ma, X.; Dong, G.; Chen, H.; Liu, Q.; Zang, J. Investigation on the effects of Bragg reflection on harbor oscillations. Coast. Eng. 2021, 170, 103977. [Google Scholar] [CrossRef]
  43. Gao, J.; Shi, H.; Zang, J.; Liu, Y. Mechanism analysis on the mitigation of harbor resonance by periodic undulating topography. Ocean Eng. 2023, 281, 114923. [Google Scholar] [CrossRef]
  44. Ni, Y.L.; Teng, B. Bragg resonant reflection of water waves by a Bragg breakwater with porous rectangular bars on a sloping permeable seabed. Ocean Eng. 2021, 235, 109333. [Google Scholar] [CrossRef]
  45. Chang, G.; Ruehl, K.; Jones, C.; Roberts, J.; Chartrand, C. Numerical modeling of the effects of wave energy converter characteristics on nearshore wave conditions. Renew. Energy 2016, 89, 636–648. [Google Scholar] [CrossRef]
  46. Meire, D.W.S.A.; Kondziolka, J.M.; Nepf, H.M. Interaction between neighboring vegetation patches: Impact on flow and deposition. Water Resour. Res. 2014, 50, 3809–3825. [Google Scholar] [CrossRef]
  47. Liu, C.; Hu, Z.; Lei, J.; Nepf, H. Vortex Structure and Sediment Deposition in the Wake behind a Finite Patch of Model Submerged Vegetation. J. Hydraul. Eng. 2018, 144, 04017065. [Google Scholar] [CrossRef]
Figure 1. The location of selected WIS stations along North Carolina Atlantic Coast superimposed on ArcMap.
Water 15 03884 g001
Figure 2. Schematic profile view of the initial model setup for the numerical simulation.
Water 15 03884 g002
Figure 3. (A). Seabed slope at varying distances around proposed MHK deployment depth (20 m) versus time (B). Change in measured local slope versus time.
Water 15 03884 g003
Figure 4. Model domain for SWAN and Delft3D simulation over the equilibrium bathymetry, indicating locations of MHK array (five 2 m × 2 m MHK devices outlined in black rectangles), with grid origin labeled in red.
Water 15 03884 g004
Figure 5. The impact of MHK devices structure on (A1) significant wave height, (A2) bed shear stress, and (A3) sedimentation in storm wave conditions. Method A: investigating the short-term response of MHKs to storm conditions without accounting for energy loss. The position of the MHKs in the simulation is indicated by the red box.
Water 15 03884 g005
Figure 6. The impact of MHK devices structure on (B1) significant wave height, (B2) bed shear stress, and (B3) sedimentation in mean wave conditions. Method B investigating the long-term response of MHKs to mean conditions without accounting for energy loss. The position of the MHKs in the simulation is indicated by the red box.
Water 15 03884 g006
Figure 7. The impact of MHK devices presence (structure and energy loss) in storm wave conditions on (C1) significant wave height, (C2) bed shear stress, (C3) and sedimentation. Method C investigating the short-term response of MHKs to storm conditions with energy absorption. The position of the MHKs in the simulation is indicated by the red box.
Water 15 03884 g007
Figure 8. The impact of MHK devices presence (structure and energy loss) in mean wave conditions on (D1) significant wave height, (D2) bed shear stress, and (D3) sedimentation. Method D investigating the long-term response of MHKs to mean conditions with energy absorption. The position of the MHKs in the simulation is indicated by the red box.
Water 15 03884 g008
Figure 9. The impact of (A) 2 m × 2 m and (B) 10 m × 10 m (larger) MHK devices’ presence on percentage change of cumulative sedimentation in storm wave conditions.
Water 15 03884 g009
Figure 10. The impact of 25 MHK devices presence on percentage change of cumulative sedimentation in storm wave conditions.
Water 15 03884 g010
Figure 11. The impact of MHK devices with 5 × D spacing (increased spacing between devices) on percentage change of cumulative sedimentation in storm wave conditions.
Water 15 03884 g011
Table 1. Wave climate for investigation of the impacts of MHK devices on morphology.
Mean WaveStorm Conditions
H s (m) T p (s) H 3 σ (s) T p (s)
Mean Value1.58613
Disclaimer/Publisher’s Note: The statements, opinions and data contained in all publications are solely those of the individual author(s) and contributor(s) and not of MDPI and/or the editor(s). MDPI and/or the editor(s) disclaim responsibility for any injury to people or property resulting from any ideas, methods, instructions or products referred to in the content.