Article

Characteristics and Research Significance of Micro-Nanoparticles in Geothermal Fluids in the Central Area of Shandong Province

School of Resources and Environmental Engineering, Shandong University of Technology, Zibo 255000, China
*
Authors to whom correspondence should be addressed.
Water 2023, 15(21), 3737; https://doi.org/10.3390/w15213737
Submission received: 26 September 2023 / Revised: 21 October 2023 / Accepted: 24 October 2023 / Published: 26 October 2023

Abstract

:
The micro-nanoparticles found in geothermal fluids exhibit distinct characteristics that hold great potential for detecting deeply concealed geothermal resources. Utilizing a nanoparticle tracking analyzer (NTA), we conducted observations on karst geothermal fluids collected from the central region of Shandong Province, specifically Jinan and Zibo. Our investigation revealed the presence of a significant quantity of naturally occurring micro-nanoparticles within these geothermal fluids, with particle sizes typically falling in the range of 100 nm to 5 μm. To gain a comprehensive understanding of these micro-nanoparticles, we subjected them to a detailed analysis, encompassing their type, shape, crystal structure, and chemical composition. This in-depth examination was carried out using transmission electron microscopy (TEM). Our findings, supported by TEM images and energy dispersive spectroscopy, indicated that these micro-nanoparticles in the geothermal fluid samples predominantly exhibit amorphous characteristics and possess irregular or nearly spherical shapes, often accompanied by rough edges. Furthermore, it was evident that the composition of these micro-nanoparticles primarily consists of carbonates, sulfates, and chlorides, which contain elements such as Fe, Ca, and Na. The distinctive features of these micro-nanoparticles provide valuable insights into the properties of the high-temperature reservoirs and aquifers from which they originate. As a result, we firmly assert that natural micro-nanoparticles can significantly contribute to the detection and comprehensive study of concealed geothermal resources within the Earth. This novel approach offers a promising method for exploring and gaining a deeper understanding of these hidden geothermal resources.

1. Introduction

1.1. Current Status of Geothermal Resources Exploration and Research

The Earth’s interior holds a substantial amount of thermal energy [1,2,3,4,5]. When this thermal energy interacts with a well-developed geothermal reservoir (comprising rock or fluid), it heats the reservoir, forming exploitable geothermal resources [6,7,8,9,10,11]. These geothermal resources come in various types, boasting vast reserves and a wide distribution [12,13,14,15]. Moreover, geothermal resources play a pivotal role in achieving carbon neutrality and carbon peaking as they represent renewable, clean, stable, and non-carbon-based energy sources [16]. This makes them essential for both economic and social development and environmental protection. As the depletion of fossil fuels continues, locating additional geothermal resources has become a priority for researchers. Shallow geothermal resources have been explored or exploited and the exploration of geothermal resources has shifted to the deeper layers of the Earth [17]. Currently, research on geothermal resources is still in its early stages and the exploration of deep geothermal resources remains a complex and insufficiently explored domain. China, however, is endowed with abundant and widely distributed geothermal resources, primarily concentrated within tectonically active zones and large sedimentary basins. These resources exhibit distinct regularity and zoning [18,19,20]. Geothermal resources are commonly found in Shandong Province, with geothermal outcrops and exposures prevalent in the central, western, and northern regions. However, there remains room for higher degrees of exploration, development, and overall utilization of these resources. Furthermore, the research and exploration of geothermal resources are currently insufficient and this is particularly true for deep-seated, concealed geothermal resources. In the past, the exploration of deeply concealed mineral resources relied on geophysical [21,22], geochemical [23], and other methods. Hydrogeochemical techniques, for example, identify concealed mineral resource deposits based on the elemental composition of water bodies [24]. However, traditional hydrogeochemical research methods have their limitations in uncovering deeply concealed minerals and understanding the biological processes taking place in the environment [25].

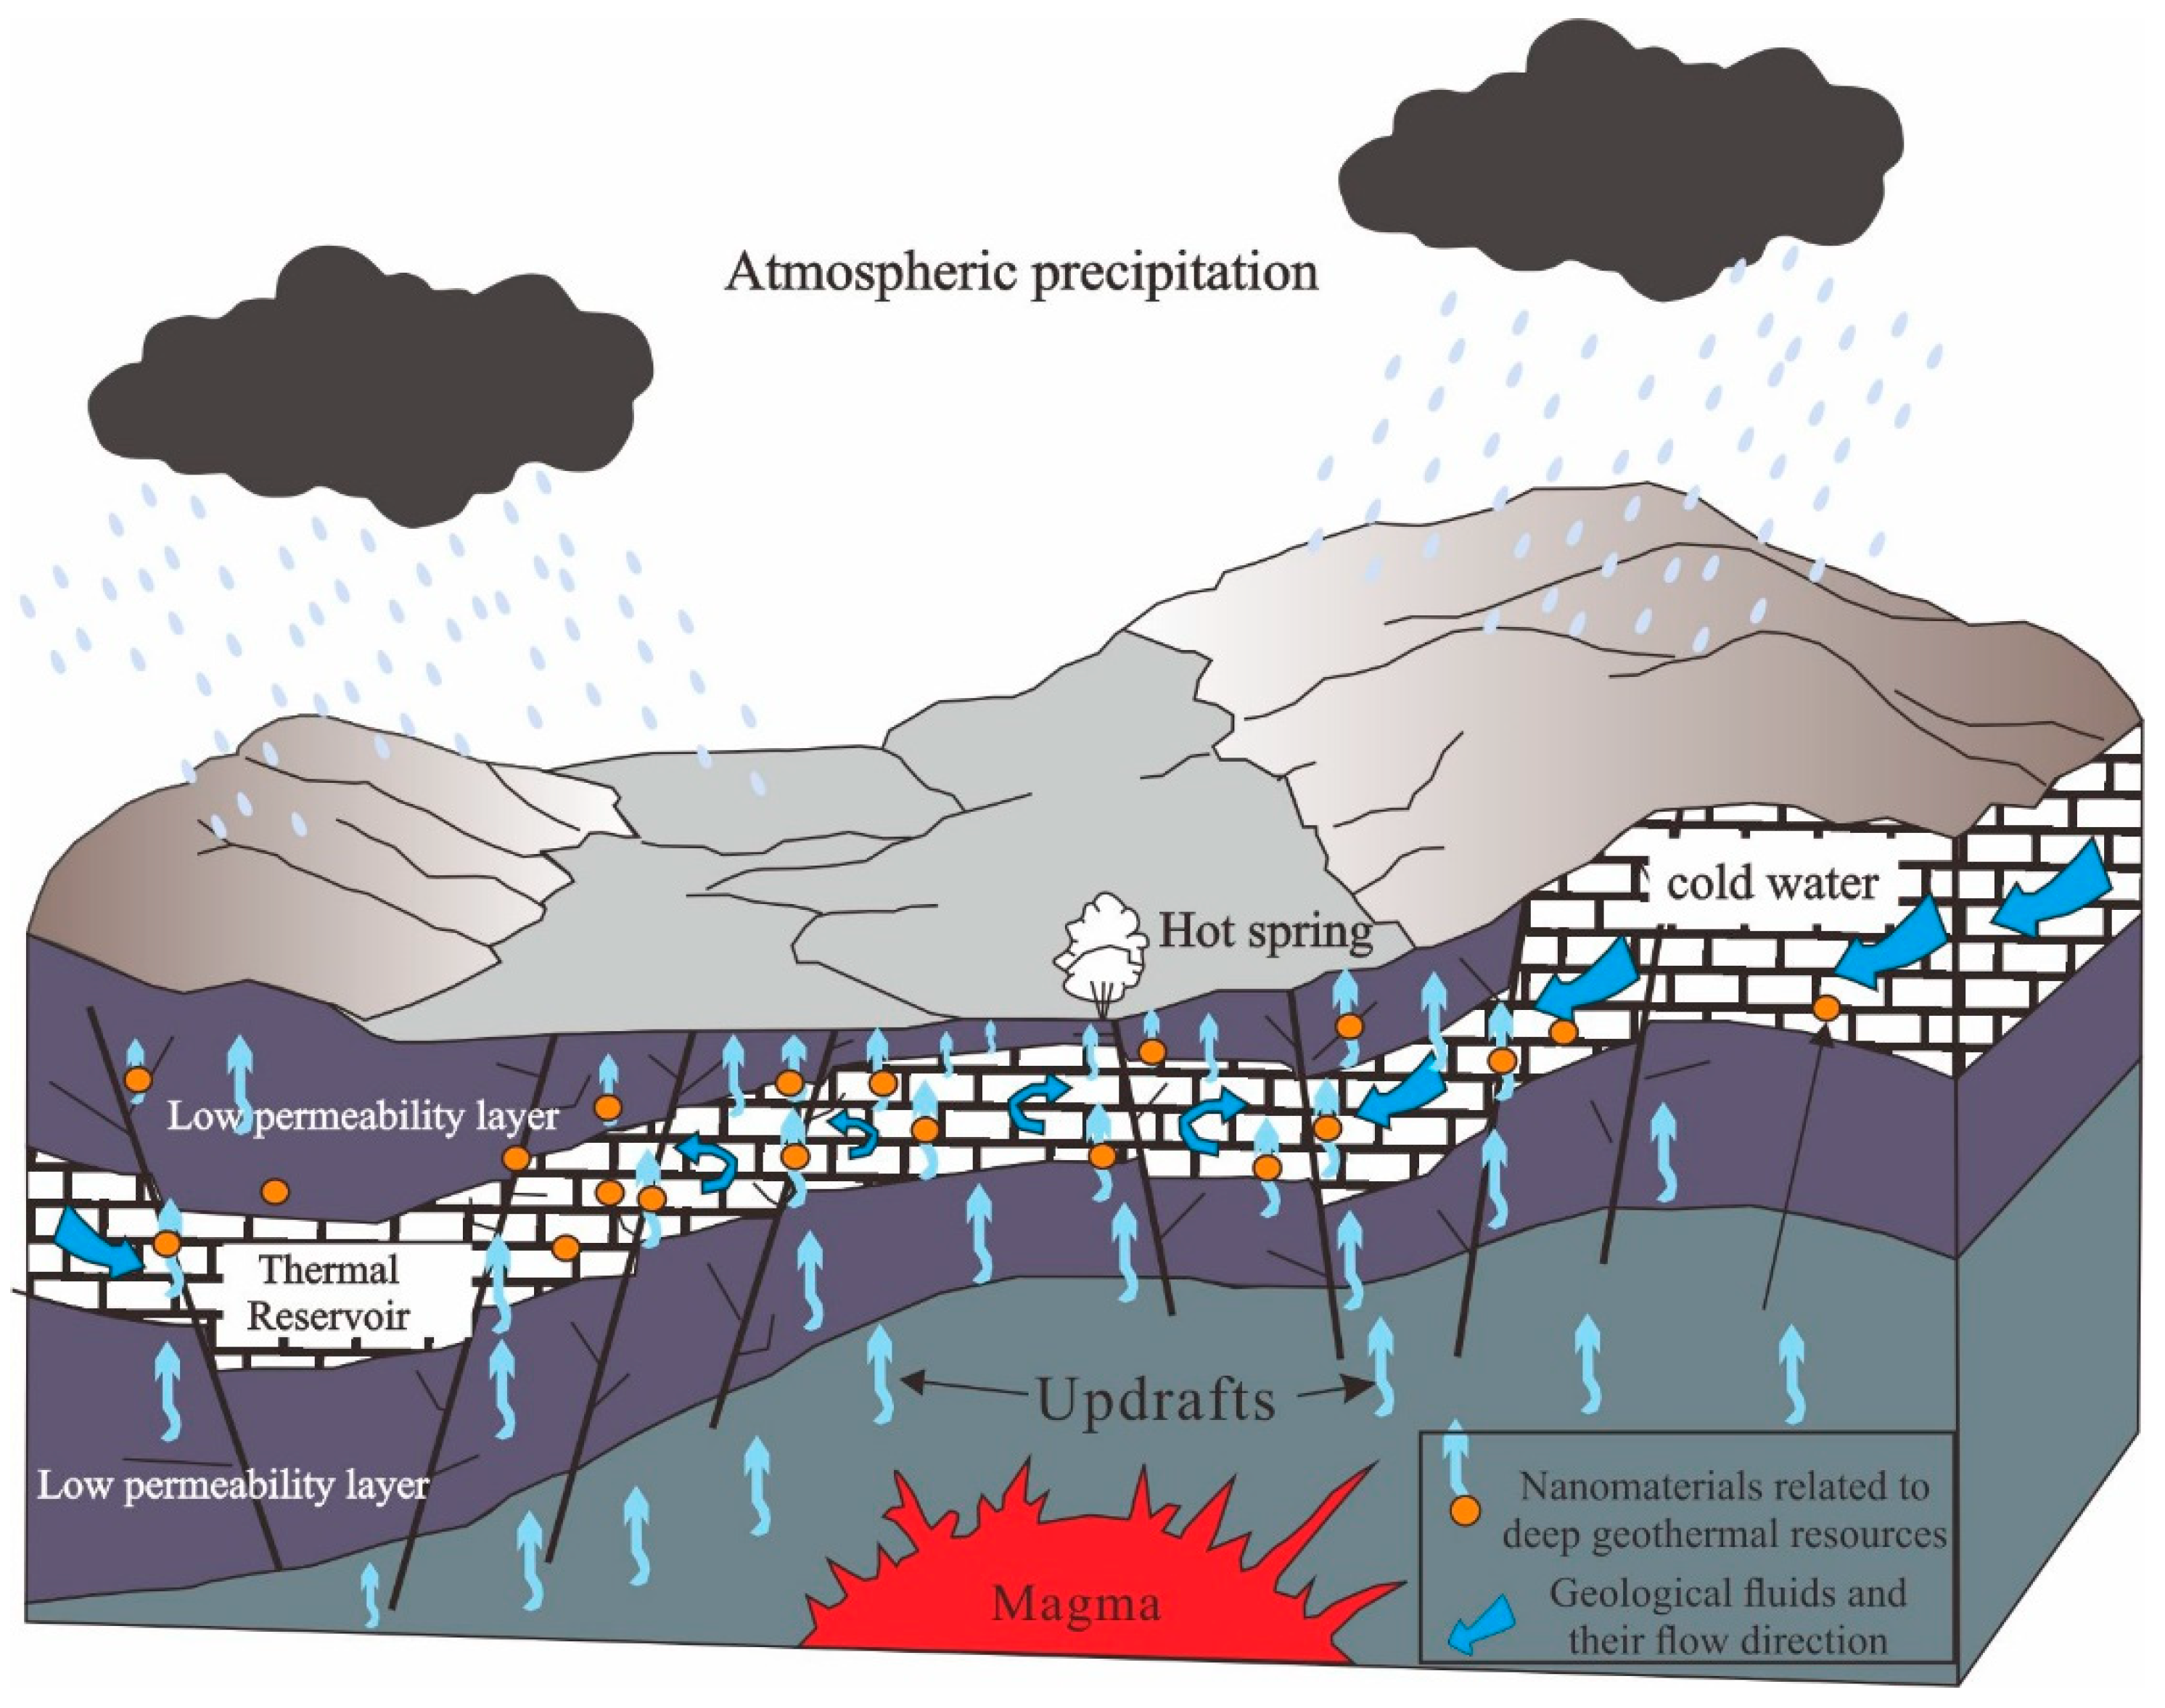
1.2. Indication of Deep Geological Bodies by Nanoparticles in Fluids

The approach of prospecting for concealed ore bodies based on the characteristics of natural nanoparticles was initially introduced by Cao et al. [26]. Natural nanoparticles originate from geochemical and biological processes and are abundant in soil and groundwater [27]. Due to their distinct physicochemical properties, nanoparticles can provide unique insights into their surroundings [28,29]. They have the ability to persist for extended periods and often transport elements [30]. Natural nanoparticles can convey valuable information about geological formations deep within the Earth [31]. As a result, characterizing nanoparticles is considered an indispensable tool for mineral exploration. Geothermal energy serves as one of the driving forces behind the migration of nanoscale materials [32]. Regions with substantial geothermal gradients often witness pronounced material migration [33]. Experimental simulations have illustrated that the greater the temperature disparity between the geological structure and the surface, the more accelerated the material migration rate within the geological body [34]. Studies have indicated that there is a significant material exchange between ore bodies and aqueous environments [35]. Micro-nanoparticles can serve as carriers of evidence for deep mineral resources and provide insights into deep geothermal resources [36]. Importantly, they are relatively resilient to the influences of the surrounding biological environment. At the same time, under suitable physicochemical conditions, the elements can exist stably in the water and maintain the element content as higher than the background within a certain flow distance; thus, it can be investigated according to the abnormal distribution of element content in the water [37,38]. Hence, the utilization of nanominerals present in geothermal fluids for the study of geothermal resources proves to be advantageous.
In this study, we employed transmission electron microscopy (TEM) to examine micro-nanoparticles in geothermal fluid samples collected from the central region of Shandong Province, specifically Jinan and Zibo. The investigation delves into the relationship between nanoparticles in geothermal fluids and the deeper geothermal formations. This exploration is conducted through an analysis of micro-nanoparticle characteristics, including morphology, size, crystallization state, polymerization state, chemical composition, and elemental distribution. The anticipated outcome of this study is to provide new avenues and methodologies for the exploration of concealed deep geothermal resources.

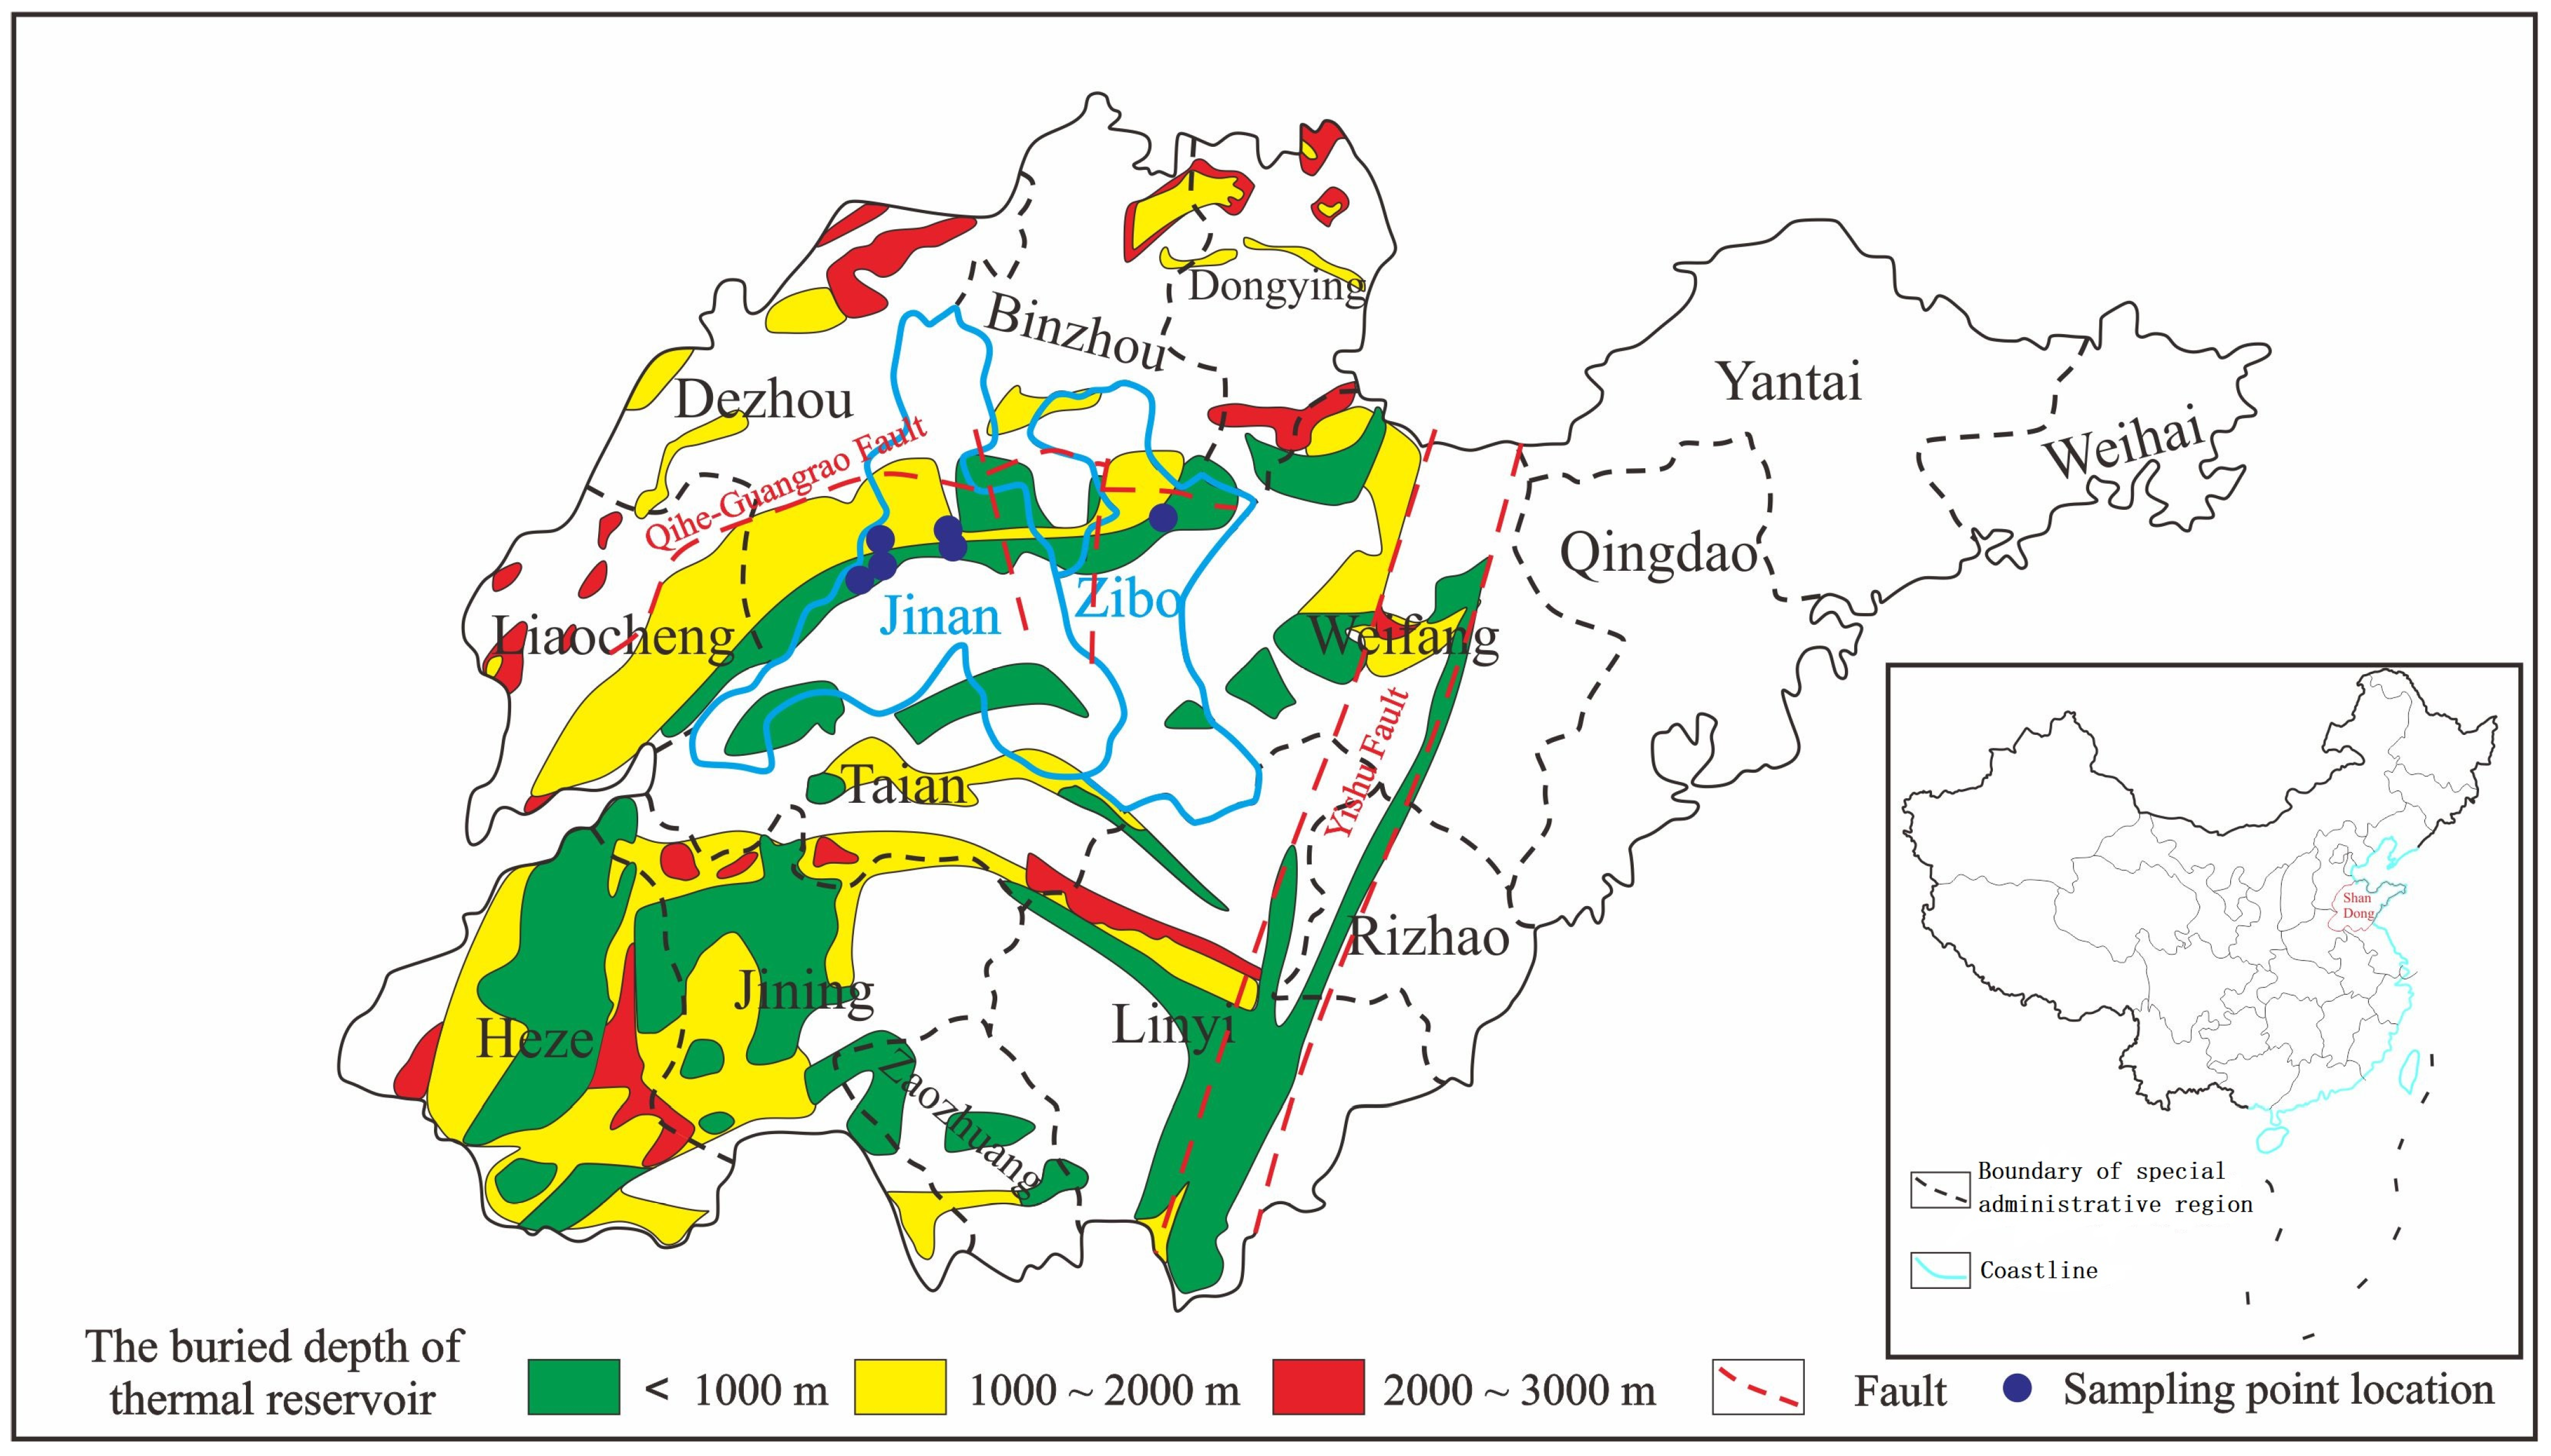
2. Geological Setting

The geographical features in the central region of Shandong Province encompass a diverse landscape comprising mountains, plains, hills, and river valleys. The topography is elevated in the southern part and gradually descends towards the north. For the purposes of this study, the study areas selected for examination were the regions of Jinan and Zibo.

2.1. Geological Background of Jinan

Jinan is situated at the northern periphery of the Luzhong Mountains, bordered by Mount Taishan to the south and the Yellow River to the north. The exposed geological strata in the region span from ancient to more recent formations. The development of fault structures in Jinan is predominantly influenced by the Qihe-Guangrao Fault, resulting in the presence of abundant geothermal resources. The area bears a wealth of evidence of magmatic activity, primarily occurring during the late Indochina-Yanshan orogeny. The existence of magmatic rock formations has played a pivotal role in the creation of geothermal resources in Jinan. These geothermal resources are primarily concentrated in the northern part of Jinan. The thermal reservoirs mainly consist of aquifers developed within Ordovician limestone fracture karst zones, overlaid by Quaternary, Neogene, Permian, and Carboniferous strata. Li et al. [39] determined that the origin of geothermal fluids in Jinan is primarily from atmospheric precipitation, driven by deep circulation and subsequent heating by the surrounding rocks, ultimately forming geothermal reservoirs. The level of mineralization in these geothermal fluids demonstrates a declining pattern from east to west, with a sequential change in hydrochemical composition from Cl·SO4-Na·Ca to SO4·Cl-Ca·Na, followed by SO4-Ca. The geothermal fluids in Jinan exhibit varying degrees of enrichment in numerous trace elements and components known to be beneficial for human health, including fluorine, strontium, and metasilicic acid.

2.2. Geological Background of Zibo

Zibo is situated within the Luzhong rupture area, which slopes backward, at the northern edge of the Luxi platform in the North China Platform. It is surrounded by mountainous terrain to the east, west, and south, creating an elevation that decreases from south to north, influenced by the local geological structure. The southern end of the Zibo syncline is closed and uplifted, while the eastern and western regions exhibit higher elevations. The central region, in contrast, is characterized by low and flat topography, opening northward and resembling a dustpan. The area features surface exposures of Neoarchean, Paleozoic, Mesozoic, and Cenozoic strata. The fault structure in this region is notably well-developed, with extension fractures being the primary fault type. These faults primarily formed during the later stages of the Indochina-Yanshan movement. The extensive development of fault structures enhances the occurrence and migration of geothermal fluids. The area also displays substantial evidence of magmatic activity, with widely distributed magmatic rocks showcasing characteristics of multiphase activity. The geographical and geological characteristics of the area define it as a relatively self-contained hydrogeological unit. The primary source of geothermal fluids in this region is atmospheric precipitation, driven by deep circulation and subsequent heating by surrounding rocks to create geothermal reservoirs. The thermal reservoirs predominantly consist of aquifers within Ordovician limestone and the hydrochemical composition of the geothermal fluids can be categorized as SO4·Cl-Na·Ca.

3. Sampling and Analytical Methods

3.1. Sampling Sites

In this study, we selected geothermal fluids from Jinan and Zibo in the central area of Shandong Province and the samples were carried from the flowing water at the wellhead. Six geothermal fluid samples were collected, with five samples originating from Jinan and one from Zibo. The exact sampling points are depicted in Figure 1. The samples were collected using 50 mL volumetric flasks. These flasks were initially rinsed with a small quantity of water and then filled with the water samples (each exceeding 30 mL). The flasks were securely sealed and stored until they were ready for analysis.

3.2. Analytical Methods

The sizes and concentrations of particles in the groundwater samples were determined through nanoparticle tracking analysis (NTA) using a ZetaView PMX 110 instrument manufactured by Particle Metrix, based in Meerbusch, Germany. The corresponding ZetaView 8.04.02 software was utilized for data analysis. NTA measurements were recorded and analyzed at eleven different positions. To maintain the desired temperatures of approximately 23 °C and 30 °C, the ZetaView system was calibrated using 110 nm polystyrene particles.
Transmission electron microscopy (TEM) was employed for nanoparticle analysis. The maximum acceleration voltage for the TEM was set at 200 kV. TEM foils were prepared by extracting nanoparticles and attaching them to Cu grids through Pt welding, followed by thinning to achieve thicknesses ranging from 50 to 70 nm. High-angle annular dark-field scanning transmission electron microscopy (HAADF-STEM) imaging was carried out using high-resolution, probe-corrected FEI Titan Themis TEM. Post-processing of high-resolution transmission electron microscopy (HRTEM) images, including fast Fourier transform (FFT) processing, was conducted using DigitalMicrograph software (version 3.7.4, Gatan, San Diego, CA, USA). Furthermore, the elemental distribution was determined via energy-dispersive X-ray spectrometry (EDS), which has an acceleration voltage of 200 kV; the energy resolution is less than 160eV and the inner collection angle ranges from 15 to 45 degrees (~0.5–1 wt.% detection limit). The sample carrier used during the scanning electron microscopy analysis of Jinan and Zibo geothermal fluid samples was a copper mesh coated with a carbon film and a silicon mesh coated with a carbon film. All analyses, including TEM and EDS, were conducted at the Sinoma Institute of Materials Research (Guangzhou) Co., Ltd. (Guangzhou, China).

4. Results

The results from the NTA test (see Table 1) revealed that the geothermal fluids collected in both regions contained a substantial number of micro-nanoparticles. In the geothermal fluids from Jinan, the particle sizes were primarily concentrated within the range of 150–500 nm and particle concentrations were predominantly found within the range of 0.5–4 × 10⁵ particles per liter. On the other hand, in the geothermal fluids from Zibo, the particle sizes were mainly concentrated in the range of 196–232 nm, with particle concentrations primarily falling within the range of 0.7–3.2 × 10⁵ particles per liter. Through TEM images and the EDS analysis of micro-nanoparticles in geothermal fluids, we found that the samples contained many micro-nanoparticles. In this study, 25 characteristic micro-nanoparticles were selected for detailed analysis (other similar micro-nanoparticle images will be shown in the attachment, see Figures S1 and S2); the EDS results are presented in Table 2.

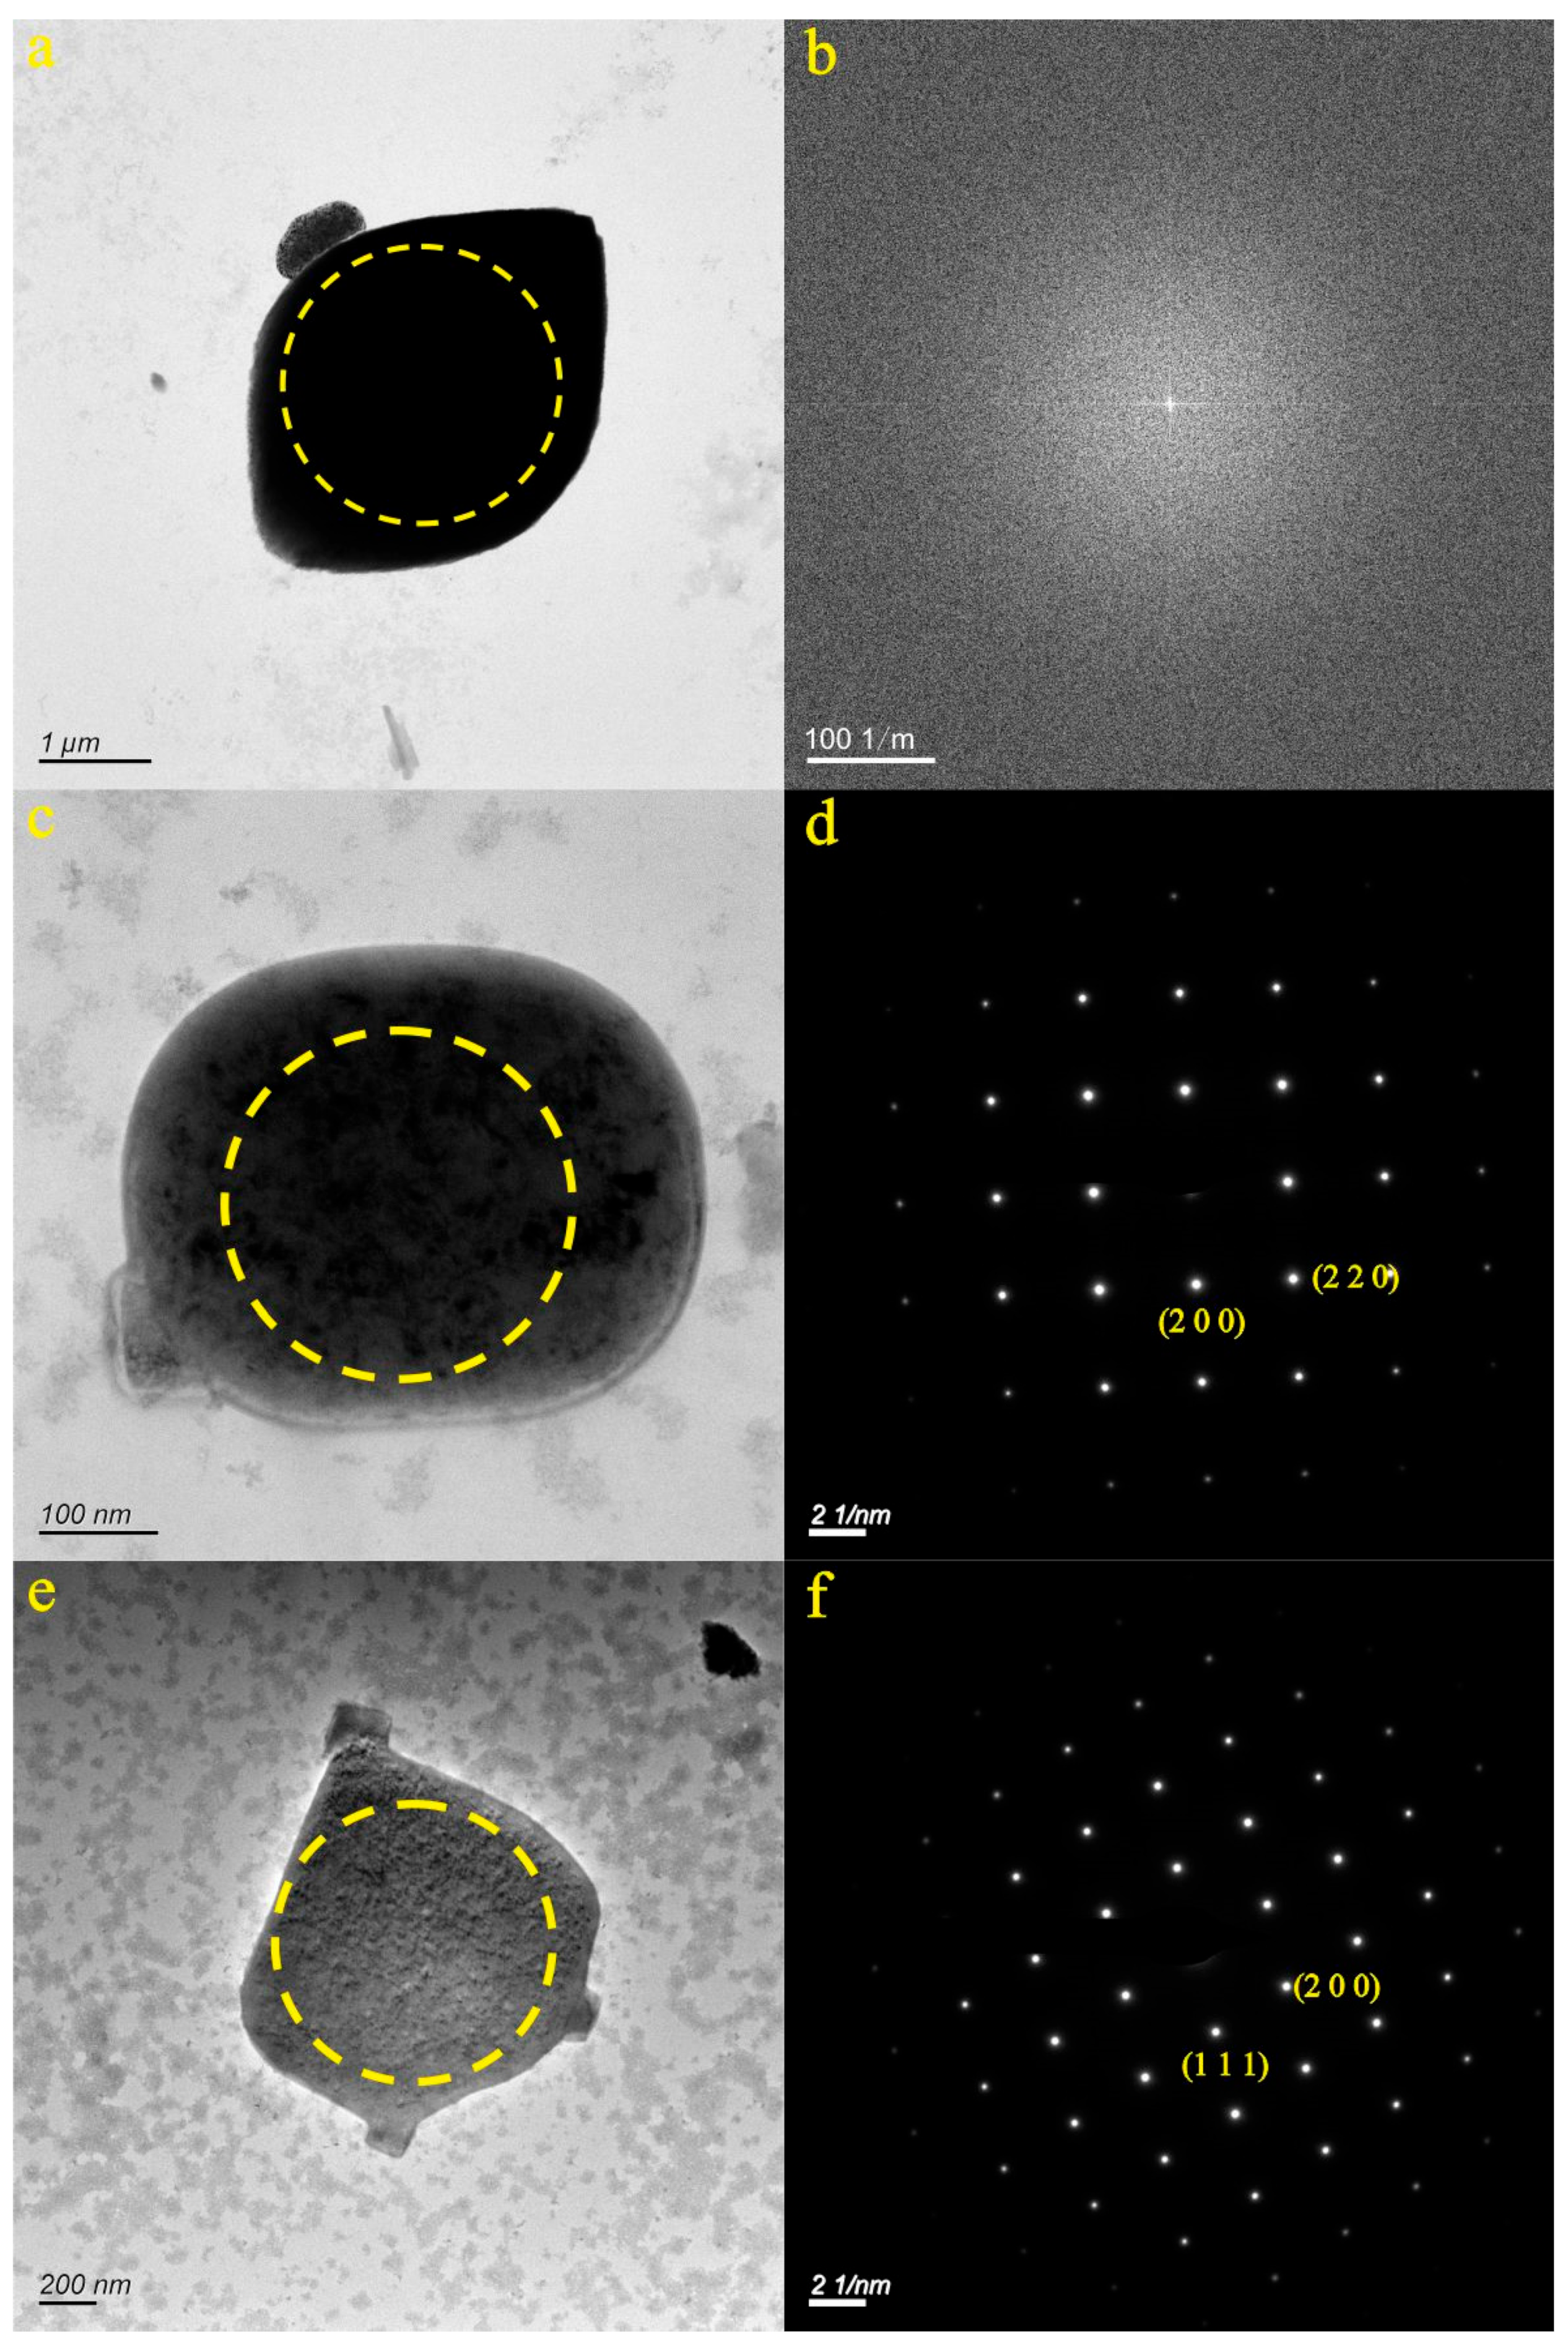
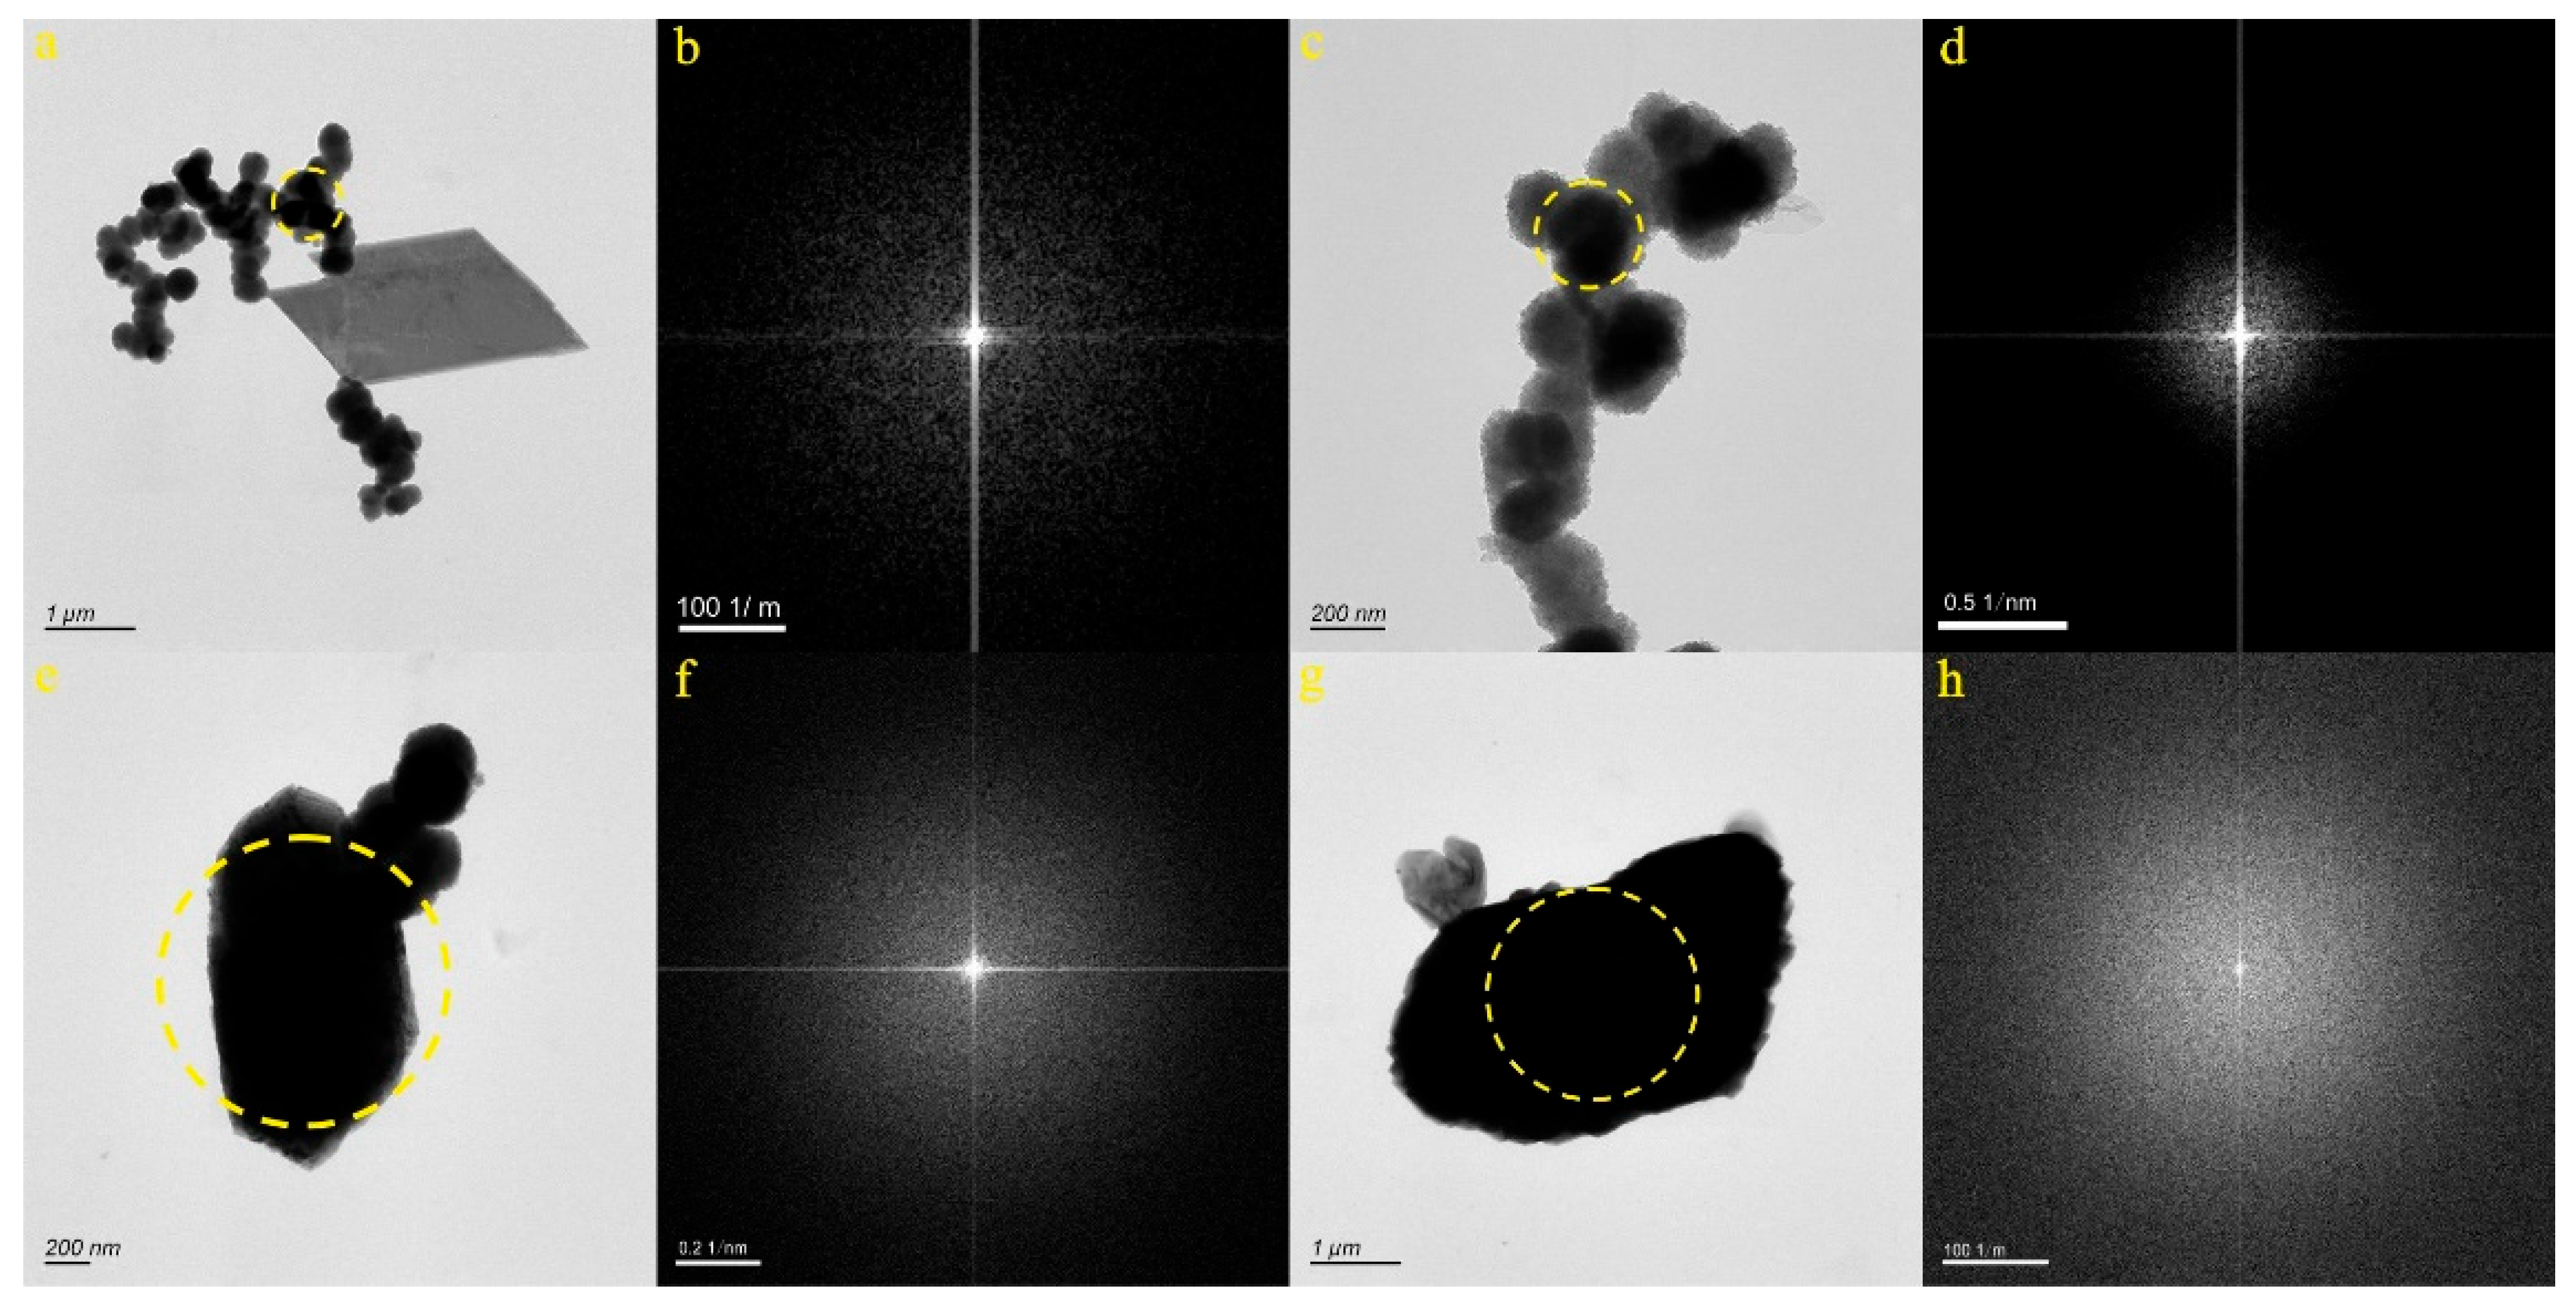
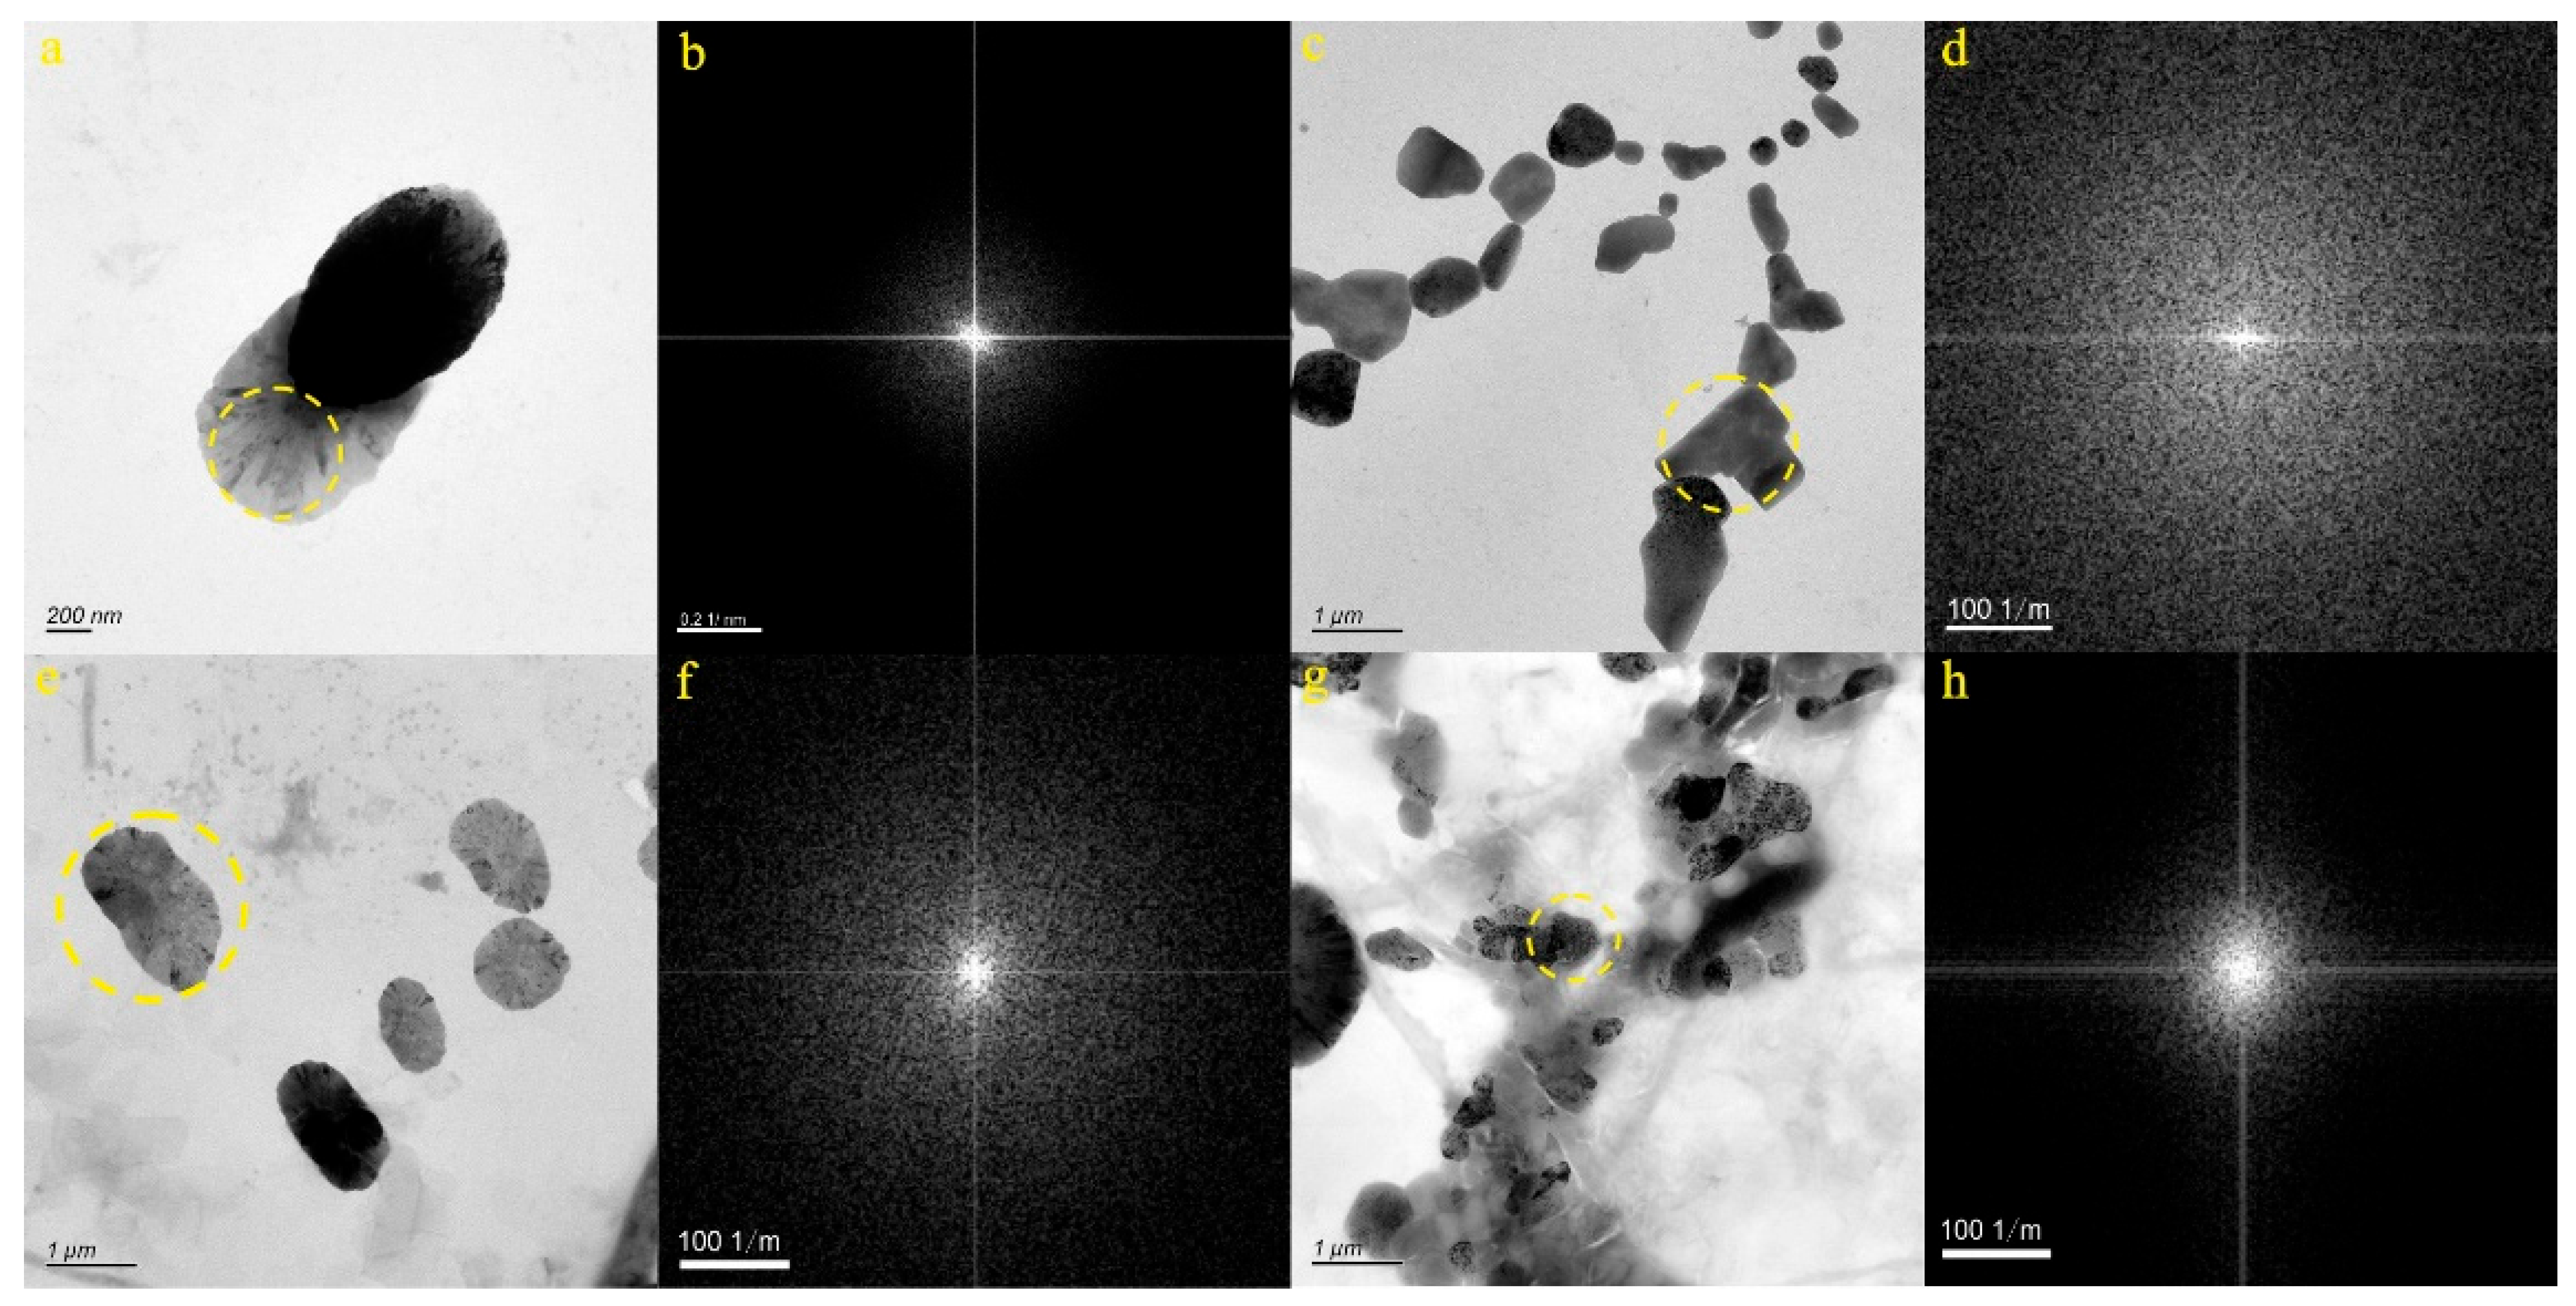
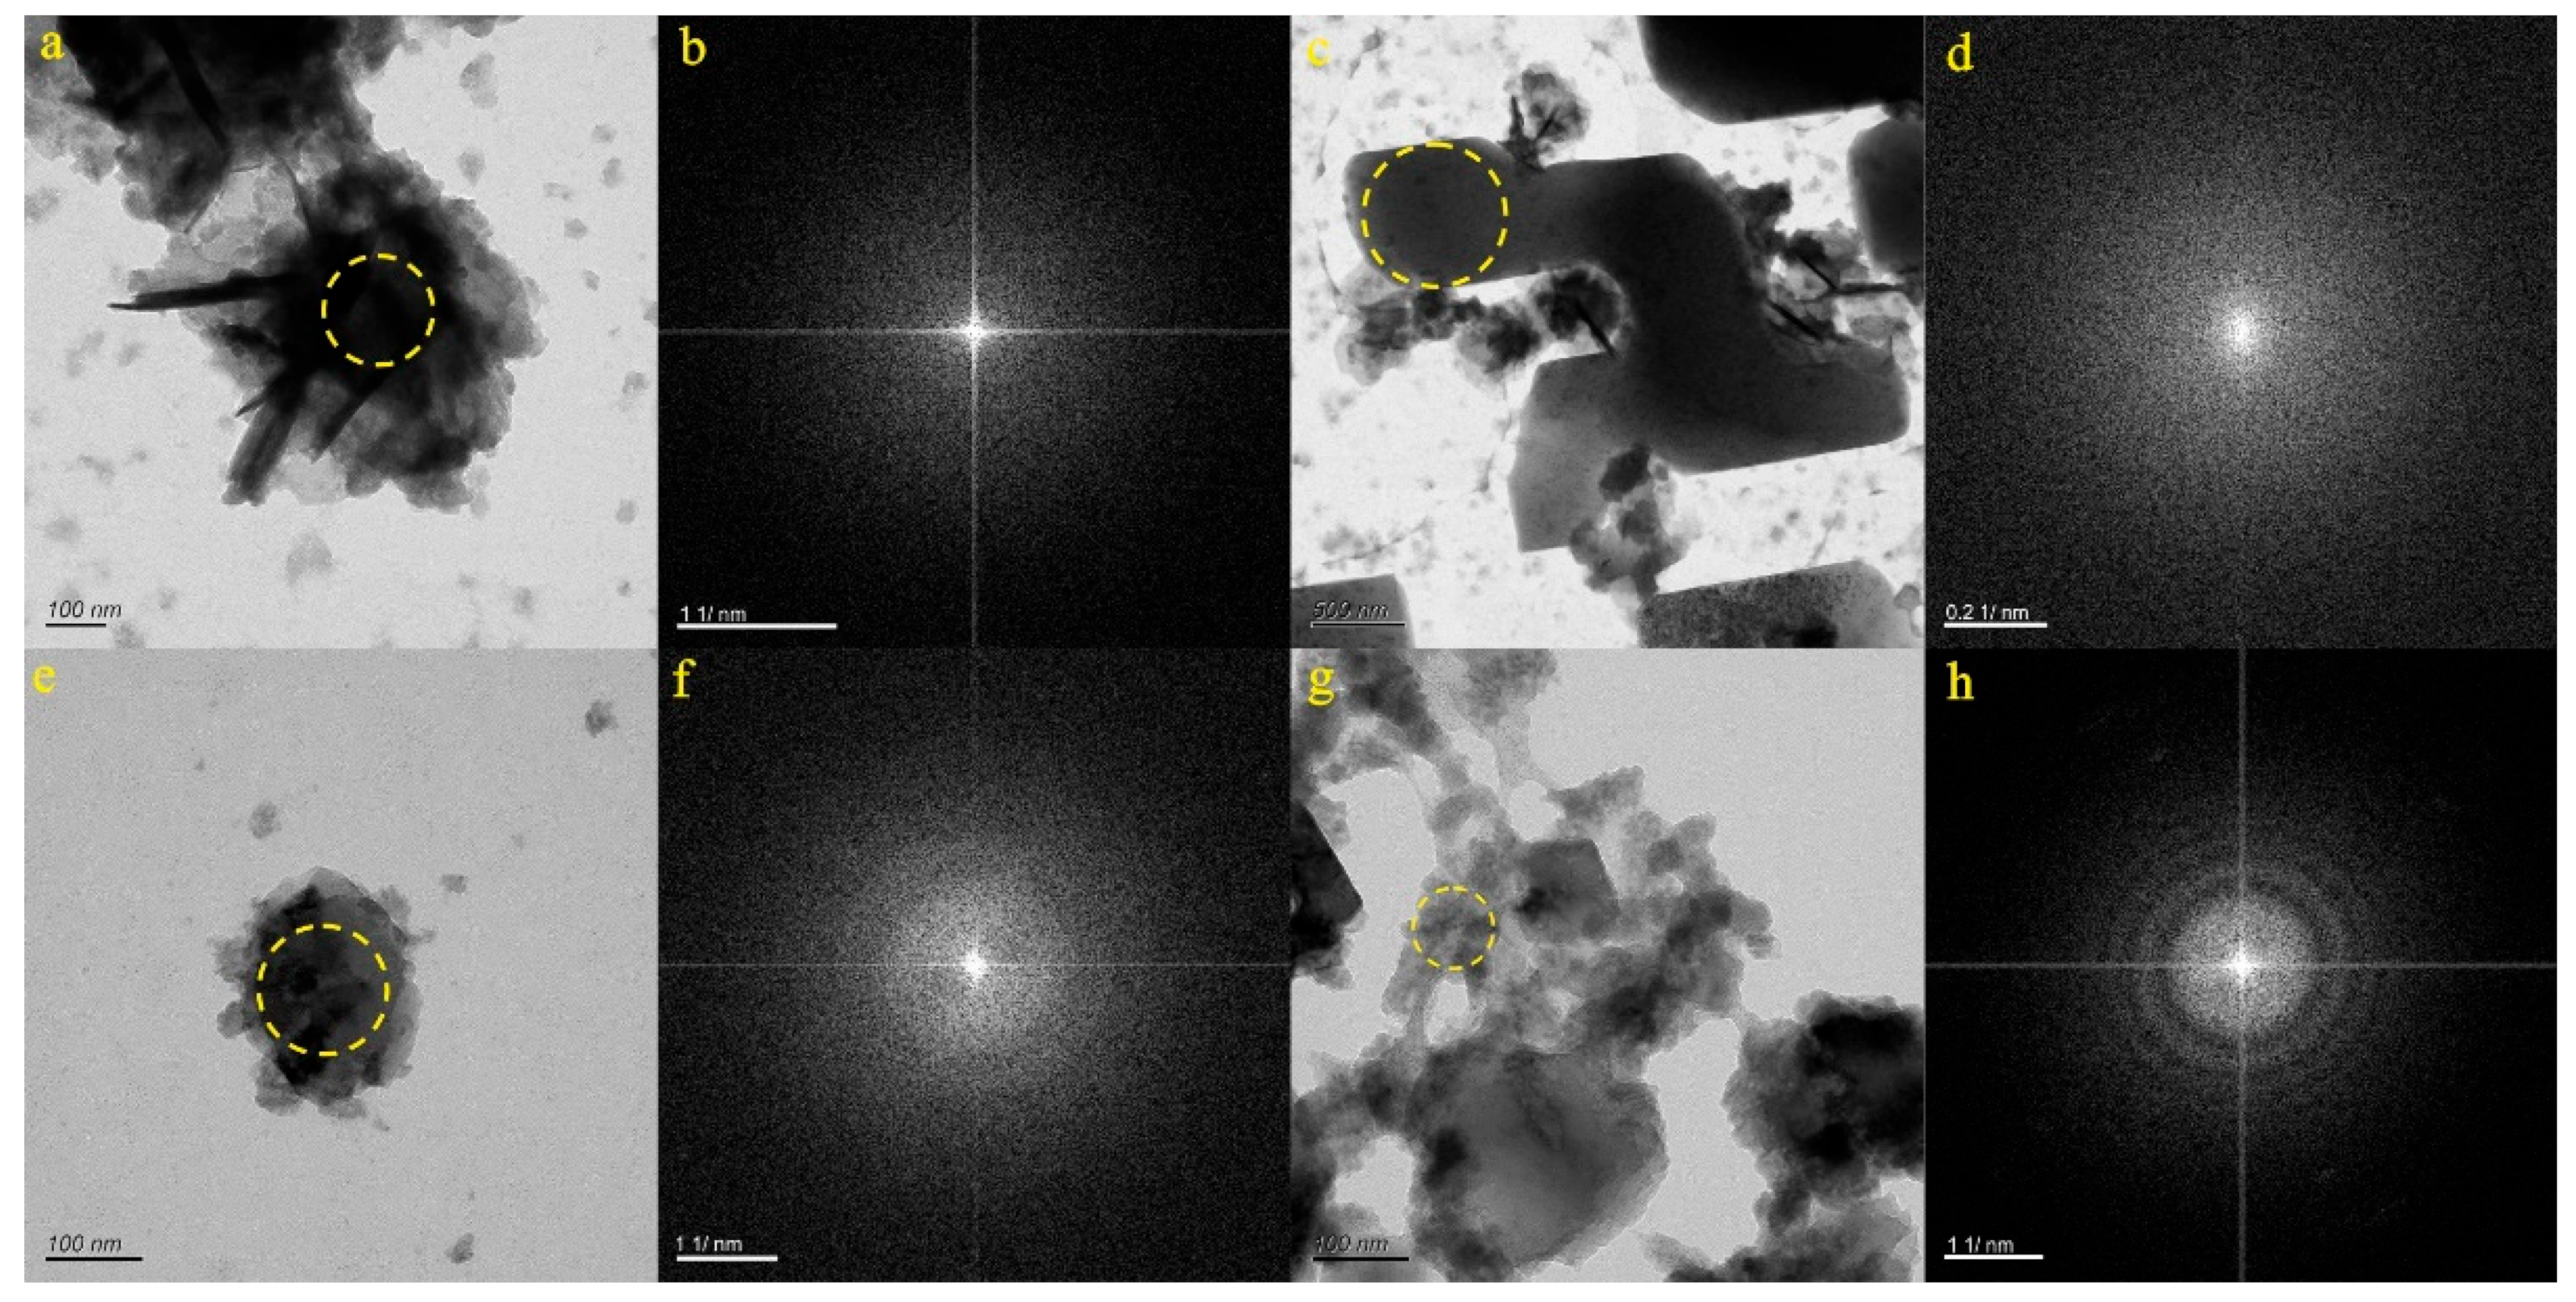
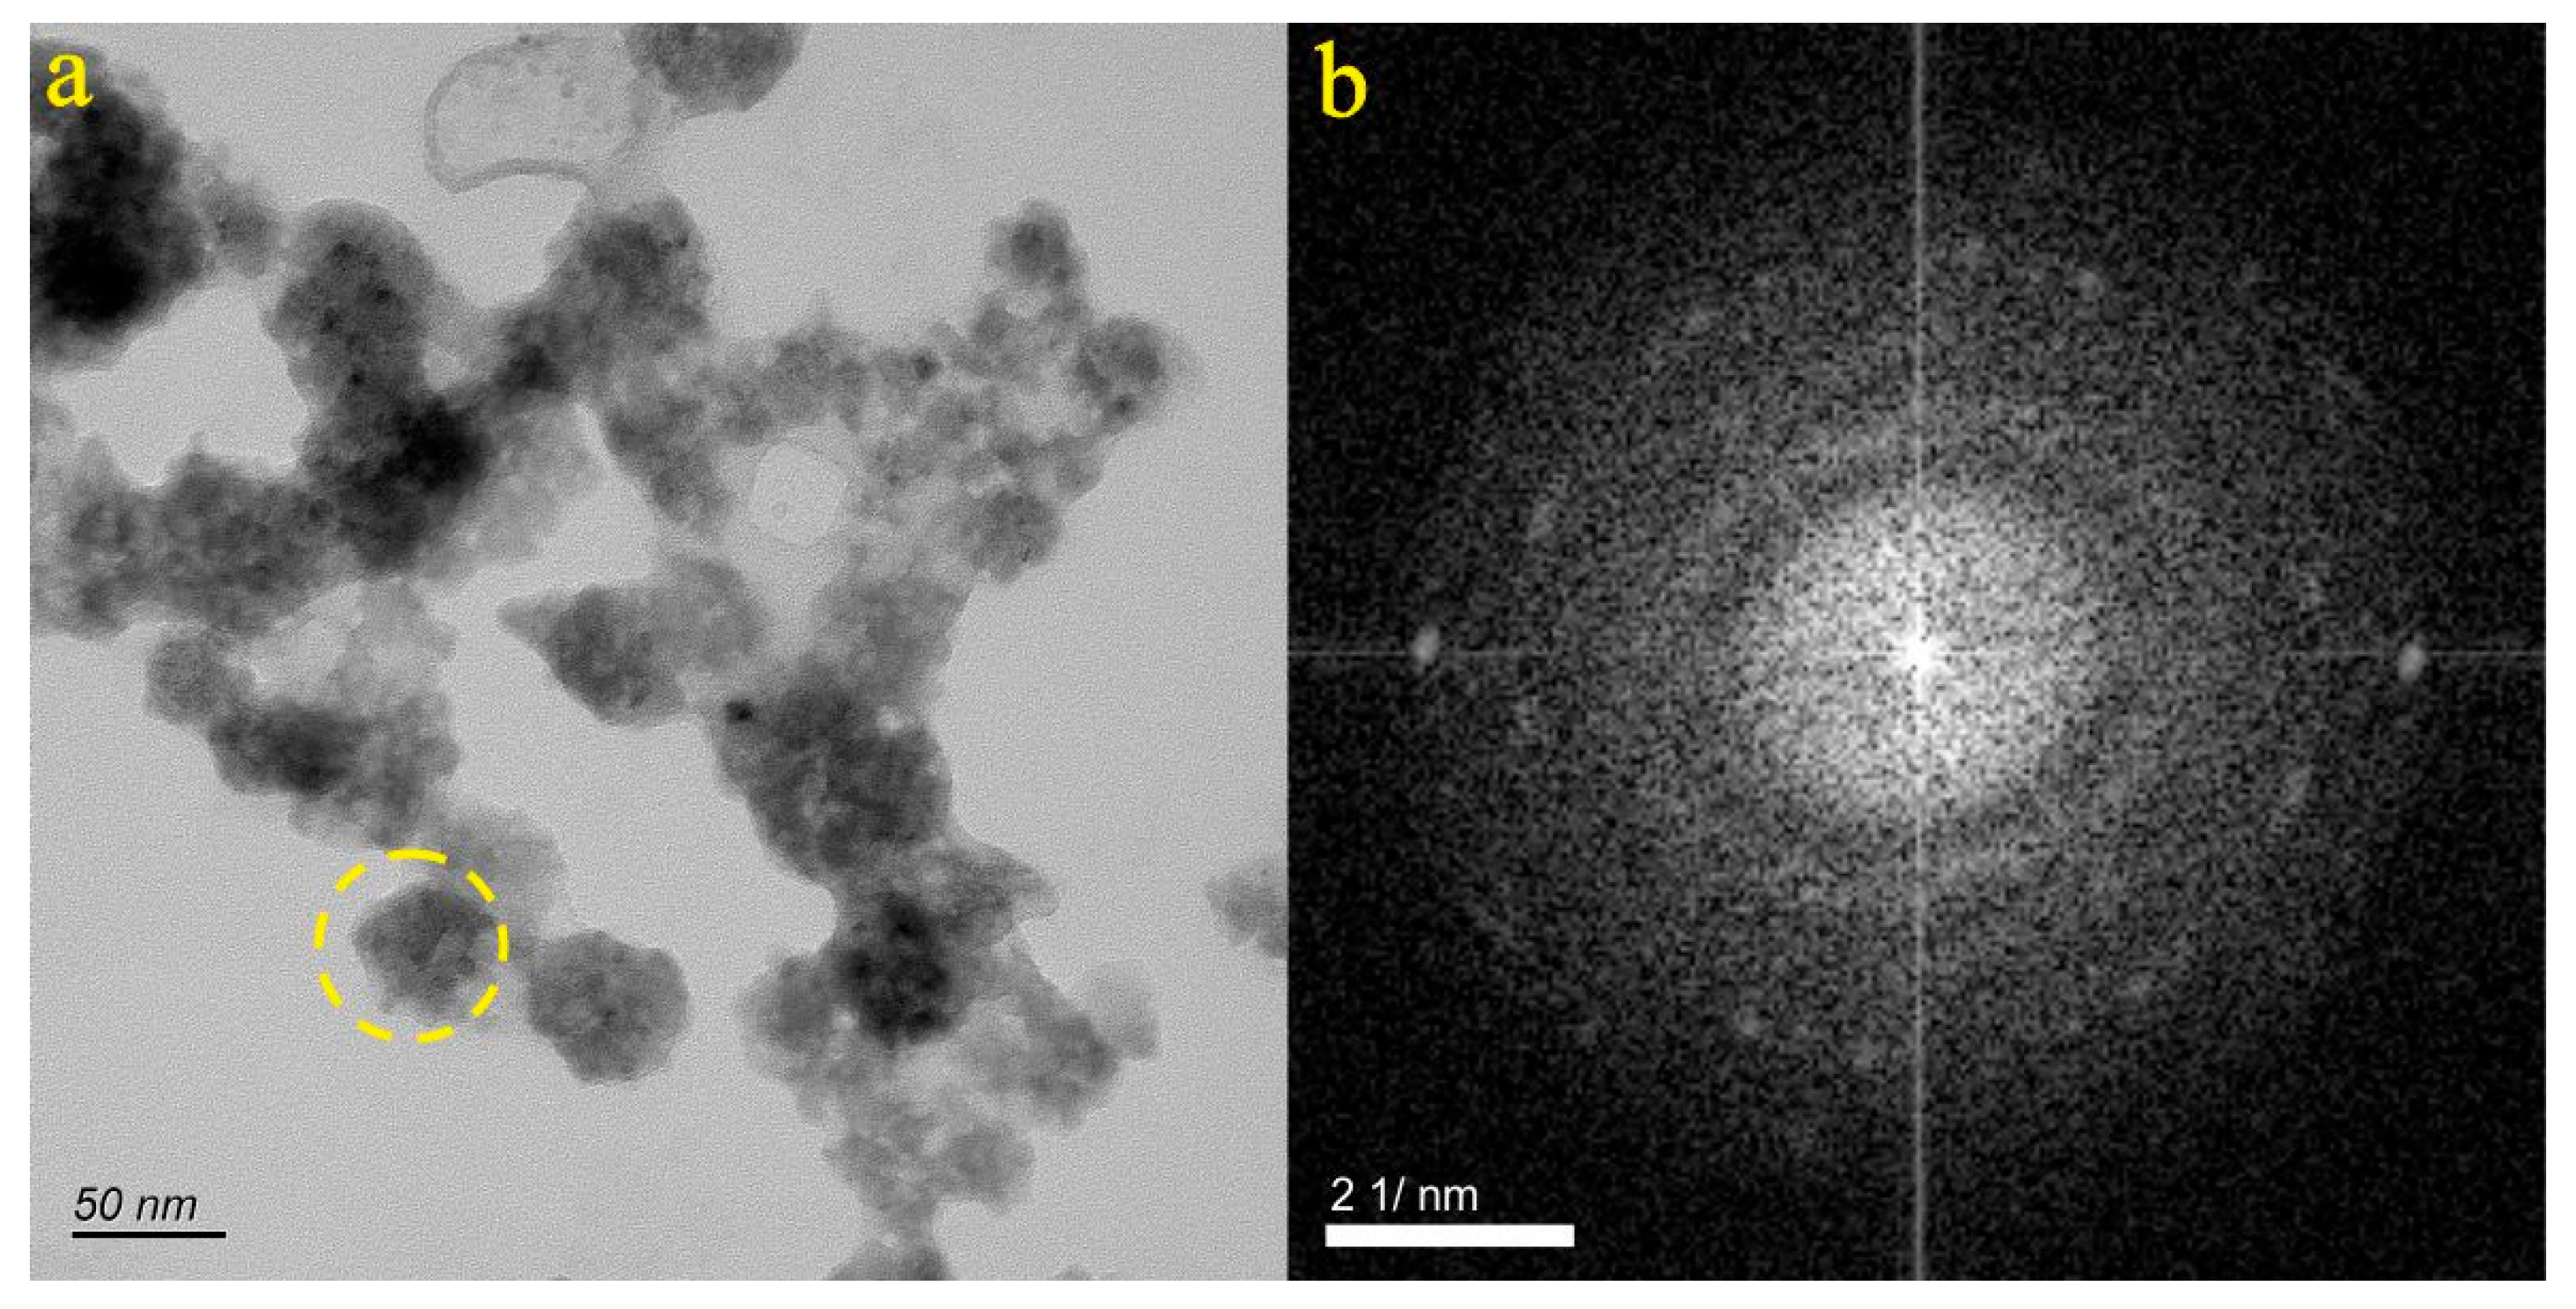
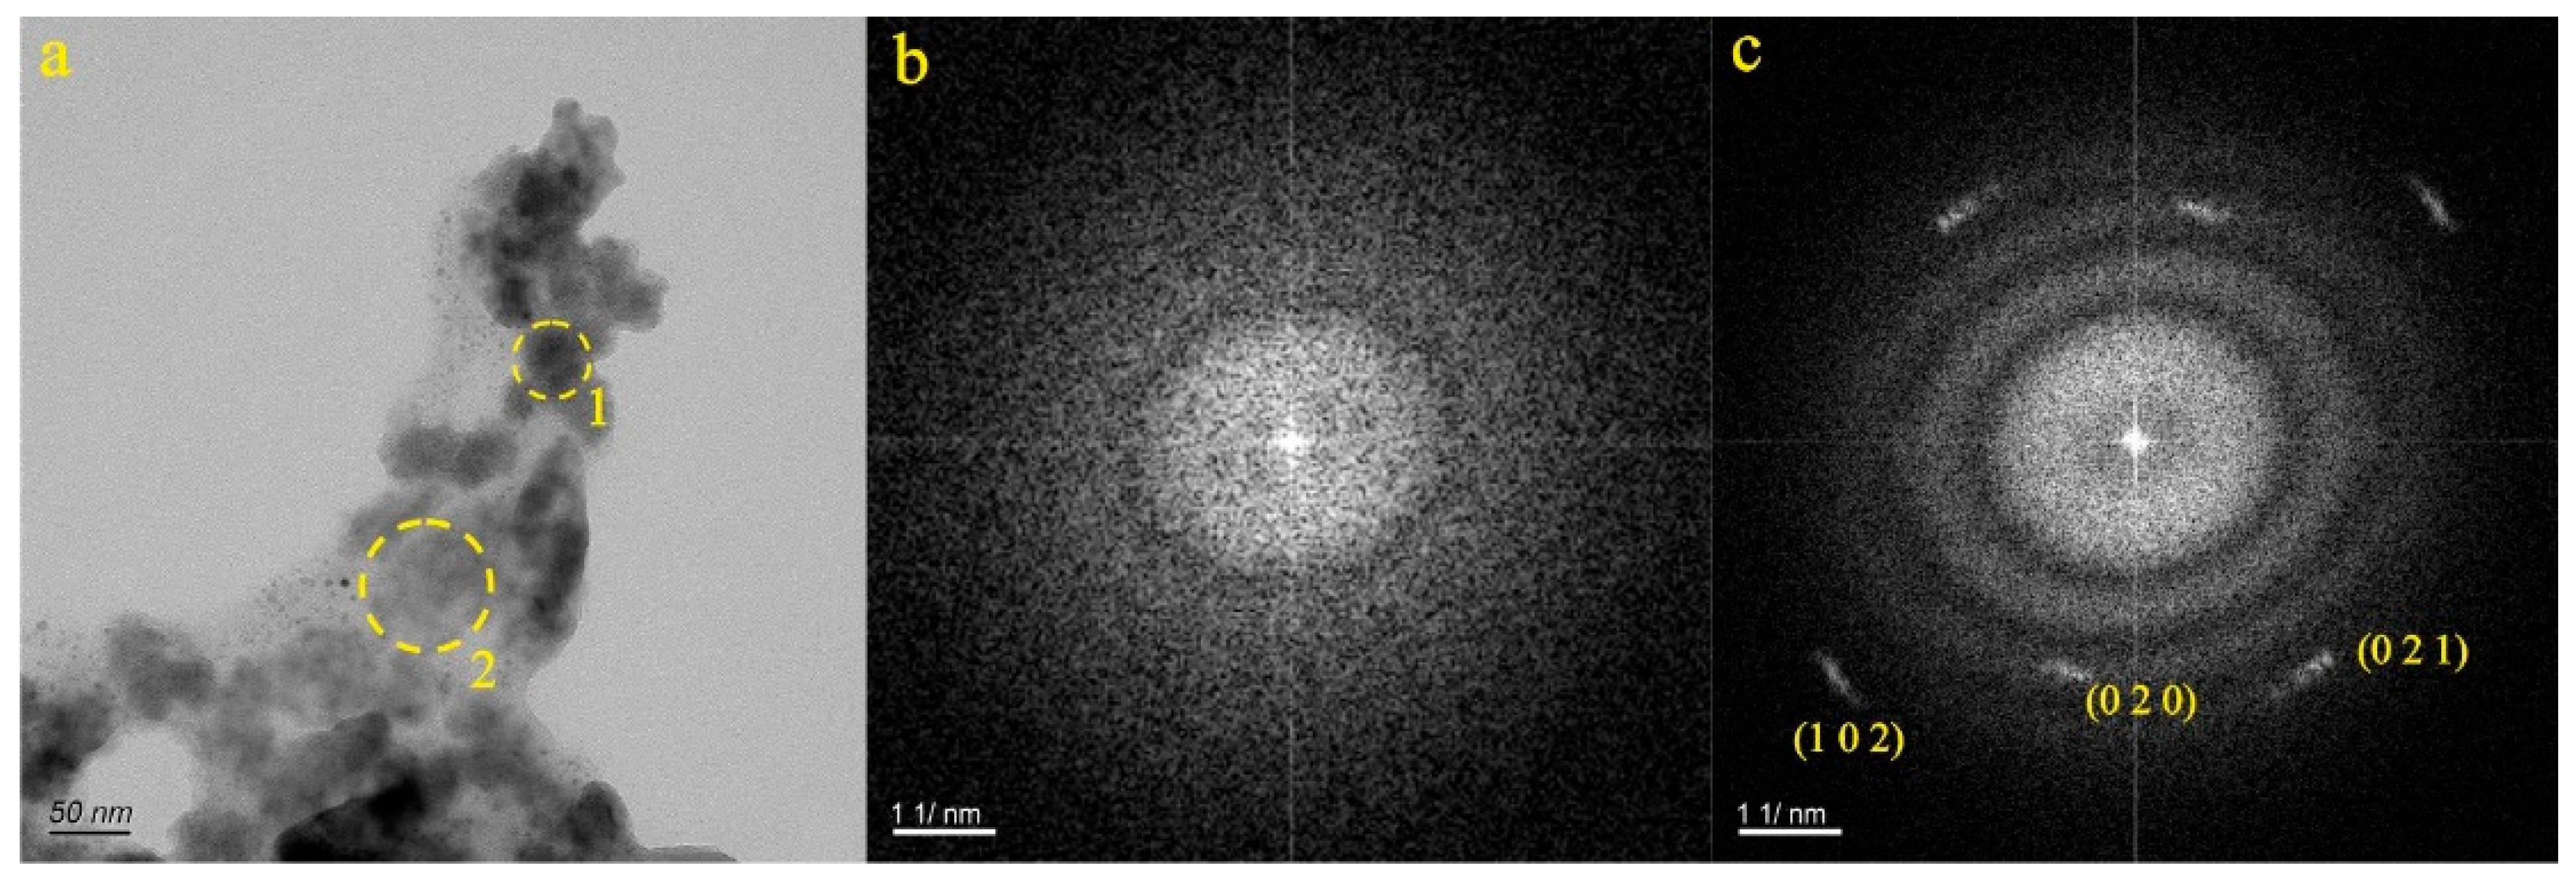
4.1. Micro-Nanoparticles in Geothermal Fluids in Jinan

A total of 16 particles were analyzed from the geothermal fluids in Jinan. TEM and EDS results suggested that these micro-nanoparticles displayed low crystallinity. These particles predominantly consisted of common chemical elements found in groundwater, including C, O, Ca, Fe, Na, Cl, and others. Notably, some anomalous elements, such as Sr, Te, In, and Pd, were detected, primarily in carbonates, sulfates, and chlorides.
We selected two micro-nanoparticles in the CJQ sample (Figure 2a,c). Figure 2a presents an image of a particle from the JN-1 sample. The particle exhibits a nearly spherical shape and the selected area electron diffraction (SAED) pattern within the dotted circle (Figure 2b) reveals the amorphous nature of the micro-nanoparticle. EDS analysis indicated that the particle was primarily composed of C (54.83%), O (15.88%), and Ca (9.81%). Consequently, it was inferred that the particle depicted in Figure 2a was composed of calcium carbonate. Figure 2c showcases the particle from the JN-2 sample, which appears granular. EDS analysis revealed that the particle was predominantly composed of Ca (62.23%), O (8.74%), and C (7.51%). Therefore, it was inferred that the particle depicted in Figure 2c consisted of carbonates and sulfates containing calcium.
We selected three micro-nanoparticles in the JR3 sample (Figure 3a,c,e). Figure 3a portrays the particle from the JN-3 sample, which exhibits a granular morphology. The SAED pattern within the dotted circle (Figure 3b) indicates the amorphous nature of the micro-nanoparticle. EDS analysis revealed that the particle was primarily composed of Ca (58.06%), O (20.31%), and C (5.38%). As a result, it was inferred that the particle depicted in Figure 3a consisted of carbonates, sulfates, and chlorine, with a calcium component.
Figure 3c showcases the particle from the JN-4 sample, which exhibits a nearly spherical shape. The SAED pattern within the dotted circle (Figure 3d) reveals the relatively well-ordered structure of the micro-nanoparticle. The d-spacing values in the (2 0 0) and (2 2 0) planes were measured at 2.820 Å and 1.991 Å, respectively. EDS analysis indicated that the particle was predominantly composed of Cl (40.33%) and Na (35.01%). The composition of the particle aligned with the data found in the PDF card 05-0628. Consequently, it was inferred that the particle depicted in Figure 3c was halite. Figure 3e illustrates the particle from the JN-5 sample, which is characterized by a cube. The SAED pattern within the dotted circle (Figure 3f) reveals the relatively well-ordered structure of the micro-nanoparticle. The d-spacing values in the (1 1 1) and (2 0 0) planes were measured at 3.264 Å and 2.826 Å, respectively. EDS analysis indicated that the particle was predominantly composed of Cl (44.66%) and Na (29.21%). The composition of the particle aligned with the data found in the PDF card 05-0628. Consequently, it was inferred that the particle depicted in Figure 3e was halite.
We selected three micro-nanoparticles in the QJZ sample (Figure 4a,c,e). Figure 4a displays the particle from the JN-6 sample, characterized by an irregular shape. The SAED pattern within the dotted circle (Figure 4b) indicates the relatively well-ordered structure of the micro-nanoparticle. The d-spacing values in the (0 1 2), (2 0 2), (1 0 4), and (0 0 6) planes were measured at 3.860 Å, 2.094 Å, 3.044 Å, and 2.850 Å, respectively. EDS analysis revealed that the particle primarily consisted of O (32.02%), Ca (33.77%), C (14.99%), and Sr (1.42%). The composition of the particle corresponded to the data found in the PDF card 05-0586. As a result, it was inferred that the particle depicted in Figure 4a was composed of calcite. Figure 4c,e present the particles from the JN-7 and JN-8 samples, consisting of a polymer chain structure. The SAED pattern within the dotted circle (Figure 4d,f) confirms the amorphous nature of the micro-nanoparticles. EDS analysis indicated that the JN-7 particle primarily contained O (45.90%), Fe (30.26%), C (8.53%), Si (3.96%), and Ca (1.39%) and the JN-8 particle primarily contained O (45.73%), Fe (31.67%), C (6.87%), Si (4.47%), and Ca (1.51%). Therefore, it was inferred that the particles depicted in Figure 4c,e were composed of carbonates containing Fe, Si, and Ca.
We selected four micro-nanoparticles in the BL sample (Figure 5a,c,e,g). Figure 5a,c present the particles from the JN-9 and JN-10 samples, consisting of a polymer chain structure. The SAED pattern within the dotted circle (Figure 5b,d) confirms the amorphous nature of the micro-nanoparticle. EDS analysis indicated that the JN-9 particle primarily contained Fe (44.99%), O (33.00%), C (7.72%), Si (3.65%), and Ca (1.66%) and the JN-10 particle primarily contained O (43.08%), Fe (32.56%), C (8.78%), Si (3.81%), and Ca (1.71%). Therefore, it was inferred that the particles depicted in Figure 5a,c were mixtures, which were composed of carbonates and silicates and contained Fe and Ca. Figure 5e presents the particle from the JN-11 sample, displaying a substantial size. The SAED pattern within the dotted circle (Figure 5f) confirms the amorphous nature of the micro-nanoparticle. EDS analysis indicated that the particle primarily contained O (30.78%), Ca (30.00%), C (17.38%) Te (5.79%), and S (1.63%). Therefore, it was inferred that the particle depicted in Figure 5e consisted of a combination of carbonates and sulfates containing Ca and Te. Figure 5g illustrates the particle from the JN-12 sample, characterized by an irregular shape. The SAED pattern within the dotted circle (Figure 5h) confirms the amorphous nature of the micro-nanoparticle. EDS analysis indicated that the particle primarily consisted of Ca (56.10%), O (15.78%), C (9.52%), and S (1.97%). Consequently, it was inferred that the particle depicted in Figure 5g was composed of a mixture of carbonate and sulfate, both containing Ca.
We selected four micro-nanoparticles in the DR2 sample (Figure 6a,c,e,g). Figure 6a displays the particle from the JN-13 sample, which takes on an approximately oval shape. The SAED pattern within the dotted circle (Figure 6b) confirms the amorphous nature of the micro-nanoparticle. EDS analysis determined that the particle primarily contained O (42.49%), C (21.55%), S (12.05%), Ca (10.62%), and Na (2.55%). As such, it was inferred that the particle depicted in Figure 6a was composed of a mixture of carbonate and sulfate, both containing Ca and Na. Figure 6c features the particle from the JN-14 sample, characterized by its substantial size; maybe it is a cracked cube. The SAED pattern within the dotted circle (Figure 6d) confirms the amorphous nature of the micro-nanoparticle. EDS analysis indicated that the particle primarily contained Cl (34.23%) and Na (32.12%). Hence, it was inferred that the particle depicted in Figure 6c primarily consisted of NaCl. Figure 6e portrays the particle from the JN-15 sample, characterized by a granular appearance. The SAED pattern within the dotted circle (Figure 6f) confirms the amorphous nature of the micro-nanoparticle. EDS analysis indicated that the particle primarily contained O (36.02%), C (12.20%), Te (11.4%), Ca (11.28%), S (10.60%), K (1.49%), In (1.60%), and Cl (1.19%). Consequently, it was inferred that the particle depicted in Figure 6e consisted of a combination of carbonates, sulfates, and chlorine, containing Ca, K, In, and Te. Figure 6g showcases the particle from the JN-16 sample, which exhibits an irregular shape. The SAED pattern within the dotted circle (Figure 6h) confirms the amorphous nature of the micro-nanoparticle. EDS analysis indicated that the particle primarily contained Cl (32.92%) and Na (23.60%). As a result, it was inferred that the particle depicted in Figure 6g consisted mainly of NaCl; there may also be a small amount of NaCO3 or NaHCO3.

4.2. Micro-Nanoparticles in Geothermal Fluids in Zibo

Altogether, we analyzed nine particles from geothermal fluid samples obtained in Zibo. TEM and EDS results suggested that these micro-nanoparticles exhibited low crystallinity. They were primarily composed of common chemical elements typically found in groundwater, including C, O, Fe, S, Na, Cl, Ca, and a few anomalous elements, like Ba. These elements were predominantly present in the form of carbonates and chlorides.
Figure 7a showcases the particle from the ZB-1 sample, characterized by its irregular shape. The SAED pattern within the dotted circle (Figure 7b) confirms the amorphous nature of the micro-nanoparticle. EDS analysis determined that the particle primarily contained O (53.38%), Cl (31.07%), C (7.76%), Si (4.21%), and Ca (3.56%). As a result, it was inferred that the particle depicted in Figure 7a was a mixture, which was composed mainly of carbonates, chlorines, and silicates and contained Ca. Figure 7c presents the particle from the ZB-2 sample, characterized by its irregular shape. The SAED pattern within the dotted circle (Figure 7d) confirms the amorphous nature of the micro-nanoparticle. EDS analysis determined that the particle primarily contained Na (33.26%), O (21.29%), Cl (17.48%), C (13.55%), Si (12.47%), and Ca (1.93%). Consequently, it was inferred that the particle depicted in Figure 7c was composed mainly of carbonates and chlorine, with calcium, sodium, and silicon components. Figure 7e portrays the particle from the ZB-3 sample, presenting a granular appearance. The SAED pattern within the dotted circle (Figure 7f) confirms the amorphous nature of the micro-nanoparticle. EDS analysis indicated that the particle primarily contained O (46.15%), C (32.55%), and Ca (20.41%). As a result, it was inferred that the particle depicted in Figure 7e consisted mainly of carbonates, containing calcium and silicon. Figure 7g features the particle from the ZB-4 sample, which takes on an irregular shape. The SAED pattern within the dotted circle (Figure 7h) confirms the amorphous nature of the micro-nanoparticle. EDS analysis indicated that the particle primarily contained C (32.42%), O (29.62%), Ba (20.74%), Si (9.70%), S (5.47%), and Ca (2.02%). Consequently, it was inferred that the particle depicted in Figure 7g consisted mainly of a combination of carbonates and sulfates, containing calcium, silicon, and barium.
Figure 8a presents the particles from the ZB-5 and ZB-6 samples. The particles are characterized by their irregular shape. The SAED pattern within the dotted circles (Figure 8b,c) confirms the amorphous nature of Particle 1 and the amorphous nature of Particle 2. EDS analysis determined that Particle 1 primarily contained O (31.92%), C (24.61%), Fe (19.87%), Si (14.58%), and Ca (8.99%). As a result, it was inferred that Particle 1 consisted mainly of carbonates, containing calcium, silicon, and iron. EDS analysis determined that Particle 2 primarily contained C (32.96%), O (31.95%), Ca (30.77%), and Si (4.31%). Consequently, it was inferred that Particle 2 primarily consisted of carbonates, containing Ca and Si.
Figure 9a illustrates the particle from the ZB-7 sample, which appears as irregular aggregates. The SAED pattern within the dotted circle (Figure 9b) shows the micro-nanoparticles transitioning from an amorphous to a crystalline state. EDS analysis indicated that the particle primarily contained C (51.16%), O (27.36%), Cl (18.18%), Si (2.14%), and Ca (1.15%). Consequently, it was inferred that the particle depicted in Figure 9a was a mixture, which consisted mainly of carbonates, chlorides, and silicates and contained Ca.
Figure 10a presents the particles from the ZB-8 and ZB-9 samples, displaying irregular shapes. The SAED pattern within the dotted circle (Figure 10b) confirms the amorphous nature of the particle. EDS analysis determined that the particle primarily contained O (46.58%), Fe (22.75%), C (17.95%), Si (11.14%), and Ca (1.56%). As a result, it was inferred that Particle 1 consisted primarily of carbonates, containing calcium, iron, and silicon. The SAED pattern within the dotted circle (Figure 10c) reveals the relatively well-ordered structure of Particle 2. The d-spacing values in the (0 2 0), (0 2 1), and (1 0 2) planes were measured at 4.447 Å, 3.656 Å, and 2.753 Å, respectively. EDS analysis indicated that the particle primarily consisted of C (42.87%), Ba (26.71%), Ca (1.35%), O (18.72%), S (7.50%), and Si (2.82%). The composition of the particle matched the data found in the PDF card 05-0378. Therefore, it was inferred that Particle 2 was witherite.

5. Discussion

5.1. Characteristics of Micro-Nanoparticles in Geothermal Samples in the Central Area of Shandong Province

This study involved the collection of geothermal fluid samples from both Jinan and Zibo, allowing for a comparative analysis. Within these geothermal fluids from the central area of Shandong Province, a multitude of micro-nanoparticles were identified using nanoparticle tracking and examination via transmission electron microscopy (TEM). This examination encompassed an evaluation of their type, size, shape, lattice parameters, and chemical composition. Additionally, trace elements, like Fe, Sr, Te, In, Pd, and Ba, were detected. Carbon and oxygen were consistently identified in all particles, often making up a substantial proportion, owing to the carbonate nature of the aquifer. Furthermore, Ca, Fe, and Na were frequently observed in the samples, with mass fractions reaching as high as 62.23%, 44.99%, and 35.01%, respectively. By analyzing the elements, lattice spacing, and atomic ratio in geothermal fluid particles, it was found that the particles mainly consist of carbonates, sulfates, and chlorides, which contain elements such as Ca, Na, Fe, Mg, and Si.

5.2. Characteristics and Significance of Micro-Nanoparticles in Geothermal Samples in Different Regions of the Central Area of Shandong Province

5.2.1. New Forms of the Existence of Elements in Geothermal Fluids

In the study of geothermal fluids, researchers usually only pay attention to the ionic forms of elements contained in the fluids; however, we found a new form of elements, especially Ca, Fe, Na, and Cl, through the study of geothermal fluids in central Shandong Province. The results show that natural micro-nanoparticles can be stably present in geothermal fluids and the elements can be transported in the form of micro-nanoparticles. We found, for the first time, that halite exists in crystalline form in geothermal fluids (e.g., JN-4, JN-5). This is also a new discovery of the form of existence of halite on a microscopic level. Meanwhile, we found that the micro-nanoparticles with higher Fe content were amorphous and always existed in the form of chain polymers (e.g., JN-7, JN-8, JN-9, JN-10), indicating that the aggregation-based growth of the Fe may exist in the geothermal fluids. And, Fe-bearing nanoparticles are widely present in geothermal fluids. This is also a new discovery in terms of the form of Fe existence at the microscopic level. And, in this study, we found that the carbonates were usually amorphous.

5.2.2. Differences in the Elements Contained in Nanoparticles in Geothermal Fluids in the Two Areas

The analysis of the chemical composition of micro-nanoparticles in the geothermal fluid samples from Jinan and Zibo unveiled the presence of trace elements, revealing notable distinctions in the elemental composition between particles from these two regions. Specifically, micro-nanoparticles in the geothermal fluids from Jinan contained trace elements, such as Sr, Te, In, and Pd. For instance, JN-5 exhibited a Sr content of 1.42% while the Te contents in the micro-nanoparticles from JN-8 and JN-11 were 5.79% and 11.40%, respectively. The In content in JN-11 was 1.6% and the Pd content in JN-12 was 7.60% (Table 2). Conversely, the micro-nanoparticles in the geothermal fluids from Zibo displayed high levels of Ba content. For instance, the Ba contents in ZB-4 and ZB-9 were 20.74% and 26.71%, respectively (Table 2). The EDS data in Table 2 illuminated that both regions’ geothermal fluids contained a wealth of micro-nanoparticles; however, variations in their chemical compositions and elemental concentrations were evident. These distinctions may be attributed to differences in the geological and hydrogeological backgrounds, as well as the surrounding environments of the two sampling areas.
Prior research on the geothermal resources in Jinan highlighted the significant role of a gabbro-diorite intrusion into the Ordovician Majiagou Formation limestone in shaping Jinan’s geothermal resources. These studies identified the Jinan gabbro as rich in elements, such as strontium and lead [40], with carbonate formations proving to be ideal environments for strontium enrichment [41]. When magma intrudes, it brings along various soluble chemical components, including trace elements like strontium and fluorine in geothermal fluids [39]. These elements are valuable for medicinal baths. Notably, tellurium ores are primarily of the dolomite-telluride type, indicating that dolomite serves as a crucial host for tellurium minerals. The primary aquifer in the area is situated within a carbonate formation, primarily composed of minerals like dolomite (CaMg(CO3)2), calcite (CaCO3), and gypsum (CaSO4) [42]. Therefore, the presence of tellurium in Jinan’s geothermal fluids can be attributed to the dolomite within the aquifer rock. Indium, while abundant in Earth’s crust, is also found in common hornblende. Thus, the presence of indium may be linked to the gabbro-diorite intrusion. In previous research on geothermal resources in Zibo, it was revealed that geothermal fluids are found within a fracture system and their hydrochemical type is primarily SO4·Cl-Na·Ca. Alongside conventional elements, these geothermal fluids contain numerous trace elements, such as silicon and barium [43,44,45]. Furthermore, as geothermal fluids undergo deep circulation, their temperature increases, enhancing dissolution and filtration processes. This leads to the dissolution of trace elements from the surrounding rock into the geothermal fluids, a consequence of alternating geothermal fluid circulation and favorable geochemical conditions [46].

5.2.3. Formation and Significance of Micro-Nanoparticles in Geothermal Fluids

Micro-nanoparticles primarily originate through processes such as mineralization, taphrogenesis, and oxidation [47]. In the geothermal fluids of the central area of Shandong Province, the micro-nanoparticles are predominantly present in the form of carbonates, sulfates, and chlorides, suggesting that they exist within a relatively oxidized environment. Some micro-nanoparticles in the geothermal fluids are in the form of sulfates, which we believe are a result of the oxidation of sulfides. The analysis of trace elements indicates a strong connection between the formation of these micro-nanoparticles and magmatic activity. Furthermore, the central area of Shandong Province is characterized by the presence of numerous fault zones. These fault zones serve as pathways for oxygen to penetrate deep into the subsurface layers, thereby enhancing the overall oxygen fugacity between the different rock layers. This increased oxygen content in the subsurface environment contributes to the formation of various types of micro-nanoparticles in the geothermal fluids.
Indeed, fault activity plays a crucial role in the generation of micro-nanoparticles. It often leads to the mechanical disintegration, milling, and oxidation of the adjacent rocks, which fosters the formation of oxide particles [47]. Furthermore, the hydraulic connections established through fault systems play a key role. Geothermal fluids are influenced not only by the pressure gradients along geological formations but also by the structural features dictated by faults. In many cases, these fluids flow along or across geological structures and hydraulic connectivity can be established between different aquifers [46]. Therefore, the utilization of the characteristics of micro-nanoparticles in these fluids can be both feasible and essential for the detection of deep-hidden geothermal resources. The temperature, chemical composition, and content of karst water formed in different geothermal regions are different, which also proves that the recharge, circulation depth, and circulation path of karst water in different regions are different. In addition, according to the research of Jiang et al. [46], the fluids of carbonate thermal reservoirs in the Luzhong geothermal area have not yet reached the equilibrium state and the dissolution is still in progress. Therefore, the differences in the types and contents of trace elements in geothermal fluids in the two regions can also be inferred to be different between the two aquifers.

5.3. Application Prospects of Nanomaterials in Fluids in Deep Geothermal Resource Exploration

Deep geothermal resources are frequently linked to thermal reservoirs, which are distinctive geological formations. Fluids from the Earth’s interior transport micro-nanoparticles associated with these thermal reservoirs. And, they are rich in special geochemicals associated with deep geological bodies [48], as depicted in Figure 11. Geological fluids have flow characteristics and their migration and positioning are controlled by tectonic processes. Fluids are dynamically driven to migrate along transport channels or translocation systems (fracture systems, unconformity surfaces, permeable rock formations, etc.). The inherent characteristics of these nanomaterials, including their morphology, elemental composition, and polymerization state, provide valuable insights into the deep thermal reservoirs’ properties. Meanwhile, studies have shown that nanoscale materials in geological bodies can provide more direct and rich information about deep geological bodies; these materials are also an important means of detecting deep geological bodies [26]. Therefore, it is entirely viable to employ the nanomaterial analysis of geothermal fluids as a means to explore deep geothermal resources. In summary, the exploration of deep geothermal resources through the analysis of nanomaterials in fluids is not only theoretically and technically feasible but also holds immense practical potential.

6. Conclusions

Through the analysis of the micro-nanoparticles in geothermal fluid from the central area of Shandong Province, it is found that these micro-nanoparticles mainly exist in the forms of carbonates, sulfates, and chlorides and can be found as single particles or aggregates, with sizes ranging from 100 nm to 5 μm. Their shapes are predominantly irregular, massive, granular, or nearly spherical. EDS results further illustrated differences in the chemical composition and element content of the micro-nanoparticles between the two studied areas, suggesting variations in their hydrogeological backgrounds. In Jinan, these micro-nanoparticles are primarily influenced by soluble chemical components from intrusive magma and aquifer ore bodies. In contrast, the micro-nanoparticles in Zibo are mainly impacted by fracture systems and aquifers. Additionally, differences in trace element types and contents within the geothermal fluids in these regions indicate distinctions in their respective aquifers. Our examination of the geological profile of the study area unveiled that these micro-nanoparticles are intricately linked to magmatic and fault activities, indicating the presence of a relatively oxidizing environment. Traditional exploration techniques have their limitations when it comes to investigating deep geothermal resources, which is why pioneering exploration theories and methods can bring about significant breakthroughs in uncovering these concealed resources. This study introduces a novel concept for identifying deeply concealed geothermal resources, focusing on the unique characteristics of micro-nanoparticles within geothermal fluids and obtaining vital information about these particles during their extensive spatial migration. Furthermore, the study of micro-nanoparticles can aid in detecting groundwater pollution by analyzing parameters such as particle type, structure, element content, and any anomalies that may be attributed to deep geothermal resources or human factors.

Supplementary Materials

The following supporting information can be downloaded at: https://www.mdpi.com/article/10.3390/w15213737/s1, Figure S1: Morphology of Jinan sample particles; Figure S2: Morphology of Zibo sample particles.

Author Contributions

Methodology, P.Z.; Investigation, Y.W.; Data curation, G.M.; Writing—original draft, L.Z.; Writing—review & editing, R.L.; Funding acquisition, R.L. All authors have read and agreed to the published version of the manuscript.

Funding

The research was funded by [National Natural Science Foundation of China] grant number [42102076] and [Natural Science Foundation of Shandong Province] granter unmber [ZR2021QD037].

Data Availability Statement

The data presented in this study are available on request from the corresponding author.

Conflicts of Interest

The authors declare no conflict of interest.

References

  1. Haenel, R.; Rybach, L.; Stegena, L. Fundamentals of geothermics. In Handbook of Terrestrial Heat-Flow Density Determination: With Guidelines and Recommendations of the International Heat-Flow Commission; Springer: Dordrecht, The Netherlands, 1988; pp. 9–57. [Google Scholar]
  2. Chen, M.X.; Wang, J.Y. Review and prospect on geothermal studies in China. Acta Geophys. Sin. 1994, 37, 320–338. [Google Scholar]
  3. Hu, S.-B.; He, L.-J.; Wang, J.-Y. Compilation of Heat Flow Data in the China Continental Area (3rd Edition). Chin. J. Geophys. 2001, 44, 604–618. [Google Scholar] [CrossRef]
  4. Gong, Y.L.; Wang, L.S.; Liu, S.W.; Li, C.; Han, Y.B.; Li, H.; Liu, B.; Cai, J.G. Distribution characteristics of terrestrial heat flow in Jiyang depression. Sci. China Ser. D 2003, 33, 384–391. [Google Scholar]
  5. Puppala, H.; Jha, S.K. Extraction schemes to harness geothermal energy from puga geothermal field, India. Energy Sources Part A Recovery Util. Environ. Eff. 2019, 43, 1912–1932. [Google Scholar] [CrossRef]
  6. Bhardwaj, K.N.; Tiwari, S.C. Geothermal energy resource utilization: Perspectives of the Uttarakhand Himalaya. Curr. Sci. Ence 2008, 95, 846–850. [Google Scholar]
  7. Hu, S.B.; Zhu, C.Q.; Xu, M.; Shan, J.N.; Tian, Y.T.; Rao, S.; Wang, J.Y. Thermal History Reconstruction of Sedimentary Basin and Its Application; Chinese Geophysical Society: Hefei, China, 2009; Volume 785. [Google Scholar]
  8. Xu, S.G.; Guo, Y.S. Heat Foundation; Beijing Science Press: Beijing, China, 2009. [Google Scholar]
  9. Shortall, R.; Davidsdottir, B.; Axelsson, G. Geothermal energy for sustainable development: A review of sustainability impacts and assessment frameworks. Renew. Sustain. Energy Rev. 2015, 44, 391–406. [Google Scholar] [CrossRef]
  10. Li, Y.Y.; Duo, J.; Zhang, C.J.; Chi, G.X.; Wang, G.L.; Zhang, F.F.; Xing, Y.F.; Zhang, B.J. Genetic relationship between geothermal energy and hydrothermal uranium deposits: Research progress and method. Geol. Rev. 2020, 66, 1361–1375. [Google Scholar]
  11. Zhang, J.; Dong, M.; Wang, B.Y.; Ai, Y.F.; Fang, G. Geophysical analysis of geothermal resources and temperature structure of crust and upper mantle beneath Guanzhong Basin of Shaanxi, China. J. Earth Sci. Environ. 2021, 43, 150–163. [Google Scholar] [CrossRef]
  12. Liao, Z.J.; Zhao, P. Yunnan-Tibet Geothermal Zone: Geothermal Resources and Typical Geothermal Systems; Beijing Science Press: Beijing, China, 1999. [Google Scholar]
  13. Wang, G.L.; Zhang, W.; Liang, J.Y.; Lin, W.J.; Liu, Z.M.; Wang, W.L. Evaluation of geothermal resources potential in China. Acta Geosci. Sin. 2017, 38, 449–450+134+451–459. [Google Scholar]
  14. Wang, S.Q.; Lu, C.; Nan, D.W.; Hu, X.C.; Shao, J.L. Geothermal resources in Tibet of China: Current status and prospective de-velopment. Environ. Earth Sci. 2017, 76, 239. [Google Scholar] [CrossRef]
  15. Kumar, L.; Hossain, S.; Assad, M.E.H.; Manoo, M.U. Technological Advancements and Challenges of Geothermal Energy Systems: A Comprehensive Review. Energies 2022, 15, 9058. [Google Scholar] [CrossRef]
  16. Wang, G.L.; Lu, C. Stimulation technology development of hot dry rock and enhanced geothermal system driven by carbon neutrality target. Geol. Resour. 2023, 32, 85–95+126. [Google Scholar] [CrossRef]
  17. Lin, W.J.; Liu, Z.M.; Wang, W.L.; Wang, G.L. The assessment of geothermal resources potential of China. Geol. China 2013, 40, 312–321. [Google Scholar]
  18. Wang, G.L.; Liu, Y.G.; Zhu, X.; Zhang, W. The status and development trend of geothermal resources in China. Earth Sci. Front. 2020, 27, 1. [Google Scholar] [CrossRef]
  19. Lin, W.; Wang, G.; Gan, H.; Zhang, S.; Zhao, Z.; Yue, G.; Long, X. Heat source model for Enhanced Geothermal Systems (EGS) under different geological conditions in China. Gondwana Res. 2023, 122, 243–259. [Google Scholar] [CrossRef]
  20. Wang, G.L.; Lin, W.J.; Liu, F.; Gan, H.N.; Wang, S.Q.; Yue, G.F.; Long, X.T.; Liu, Y.G. Theory and survey practice of deep heat accumulation in geothermal system and exploration practice. Acta Geol. Sin. 2023, 97, 639–660. [Google Scholar] [CrossRef]
  21. Yuan, G.Q.; Li, F.; Zheng, H.S.; Ding, Z.Q. Geophysical technologies and their application effects for exploration of deep metallic mineral. Comput. Tech. Geophys. Geochem. Explor. 2010, 32, 495–499+455. [Google Scholar]
  22. Li, X.; Wang, F.; Luo, D.F. The effects of applying integrated geophysical method to the prospecting for the Jiangcheng concealed lead Yunnan Province. Geophys. Geochem. Explor. 2015, 39, 1119–1123. [Google Scholar] [CrossRef]
  23. Zhang, S.; Li, F.L.; Gong, J.J.; Bao, Z.Y.; Xie, S.Y.; Cui, F.; Su, Z.W.; Zeng, Y.H. Application of hydrocarbons in concealed tungsten ore prediction in Weijia, Nanling Area. Earth Sci. J. China Univ. Geosci. 2012, 37, 1149–1159. [Google Scholar]
  24. Chen, K.; Jiao, J.J.; Huang, J.; Huang, R. Multivariate statistical evaluation of trace elements in groundwater in a coastal area in Shenzhen, China. Environ. Pollut. 2007, 147, 771–780. [Google Scholar] [CrossRef]
  25. Zhou, F.; Zhu, J.; Zhang, P.; Yuan, S.H. Effect of groundwater components on hydroxyl radical production by Fe (Ⅱ) oxygenation. Earth Sci. 2017, 42, 1039–1044. [Google Scholar] [CrossRef]
  26. Cao, J.J. A technique for detecting concealed deposits by combining geogas particle characteristics with element concentrations. Met. Mine 2009, 2, 1–4. [Google Scholar]
  27. Frimmel, F.H.; Niessner, R. Nanoparticles in the Water Cycle || Nanoparticles in Groundwater–Occurrence and Applications; Springer: Berlin/Heidelberg, Germany, 2010; Chapter 3; pp. 23–34. [Google Scholar]
  28. Banfield, J.F.; Zhang, H. Nanoparticles in the Environment. Rev. Miner. Geochem. 2001, 44, 1–58. [Google Scholar] [CrossRef]
  29. Bakshi, S.; He, Z.L.; Harris, W.G. Natural Nanoparticles: Implications for Environment and Human Health. Crit. Rev. Environ. Sci. Technol. 2014, 45, 861–904. [Google Scholar] [CrossRef]
  30. Consani, S.; Carbone, C.; Dinelli, E.; Balić-Žunić, T.; Cutroneo, L.; Capello, M.; Salviulo, G.; Lucchetti, G. Metal transport and remobilisation in a basin affected by acid mine drainage: The role of ochreous amorphous precipitates. Environ. Sci. Pollut. Res. 2017, 24, 15735–15747. [Google Scholar] [CrossRef] [PubMed]
  31. Tan, X.; Bo, B.; Zhang, P.; Shao, G.; Liu, R.; Wang, K. Carbonaceous nanoparticles in Zibo hot springs: Implications for the cycling of carbon and associated elements. Environ. Chem. Lett. 2021, 19, 4009–4014. [Google Scholar] [CrossRef]
  32. Wang, L.S.; Li, C.; Liu, S.W.; Li, H.; Xu, M.J.; Yu, D.Y.; Jia, C.Z.; Wei, G.Q. Terrestrial heat flow distribution in Kuqa foreland basin, Tarim, NW China. Pet. Explor. Dev. 2005, 4, 79–83. [Google Scholar]
  33. Zhou, S.C.; Liu, X.H.; Tong, C.H.; Hu, B. Application research of geogas survey in prospecting concealed ore. Acta Geol. Sin. 2014, 88, 736–754. [Google Scholar]
  34. Liu, X.H.; Tong, C.H. Preliminary study on elements transportation in underground vitrification form. Nucl. Phys. Rev. 2009, 26, 64–68. [Google Scholar]
  35. Edmunds, W.M.; Smedley, P.L. Residence time indicators in groundwater: The East Midlands Triassic sandstone aquifer. Appl. Geochem. 2000, 15, 737–752. [Google Scholar] [CrossRef]
  36. Lu, Q.M.; Cao, J.J.; Mi, Y.B.; Liu, X.; Hu, G. Study of nanoparticles in groundwater of Yagongtang Cu-Pb-Zn-S polymetallic deposit, Hunan Province. Met. Mine 2020, 3, 143–153. [Google Scholar] [CrossRef]
  37. Miller, W.R.; Ficklin, W.H.; Learned, R.E. Hydrogeochemical prospecting for porphyry copper deposits in the tropical-marine climate of Puerto Rico. J. Geochem. Explor. 1982, 16, 217–233. [Google Scholar] [CrossRef]
  38. Zhi, C.; Zhang, Y.C.; Chen, Y.F.; Lu, S.F.; Liao, K. Progress in the study of deep mineral prospecting. J. Geol. 2014, 38, 657–669. [Google Scholar]
  39. Li, C.S.; Zhao, Y.X.; Wang, S.J.; Zhang, H.L. Analysis of the rules of water enrichment in the geothermal field, northern Jinan, Shandong Province. Earth Environ. 2008, 2, 155–160. [Google Scholar] [CrossRef]
  40. Meng, F.C.; Xue, H.M.; Li, T.F.; Yang, H.R.; Liu, L.F. Enriched characteristics of late Mesozoic mantle under the Sulu orogenic belt: Geochemical evidence from gabbro in Rushan. Acta Petrol. Sin. 2005, 21, 1583–1592. [Google Scholar]
  41. Liu, Q.X.; Wang, G.L.; Zhang, F.W. Geochemical environment of trace element strontium (Sr) enriched in mineral waters. Hydrogeol. Eng. Geol. 2004, 6, 19–23. [Google Scholar]
  42. Xu, H.Z.; Duan, X.M.; Gao, Z.D.; Wang, Q.B.; Li, W.P.; Yin, X.L. Hydrochemical study of karst groundwater in the Jinan spring catchment. Hydrogeol. Eng. Geol. 2007, 3, 15–19. [Google Scholar]
  43. Liu, K.; Cao, X.H. Preliminary Study on Geothermal Resources in Nanding, Zibo; Beijing Science Press: Beijing, China, 1989; pp. 91–99. [Google Scholar]
  44. Yang, S.; Zhang, H.D.; Li, W.Z.; Wu, L. Genesis of geothermal anomaly in Southern Zhangdian district of Zibo City. Hydro-Geol. Eng. Geol. 2005, 3, 59–62. [Google Scholar]
  45. Xiang, Q.K.; Han, J.J.; Li, C.L.; Zhang, L.X. Research on forming condition of geothermal resource in Zhangdian region of Zibo City. Shandong Land Resour. 2009, 25, 33–36. [Google Scholar]
  46. Jiang, L.L.; Sui, H.B.; Kang, F.X.; Li, C.S.; Wei, S.M.; Yu, L.Q.; Li, Y. Hydrogeochemical characteristics and formation mechanism of the karst thermal reservoir in the northern edge of the Luzhong Uplift. Carsolog. Sin. 2023, 42, 1–23. [Google Scholar]
  47. Li, Y.K.; Cao, J.J.; Chen, J.; Yi, J. The research of particles carried by ascending gas flow from Qingmingshan Cu-Ni sulfide deposit in Guangxi Province. Acta Petrol. Sin. 2017, 33, 831–842. [Google Scholar]
  48. Li, R.X.; Wang, T.; Liu, H.Q. Geofluid and geological mapping for geofluid. Geol. Bull. China 2018, 37, 325–336. [Google Scholar]
Figure 1. Locations of the sampling points.
Water 15 03737 g001
Figure 2. Particle morphology of the CJQ samples ((a,b): JN-1, (c): JN-2).
Water 15 03737 g002
Figure 3. Particle morphology and diffraction pattern of the JR3 samples ((a,b): JN-3, (c,d): JN-4, (e,f): JN-5).
Water 15 03737 g003
Figure 4. Particle morphology and diffraction pattern of the QJZ samples ((a,b): JN-6, (c,d): JN-7, (e,f): JN-8).
Water 15 03737 g004
Figure 5. Particle morphology and diffraction pattern of the BL samples ((a,b): JN-9, (c,d): JN-10, (e,f): JN-11, (g,h): JN-12).
Water 15 03737 g005
Figure 6. Particle morphology and diffraction patterns of the DR2 samples ((a,b): JN-13, (c,d): JN-14, (e,f): JN-15, (g,h): JN-16).
Water 15 03737 g006
Figure 7. Particle morphology and diffraction pattern of the ZB-1–ZB-4 samples ((a,b): ZB-1, (c,d): ZB-2, (e,f): ZB-3, (g,h): ZB-4).
Water 15 03737 g007
Figure 8. Particle morphology and diffraction pattern of the ZB-5 and ZB-6 samples.
Water 15 03737 g008
Figure 9. Particle morphology and diffraction pattern of the ZB-7 sample.
Water 15 03737 g009
Figure 10. Particle morphology and diffraction patterns of the ZB-8 and ZB-9 samples.
Water 15 03737 g010
Figure 11. Generalized map of nanomaterial transport associated with deep geothermal resources in geothermal fields.
Water 15 03737 g011
Table 1. Basic information of samples.
SamplesSize (nm)Concentration (Particles/mL)Aquifer
CJQ154.0–482.40.56–1.8 × 10⁵Ordovician Majiagou Formation
JR3113.3–501.90.96–2.1 × 10⁵Ordovician Majiagou Formation
QJZ171.4–574.83.1–3.7 × 10⁵Ordovician Majiagou Formation
BL152.6–469.51.6–3.9 × 10⁵Ordovician Majiagou Formation
DR2151.4–457.00.62–1.5 × 10⁵Ordovician
Zibo196.4–232.40.71–3.2 × 10⁵Ordovician
Table 2. EDS results of sample particles.
SampleC wt%O wt%Ca wt%Cu wt%Si wt%S wt%Cl wt%Mg wt%Na wt%Al wt%K wt%Fe wt%Sr wt%F wt%Te wt%In wt%Pd wt%Ba wt%
JinanCJQJN-154.8315.889.8118.57 0.68 0.21
JN-27.518.7462.2320.54 0.61 0.35
JR3JN-35.3820.3158.0612.20 2.351.110.440.12
JN-48.872.48 12.96 40.330.3135.01
JN-51.993.15 19.140.61 44.66 29.21 0.41 0.78
QJZJN-614.9932.0233.7715.61 0.850.620.67 1.42
JN-78.5345.901.399.003.960.380.220.30 30.26
JN-86.8745.731.518.254.470.200.120.13 31.67
BLJN-97.2733.001.669.273.65 0.14 44.99
JN-108.7843.081.719.103.810.331.710.15 0.08 32.56
JN-1117.3830.7830.0013.07 1.63 0.71 0.615.79
JN-129.5215.7856.116.47 1.97 0.13
DR2JN-1321.5542.4910.628.960.4112.050.610.482.55 0.25
JN-1418.681.82 12.570.26 34.230.2932.12
JN-1512.2036.0211.289.790.1610.601.190.953.25 1.49 11.41.60
JN-1614.104.090.3315.920.380.2732.920.7423.60 7.60
ZiboZB-17.7653.383.56 4.21 31.07
ZB-213.5521.291.93 12.47 17.48 33.26
ZB-332.5546.1520.41 0.87
ZB-432.4229.622.02 9.705.47 20.74
ZB-524.6131.928.99 14.58 19.87
ZB-632.9631.9530.77 4.31
ZB-751.1627.361.15 2.14 18.18
ZB-817.9546.581.56 11.14 22.75
ZB-942.8718.721.35 2.827.50 26.71
Disclaimer/Publisher’s Note: The statements, opinions and data contained in all publications are solely those of the individual author(s) and contributor(s) and not of MDPI and/or the editor(s). MDPI and/or the editor(s) disclaim responsibility for any injury to people or property resulting from any ideas, methods, instructions or products referred to in the content.

