Abstract
High-temperature geothermal systems hold promise for sustainable and environmentally friendly power generation. However, China’s geothermal power capacity significantly underutilizes its abundant resources. This study focuses on the geothermal potential of the Pamir Plateau, particularly its northeastern edge, where complex tectonic forces converge. We aim to unveil the mechanisms driving the emergence of high-temperature geothermal reservoirs in this unique geological setting. Hydrogeochemical analysis reveals diverse profiles in geothermal water, primarily derived from atmospheric precipitation. Estimation of reservoir temperatures and simulation of geotherms unveil distinct geothermal systems. Kongur exhibits a medium–low-temperature hydrothermal system and Tashkurgan demonstrates high-temperature hydrothermal system characteristics, while the Pamir’s northeastern edge hints at a potential high-temperature dry geothermal system where there might not be a fault. These findings have important implications for sustainable energy development and future geothermal exploration.
1. Introduction
High-temperature geothermal systems have the potential to provide continuous and reliable power generation while emitting minimal greenhouse gases [1,2,3,4], making them a crucial player in the transition to a more environmentally conscious energy landscape. Nevertheless, China’s geothermal power installed capacity has not surpassed 53.45 MW to date, accounting for only 3‰ of the world’s total installed capacity, which is inconsistent with the total amount of geothermal resources in China.
Predominantly situated along the Himalayan geothermal belt on the Chinese mainland, high-temperature geothermal systems are distributed across the provinces of Yunnan, Tibet, Sichuan, and Xinjiang, a consequence of the ongoing Himalayan orogenic activity [5]. The majority of geothermal systems are located in remote areas of the Tibet Plateau, characterized by an average elevation of 4000 m. Comprehensive geothermal exploration and studies have been conducted on specific geothermal fields, including Yangbajing [6,7,8,9,10], Yangyi [10,11,12,13], and Naqu [14] in Tibet; Kangding [15,16,17], Litang [18,19], and Ganzi [18,20] in Sichuan; as well as Rehai [21,22] and Jifei [23,24] in Yunnan. However, systematic inquiries into geothermal fields within the Pamir Plateau are scarce [25].
The Pamir Plateau, renowned for its complex tectonic history and remarkable geological diversity [26], has garnered increasing attention as a focal point for unraveling the dynamics that shape high-temperature geothermal phenomena, e.g., [5,25,27]. As the northeastern edge of the Pamir Plateau witnesses the convergence of these geological forces, it presents a unique opportunity to delve into the intricacies of geothermal system formation. The juxtaposition of colliding tectonic plates, coupled with the plateau’s elevated terrain, facilitates the ascent of thermal fluids and magma from the Earth’s interior, generating elevated temperature reservoirs that hold considerable promise for sustainable energy production [25].
This study is centered on four pivotal facets: the chemical composition of geothermal water, the computation of a geothermic temperature gradient, the simulation of radioactive heat generation within granite, and discussion about uncondensed magma. Through the analysis of these elements, our objective is to unravel the fundamental mechanisms governing the geothermal system’s configuration in this particular region. By synergizing these multifaceted inquiries, our research strives to elucidate the underlying processes responsible for the emergence of high-temperature geothermal reservoirs at the northeastern edge of the Pamir Plateau.
2. Geological Setting
2.1. Geological Background
The Pamir Plateau, situated at the northwestern periphery of the Tibetan Plateau, is recognized as one of the most rapidly uplifting regions on a global scale [26]. Encompassing an average elevation exceeding 4000 m, it spans roughly one-third of the longitudinal extent of the Tibetan Plateau (Figure 1a). During the Late Cenozoic era, the Pamir Plateau underwent a tectonic process that yielded a northward-wedging configuration extending approximately 300 km [28]. According to Schneider et al. [29], the crustal thickness of the Pamir Plateau presently varies within the range of 55 to 80 km. While the leading edge of the Pamir Plateau showcases sinistral strike-slip motion, its interior manifests extensional characteristics, giving rise to an assemblage of northward-protruding arc-shaped active tectonic zones (see Figure 1), notably including the Karakoram fault (KKF), the South Pamir Thrust (SPT), the Main Pamir Thrust (MPT), and the Pamir Frontal Thrust (PFT).
The average measured surface heat flow of Pamir is 80–120 mW/m2 [30]. The thermal activities of the Pamir are more intense than those of the Tian Shan mountain range [5]. Nearly 80% of the geothermal springs over the wide range of the Tian Shan and Pamir are low-enthalpy geothermal waters, with temperatures ranging from 20 to 93 °C [31].
2.2. Geological Settings of the Study Area
To the northeast of the Pamir Plateau lies the junction between the Karakoram fault zone and the West Kunlun fault zone, collectively presenting a prevailing east–west extensional tectonic setting [28]. Amid diverse structural attributes, the Kongur extensional system (KES) emerges as the most salient, with its activity predominantly recorded during the Miocene and Pliocene epochs [28]. The lower plate of the KES comprises ancient metamorphic basement rock, while the upper plate exposes Mesozoic granite formations alongside segments of Permian and Jurassic carbonate rock strata [28,32].
Within the southern segment of the KES, a sequence of three prominent normal faults is discernible (Figure 1b), aligned from west to east: the Tashkurgan fault (TF), the Kangwa Fault (KWF) and the Wachia fault (WF). The footwall of these fault zones primarily consists of Mesozoic granites, while the hanging wall is characterized by Paleozoic metamorphic rocks that have been intruded by substantial Mesozoic granite intrusions (Figure 1c) [33,34].
Situated on the eastern flank of the Pamir tectonic junction, alongside the Karakoram fault zone and its subsidiary fault structures, are six Cenozoic alkaline complexes and multiple granite formations. Among these geological features, the Tashkurgan complex, which consists of Karibasheng pluton and Kuzgun pluton, emerges as the largest Cenozoic alkaline complex in the vicinity.
The Dunkeldik magmatic complex (Figure 1b) represents the most recently documented magmatic activity within the Pamir Plateau, estimated to have originated approximately 11 million years ago [35]. This magmatic complex encompasses ultra-classic dikes, conduits, and sub-volcanic bodies. It is situated within the dynamic deformation zone associated with the KKF, positioned between the Late Triassic–Early Jurassic Tanymas suture and the Late Jurassic–Early Cretaceous Rushan–Pshart suture.
Since 2001, extensive geothermal surveys have been conducted in the ambient of the Tashkurgan basin (TB), resulting in the identification of multiple geothermal anomalies. In a preliminary study conducted by Li, Pang, Yang, Yuan, and Tang [25] to predict reservoir temperatures, the highest reservoir temperature (260 °C) was deduced based on data gathered from TB.
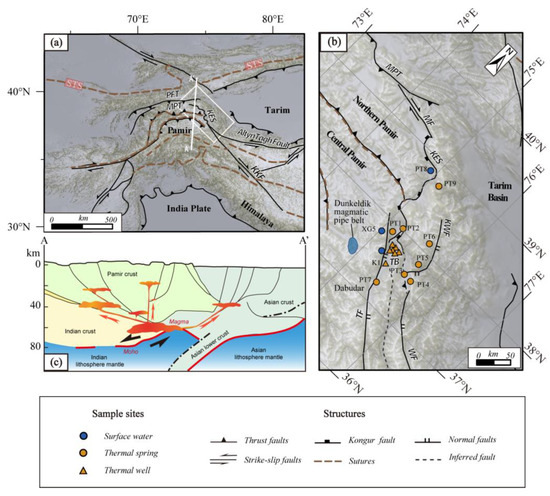
Figure 1.
Schematic map showing (a) map of ambient continental settings: STS–South Tian Shan suture, KKF–Karakoram fault, KES–Kongur extension system, PFT–Pamir Frontal Thrust, MPT–Main Pamir Thrust; (b) spatial distribution of sampling locations of this study and those from the literature (see supporting material for detail): KWF–Kangwa fault, MF–Muji fault, TF–Tashkurgan fault, WF–Wachia fault, TB–Tashkurgan basin. Geologic units are after Schwab et al. [36] and Robinson, Yin, Manning, Harrison, Zhang, and Wang [32]; and (c) deep structures of Pamir and Tian Shan collision domain. See subfigure (a) for the locations of profile AA’; the geometry and position of magma chambers in (c) are schematic.
3. Sampling and Methods
3.1. Sample Collection
This study analyzed a total of 8 geothermal spring samples and 1 surface water sample, and the locations of the sampling sites are illustrated in Figure 1b. The sampling springs of this study are located within the control range of several normal faults, i.e., KES, TF, KWF, and WF. Water samples were field tested and filtered using a 0.45 µm fiber microfiltration membrane in a polyethylene bottle. The cation element analysis of water samples entailed titration with concentrated nitric acid (6 mol/L) to achieve a pH below 2, while anionic water samples remained unacidified.
For radiogenic thermal analysis, five granitic samples were collected from the Tashkurgan complex for whole-rock geochemistry analysis, consisting of two Karibasheng samples and three Kuzgun samples. The photos of some typical sampling sites in this study are shown in Figure 2.
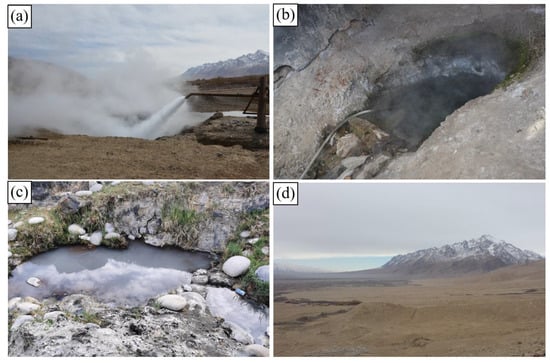
Figure 2.
Photographs of representative locations: (a) ZK7 drilling well with a wellhead temperature of 144 °C [37]; (b) Tahman thermal spring (PT1); (c) Dabudar thermal spring (PT7); (d) Tashkurgan granitic complex.
3.2. Analytical Techniques
For the assessment of the variable chemical attributes of water, encompassing temperature, pH, electrical conductivity (EC), and redox potential (ORP), field measurements were conducted utilizing a Hashing multi-function parameter tester (HQ40D, Danaher) throughout the sampling process. Measurements and analysis of anions, as well as δD and δ18O, were conducted using an ion chromatograph (Dionex-ICS1100) and an inductively coupled plasma spectrometer (ICP-OES, ICAP6300). Additionally, δD and δ18O were determined using an isotopic water quality analyzer (IWA-35-EP), with results standardized to VSMOW and a test accuracy of 0.1‰ and 0.5‰ for δD and δ18O, respectively. Sampling information and analysis results are listed in Table S1 (see Supplementary Materials).
Comprehensive analyses of whole-rock chemistry, rare earth elements, and trace elements were conducted on the gathered samples at the State Key Laboratory of Biogeology and Environmental Geology, China University of Geosciences (Wuhan). The primary elements were quantified using XRF spectroscopy, employing the standard curve method (empirical coefficient method) for analysis. Moreover, the examination of rare earth elements and trace elements was performed using a dual-focused inductively coupled plasma mass spectrometer (ICP-MS). The analytical results for U, Th, and K2O, along with the results from the literature, are delineated in Tables S2 and S3 (see Supplementary Materials).
4. Results and Discussion
4.1. Regional Geothermal Hydrogeochemical Characteristics and Estimation of Reservoir Temperatures
4.1.1. Geochemical Characteristics of Geothermal Water
These samples are categorized into surface water, cold spring water, thermal spring water, and thermal well water, based on their individual properties and hydrochemical features. The concentrations of primary ions in the water samples are listed in Table S1 in Supplementary Materials. The term ‘cold water’ collectively denotes surface water and cold spring water, while ‘geothermal water’ refers to thermal spring water (with a sampling temperature ranging from 37.0 to 71.9 °C) and thermal well water (with a sampling temperature ranging from 27.0 to 144.0 °C). The pH and total dissolved solids (TDS) of the thermal springs vary from 6.86 to 9.92 and from 223 to 1762 mg/L, respectively. The pH and TDS of the thermal well water range from 6.35 to 8.60 and from 564 to 3664 mg/L, respectively. Within the study area, the anions of cold water are predominantly HCO3− and SO42−, with Ca2+ as the primary cation. However, the cations in both thermal spring water and thermal well water are mainly Na+, with the anions displaying considerable differences. The majority of thermal well waters contain high levels of Cl−, SO42−, and HCO3− anions, while most thermal springs primarily contain SO42− anions, with HCO3− being the main anion only in PT7 and PT9 thermal springs. As per the Shukalev classification, the hydrochemical types of cold water are primarily HCO3-Ca and HCO3·SO4-Na, while thermal springs are of the SO4-Na, HCO3·SO4-Na (PT7), and HCO3·SO4-Ca·Na (PT9) types. The thermal well water, on the other hand, falls under the Cl·SO4·HCO3-Na, Cl·SO4-Na, SO4·Cl-Na, and SO4·HCO3·Cl-Na types, as depicted in the Piper diagram (Figure 3).
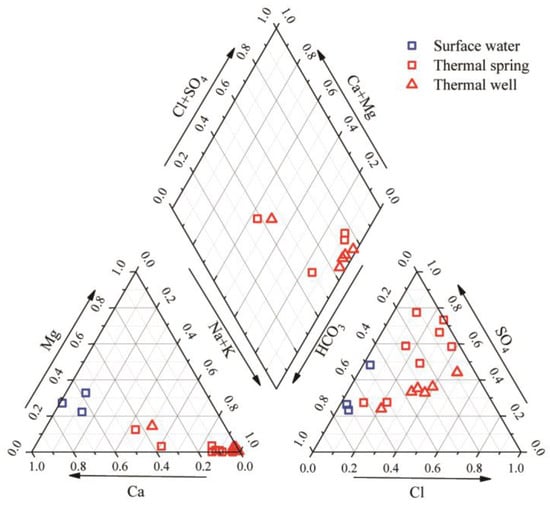
Figure 3.
Piper diagram for water samples from northeast Pamir of northwest China, including surface cold water from this study and Li, Pang, Yang, Yuan, and Tang [25], geothermal springs (this study), and water samples from drilling wells of Tashkurgan basin [27,37].
4.1.2. Isotopic Characteristics of the Geothermal System
The determination of geothermal water’s source and formation mechanism can be inferred from recharge elevation and cycle depth. Hydrogen and oxygen stable isotopes in precipitation, which exhibit variations across different time scales and elevations, hold distinct environmental insights. The widely used δD and δ18O isotopic values serve to ascertain groundwater’s source, flow, mixing, and evaporation dynamics [38]. As per Table S1 in Supplementary Materials, δD values within the geothermal water span from −93.90 to −63.62‰ (VSMOW), while δ18O values range from −13.05 to −8.30‰ (VSMOW). Considering the latitude and elevation effects of hydrogen and oxygen isotopes, the altitude and elevation of the Delingha area are relatively consistent with the study area. Therefore, it is more appropriate to use the meteoric water line of Delingha station [39] as the local meteoric water line.
Notably, the geothermal water samples (Figure 4) align closely with both the global meteoric water line (GMWL, δD = 8δ18O + 10) after Craig [40], and the local meteoric water line (LMWL, δD = 7.83δ18O + 8.61) after Zhu, Chen, and Gong [39], signifying atmospheric precipitation as the principal supply source for geothermal water within the study region.
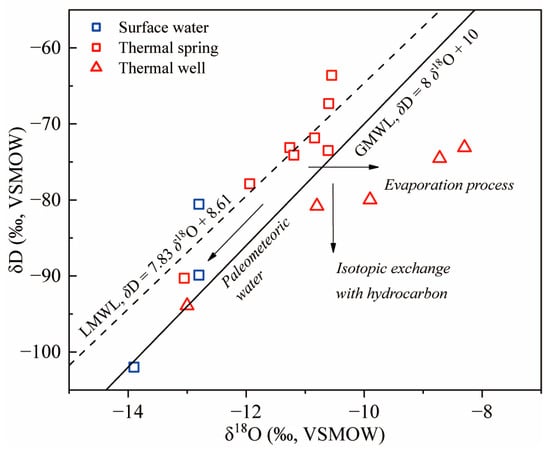
Figure 4.
Plot of δD versus δ18O for various water samples from northeast Pamir, with arrows indicating the possible undergone processes of the water.
Equation (1) can be employed to calculate the supply elevation and location details of atmospheric precipitation:
H and h are the elevation of the recharge area and sampling point, respectively, in units of m; δS and δp are the isotopic compositions of geothermal water and atmospheric precipitation near the sampling point, respectively, in units of ‰; k is the isotope height gradient, in the unit ‰/100 m.
Employing calculations rooted in δ18Op = −7.54‰ and k = −0.34‰/100 m, as per the annual average atmospheric precipitation data from Urumqi Houxia Station, we calculated the recharging elevation for our samples. The recharge elevations of regional hot springs span from 3116 m to 4763 m, with the PT1 hot spring boasting the highest recharge elevation at 4718 m. It is pertinent to note that the study area’s average altitude stands at 3200 m, and the calculation outcomes further substantiate the mountainous region as the primary recharge source for regional geothermal water.
Several drilled hot water samples marginally deviate from the atmospheric precipitation line (Figure 4). This discrepancy could potentially be attributed to isotopic exchange reactions involving geothermal water and substances such as H2S, CO2, or silicate minerals [41], along with altitude effects and paleoclimate influences [42]. The elevated TDS, heat storage temperatures, and recharge elevations of these three water samples, in contrast to other geothermal waters, denote heightened water–rock interactions.
4.1.3. Reservoir Temperature Prediction
Understanding the equilibrium state of water samples and selecting an appropriate solute thermometer are crucial steps in estimating the temperature of geothermal water reservoirs under different equilibrium conditions. Giggenbach [43] proposed the Na–K–Mg diagram method to discern the equilibrium state of water, facilitating the classification of water samples into mature (full equilibrium), immature, or partially equilibrated (partial equilibrium) stages. Illustrated in Figure 5, all water sample data within the study area fall within the immature and partially balanced categories, with none falling within the mature water range. For estimating the temperature of immature geothermal reservoirs, silica and K–Mg thermometers often provide superior accuracy compared to other cationic thermometers.
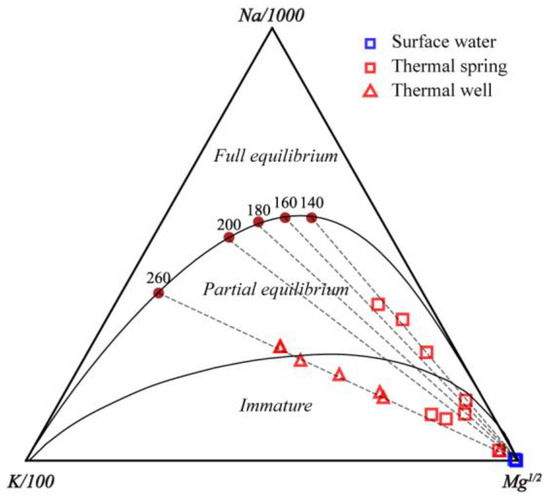
Figure 5.
The distribution of water samples from northeast Pamir in Na/100-K/100-Mg1/2 (in mg/L) ternary diagram after Giggenbach [43]. The two solid lines separate three areas, representing different water–rock reaction degrees, i.e., full equilibrium, partial equilibrium and immature water. The dashed lines represent K–Na apparent temperatures.
The silica thermometers proposed by Fournier [44] and Fournier and Potter [45], along with the K–Mg thermometer proposed by Giggenbach [43], were selected to calculate the potential reservoir temperatures in the study area, and the calculation results are shown in Table 1. The temperatures calculated by K–Mg thermometer (Table 1) are the lowest, which are much lower than the temperature of hot well water and hot spring water outlet, so the K–Mg thermometer is not suitable for the estimation of reservoir temperature in the study area. Silica geothermometers offer a more reliable representation of conservative estimates for reservoir temperatures, with sample ZK7 from the borehole in TB presenting the highest silica temperature (202.19 °C). However, in cases where cold water mixing occurs, these calculations yield values lower than the actual reservoir temperature [25].

Table 1.
Evaluated reservoir temperatures (°C) by different silica thermometers and K–Mg thermometer.
The Na–K–Mg diagram shows that the maximum reservoir temperature of the hot water is 260 °C, which is higher than the 202 °C calculated by the silica thermometer.
Although several minerals, such as albite and microcline, will undergo a process of rebalancing during the cooling of hot water, the Na–K ratio is not affected by boiling and conduction cooling [43]. Therefore, the reservoir temperature indicated by the Na–K–Mg diagram may be more reasonable.
4.2. Heat Source Analysis and Conceptual Model of the Local Geothermal Systems
4.2.1. Potential Heat Sources for the Geothermal Systems
The average measured surface heat flow of Pamir is 80–120 mW/m2 [30], while the heat flow in the ambient of TB is 150–350 mW/m2 [46]. There is no recent volcanic activity record on the Pamir Plateau, and the Dunkeldik magmatic field (Figure 1b) is the result of the youngest known volcanic activity [c. 11 Ma; 35]. The earthquake data of Tien Shan–Pamir Geodynamic Program (TIPAGE), Schneider, Yuan, Schurr, Mechie, Sippl, Haberland, Minaev, Oimahmadov, Gadoev, Radjabov, Abdybachaev, Orunbaev, and Negmatullaev [29] reveal that the average Moho depth of the Pamir Plateau exceeds 70 km.
The high-enthalpy fluids, the high local heat flows, the lack of recent volcanic activity, along with the deep mantle burial depth, suggest the existence of a shallower heat source for the formation of these geothermal systems, especially for the high temperature geothermal system in the ambient of TB.
Potential shallow heat sources for the geothermal system of the Pamir Plateau encompass frictional heat resulting from fault movement, crustal magma activity, and the radioactive decay of rocks. It is essential to emphasize that, while geothermal systems present a diverse array of heat source possibilities, an in-depth analysis of existing geological and geophysical evidence allows us to systematically eliminate certain conjectures.
KKF is the main controlling fault system in the northeastern Pamir (see Figure 1). Pertinent research has revealed a series of structural and geomorphic characteristics at the northern terminus of the KKF, indicative of the cessation of the northern KKF at the late Quaternary [47,48]. Consequently, grounded in these empirical considerations, it is reasonable to logically exclude the influence of frictional heat from faulting as a primary heat source for the present geothermal system in the northeastern Pamir. In the following section, we will further discuss the potential contribution from the Miocene granites, that display high whole-rock U and Th contents (see Tables S2 and S3 in Supplementary Materials).
4.2.2. Radioactive Heat Production of the Miocene Granites and Its Relationship to the Geothermal Systems
We employed the equation proposed by Rybach [49] to quantitatively calculate the radiogenic heat production rate (QA, μW/m3) of the Karibasheng Miocene granite and the Kuzgan Miocene granite. The formula is presented as follows:
where ρ denotes rock density in kg/m3, CU and CTh represent uranium and thorium mass fractions in the granite (in mg/kg), and CK signifies the potassium mass fraction in the granite (in %).
Kuzgan granite pluton exhibits U and Th contents (Table S2) ranging from 1.90 to 27.2 μg/g and from 10.8 to 115.38 μg/g, respectively, with respective average values of 11.04 μg/g and 66.59 μg/g. The radiogenic heat production rate spans from 2.72 to 15.05 μW/m3, with an average of 8.05 μW/m3. Similarly, for the Karibasheng granite pluton, U and Th mass fractions vary from 7 to 14.1 μg/g and from 49.8 to 125 μg/g, respectively, with corresponding average values of 10.15 μg/g and 74.09 μg/g (Table S3). The radiogenic heat production rate ranges from 5.91 to 12.33 μW/m3, averaging at 8.17 μW/m3. According to Kromkhun [50], granite featuring a radiogenic heat production rate, surpassing 5 μW/m3, qualifies as high heat-producing granite.
We have chosen three representative locations for simulation, each with distinct parameter settings: in the Kongur region, the upper 2 km is composed of high-radioactivity Achiehkopia granite (5.70 μW/m3) and overlying low-radioactivity Muztaghata granite (1.78 μW/m3); in Tashkurgan, the entire 10km depth comprises high-radioactivity granite (8.17 μW/m3); and in Dabudar, the shallow stratum comprises 2-kilometer-thick limestone (0.60 μW/m3), while the deeper portion is characterized by high-radioactivity granite (8.17 μW/m3). The simulated results are illustrated in Figure 6. Kongur exhibits the lowest temperature at a depth of 10 km, Tashkurgan demonstrates the highest temperature at the same depth, and Dabudar lies in between. This variation in temperature among the three representative locations can be attributed to the diverse geological compositions and varying radioactive content of the subsurface rock formations. High-radioactivity granite contributes to heightened heat production, whereas lower radioactive content in other rock types leads to decreased heat production. The persistent presence of high-radioactivity granite throughout the depth of Tashkurgan contributes to its elevated 10 km temperature compared to the other locations.
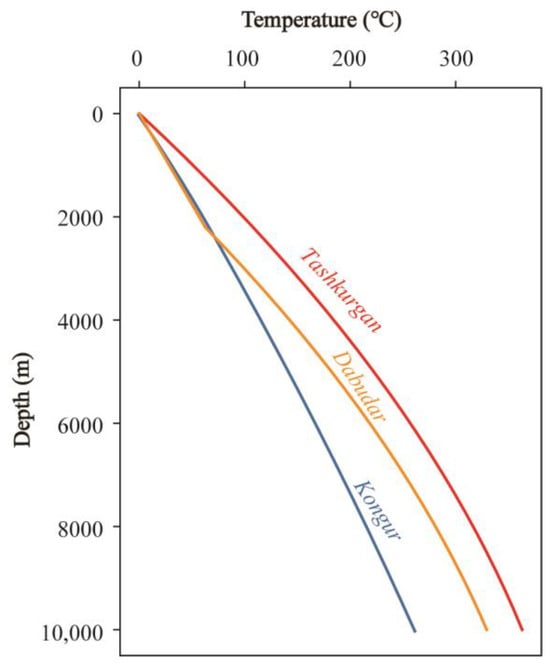
Figure 6.
Simulated geotherms for three typical sites: Kongur mountain, Tashkurgan basin and Dabudar. See Figure 1 for locations.
4.2.3. Conceptual Model of Local Geothermal Systems and Implications for the Future Exploration
The Pamir region showcases three distinctive geothermal systems. Kongur represents a medium–low-temperature hydrothermal system characterized by a relatively low regional geothermal gradient. Heat conduction occurs through faults and water pathways (Figure 7a). Tashkurgan, on the other hand, exemplifies a high-temperature hydrothermal system. Here, the presence of high-radioactivity granite contributes to an elevated geothermal gradient. Heat conduction takes place primarily along fault pathways, leading to the formation of high-temperature reservoirs within the TB basin (Figure 7b). Additionally, the Pamir region potentially hosts a high-temperature dry geothermal system. This system draws heat from extensive concealed Middle Miocene granites located along the northeastern edge of the Pamir. These granites possess significant radioactivity and retain residual heat from magma intrusion (Figure 7c).
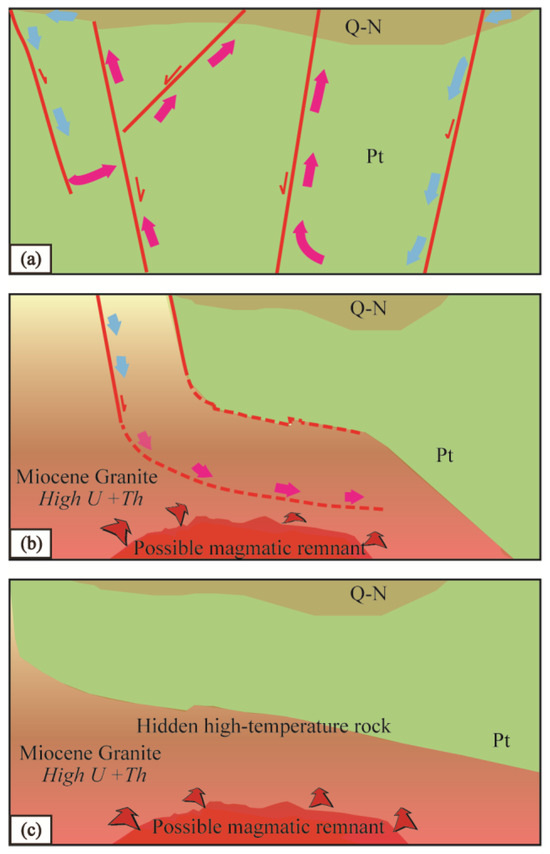
Figure 7.
Conceptual model of geothermal systems in in the northeastern Pamir Plateau. (a) Genetic model of low–medium-temperature geothermal system represented by the Kongur area; (b) genetic model of medium–high-temperature geothermal system represented by the TB; and (c) genetic model of possible high-temperature geothermal system with no fault or water circulation. All sections are not true scale for tectonic structures. Q-N represents sediment from Neogene to Quaternary, and Pt represents Proterozoic metamorphic rock.
Based on the TIPAGE project research, multiple low-resistivity bodies were identified within the magnetotelluric profile of the eastern South Pamir block and Middle Pamir block, ranging from depths of 8 to 25 km [51]. These bodies, characterized by low wave velocities, are recognized as regions of partial crustal melting [29,30]. Additionally, a significant Early Miocene magma emplacement event [32,52] further supports this possibility, highlighting potential high-temperature heat sources within the crust. The existence of this geothermal system provides crucial insights for future geothermal exploration.
5. Summary and Conclusions
This study elucidates the geothermal characteristics and heat sources within the northeastern Pamir. Various hydrogeochemical profiles were observed among distinct water samples, with atmospheric precipitation identified as the primary source of geothermal water. Reservoir temperature estimation using silica thermometers provided insights into temperature distributions. Radiogenic heat production analysis of Miocene granites indicated their significance as shallow heat sources. Distinct hydrothermal systems were identified: Kongur as a medium–low-temperature system, Tashkurgan as a high-temperature system, and the northeastern edge of the Pamir as a potential high-temperature dry geothermal system. Geophysical evidence suggests regions of partial crustal melting, highlighting high-temperature heat sources associated with Early Miocene magma emplacement events. This comprehensive understanding has implications for future geothermal exploration and sustainable energy development.
Through the analysis of the chemical composition of geothermal water, computation of a geothermic temperature gradient, and simulation of radioactive heat generation within granite, we believe that the northeastern edge of the Pamir Plateau holds great potential for high-temperature geothermal reservoirs, and the favorable conditions for the formation of high-temperature geothermal systems are the existence of magma residue in the shallow crust, thermal conductivity and heat production of high-emission granite, and good cover conditions.
In summary, this study advances insights into the geothermal systems of the Pamir region, offering valuable information for energy resource assessment and exploration endeavors, while shedding light on the geothermal potential of this unique area.
Supplementary Materials
The following supporting information can be downloaded at: https://www.mdpi.com/article/10.3390/w15203583/s1. Table S1: Sample information, major ion content and isotope composition of samples in the study area; Table S2: test results of radioactive elements in Kuzgun granitic pluton and calculation of radioactive heat generation; Table S3: test results of radioactive elements in Karibasheng granitic pluton and calculation of radioactive heat generation. References [25,27,37,53] are cited in the Supplementary Materials.
Author Contributions
Conceptualization, S.Q. and S.W.; investigation, F.C., S.Q., S.W, B.Z., and G.H.; formal analysis, F.C. and S.W.; writing—original draft preparation, F.C. and S.W.; writing—review and editing, S.Q. and B.Z; funding acquisition, S.W. All authors have read and agreed to the published version of the manuscript.
Funding
This research was funded by the National Natural Science Foundation of China (grant number 42202334) and by the Second Hydrologic Engineering Geology Brigade of Xinjiang Bureau of Geology and Mineral Resources.
Data Availability Statement
Not applicable.
Conflicts of Interest
The authors declare no conflict of interest.
References
- Zhang, R.; Wang, G.; Shen, X.; Wang, J.; Tan, X.; Feng, S.; Hong, J. Is geothermal heating environmentally superior than coal fired heating in China? Renew. Sust. Energ. Rev. 2020, 131, 110014. [Google Scholar] [CrossRef]
- Watson, S.M.; Westaway, R.; Falcone, G. A review of deep geothermal rnergy and future opportunities in the UK. In Proceedings of the European Geothermal Congress, Hague, The Netherlands, 11–14 June 2019. [Google Scholar]
- Wang, G.; Lin, W.; Zhang, W.; Lu, C.; Ma, F.; Gan, H. Research on Formation Mechanisms of Hot Dry Rock Resources in China. Acta Geol. Sin. -Engl. Ed. 2016, 90, 1418–1433. [Google Scholar] [CrossRef]
- Lin, W.; Wang, G.; Gan, H.; Zhang, S.; Zhao, Z.; Yue, G.; Long, X. Heat source model for Enhanced Geothermal Systems (EGS) under different geological conditions in China. Gondwana Res. 2023, 122, 243–259. [Google Scholar] [CrossRef]
- Hochstein, M.P.; Regenauer-Lieb, K. Heat generation associated with collision of two plates: The Himalayan geothermal belt. J. Volcanol. Geotherm. Res. 1998, 83, 75–92. [Google Scholar] [CrossRef]
- Duo, J. The basic characteristics of the Yangbajing geothermal gield-A typical high temperature geothermal system. Eng. Sci. 2003, 5, 42–47. [Google Scholar]
- Guo, Q.; Wang, Y.; Liu, W. Major hydrogeochernical processes in the two reservoirs of the Yangbajing geothermal field, Tibet, China. J. Volcanol. Geotherm. Res. 2007, 166, 255–268. [Google Scholar] [CrossRef]
- Sun, H.; Ma, F.; Lin, W.; Liu, Z.; Wang, G.; Nan, D. Geochemical characteristics and geothermometer application in high temperature geothermal field in Tibet. Geol. Sci. Techology Inf. 2015, 34, 171–177. [Google Scholar]
- Wang, Y.C.; Li, L.; Wen, H.G.; Hao, Y.L. Geochemical evidence for the nonexistence of supercritical geothermal fluids at the Yangbajing geothermal field, southern Tibet. J. Hydrol. 2021, 604, 127243. [Google Scholar] [CrossRef]
- Yuan, J.F.; Guo, Q.H.; Wang, Y.X. Geochemical behaviors of boron and its isotopes in aqueous environment of the Yangbajing and Yangyi geothermal fields, Tibet, China. J. Geochem. Explor. 2014, 140, 11–22. [Google Scholar] [CrossRef]
- Guo, Q.H.; Wang, Y.X.; Liu, W. Hydrogeochemistry and environmental impact of geothermal waters from Yangyi of Tibet, China. J. Volcanol. Geotherm. Res. 2009, 180, 9–20. [Google Scholar] [CrossRef]
- Qin, J. Hydrothermal alteration and evalution in Yangyi geothermal field. J. Taiyuan Univ. Technol. 2003, 34, 161–165. [Google Scholar]
- Wang, X.; Wang, G.; Gan, H.; Liu, N.; Nan, D.; Liu, Z. Genetic mechanisms of sinter deposit zones in the Yangyi geothermal field, Tibet: Evidence from the hydrochemistry of geothermal fluid. Geothermics 2022, 103, 102408. [Google Scholar] [CrossRef]
- Liu, Z.; Lin, W.; Xie, E.; He, Y.; Zhang, M.; Wang, G. Characteristics and indicative significance of deuterium excess in thermal water in Nimu-Naqu area of Tibet, China. J. Chengdu Univ. Technol. Sci. Techno. Ed. 2014, 41, 251–256. [Google Scholar]
- Cheng, Y.; Pang, Z.; Kong, Y.; Chen, X.; Wang, G. Imaging the heat source of the Kangding high-temperature geothermal system on the Xianshuihe fault by magnetotelluric survey. Geothermics 2022, 102, 102386. [Google Scholar] [CrossRef]
- Guo, Q.; Pang, Z.; Wang, Y.; Tian, J. Fluid geochemistry and geothermometry applications of the Kangding high-temperature geothermal system in eastern Himalayas. Appl. Geochem. 2017, 81, 63–75. [Google Scholar] [CrossRef]
- Liu, Z.H.; Yuan, D.X.; He, S.Y.; Zhang, M.L.; Zhang, J.G. Geochemical features of the geothermal CO2-water-carbonate rock system and analysis on its CO2 sources—Examples from Huanglong Ravine and Kangding, Sichuan, and Xiage, Zhongdian, Yunnan. Sci. China Ser. D-Earth Sci. 2000, 43, 569–576. [Google Scholar] [CrossRef]
- Wei, S.; Liu, F.; Zhang, W.; Zhang, H.; Zhao, J.; Liao, Y.; Yan, X. Typical geothermal waters in the Ganzi–Litang fault, western Sichuan, China: Hydrochemical processes and the geochemical characteristics of rare-earth elements. Environ. Earth Sci. 2022, 81, 538. [Google Scholar] [CrossRef]
- Zhou, X.; Liu, L.; Chen, Z.; Cui, Y.; Du, J. Gas geochemistry of the hot spring in the Litang fault zone, Southeast Tibetan Plateau. Appl. Geochem. 2017, 79, 17–26. [Google Scholar] [CrossRef]
- Cheng, Y.; Pang, Z.; Di, Q.; Chen, X.; Kong, Y. Three-dimensional resistivity structure in the hydrothermal system beneath Ganzi Basin, eastern margin of Tibetan Plateau. Geothermics 2021, 93, 102062. [Google Scholar] [CrossRef]
- Guo, Q.H.; Liu, M.L.; Li, J.X.; Zhang, X.B.; Wang, Y.X. Acid hot springs discharged from the Rehai hydrothermal system of the Tengchong volcanic area (China): Formed via magmatic fluid absorption or geothermal steam heating? Bull. Volcanol. 2014, 76, 868. [Google Scholar] [CrossRef]
- Zhiguan, S.G. Structure of geothermal reservoirs and the temperature of mantle-derived magma hot source in the Rehai area, Tengchong. Acta Petrol. Sin. 2000, 16, 83–90. [Google Scholar]
- Jones, B.; Peng, X.T. Hot spring deposits on a cliff face: A case study from Jifei, Yunnan Province, China. Sediment. Geol. 2014, 302, 1–28. [Google Scholar] [CrossRef]
- Liu, Y.P.; Zhou, X.; Deng, Z.J.; Fang, B.; Tsutomu, Y.; Zhao, J.B.; Wang, X.C. Hydrochemical characteristics and genesis analysis of the Jifei hot spring in Yunnan, southwestern China. Geothermics 2015, 53, 38–45. [Google Scholar] [CrossRef]
- Li, Y.M.; Pang, Z.H.; Yang, F.T.; Yuan, L.J.; Tang, P.H. Hydrogeochemical characteristics and genesis of the high-temperature geothermal system in the Tashkorgan basin of the Pamir syntax, western China. J. Asian Earth Sci. 2017, 149, 134–144. [Google Scholar] [CrossRef]
- Burtman, V.S.; Molnar, P. Geological and Geophysical Evidence for Deep Subduction of Continental Crust Beneath the Pamir; Geological Society of America: Boulder, CO, USA, 1993; Volume 281, pp. 1–76. [Google Scholar]
- Shi, J.; Lu, C.; Li, Q.; Chang, Z. Progress in research on the geothermal resources in Taxkorgan Valley, Xinjiang. Geol. Surv. China 2018, 5, 8–10. [Google Scholar]
- Robinson, A.C.; Yin, A.; Manning, C.E.; Harrison, T.M.; Zhang, S.-H.; Wang, X.-F. Tectonic evolution of the northeastern Pamir: Constraints from the northern portion of the Cenozoic Kongur Shan extensional system, western China. Geol. Soc. Am. Bull. 2004, 116, 953–973. [Google Scholar] [CrossRef]
- Schneider, F.M.; Yuan, X.; Schurr, B.; Mechie, J.; Sippl, C.; Haberland, C.; Minaev, V.; Oimahmadov, I.; Gadoev, M.; Radjabov, N.; et al. Seismic imaging of subducting continental lower crust beneath the Pamir. Earth Planet. Sci. Lett. 2013, 375, 101–112. [Google Scholar] [CrossRef]
- Sass, P.; Ritter, O.; Ratschbacher, L.; Tympel, J.; Matiukov, V.E.; Rybin, A.K.; Batalev, V.Y. Resistivity structure underneath the Pamir and Southern Tian Shan. Geophys. J. Int. 2014, 198, 564–579. [Google Scholar] [CrossRef]
- Chelnokov, G.; Lavrushin, V.; Bragin, I.; Abdullaev, A.; Aidarkozhina, A.; Kharitonova, N. Geochemistry of thermal and cold mineral water and gases of the Tien Shan and the Pamir. Water 2022, 14, 838. [Google Scholar] [CrossRef]
- Robinson, A.C.; Yin, A.; Manning, C.E.; Harrison, T.M.; Zhang, S.H.; Wang, X.F. Cenozoic evolution of the eastern Pamir: Implications for strain-accommodation mechanisms at the western end of the Himalayan-Tibetan orogen. Geol. Soc. Am. Bull. 2007, 119, 882–896. [Google Scholar] [CrossRef]
- Jiang, Y.H.; Jia, R.Y.; Liu, Z.; Liao, S.Y.; Zhao, P.; Zhou, Q. Origin of middle Triassic high-K calc-alkaline granitoids and their potassic microgranular enclaves from the western Kunlun orogen, northwest China: A record of the closure of Paleo-Tethys. Lithos 2013, 156–159, 13–30. [Google Scholar] [CrossRef]
- Liu, X.Q.; Zhang, C.-L.; Hao, X.-S.; Zou, H.; Zhao, H.-X.; Ye, X.-T. Early Cretaceous granitoids in the Southern Pamir: Implications for the Meso-Tethys evolution of the Pamir Plateau. Lithos 2020, 362–363, 105492. [Google Scholar] [CrossRef]
- Hacker, B.; Luffi, P.; Lutkov, V.; Minaev, V.; Ratschbacher, L.; Plank, T.; Ducea, M.; Patiño-Douce, A.; Mcwilliams, M.; Metcalf, J. Near-ultrahigh pressure orocessing of continental crust: Miocene crustal xenoliths from the Pamir. J. Petrol. 2005, 46, 1661–1687. [Google Scholar] [CrossRef]
- Schwab, M.; Ratschbacher, L.; Siebel, W.; McWilliams, M.; Minaev, V.; Lutkov, V.; Chen, F.; Stanek, K.; Nelson, B.; Frisch, W.; et al. Assembly of the Pamirs: Age and origin of magmatic belts from the southern Tien Shan to the southern Pamirs and their relation to Tibet. Tectonics 2004, 23, TC4002. [Google Scholar] [CrossRef]
- Shi, J.; Wang, M.; Ma, X.; Zhang, W.; Zhu, L. Isotope and Hydrogeochemical Characteristics of the Quman High Temperature Geothermal Field in Taxkorgan, Xinjiang. Acta Geosci. Sin. 2022, 43, 645–653. [Google Scholar]
- Bahati, G.; Pang, Z.H.; Armannsson, H.; Isabirye, E.M.; Kato, V. Hydrology and reservoir characteristics of three geothermal systems in western Uganda. Geothermics 2005, 34, 568–591. [Google Scholar] [CrossRef]
- Zhu, J.-J.; Chen, H.; Gong, G.-L. Hydrogen and oxygen isotopic compositions of precipitation and its water vapor sources in eastern Qaidam basin. Environ. Sci. 2015, 36, 2784–2790. [Google Scholar] [CrossRef]
- Craig, H. Isotopic variations in meteoric waters. Science 1961, 133, 1702–1703. [Google Scholar] [CrossRef] [PubMed]
- Pang, J.; Pang, Z.; Lv, M.; Tian, J.; Kong, Y. Geochemical and isotopic characteristics of fluids in the Niutuozhen geothermal field, North China. Environ. Earth Sci. 2017, 77, 12. [Google Scholar] [CrossRef]
- Luo, J.; Li, Y.; Tian, J.; Cheng, Y.; Pang, Z.; Gong, Y. Geochemistry of geothermal fluid with implications on circulation and evolution in Fengshun-Tangkeng geothermal field, South China. Geothermics 2022, 100, 102323. [Google Scholar] [CrossRef]
- Giggenbach, W.F. Geothermal solute equilibria. Derivation of Na-K-Mg-Ca geoindicators. Geochim. Cosmochim. Acta 1988, 52, 2749–2765. [Google Scholar] [CrossRef]
- Fournier, R.O. Chemical geothermometers and mixing models for geothermal systems. Geothermics 1977, 5, 41–50. [Google Scholar] [CrossRef]
- Fournier, R.O.; Potter, R.W. An equation correlating the solubility of quartz in water from 25° to 900 °C at pressures up to 10,000 bars. Geochim. Cosmochim. Acta 1982, 46, 1969–1973. [Google Scholar] [CrossRef]
- Hu, S.B.; He, L.J.; Wang, J.Y. Compilation of heat flow data in the China continental area. Chin. J. Geophys. 2001, 44, 604–618. [Google Scholar] [CrossRef]
- Owen, L.A.; Chen, J.; Hedrick, K.A.; Caffee, M.W.; Robinson, A.C.; Schoenbohm, L.M.; Yuan, Z.; Li, W.; Imrecke, D.B.; Liu, J. Quaternary glaciation of the Tashkurgan Valley, Southeast Pamir. Quat. Sci. Rev. 2012, 47, 56–72. [Google Scholar] [CrossRef]
- Robinson, A.C.; Owen, L.A.; Chen, J.; Schoenbohm, L.M.; Hedrick, K.A.; Blisniuk, K.; Sharp, W.D.; Imrecke, D.B.; Li, W.; Yuan, Z.; et al. No late Quaternary strike-slip motion along the northern Karakoram fault. Earth Planet. Sci. Lett. 2015, 409, 290–298. [Google Scholar] [CrossRef]
- Rybach, L. Radioactive heat production in rocks and its relation to other petrophysical parameters. Pure Appl. Geophys. 1976, 114, 309–317. [Google Scholar] [CrossRef]
- Kromkhun, K. Petrogenesis of High Heat Producing Granite: Implication for Mt Painter Province, South Australia. Ph.D. Thesis, University of Adelaide, Adelaide, Australia, 2010. [Google Scholar]
- Mechie, J.; Yuan, X.; Schurr, B.; Schneider, F.; Sippl, C.; Ratschbacher, L.; Minaev, V.; Gadoev, M.; Oimahmadov, I.; Abdybachaev, U.; et al. Crustal and uppermost mantle velocity structure along a profile across the Pamir and southern Tien Shan as derived from project TIPAGE wide-angle seismic data. Geophys. J. Int. 2012, 188, 385–407. [Google Scholar] [CrossRef]
- Sobel, E.R.; Chen, J.; Schoenbohm, L.M.; Thiede, R.; Stockli, D.F.; Sudo, M.; Strecker, M.R. Oceanic-style subduction controls late Cenozoic deformation of the Northern Pamir orogen. Earth Planet. Sci. Lett. 2013, 363, 204–218. [Google Scholar] [CrossRef]
- Ke, S. Petrogenesis of Taxkorgan Alkaline Complex Belt and Its Tectonic Significance; China University of Geosciences: Beijing, China, 2006. [Google Scholar]
Disclaimer/Publisher’s Note: The statements, opinions and data contained in all publications are solely those of the individual author(s) and contributor(s) and not of MDPI and/or the editor(s). MDPI and/or the editor(s) disclaim responsibility for any injury to people or property resulting from any ideas, methods, instructions or products referred to in the content. |
© 2023 by the authors. Licensee MDPI, Basel, Switzerland. This article is an open access article distributed under the terms and conditions of the Creative Commons Attribution (CC BY) license (https://creativecommons.org/licenses/by/4.0/).