Article

The Optimization of Water Storage Timing in Upper Yangtze Reservoirs Affected by Water Transfer Projects

1
State Key Laboratory of Simulation and Regulation of Water Cycle in River Basin, China Institute of Water Resources and Hydropower Research, Beijing 100038, China
2
China Three Gorges Corporation, Yichang 443000, China
3
Cooperative Innovation Center for Water Safety & Hydro Science, Hohai University, Nanjing 210098, China
4
College of Civil Engineering, Tianjin University, Tianjin 300354, China
5
State Key Laboratory of Hydrology-Water Resources and Hydraulic Engineering, Hohai University, Nanjing 210098, China
*
Author to whom correspondence should be addressed.
Water 2023, 15(19), 3393; https://doi.org/10.3390/w15193393
Submission received: 7 September 2023 / Revised: 19 September 2023 / Accepted: 25 September 2023 / Published: 27 September 2023
(This article belongs to the Special Issue China Water Forum 2023)

Abstract

:
To alleviate regional disparities in water resource distribution and consequent scarcity, China has initiated and planned a series of inter-basin water transfer projects using the Yangtze River Basin as the source. These projects are expected to divert approximately 33.4 billion cubic meters of water annually from the Yangtze River Basin. The implementation of these water transfer projects will inevitably alter the hydrological conditions in the upper reaches of the Yangtze River, impacting the reservoir storage strategies of cascading hydroelectric stations under current end-of-flood-season operational plans. This study quantitatively assesses the impact of water transfer projects on end-of-flood-season reservoir storage in cascading systems using the reservoir fullness ratio as an indicator. Employing reservoir storage analysis models, optimization techniques, and flood risk assessment methods, we simulated reservoir storage processes to evaluate associated flood risks and derive an optimized timing strategy for cascading reservoir storage. The results indicate that advancing the reservoir filling schedule by five days for both the Baihetan and Three Gorges dams can offset the adverse impacts of water transfer projects on reservoir storage efficiency. This adjustment restores the reservoir fullness ratio to levels observed in scenarios without water transfers while still meeting flood control requirements. After optimizing the timing of reservoir filling, the electricity generation capacity for the Baihetan and Three Gorges dams increased by 1.357 and 3.183 billion kWh, respectively, under non-transfer scenarios. In water transfer scenarios, the electricity generation for the Baihetan and Three Gorges dams increased by 1.48 and 2.759 billion kWh, respectively. By optimizing reservoir filling schedules, we not only improved the reservoir fullness ratio but also enhanced the electricity generation efficiency of the cascading systems, offering valuable insights for future reservoir operation optimization.

1. Introduction

Global freshwater resources constitute a mere 2.5% of the world’s total water volume, with the majority stored in polar ice caps and glaciers [1]. Only 0.8% of the global water volume is readily accessible for direct human use [2]. China’s per capita freshwater availability is just a quarter of the global average, categorizing it as a water-scarce nation [3]. Additionally, China exhibits significant regional disparities in water resources, leading to uneven distribution across its territories [4]. The Yangtze River Basin spans three major economic regions in China—eastern, central, and western—with a catchment area of approximately 1.8 million km2, accounting for 18.8% of the country’s land area [5]. It holds an estimated 1118.7 billion cubic meters of water, making it one of China’s most water-rich regions [6]. With the growth in population and economic development, imbalances have emerged between regional water supply and demand [7]. To alleviate the water scarcity caused by uneven regional water distribution, a series of inter-basin water transfer projects have been constructed, are under construction, or are planned in the Yangtze River Basin [8,9,10]. These projects aim to divert approximately 33.4 billion cubic meters of water annually from the water-rich Yangtze River Basin to water-scarce areas [11].
The ongoing construction and expansion of upstream water transfer projects are redistributing water from supply zones to demand zones, inducing significant hydrological shifts in the upper Yangtze River Basin [12]. However, these hydrological changes in the upper Yangtze will directly impact the operation of its cascade reservoirs [13,14]. Adhering to existing reservoir management strategies will inevitably degrade the water storage quality of these cascade systems [15]. Given this context, it is crucial to investigate the operational strategies of cascade reservoirs under the influence of water transfer projects. Optimizing the timing of reservoir water storage serves as a key component of enhanced reservoir management [16]. It not only harmonizes the operational scheduling of cascade reservoirs but also mitigates adverse effects due to hydrological variations, thereby improving regional water resource utilization [17,18]. Therefore, under the constraint of flood control requirements, the pressing issue is how to fine-tune the timing of water storage to maximize the water resource utilization efficiency of cascade reservoir systems.
Optimizing the timing for reservoir water storage is a complex scientific challenge that encompasses multiple objectives, including flood control, water supply, power generation, and navigation. A holistic approach is required to maximize the overall benefits of reservoirs while ensuring flood safety for both the reservoir and downstream areas [19,20,21]. Therefore, devising sound water storage strategies and integrated management plans is crucial for optimizing reservoir storage timing. Current research on the timing of reservoir water storage has made significant strides, particularly in the areas of reservoir scheduling policies and optimization techniques. Numerous scholars have investigated this issue from various perspectives and have proposed corresponding solutions. Methods such as risk–benefit analysis, flood risk and benefit assessment models, and multi-objective water storage scheduling models have been widely applied. Researchers have proposed a decadal water storage control scheme for the Three Gorges Dam, conducted a preliminary evaluation of the overall benefits, and summarized the pros and cons of each storage strategy [22]. A previous study employed a multi-objective water storage scheduling model to scientifically allocate flood storage capacity at the end of the flood season and optimize water storage schedules, thereby ensuring flood safety while maximizing economic benefits [23]. Using Bayesian methods, another study constructed a hydrological flood risk analysis model to assess the flood risks associated with early water storage in the Three Gorges Dam [24]. Scholars combined watershed reservoir group storage principles with the K-value discriminant method to propose a novel water storage and release strategy, determining the timing and sequence for each reservoir in the cascade system while ensuring flood safety [25]. However, these studies have only generated Pareto-optimal solutions for joint water storage scheduling in cascading reservoir systems, without presenting a balanced decision-making framework for multiple objectives such as flood control, power generation, and navigation. Some researchers have also approached reservoir storage timing optimization from the perspectives of sediment deposition and ecological impact. Some studies utilized a one-dimensional steady-flow sediment transport model to compare sediment deposition scenarios between original and advanced water storage plans, finding that advancing post-flood storage timing benefits downstream navigation and enhances the dam’s power generation efficiency [26]. In another study, a coupled water–sediment scheduling model was developed for the dam’s storage period, effectively addressing decision-making objectives under various storage strategies [27]. Further research indicates that advancing the storage timing of the Three Gorges Dam can mitigate its impact on downstream ecological flow requirements, thereby promoting river ecosystem health and stability [28].
However, most existing studies focus on individual reservoirs, neglecting the complex system of cascading reservoirs in the upper Yangtze River in terms of optimized storage timing. Optimizing the storage timing of cascading reservoirs involves not only the operational fine-tuning of individual reservoirs but also the coordination and balance of the entire cascading system, presenting a technical challenge. Additionally, in the upper Yangtze region, there is a lack of research on the impact of water transfer projects on the storage timing of cascading reservoirs, particularly in terms of adaptive strategies. Therefore, it is imperative to consider the impact of water transfer projects in the upper Yangtze and explore optimized storage timing strategies for cascading reservoirs to maximize their overall benefits in water resource management.
This study takes into account the impact of water transfer projects in the upper Yangtze River and aims to optimize the timing of reservoir storage in cascading systems, with a focus on maximizing overall reservoir efficiency while ensuring flood safety. To achieve this, we employed conventional reservoir scheduling techniques, reservoir storage optimization methods, and flood risk analysis to calculate the fill rates of cascading reservoirs in the upper Yangtze River before and after water transfer. Building on this, we developed preliminary storage plans for reservoirs affected by reduced fill rates due to water transfer, using trial calculations. We then assessed the feasibility of these storage timings using a flood risk analysis model, ultimately determining the final storage plans to maximize reservoir benefits.
The remainder of this paper is organized as follows: Section 2 provides an overview of the watershed and research methodology. Section 3 validates the employed models and outlines the design of the study. Section 4 delves into the optimization of reservoir storage timing and benefit analysis. Finally, Section 5 and Section 6 discuss the results.

2. Materials and Methods
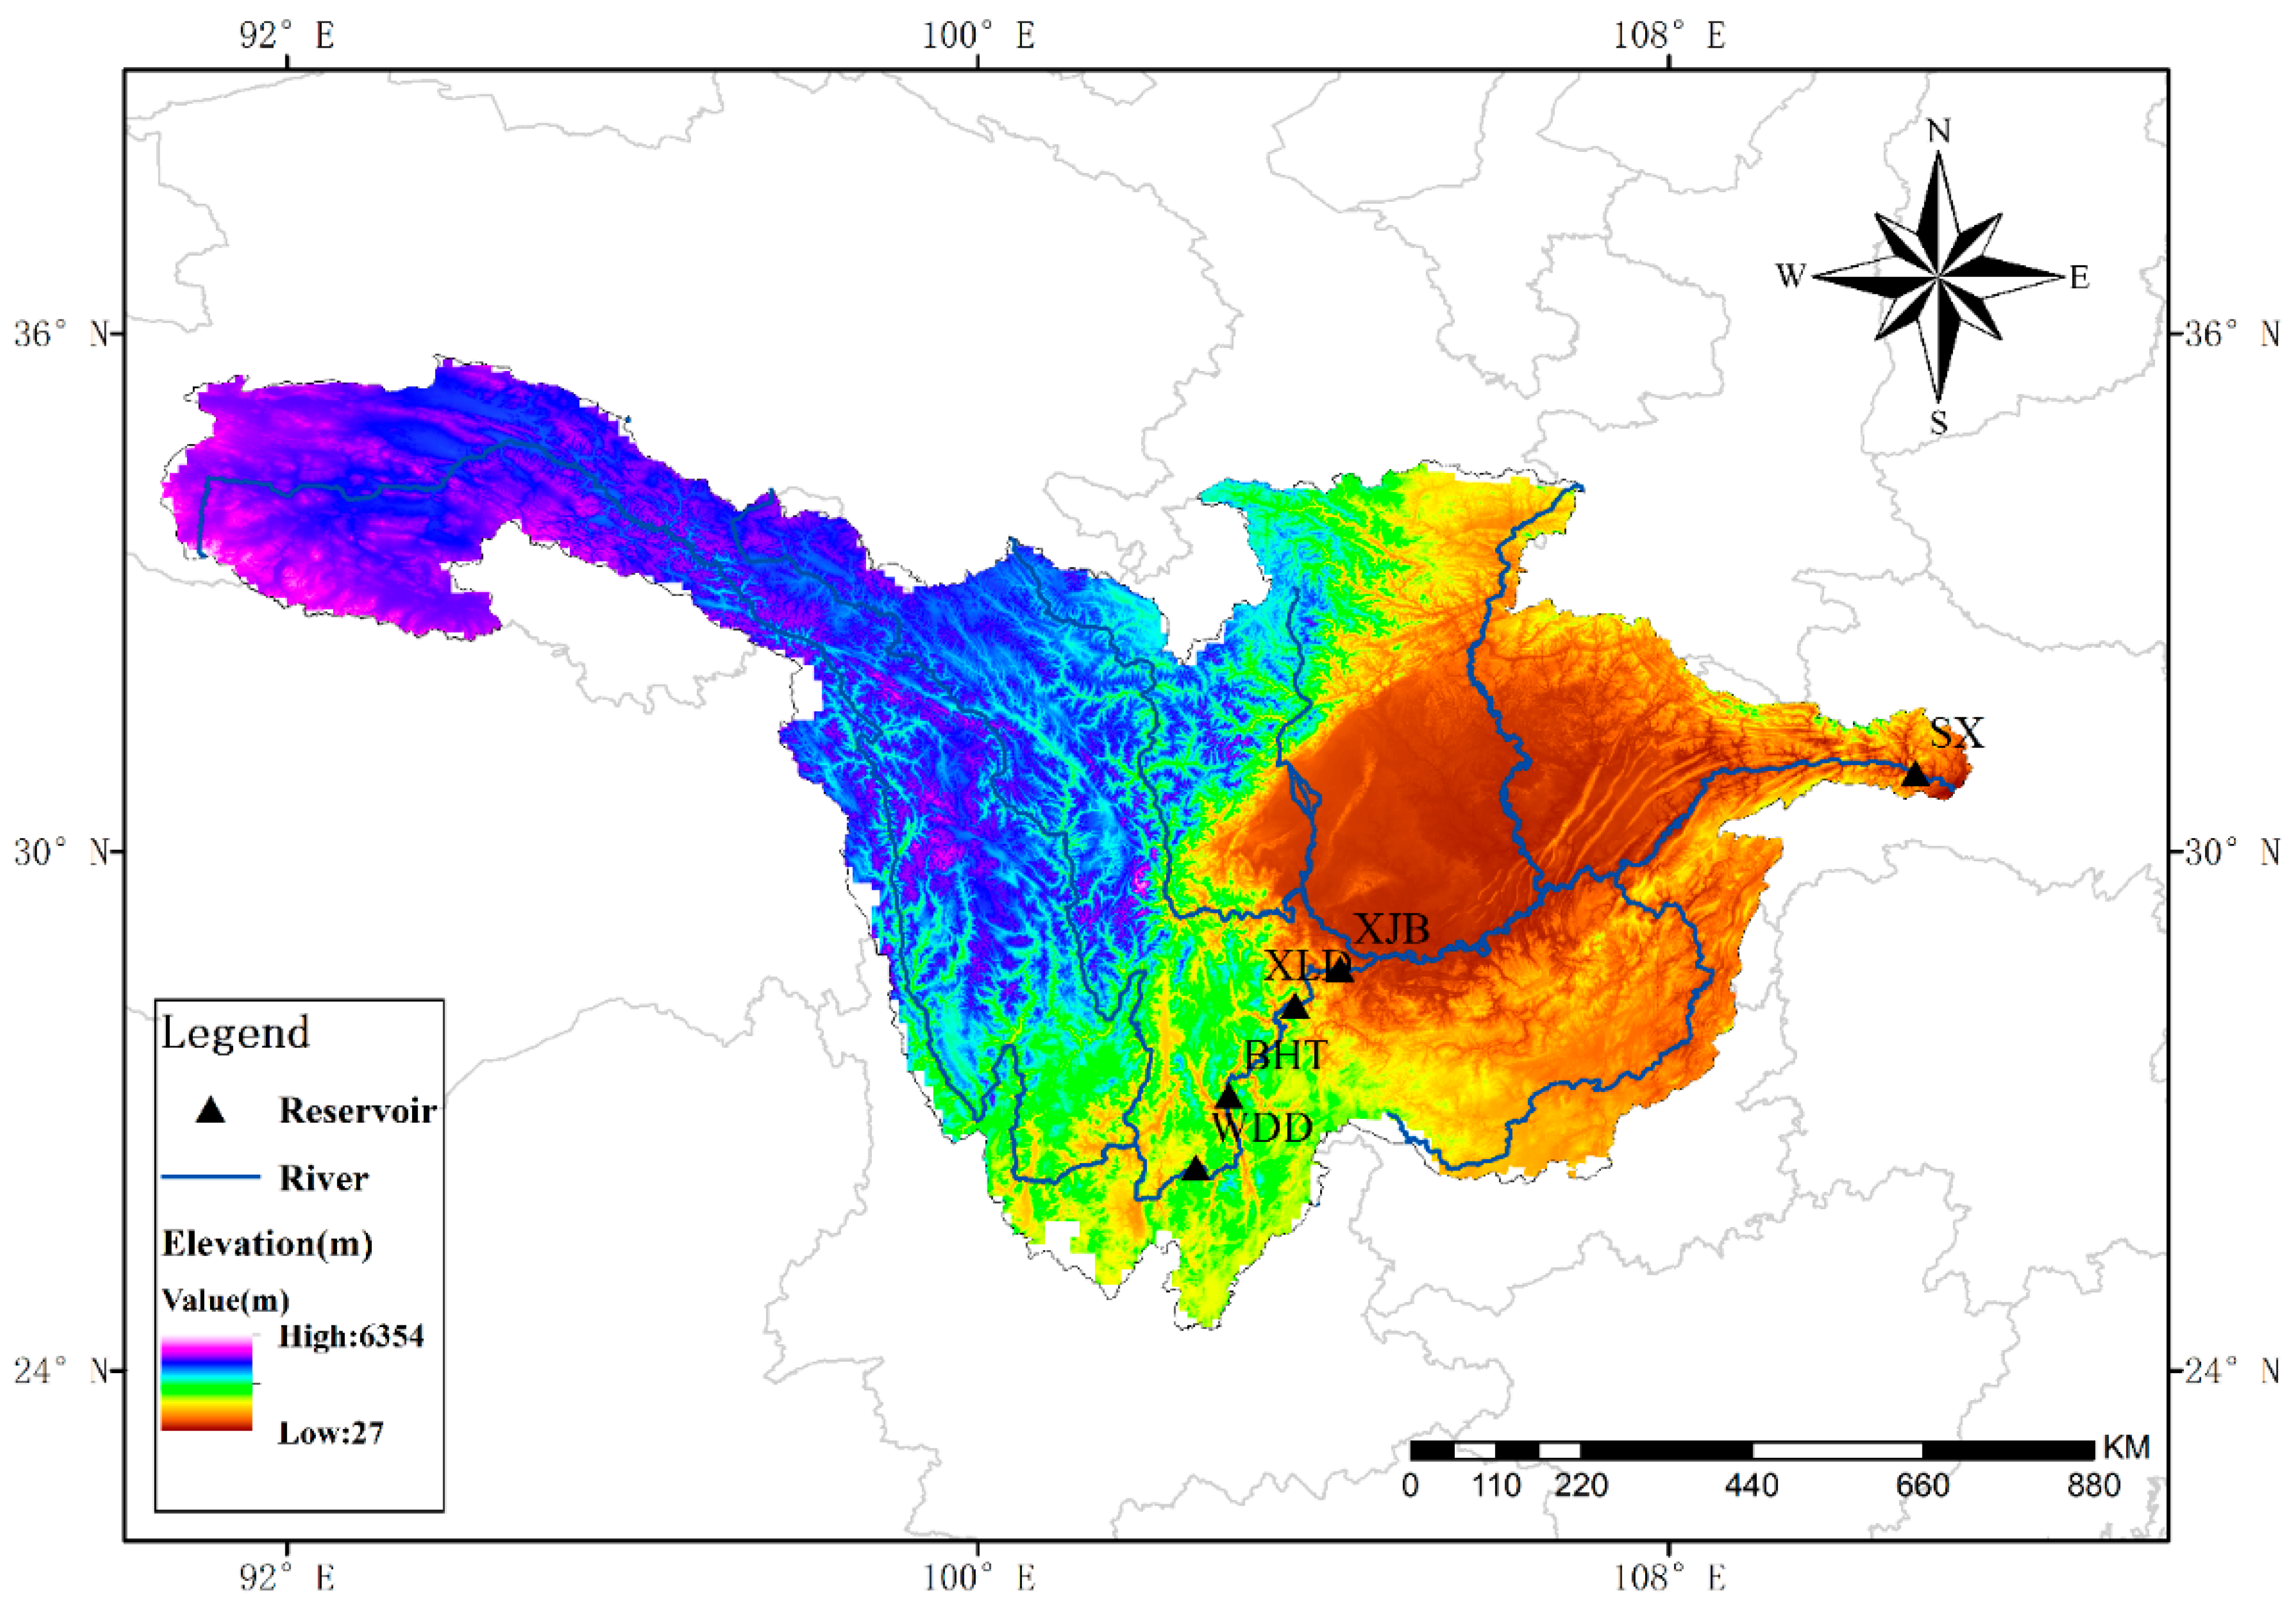
2.1. Study Area

The Yangtze River originates from the Tanggula Mountain Range on the southwestern side of the Geladandong peak in the Qinghai–Tibet Plateau. With a main channel exceeding 6300 km, it ranks as the third longest river globally and the longest in China. The upper reaches of the Yangtze River extend to Yichang, covering approximately 4300 km and draining an area of 1 million km2. The annual average discharge at the Yichang station is 451 billion m3. The main channel above Yibin is characterized as a canyon stretch, spanning 3464 km with a total elevation drop of approximately 5100 m, accounting for 95% of the Yangtze’s total elevation change. The Jinsha River Basin is generally divided into three regions: the southeastern Qinghai–Tibet Plateau, the Hengduan Mountain valleys, and the Yunnan–Guizhou Plateau. The segment from Yibin to Yichang spans 1040 km, featuring alternating hills and terraces along the river. Major tributaries joining from the north bank include the Juejiang, Tuojiang, and Jialing rivers, while the Chishui and Wu rivers join from the south bank. Below the Jiangjin Huahongbao section lies the Three Gorges stretch, which has been transformed into the Three Gorges Reservoir area following the construction of the Three Gorges Dam. The cascade reservoirs in the upper reaches of the Yangtze main channel include Wudongde, Baihetan, Xiluodu, Xiangjiaba, and the Three Gorges Reservoir (Figure 1).
There are five major inter-basin water transfer projects in the upper Yangtze River Basin that are completed, under construction, or planned. These projects include the Yijiang–Buhan, Dianzhong Water Transfer, Bailongjiang Water Diversion, South-to-North Water Transfer Western Route Phase I, and South-to-North Water Transfer Western Route Phase II (Figure 1). Specifically, the Yijiang–Buhan project (P1) aims to transfer water from upstream of the Three Gorges Dam to the receiving areas of the South-to-North Water Transfer Central Route, the middle and lower reaches of the Han River in Hubei Province, the Yinhan–Jiwei project receiving area, and the right bank replenishment area of the Han River in Hubei. The Dianzhong Water Transfer project (P2) is designed to divert water from the Jinsha River to Xinpo Bei in Honghe Prefecture. The Bailongjiang Water Diversion project (P3) aims to transfer water from the Daigusi Reservoir to the Longdongnan Region in Gansu Province. The South-to-North Water Transfer Western Route Phase I project (P4) plans to divert water from Shuangjiangkou to provinces along the Yellow River Basin. The South-to-North Water Transfer Western Route Phase II project (P5) is set to channel water from Lianghekou and Yebatan to provinces along the Yellow River Basin. The estimated annual average water transfer volumes for these projects are shown in Table 1.

2.2. Water Storage Periods

In this study, we constructed water storage analysis models for five dams: Wudongde, Baihetan, Xiluodu, Xiangjiaba, and the Three Gorges, based on their existing operational guidelines. Specifically, these guidelines include the provisional operational rules for the Wudongde and Baihetan hydroelectric stations on the Jinsha River, the cascading operational rules for Xiluodu and Xiangjiaba, and the 2019 revised cascading operational rules for the Three Gorges and Gezhouba dams. According to these rules, the water storage periods are as follows: Wudongde from 1 August to 30 August; Baihetan from 1 August to 10 September; Xiluodu from 10 September to 30 September; Xiangjiaba from 10 September to 30 September; and the Three Gorges from 10 September to 31 October.

2.3. CLHMS Model

In this study, we employed a coupled land–hydrology model system (CLHMS) to simulate daily average inflow rates for the Wudongde Dam from 1981 to 2010, as well as for the Baihetan, Xiluodu, Xiangjiaba, and Three Gorges dams over the same period, providing a data foundation for optimizing cascading reservoir water storage timing. CLHMS is a fully integrated system that couples the land surface scheme (LSX) with the hydrologic modeling system (HMS) [29]. LSX incorporates modules for soil, vegetation, snow, and glaciers, and calculates runoff, evapotranspiration, and soil moisture fluxes based on meteorological factors such as precipitation, solar radiation, temperature, wind speed, air pressure, humidity, and cloud cover. These calculations are then passed to HMS, which includes modules for one-dimensional river routing, two-dimensional hill slope routing, two-dimensional lake hydrodynamics, and two-dimensional groundwater hydrodynamics. This allows for the integration of surface and groundwater flows, thereby calculating the moisture content in the vadose zone and groundwater levels, which are then fed back into LSX to update soil moisture fluxes at the lower boundary, completing a fully coupled land–hydrology system.
In this study, the daily meteorological data required to drive the coupled land–hydrology model system (CLHMS) include the CN05.1 precipitation dataset (http://data.cma.cn, accessed on 1 January 2021) and the NCEP/NCAR reanalysis data (http://rda.ucar.edu/datasets, accessed on 1 January 2021). The model operates on a daily scale with a spatial resolution of 5 km.

3. Model Validation and Optimization Scheme Design

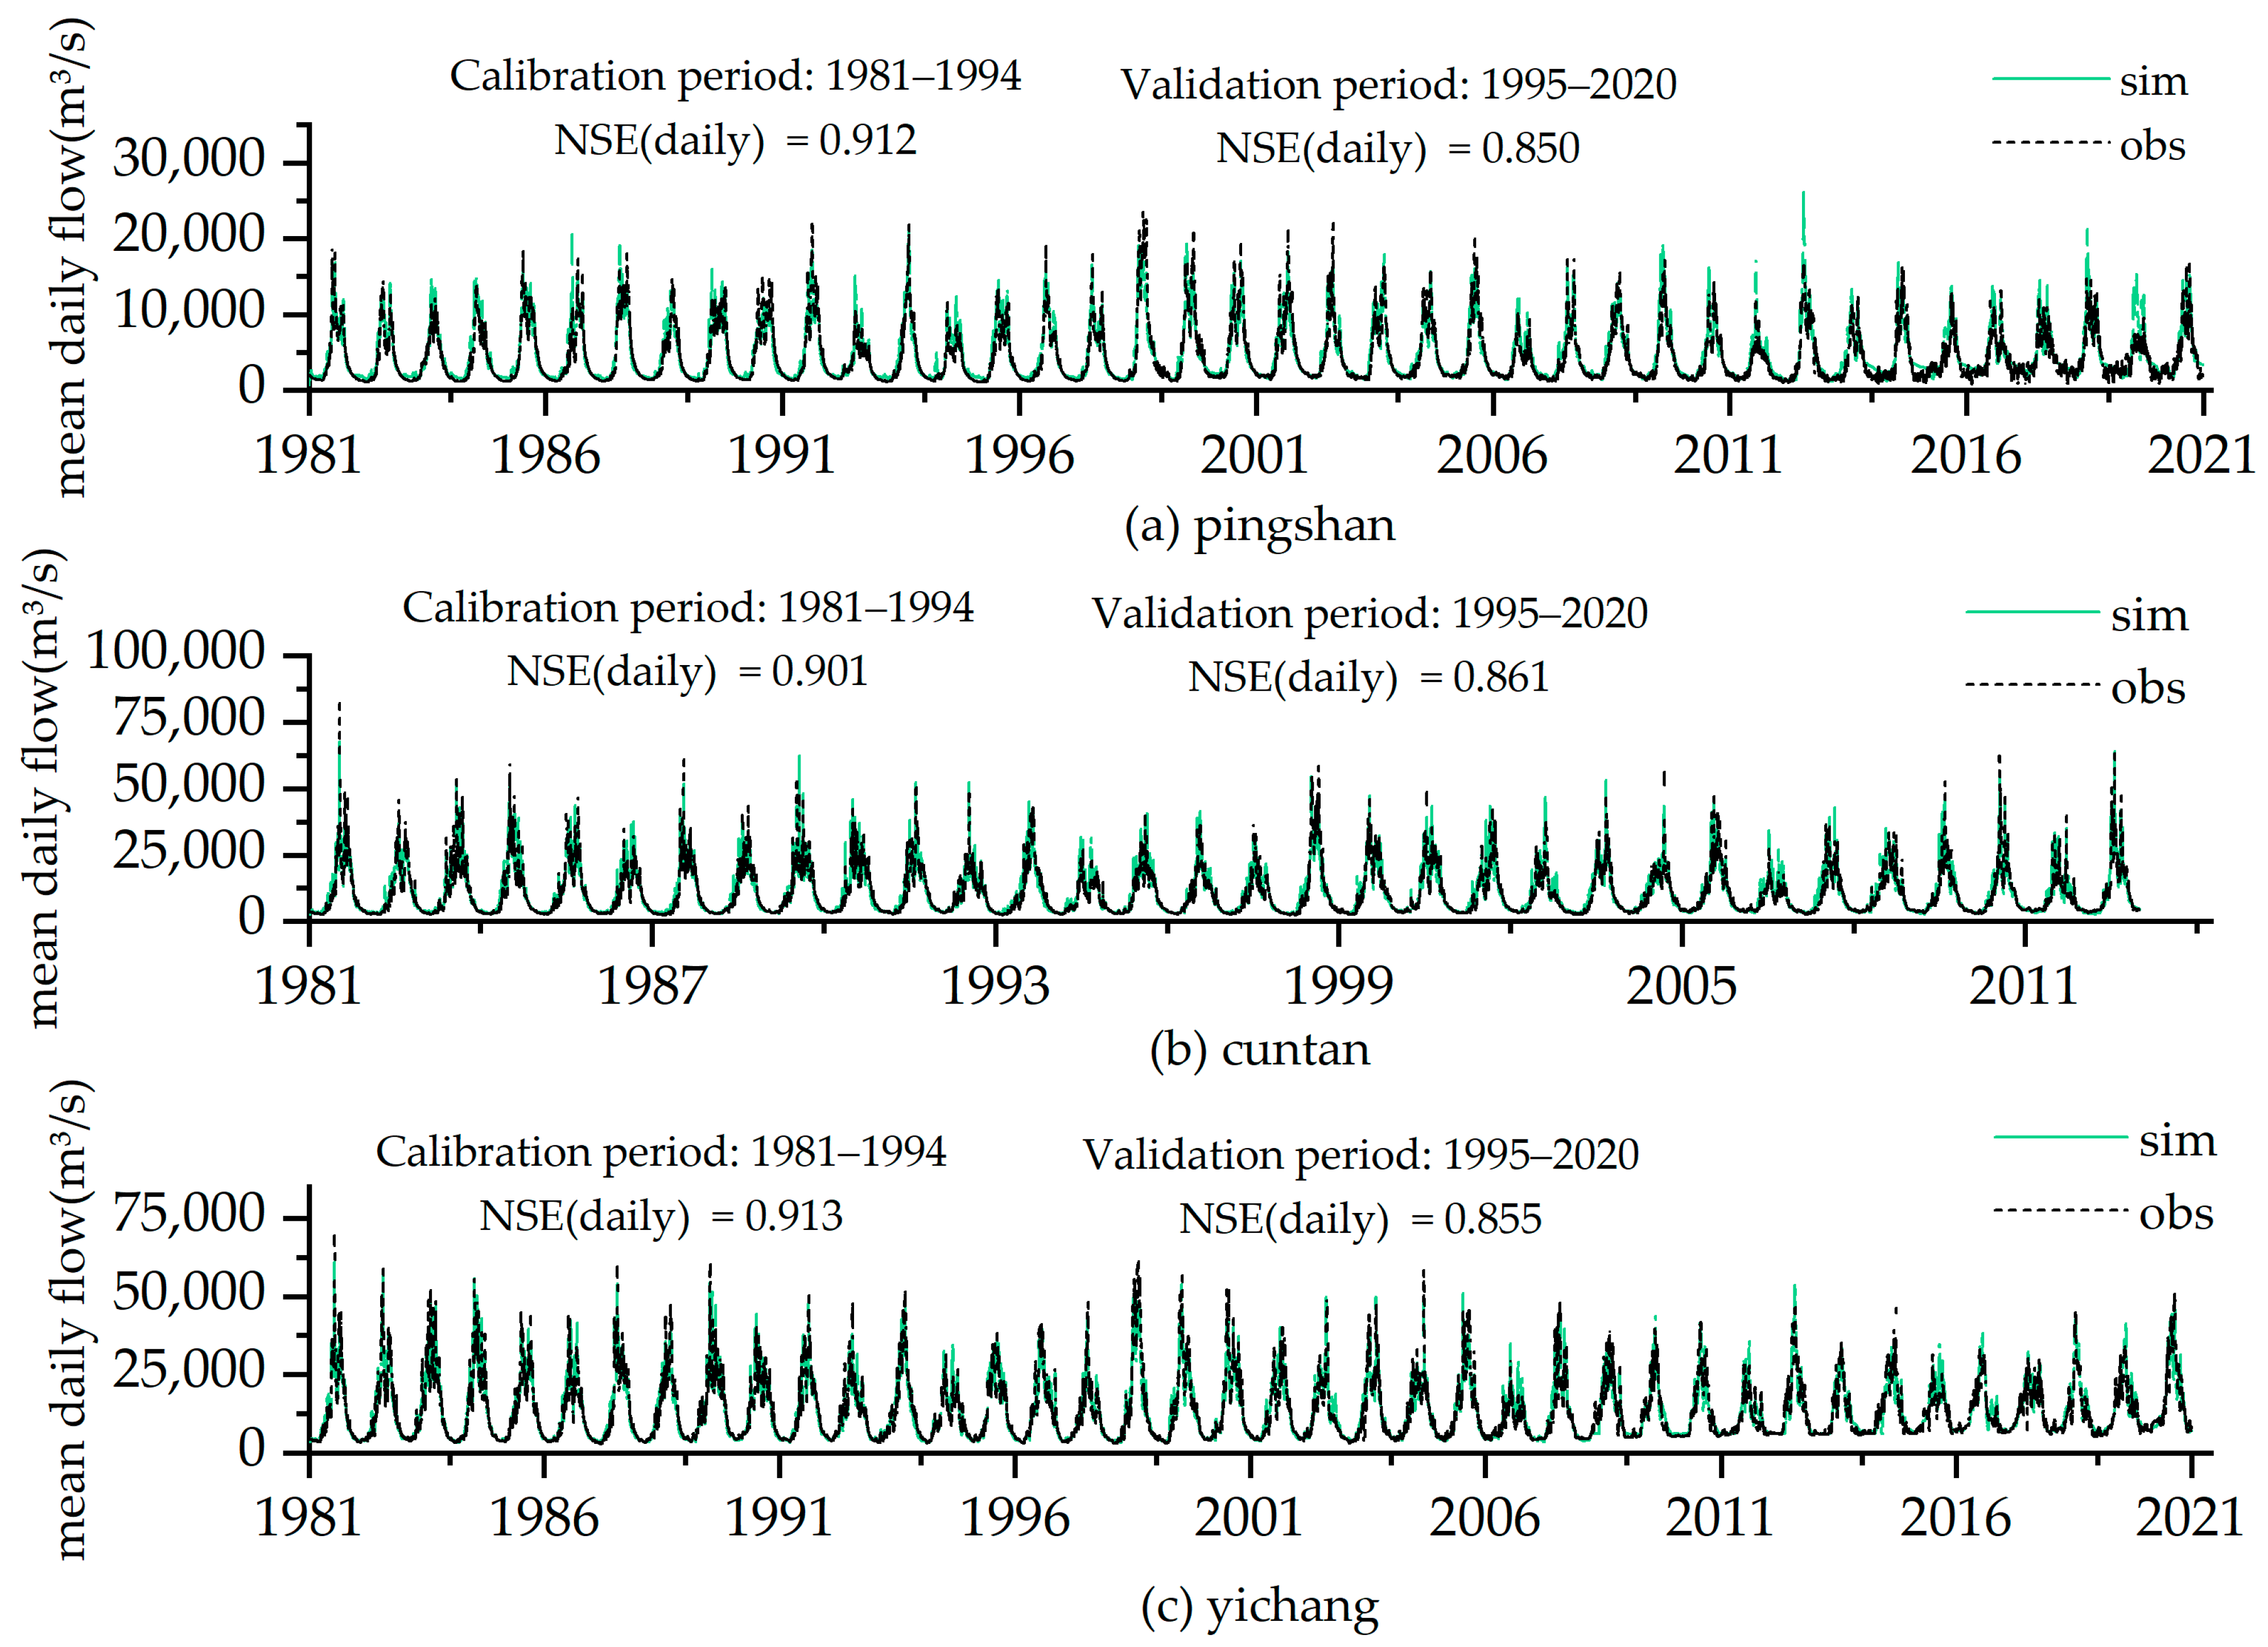
3.1. Model Calibration and Validation

To validate the feasibility of the coupled land–hydrology model system (CLHMS), we calibrated and validated runoff parameters at three sites: Yichang, Cuntan, and Pingshan. The calibration period was selected from 1981 to 1994, and the validation period was from 1995 to 2020. Through the simulation of flow with 10,000 randomly generated parameter sets, the average daily Nash–Sutcliffe efficiency (NSE) for each set was compared, and the optimal parameter set was ultimately selected.
Figure 2 presents the daily observed and simulated flow rates at three hydrological stations. The results indicate satisfactory model performance at these sites, with daily determination coefficients exceeding 0.9 during the calibration period and 0.85 during the validation period. This confirms the model’s capability to accurately simulate the hydrological characteristics of the upper reaches of the Yangtze River, thereby validating its feasibility and providing a flow data foundation for the optimization of the timing of reservoir storage in cascading systems.

3.2. Optimization of Water Storage Timing Strategies

3.2.1. Reservoir Inflow Classification

To quantitatively analyze the changes in the reservoir fullness rate before and after water transfer, we used the CLHMS model to simulate the inflow to the Wudongde Reservoir from 1981 to 2020 and the inter-reservoir inflow. Based on the average flow rate during the storage period, the data were categorized into three hydrological year groups: wet, average, and dry. According to the classification criteria, out of the 40-year flow sequence, there are 13 wet years, 14 average years, and 13 dry years. The categorization results are presented in Table 2.

3.2.2. Reservoir Fullness Rate

The fullness rate serves as an indicator to measure the ease or difficulty of reservoir storage. In this study, the fullness rate was used to quantitatively analyze the impact of water transfer projects on the end-of-flood-season storage of cascading reservoirs. A higher fullness rate indicates better storage quality at the end of the storage period, while a lower rate indicates poorer quality. Using inflow and inter-reservoir flow data simulated with the CLHMS model, the fullness rates of each reservoir at the end of the storage period were calculated through a reservoir storage analysis model. The formula for calculating the fullness rate is as follows:
F = n/N × 100%
where F represents the fullness rate of the reservoir; n denotes the number of years from 1981 to 2020 when the reservoir achieved full capacity; and N symbolizes the overall count of years under consideration, totaling 40. The storage periods and fullness conditions for each reservoir are detailed in Table 3 below.

3.2.3. Optimization Methods for Reservoir Water Storage Timing

To mitigate the adverse effects of water diversion projects on the end-of-flood-season storage levels of cascading reservoirs, a trial calculation method was employed to formulate advanced water storage plans for each reservoir. By advancing the timing of reservoir water storage, the post-diversion reservoir fill rates are restored to pre-diversion levels. Initially, the fill rates of each reservoir prior to water diversion are calculated, as well as the fill rates when water storage is advanced by a certain number of days post-diversion. Under the condition that the post-diversion fill rates are not less than the pre-diversion rates, the number of days by which water storage should be advanced post-diversion is determined. An advanced end-of-flood-season water storage plan for the reservoirs is then formulated. The calculation procedure is as follows:
  • The flow data from the Wudongde Dam site and the interval flow of cascading reservoirs from 1981 to 2020 are utilized as input, considering the regulation effect between cascading reservoirs. By simulating the scheduling according to each reservoir’s scheduling procedure, the reservoir’s annual simulated storage process is calculated. The number of years (n1) when the reservoir is full at the end of the year is recorded, and the pre-diversion full storage rate was calculated as Rf1 = n1/N, where Rf1 represents the pre-diversion reservoir storage rate; N is the total number of years of reservoir storage, which is 40 years in total; and n1 represents the number of years with full reservoir storage.
  • Post-diversion flow data from the Wudongde Dam site and cascading reservoirs from 1981 to 2020 are utilized as input, considering the regulation effect between cascading reservoirs. By advancing the storage time by j days and simulating the scheduling, the reservoir’s annual simulated storage process is calculated, and the number of years (n2) when the reservoir is full at the end of the year is recorded. The corresponding full storage rate under the diversion scenario is Rfj2 = n2/N, where Rfj2 represents the reservoir storage rate after diversion with j days of advanced filling; N signifies the total number of years for reservoir storage, which spans 40 years in total; and n2 denotes the number of years without full reservoir storage.
  • The pre-diversion full storage rate Rf1 is compared with the corresponding full storage rate Rfj2 when storage is advanced by j days post-diversion. When Rf1 is less than or equal to Rfj2, the number of days to advance storage under the influence of the diversion project is P = j, where Rf1 represents the reservoir storage rate before diversion, Rfj2 denotes the reservoir storage rate in the diversion scenario with j days of advanced filling, and P represents the number of days by which the reservoir should be filled in advance to ensure that the post-diversion storage rate is not lower than the pre-diversion storage rate.
  • If Rf1 is greater than or equal to Rfj2, j is increased by 1, and steps b-c are repeated. The maximum number of days that each reservoir (Wudongde, Baihetan, Xiluodu, Xiangjiaba, and Three Gorges) can advance storage, denoted as P1, P2, P3, P4, and P5, and the corresponding end-of-flood-season advance storage plans are then calculated, where Rf1 represents the reservoir storage rate before diversion; Rfj2 represents the reservoir storage rate in the diversion scenario with j days of advanced filling; and P1, P2, P3, P4, and P5 indicate the number of days each reservoir should fill in advance.
Through the above computational steps, the number of days each reservoir should advance its water storage can be determined, thereby optimizing the reservoir’s water storage scheduling scheme and enhancing the full storage rate and water resource utilization efficiency.

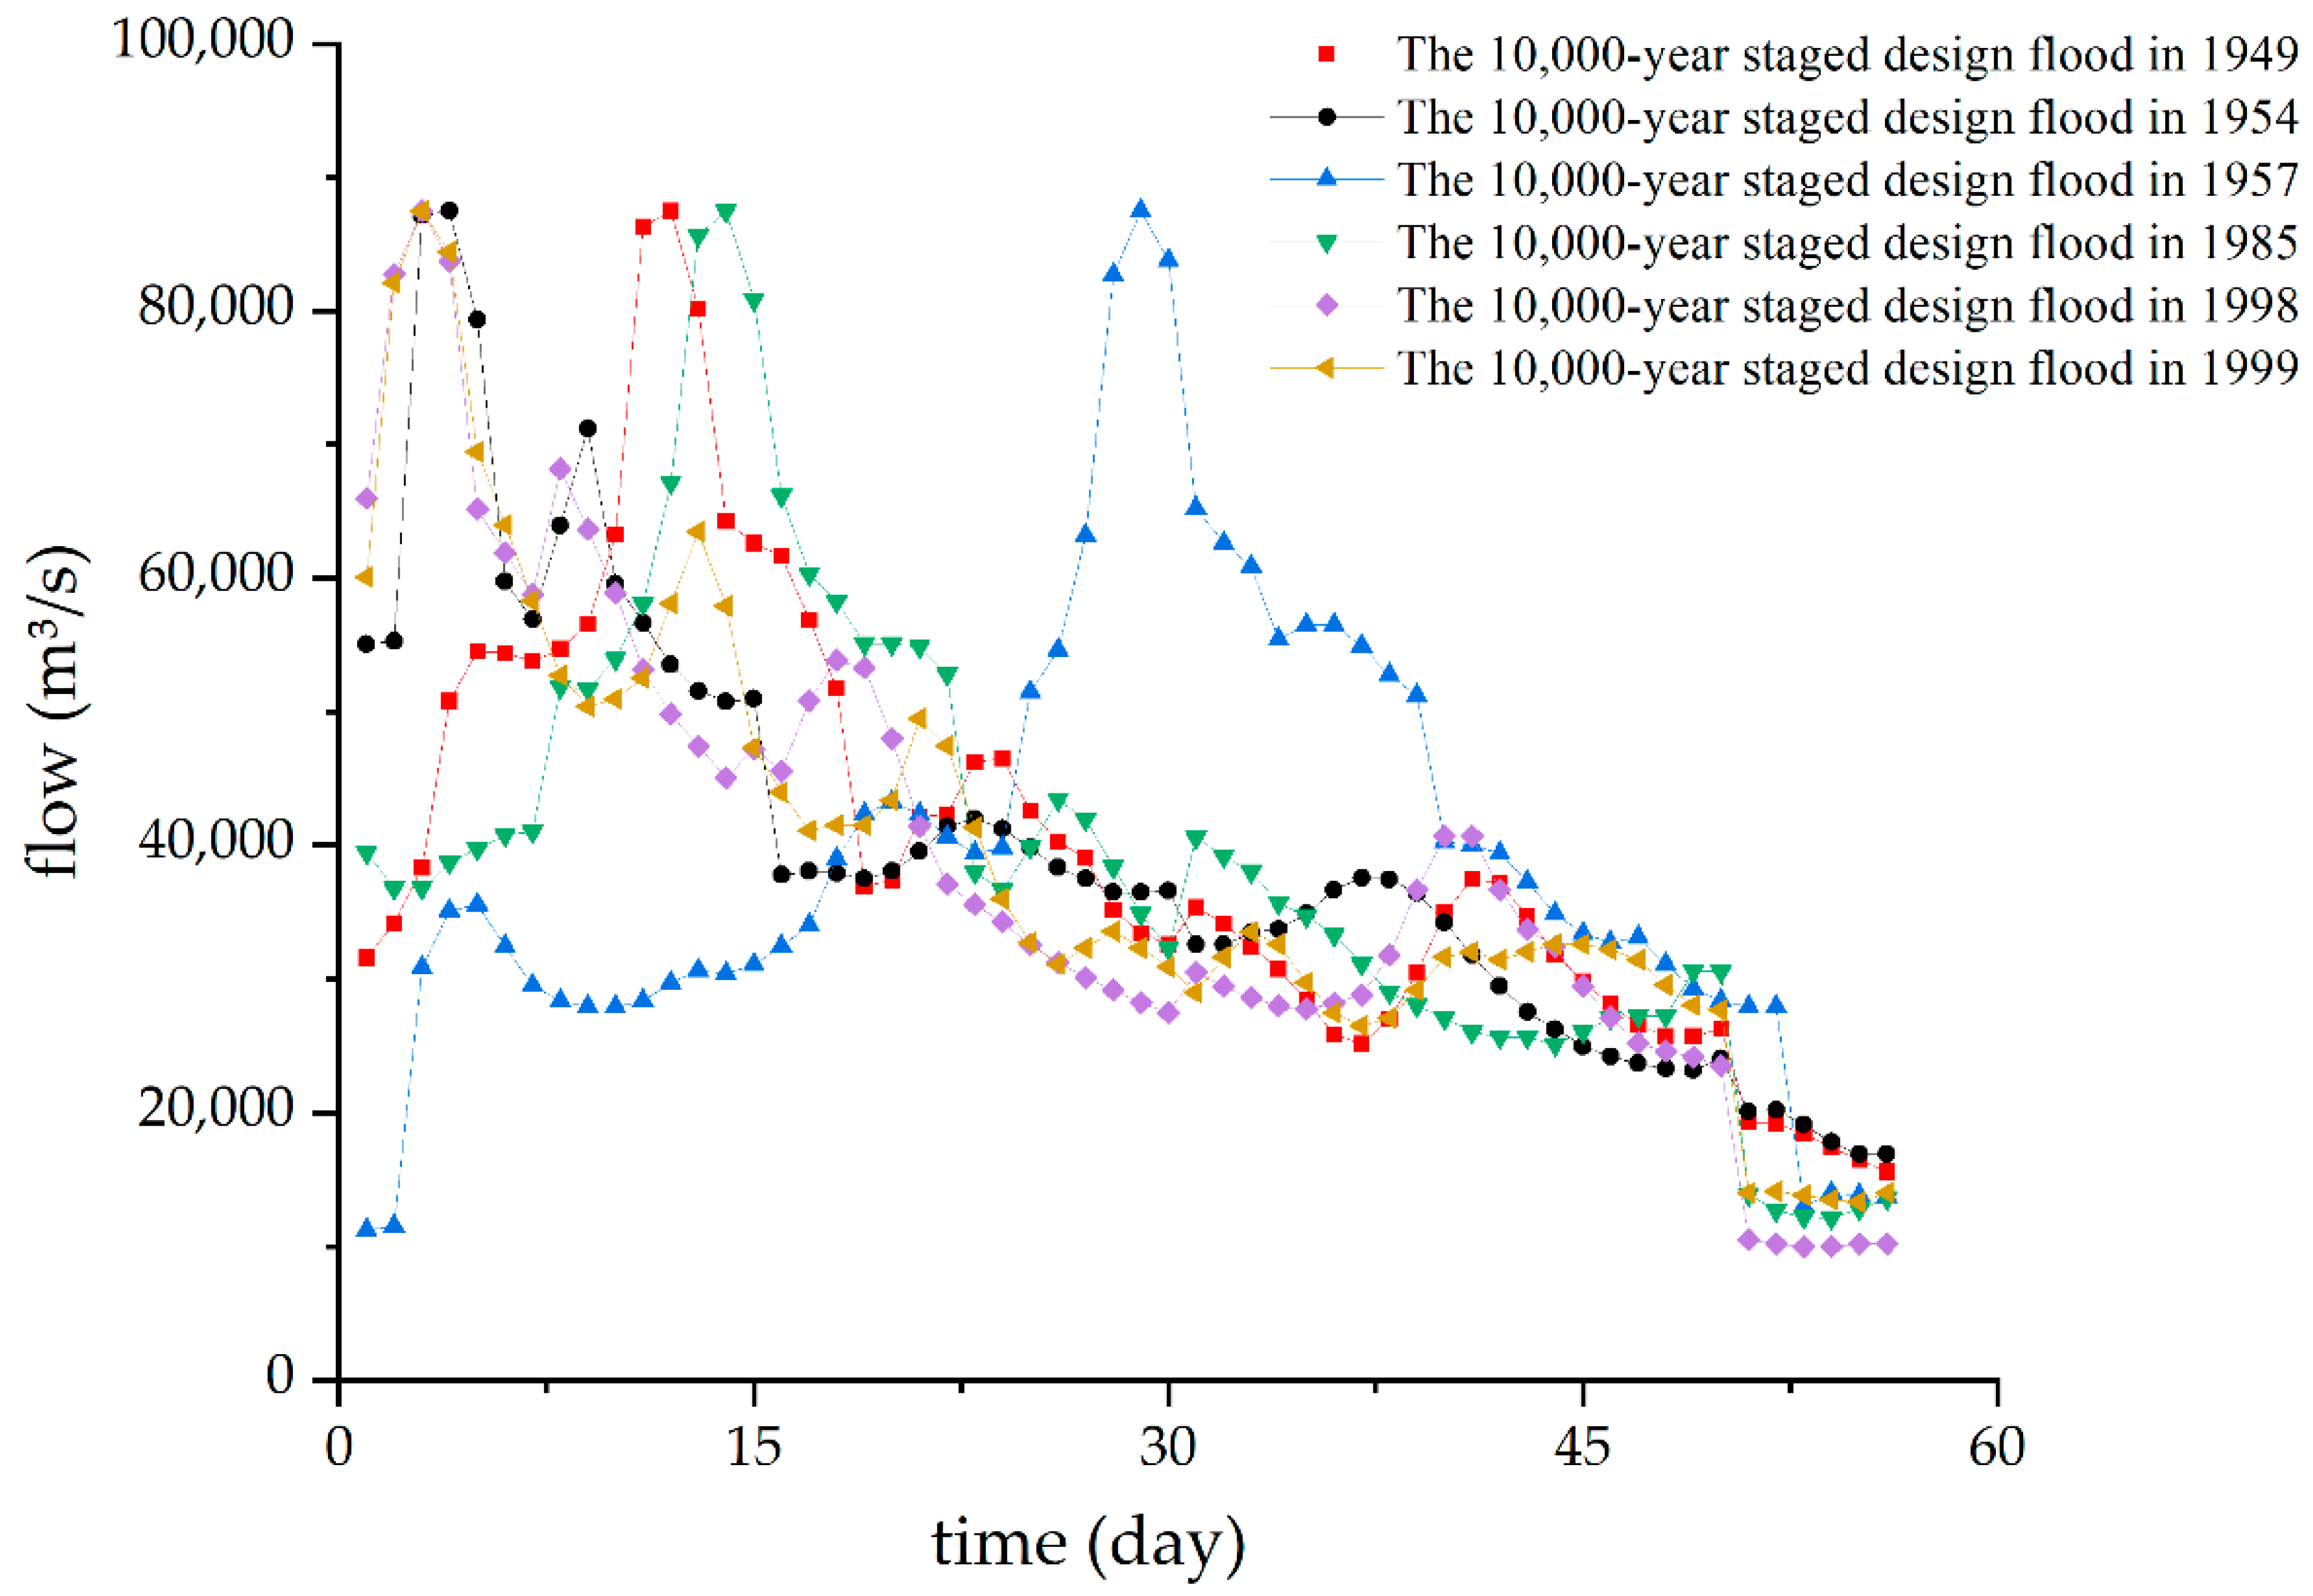
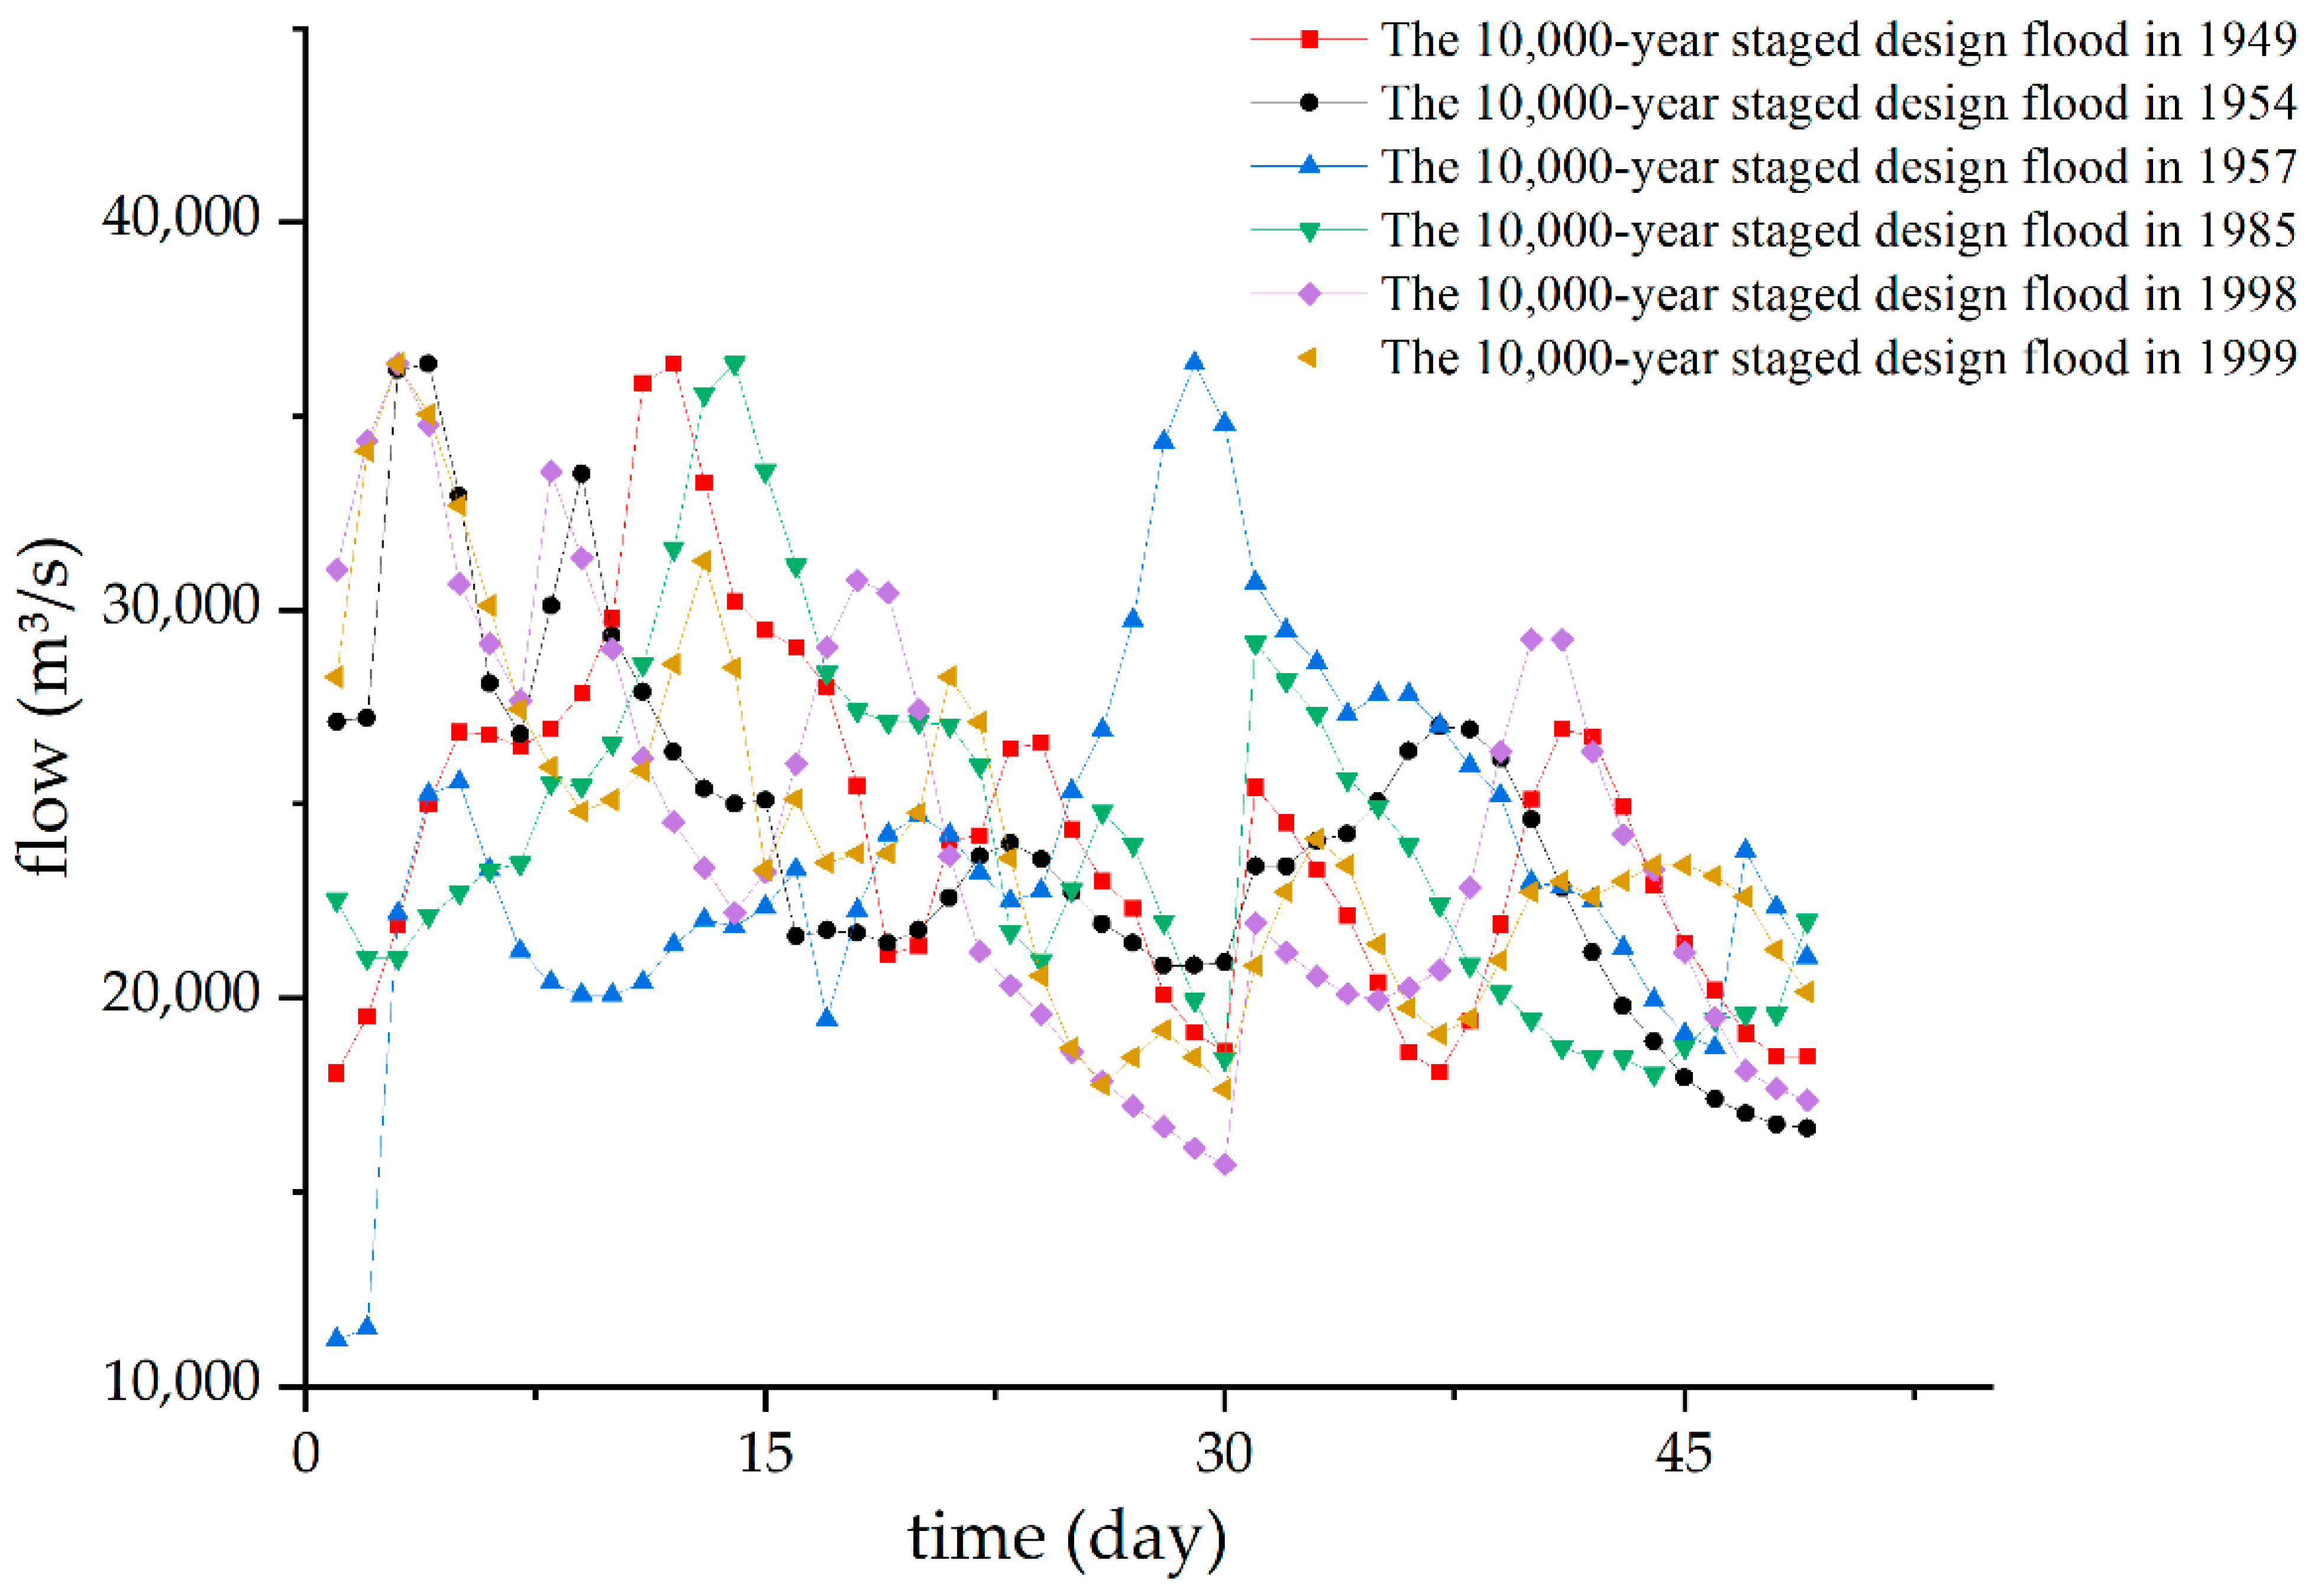
3.2.4. Methodology for Reservoir Flood Risk Analysis

Given that implementing new water storage scheduling may elevate flood risk in reservoirs, a flood risk assessment is imperative for reservoirs adopting advanced storage strategies. In this study, we initially selected multiple representative flood events and employed the P-III curve for fitting. Using frequency-matching magnification, we generated staged design floods with a 0.01% occurrence probability. These flood events encapsulate a range of flood characteristics, including peak height, flood volume, single-peak and multi-peak floods, and early and late peak timings. Subsequently, these staged design floods were used for flood routing simulations to determine the maximum flood control water level (Zmax). This level was then compared with the standard flood level (Zx) to assess the flood risk of the reservoir. The criteria for risk assessment were as follows: If Zmax ≤ Zx, then early reservoir filling meets flood control requirements. If Zmax ≥ Zx, then early reservoir filling does not meet flood control requirements, where Zmax represents the maximum flood level of the reservoir, and Zx stands for the verified flood level.

4. Results

4.1. Impact of Water Transfer on Reservoir Filling Rates

Utilizing the CLHMS model, we acquired flow data for cascading reservoirs pre- and post-water transfer. Employing the reservoir fullness ratio as a key metric and leveraging a reservoir storage analysis model, we calculated the fullness ratios for each reservoir before and after water transfer.
Table 4 presents the reservoir fullness ratios before and after the implementation of inter-basin water transfer projects. The results indicate that these projects have adversely affected the storage quality of certain reservoirs. For the Wudongde Reservoir, the water transfer had no significant impact on its fullness ratio, maintaining 100% across wet, average, and dry years. In contrast, the Baihetan Reservoir experienced a substantial decline in its fullness ratio to 87.5% post-transfer, a 7.5% reduction compared to pre-transfer levels. For both the Xiluodu and Xiangjiaba reservoirs, the water transfer projects had a negligible impact on their fullness ratios, which remained at 100% across all hydrological year types—wet, average, and dry. In contrast, the Three Gorges Reservoir experienced a notable decrease in its fullness ratio to 87.5% after water transfer, marking a 2.5% reduction from its pre-transfer state. The fullness ratios for wet, average, and dry years were 100%, 100%, and 62%, respectively.

4.2. Optimization of Reservoir Water Storage Timing

We employed the CLHMS model to obtain flow data for cascading reservoirs before and after water transfer. Utilizing an optimized reservoir storage timing methodology and a reservoir storage analysis model, we derived optimal storage timing strategies for the upstream cascading reservoirs of the Yangtze River, ensuring that post-transfer fullness ratios would not be lower than their pre-transfer levels.
Table 5 presents the calculated reservoir fullness ratios under the optimized water storage timing scheme. The results indicate that by advancing the water storage timing by five days for both the Baihetan and Three Gorges reservoirs, their fullness ratios can be restored to the levels observed in the absence of water transfer. Specifically, the Baihetan Reservoir achieved a fullness ratio of 95% with the advanced timing, with individual fullness ratios of 100%, 84%, and 95% for wet, average, and dry years, respectively. This restored the fullness ratio to the pre-transfer level of 95%. Similarly, the Three Gorges Reservoir reached a fullness ratio of 90% with the advanced timing, with individual fullness ratios of 100%, 100%, and 70% for wet, average, and dry years, respectively, restoring it to the pre-transfer level of 90%.
The computational findings suggest that in water transfer scenarios, advancing the water storage timing can significantly enhance the storage volumes for the Baihetan and Three Gorges reservoirs, thereby improving their fullness ratios. This offers critical insights for water resource management and scheduling in trans-basin water transfer projects, contributing to the optimization of reservoir water utilization.

4.3. Optimization of Reservoir Water Storage Timing

The implementation of the proposed advanced water storage schedules for the Baihetan and Three Gorges reservoirs—specifically, a 5-day advance for each—may elevate flood risk, necessitating flood risk assessments. For this purpose, six representative flood events from 1949, 1954, 1957, 1985, 1998, and 1999 were selected, encompassing a range of flood characteristics including peak heights, flood volumes, and temporal flood peak distributions. Utilizing the P-III curve fitting and frequency-matching methods, we calculated the 0.01% annual exceedance probability staged design floods for the Baihetan Reservoir (25 July to 10 September) and the Three Gorges Reservoir (5 September to 31 October). Figure 3 and Figure 4 depict these staged design floods for each reservoir, respectively.
Using a reservoir storage analysis model and following the proposed advanced storage schedules—5 days in advance for both the Baihetan and Three Gorges reservoirs—we conducted flood risk assessments and obtained flood control dispatch results for these reservoirs.
Figure 5 illustrates the flood control simulation results for the Three Gorges Reservoir during six specific flood events (1949, 1954, 1957, 1985, 1998, and 1999) with a 0.01% exceedance probability. The calculated peak flood levels were 170.32 m, 170.35 m, 169.59 m, 170.11 m, 170.23 m, and 169.75 m, respectively. Notably, the 1954 flood event yielded the highest flood level of 170.35 m. These results indicate that the peak flood levels under these extreme conditions are all below the design flood level of 175 m. Therefore, advancing the storage schedule by 5 days for the Three Gorges Reservoir does not increase flood risk and is a viable strategy.
Figure 6 presents the flood control simulation outcomes for the Baihetan Reservoir across six distinct flood events (1949, 1954, 1957, 1985, 1998, and 1999) with a 0.01% exceedance probability. The computed peak flood levels were 807.16 m, 807.01 m, 805.70 m, 807.30 m, 807.72 m, and 805.12 m, respectively. The 1998 flood event resulted in the highest flood level of 807.72 m. These findings confirm that the peak flood levels under these extreme scenarios are all below the design flood level of 827.83 m. Consequently, advancing the reservoir’s storage schedule by 5 days does not elevate the flood risk and is deemed a feasible approach.
Based on these calculations, it is evident that the proposed advanced storage strategy—namely, advancing the storage schedule by 5 days for both the Baihetan and Three Gorges reservoirs—does not increase flood risk when facing a 0.01% design flood event. Therefore, this advanced storage strategy is deemed viable.

4.4. Impact of Reservoir Water Storage Timing Optimization on Power Generation

Utilizing the established reservoir storage analysis model, we evaluated the hydroelectric generation performance of the Baihetan and Three Gorges reservoirs before and after the implementation of the proposed advanced storage strategy.
Table 6 illustrates the hydroelectric generation performance of the cascade reservoirs before and after the optimization of storage timing. The results indicate a significant impact on the electricity generation during the storage period. Following the optimization, the electricity output increased substantially in both regulated and unregulated scenarios. Specifically, the regulated scenario saw an increase of 42.39 billion kWh, while the unregulated scenario experienced an increase of 45.4 billion kWh.
Further analysis reveals that only the Baihetan and Three Gorges reservoirs experienced an increase in hydroelectric generation during the storage period under the proposed early storage scheme. In the unregulated scenario, the Baihetan and Three Gorges reservoirs saw an increase of 1.357 billion kWh and 3.183 billion kWh, respectively. In the regulated scenario, the increases were 1.48 billion kWh for Baihetan and 2.759 billion kWh for Three Gorges. Notably, the increase in electricity output was more substantial for the Three Gorges reservoir compared to Baihetan.
In summary, early water storage in the Baihetan and Three Gorges reservoirs significantly enhances hydroelectric generation during the storage period, particularly in regulated scenarios. This has important implications for the operational decision making in trans-basin water transfer projects and for hydroelectric supply.

5. Discussion

This study reveals that the implementation of water transfer projects in the Yangtze River Basin adversely affects the reservoir storage quality of the main cascade reservoirs. Specifically, the Three Gorges and Baihetan reservoirs experienced a 7.5% and 2.5% reduction in their storage efficiency, respectively, while other reservoirs remained unaffected with a 100% storage efficiency. This could be attributed to the larger storage capacities and greater regulation capabilities of the Three Gorges and Baihetan reservoirs, which were compromised to maintain the storage levels of other reservoirs. Additionally, the Wudongde Reservoir experienced a greater decline in storage efficiency than the Three Gorges Reservoir, likely due to the latter’s superior regulation capabilities, which rendered it less susceptible to adverse impacts.
In this study, we calibrated and validated the model at three hydrological stations: Yichang, Cuntan, and Pingshan. The results show that all three stations exhibited a high level of performance in both the calibration period (1981–1994) and the validation period (1995–2020). Particularly, during the calibration period, the NSE coefficient exceeded 0.9. This phenomenon may be attributed to the fact that large hydropower stations such as Wudongde, Baihetan, Xiluodu, Xiangjiaba, and Three Gorges on the upper reaches of the Yangtze River began operation after 1995, so the hydrological model was not influenced by the operation of these large reservoirs during the calibration period, resulting in a high NSE coefficient. However, in the validation period (1995–2020), the NSE coefficient showed a slight decrease but still remained above 0.8. The decline in the NSE coefficient may be related to the successive operation of Xiluodu (commissioned in 2013), Xiangjiaba (commissioned in 2012), and Three Gorges (commissioned in 2003) hydropower stations on the mainstream of the Yangtze River during the validation period. Nevertheless, the NSE coefficient still maintained a high level, possibly because these hydropower stations generally operate at their maximum generation capacity, resulting in more stable flow conditions and facilitating accurate simulation using the hydrological model [30]. Therefore, even during the validation period, which was influenced by the operation of hydropower stations, the NSE coefficient of the hydrological model remained above 0.8.
Our study further reveals that optimizing reservoir storage timing can mitigate the adverse effects of water transfer on the storage efficiency of the Baihetan and Three Gorges reservoirs while still meeting flood control requirements. In flood risk assessments, the highest flood control levels for the Three Gorges and Baihetan reservoirs were 170.35 m and 807.72 m, respectively, both significantly below their standard flood levels of 175 m and 825 m. This indicates that there is potential for further optimization of storage timing for both the Baihetan and Three Gorges reservoirs to enhance storage efficiency and hydroelectric benefits. Additionally, comparative analysis of pre- and post-optimization scenarios revealed that advancing the storage timing not only compensates for the loss in storage efficiency but also enhances the electricity generation of the cascade reservoirs. Particularly, in the absence of water transfer, the Baihetan and Three Gorges reservoirs saw an increase in electricity generation by 1.357 billion kWh and 3.183 billion kWh, respectively, highlighting the significant impact of storage timing optimization.

6. Conclusions

To counteract the impact of water transfer projects on reservoir storage efficiency, in this study, we employed timing optimization techniques to mitigate storage losses. We developed models for reservoir storage analysis, storage timing optimization, and flood risk assessment, evaluating both the benefits and risks of advancing reservoir storage timing. The following are the key findings of this study:
(1)
The implementation of inter-basin water transfer projects in the Yangtze River Basin has negatively impacted the storage efficiency of the mainstream cascade reservoirs. Specifically, the Baihetan and Three Gorges reservoirs experienced a significant decline in their storage levels, decreasing by 7.5% and 2.5%, respectively, after the water transfer.
(2)
By advancing the water storage schedule by five days for both the Baihetan and Three Gorges reservoirs, their storage levels were restored to pre-transfer conditions while still meeting flood control requirements. This indicates that early water storage effectively mitigates the adverse effects of water transfer on reservoir storage efficiency.
(3)
Implementing the proposed early storage plan—namely advancing water storage by five days for both the Baihetan and Three Gorges reservoirs—achieved dual benefits: It restored the reservoirs’ storage levels and enhanced their electricity generation. In non-transfer scenarios, the Baihetan and Three Gorges reservoirs experienced an increase in electricity generation by 1.357 and 3.183 billion kWh, respectively. In transfer scenarios, the increases were 1.48 and 2.759 billion kWh, respectively. This demonstrates that optimizing the timing of water storage not only restores the reservoirs’ storage levels but also enhances their electricity generation capabilities.
In summary, this study offers crucial insights into the decision-making process and water resource management of the upstream cascade reservoirs in the Yangtze River. By optimizing the timing of water storage, reservoirs can improve both their fill rates and electricity generation, contributing to more efficient water resource utilization and management. Future research can further explore the potential of advanced water storage to refine reservoir management strategies.

Author Contributions

F.W. designed and conducted the experiments. F.W., M.Y., N.D. and W.G. wrote the draft of the paper. J.C. proposed the main structure of this study. Y.Z., H.W. and X.L. provided useful advice and made some corrections. All authors have read and agreed to the published version of the manuscript.

Funding

This research was funded by the Research Programme of the China Three Gorges Corporation “Impact of trans-basin water diversion on the Yangtze River Basin and its adaptation” (No. 0704183), the Research Programme of the Kunming Engineering Corporation Limited (No. DJ-HXGG-2021-04), the Key Research and Development Programme of Yunnan (202203AA080010) as part of the Science and Technology Plan Project of Yunnan Provincial Department of Science and Technology, and the Belt and Road Special Foundation of the State Key Laboratory of Hydrology-Water Resources and Hydraulic Engineering (2021490311).

Data Availability Statement

Not applicable.

Conflicts of Interest

The authors declare no conflict of interest.

References

  1. Gleick, P.H. Water in Crisis; Oxford University Press: Oxford, UK, 1993; 473p. [Google Scholar]
  2. Wada, Y.; Bierkens, M.F.P. Sustainability of global water use: Past reconstruction and future projections. Environ. Res. Lett. 2014, 9, 104003. [Google Scholar] [CrossRef]
  3. Hoekstra, A.Y.; Mekonnen, M.M. The water footprint of humanity. Proc. Natl. Acad. Sci. USA 2012, 109, 3232–3237. [Google Scholar] [CrossRef] [PubMed]
  4. Ma, T.; Sun, S.; Fu, G.; Hall, J.W.; Ni, Y.; He, L.; Yi, J.; Zhao, N.; Du, Y.; Pei, T. Pollution exacerbates China’s water scarcity and its regional inequality. Nat. Commun. 2020, 11, 650. [Google Scholar] [CrossRef] [PubMed]
  5. Zheng, S.; Zhong, Z.; Zou, Q.; Ding, Y.; Yang, L.; Luo, X. Overall Situation of Yangtze River Basin. In Flood Resources Utilization in the Yangtze River Basin; Springer: Singapore, 2021; pp. 19–69. [Google Scholar]
  6. Guan, D.; Hubacek, K. Assessment of regional trade and virtual water flows in China. Ecol. Econ. 2007, 61, 159–170. [Google Scholar] [CrossRef]
  7. Zhang, Y.; Khan, S.U.; Swallow, B.; Liu, W.; Zhao, M. Coupling coordination analysis of China’s water resources utilization efficiency and economic development level. J. Clean. Prod. 2022, 373, 133874. [Google Scholar] [CrossRef]
  8. Sun, S.; Zhou, X.; Liu, H.; Jiang, Y.; Zhou, H.; Zhang, C.; Fu, G. Unraveling the effect of inter-basin water transfer on reducing water scarcity and its inequality in China. Water Res. 2021, 194, 116931. [Google Scholar] [CrossRef] [PubMed]
  9. Zhuang, W. Eco-environmental impact of inter-basin water transfer projects: A review. Environ. Sci. Pollut. Res. 2016, 23, 12867–12879. [Google Scholar] [CrossRef]
  10. Yu, M.; Wang, C.; Liu, Y.; Olsson, G.; Wang, C. Sustainability of mega water diversion projects: Experience and lessons from China. Sci. Total Environ. 2018, 619–620, 721–731. [Google Scholar] [CrossRef]
  11. Li, Y.; Nzudie, H.L.F.; Zhao, X.; Wang, H. Addressing the Uneven Distribution of Water Quantity and Quality Endowment: Physical and Virtual Water Transfer within China; Springer: Berlin/Heidelberg, Germany, 2019. [Google Scholar]
  12. Wang, W.; Zhu, Y.; Dong, S.; Becker, S.; Chen, Y. Attribution of decreasing annual and autumn inflows to the Three Gorges Reservoir, Yangtze River: Climate variability, water consumption or upstream reservoir operation? J. Hydrol. 2019, 579, 124180. [Google Scholar] [CrossRef]
  13. Zhou, J.; Zhang, Y.; Zhang, R.; Ouyang, S.; Wang, X.; Liao, X. Integrated optimization of hydroelectric energy in the upper and middle Yangtze River. Renew. Sustain. Energy Rev. 2015, 45, 481–512. [Google Scholar] [CrossRef]
  14. Yang, Z.; Cai, Y.; Mitsch, W.J. Ecological and hydrological responses to changing environmental conditions in China’s river basins. Ecol. Eng. 2015, 76, 1–6. [Google Scholar] [CrossRef]
  15. He, S.; Guo, S.; Yin, J.; Liao, Z.; Li, H.; Liu, Z. A novel impoundment framework for a mega reservoir system in the upper Yangtze River basin. Appl. Energy 2022, 305, 117792. [Google Scholar] [CrossRef]
  16. Ahmad, A.; El-Shafie, A.; Razali, S.F.M.; Mohamad, Z.S. Reservoir Optimization in Water Resources: A Review. Water Resour. Manag. 2014, 28, 3391–3405. [Google Scholar] [CrossRef]
  17. Kuriqi, A.; Pinheiro, A.N.; Sordo-Ward, A.; Bejarano, M.D.; Garrote, L. Ecological impacts of run-of-river hydropower plants—Current status and future prospects on the brink of energy transition. Renew. Sustain. Energy Rev. 2021, 142, 110833. [Google Scholar] [CrossRef]
  18. Dong, N.; Yang, M.; Yu, Z.; Wei, J.; Yang, C.; Yang, Q.; Liu, X.; Lei, X.; Wang, H.; Kunstmann, H. Water resources management in a reservoir-regulated basin: Implications of reservoir network layout on streamflow and hydrologic alteration. J. Hydrol. 2020, 586, 124903. [Google Scholar] [CrossRef]
  19. Yu, Y.; Zhao, R.; Zhang, J.; Yang, D.; Zhou, T. Multi-objective game theory optimization for balancing economic, social and ecological benefits in the Three Gorges Reservoir operation. Environ. Res. Lett. 2021, 16, 085007. [Google Scholar] [CrossRef]
  20. Jing, Z.; An, W.; Zhang, S.; Xia, Z. Flood control ability of river-type reservoirs using stochastic flood simulation and dynamic capacity flood regulation. J. Clean. Prod. 2020, 257, 120809. [Google Scholar] [CrossRef]
  21. Dittmann, R.; Froehlich, F.; Pohl, R.; Ostrowski, M. Optimum multi-objective reservoir operation with emphasis on flood control and ecology. Nat. Hazards Earth Syst. Sci. 2009, 9, 1973–1980. [Google Scholar] [CrossRef]
  22. Li, Y.; Gan, F.; Deng, J. Preliminary study on impounding water of Three Gorges Project in September. J. Hydraul. Eng. 2008, 27, 110–114. [Google Scholar]
  23. Liu, X.-y.; Guo, S.-l.; Liu, P.; Li, X. Scheme of impounding in advance for the Three Gorges Reservoir by considering the comprehensive utilization benefits. Adv. Water Sci. 2009, 20, 851–856. [Google Scholar]
  24. Guo, J.; Guo, S.; Li, T.; Chen, G. Flood control risk analysis model of impounding water in advance for Three Gorges reservoir Shuili Fadian Xuebao. J. Hydroelectr. Eng. 2012, 31, 16–21. [Google Scholar]
  25. Ouyang, S.; Zhou, J.; Zhang, R.; Wang, X.M.; Wang, H. Study on optimal scheduling of multi-objective joint flood control for lower Jinsha River cascade reservoirs and Three Gorges reservoir. J. Hydroelectr. Eng. 2013, 32, 43–49. [Google Scholar]
  26. Peng, Y.; Li, Y.T.; Zhang, H.W. Multi-objective decision-making model for coordinative dispatch of water and sediment in reservoir. J. Hydraul. Eng. 2004, 4, 1–7. [Google Scholar]
  27. Peng, Y.; Ji, C.; Liu, F. Impounding time and objective decision of Xiluodu-Xiangjiaba cascade reservoirs in the flood recession period. J. Basic Sci. Eng. 2014, 22, 1098–1107. [Google Scholar]
  28. Li, Q.; Bai, X.; Lu, G.; Zou, Z.; Cai, T. Impact of the Three Gorges reservoir operation with different schemes on the downstream ecological water use Shuili Fadian Xuebao. J. Hydroelectr. Eng. 2011, 30, 124–128. [Google Scholar]
  29. Dong, N.; Guan, W.; Cao, J.; Zou, Y.; Yang, M.; Wei, J.; Chen, L.; Wang, H. A hybrid hydrologic modelling framework with data-driven and conceptual reservoir operation schemes for reservoir impact assessment and predictions. J. Hydrol. 2023, 619, 129246. [Google Scholar] [CrossRef]
  30. Galletti, A.; Avesani, D.; Bellin, A.; Majone, B. Detailed simulation of storage hydropower systems in large Alpine watersheds. J. Hydrol. 2021, 603, 127125. [Google Scholar] [CrossRef]
Figure 1. The upper reaches of the Yangtze River.
Water 15 03393 g001
Figure 2. The simulated and observed daily streamflow at (a) Pingshan, (b) Cuntan, and (c) Yichang.
Water 15 03393 g002
Figure 3. The 0.01% staged design floods for the Three Gorges Reservoir.
Water 15 03393 g003
Figure 4. The 0.01% staged design floods for the Baihetan Reservoir.
Water 15 03393 g004
Figure 5. Flood risk analysis chart for the Three Gorges Reservoir.
Water 15 03393 g005
Figure 6. Flood risk analysis chart for the Baihetan Reservoir.
Water 15 03393 g006
Table 1. Description of the water transfer projects in the upper reaches of the Yangtze River.
Project NameWater ResourcesWater Receiving AreaDesigned Annual Water Transfer Demand
(Billion m3)
P1Upstream of the Three Gorges DamHubei Province3.9
P2Jinsha RiverHonghezhou3.403
P3Daikosi ReservoirGansu Province0.96
P4ShuangjiangkouYellow River Basin8
P5Lianghekou and YebatanYellow River Basin9
Table 2. Classification results of wet, normal, and dry years for the reservoir.
Wet YearsNormal YearsDry Years
YearThe Average Flow during the Storage Period (m3/s)YearThe Average Flow during the Storage Period (m3/s)YearThe Average Flow during the Storage Period (m3/s)
199814,8572014774419955520
199110,8542001752520165395
200510,7971996712920135344
200910,7472017672619885102
202010,4082004659220194832
199310,2861989647020114730
200210,2281985605619834561
201889672010602719824334
199988462003597219924280
198787072007594219864207
200886241981584319943795
200084751997567420153609
201281561984567220063452
19905653
Table 3. Conditions for reservoir fullness.
ReservoirStorage PeriodThe Full Storage Conditions of the Reservoir
WDD8.1–8.30The water level on 30 August: =975 m
BHT8.1–9.10The water level on 10 September: =825 m
XLD9.10–9.30The water level on 30 September: =600 m
XJB9.10–9.30The water level on 30 September: =380 m
SX9.10–10.31The water level on 31 October: =175 m
Table 4. Reservoir fullness ratios before and after water transfer.
Reservoir Full Storage Rate of Reservoir before Water Transfer (%)Full Storage Rate of the Reservoir After Water Transfer (%)
Wet YearsNormal YearsDry YearsTotalWet YearsNormal YearsDry YearsTotal
WDD100100100100100100100100
BHT10010084951001006287.5
XLD100100100100100100100100
XJB100100100100100100100100
SX10010070901001006287.5
Table 5. Optimized water storage plans and reservoir fullness rates.
ReservoirTime to Start Reservoir StorageDays to Start Storing Water Early (d)Reservoir Fullness Rates (%)
Wet YearsNormal YearsDry YearsTotal
WDD1 August0100100100100
BHT27 July510010093100
XLD10 September0100100100100
XJB10 September0100100100100
SX6 September51001009397.3
Table 6. Power generation during reservoir water storage period before and after optimization.
ReservoirBefore OptimizationAfter OptimizationIncreased Power GenerationIncrease Percentage (%)
No Water TransferWater TransferNo Water TransferWater TransferNo Water TransferWater TransferNo Water TransferWater Transfer
WDD54.5851.3554.5851.35000.00%0.00%
BHT87.1179.26100.6894.0613.5714.815.58%18.67%
XLD53.9748.6453.9748.64000.00%0.00%
XJB25.8523.2225.8523.22000.00%0.00%
SX135.21128.85167.04156.4431.8327.5923.54%21.41%
Total356.72331.32402.12373.7145.442.3912.73%12.79%
Disclaimer/Publisher’s Note: The statements, opinions and data contained in all publications are solely those of the individual author(s) and contributor(s) and not of MDPI and/or the editor(s). MDPI and/or the editor(s) disclaim responsibility for any injury to people or property resulting from any ideas, methods, instructions or products referred to in the content.

