Article

Fusing Satellite Precipitation Products Based on Top–Down and Bottom–Up Approaches and an Improved Double Instrumental Variable Method for the Chuanyu Region, China, from 2007 to 2019

1
Institute of RS and GIS, School of Earth and Space Sciences, Peking University, Beijing 100871, China
2
State Key Laboratory of Efficient Utilization of Agricultural Water Resources, Beijing 100083, China
3
National Field Scientific Observation and Research Station on Efficient Water Use of Oasis Agriculture, Wuwei 733009, China
*
Author to whom correspondence should be addressed.
Water 2023, 15(19), 3390; https://doi.org/10.3390/w15193390
Submission received: 8 September 2023 / Revised: 21 September 2023 / Accepted: 25 September 2023 / Published: 27 September 2023
(This article belongs to the Section Hydrology)

Abstract

:
Precipitation is one of the crucial variables in the hydrological and ecological cycles. High-quality precipitation data are of great importance for climate change, water resource management, and agricultural research over complex terrains. Recently, satellite precipitation products have been produced based on different retrieval algorithms, mainly the top–down and bottom–up approaches. Fusing satellite precipitation products based on these two different approaches may combine their advantages and achieve a better data quality for describing precipitation. In this paper, an improved double instrumental variable (IMDIV) method is proposed for data quality enhancement by merging IMERG (integrated multi-satellite retrievals for global precipitation measurement), which is based on the top–down approach, and SM2RAIN (soil moisture to rain), which is based on the bottom–up approach. In detail, IMERG-Early (IMERG early run) and IMERG-Final (IMERG final run) are merging with SM2RAIN at a daily scale, respectively. Rain gauge station records from GHCNd (Global Historical Climatology Network Daily) are used to evaluate the original and fused precipitation products for the Chuanyu region, China, from 2007 to 2019. The results show that the proposed IMDIV method outperforms the original DIV method on precipitation fusion tasks. Moreover, the proposed IMDIV-EAS (fusing IMERG-Early and SM2RAIN) and IMDIV-FIS (fusing IMERG-Final and SM2RAIN) products both outperform the original precipitation products IMERG and SM2RAIN, with higher correlation coefficients (R) of 0.603 and 0.634; better RMSEs of 5.136 and 5.088 mm/day; and better biases of 0.514 and 0.509 mm/day. The results demonstrate the effectiveness of the proposed method and the high quality of the fused products, which could be useful for hydrology and climate studies.

1. Introduction

Precipitation is an essential component within the water cycle [1,2,3,4]. Accurate precipitation information is needed for ground–atmosphere domain research, such as water resource management [5,6,7], drought monitoring [8,9,10,11,12], flood monitoring [13], agricultural production [14,15,16,17], large-scale climate change monitoring, and climate forecasting [18,19,20,21,22,23,24].
Generally, precipitation data can be obtained via the following four ways [25]. Firstly, the gauge station is the conventional way to acquire precipitation records. A gauge station can provide precipitation information at a single location with very high accuracy; this gauge-station-based precipitation information is often used as the ground truth [26] and further corrects satellite-based precipitation data. However, the quantity of the precipitation records is directly decided by the spatial distribution and the temporal availability of the gauge station. Thus, areas with a complex terrain and a harsh climate can lack gauge stations, which results in the low availability of ground truth for precipitation monitoring and satellite precipitation data correction [27]. Secondly, the ground-based radar is another ground-based precipitation observation method with high accuracy, yet it still has the limitation of spatial and temporal availability [28]. Thirdly, model simulation has been used for precipitation data production and analysis. The model simulation method considers multiple climate and geographical variables, such as clouds, temperature, wind, and elevation [29]. Model adjustment during the simulation often needs professional knowledge to understand the model [30]. Finally, precipitation data can also be obtained using the satellite technique.
With the recent development of remote sensing, satellite-based precipitation data have become an important method for rainfall monitoring [31]. Precipitation products have been produced based on precipitation retrieval algorithms, such as PERSIANN (precipitation estimation from remotely sensed information using artificial neural networks) [32], PERSIANN-CCS (PERSIANN–cloud classification system) [33], PERSIANN-CDR (PERSIANN–climate data record) [34], PERSIANN-CCSCDR (precipitation estimation from remotely sensed information using artificial neural networks–cloud classification system–climate data record) [35], CHIRPS (climate hazards group infrared precipitation with stations) [36], TRMM (tropical rainfall measuring mission), the TMPA product (multi-satellite precipitation analysis) [37], the GPM IMERG product (the integrated multi-satellite retrievals for the global precipitation measurement) [38], the SM2RAIN product (soil moisture to rain) [39], and GSMaP (global satellite mapping of precipitation) [40]. These products contain precipitation data with different spatial and temporal resolutions and have been widely used for regional scale and large-scale climate and surface studies, such as extreme rainfall event detection [41] and long-term precipitation pattern analysis as well as forecasting [42].
Among the satellite-based precipitation products mentioned above, there are two conventional ways to retrieve precipitation, precipitation retrieval methods based on the top–down approach and precipitation retrieval methods based on the bottom–up approach [43]. The IMERG products are widely used for precipitation products with a top–down approach [44], high temporal and spatial resolutions, and near-real-time production. The retrieval algorithm of IMERG estimates precipitation via the inversion of atmospheric signals and hydrometeors. The IMERG products contain three datasets, IMERG-Early (IMERG early run), IMERG-Late (IMERG late run), and IMERG-Final (IMERG final run). IMERG-Early is retrieved only from satellite observations and is not corrected by gauge station records. IMERG-Final is retrieved from satellite observations and is subsequently corrected by gauge station observation records. SM2RAIN is a typical precipitation product based on the bottom–up approach [45], with a unique soil-moisture-based precipitation retrieval algorithm. Specifically, the ASCAT (Advanced SCAT terometer) soil moisture observation data from three MetOp (Meteorological Operational) satellites are used as the inputs during precipitation retrieval from soil moisture. The close relationship between the precipitation and soil moisture is able to achieve the goal of precipitation retrieval from soil moisture. It can be seen that the precipitation products based on the top–down approach and bottom–up approach with retrieval from different theories and algorithms contain unique advantages. Moreover, the performances of these two types of precipitation products can be different depending on time and space. Thus, fusing the satellite precipitation products based on the top–down approach and bottom–up approach may combine their advantages and thus acquire more stable precipitation data with a better quality.
Recently, many studies have focused on the data fusing task. Different methods and algorithms have been proposed and utilized for data fusion, as well as assessment and evaluation [46]. Among them, there are two conventional methods: error-estimation-based static methods and machine-learning-based analysis methods. The triple collocation (TC) method is an error-estimation-based static method. Yumnam et al. [47] used a Bayesian model to fuse the TRMM, PERSIANNCDR, and CMORPH products for India’s Vamsadhara river basin from 2001 to 2013. Dong et al. [48] utilized a least-squares-based fusion model to fuse the PERSIANN-CDR, SM2RAIN, and ERA-Interim products for a data-poor area in South America. Tang et al. [49] assessed satellite-based snow products based on the TC method. Wu et al. [50] used the TC method to assess IMERG for the Tibetan Plateau. Chen et al. [51] estimated precipitation products for the Yangtze River basin via the TC method. Compared with machine learning methods, error-estimation-based static methods have the advantage of simple mathematical algorithms and models [52,53]. However, since the TC method requires three products with independent variances as inputs, this limits the usage of the TC method in precipitation product fusion tasks based on the top–down approach and bottom–up approach [54]. The double instrumental variable method is a static-based method from numerical simulation [55]. Compared with the TC method that requires three products with independent variances for data fusing, the double instrumental variable method has the advantage of only using two products with independent variances for error estimation and thus can be promising in precipitation fusion tasks [56]. Moreover, in the original double instrumental variable method the instrumental variables are selected based on a constant movement, which can be further improved.
Furthermore, regions with complex terrains are often under rich climate events, including unique patterns of precipitation, and have drawn a lot of attention from researchers [57,58,59,60]. The Chuanyu region is a typical area with a complex terrain and rainfall, which contains Sichuan Province and Chongqing City in southwest of China. Many studies have focused on better understanding the climate and its pattern within this region. Lin et al. [61] analyzed the temperature trend of the Chuanyu region, via the used of an atmospheric circulation model. Zhong et al. [62] utilized long-term spaceborne observations to analyze the trend of the ice and snow in the Chuanyu region. Hu et al. [63] analyzed extreme temperatures and their trend within the Chuanyu region based on ERA-Interim satellite reanalysis data. Yang et al. [64] explored the spatiotemporal pattern of surface vegetation cover in the Chuanyu region based on historical surface cover data and remote-sensing-derived land-use data. In our case, providing precipitation products with a higher quality for this region can help researchers to better understand the precipitation of the Chuanyu region and provide key information for related climate research.
Aiming to produce high-quality precipitation data for complex terrains, this study proposed a novel improved double instrumental variable (IMDIV)-based precipitation fusion method. The proposed method is able to merge IMERG, which is based on a top–down approach, and SM2RAIN, which is based on a bottom–up approach, and generate new precipitation products with an enhanced quality for data for the Chuanyu region from 2007 to 2019. The study area and time period are set for a better understanding of the rainfall of a typical complex terrain and to provide high-quality precipitation data for regional climate studies. Firstly, IMERG-Early and SM2RAIN are fused based on the IMDIV method, and the fused product IMDIV-EAS is obtained. In the meantime, IMERG-Final and SM2RAIN are fused based on the IMDIV method, and the fused product IMDIV-FIS is obtained. The performances of the proposed IMDIV method and original DIV method and the original and fused products are evaluated using gauge station records. Specifically, since the original IMERG-Early and SM2RAIN in the Chuanyu region have not been ground-corrected using gauge station records, the good performance of the fused IMDIV-EAS product proves the advantage of the IMDIV-based precipitation fusion method for the condition of having no gauge station records. Moreover, the IMDIV-FIS product also shows a better performance compared with the original input of IMERG-Final and SM2RAIN, which can be useful for water resource and climate studies.
In summary, the main objectives and innovations of this study are as follows: (1) to propose a novel precipitation fusion approach for producing satellite-based precipitation products with a better data quality. The proposed improved double instrumental variable (IMDIV) method is compared to the original double instrumental variable (DIV) method on fused product quality via gauge station records; (2) to explore satellite precipitation product fusion tasks based on the top–down approach and bottom–up approach based on the proposed IMDIV method. In detail, IMERG-Early and SM2RAIN are fused into IMDIV-EAS, which explores the condition of precipitation product fusion tasks without gauge station correction. IMERG-Final and SM2RAIN are fused into IMDIV-FIS, which explores the precipitation fusion performance for the gauge-station-corrected condition; (3) to produce the novel fused satellite precipitation products IMDIV-EAS and IMDIV-FIS for data from the Chuanyu region from 2007 to 2019, which are based on the top–down approach and bottom–up approach and are of a high quality and ready for public use.
The rest of this paper is organized as follows: Section 2 introduces the study area and data and describes the methodology; Section 3 reports the results; Section 4 is the discussion; and the last section is the conclusions.

2. Materials and Methods

2.1. Study Area

The study area is the Chuanyu region located in the southwest part of China, as shown in Figure 1. The Chuanyu region includes Sichuan Province and Chongqing City and covers an area of 570 thousand square kilometers, from 97.15° E to 110.45° E and 25.75° N to 34.35° N. This study area is a typical region containing a complex terrain and climate, with a high altitude difference that ranges from 86 to 6816 m. In detail, this region can be divided into three typical zones, the northwest mountain zone, southwest plateau zone, and eastern basin zone. The northwest mountain zone is under a semihumid climate, with the average temperature ranging from 12 to 20 degrees centigrade and the average precipitation ranging from 900 to 1200 mm per year. The southwest plateau zone has a typical high-altitude cold climate, with the temperature ranging from 4 to 12 degrees centigrade and the precipitation ranging from 500 to 900 mm per year on average. The eastern basin zone belongs to a subtropical humid and oceanic climate, with the average temperature ranging from 16 to 18 degrees centigrade and more precipitation compared with other zones. Specifically, the middle and eastern parts of the Chuanyu region have more rainfall on average.

2.2. Data

2.2.1. IMERG

The IMERG product is a widely used top–down precipitation product, provided by NASA (National Aeronautics and Space Administration) to estimate the globe surface precipitation. The IMERG product provides three datasets with a daily temporal resolution and a 0.1-degree spatial resolution: IMERG-Early, IMERG-Late, and IMERG-Final. IMERG-Early is a near-real-time precipitation product, and the data sources only contain satellite-based information. IMERG-Final is a corrected precipitation product, which has been further corrected via gauge station records. The data from 2007 to 2019 of IMERG-Early and IMERG-Final are collected for this study. In this study, IMERG-Early is used for data fusion and IMERG-Final is used for results comparison.

2.2.2. SM2RAIN

The SM2RAIN product is a typical bottom–up precipitation product, with a daily temporal resolution and a 0.1-degree spatial resolution. The SM2RAIN precipitation information is derived from soil moisture with a water balance model, which is different from the algorithm of IMERG products. Therefore, SM2RAIN has independent variances toward IMERG. The SM2RAIN data used in this study cover the entire study period from 2007 to 2019, with a reliable quality.

2.2.3. Gauge Data

Gauge station records are obtained from the GHCNd (Global Historical Climatology Network Daily) [65]. These gauge station records contain in situ observation of precipitation, which can be used as the ground truth for the precipitation product evaluation in this study. The details of the gauge stations in the Chuanyu region are listed in Figure 1 and Table 1. It can be seen that these stations are located in each part of the Chuanyu region. Moreover, there are huge differences in the elevations for these gauge stations, which can be valuable for precipitation monitoring and climate analysis.

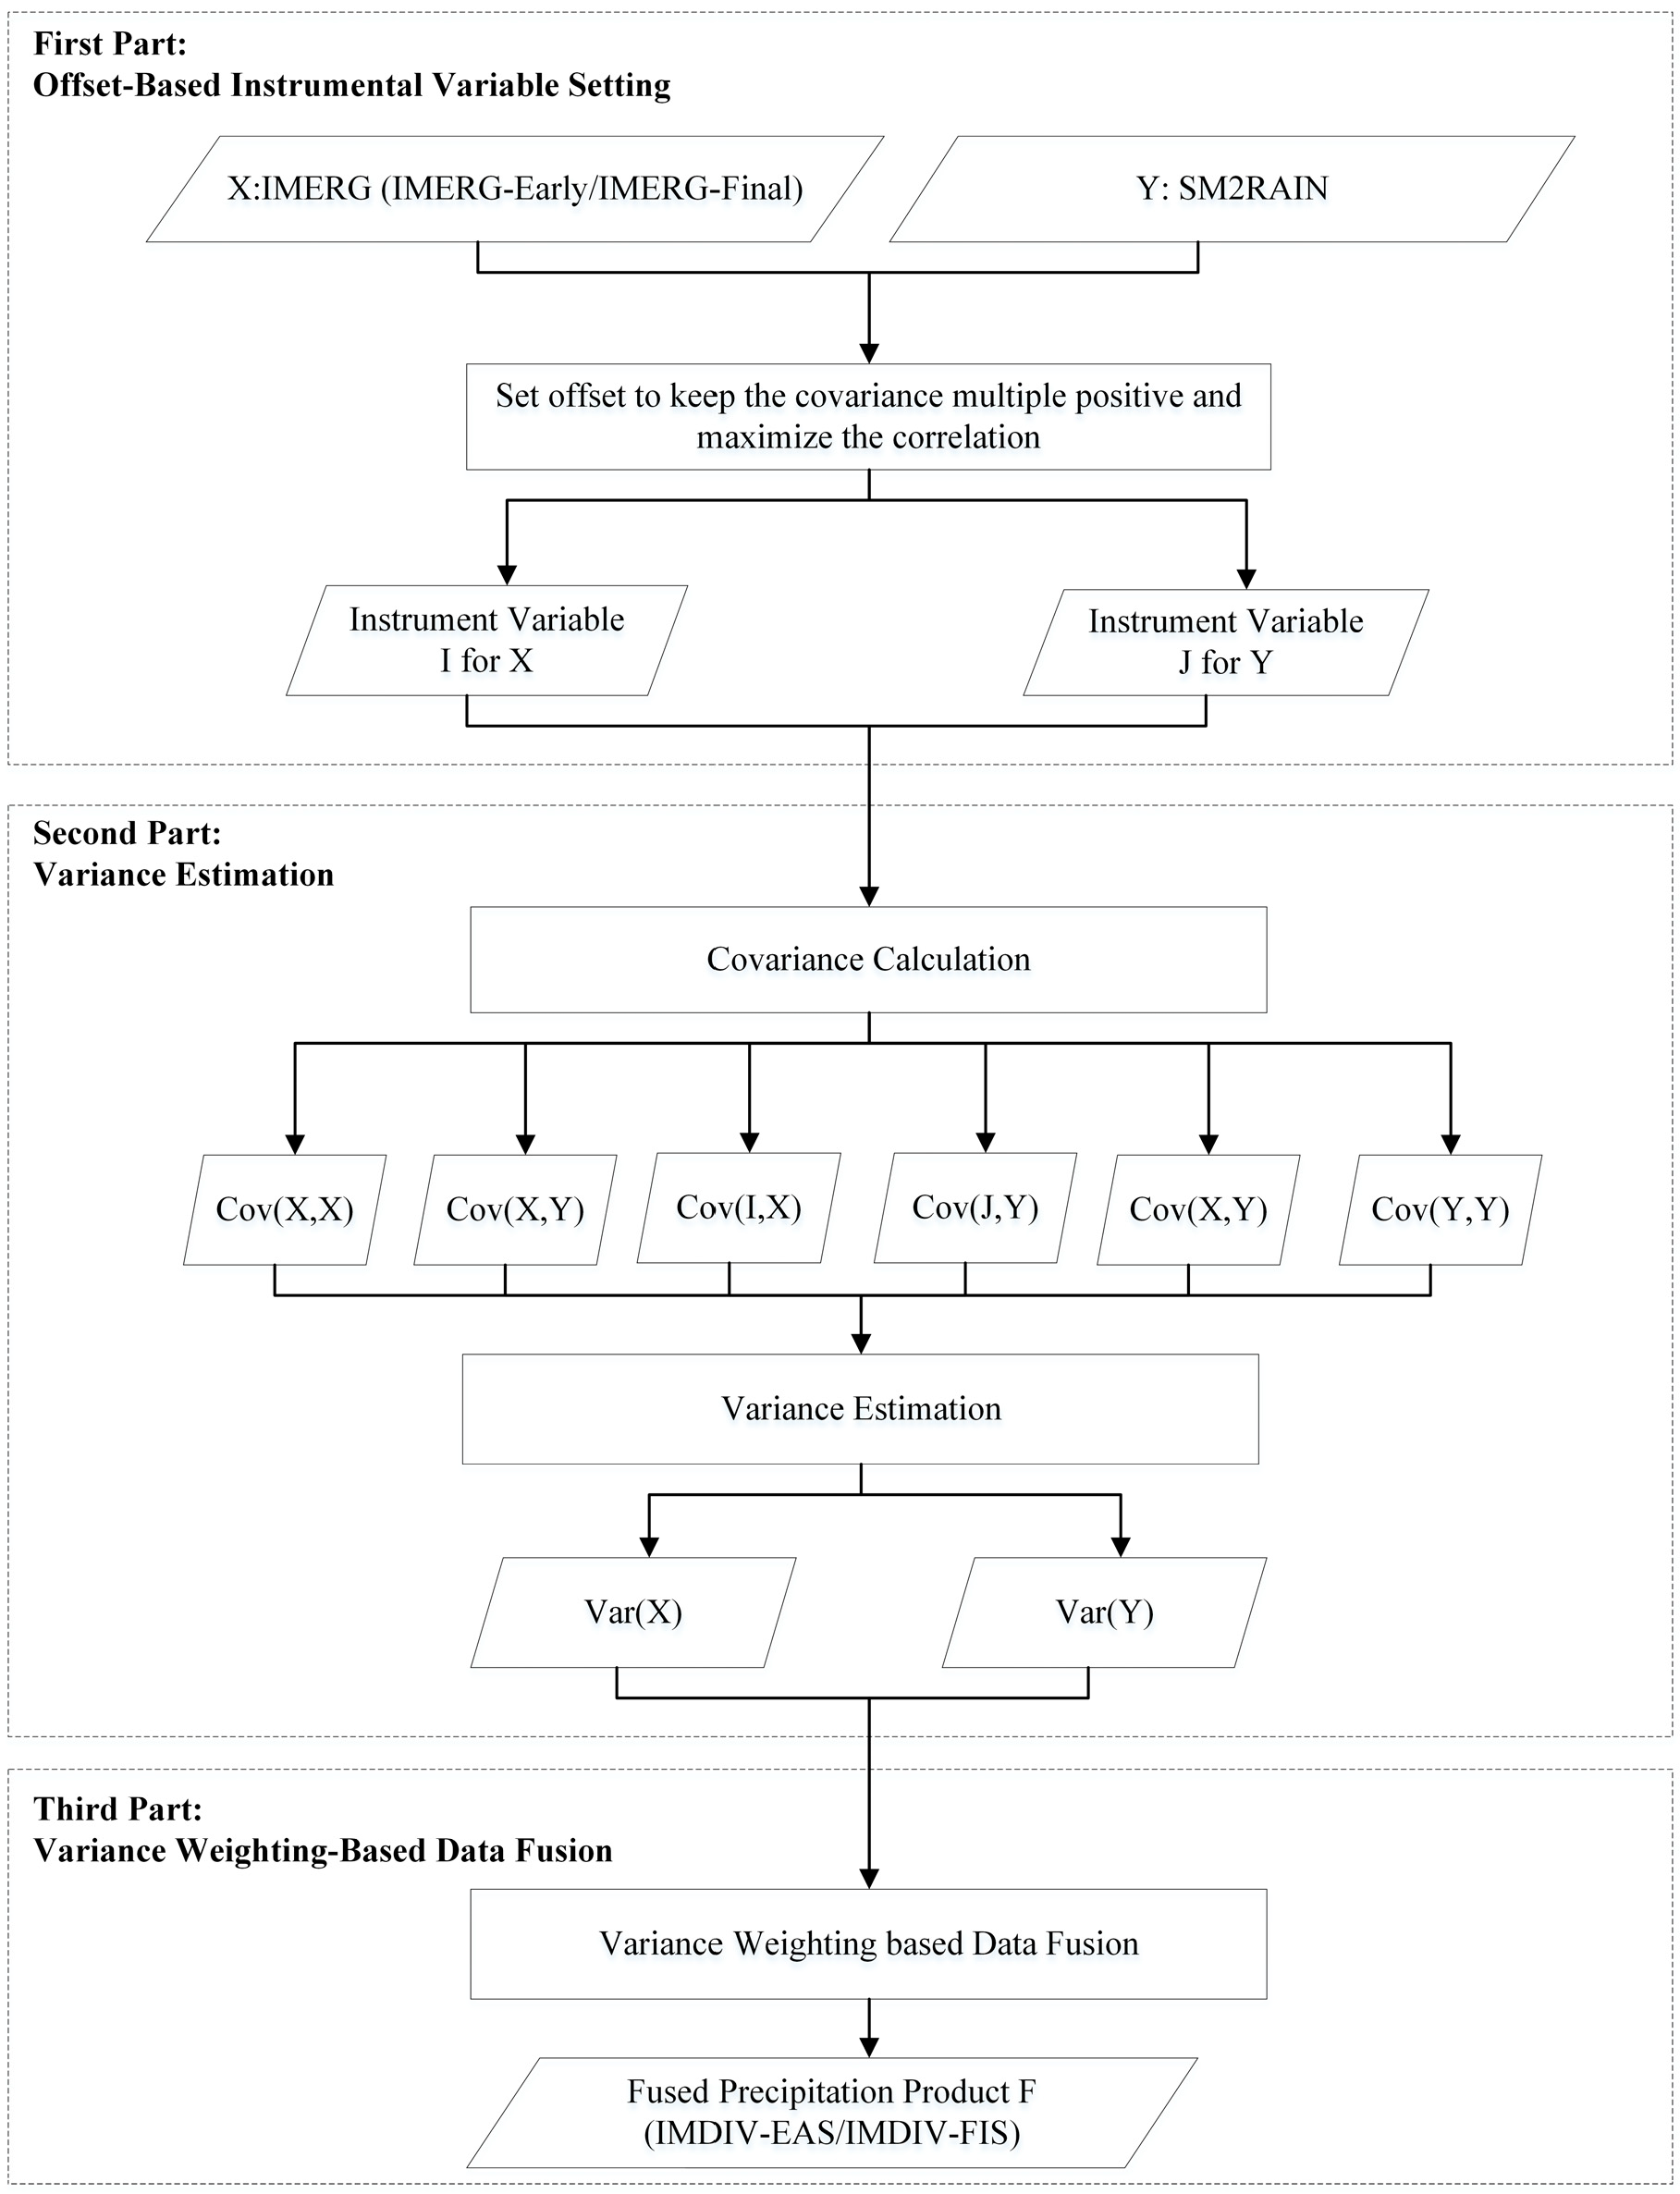
2.3. Improved Double Instrumental Variable for Precipitation Data Fusion

Figure 2 shows the pipeline of the precipitation fusion approach based on the improved double instrumental variable method. The improved double instrumental variable method can be divided into three parts, the offset-based instrumental variable setting, variance estimation, and variance weighting-based data fusion.

2.3.1. Offset-Based Instrumental Variable Setting

In the first part, the instrumental variable is set by the offset. Firstly, the two products X and Y are used as inputs. Here, X and Y are required to be independent from each other. The definitions of X and Y are defined as follows:
X = α x G + B x + ε x
Y = α y G + B y + ε y
where α x and α y represent the scaling factors; G represents the ground truth; ε x and ε y are the random zero-means error; and B x and B y represent the constant bias.
Then, two instrumental variables are initialized for the two input products: instrumental variable I t for input product X and instrumental variable J t for input product Y .
In the original double instrumental variable (DIV) method, two instrumental variables I t and I t are defined as follows:
I t = α x G t + 1 + B x + ε x t + 1
J t = α y G t + 1 + B y + ε y t + 1
where t represents a current time step, t + 1 represents the time step next to the t time step, which is the lag-1 time step; I t represents the instrumental variable, which is a series starting from time step t ; J t represents another instrumental variable, which is a series starting from time step t ; α x and α y represent the scaling factors; G t + 1 is part of the ground truth G starting from the t + 1 time step; ε x t + 1 and ε y t + 1 are the random zero-means error; and B x and B y are the constant bias.
It can be seen that both of the instrumental variables I t and J t are set by the lag-1 time step in the original version of the double instrumental variable method. Since this method does not require the instrumental variable to be temporally continuous with the ground truth, we can further modify the time step selection of the instrumental variable, which makes the lag-1 time step selection the lag-offset time step, and the offset can be dynamically selected using the variance.
Thus, the instrumental variables I t and J t can be further improved as follows:
I t = α x G t + 1 + B x + ε x t + o f f s e t
J t = α y G t + 1 + B y + ε y t + o f f s e
where ε x t + o f f s e t and ε y t + o f f s e t are the zero-means random error series starting from the t + o f f s e t time step. In order to find the best offset during instrumental variable selection, the correlation coefficient of R I x and R J y should be both positive and negative; this can ensure that the trend of the instrumental variable and output product of the double instrumental variable method remains the same. Moreover, the best offset can be selected when the sum of R I x and R J y reaches a maximum value. These conditions will be used in the second part of the improved double instrumental method.

2.3.2. Variance Estimation

In the second part, the variance for the two input products X and Y is estimated as follows:
C x x = α x 2 C g g + σ x 2
C y y = α y 2 C g g + σ y 2
C x y = α x α y C g g
C I x = α x 2 L g g
C J y = α y 2 L g g
where C is the covariance, including C x x for X , C y y for Y , and C g g for G . Moreover, C x y represents the covariance between X and Y . C I x represents the covariance between I and X , while C J y represents the covariance between J and Y . σ x 2 and σ y 2 are the variances of X and Y . L g g is the auto-covariance for G at the lag offset.
The variances σ x 2 and σ y 2 can be calculated based on Equations (7)–(11), as follows:
σ x 2 = C x x C I x C J y C x y
σ y 2 = C y y C J y C I x C x y

2.3.3. Variance Weighting-Based Data Fusion

In the third part, the two input products are fused based on the variance weighting.
Firstly, the fused product F can be defined as follows:
F = m X + n Y + B f
where F is the fused product and m and n are the fusion weights for input products X and Y , respectively. B f is the correction constant. Since B f is a constant and it does not influence the correlation coefficient, the B f can thus be set as zero during the fusion process.
Secondly, the correlation coefficient between the ground truth G and the fused product F is defined as follows:
R g f 2 = C g f 2 C f f × C g g
where C f f is the covariance of the fused product F ; C g g is the covariance of the ground truth G ; and C g f is the covariance between the ground truth G and the fused product F .
The C f f and C g f can be further calculated by Equation (9) as follows:
C f f = m 2 C x x + n 2 C y y + 2 m n C x y
C g f = m C g x + n C g y
The correlation coefficient R g f 2 can be calculated by Equations (10), (11), (15) and (16) as follows:
R g f 2 = m C g x + n C g y 2 C g g × m 2 C x x + n 2 C y y + 2 m n C x y
Then, by combining Equations (7)–(9) into Equation (17), the correlation can be calculated as follows:
R g f 2 = 1 1 + m 2 σ x 2 + n 2 σ y 2 m 2 α x 2 C g g + n 2 α y 2 C g g + 2 m n α x α y C g g
In order to find the maximum of R g f 2 for data fusion, two variables k and φ k are defined as follows:
k = m n
φ k = k 2 σ x 2 + σ y 2 k 2 α x 2 + 2 k α x α y + α y 2
It can be seen that R g f 2 has the maximum value when φ k has the minimum value. Thus, the derivative of φ k is calculated as follows:
φ k = 2 k α x + α y σ x 2 k α y σ y 2 α x k α x + α y 4
φ k has the minimum value when k meets the following condition:
k = σ y 2 α x σ x 2 α y
Thus, the fusion weights m and n can be calculated as follows:
m = C I x C J y σ y 2 σ x 2 + C I x C J y σ y 2
n = σ x 2 σ x 2 + C I x C J y σ y 2
Based on Equations (14), (24) and (25), the fused product F is calculated as follows:
F = C I x C J y σ y 2 σ x 2 + C I x C J y σ y 2 X + σ x 2 σ x 2 + C I x C J y σ y 2 Y

2.4. Experiment Setting and Accuracy Assessment

In this study, we fused both IMERG-Early and IMERG-Final with SM2RAIN, respectively. Specifically, IMERG-Early and SM2RAIN were fused based on the IMDIV method, and the fused product IMDIV-EAS was obtained. In the meantime, IMERG-Final and SM2RAIN were fused based on the IMDIV method, and the fused product IMDIV-FIS was obtained. The same fusion settings based on the original DIV method were also designed. These fusing experiments were set up for the following reasons:
Firstly, the method comparison experiments aim to evaluate the performance of the proposed IMDIV method and compare it to the original DIV method.
Secondly, since IMERG-Early is one of the IMERG products that has not been processed via ground correction, fusing IMERG-Early and SM2RAIN can explore the performance of the IMDIV method on satellite precipitation product enhancement, especially for areas where gauge station records are not available for correcting.
Thirdly, IMERG-Final is the IMERG product with the highest quality. Thus, fusing IMERG-Final, which is based on the top–down approach, and SM2RAIN, which is based on the bottom–up approach, can explore the possibility of satellite precipitation product enhancement.
Three metrics are used for statistical analysis of the proposed method and products. In detail, the correlation coefficient (R), root mean square error (RMSE), and bias are used to evaluate the accuracy of the original and fused precipitation products, including IMERG-Early, IMERG-Final, SM2RAIN, IMDIV-EAS, and IMDIV-FIS. These metrics can describe the consistency of the products to the gauge station records and have been commonly used in data evaluation studies. The definitions of the R, RMSE, and bias are as follows:
R = i = 1 n ( G i G ¯ ) ( S i S ¯ ) i = 1 n ( G i G ¯ ) 2 × i = 1 n ( S i S ¯ ) 2
R M S E = 1 n i = 1 n ( S i G i ) 2
b i a s = 1 n i = 1 n S i G i
where G is the ground truth and S is the corresponding product.

3. Result

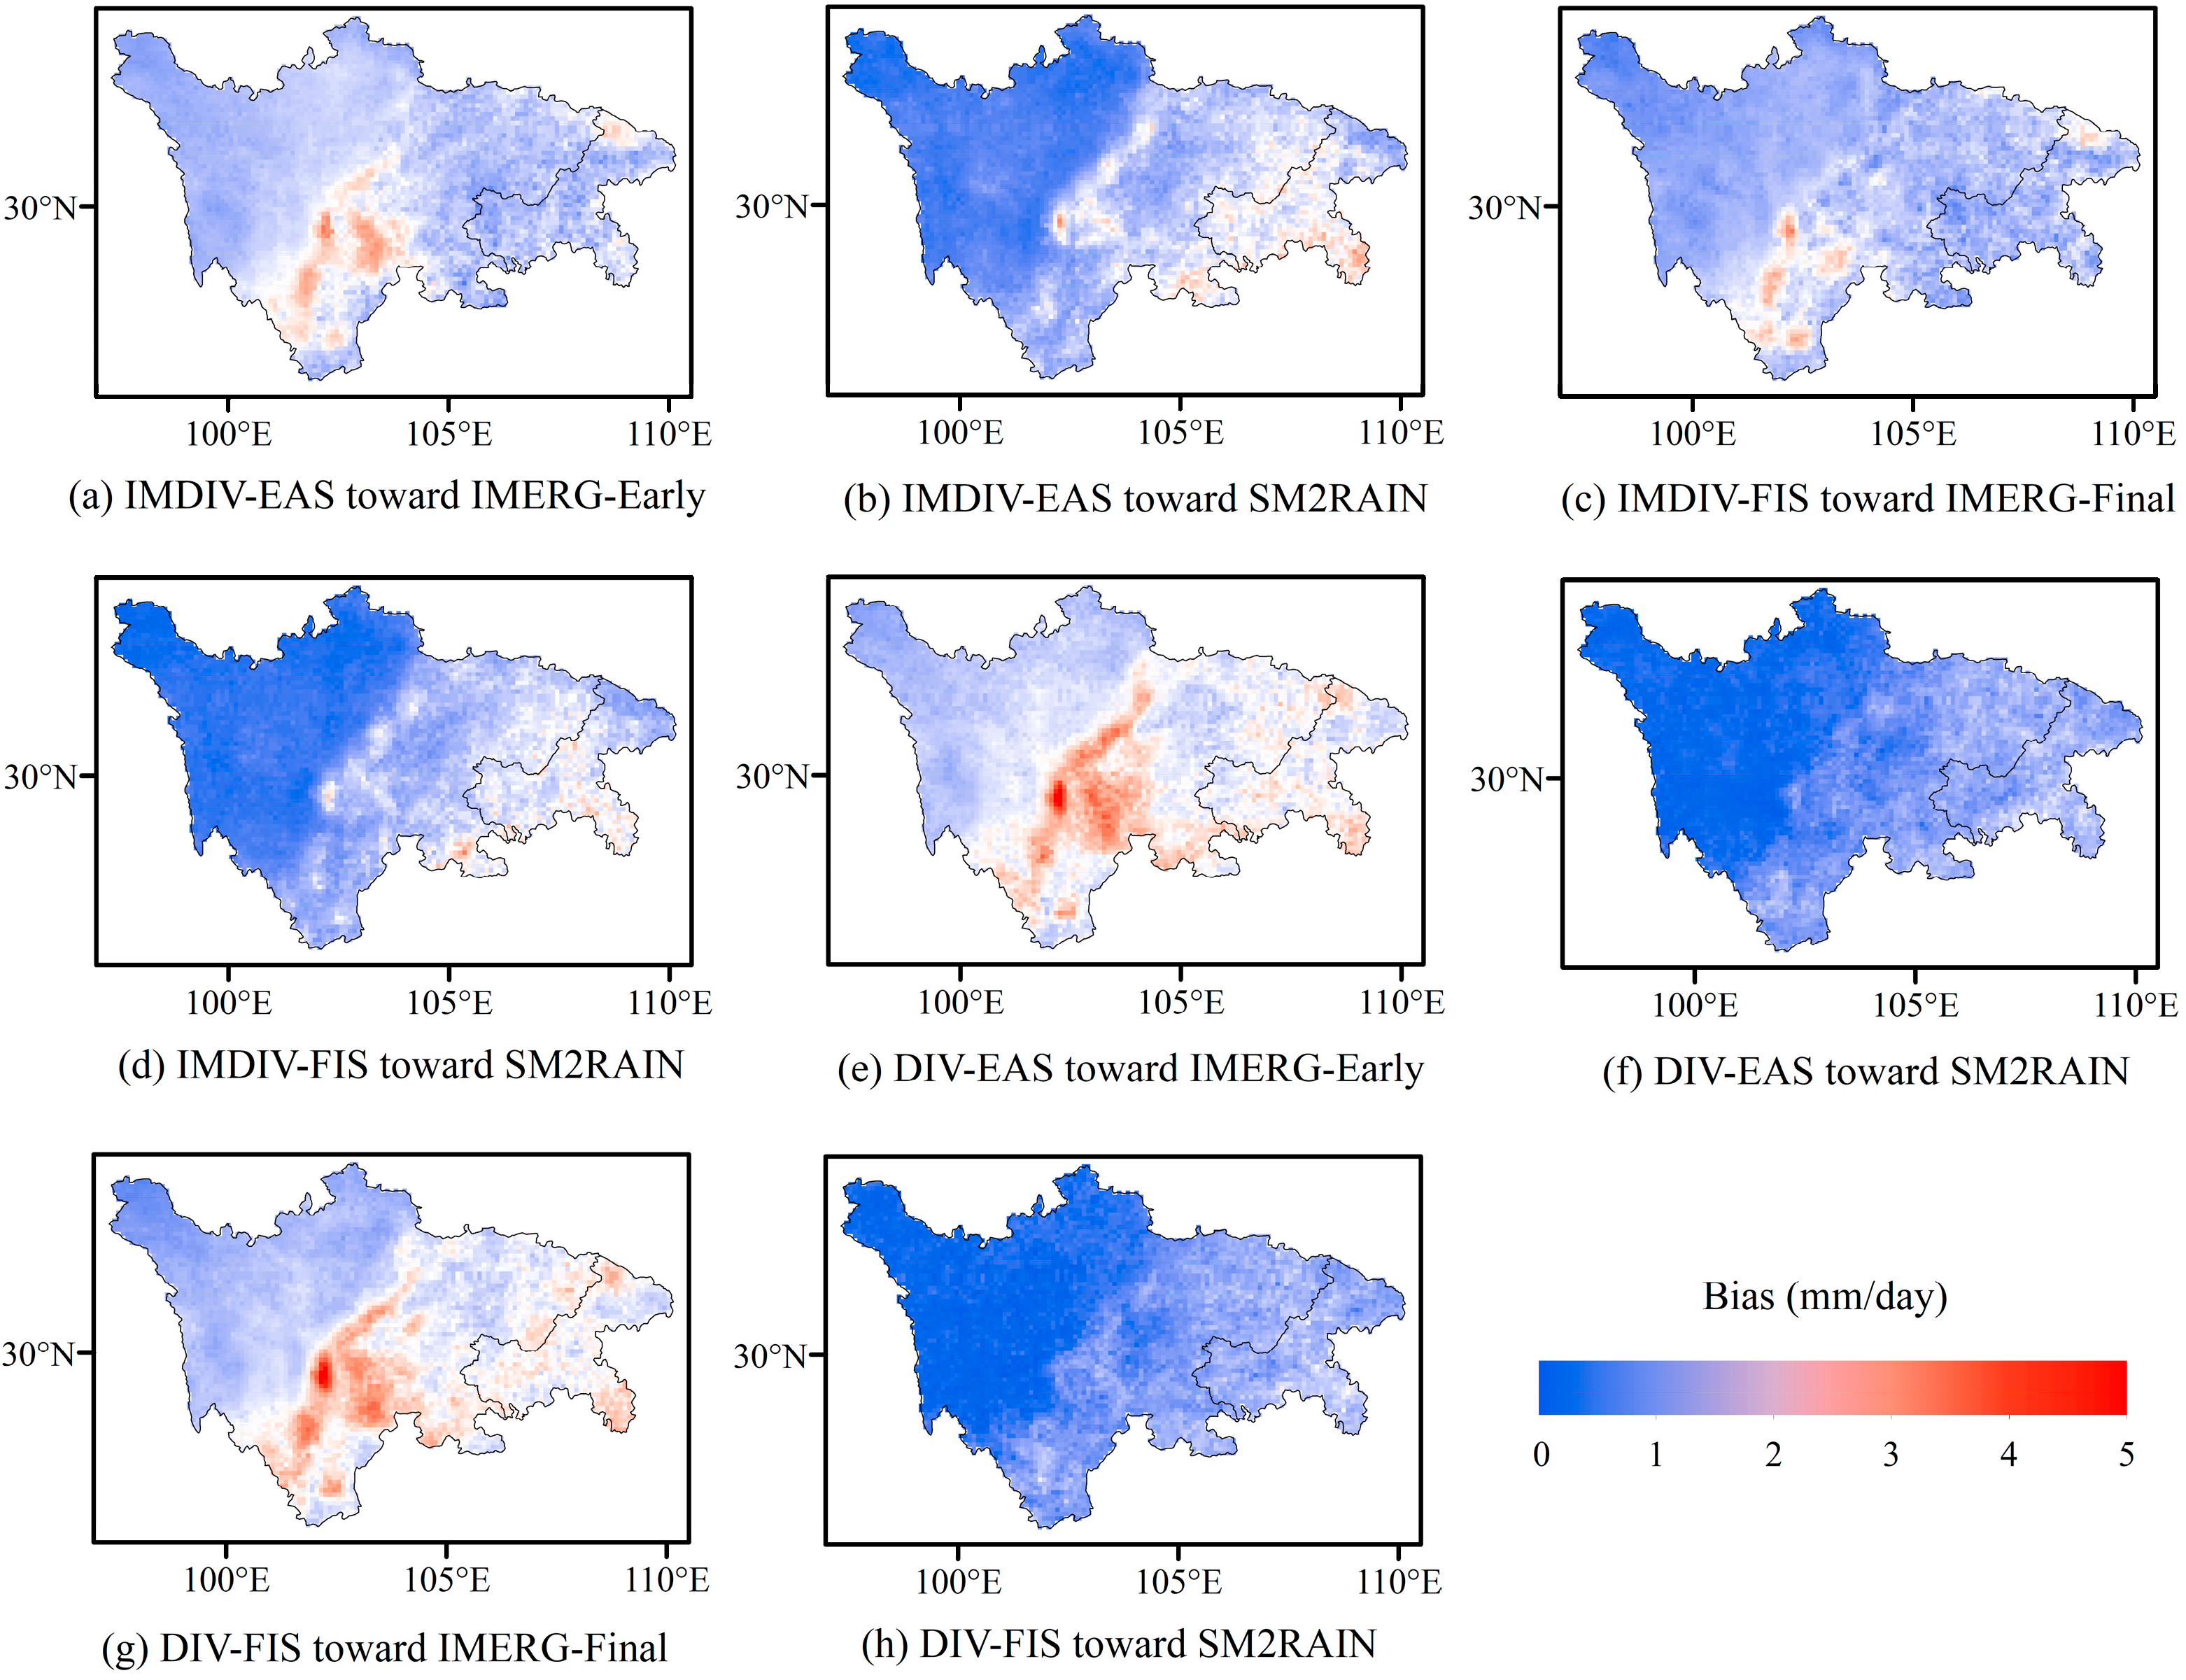
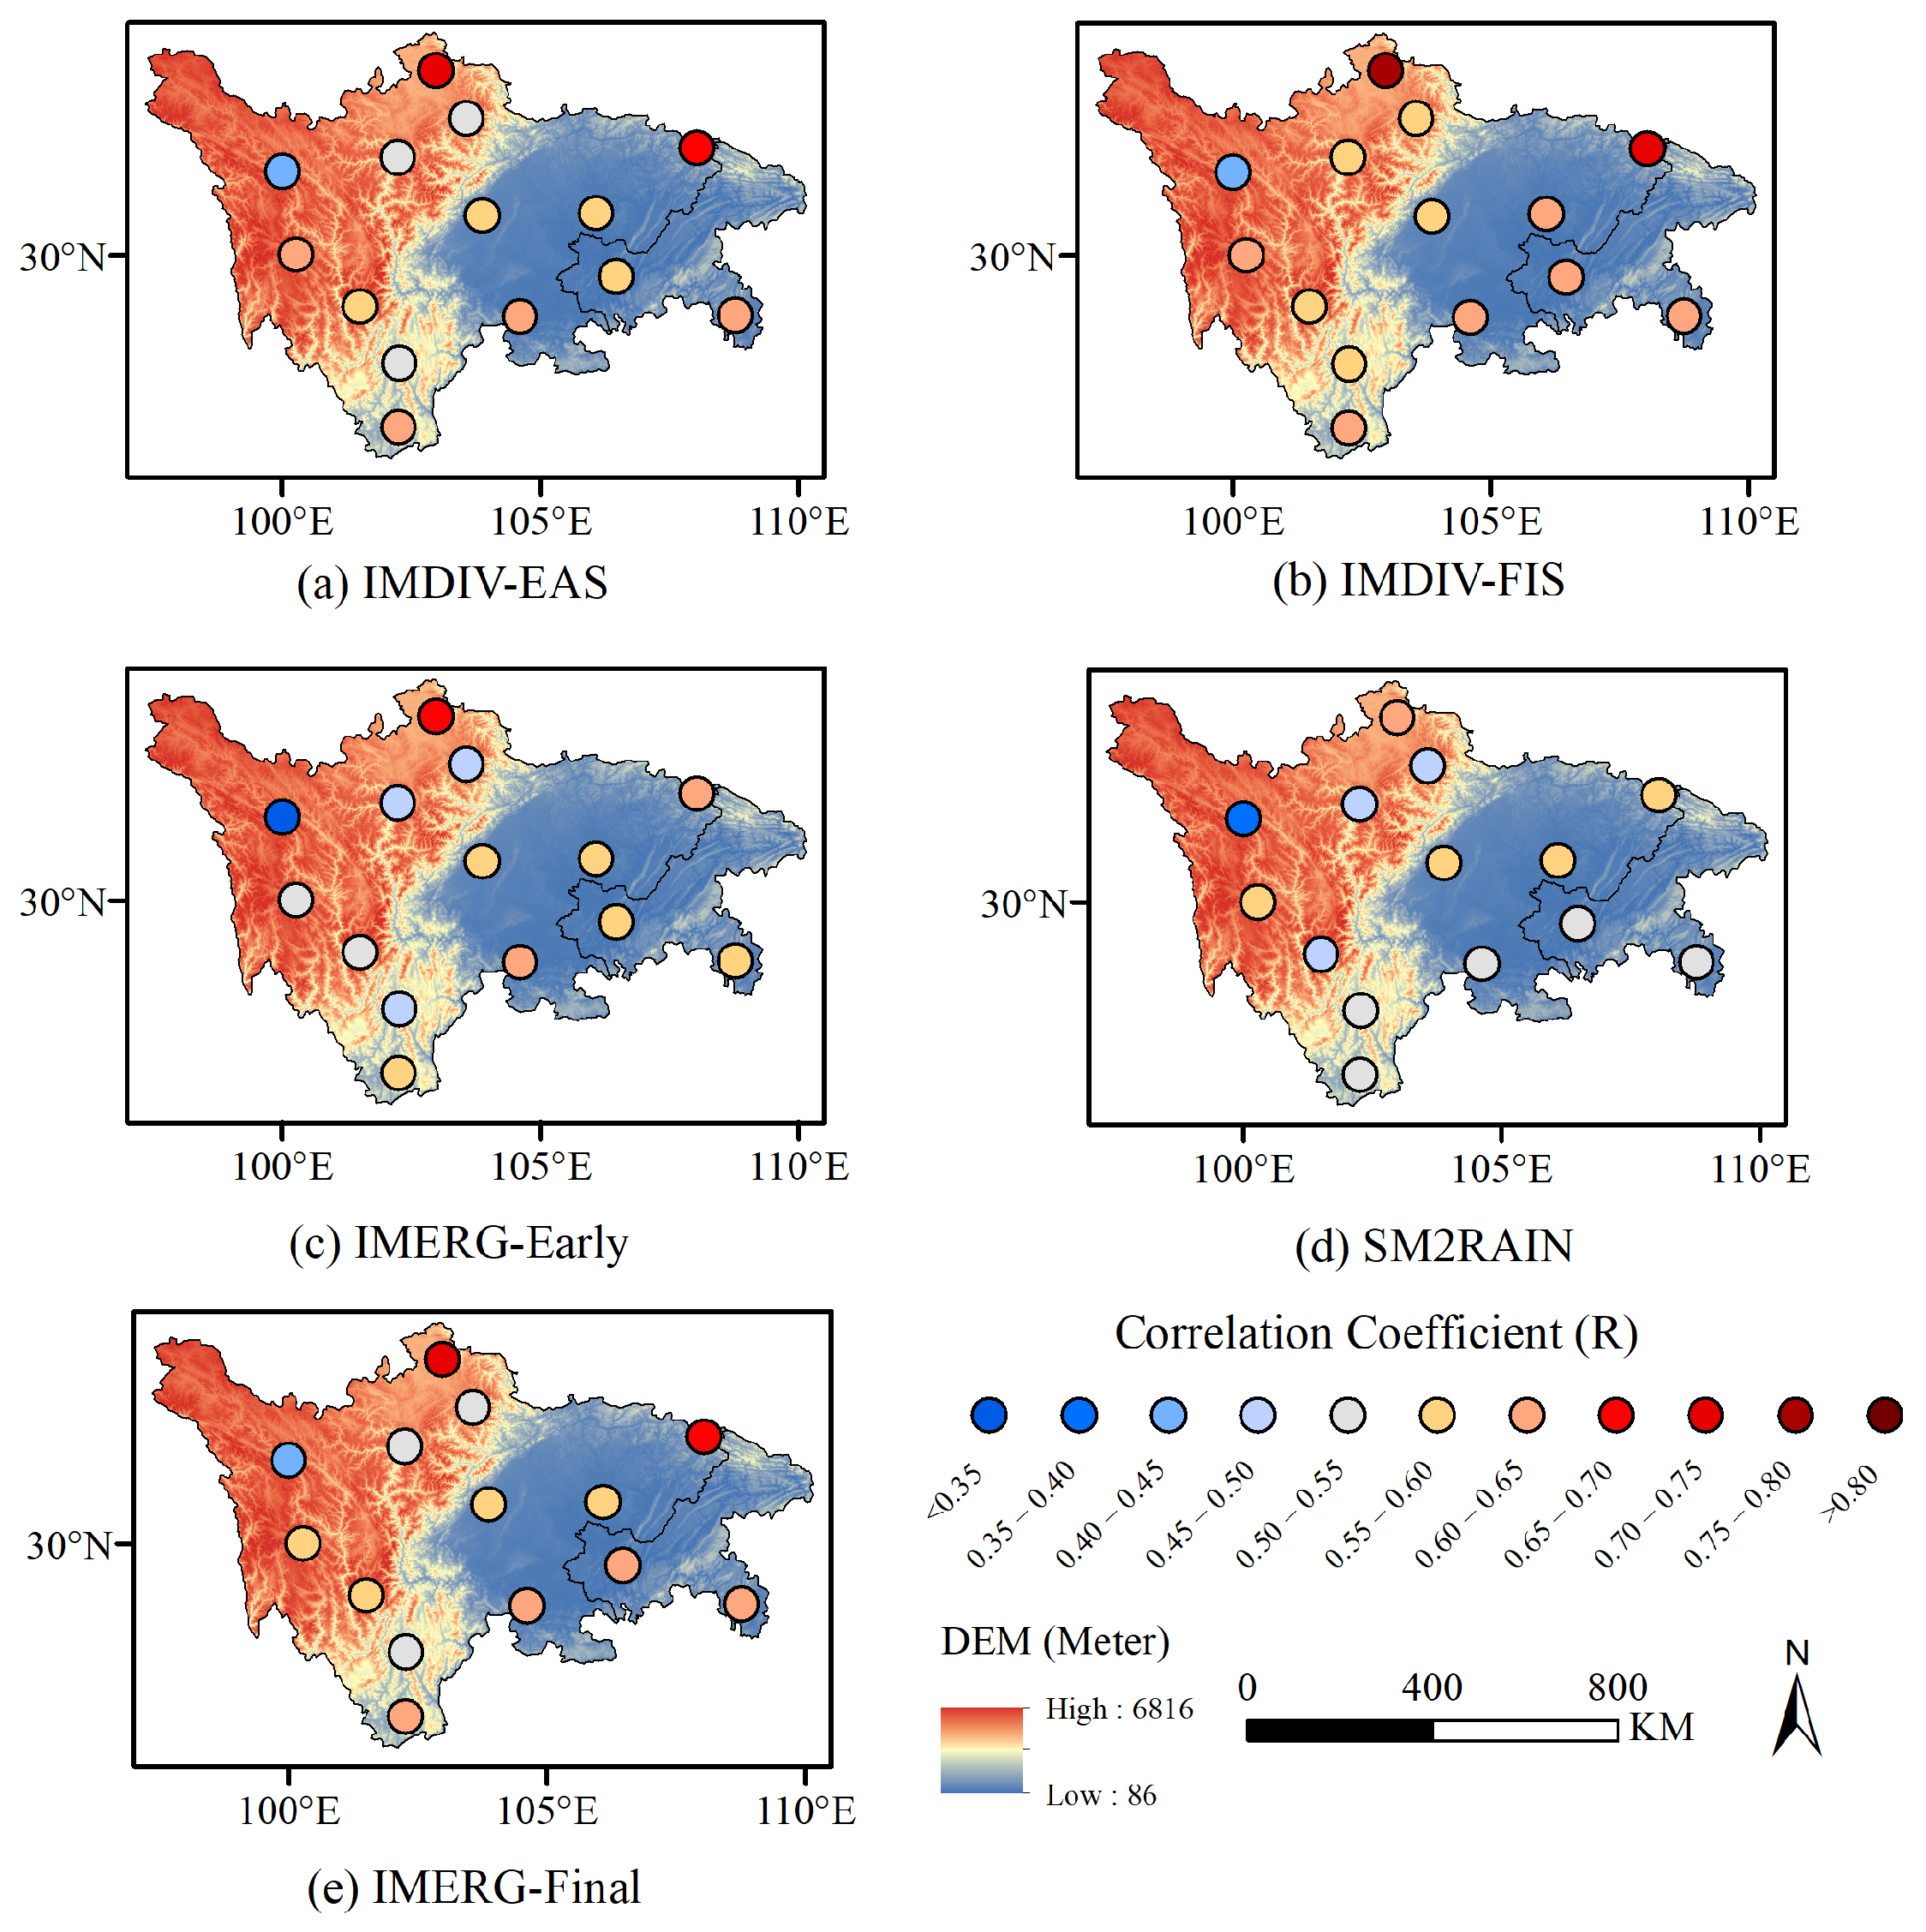
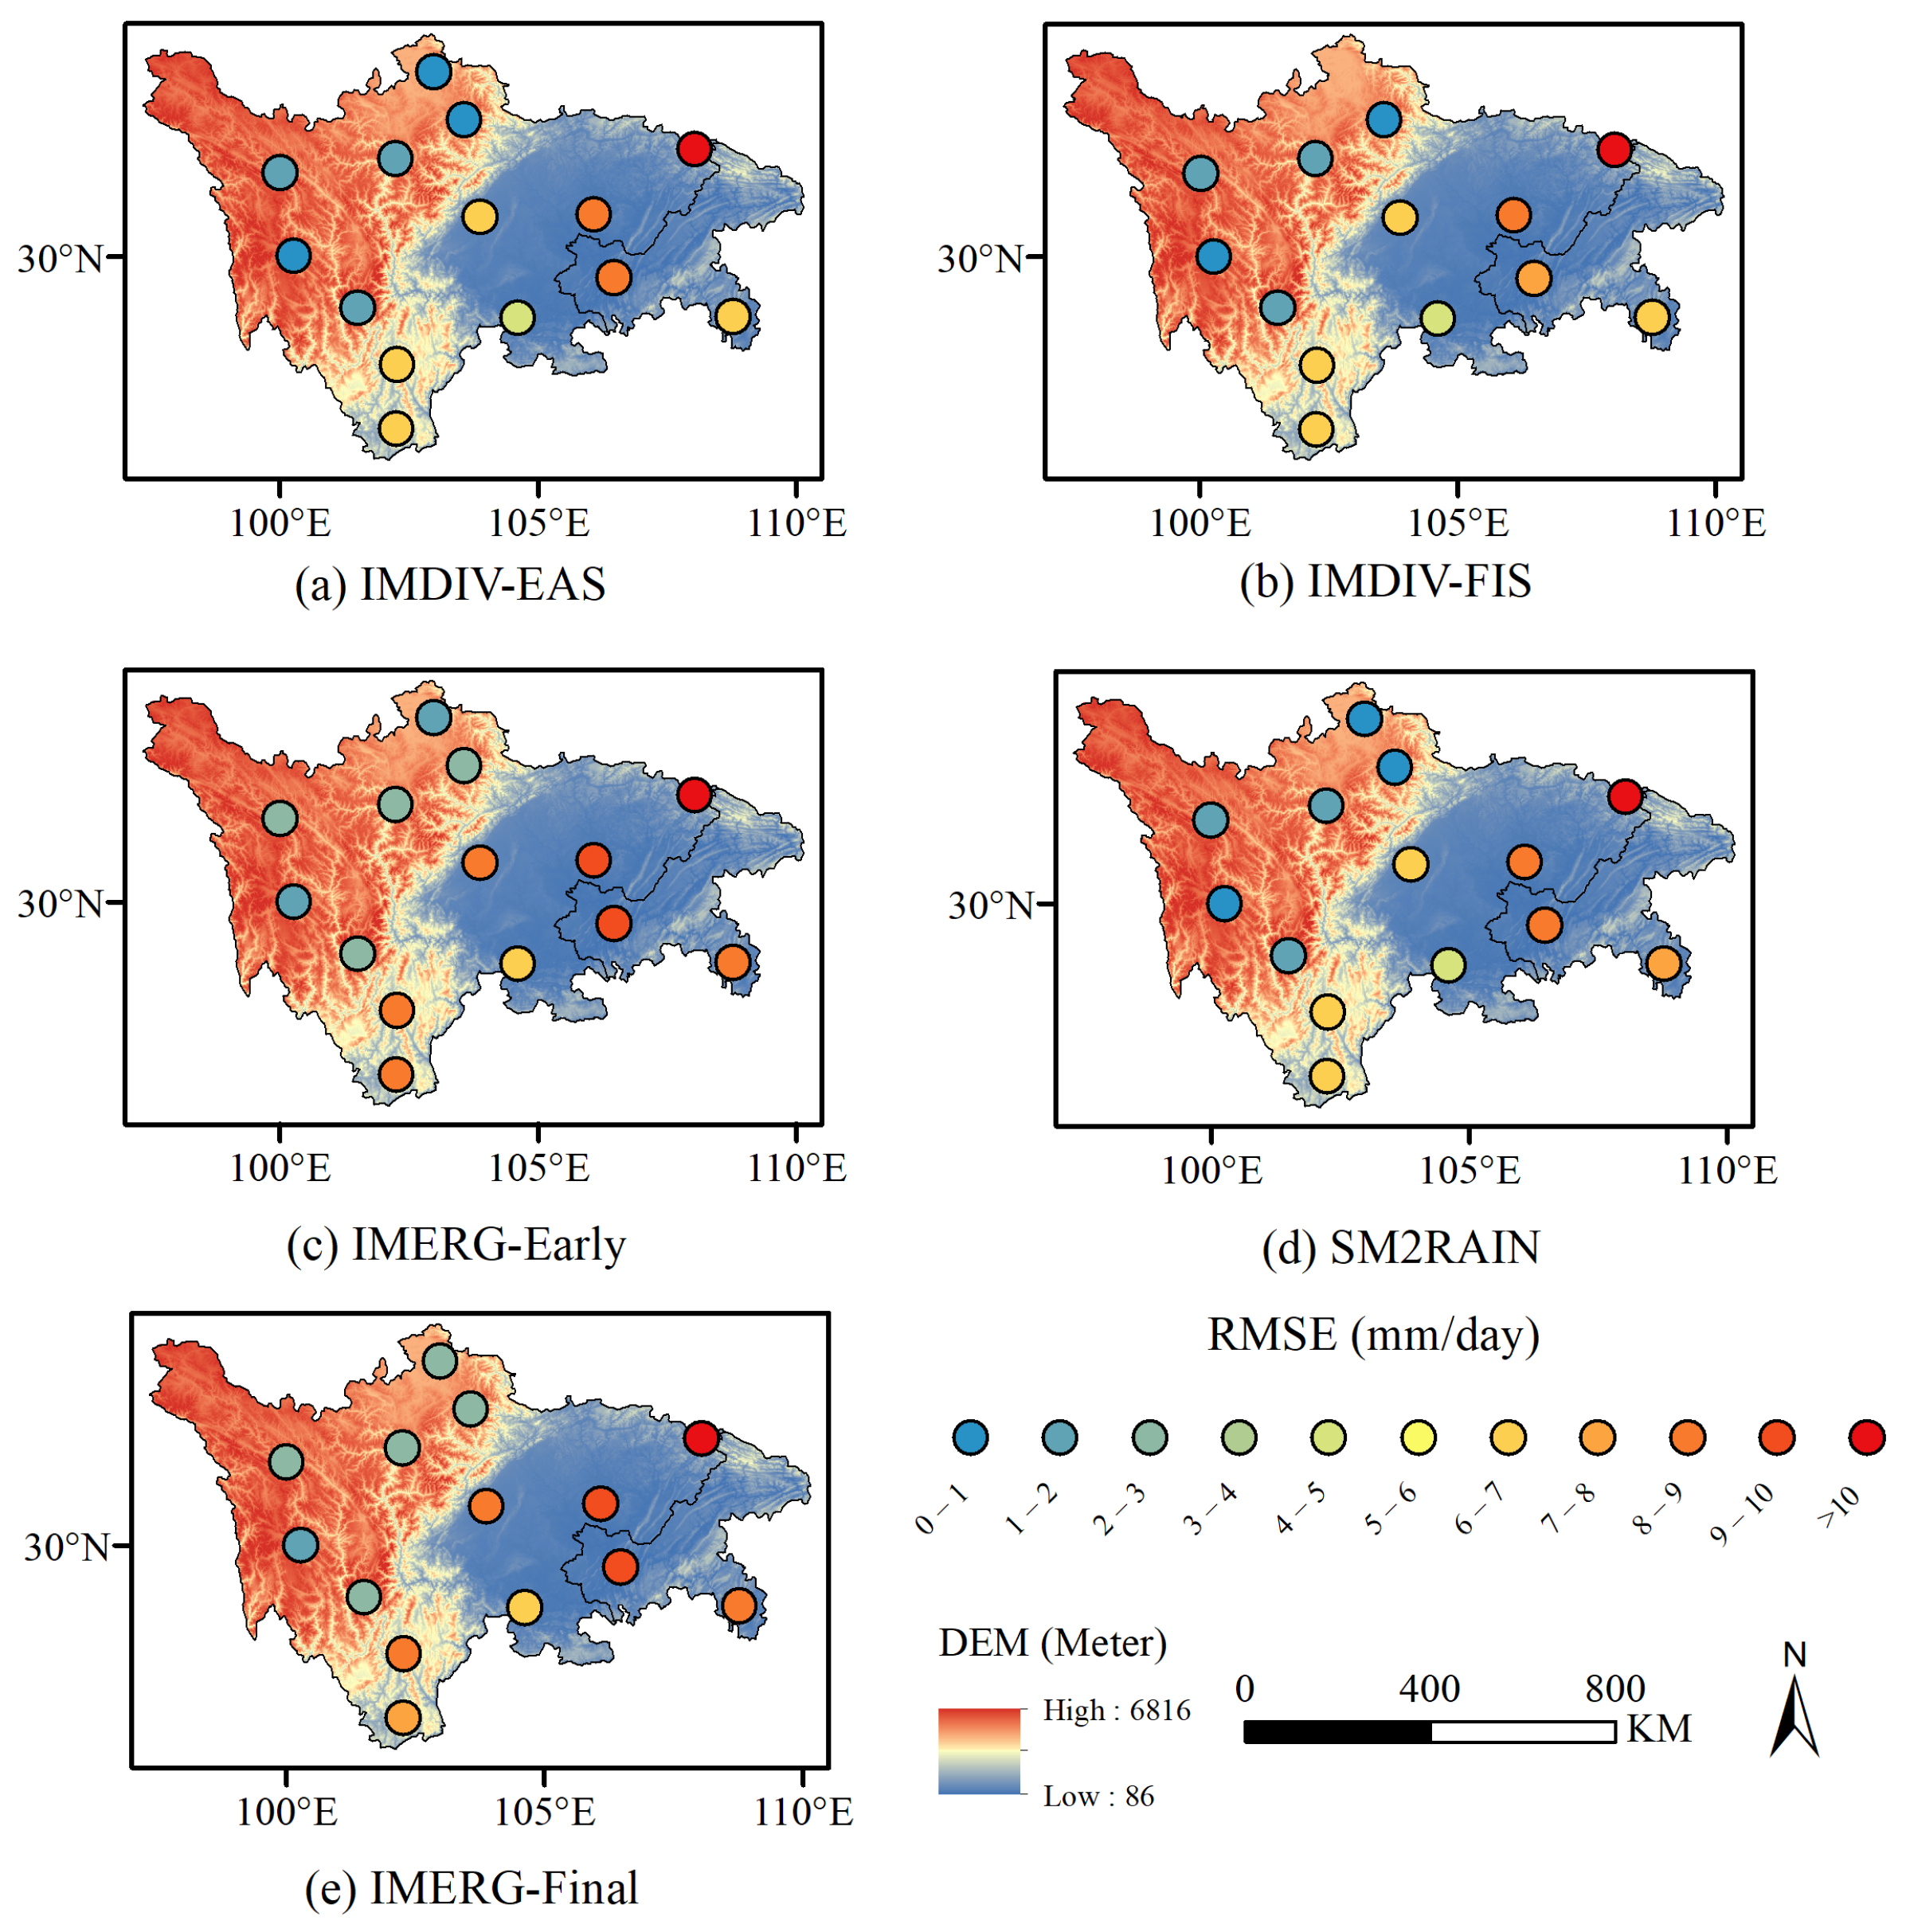
3.1. Overall Performance of the Improved Double Instrumental Variable Method-Based Precipitation Fusion

A comparison between the original and fused precipitation products using the proposed improved double instrumental variable (IMDIV) method and the original double instrumental variable (DIV) method in terms of the correlation coefficient is shown in Figure 3. The correlation coefficient of each product from 2007 to 2019 is evaluated using gauge station records from the GHCNd dataset. Firstly, it can be seen that IMDIV-EAS and IMDIV-FIS reach correlation coefficients of 0.603 and 0.634, respectively, which outperforms those of DIV-EAS and DIV-FIS, which are 0.584 and 0.613. This indicates that the proposed IMDIV method can produce fused products with a higher quality and more consistent in situ measurement, compared with the original DIV method and both EAS (fusing IMERG-Early and SM2RAIN) and FIS (fusing IMERG-Final and SM2RAIN) fusion tasks. Moreover, it can be seen that the two fused products IMDIV-EAS and IMDIV-FIS both outperform the corresponding original products with top–down and bottom–up approaches. In detail, the correlation coefficient of IMDIV-EAS reaches 0.603, which is higher than the correlation coefficient of 0.574 of the IEMRG-Early product based on the top–down approach and the correlation coefficient of 0.542 of the SM2RAIN product based on the bottom–up approach; the correlation coefficient of IMDIV-FIS is 0.634, which outperforms SM2RAIN’s correlation coefficient of 0.542 (bottom–up approach) and IMERG-Final’s correlation coefficient of 0.600 (top–down approach). Also, IMDIV-FIS outperforms IMDIV-EAS on the average correlation coefficient with an increase of 0.031; this increase is higher than the correlation coefficient difference between IMERG-Early and IMERG-Final of 0.026. The correlation coefficient of SM2RAIN (bottom–up approach) remains stable in the entire study time period. There was an increasing trend for the correlation coefficient of IMERG-Early and IMERG-Final, which are based on the top–bottom approach, from 2012 to 2014. The proposed fused IMDIV-EAS and IMDIV-FIS show similar correlation coefficient trends to the original products in terms of the study time period, since the proposed fused products use the top–down and bottom–up products as the proposed IMDIV method inputs. Furthermore, even though the correlation coefficients of IMERG-Early and SM2RAIN are lower than that of IMERG-Final from 2014 to 2017, the correlation coefficient of IMDIV-EAS at this time period is higher than that of IMERG-Final. Moreover, it can be seen that IMDIV-EAS outperforms IMERG-Final on some of the years; this shows the unique advantage of the proposed IMDIV method on combing the “top–down” and “bottom–up” approach products. These promising results prove the evident effectiveness of the proposed IMDIV method in fusing the top–down and bottom–up precipitation data and show that it outperforms the original DIV method with better consistency in the in situ measurements.
The scatter plots of the fused and original products’ evaluation in the Chuanyu region from 2007 to 2019 are shown in Figure 4. The proposed IMDIV-method-based IMDIV-EAS product has a high correlation coefficient of 0.603, better RMSE of 5.136, and better bias of 0.514, compared with the DIV-EAS product based on the original DIV method. This indicates that the proposed IMDIV method outperforms the original DIV method on the precipitation fusion tasks based on the “top–down” and “bottom–up” approaches. In the meantime, IMDIV-FIS outperforms the DIV-FIS. These results prove the proposed IMDIV method performs better than the original DIV method on these precipitation data fusion tasks. Moreover, IMDIV-EAS outperforms the original IMERG-Early and SM2RAIN in terms of the correlation coefficient, RMSE, and bias. It can be seen that both the RMSE and bias of IMDIV-EAS are lower than the two corresponding input products. IMDIV-FIS outperforms the original IMERG-Final and SM2RAIN, with a lower RMSE and bias. IMDIV-FIS outperforms IMDIV-EAS, with a better RSME and bias. As shown in Figure 4f, some points of the precipitation have been underestimated by SM2RAIN; this pattern has been proven by related research [66]. However, in the proposed fused products IMDIV-EAS and IMDIV-FIS this underestimation issue has been addressed by the proposed IMDIV method, which combines the advantages of both IMERG-Early/IMERG-Final’s top–down approach and SM2RAIN’s bottom–up approach. Overall, these promising results prove that the proposed IMDIV method can better enhance the precipitation product quality and can be useful for precipitation data production for complex terrains and related studies.

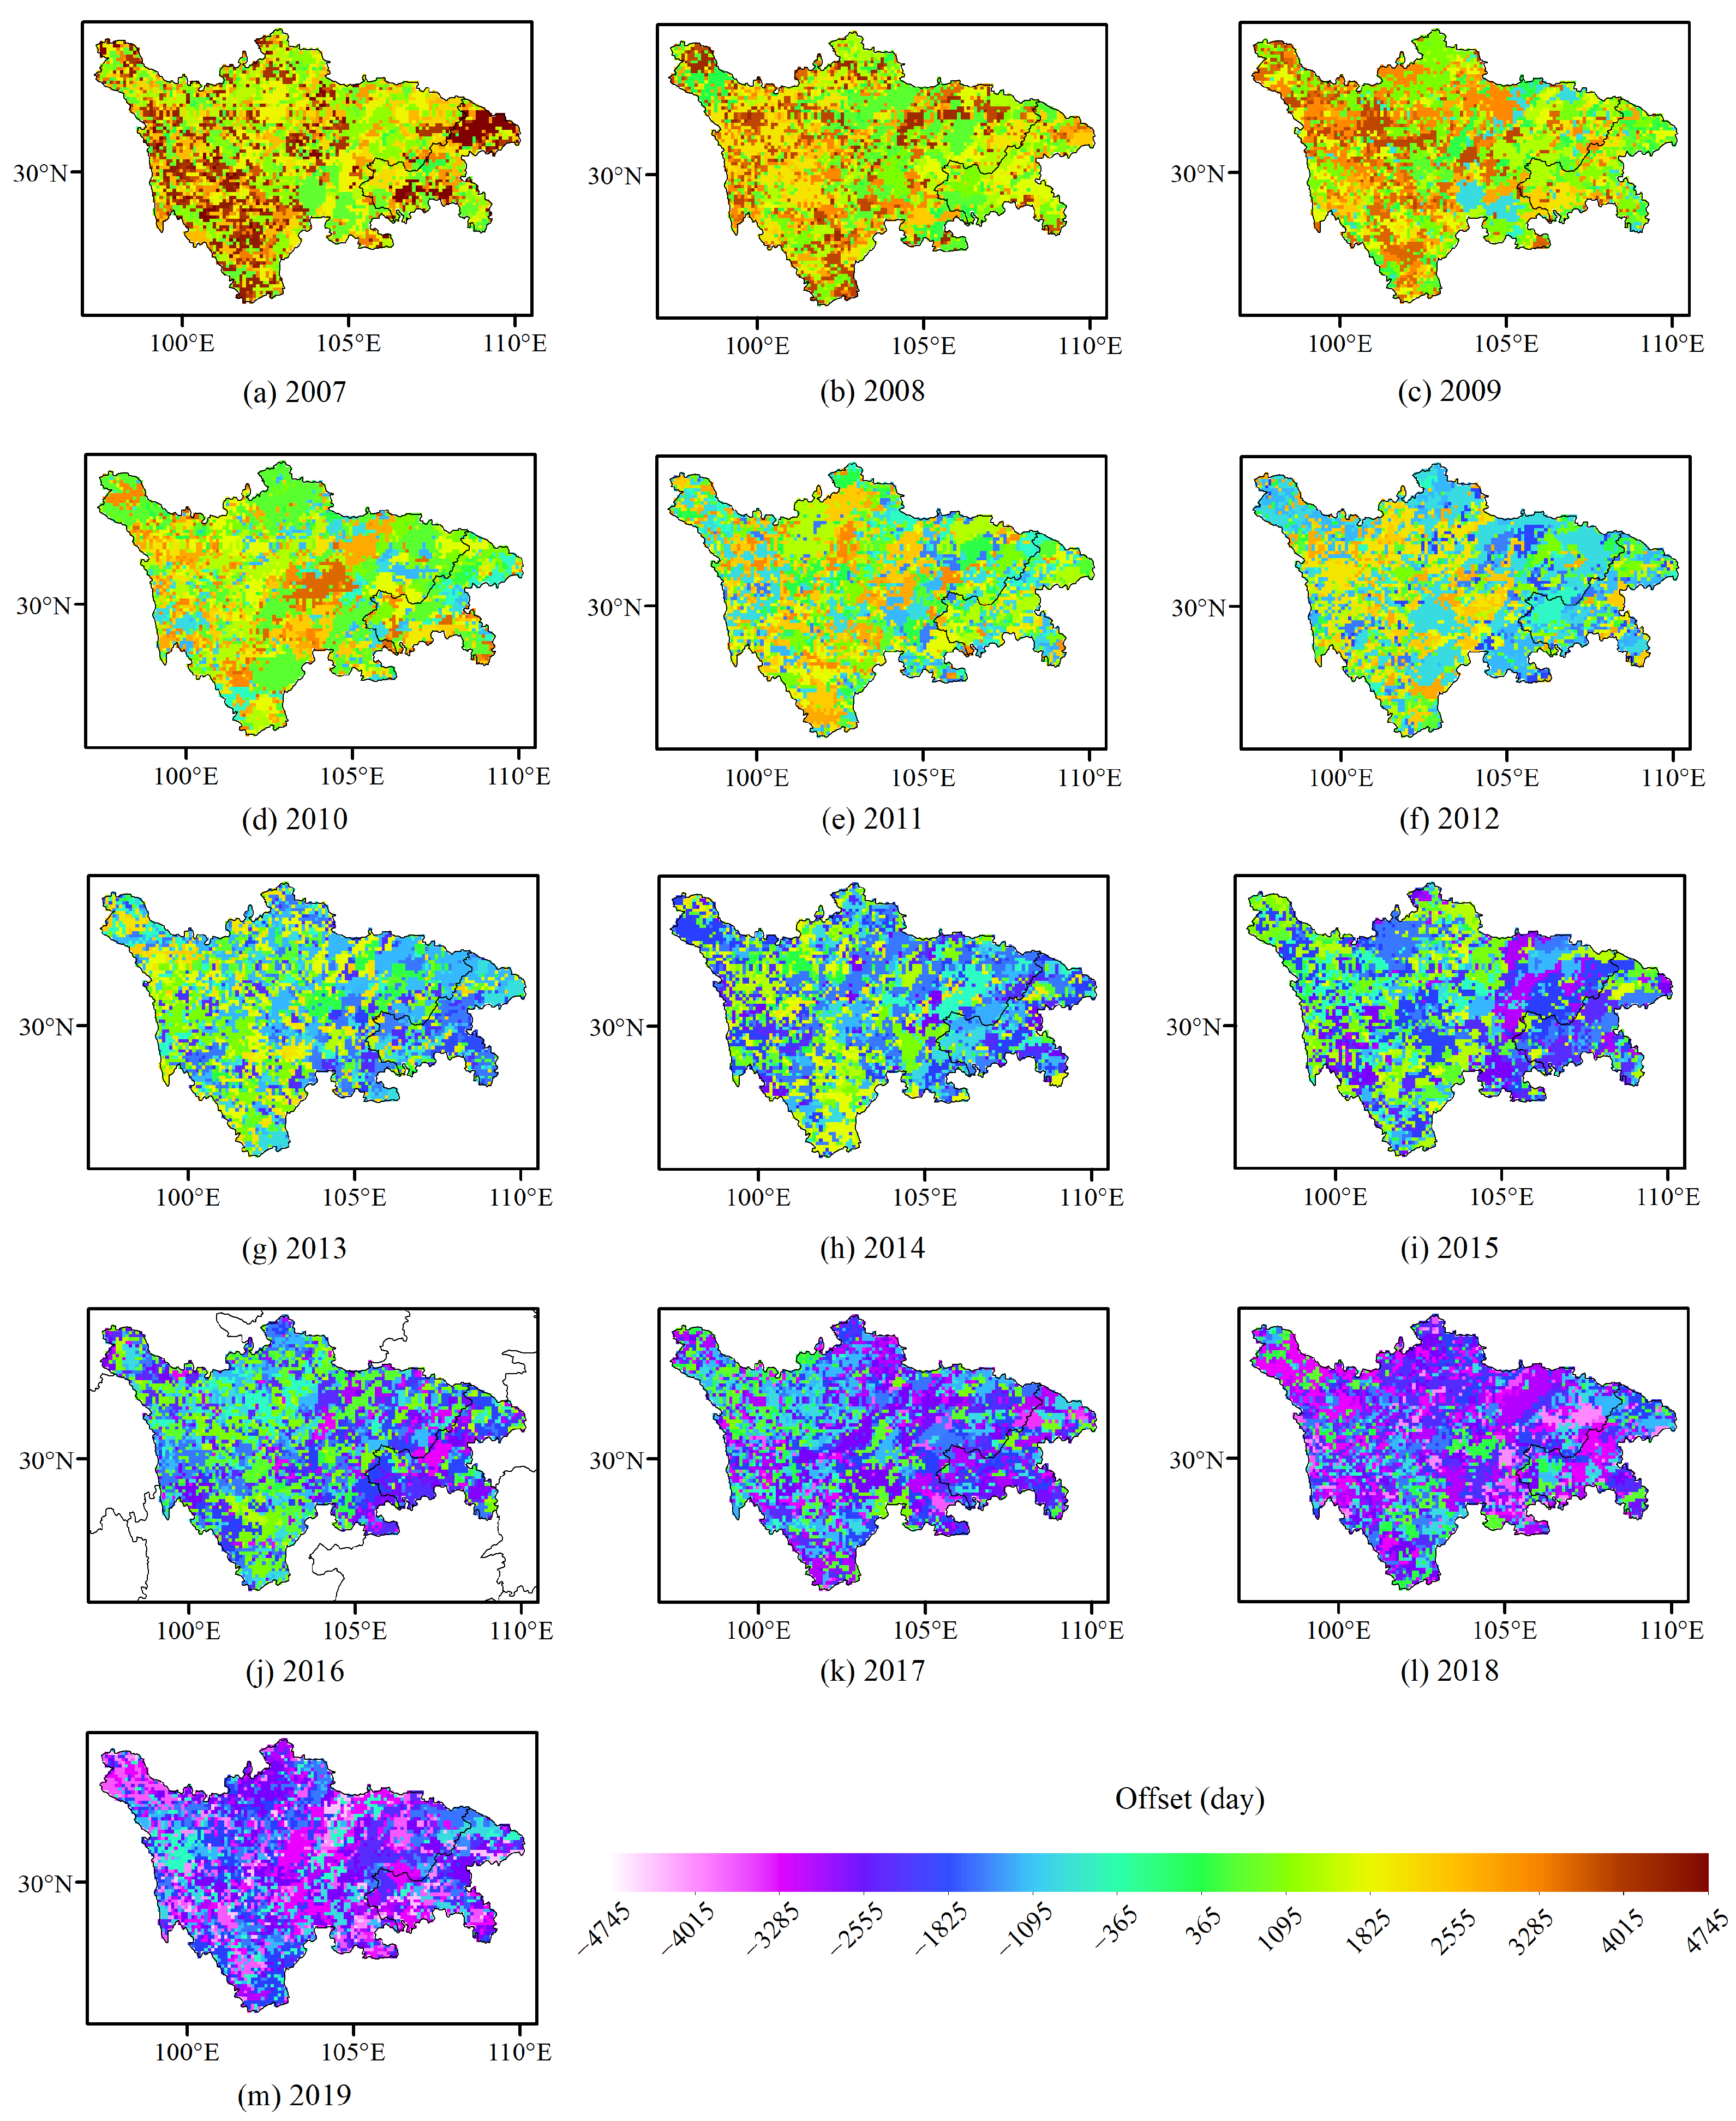
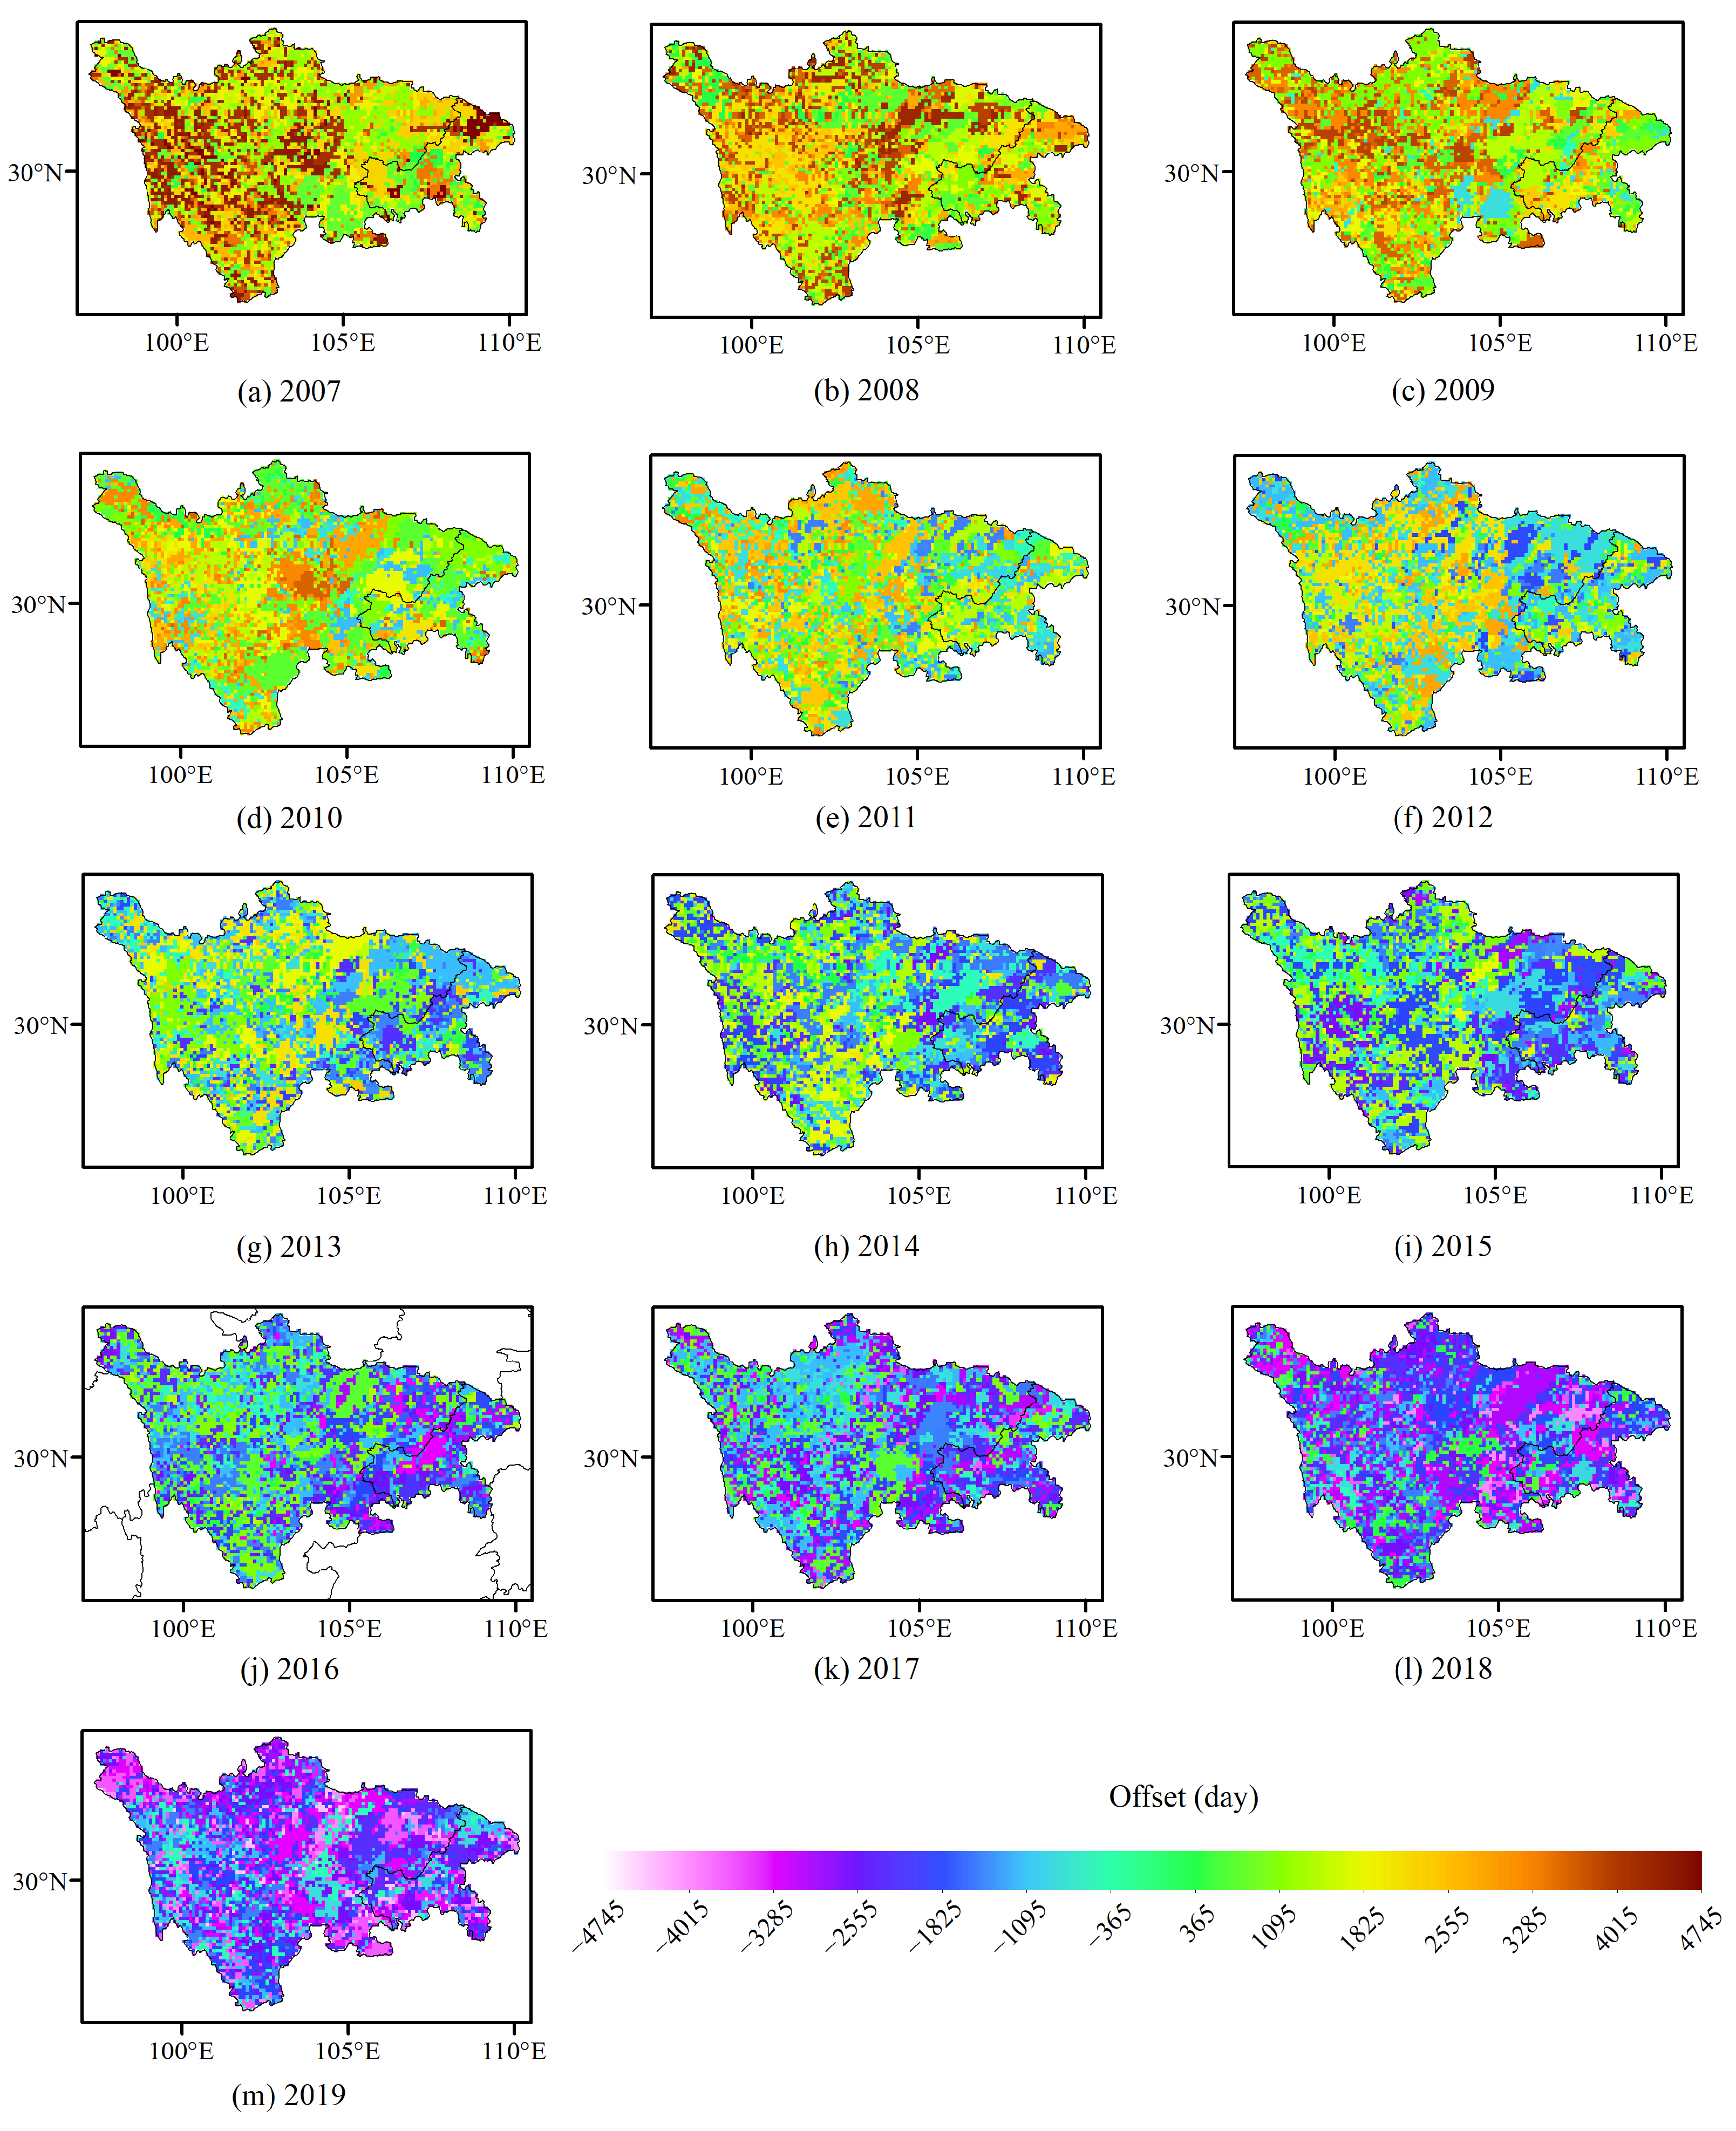
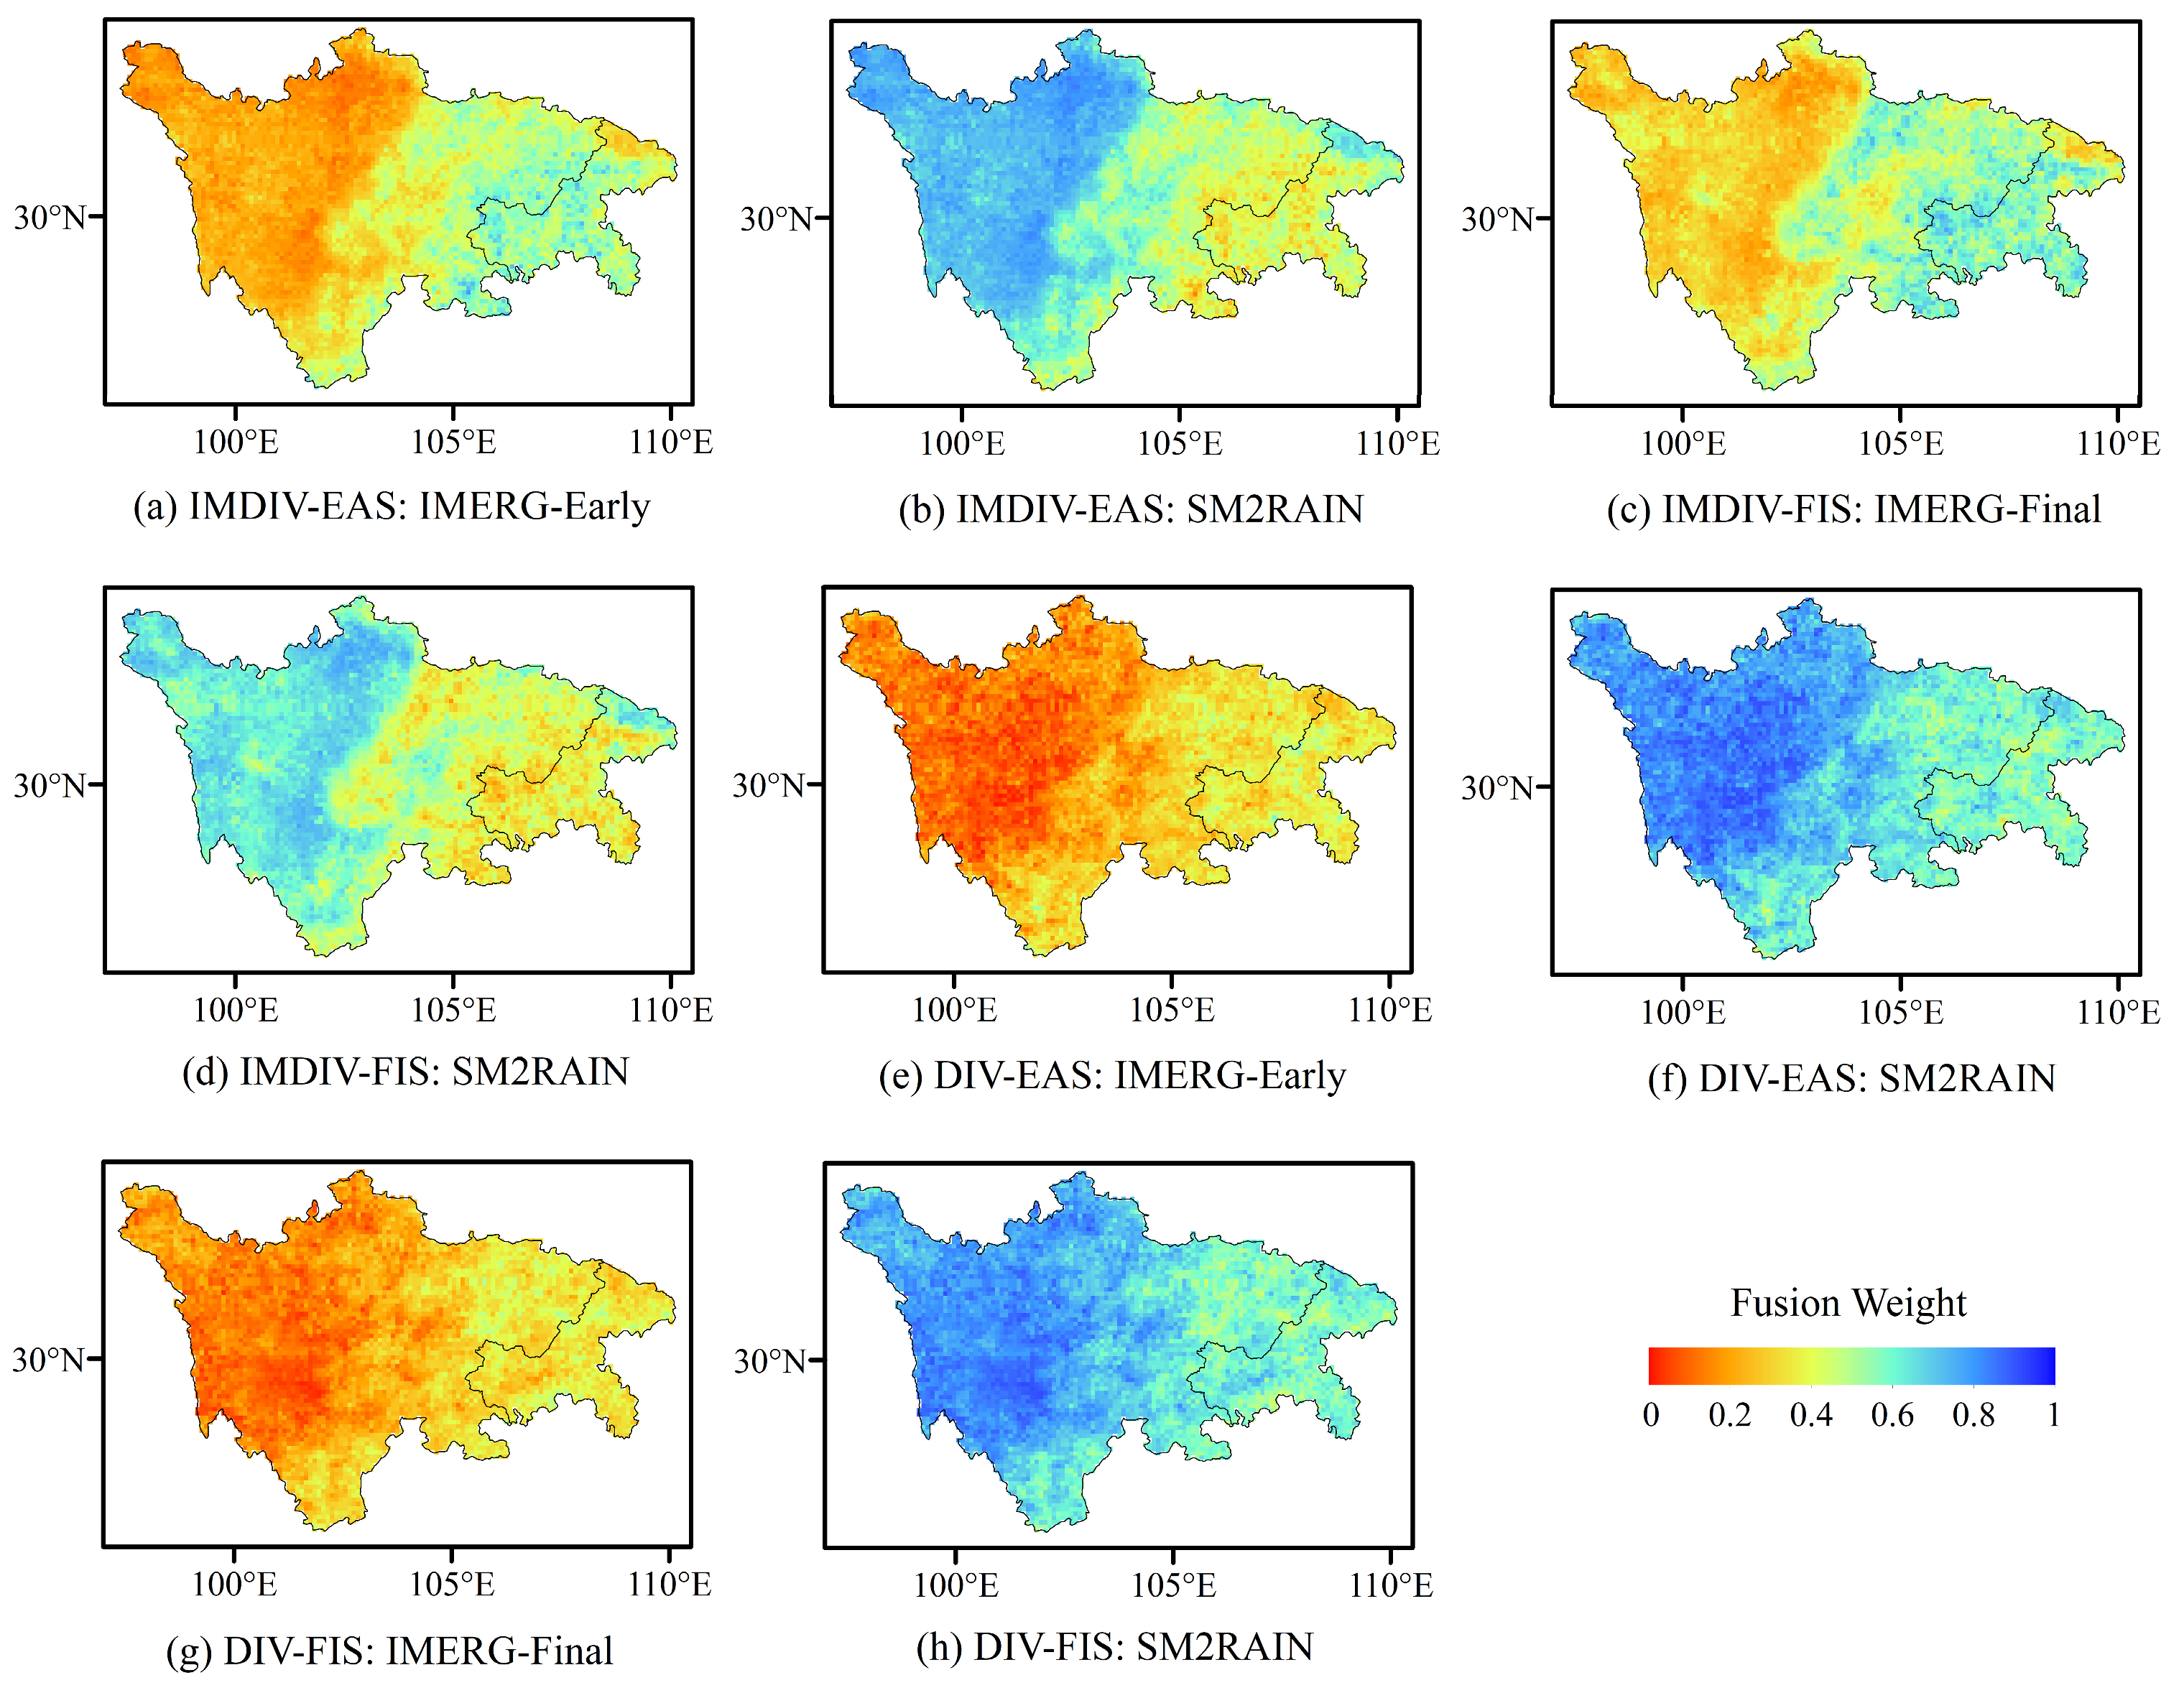
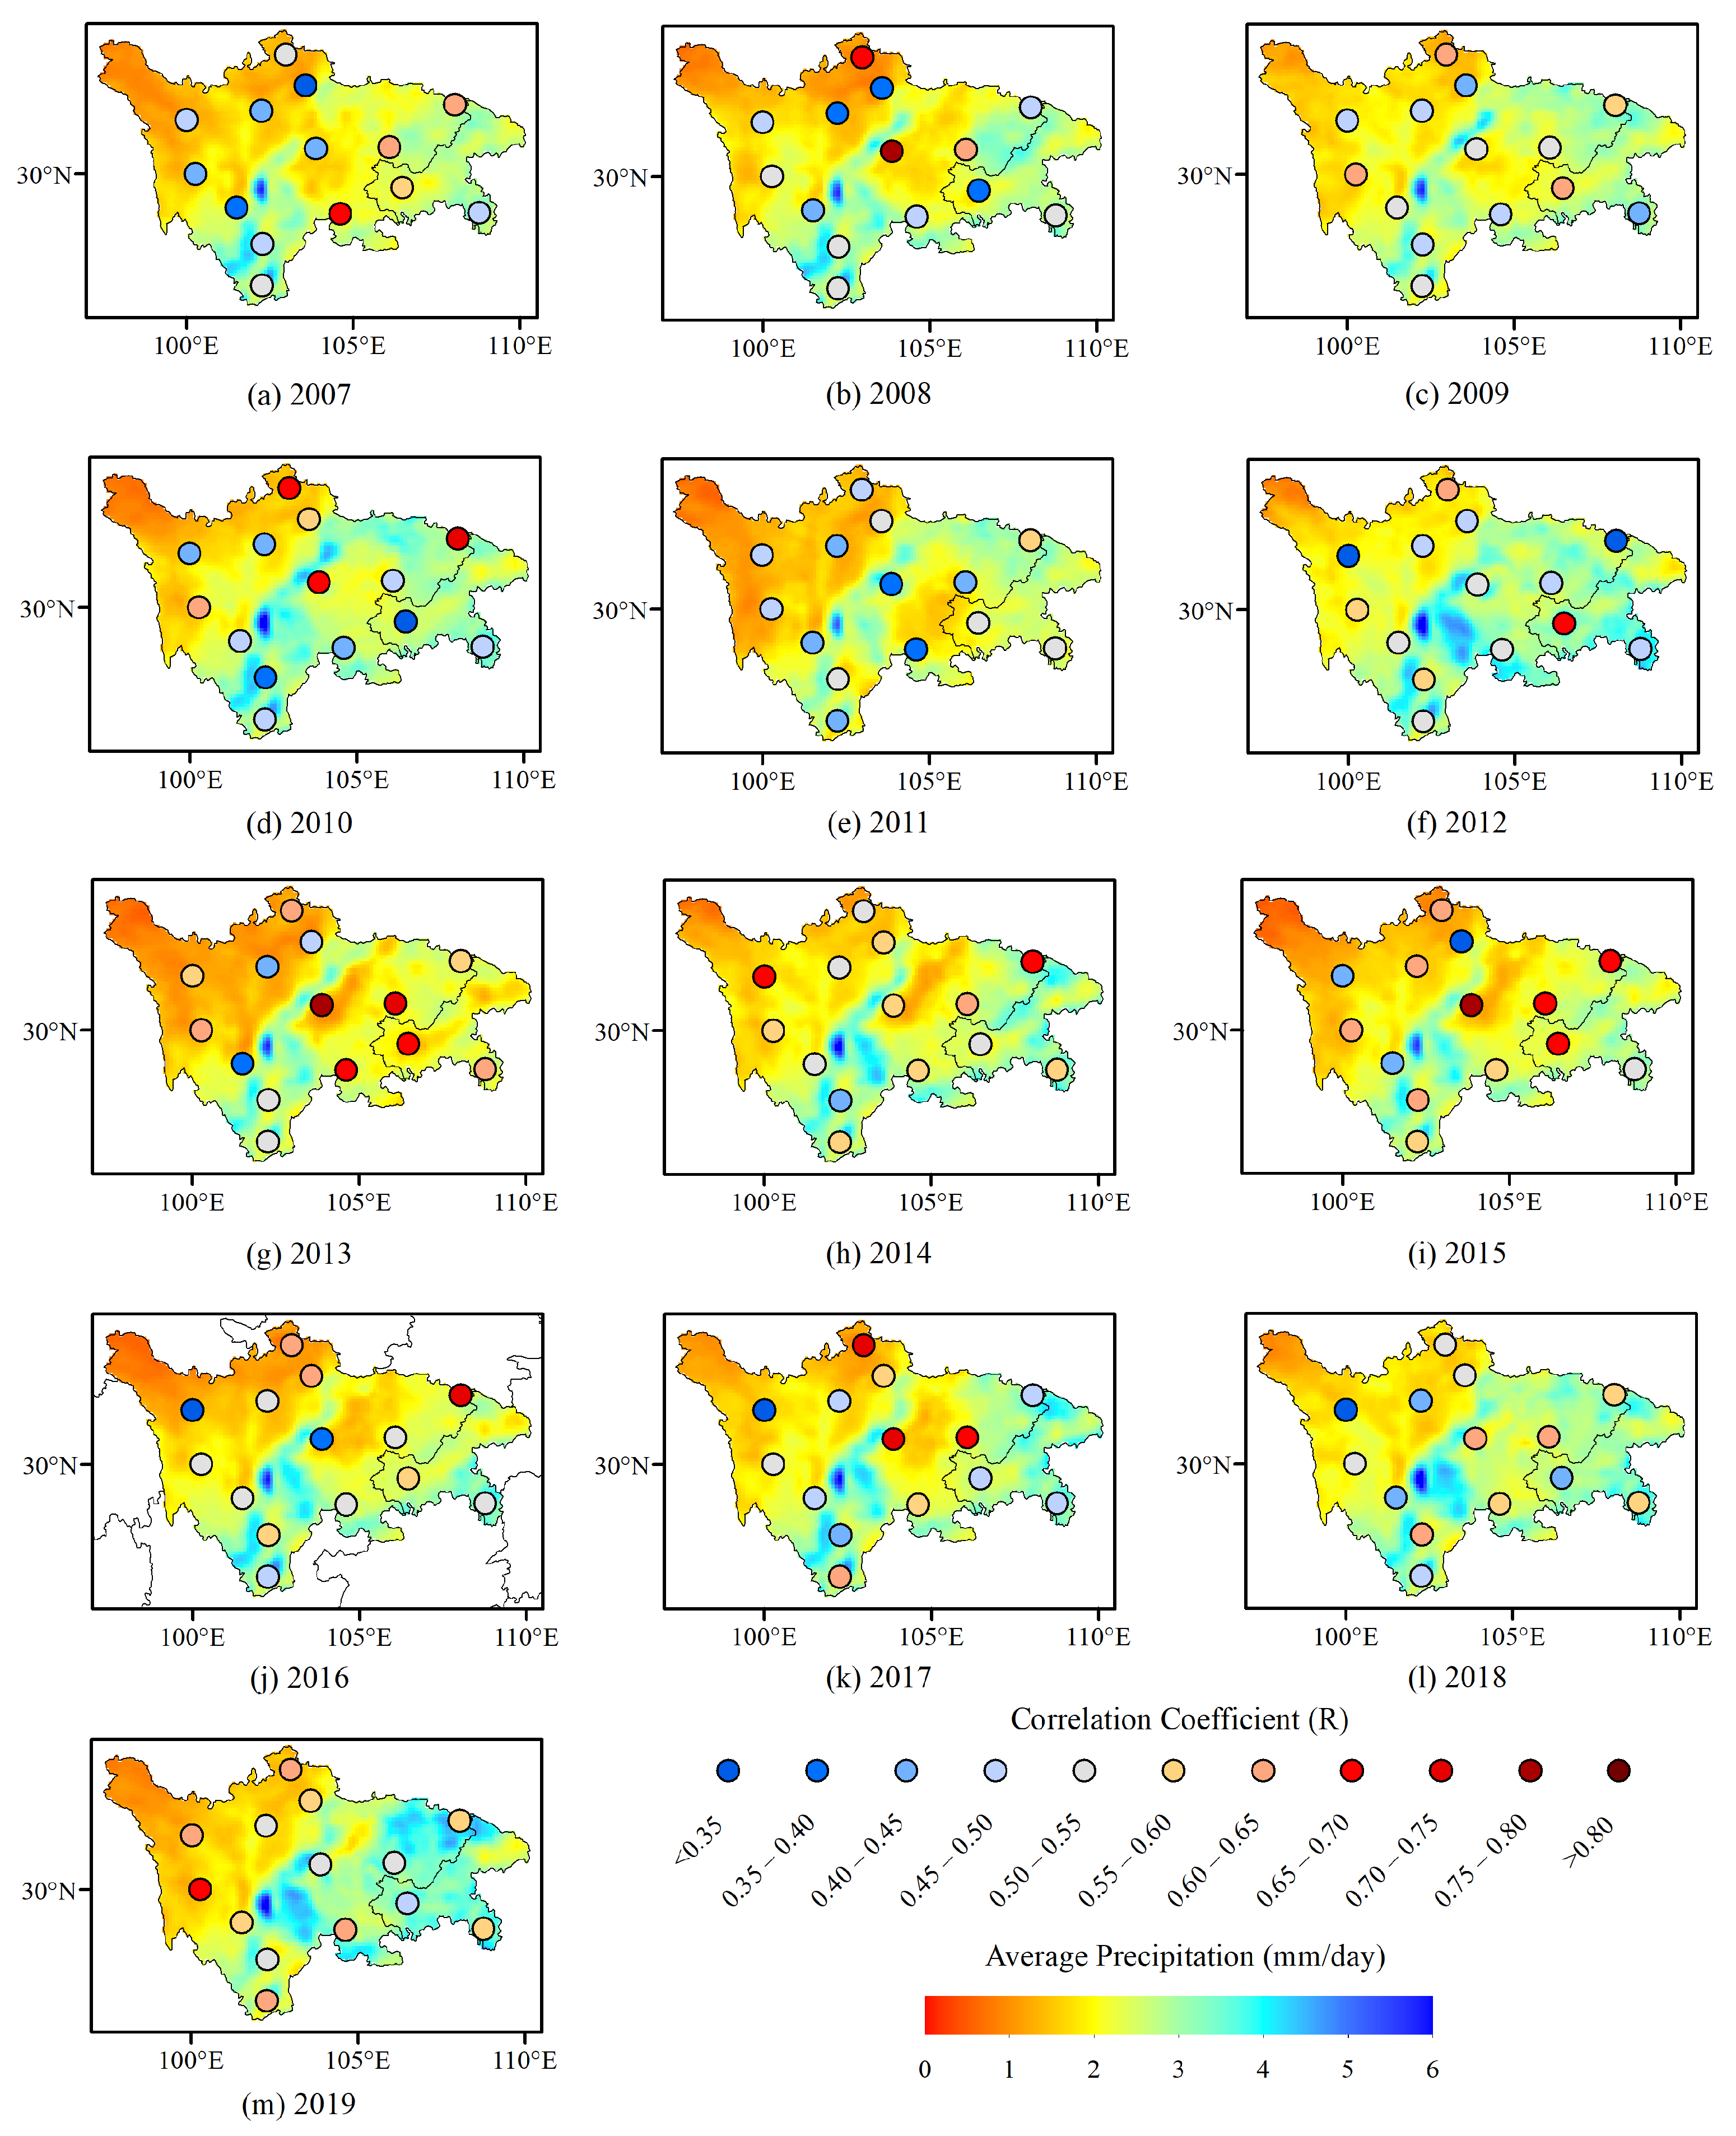
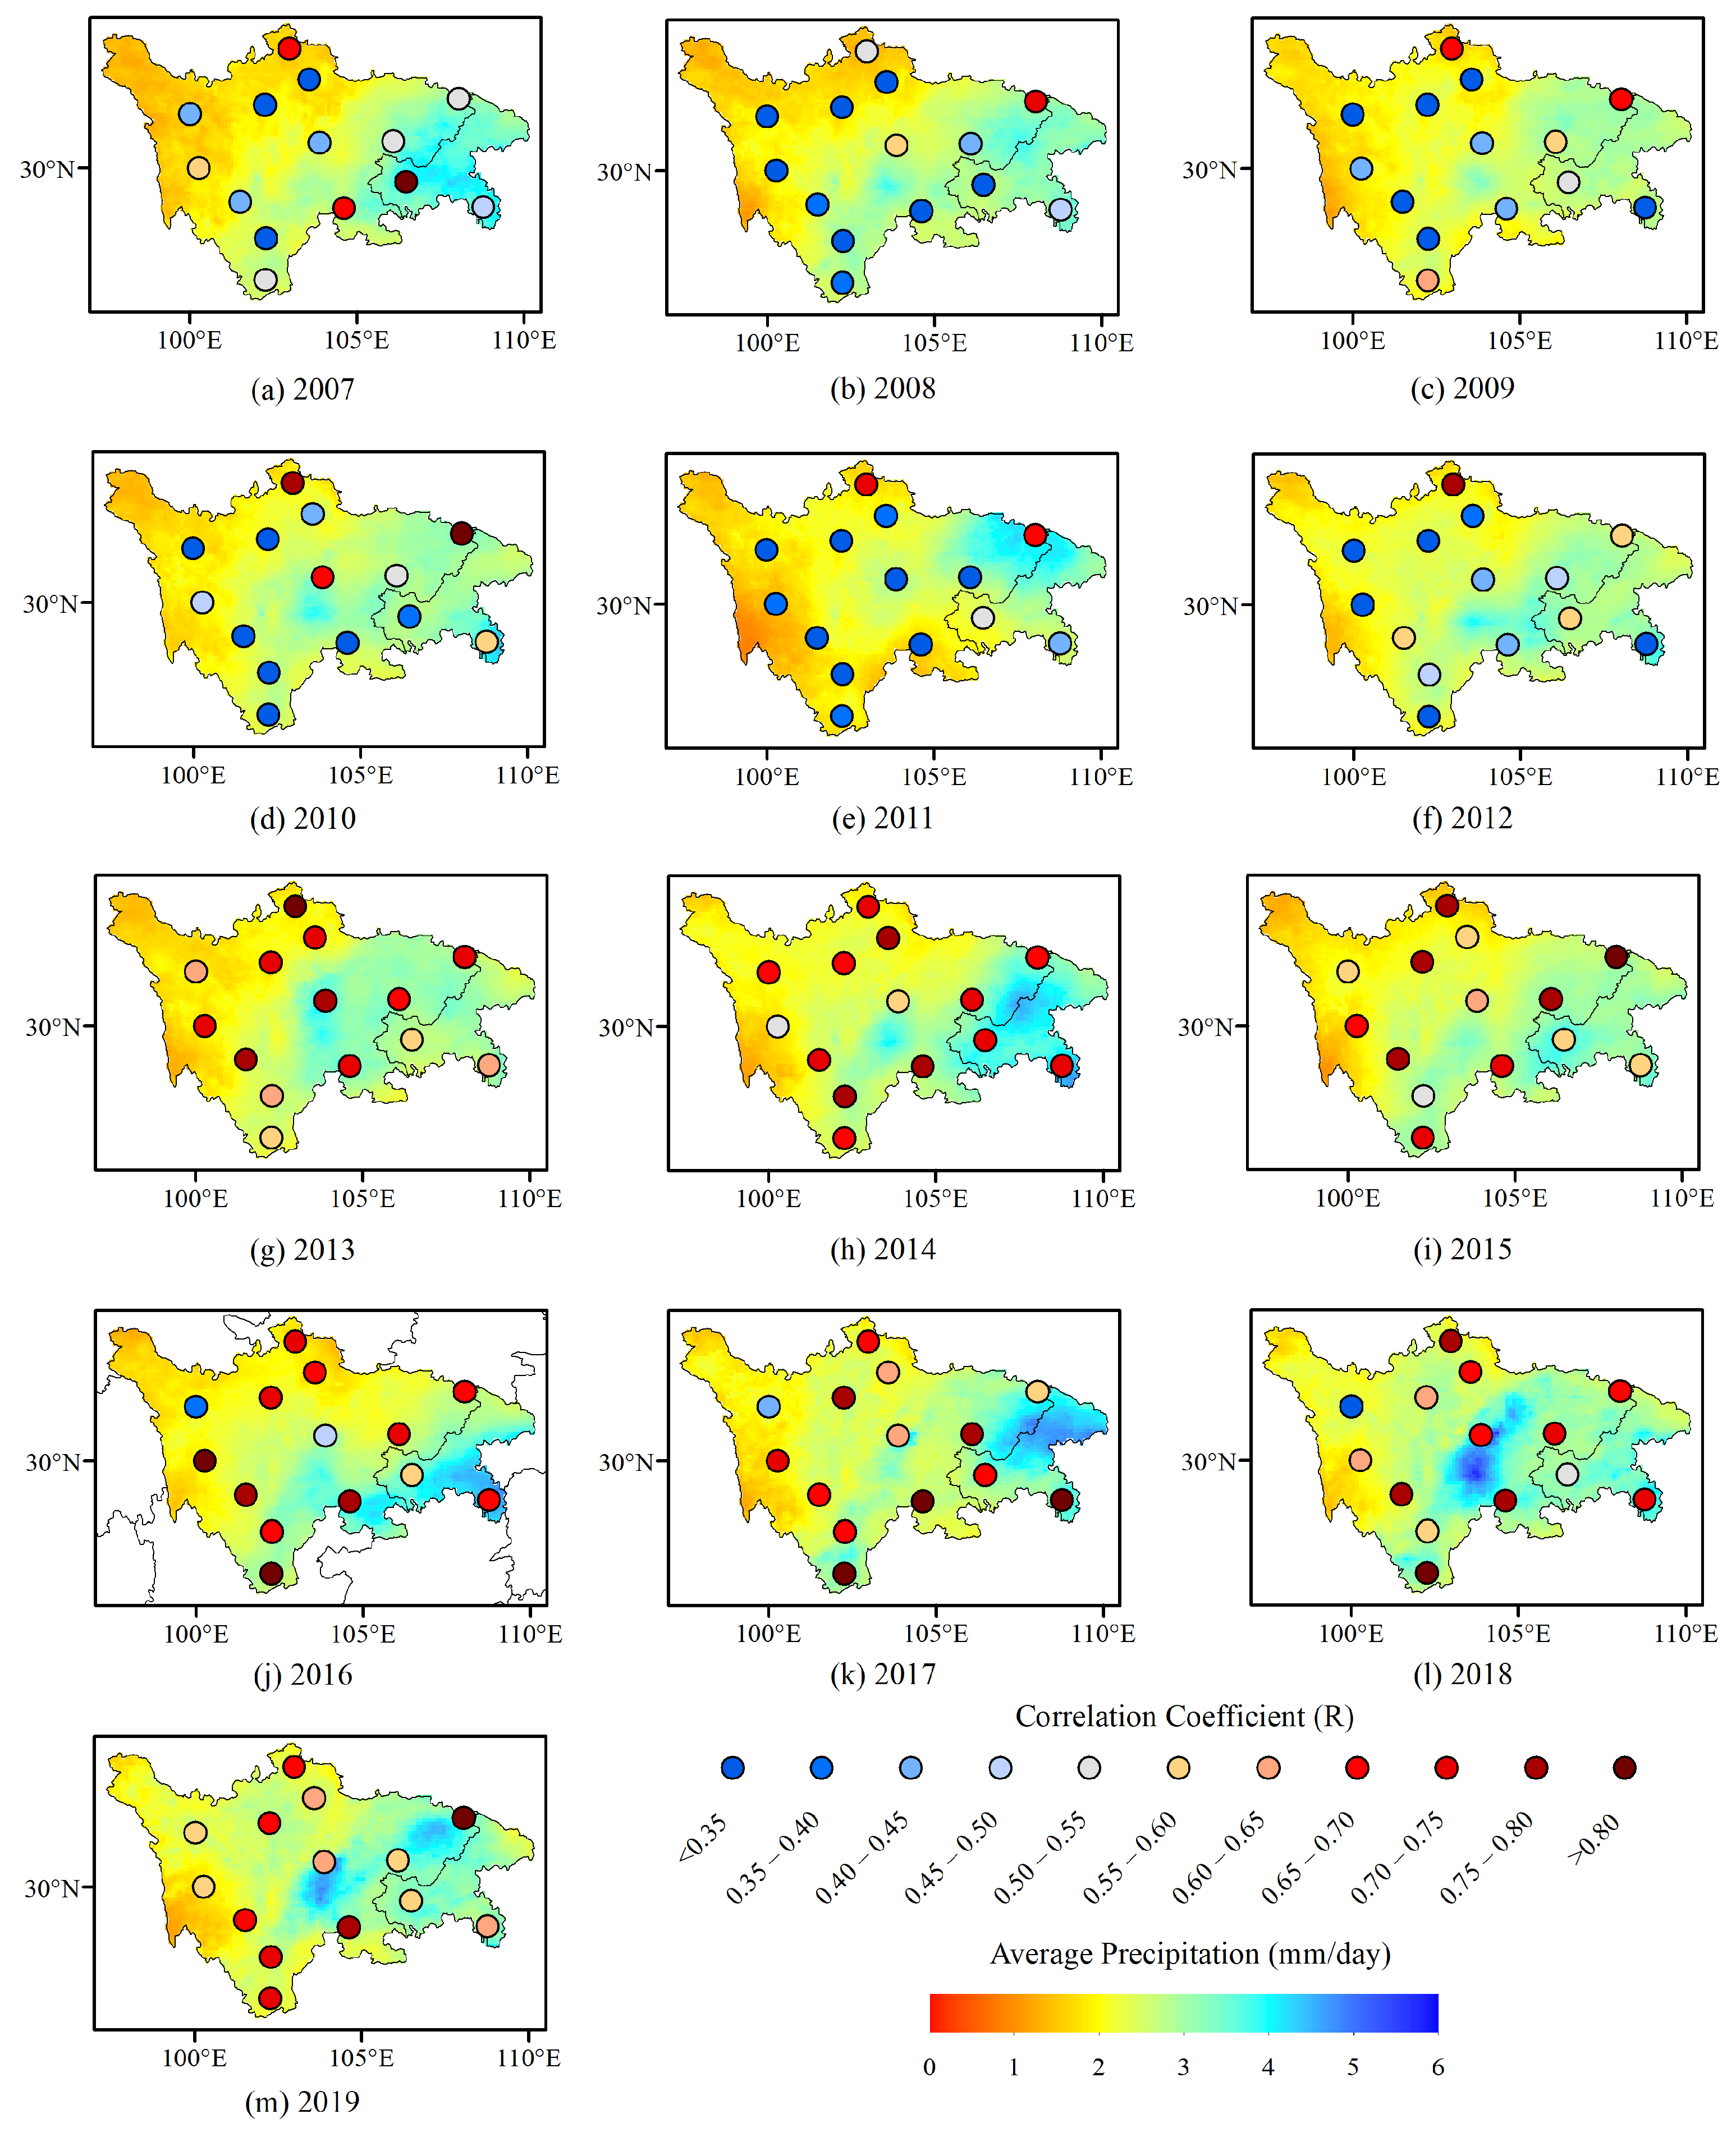
3.2. Visualization of Key Parameters in IMDIV and DIV Method on EAS and FIS Fusion Task

In order to further explore the improvement of IMDIV from the original DIV method, the differences between the fused products and key parameters are visualized as follows. Figure 5 shows the average bias between the fused products and original products in the Chuanyu region from 2007 to 2019, via the IMDIV and DIV methods, respectively. Firstly, Figure 5a,b show the bias of IMDIV-EAS toward IMERG-Early and SM2RAIN, respectively. It can be seen that these two biases are both lower in the northwest mountain zone compared with those in the other two zones. On the one hand, the bias from IMDIV-EAS toward SM2RAIN in this zone is lower than the bias between IMDIV-EAS and IMERG-Early. On the other hand, the bias between IMDIV-EAS and IMERG-Early in the eastern basin zone is lower than the bias from IMDIV-EAS toward IMERG-Early in this zone. The biases of IMDIV-FIS between IMERG-Final and SM2RAIN in Figure 5c,d show a similar pattern to those of IMDIV-EAS. This bias distribution pattern shows that the proposed IMDIV-based precipitation fusion method is able to adaptively adjust the fusion weight to merge the two original satellite precipitation products with top–down and bottom–up approaches. Moreover, Figure 5e,h show bias between the fused and original products using the original DIV method. It can be seen that both DIV-EAS and DIV-FIS are more different from IMERG-Early and less different from SM2RAIN, while comparing with the differences between IMDIV-EAS and IMDIV-FIS and IMERG-Early and SM2RAIN, respectively.
Moreover, the detailed key parameters of the IMDIV and DIV methods, including the offset, fusion weight m and n , and estimate error σ x and σ y , are visualized in Figure 6, Figure 7, Figure 8 and Figure 9, respectively.
Figure 6 and Figure 7 show the offset from 2007 to 2019 via the IMDIV method on an EAS fusion task and FIS fusion task, respectively. It can be seen that the offsets in the IMDIV method range from −4745 to 4745 days, which covers the entire time period of 13 years. Also, the offsets are different from years to years. Compared with the constant offset used in the original DIV method, the adaptively adjustable offset in the IMDIV method can better select which of the double instrumental variables has a higher correlation coefficient for the corresponding input data and results in a better fusion performance.
Figure 8 shows the estimate error σ x and σ y for an IMDIV-based EAS fusion task and FIS fusion task, as well as the DIV-based EAS fusion task ans FIS fusion task, respectively. It can be seen that the IMDIV-based estimated error for the original product SM2RAIN in Figure 8b,d has more details in spatial distribution, compared to the DIV-based estimated error for the original product SM2RAIN in Figure 8f,h.
Figure 9, Figure 10, Figure 11, Figure 12 and Figure 13 show the details of the fusion weights in the IMDIV method and DIV method. Here, since the fusion weights of the two original products at a single location are always sum to 1, thus the fusion weights of IMERG-Early and IMERG-Final are shown for EAS and FIS fusion tasks, respectively. Figure 9 shows the average fusion weights of the IMDIV method and DIV method from 2007 to 2019. As shown in Figure 9, both the IMDIV and DIV methods have set up higher fusion weights for SM2RAIN, which is based on the bottom–up approach, on the western part of the Chuanyu region, and a higher fusion weight for IMERG-Early and IMERG-Final, which are based on the top–down approach, on the eastern part of the Chuanyu region. Moreover, the IMDIV-based fusion weights are more balancing than DIV-based fusion weights for the entire study region. Figure 10, Figure 11, Figure 12 and Figure 13 show the fusion weight for each year from 2007 to 2019, for the EAS fusion task and FIS fusion task based on the IMDIV method and DIV method, respectively. The fusion weights for each year follow a similar pattern to the corresponding average fusion weights. Moreover, the IMDIV-based fusion weight for both the EAS fusion task and FIS fusion task shows more details in the western part of the Chuanyu region. Above all, these results show that the proposed IMDIV method has a better ability to estimate the error within input products, resulting in a good performance by fusing the products based on the top–down and bottom–up approach for EAS and FIS fusion tasks, compared to the original DIV method.

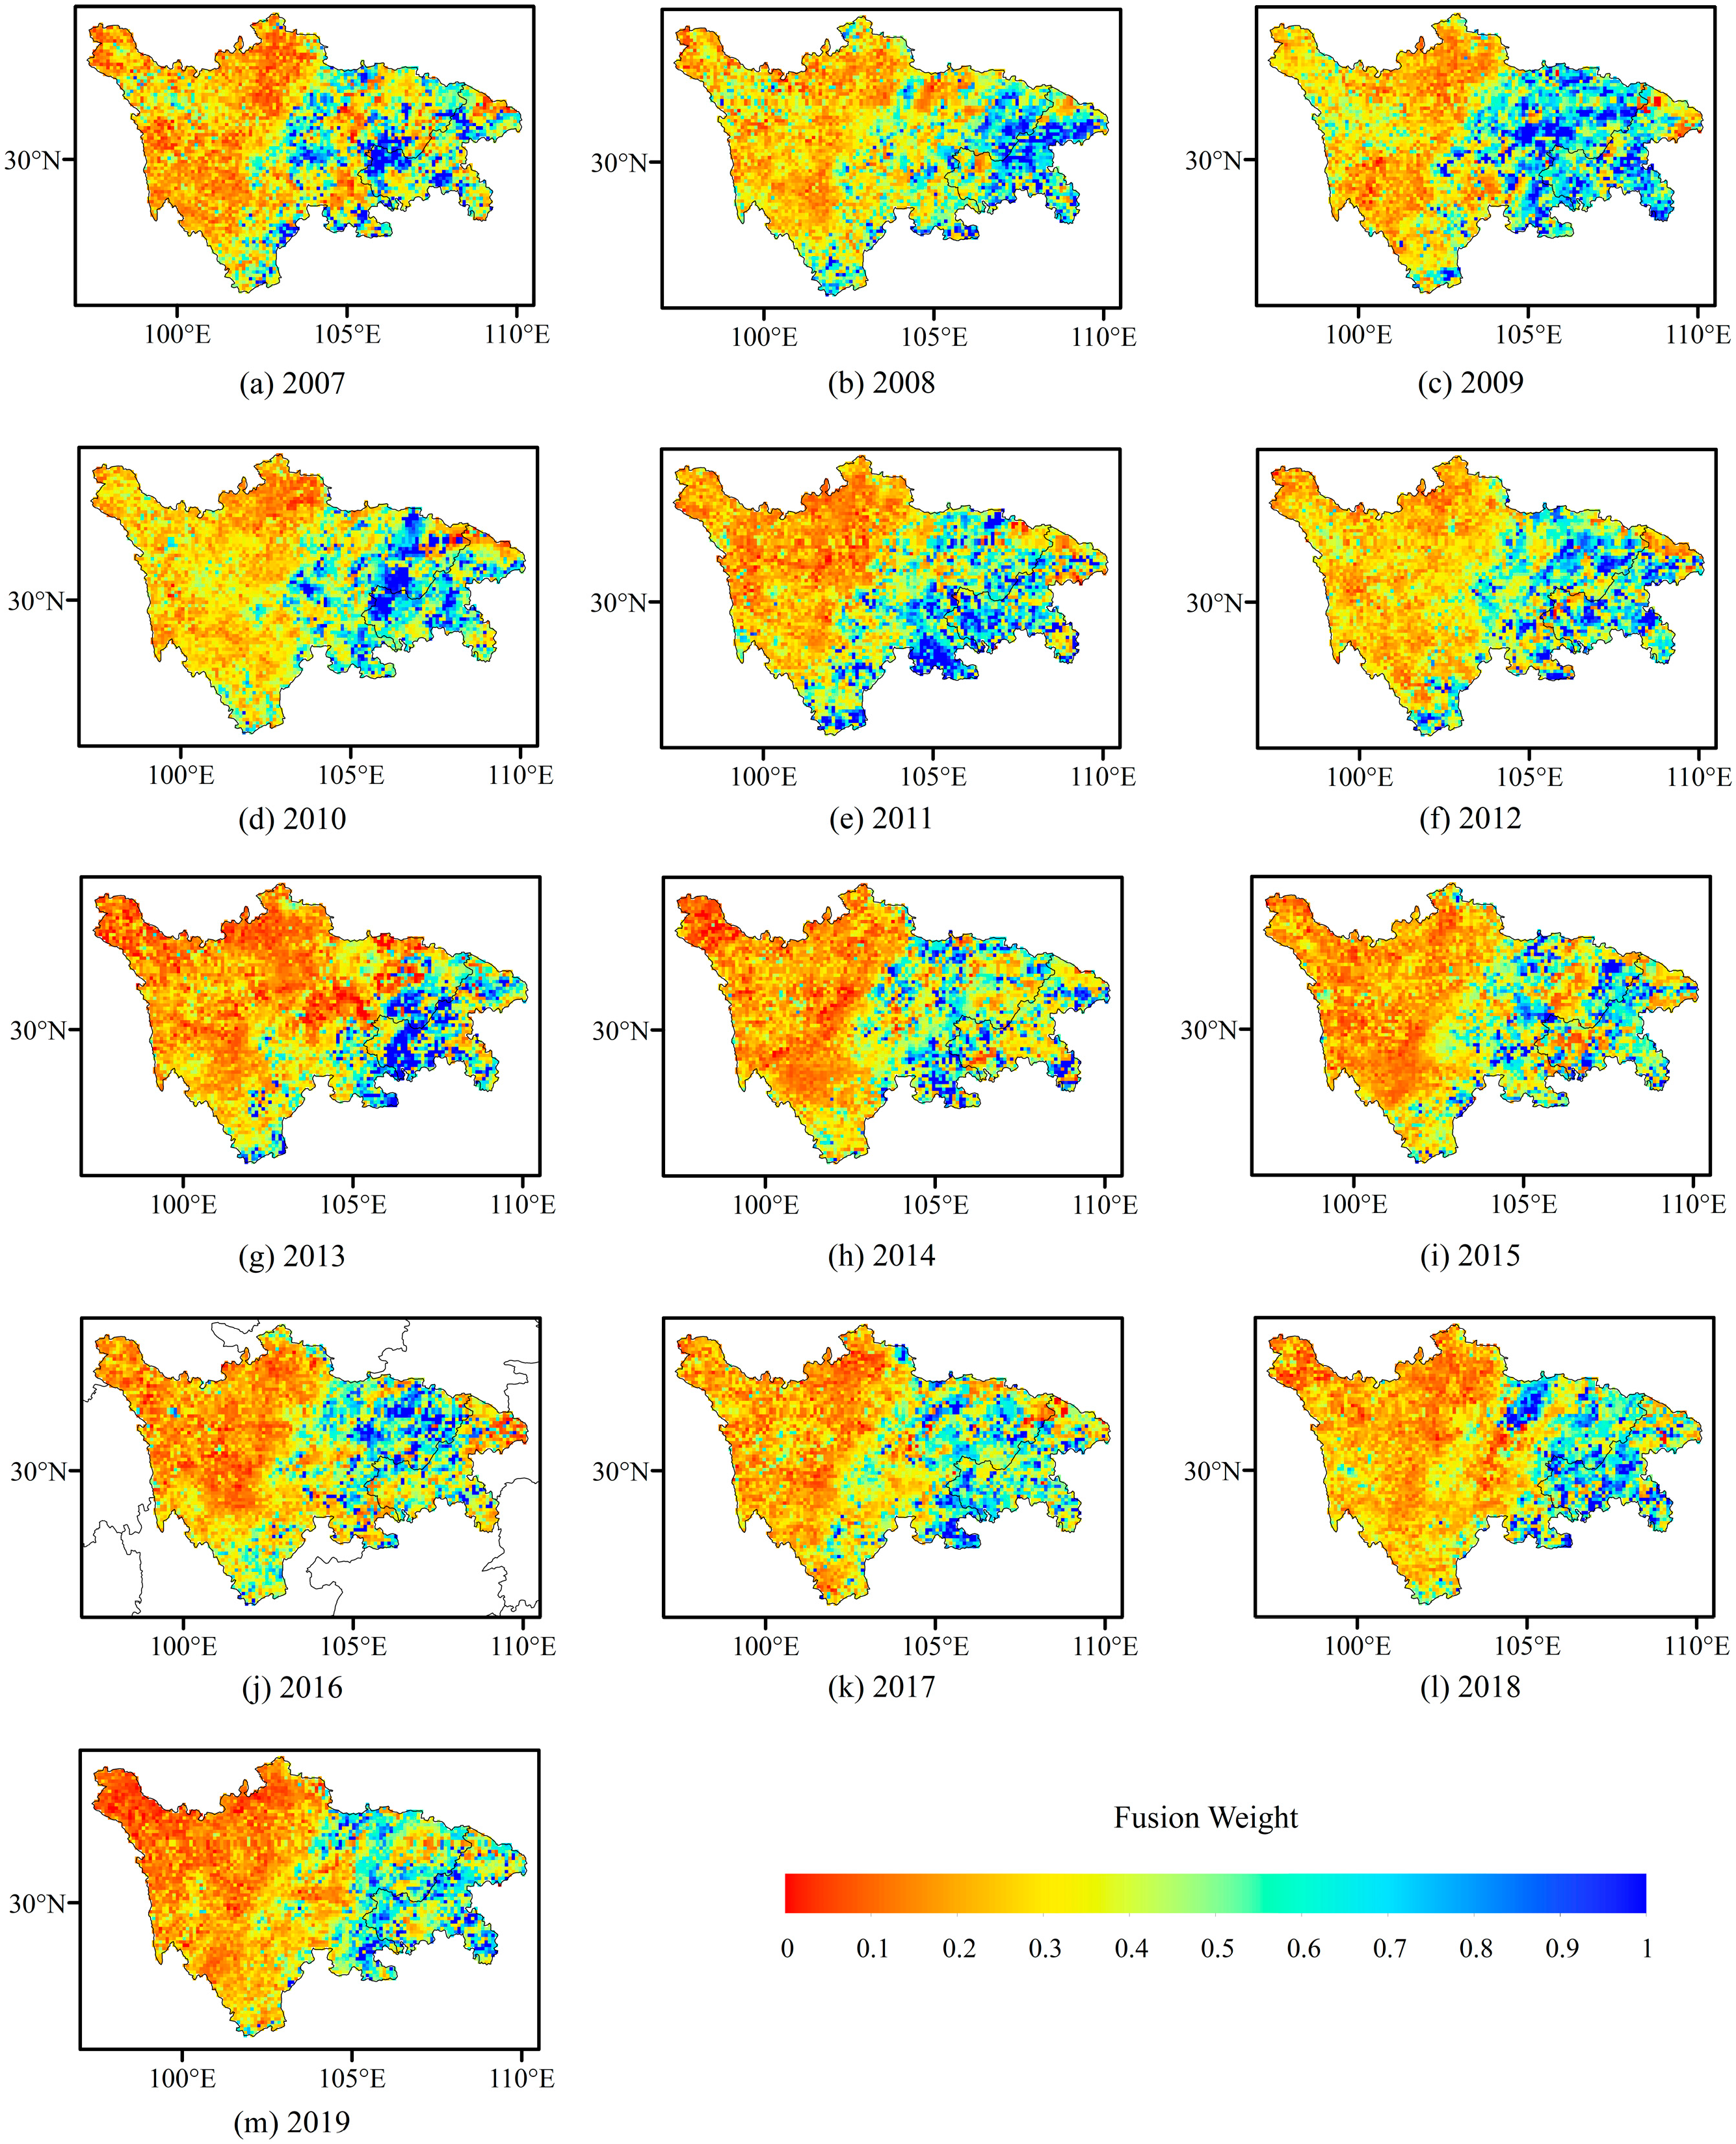
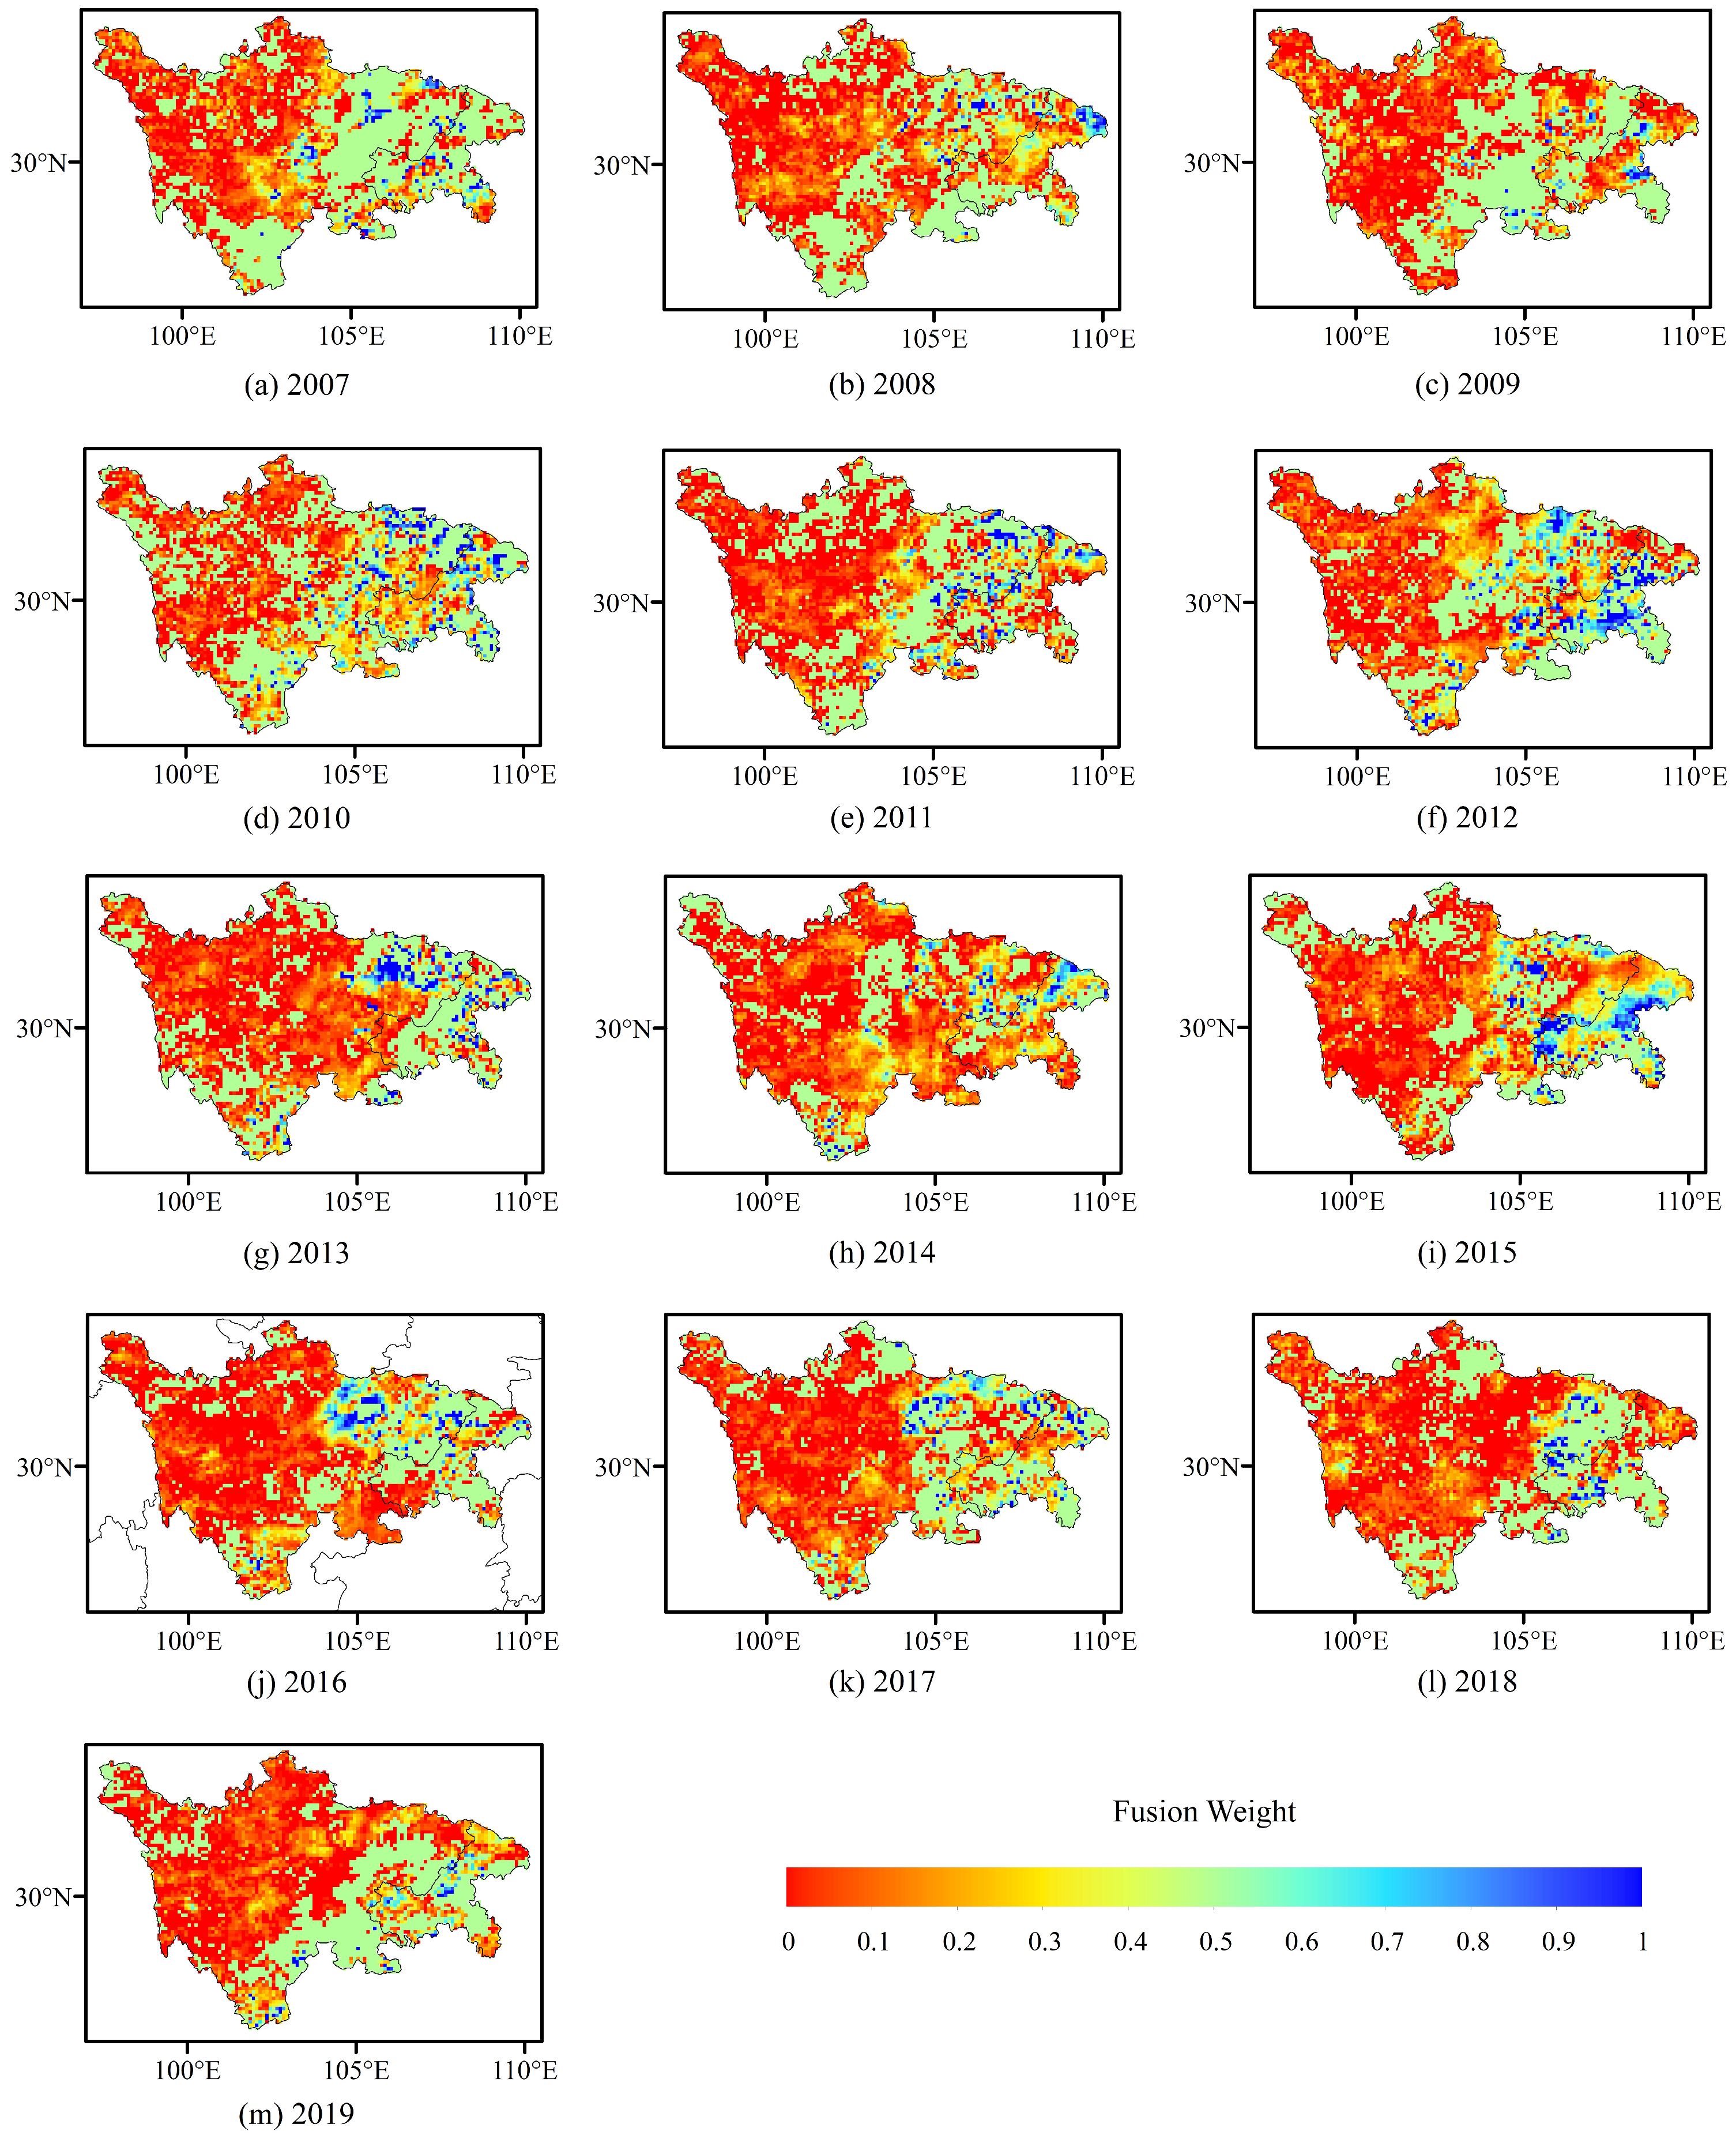
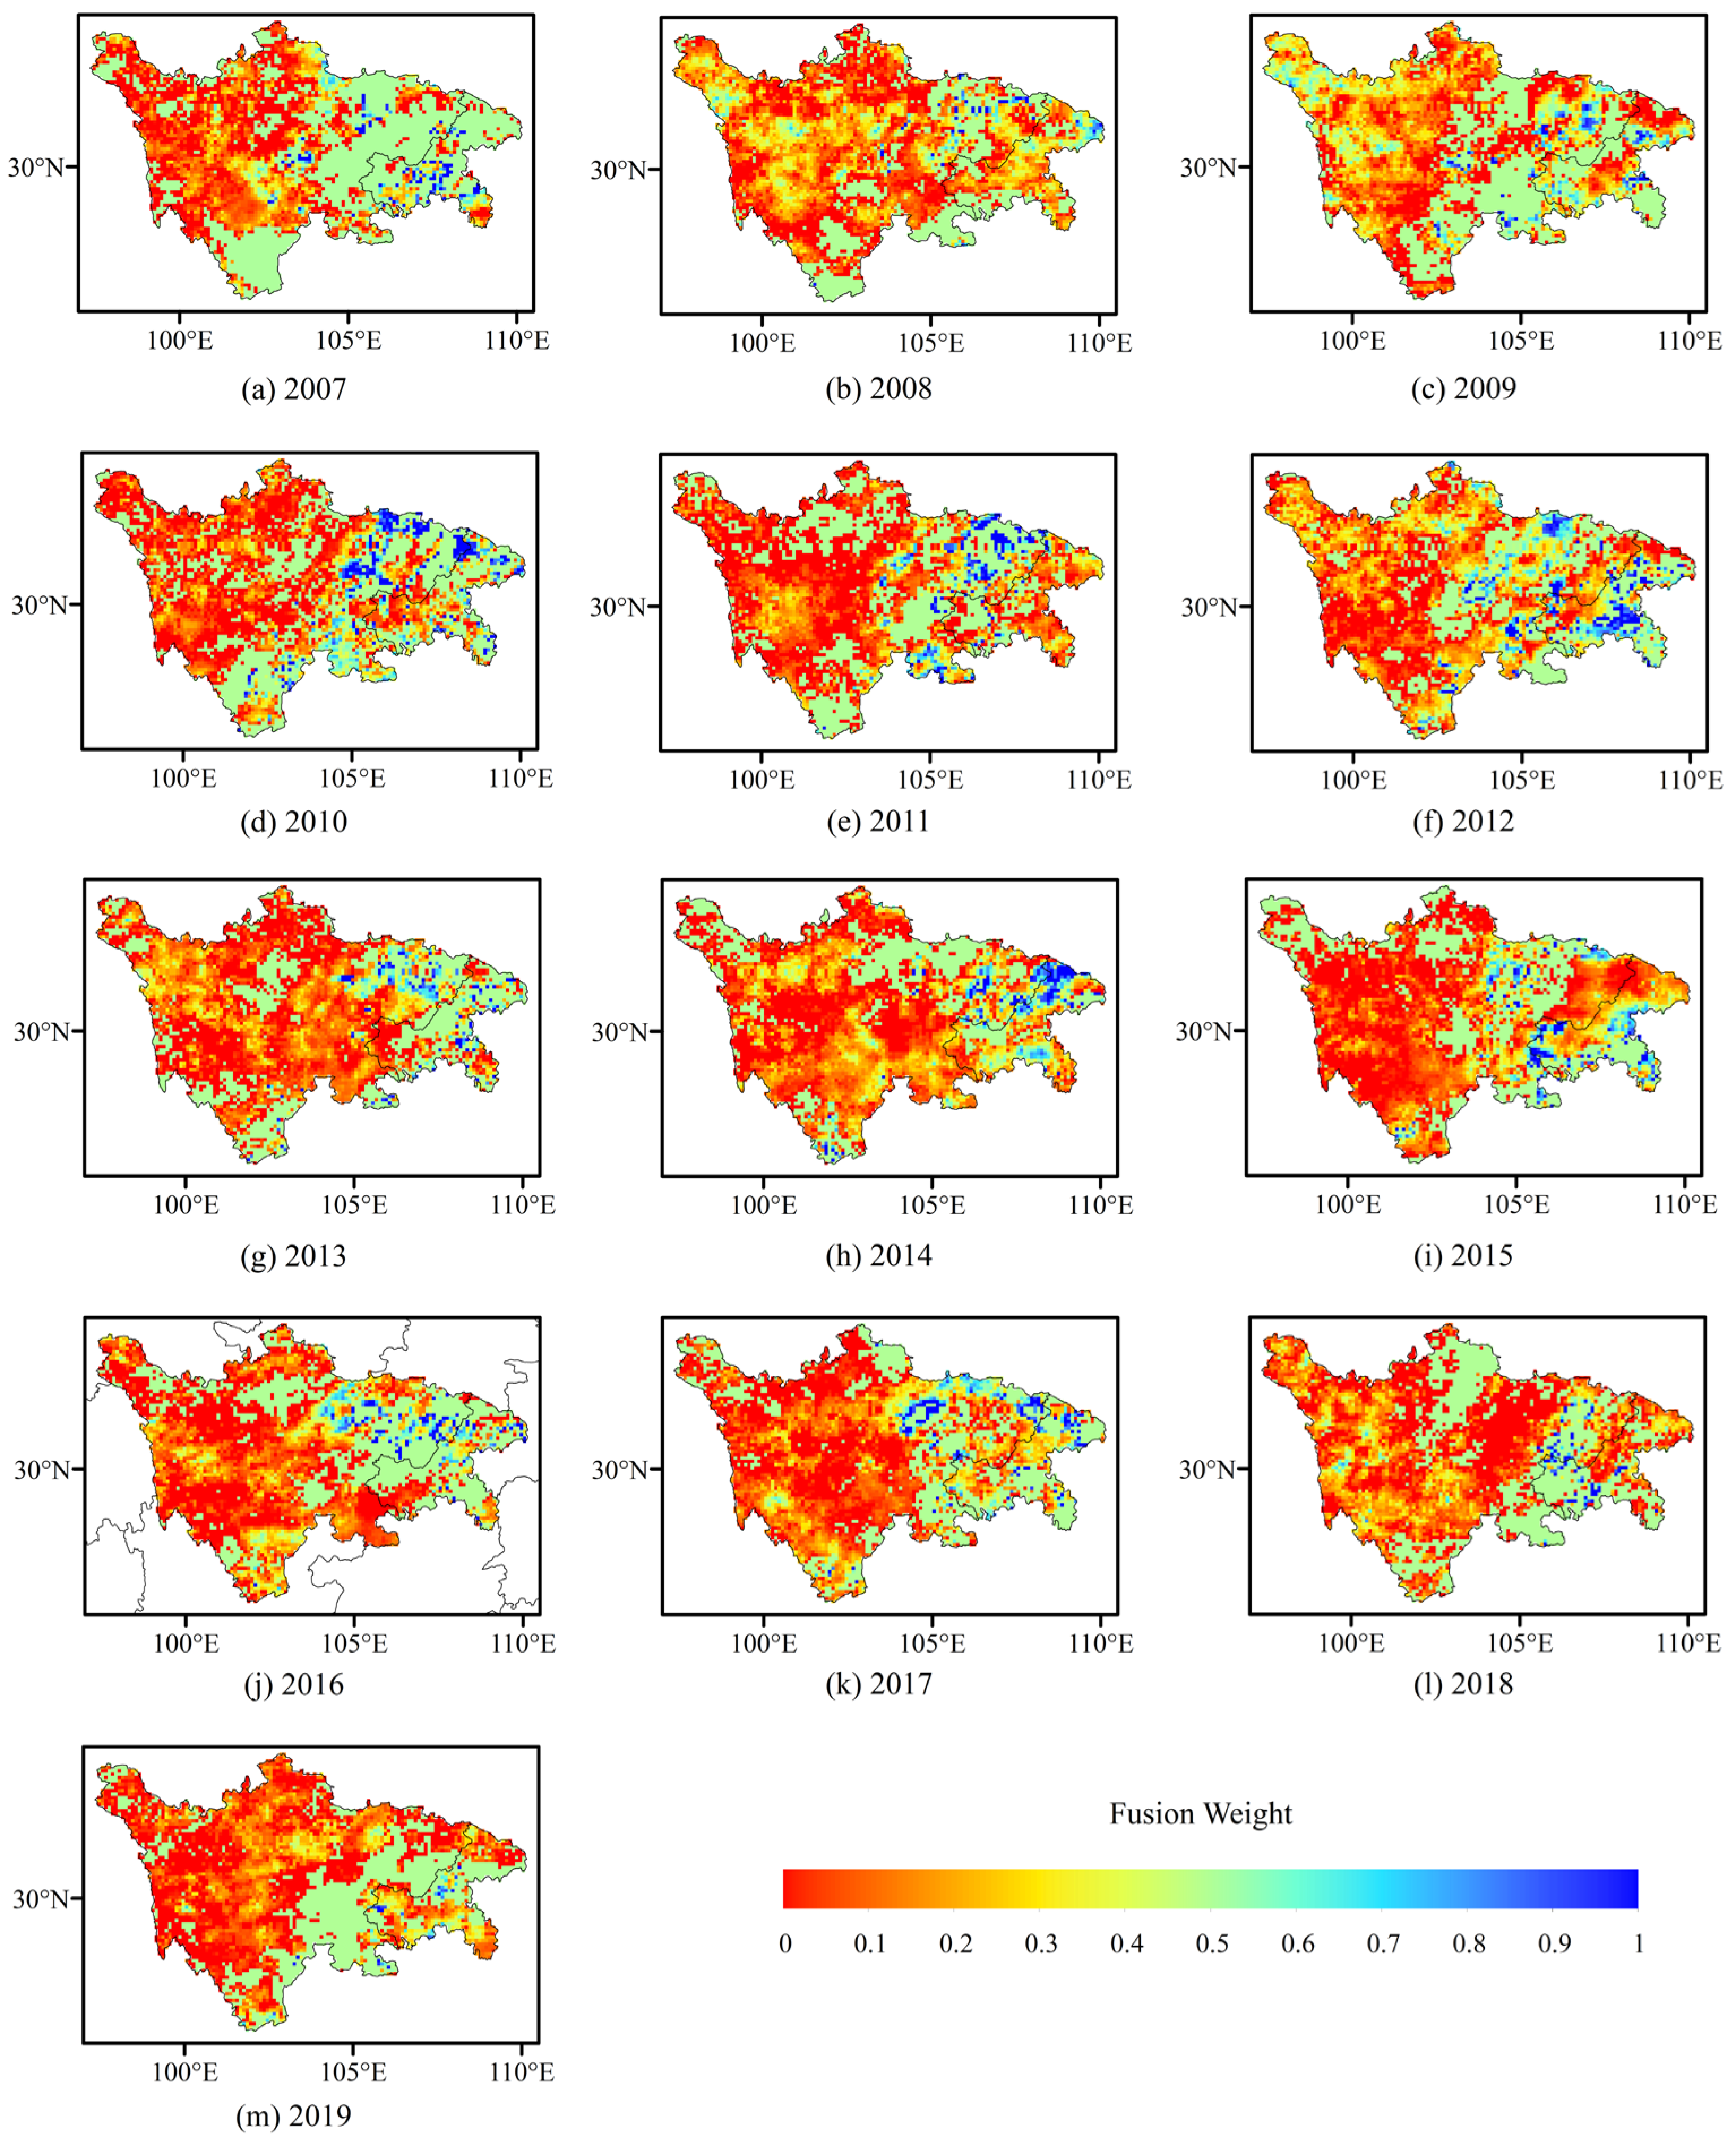
3.3. Fusion of IMDIV-Based Satellite Precipitation Products Based on Top–Down and Bottom–Up Approaches

Table 2 shows the comparison between the different performances of using IMERG-Early, which does not have gauge-station-corrected data, and IMERG-Final, which has gauge-station-corrected data, to fuse with SM2RAIN, via the proposed IMDIV method. It shows that the IMDIV-based fused products both outperform the original products. Moreover, the fused product IMDIV-EAS, which uses IMERG-Early, which is based on the top–down approach, and SM2RAIN, which is based on the bottom–up approach, even outperforms IMERG-Final on some of the stations. These promising results prove the effectiveness of the proposed IMDIV method for the condition of data that are not corrected by gauge stations.
Figure 14 and Figure 15 shows the details for the performances on each station. Figure 14 shows the correlation coefficients of the IMDIV-based satellite products that fuse the top–down and bottom–up approaches, along with the original products with top–down and bottom–up approaches, for each gauge station of the Chuanyu region from 2007 to 2019. The proposed fused IMDIV-EAS and IMDIV-FIS have higher correlation coefficients compared with those of the original input products on almost all of the stations. Moreover, there is a similar correlation coefficient pattern in that the performance of each product on the southwest plateau zone and eastern basin zone is higher than that at the northwest mountain zone. Specially, the correlation coefficient of IMDIV-EAS on gauge station 12 reaches 0.681, which shows a significant improvement compared with IMERG-Early’s correlation coefficient of 0.636 and SM2RAIN’s correlation coefficient of 0.557. This pattern can be explained by the unique rainfall event distribution in these regions, which has been proven by climate studies [67,68,69].
Figure 15 shows the RMSE of the fused and original products for each gauge station of the Chuanyu region from 2007 to 2019. IMDIV-EAS and IMDIV-FIS have a lower RMSE for almost all gauge stations, compared with the original input products. Moreover, there is a similar pattern that the products’ RMSE for the gauge stations within the northwest mountain zone is lower than that within the southwest plateau zone and eastern basin zone. This can be explained by the fact that the average precipitation in the northwest mountain zone is lower than that of the other two zones [70].
The gauge-station-level evaluation of the fused and original products at each year from 2007 to 2019 is shown in Figure 16, Figure 17, Figure 18, Figure 19 and Figure 20. Each subfigure represents the correlation coefficient of the corresponding products toward gauge stations within a single year. The average precipitation of the Chuanyu region has been calculated by corresponding fused and original products, which are further filled in on the corresponding subfigure. Firstly, by comparing the correlation coefficient of IMDIV-EAS toward the original products IMERG-Early and SM2RAIN, as well as that of IMDIV-FIS toward the original products IMERG-Final and SM2RAIN, it can be seen that the fused products outperform the original products for most of the gauge-station-level results within each single year. Secondly, the performance of the fused products IMDIV-EAS and IMDIV-FIS for each single year is consistent with the overall performance in Figure 4. The good performance of IMDIV-EAS shows that the proposed method can be helpful in satellite precipitation fusion without gauge station correction. In the meantime, the IMDIV-FIS product also achieves a better performance compared with IMERG-Final and SM2RAIN for gauge-station-corrected conditions. Above all, it can be concluded that the proposed IMDIV-based top–down and bottom–up satellite precipitation data fusion approach is able to provide high-accuracy precipitation data with an enhanced data quality.

4. Discussion

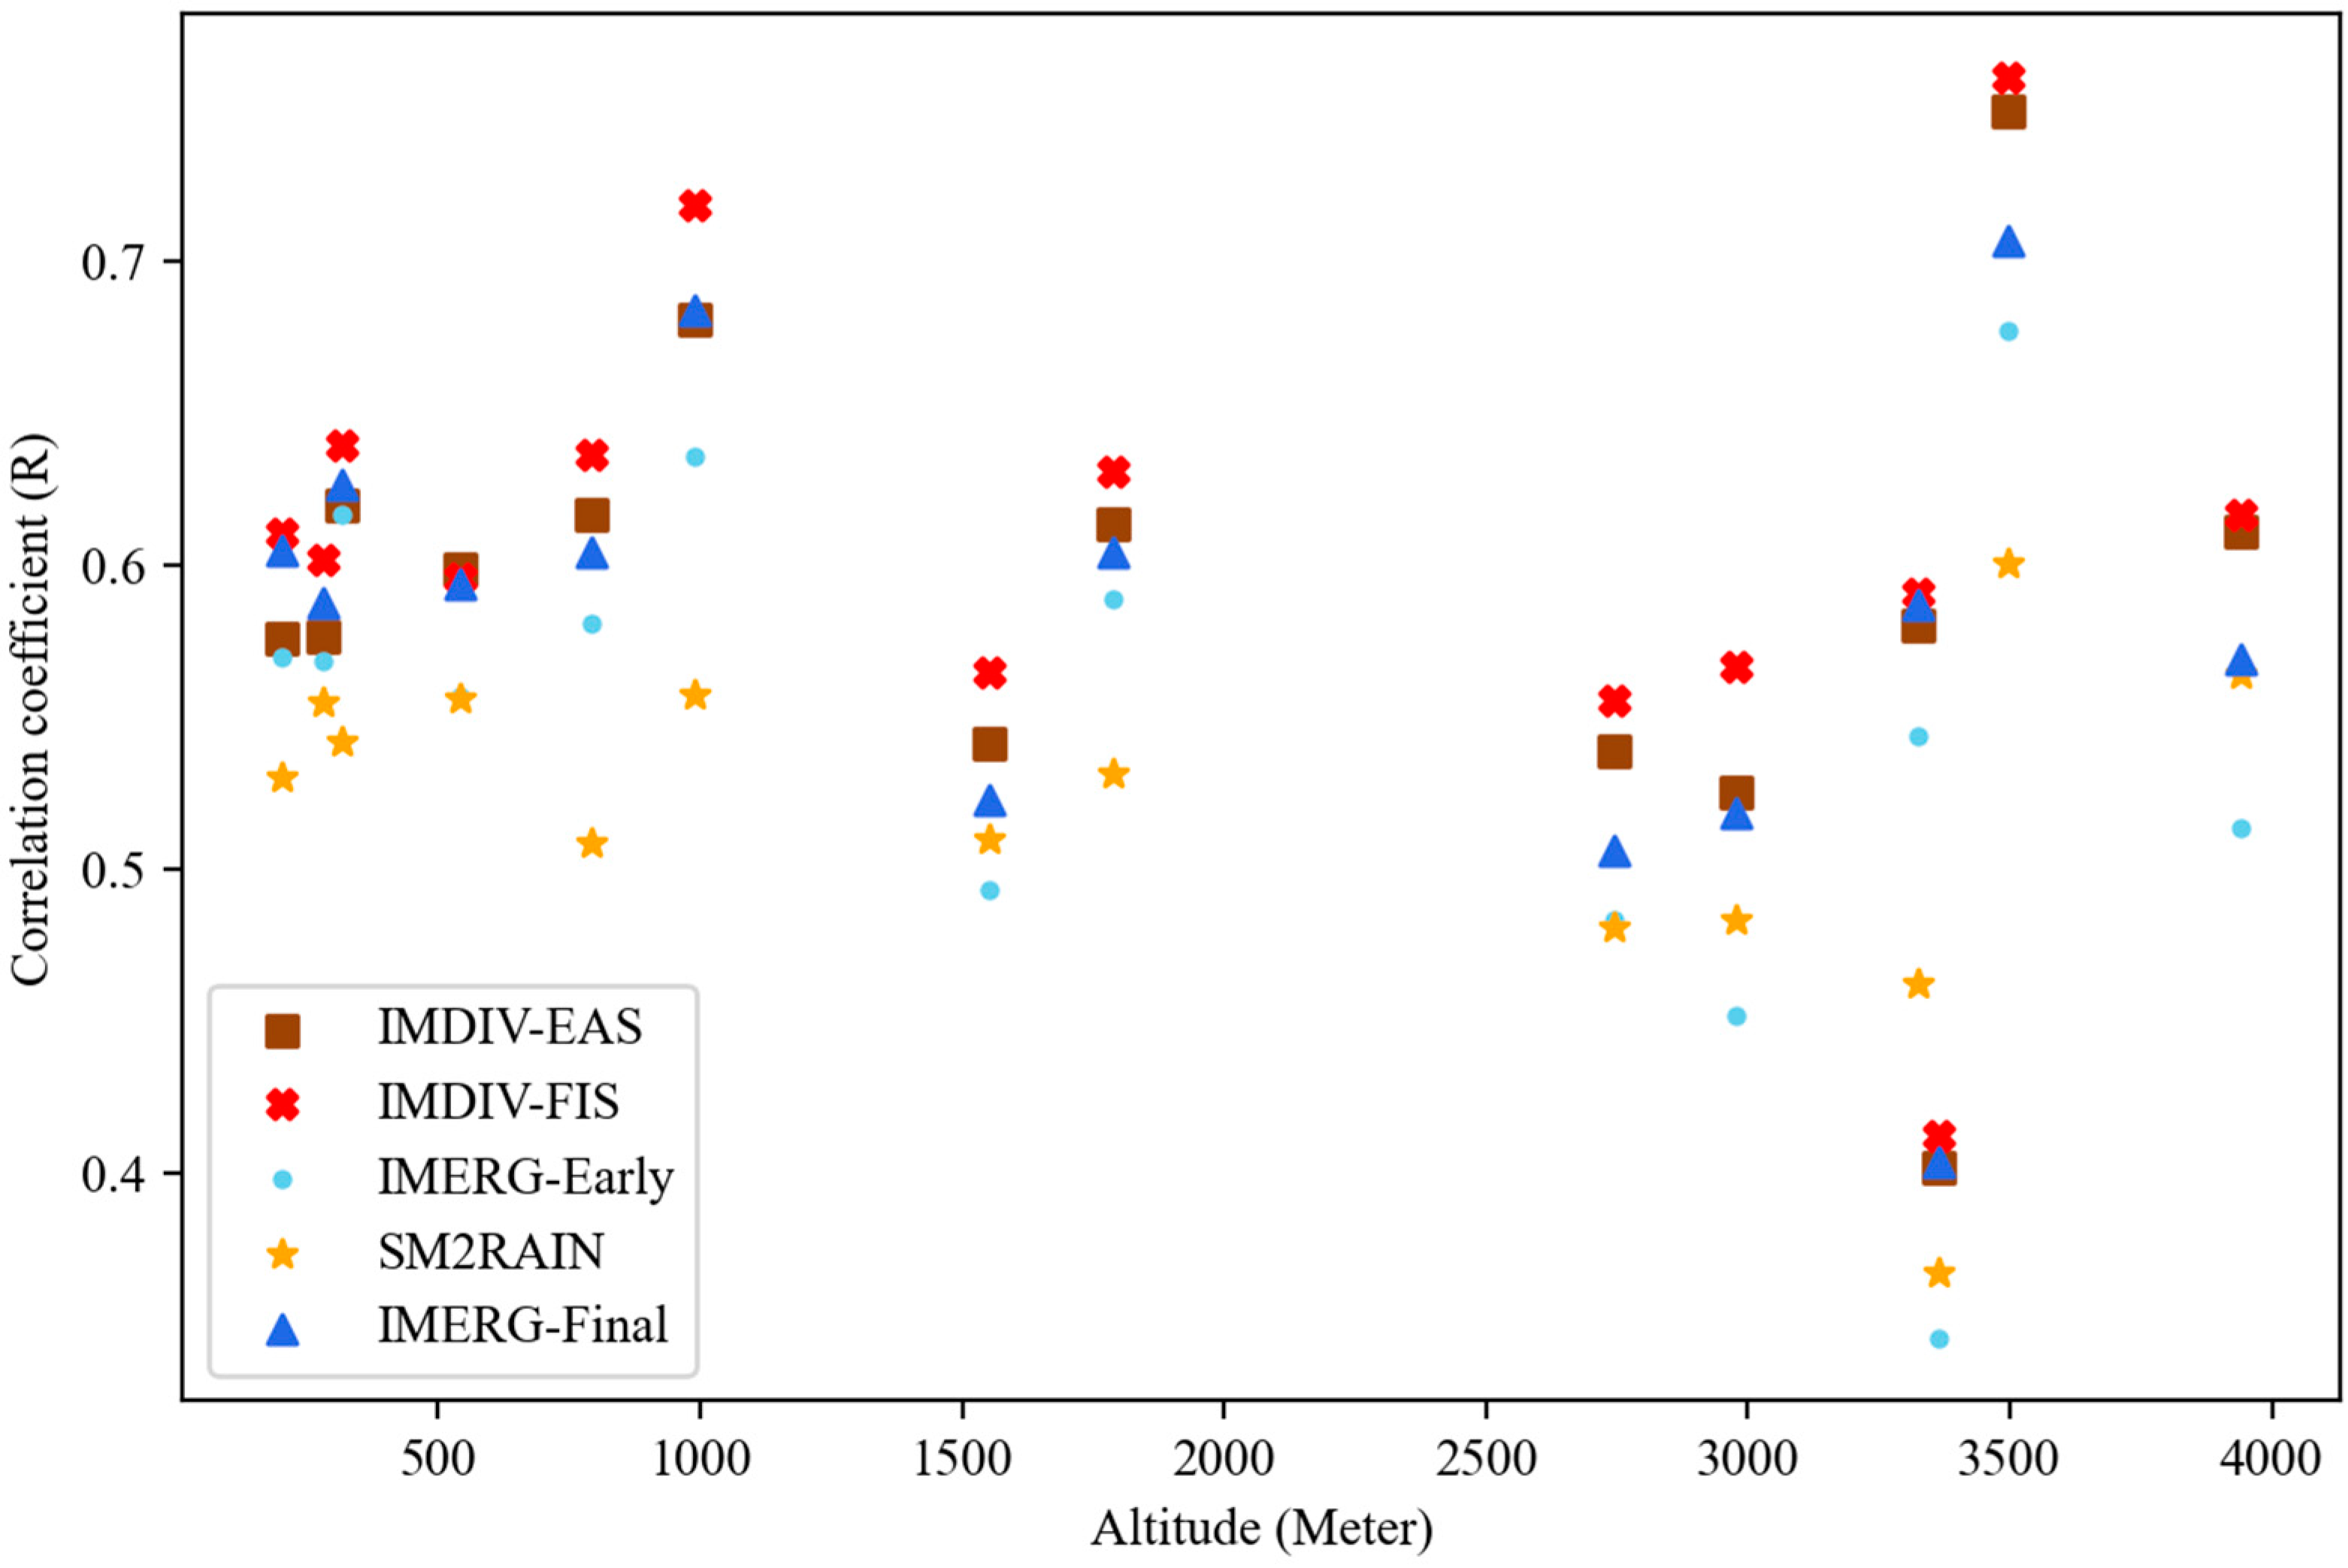
4.1. The Correlation Coefficients of Fused and Orginal Products for Gauge Stations with Different Altitudes

The correlation coefficients of the fused and original products are analyzed based on altitude using gauge station records. As shown in Figure 21, the correlation coefficients of the products under 2000 m are mostly around 0.65. Differently than in the low-altitude area situations, the correlation coefficients of the products in higher-altitude areas ranging from 2500 to 4000 m changed rapidly. This indicates that the performance of the fused and original products has a larger difference in these altitude regions and also shows that the proposed IMDIV-based fused products have better performances in these altitude regions, compared with the original products. The reason for this could be that high-altitude areas contain more topographic fluctuations. This finding is similar to the conclusions from relevant research on high-altitude precipitation monitoring [71,72,73], as the precipitation events at high altitudes are complex. Moreover, IMDIV-EAS and IMDIV-FIS have better correlation coefficient increases from areas of 3500 to 4000 m in altitude, compared with the correlation coefficient increases in fused products toward original products at lower altitude area. The good performance of the proposed IMDIV-EAS and IMDIV-FIS indicates that the proposed IMDIV method is useful for producing high-quality precipitation data for complex regions and has significate improvements for the high-altitude regions from 2500 to 4000 m.

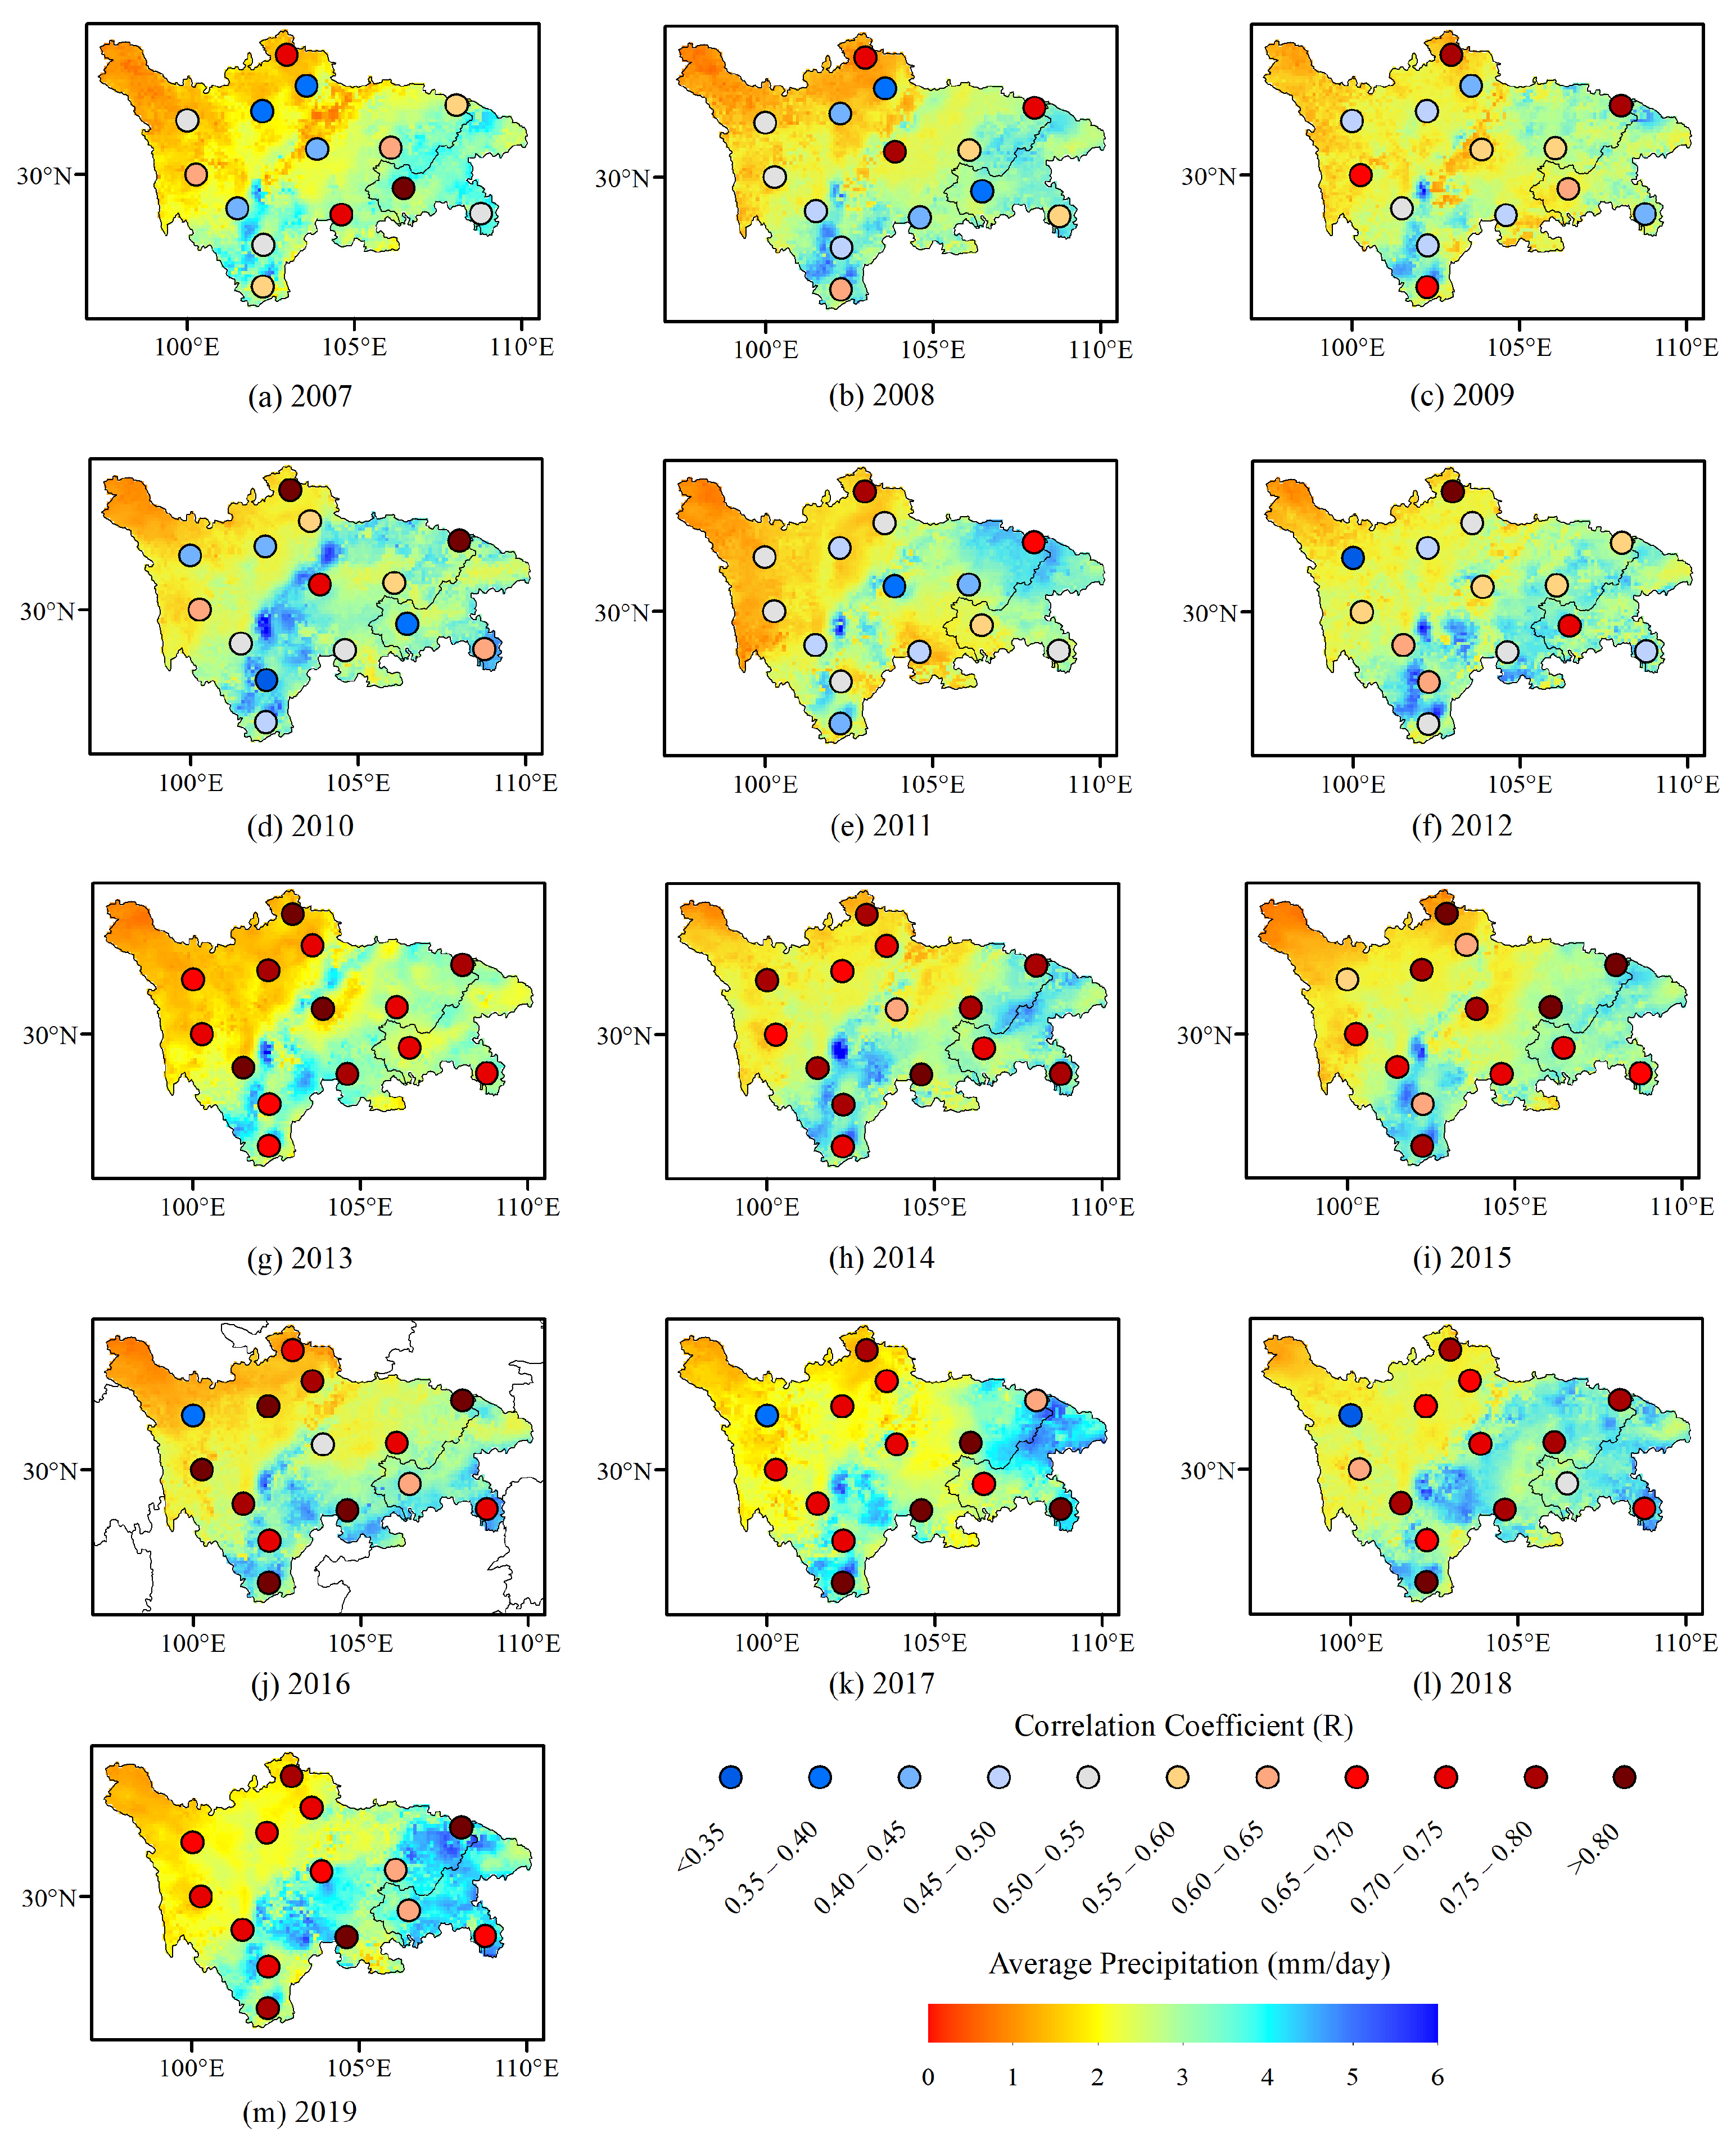
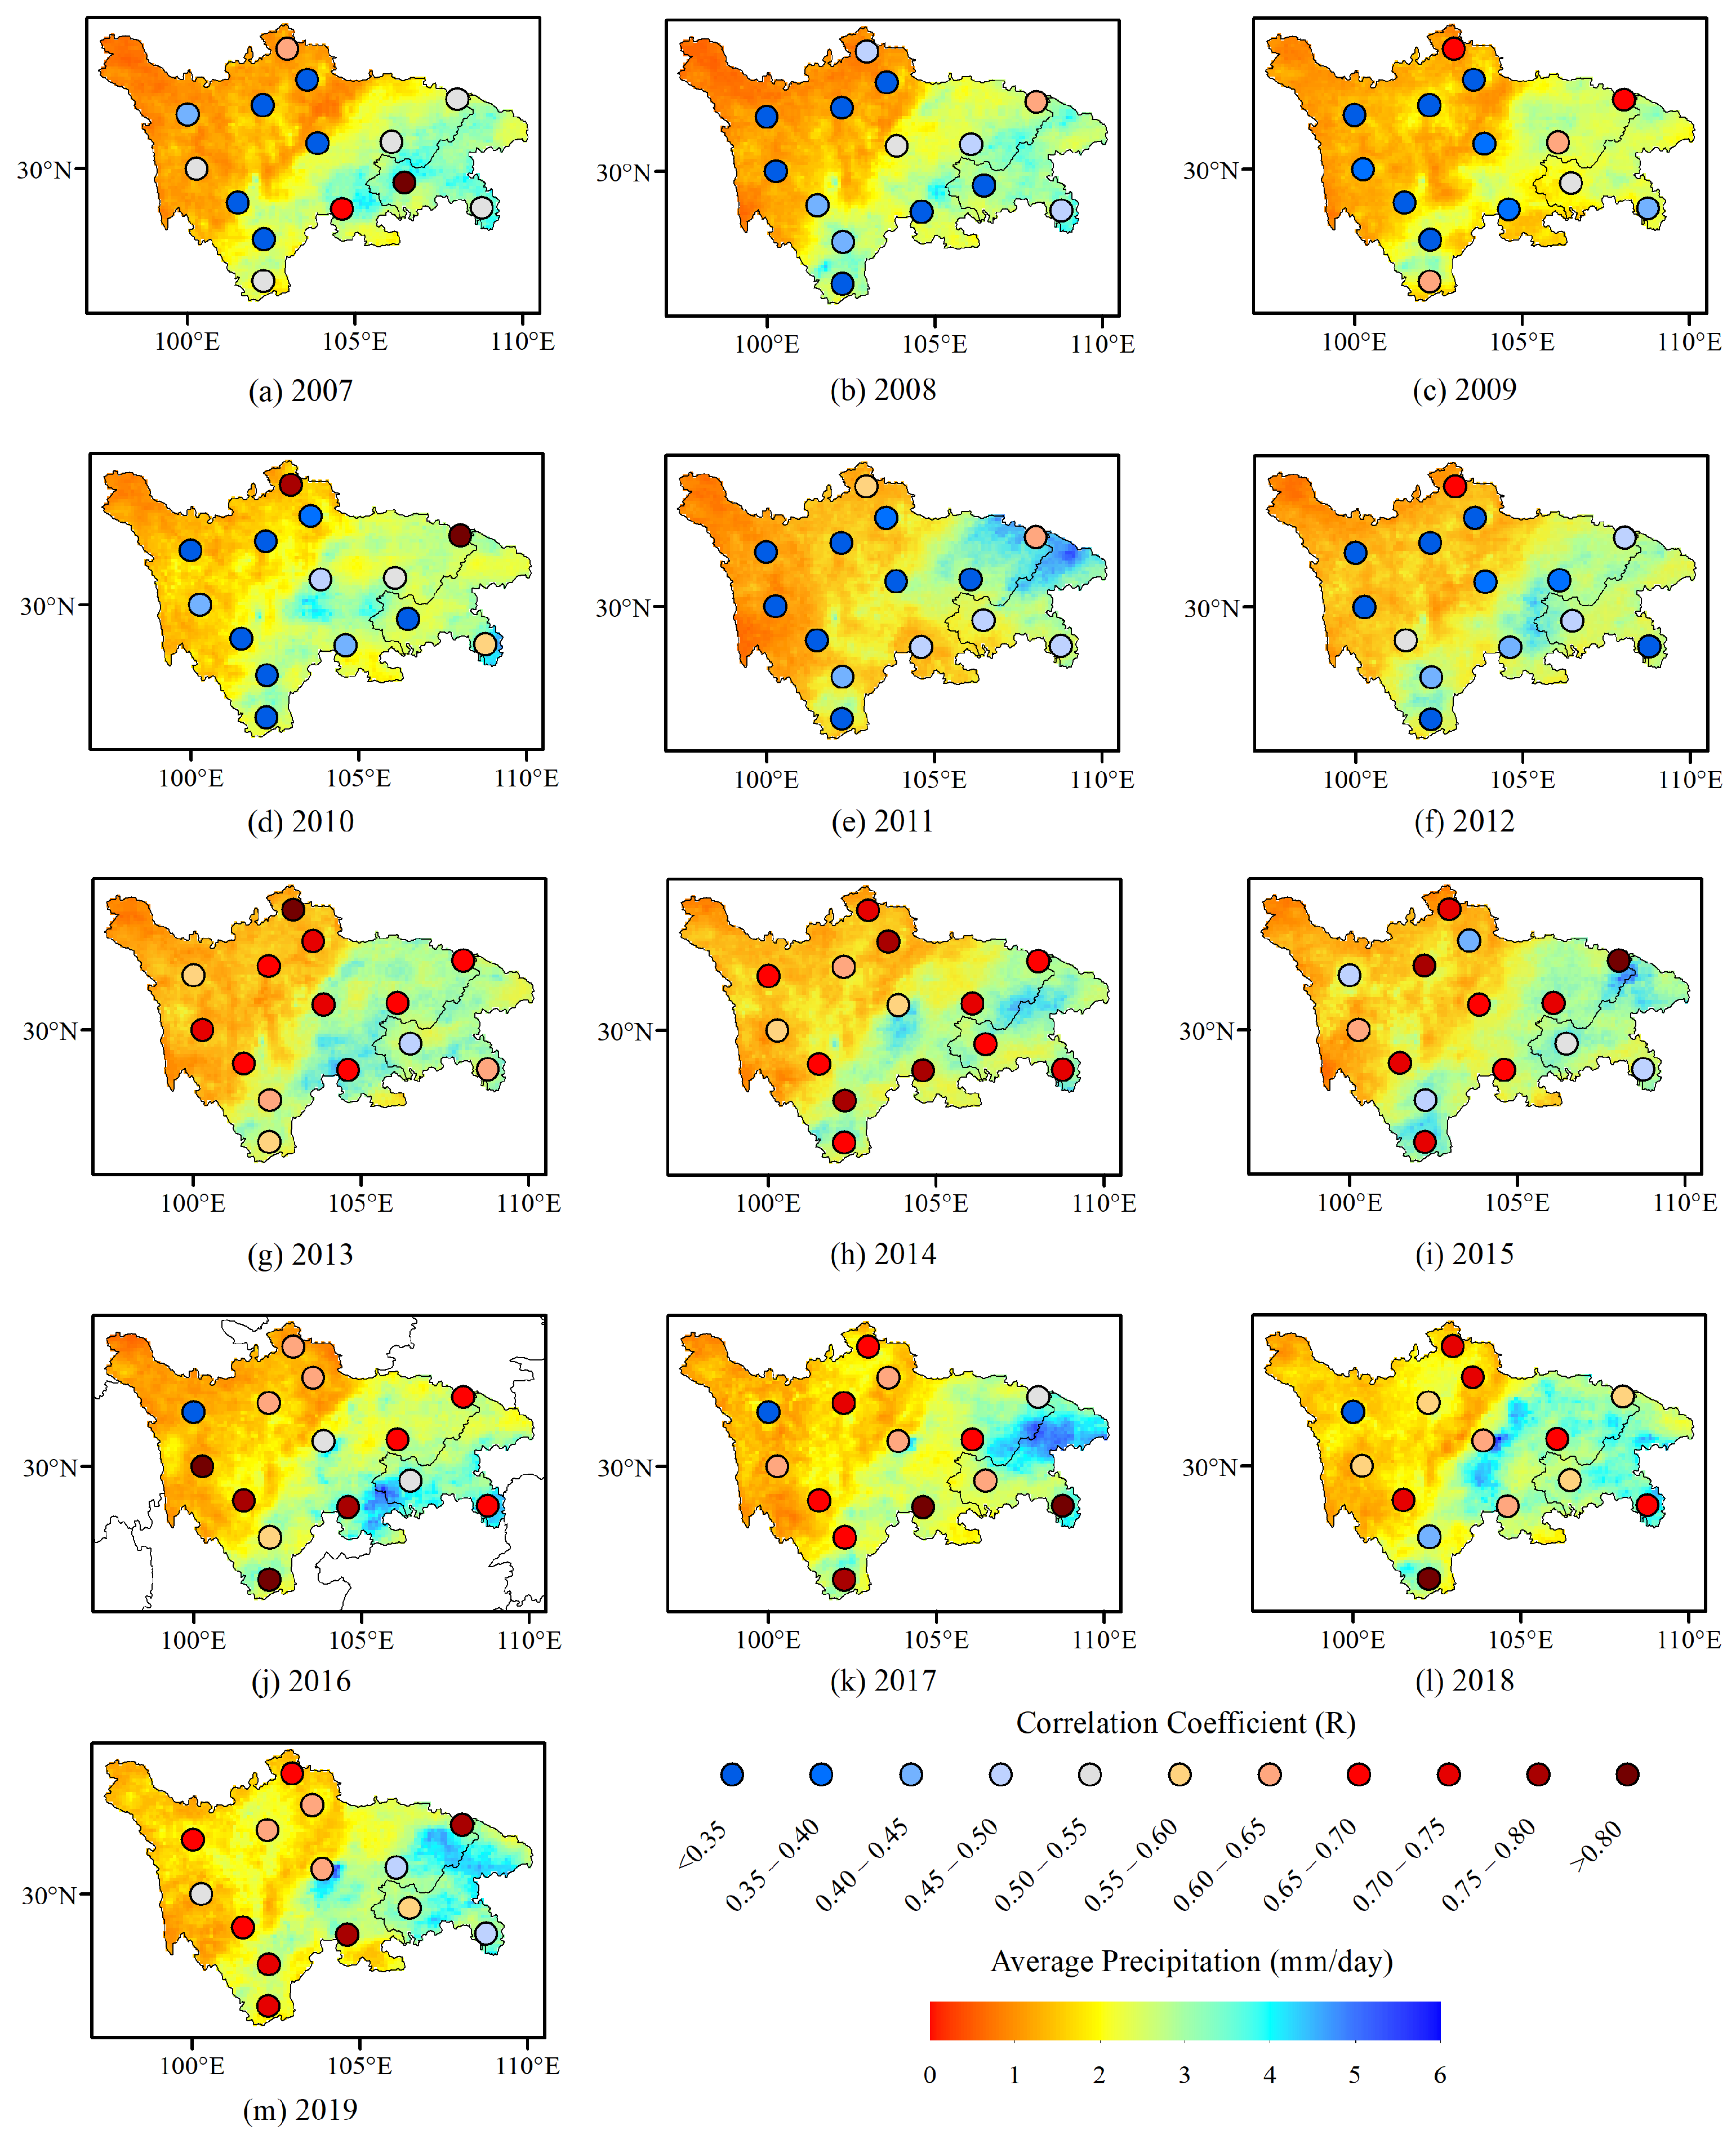
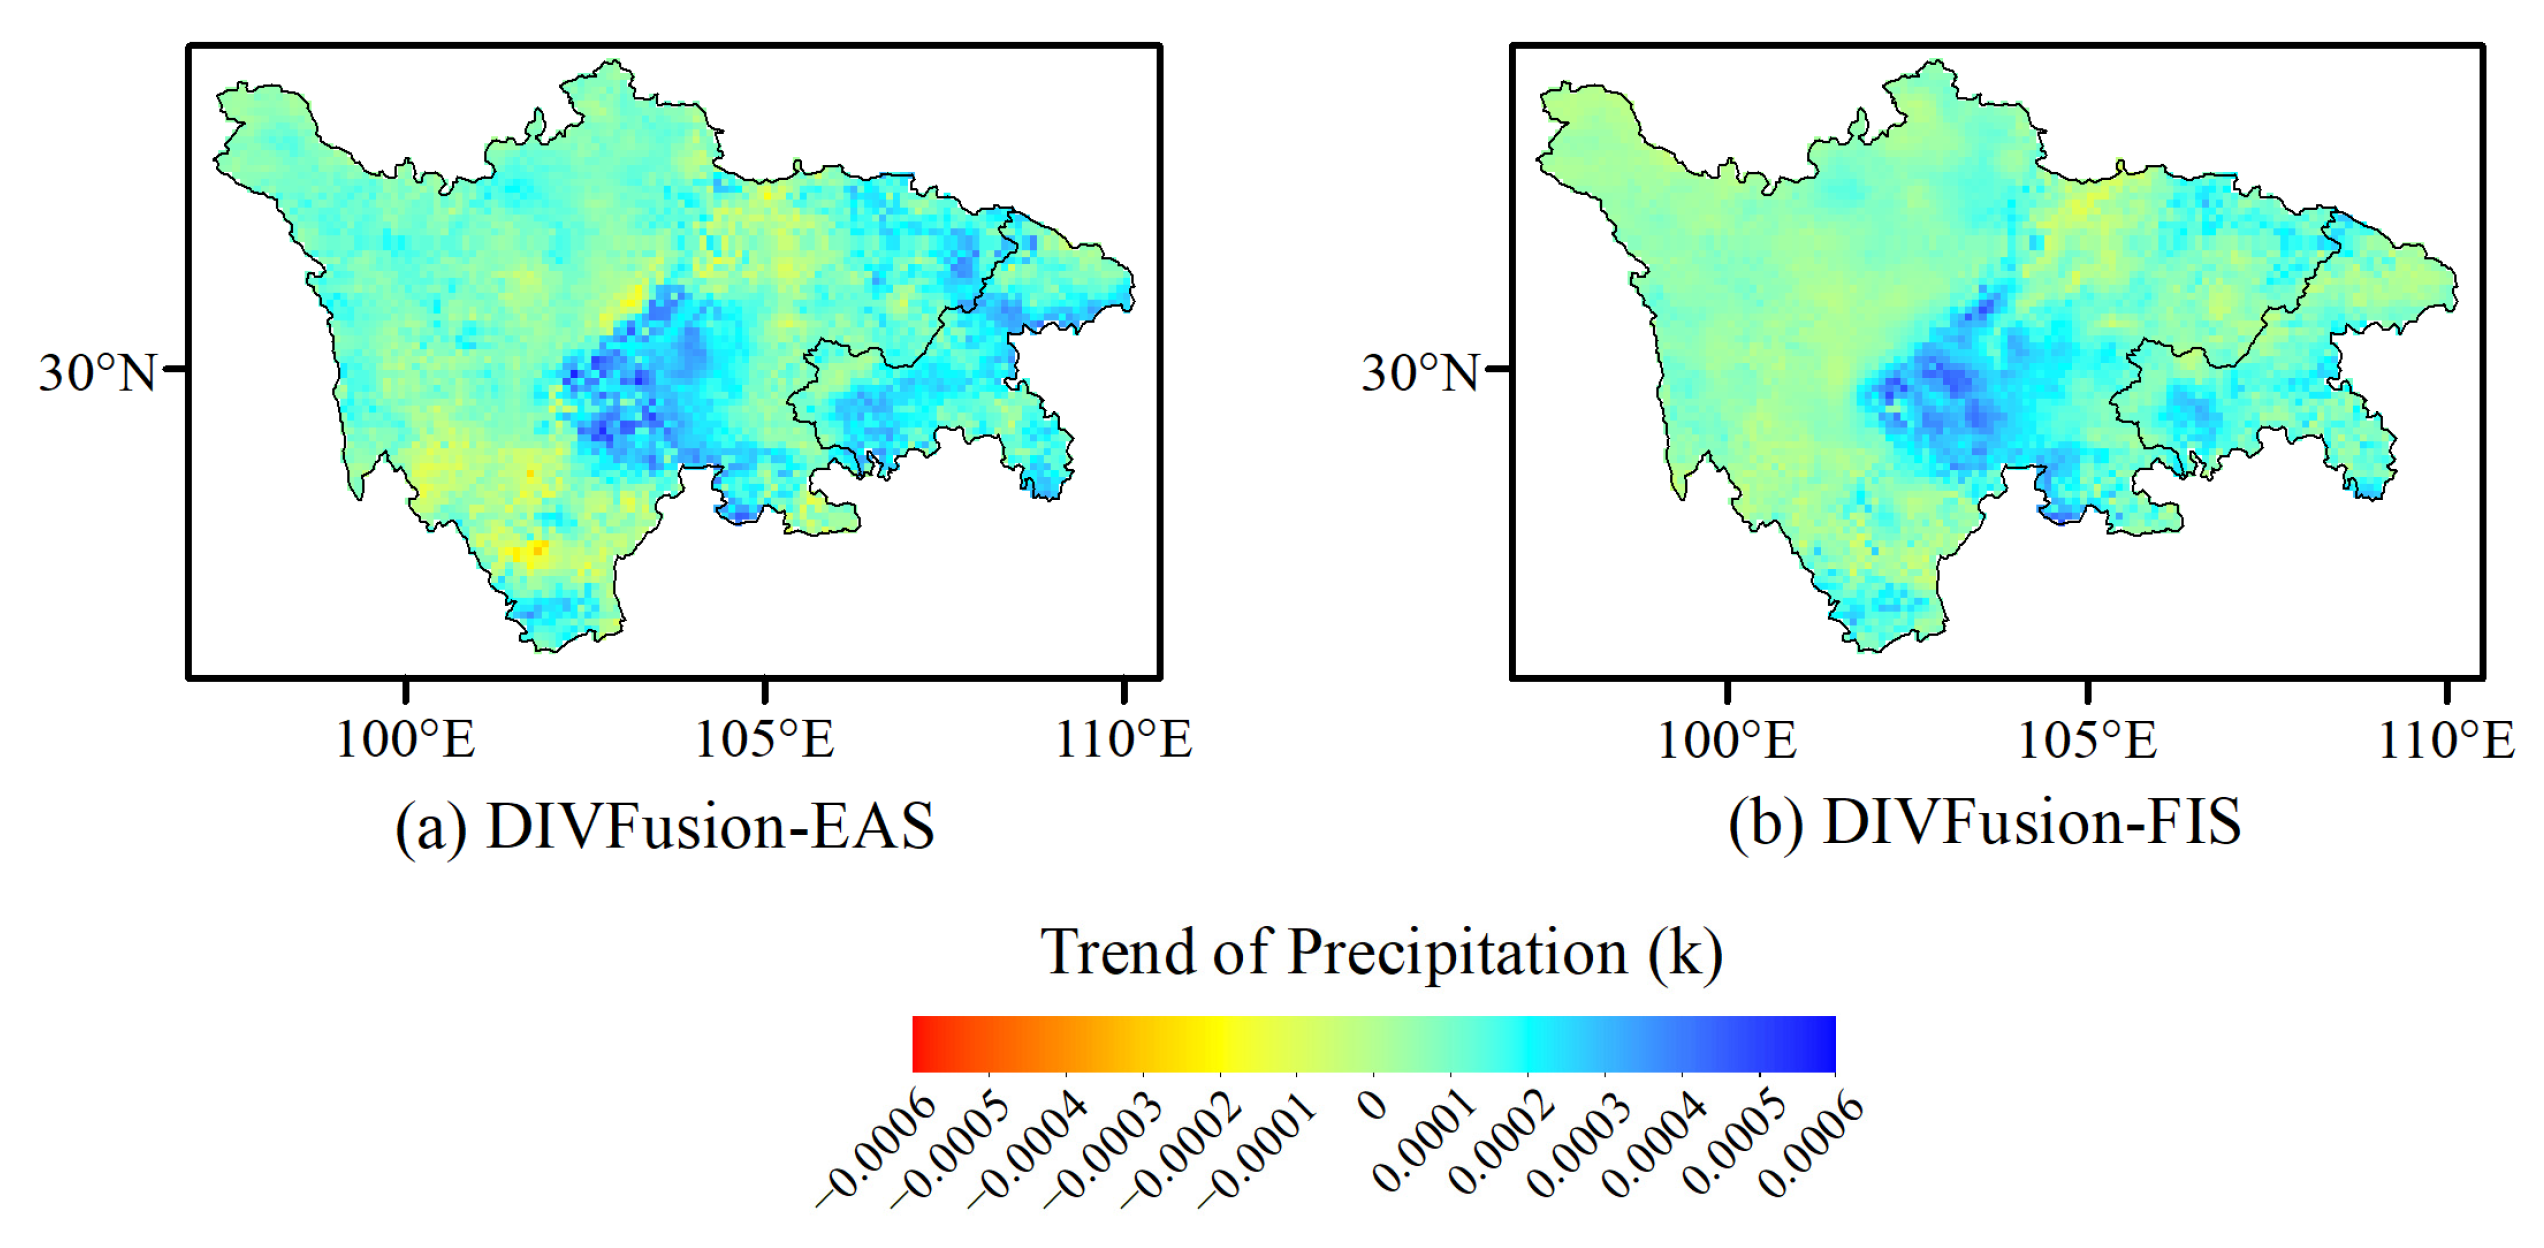
4.2. Trend of the Precipitation

The spatiotemporal evolution trend analysis is an important task for geophysical and environmental research [74,75,76]. Here, the trend of the precipitation over the Chuanyu region from 2007 to 2019 is calculated via a linear regression model based on the proposed IMDIV-EAS and IMDIV-FIS, respectively. Figure 22a,b show similar increasing trends for precipitation for the Chuanyu region. In detail, more than 85% of the area has an increasing trend for rainfall from 2007 to 2019. Moreover, it can be seen that the increasing trend locations are gathering at the central part of the Chuanyu region, where the altitude has a significant difference. This result is consistent with the pattern of precipitation in the Chuanyu region, which has been reported by related climate studies [77,78]. Furthermore, this proves the value of the proposed method as well as that of the fused products for providing accurate precipitation information, and they could be useful for other related climatology studies.

5. Conclusions

Producing precipitation products with a high quality for complex regions is an important mission within the remote sensing and climate community. The “top–down”- and “bottom–up”-based satellite precipitation products have shown unique advantages, and research on fusing these two products may achieve better precipitation products with an enhanced quality. In this paper, a novel precipitation data fusion approach based on the improved double instrumental variable is proposed. IMERG-Early, which is based on the top–down approach, and SM2RAIN, which is based on the bottom–up approach-, are fused into IMDIV-EAS, and the precipitation fusion performance without gauge station correction is explored. IMERG-Final and SM2RAIN are fused into IMDIV-FIS, and the precipitation fusion performance for the gauge-station-corrected condition is explored. Moreover, the fused products IMDIV-EAS and IMDIV-FIS are produced for an important study area—the Chuanyu region—which contains significant differences in altitude and climate. The original and fused products are evaluated using the gauge station records. The results show that the proposed IMDIV method outperforms the original DIV method for both uncorrected and gauge-station-corrected conditions. In the meantime, the fused products IMDIV-EAS and IMDIV-FIS both outperform the corresponding original products. In summary, the conclusions are as follows: (1) the proposed IMDIV-based precipitation data fusion approach can significantly improve the quality of precipitation data, with better correlation coefficients, RMSE, and bias compared to in situ measurement. The fused products from the IMDIV method have a better consistency compared to the in situ measurement, and they outperform the fused products from the original DIV method; (2) fusing precipitation data based on the top–down approach and bottom–up approach and based on the proposed IMDIV method is able to combine these two products advantages and produce accuracy-enhanced fused precipitation products. Specifically, the proposed method is able to achieve high-quality fused data production without gauge station correction; (3) the high-quality fused precipitation products IMDIV-EAS and IMDIV-FIS for the Chuanyu region from 2007 to 2019 at a daily temporal resolution and 0.1-degree spatial resolution were produced. These two products have added longitude and latitude information and are ready for public use.
Overall, the proposed IMDIV method can effectively produce precipitation products with an enhanced quality, combining the advantages of the satellite precipitation products based on “top–down” and “bottom–up” approaches.
With the rapid development of satellite-based retrieval products and reanalysis products, other climate products, such as those related to temperature, evaporation, snow, and soil moisture, can be fused to achieve a better data quality. The performance of the proposed method on fusing these geographical variables can be further tested. Moreover, other geographical regions with complex terrains and rich types of climate can be studied by the proposed method. These can be researched in the future.

Author Contributions

Conceptualization and methodology, Z.W.; research, resources, and data curation, Z.W. and S.L.; writing—original draft preparation, Z.W.; writing—review and editing, Z.W., S.L. and H.Y.; supervision, S.L. All authors have read and agreed to the published version of the manuscript.

Funding

This research was funded by the National Key Research and Development Program of China (grant numbers 2022YFD1900801 and 2022YFC3002802).

Data Availability Statement

The proposed fused products in this paper are available at https://doi.org/10.6084/m9.figshare.24104004, accessed on 8 September 2023. The code is available upon request to the corresponding authors.

Conflicts of Interest

The authors declare no conflict of interest.

References

  1. Bevacqua, E.; Zappa, G.; Lehner, F.; Zscheischler, J. Precipitation trends determine future occurrences of compound hot-dry events. Nat. Clim. Chang. 2022, 12, 350–355. [Google Scholar] [CrossRef]
  2. Koop, S.; Grison, C.; Eisenreich, S.; Hofman, J.; van Leeuwen, K. Integrated Water Resources Management in Cities in the World: Global Solutions. Sustain. Cities Soc. 2022, 86, 14. [Google Scholar] [CrossRef]
  3. Cui, Y.K.; Long, D.; Hong, Y.; Zeng, C.; Zhou, J.; Han, Z.Y.; Liu, R.H.; Wan, W. Validation and reconstruction of FY-3B/MWRI soil moisture using an artificial neural network based on reconstructed MODIS optical products over the Tibetan Plateau. J. Hydrol. 2016, 543, 242–254. [Google Scholar] [CrossRef]
  4. He, J.; Yang, K.; Tang, W.; Lu, H.; Qin, J.; Chen, Y.; Li, X. The first high-resolution meteorological forcing dataset for land process studies over China. Sci. Data 2020, 7, 25. [Google Scholar] [CrossRef] [PubMed]
  5. Li, S.E.; Kang, S.Z.; Zhang, L.; Ortega-Farias, S.; Li, F.S.; Du, T.S.; Tong, L.; Wang, S.F.; Ingman, M.; Guo, W.H. Measuring and modeling maize evapotranspiration under plastic film-mulching condition. J. Hydrol. 2013, 503, 153–168. [Google Scholar] [CrossRef]
  6. Qin, S.; Li, S.; Kang, S.; Du, T.; Tong, L.; Ding, R. Can the drip irrigation under film mulch reduce crop evapotranspiration and save water under the sufficient irrigation condition? Agric. Water Manag. 2016, 177, 128–137. [Google Scholar] [CrossRef]
  7. Zhao, P.; Li, S.; Li, F.; Du, T.; Tong, L.; Kang, S. Comparison of dual crop coefficient method and Shuttleworth–Wallace model in evapotranspiration partitioning in a vineyard of northwest China. Agric. Water Manag. 2015, 160, 41–56. [Google Scholar] [CrossRef]
  8. Balti, H.; Abbes, A.B.; Mellouli, N.; Farah, I.R.; Sang, Y.; Lamolle, M. A review of drought monitoring with big data: Issues, methods, challenges and research directions. Ecol. Inform. 2020, 60, 101136. [Google Scholar] [CrossRef]
  9. Li, S.; Kang, S.; Zhang, L.; Zhang, J.; Du, T.; Tong, L.; Ding, R. Evaluation of six potential evapotranspiration models for estimating crop potential and actual evapotranspiration in arid regions. J. Hydrol. 2016, 543, 450–461. [Google Scholar] [CrossRef]
  10. Cui, Y.; Jia, L. Estimation of evapotranspiration of “soil-vegetation” system with a scheme combining a dual-source model and satellite data assimilation. J. Hydrol. 2021, 603, 127145. [Google Scholar] [CrossRef]
  11. Chen, Y.; Yang, K.; He, J.; Qin, J.; Shi, J.; Du, J.; He, Q. Improving land surface temperature modeling for dry land of China. J. Geophys. Res. Atmos. 2011, 116, 15921. [Google Scholar] [CrossRef]
  12. Li, S.; Kang, S.; Li, F.; Zhang, L. Evapotranspiration and crop coefficient of spring maize with plastic mulch using eddy covariance in northwest China. Agric. Water Manag. 2008, 95, 1214–1222. [Google Scholar] [CrossRef]
  13. Shoyama, K.; Cui, Q.; Hanashima, M.; Sano, H.; Usuda, Y. Emergency flood detection using multiple information sources: Integrated analysis of natural hazard monitoring and social media data. Sci. Total Environ. 2020, 767, 144371. [Google Scholar] [CrossRef] [PubMed]
  14. Kang, S.; Hao, X.; Du, T.; Tong, L.; Su, X.; Lu, H.; Li, X.; Huo, Z.; Li, S.; Ding, R. Improving agricultural water productivity to ensure food security in China under changing environment: From research to practice. Agric. Water Manag. 2017, 179, 5–17. [Google Scholar] [CrossRef]
  15. Fan, Y.; Ding, R.; Kang, S.; Hao, X.; Du, T.; Tong, L.; Li, S. Plastic mulch decreases available energy and evapotranspiration and improves yield and water use efficiency in an irrigated maize cropland. Agric. Water Manag. 2017, 179, 122–131. [Google Scholar] [CrossRef]
  16. Qin, S.; Li, S.; Yang, K.; Hu, K. Can plastic mulch save water at night in irrigated croplands? J. Hydrol. 2018, 564, 667–681. [Google Scholar] [CrossRef]
  17. Marvel, K.; Cook, B.I.; Bonfils, C.J.W.; Durack, P.J.; Smerdon, J.E.; Williams, A.P. Twentieth-century hydroclimate changes consistent with human influence. Nat. Cell Biol. 2019, 569, 59–65. [Google Scholar] [CrossRef]
  18. Tabari, H. Climate change impact on flood and extreme precipitation increases with water availability. Sci. Rep. 2020, 10, 13768. [Google Scholar] [CrossRef]
  19. Ostad-Ali-Askari, K.; Ghorbanizadeh Kharazi, H.; Shayannejad, M.; Zareian, M.J. Effect of climate change on precipitation patterns in an arid region using GCM models: Case study of Isfahan-Borkhar Plain. Nat. Hazards Rev. 2020, 21, 04020006. [Google Scholar] [CrossRef]
  20. Cui, Y.; Chen, X.; Gao, J.; Yan, B.; Tang, G.; Hong, Y. Global water cycle and remote sensing big data: Overview, challenge, and opportunities. Big Earth Data 2018, 2, 282–297. [Google Scholar] [CrossRef]
  21. Yang, K.; He, J.; Tang, W.; Qin, J.; Cheng, C.C. On downward shortwave and longwave radiations over high altitude regions: Observation and modeling in the Tibetan Plateau. Agric. For. Meteorol. 2010, 150, 38–46. [Google Scholar] [CrossRef]
  22. Cui, Y.; Jia, L.; Fan, W. Estimation of actual evapotranspiration and its components in an irrigated area by integrating the Shuttleworth-Wallace and surface temperature-vegetation index schemes using the particle swarm optimization algorithm. Agric. For. Meteorol. 2021, 307, 108488. [Google Scholar] [CrossRef]
  23. Pepin, N.C.; Arnone, E.; Gobiet, A.; Haslinger, K.; Kotlarski, S.; Notarnicola, C.; Palazzi, E.; Seibert, P.; Serafin, S.; Schöner, W.; et al. Climate Changes and Their Elevational Patterns in the Mountains of the World. Rev. Geophys. 2022, 60, e2020RG000730. [Google Scholar] [CrossRef]
  24. Yang, K.; Wu, H.; Qin, J.; Lin, C.; Tang, W.; Chen, Y. Recent climate changes over the Tibetan Plateau and their impacts on energy and water cycle: A review. Glob. Planet. Chang. 2014, 112, 79–91. [Google Scholar] [CrossRef]
  25. Gilewski, P.; Nawalany, M. Inter-comparison of rain-gauge, radar, and satellite (IMERG GPM) precipitation estimates performance for rainfall-runoff modeling in a mountainous catchment in Poland. Water 2018, 10, 1665. [Google Scholar] [CrossRef]
  26. Li, S.; Zhang, L.; Kang, S.; Tong, L.; Du, T.; Hao, X.; Zhao, P. Comparison of several surface resistance models for estimating crop evapotranspiration over the entire growing season in arid regions. Agric. For. Meteorol. 2015, 208, 1–15. [Google Scholar] [CrossRef]
  27. Xie, W.; Yi, S.; Leng, C.; Xia, D.; Li, M.; Zhong, Z.; Ye, J. The evaluation of IMERG and ERA5-Land daily precipitation over China with considering the influence of gauge data bias. Sci. Rep. 2022, 12, 8085. [Google Scholar] [CrossRef]
  28. Moazami, S.; Najafi, M.R. A comprehensive evaluation of GPM-IMERG V06 and MRMS with hourly ground-based precipitation observations across Canada. J. Hydrol. 2021, 594, 125929. [Google Scholar] [CrossRef]
  29. Srivastava, A.; Grotjahn, R.; Ullrich, P.A. Evaluation of historical CMIP6 model simulations of extreme precipitation over contiguous US regions. Weather Clim. Extrem. 2020, 29, 100268. [Google Scholar] [CrossRef]
  30. Li, C.; Zwiers, F.; Zhang, X.B.; Li, G.L.; Sun, Y.; Wehner, M. Changes in Annual Extremes of Daily Temperature and Precipitation in CMIP6 Models. J. Clim. 2021, 34, 3441–3460. [Google Scholar] [CrossRef]
  31. Lai, C.G.; Zhong, R.D.; Wang, Z.L.; Wu, X.Q.; Chen, X.H.; Wang, P.; Lian, Y.Q. Monitoring hydrological drought using long-term satellite-based precipitation data. Sci. Total Environ. 2019, 649, 1198–1208. [Google Scholar] [CrossRef] [PubMed]
  32. Hsu, K.L.; Gao, X.G.; Sorooshian, S.; Gupta, H.V. Precipitation estimation from remotely sensed information using artificial neural networks. J. Appl. Meteorol. 1997, 36, 1176–1190. [Google Scholar] [CrossRef]
  33. Hong, Y.; Gochis, D.; Cheng, J.-T.; Hsu, K.-L.; Sorooshian, S. Evaluation of PERSIANN-CCS Rainfall Measurement Using the NAME Event Rain Gauge Network. J. Hydrometeorol. 2007, 8, 469–482. [Google Scholar] [CrossRef]
  34. Ashouri, H.; Hsu, K.-L.; Sorooshian, S.; Braithwaite, D.K.; Knapp, K.R.; Cecil, L.D.; Nelson, B.R.; Prat, O.P. PERSIANN-CDR: Daily precipitation climate data record from multisatellite observations for hydrological and climate studies. Bull. Am. Meteorol. Soc. 2015, 96, 69–83. [Google Scholar] [CrossRef]
  35. Sadeghi, M.; Nguyen, P.; Naeini, M.R.; Hsu, K.; Braithwaite, D.; Sorooshian, S. PERSIANN-CCS-CDR, a 3-hourly 0.04° global precipitation climate data record for heavy precipitation studies. Sci. Data 2021, 8, 157. [Google Scholar] [CrossRef] [PubMed]
  36. Funk, C.; Peterson, P.; Landsfeld, M.; Pedreros, D.; Verdin, J.; Shukla, S.; Husak, G.; Rowland, J.; Harrison, L.; Hoell, A.; et al. The climate hazards infrared precipitation with stations—A new environmental record for monitoring extremes. Sci. Data 2015, 2, 66. [Google Scholar] [CrossRef]
  37. Bowman, K.P.; Hong, Y.; Stocker, E.F.; Wol, D.B. The TRMM multi-satellite precipitation analysis: Quasi-global, multi-year, combined sensor precipitation estimates at fine scales. J. Hydrometeorol. 2007, 8, 28–55. [Google Scholar]
  38. Huffman, G.J.; Bolvin, D.T.; Braithwaite, D.; Hsu, K.; Joyce, R.; Xie, P.; Yoo, S. NASA Global Precipitation Measurement (GPM) Integrated Multi-Satellite Retrievals for GPM (IMERG); Algorithm Theoretical Basis Document (ATBD) Version 4.26; National Aeronautics and Space Administration: Washington, DC, USA, 2015; Volume 4, p. 26.
  39. Brocca, L.; Filippucci, P.; Hahn, S.; Ciabatta, L.; Massari, C.; Camici, S.; Schüller, L.; Bojkov, B.; Wagner, W. SM2RAIN-ASCAT (2007–2018): Global daily satellite rainfall from ASCAT soil moisture. Earth Syst. Sci. Data Discuss 2019, 11, 1583–1601. [Google Scholar] [CrossRef]
  40. Aonashi, K.; Awaka, J.; Hirose, M.; Kozu, T.; Kubota, T.; Liu, G.; Shige, S.; Kida, S.; Seto, S.; Takahashi, N.; et al. GSMaP Passive Microwave Precipitation Retrieval Algorithm: Algorithm Description and Validation. J. Meteorol. Soc. Jpn. 2009, 87A, 119–136. [Google Scholar] [CrossRef]
  41. Mazzoglio, P.; Laio, F.; Balbo, S.; Boccardo, P.; Disabato, F. Improving an extreme rainfall detection system with GPM IMERG data. Remote Sens. 2019, 11, 677. [Google Scholar] [CrossRef]
  42. Dahal, V.; Gautam, S.; Bhattarai, R. Analysis of the Long-term Precipitation Trend in Illinois and Its Implications for Agricultural Production. Water 2018, 10, 433. [Google Scholar] [CrossRef]
  43. Fan, Y.; Ma, Z.; Ma, Y.; Ma, W.; Xie, Z.; Ding, L.; Han, Y.; Hu, W.; Su, R. Respective Advantages of “Top-Down” Based GPM IMERG and “Bottom-Up” Based SM2RAIN-ASCAT Precipitation Products Over the Tibetan Plateau. J. Geophys. Res. Atmos. 2021, 126, 33946. [Google Scholar] [CrossRef]
  44. Tang, G.; Ma, Y.; Long, D.; Zhong, L.; Hong, Y. Evaluation of GPM Day-1 IMERG and TMPA Version-7 legacy products over Mainland China at multiple spatiotemporal scales. J. Hydrol. 2016, 533, 152–167. [Google Scholar] [CrossRef]
  45. Brocca, L.; Massari, C.; Ciabatta, L.; Moramarco, T.; Penna, D.; Zuecco, G.; Pianezzola, L.; Borga, M.; Matgen, P.; Martínez-Fernández, J. Rainfall estimation from in situ soil moisture observations at several sites in Europe: An evaluation of SM2RAIN algorithm. J. Hydrol. Hydromech. 2015, 63, 201–209. [Google Scholar] [CrossRef]
  46. Liu, C.Y.; Aryastana, P.; Liu, G.R.; Huang, W.R. Assessment of satellite precipitation product estimates over Bali Island. Atmos. Res. 2020, 244, 105032. [Google Scholar] [CrossRef]
  47. Yumnam, K.; Kumar Guntu, R.; Rathinasamy, M.; Agarwal, A. Quantile-based Bayesian Model Averaging approach towards merging of precipitation products. J. Hydrol. 2022, 604, 127206. [Google Scholar] [CrossRef]
  48. Dong, J.; Lei, F.; Wei, L. Triple Collocation Based Multi-Source Precipitation Merging. Front. Water 2020, 2, 1. [Google Scholar] [CrossRef]
  49. Tang, G.; Clark, M.P.; Papalexiou, S.M.; Ma, Z.; Hong, Y. Have satellite precipitation products improved over last two decades? A comprehensive comparison of GPM IMERG with nine satellite and reanalysis datasets. Remote Sens. Environ. 2020, 240, 111697. [Google Scholar] [CrossRef]
  50. Wu, X.; Zhu, J.; Lai, C. Assessment and Data Fusion of Satellite-Based Precipitation Estimation Products over Ungauged Areas Based on Triple Collocation without In Situ Observations. Remote Sens. 2023, 15, 4210. [Google Scholar] [CrossRef]
  51. Chen, C.; He, M.; Chen, Q.; Zhang, J.; Li, Z.; Wang, Z.; Duan, Z. Triple collocation-based error estimation and data fusion of global gridded precipitation products over the Yangtze River basin. J. Hydrol. 2022, 605, 127307. [Google Scholar] [CrossRef]
  52. Yang, S.; Zeng, J.; Fan, W.; Cui, Y. Evaluating Root-zone Soil Moisture Products from GLEAM, GLDAS, and ERA5 based on in Situ ObServations and Triple Collocation Method Over the Tibetan Plateau. J. Hydrometeorol. 2022, 23, 1861–1878. [Google Scholar] [CrossRef]
  53. Gai, Y.; Long, X.; Wei, Z.; Sui, X.; Jiang, B.; Chen, X.; Yu, D.; Qin, S.; Cui, Y. Toward a better understanding of uncertainty for satellite precipitation products over complex terrain with sparse rain gauge data. Atmos. Res. 2020, 244, 106742. [Google Scholar] [CrossRef]
  54. Dong, J.; Crow, W.T.; Duan, Z.; Wei, L.; Lu, Y. A double instrumental variable method for geophysical product error estimation. Remote Sens. Environ. 2019, 225, 217–228. [Google Scholar] [CrossRef]
  55. Wei, Z.; Long, X.; Gai, Y.; Yang, Z.; Sui, X.; Chen, X.; Kan, G. Evaluating Remote Sensing Precipitation Products Using Double Instrumental Variable Method. IEEE Geosci. Remote Sens. Lett. 2022, 19, 1–5. [Google Scholar] [CrossRef]
  56. Derin, Y.; Anagnostou, E.; Berne, A.; Borga, M.; Boudevillain, B.; Buytaert, W.; Chang, C.-H.; Delrieu, G.; Hong, Y.; Chia Hsu, Y.; et al. Multiregional satellite precipitation products evaluation over complex terrain. J. Hydrometeorol. 2016, 17, 1817–1836. [Google Scholar] [CrossRef]
  57. Derin, Y.; Anagnostou, E.; Berne, A.; Borga, M.; Boudevillain, B.; Buytaert, W.; Chang, C.-H.; Chen, H.; Delrieu, G.; Hsu, Y.C. Evaluation of GPM-era Global Satellite Precipitation Products over Multiple Complex Terrain Regions. Remote Sens. 2019, 11, 2936. [Google Scholar] [CrossRef]
  58. Qin, J.; Yang, K.; Liang, S.; Guo, X. The altitudinal dependence of recent rapid warming over the Tibetan Plateau. Clim. Chang. 2009, 97, 321. [Google Scholar] [CrossRef]
  59. Qin, S.; Li, S.; Yang, K.; Zhang, K.; Zhang, L.; Cheng, L.; Liu, P.; She, D. A method for estimating surface albedo and its components for partial plastic mulched croplands. J. Hydrometeorol. 2023, 24, 1069–1086. [Google Scholar] [CrossRef]
  60. Yu, H.; Li, S.; Yang, T.; Wang, Y. Water use efficiency and its drivers of two typical cash crops in an arid area of Northwest China. Agric. Water Manag. 2023, 287, 108433. [Google Scholar] [CrossRef]
  61. Lin, Z.-H.; Yu, Z.; Zhang, H.; Wu, C.-L. Quantifying the attribution of model bias in simulating summer hot days in China with IAP AGCM 4.1. Atmos. Ocean. Sci. 2016, 9, 436–442. [Google Scholar] [CrossRef]
  62. Zhong, L.; Yang, R.; Chen, L.; Wen, Y.; Li, R.; Tang, G.; Hong, Y. Combined space and ground radars for improving quantitative precipitation estimations in the eastern downstream region of the Tibetan plateau. Part I: Variability in the vertical structure of precipitation in ChuanYu analyzed from long-term Spaceborne observations by TRMM PR. J. Appl. Meteorol. Climatol. 2017, 56, 2259–2274. [Google Scholar]
  63. Hu, L.; Huang, G.; Hu, K. The performance of multiple datasets in characterizing the changes of extreme air temperature over China during 1979 to 2012. Theor. Appl. Climatol. 2018, 133, 619–632. [Google Scholar] [CrossRef]
  64. Yang, F.; He, F.; Li, S.; Li, M. Exploring Spatiotemporal Pattern of Grassland Cover in Western China from 1661 to 1996. Int. J. Environ. Res. Public Health 2019, 16, 3160. [Google Scholar] [CrossRef] [PubMed]
  65. Menne, M.J.; Durre, I.; Vose, R.S.; Gleason, B.E.; Houston, T.G. An overview of the Global Historical Climatology Network-Daily Database. J. Atmos. Ocean. Technol. 2012, 29, 897–910. [Google Scholar] [CrossRef]
  66. Xiang, B.; Zeng, C.; Dong, X.; Wang, J. The Application of a Decision Tree and Stochastic Forest Model in Summer Precipitation Prediction in Chongqing. Atmosphere 2020, 11, 508. [Google Scholar] [CrossRef]
  67. Wang, S.J.; Jiao, S.T.; Xin, H.J. Spatio-temporal Characteristics of Temperature and Precipitation in Sichuan Province, Southwestern China in Recent Five Decades. Quat. Int. 2013, 286, 103–115. [Google Scholar] [CrossRef]
  68. Liu, C.; Yang, C.; Yang, Q.; Wang, J. Spatiotemporal Drought Analysis by the Standardized Precipitation Index (SPI) and Standardized Precipitation Evapotranspiration Index (SPEI) in Sichuan Province, China. Sci. Rep. 2021, 11, 1280. [Google Scholar] [CrossRef]
  69. Duan, Z.; Ren, Y.; Liu, X.; Lei, H.; Hua, X.; Shu, X.; Zhou, L. A comprehensive comparison of data fusion approaches to multi-source precipitation observations: A case study in Sichuan province, China. Environ. Monit. Assess. 2022, 194, 422. [Google Scholar] [CrossRef]
  70. Hamza, A.; Anjum, M.N.; Masud Cheema, M.J.; Chen, X.; Afzal, A.; Azam, M.; Kamran Shafi, M.; Gulakhmadov, A. Assessment of IMERG-V06, TRMM-3B42V7, SM2RAIN-ASCAT, and PERSIANN-CDR Precipitation Products over the Hindu Kush Mountains of Pakistan, South Asia. Remote Sens. 2020, 12, 3871. [Google Scholar] [CrossRef]
  71. Nazeer, A.; Maskey, S.; Skaugen, T.; McClain, M.E. Simulating the hydrological regime of the snow fed and glaciarised Gilgit Basin in the Upper Indus using global precipitation products and a data parsimonious precipitation-runoff model. Sci. Total Environ. 2021, 802, 149872. [Google Scholar] [CrossRef]
  72. Jasmine, M.K.; Aloysius, M.; Jayaprakash, R.; Fathima, C.P.; Prijith, S.S.; Mohan, M. Investigation on the role of aerosols on precipitation enhancement over Kerala during August 2018. Atmos. Environ. 2022, 279, 119101. [Google Scholar] [CrossRef]
  73. Lei, H.; Zhao, H.; Ao, T. Ground Validation and Error Decomposition for Six State-of-the-Art Satellite Precipitation Products over Mainland China. Atmos. Res. 2022, 269, 106017. [Google Scholar] [CrossRef]
  74. Alnaimy, M.A.; Elrys, A.S.; Zelenakova, M.; Pietrucha-Urbanik, K.; Merwad, A.-R.M. The Vital Roles of Parent Material in Driving Soil Substrates and Heavy Metals Availability in Arid Alkaline Regions: A Case Study from Egypt. Water 2023, 15, 2481. [Google Scholar] [CrossRef]
  75. Cui, M.; Zheng, X.; Li, Y.; Wang, Y. Analysis of NDVI Trends and Driving Factors in the Buffer Zone of the Aral Sea. Water 2023, 15, 2473. [Google Scholar] [CrossRef]
  76. Li, X.; Wu, P. Contribution of Evaporation to Precipitation Changes in the Yangtze River Basin—Precipitation Recycling. Water 2023, 15, 2407. [Google Scholar] [CrossRef]
  77. Ding, B.; Yang, K.; Qin, J.; Wang, L.; Chen, Y.; He, X. The dependence of precipitation types on surface elevation and meteorological conditions and its parameterization. J. Hydrol. 2014, 513, 154–163. [Google Scholar] [CrossRef]
  78. Gao, J.; Bian, H.Y.; Zhu, C.J.; Tang, S. The response of key ecosystem services to land use and climate change in Chongqing, Time, space, and altitude. J. Geogr. Sci. 2022, 32, 317–339. [Google Scholar] [CrossRef]
Figure 1. Location of the study area. The gauge stations within the study area are marked with Station ID from 1 to 14.
Water 15 03390 g001
Figure 2. Pipeline of proposed improved double instrumental variable (IMDIV)-based precipitation data fusion approach.
Water 15 03390 g002
Figure 3. Correlation coefficients of IMDIV-EAS, IMDIV-FIS, DIV-EAS, DIV-FIS, IMERG-Early, SM2RAIN, and IMERG-Final toward gauge station records in the Chuanyu region from 2007 to 2019.
Water 15 03390 g003
Figure 4. Scatter plots between the gauge data and (a) IMDIV-EAS, (b) IMDIV-FIS, (c) IMERG-Early, (d) DIV-EAS, (e) DIV-FIS, (f) SM2RAIN, and (g) IMERG-Final in the Chuanyu region from 2007 to 2019.
Water 15 03390 g004
Figure 5. Bias from IMDIV-EAS toward (a) IMERG-Early and (b) SM2RAIN; from IMDIV-FIS toward (c) IMERG-Final and (d) SM2RAIN; from DIV-EAS toward (e) IMERG-Early and (f) SM2RAIN; and from DIV-FIS toward (g) IMERG-Final and (h) SM2RAIN, from 2007 to 2019.
Water 15 03390 g005
Figure 6. Offset of IMDIV on EAS fusion task for 2007 to 2019.
Water 15 03390 g006
Figure 7. Offset of IMDIV on FIS fusion task for 2007 to 2019.
Water 15 03390 g007
Figure 8. Average estimate error σ x and σ y from 2007 to 2019 in IMDIV for EAS fusion task of (a) IMERG-Early and (b) SM2RAIN and that for FIS fusion task of (c) IMERG-Early and (d) SM2RAIN; average estimate error σ x and σ y from 2007 to 2019 in DIV for EAS fusion task of (e) IMERG-Early and (f) SM2RAIN and that for FIS fusion task of (g) IMERG-Early and (h) SM2RAIN.
Water 15 03390 g008
Figure 9. Average fusion weight m and n from 2007 to 2019 in IMDIV for EAS fusion task of (a) IMERG-Early and (b) SM2RAIN and that for FIS fusion task of (c) IMERG-Early and (d) SM2RAIN; average fusion weight m and n from 2007 to 2019 in DIV for EAS fusion task of (e) IMERG-Early and (f) SM2RAIN and that for FIS fusion task of (g) IMERG-Early and (h) SM2RAIN.
Water 15 03390 g009
Figure 10. Fusion weight m for IMERG-Early in proposed IMDIV method on EAS fusion task.
Water 15 03390 g010
Figure 11. Fusion weight m for IMERG-Final in proposed IMDIV method on FIS fusion task.
Water 15 03390 g011
Figure 12. Fusion weight m for IMERG-Early in original DIV method on EAS fusion task.
Water 15 03390 g012
Figure 13. Fusion weight m for IMERG-Final in original DIV method on FIS fusion task.
Water 15 03390 g013
Figure 14. Correlation coefficients of (a) IMDIV-EAS, (b) IMDIV-FIS, (c) IMERG-Early, (d) SM2RAIN, and (e) IMERG-Final for each gauge station in the Chuanyu region from 2007 to 2019.
Water 15 03390 g014
Figure 15. RMSE of (a) IMDIV-EAS, (b) IMDIV-FIS, (c) IMERG-Early, (d) SM2RAIN, and (e) IMERG-Final for each gauge station in the Chuanyu region for 2007–2019.
Water 15 03390 g015
Figure 16. Correlation coefficients of IMDIV-EAS in the Chuanyu region for 2007–2019.
Water 15 03390 g016
Figure 17. Correlation coefficients of IMDIV-FIS in the Chuanyu region for 2007–2019.
Water 15 03390 g017
Figure 18. Correlation coefficients of IMERG-Early in the Chuanyu region for 2007–2019.
Water 15 03390 g018
Figure 19. Correlation coefficients of SM2RAIN in the Chuanyu region from 2007–2019.
Water 15 03390 g019
Figure 20. Correlation coefficients of IMERG-Final in the Chuanyu region from 2007–2019.
Water 15 03390 g020
Figure 21. The correlation coefficients of fused and original products at different altitudes.
Water 15 03390 g021
Figure 22. Trend of the precipitation in the Chuanyu region for 2007–2019 based on (a) IMDIV-EAS data and (b) IMDIV-FIS data.
Water 15 03390 g022
Table 1. List of gauge stations from the GHCNd in the Chuanyu region, China.
Station IDLongitude (°N)Latitude (°E)Elevation
1100.00931.6173365
2100.26730.0023942
3101.50129.0123325
4102.23331.9132745
5102.97333.5663495
6103.55132.6592978
7102.25427.8971551
8102.24726.6691787
9103.86130.759543
10104.60528.812316
11106.08430.798280
12108.03232.078989
13106.46029.586200
14108.76728.858793
Table 2. The correlation coefficient of IMDIV-based fused products and original products on different gauge stations from 2007–2019.
Station IDIMDIV-EASIMDIV-FISIMERG-EarlySM2RAINIMERG-Final
10.4020.4130.3460.3670.404
20.6120.6170.5140.5650.569
30.5800.5910.5440.4630.587
40.5390.5560.4830.4810.507
50.7490.7610.6770.6010.707
60.5260.5670.4520.4840.519
70.5420.5650.4940.5100.523
80.6140.6310.5890.5320.605
90.5990.5960.5570.5560.594
100.6200.6400.6170.5420.627
110.5770.6020.5690.5550.588
120.6810.7180.6360.5570.684
130.5760.6110.5700.5300.605
140.6170.6370.5810.5090.605
Disclaimer/Publisher’s Note: The statements, opinions and data contained in all publications are solely those of the individual author(s) and contributor(s) and not of MDPI and/or the editor(s). MDPI and/or the editor(s) disclaim responsibility for any injury to people or property resulting from any ideas, methods, instructions or products referred to in the content.

