Article

Quantitative Analysis of the Uncertainty of Drought Process Simulation Based on Atmospheric–Hydrological Coupling in Different Climate Zones

1
Shanghai Investigation, Design & Research Institute, Co., Ltd., Shanghai 200335, China
2
College of Hydrology and Water Resources, Hohai University, Nanjing 210098, China
*
Author to whom correspondence should be addressed.
Water 2023, 15(18), 3286; https://doi.org/10.3390/w15183286
Submission received: 10 August 2023 / Revised: 3 September 2023 / Accepted: 11 September 2023 / Published: 18 September 2023
(This article belongs to the Special Issue Assessment of Extreme Meteorological and Hydrological Events)

Abstract

:
Droughts can lead to drought disasters, which have become one of the main natural disasters affecting the development of social economies and ecological environments around the world. Timely and effective drought process simulation and prediction based on atmospheric–hydrological coupling is crucial for drought prevention and resistance. The initial condition (IC) is one source causing uncertainty in drought process simulation and prediction, and the impacts are different with drought duration, basin size and region. Therefore, a quantitative method that measures the uncertainty caused by ICs on the drought process simulation in different climate zones is proposed in this study. In this study, the VIC (Variable Infiltration Capacity) model at a resolution of 0.05°, which is proven as an ideal model to reflect drought processes, was used as the hydrological model to obtain soil moisture. By analyzing the Soil Moisture Anomaly Percentage Index (SMAPI) error characteristics that were simulated based on different ICs, an uncertainty index for drought process simulation was constructed in different climate zones. It was found that with the development of a drought process, the uncertainty converges, and it decreases to within 10% after a drought occurs for 5 to 6 months, while it is less than 5% in the particular basin in a humid region. In climate transition zones, both the uncertainty and its decrease rate are greater than those in humid regions. Climate characteristics, as well as soil types and vegetation types, are fundamental factors that cause differences in drought process simulation and uncertainty changes. The precipitation and temperature distribution more obviously vary spatially and temporally, a greater uncertainty is caused by ICs. This quantitative method reveals the impact of ICs on drought process simulation in different climate regions and provides a basis for the further improvement of drought simulation and prediction based on atmospheric–hydrological coupling.

1. Introduction

In recent years, droughts have become major global environmental and climate issues. According to statistics, meteorological disasters account for about 70% of global natural disasters, with drought-induced disasters accounting for about half of those meteorological disasters. The sixth assessment report of the Intergovernmental Panel on Climate Change (IPCC) [1] shows that the faster warming of the climate can change the precipitation pattern and structure, as well as the evapotranspiration in inland areas, thus changing the water cycle process, causing changes in surface runoff [2,3] and leading to more frequent extreme floods and droughts [4,5,6,7].
In China, due to the highly uneven spatiotemporal distribution of precipitation and the shortage of water resources, droughts occur frequently and have a wide impact nationwide. In the background of climate change, the frequency of large-scale and long-term drought events in China is on the rise, and the intensity of droughts has also increased significantly [8,9]. The induced drought disaster has a very serious impact on the social economy, especially on agricultural production [8,10,11,12,13]. The timely detection of droughts and the real-time monitoring of drought development trends are crucial in drought prevention and resistance.
The basic cause of a drought is a period of months to years of reduced precipitation and/or enhanced evapotranspiration, triggering a sustained and regionally extensive occurrence of below-average water availability. Droughts are complex and typically slowly evolving phenomena, with the beginning and ending times difficult to accurately identify [14,15,16]; thus, it is hard to define a drought’s intensity and severity. The method of atmospheric–hydrological coupling can realize the simulation and prediction of hydrological processes so as to realize drought simulation and prediction, which has become a state-of-the-art method around the world [17,18,19,20,21,22,23,24,25,26,27]. The distributed models are more suitable for drought simulation and prediction [28]. However, the existence of several sources of uncertainty, such as model parameterization and calibration [25,29,30,31,32], initial conditions (ICs) [21,33], meteorological forcings [34,35,36], model structure [37] and a combination of the above makes drought monitoring and prediction a challenging process [38,39,40].
Among those uncertainty sources, a lot of research has been focused on the impact of ICs on atmospheric–hydrological coupling in drought simulation and prediction. The ICs represent the initial surface hydrological state, including snow cover, soil moisture content or water stored in groundwater, which controls the simulated runoff or soil moisture, and then helps to improve simulation and forecasting skills [21,41]. In terms of soil moisture, due to its memory ability, Koster et al. [42] pointed out that it has a significant impact on large-scale prediction systems for dry–wet transition regions. Typically, drought predictions using different hydrological variables, such as meteorological-driven data and ICs, are used to evaluate the impact of meteorological forcings and ICs on seasonal drought prediction capabilities [21,43,44,45,46,47,48,49]. In order to investigate the impact of ICs on drought prediction, perfect meteorological forcings and the collection of different ICs, called reverse-ESP (Ensemble Streamflow Prediction), are used to drive the hydrological model to obtain the collection of hydrological outputs so as to evaluate the impact of the uncertainty of ICs on the drought prediction results [44], and it was shown that the sources of predictability from ICs depend on the region, season, lead time and basin size [50]. The method was first used by Wood et al. [44], and they pointed out in northern California that ICs yield streamflow prediction skills for up to 5 months during the transition between the wet and dry seasons, while in southern Colorado, IC knowledge outweighs the climate prediction skill for shorter periods due to a more uniform precipitation regime. The research conducted by Li et al. [43] in Ohio and the Southeastern United States shows that the impact of ICs on the seasonal streamflow forecast is short (about one month), and the larger the basin, the more obvious the ICs’ impact. As for the Yellow River Basin in China, the impact of ICs plays a leading role in the streamflow predictability for up to 2–5 months during cold and dry seasons, while for the streamflow initialized at the end of the rainy season, the ICs’ influences for lower reaches can be 5 months longer than those for the upper reaches [21]. Staudinger and Seibert [41] extended the construction to include model parameter uncertainty in a study of 21 Swiss catchments’ low flow and found the persistence of ICs ranging from 2 months to at least a year. Wood et al. extended the approach to characterize the influence of ICs of varying uncertainty levels on streamflow prediction uncertainty in 424 watersheds and emphasized the importance of ICs in streamflow prediction [51].
Previous research mostly focused on how long ICs impact streamflow prediction and during what period ICs play leading roles in streamflow prediction, but focused less on soil moisture, which can be also used to reflect drought, so this study extends the impact assessment of ICs on streamflow toward a quantitative investigation into how ICs affect drought processes identified based on soil moisture and the influence differences in different basins situated in different climate zones. It is important to note that this extension enables calculating the uncertainty in the drought process caused by ICs. The practical goal of this approach is to provide a more robust insight into the importance of ICs and a quantitative insight into the potential benefits of ICs in future drought simulation as well as drought prediction; therefore, in this study, drought simulation is the focus instead of drought prediction.

2. Data and Methodology
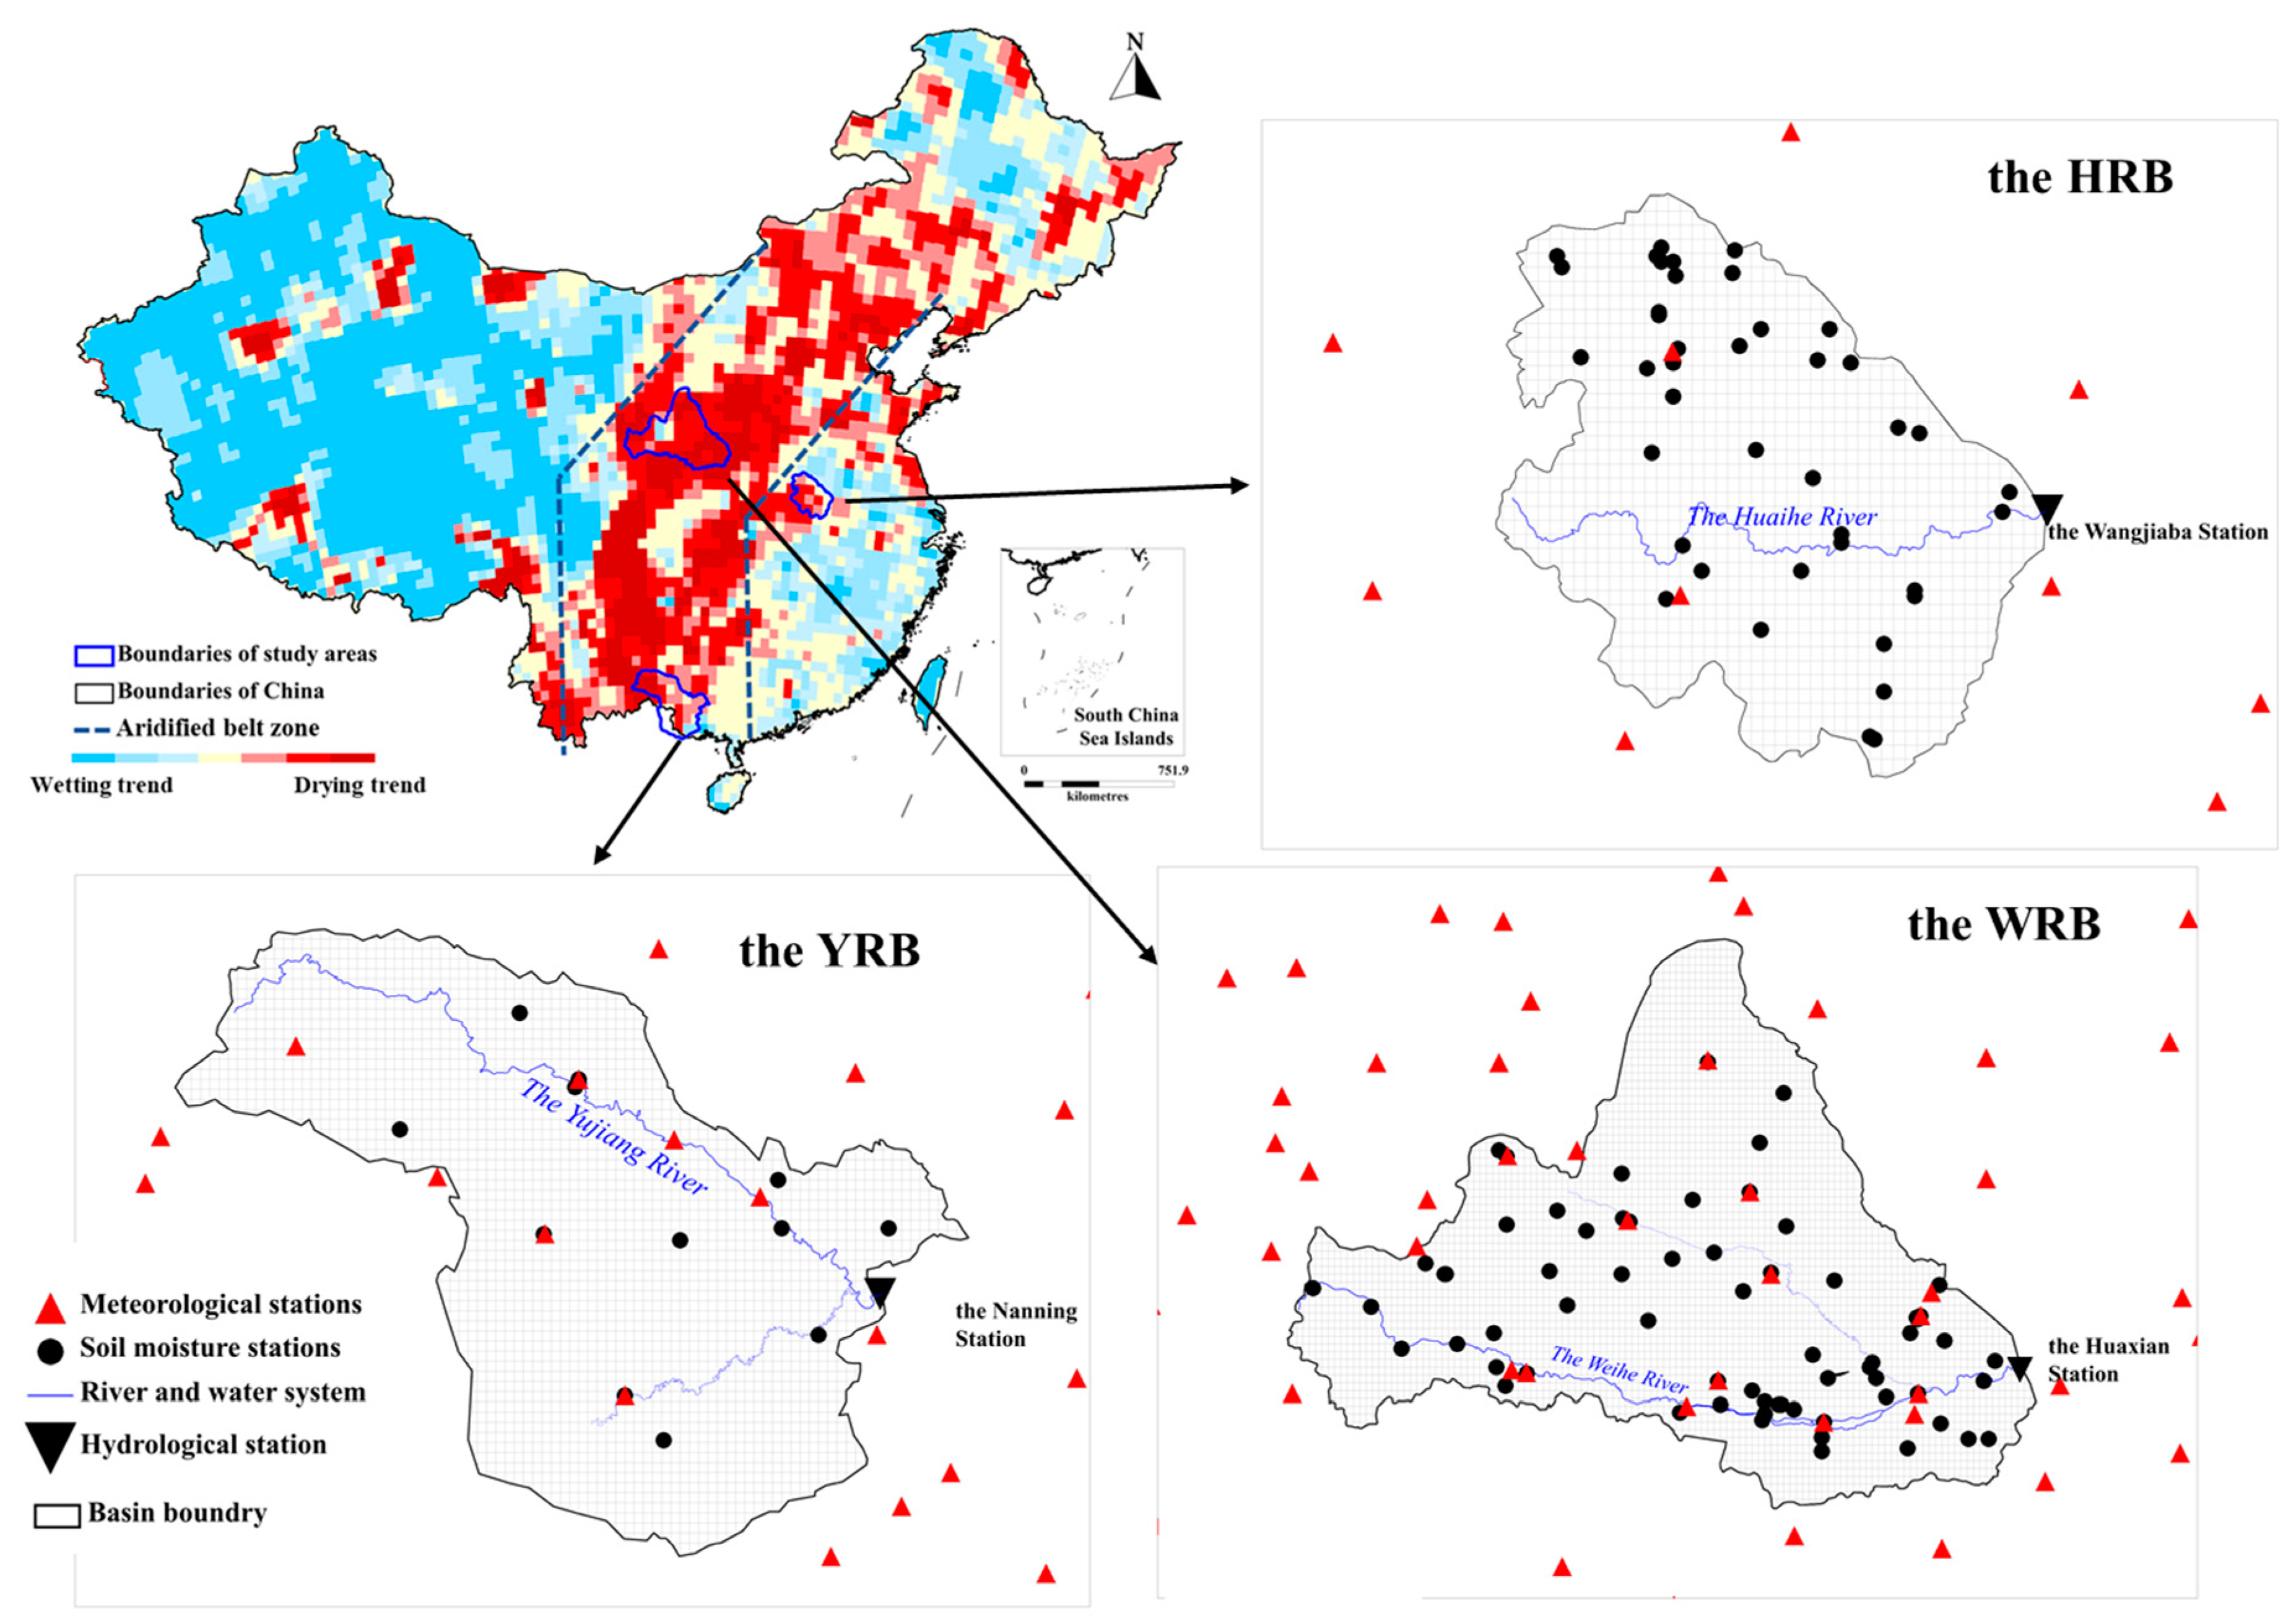
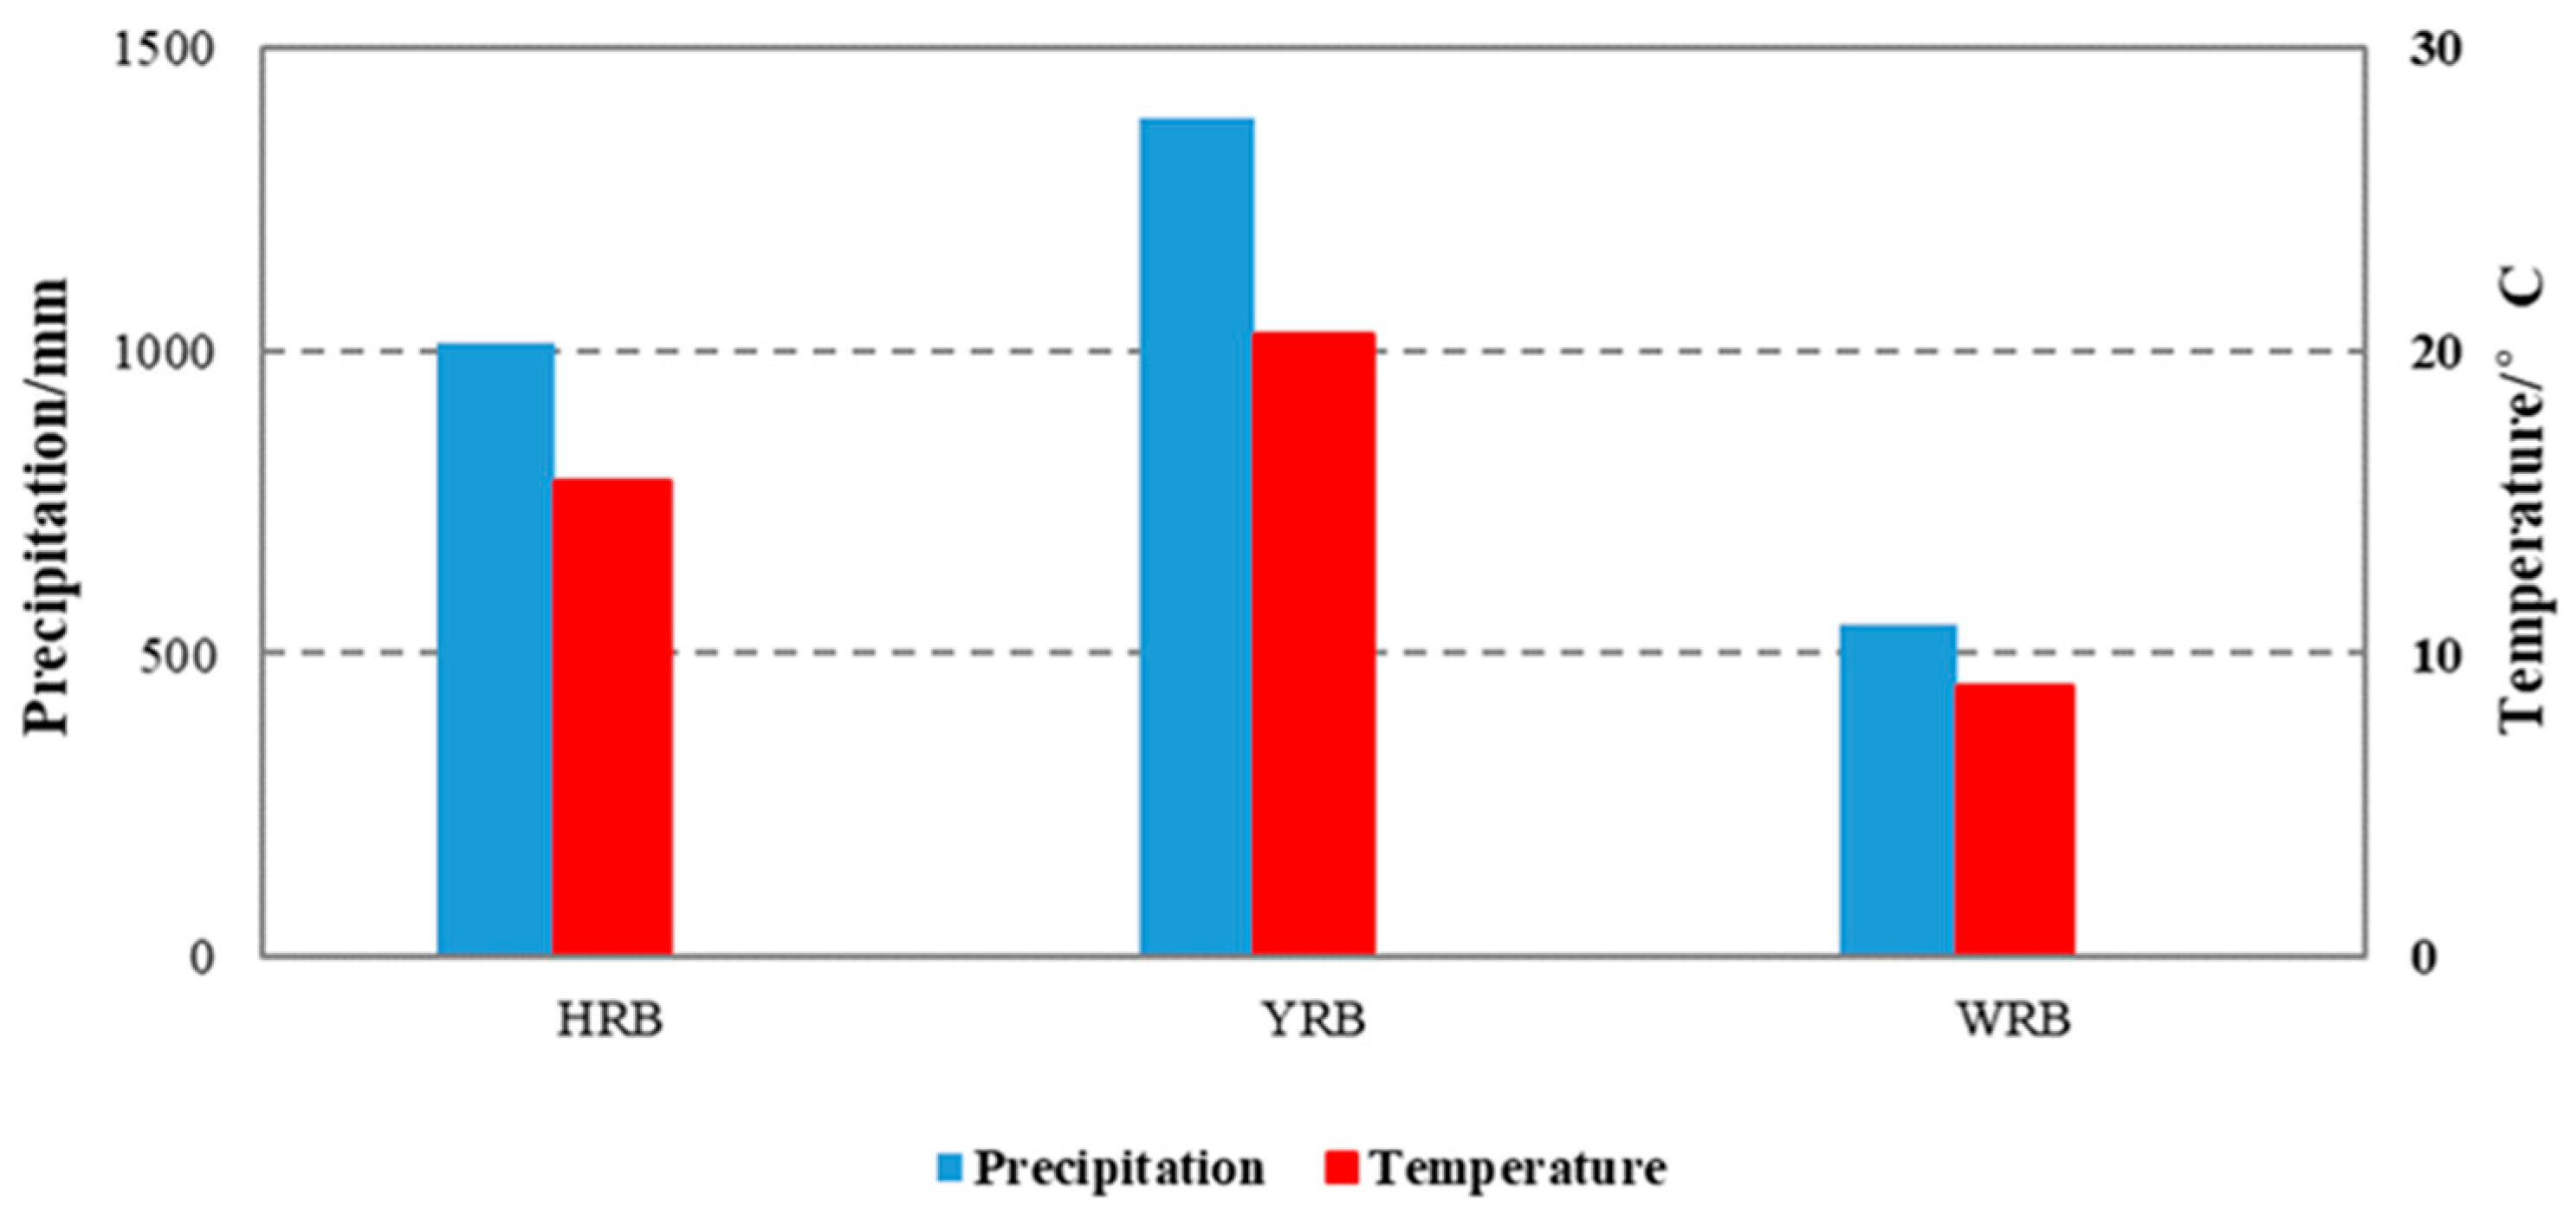
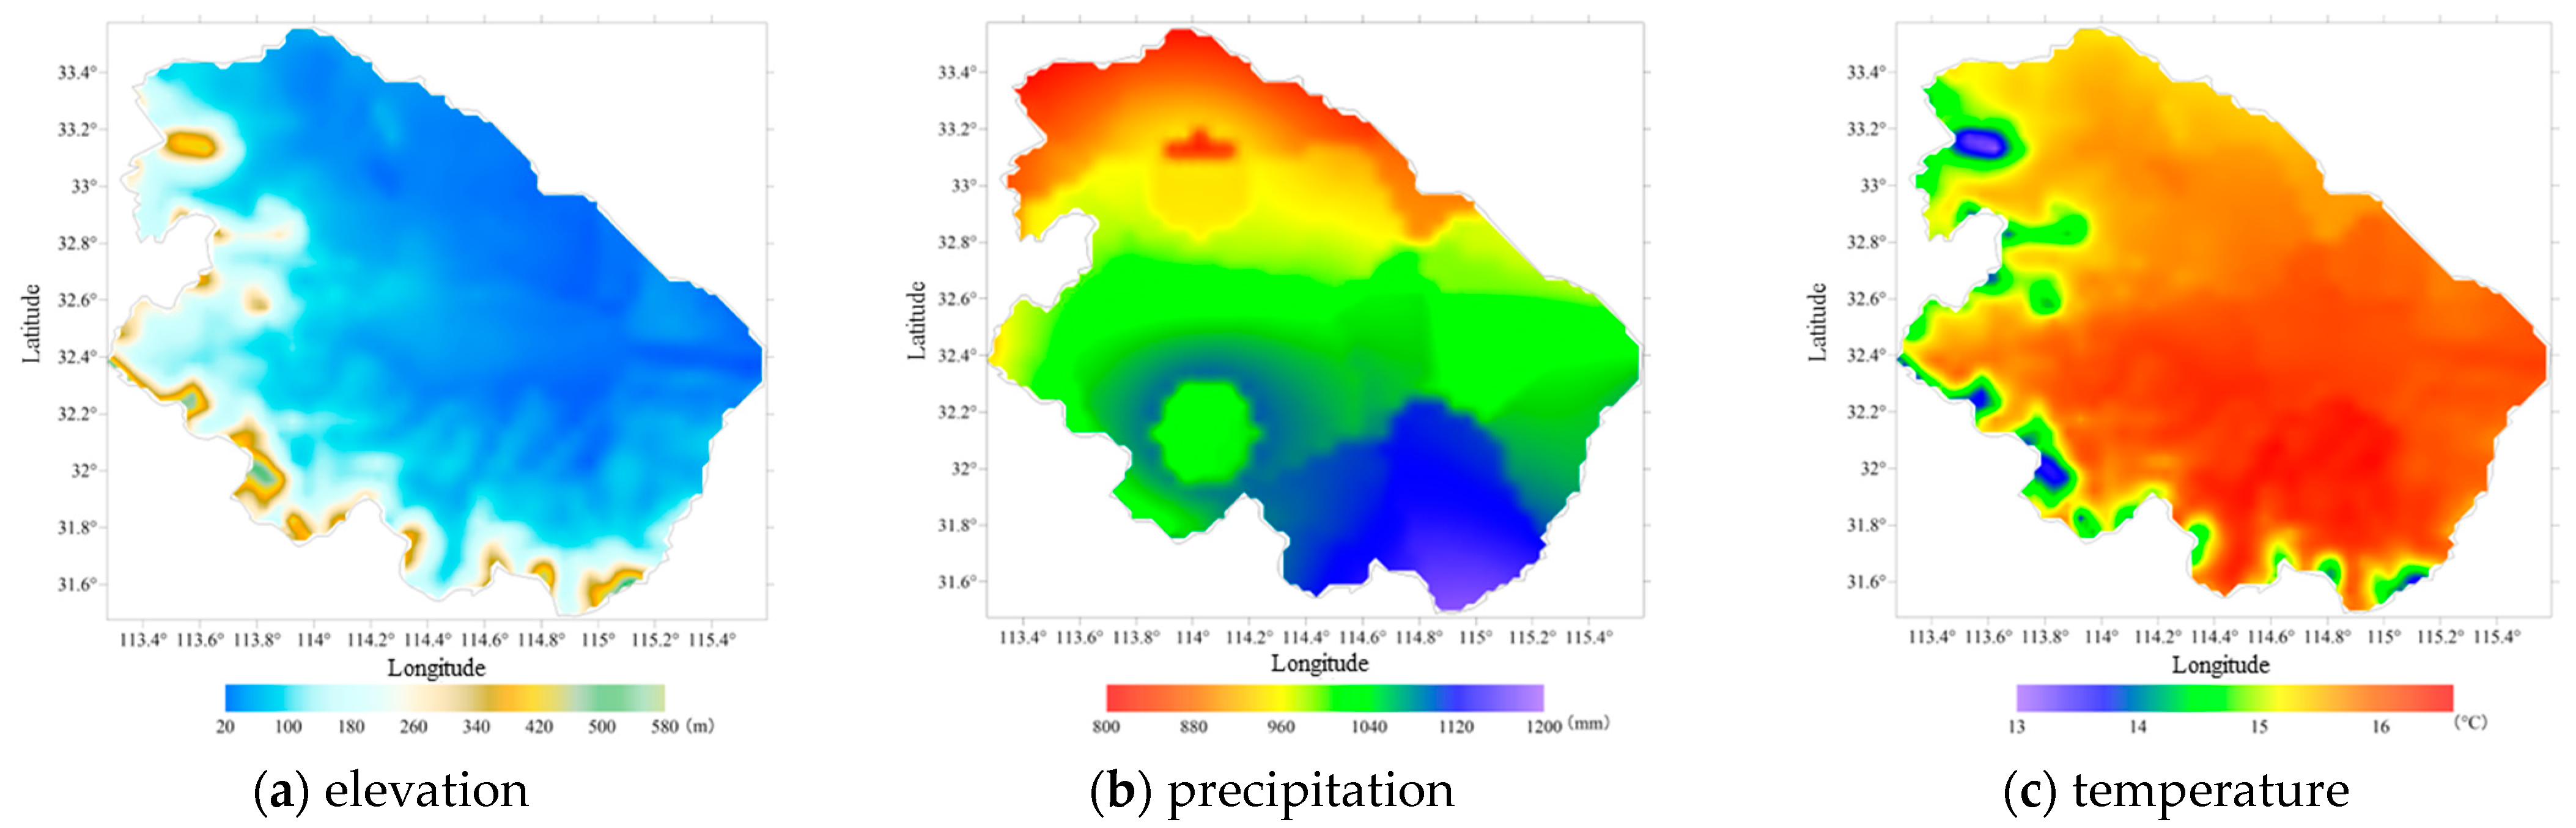
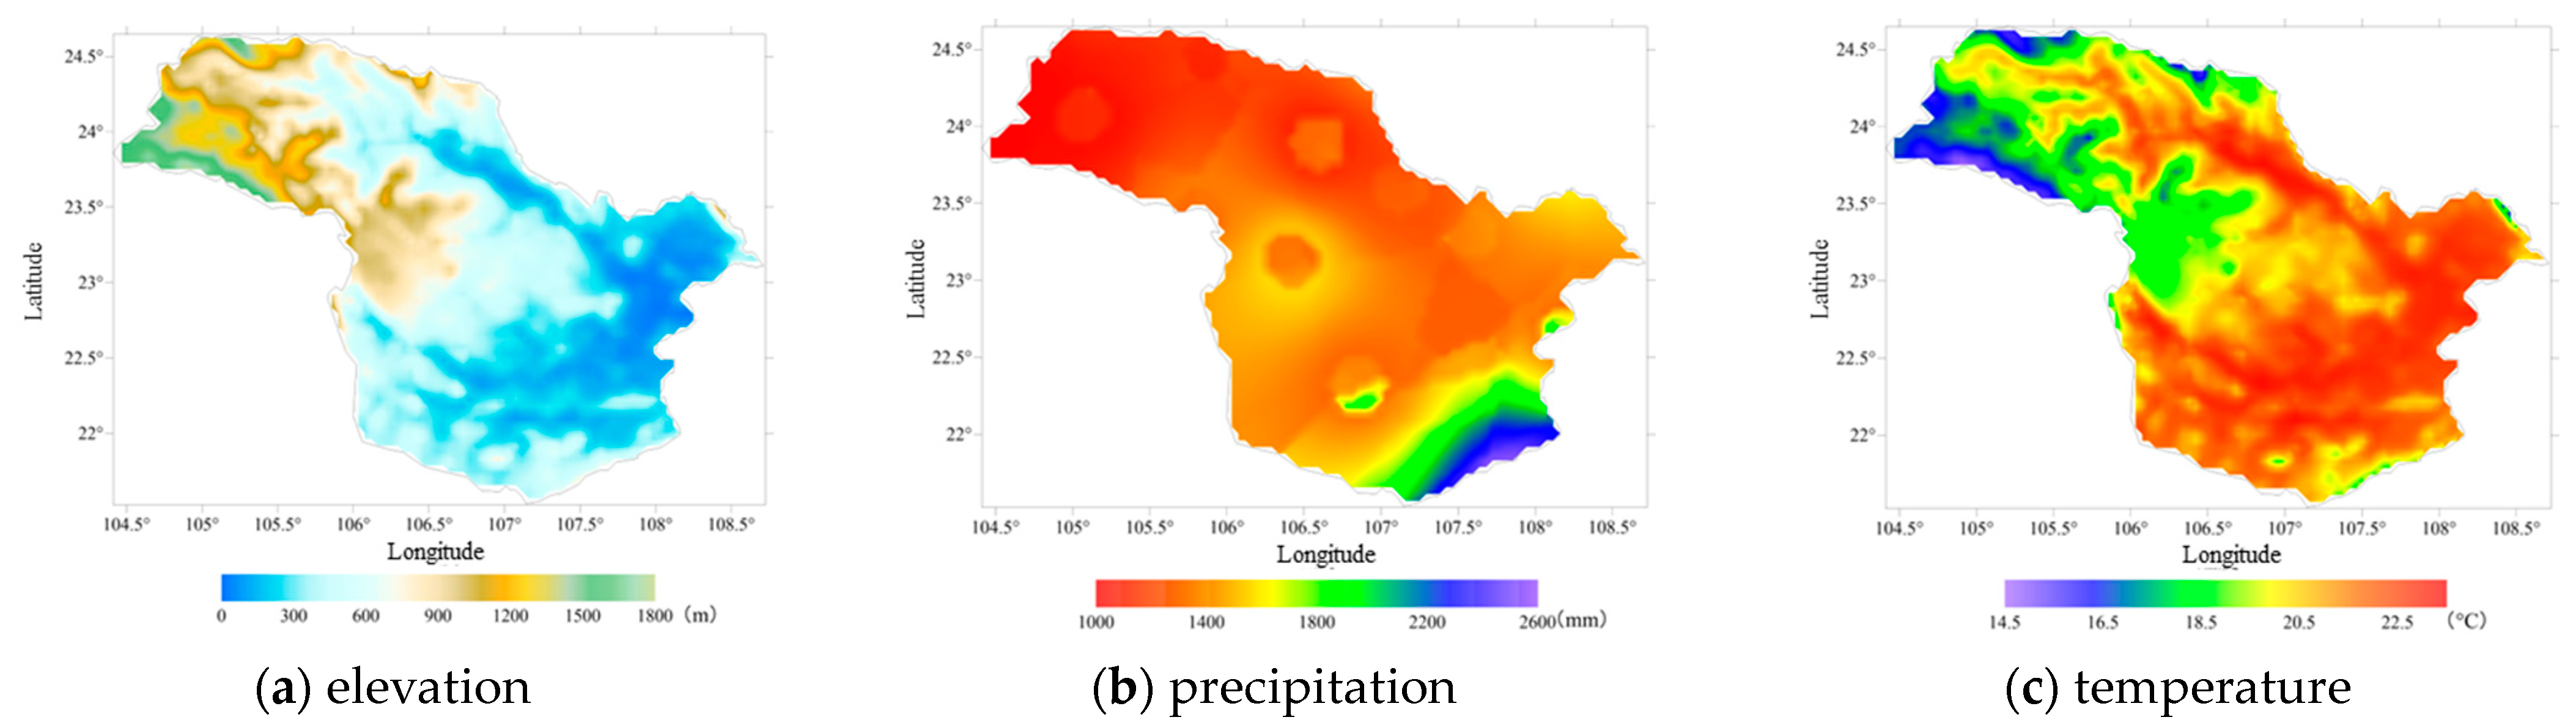
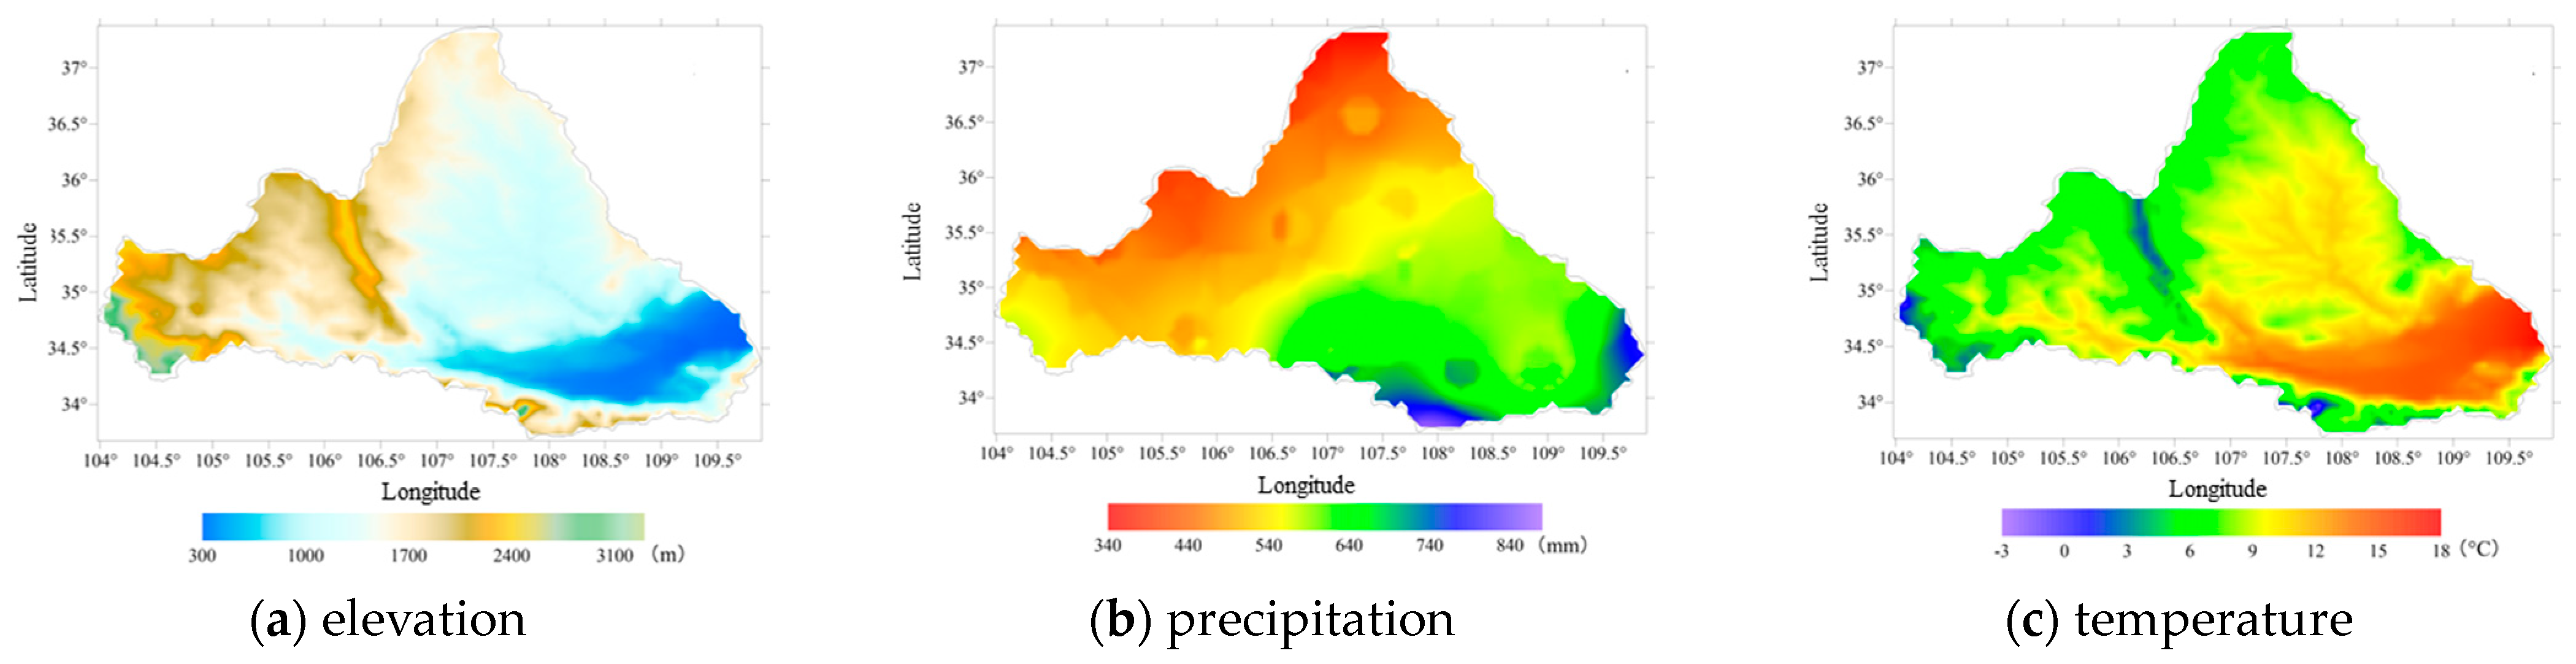
2.1. Study Areas

In order to investigate the impact of different climatic conditions, different landforms, vegetation coverage, soil texture, etc., on the drought process simulation, three typical basins in different climate zones located in the aridified belt zone [52] of Liaohe Plain–Haihe Plain–Loess Plateau–the Sichuan Basin–the Yunnan-Guizhou Plateau are chosen as the study areas. The chosen typical basins are the area above the Wangjiaba station in the Huaihe River Basin (HRB), the area above the Nanning station in the Yujiang River Basin (YRB) and the area above the Huaxian station in the Weihe River Basin (WRB), located in different climate zones, the transition zone between humid and semi-humid regions, the humid region and the transition zone between semi-humid and semi-arid regions, respectively. The geographical locations of the three typical basins in China’s aridified belt zone are shown in Figure 1, as well as the meteorological stations within and nearby, the soil moisture stations within, the main rivers and water systems within the basins, the location of hydrological stations and the basin boundaries. The average annual precipitation and temperature of the study areas are shown in Figure 2.
In the Huaihe River Basin, belonging to the warm and semi-humid monsoon climate zone, the spatial and temporal distribution of precipitation is uneven, which is one of the main reasons for frequent droughts [53]. The Wangjiaba station is located at 115.6° E and 32.4° N, in the upper reaches of the Huaihe River Basin. The study area, the HRB, is with a catchment area of 30,630 km2. Figure 3 shows the spatial distribution of elevation, precipitation and temperature in the basin. There are many hilly areas in this basin, with an altitude ranging from 19.8 m to 632.3 m, increasing from east to west. The average annual precipitation reaches 1000 mm, with an uneven distribution temporally and spatially [54], decreasing from south to north. The average annual temperature is about 15 °C, decreasing from south to north as well. The special geographical location, climatic conditions and hydrothermal conditions have led to significant droughts in the basin [55].
The Yujiang River Basin is the largest primary tributary of the Xijiang River in the Pearl River, located in the low latitude area, with the Tropic of Cancer cutting through it. It belongs to the subtropical monsoon climate area with a mild climate [56,57]. The Nanning station, located at 108.2° E and 22.8° N, belongs to the upper reaches of the Yujiang River Basin, with a catchment area of 72,650 km2. The spatial distribution of elevation, precipitation and temperature in the YRB is shown in Figure 4. The elevation ranges from 60.5 to 1789 m, gradually decreasing from the west to the east. The average annual precipitation reaches 1400 mm, varying between 1000 and 2560 mm, while the annual average temperature is up to 20 °C, both gradually decreasing from southeast to northwest. Drought is one of the main natural disasters in the basin, and its frequency and duration are increasing generally.
The Weihe River Basin is the largest tributary of the Yellow River basin [58], located in the eastern part of the northwest inland of China, mainly characterized by continental climate [59]. It is hot and rainy in summer while cold and dry in winter. The Huaxian station is situated at 109.8° E and 34.6° N, in the lower reaches of the Weihe River Basin, with a catchment area of 105,800 km2. The spatial distribution of elevation, precipitation and temperature in the WRB is shown in Figure 5. The elevation of the basin ranges from 341 to 3438.1 m, with a flat terrain in the eastern and central parts and a steep terrain in the western part. The average annual precipitation is about 500 mm, decreasing from southeast to northwest, and the average annual temperature ranges from −3 to 17.4 °C. The ecological environment of the basin is fragile and prone to drought [59].

2.2. Hydrological Model

The VIC model, called the Variable Infiltration Capacity model, is a large-scale semi-distributed hydrological model based on the Soil Vegetation Atmospheric Transfer Schemes (SVATS) idea [60]. Compared with traditional hydrological models, VIC can simultaneously consider the water balance as well as the energy balance between land and atmosphere fluxes. Meanwhile, the model takes the heterogeneity of vegetation types in the sub-grid, the heterogeneity of spatial distribution of soil water storage capacity of the Xin’anjiang model, the non-linearity of canopy wet evaporation, leaf transpiration, bare soil evaporation and base flow regression into account, which is conducive to better simulation of surface runoff and soil moisture, therefore further making the VIC model one of the best hydrological models to simulate the actual hydrological processes [17,61]. It is applicable to grid scale and basin scale and has been widely used in the research of water resources management, land–air interaction and climate change.
There are four user-defined parameter types, climatic and geographical parameters, vegetation parameters, soil parameters and hydrological parameters. Generally speaking, except for hydrological parameters, the other three parameters are usually directly determined when constructing VIC, and will not be changed. Hydrological parameters are optimized according to the observed runoff, including the shape parameter of saturation capacity curve ( b ); the maximum velocity of baseflow ( D s m a x ); the fraction of D s m a x where non-linear baseflow begins ( D s ); the fraction of maximum soil moisture where non-linear baseflow occurs ( W s ); the thickness of three soil layers ( d 0 , d 1 , d 2 ); and the exponent used in baseflow curve ( c ), normally set to 2. The optimization of hydrological parameters is based on the Rosenbrock algorithm [62] and artificial intervention.
At the same time, since the research uses drought indicators related to soil moisture that reflect agricultural drought, and it is not easy to obtain long-sequence soil moisture measurements from field surveys on large scales [63], the VIC model can not only provide long-term and large-scale soil moisture data, but also generate current ICs based on observed meteorological input data to reduce uncertainty in drought monitoring and prediction [64].

2.3. Data

The observations used in the study include station precipitation, temperature, runoff and soil moisture. The daily station observed precipitation and the maximum and minimum temperatures used as the meteorological inputs of the VIC model are obtained from the National Meteorological Science Data Center, the meteorological stations within each basin and nearby are shown in Figure 1. The observed runoff data of the Wangjiaba Station, the Nanning Station and the Huaxian Station from 1952 to 2008, 1951 to 2010 and 1951 to 2018, respectively, are used to calibrate and validate the hydrological parameters of VIC, and obtained from the Information Center Database of the Ministry of Water Resources. The observed soil moisture data from soil moisture stations, between 2008 and 2018 also obtained from the Information Center Database of the Ministry of Water Resources, are used to validate the performance of the calibrated hydrological parameters of VIC. Due to the different deployment times and monitoring frequency of different soil moisture stations, the data sequence length of each station differs. The soil moisture data are mass water moisture, monitored with collection points at depths of 10 cm, 20 cm and 40 cm, respectively. The data quality is reliable and has been widely used for model simulation of soil moisture and satellite soil moisture data evaluation and fusion [65,66,67].

2.4. Method

2.4.1. Drought Process Identification Based on Soil Moisture

In order to identify the drought processes based on soil moisture, we first ran the VIC model using the observed precipitation, temperature and runoff to get the best hydrological parameters and corresponding simulated soil moisture, and then calculated the soil moisture anomaly index (SMAPI) [63] as the drought index reflecting droughts.
SMAPI is an indicator that can describe the characteristics of large-scale drought, which refers to a percentage of the difference between the actual soil moisture and the annual average soil moisture, to the annual average soil moisture. When the actual soil moisture is lower than the annual average soil moisture, there is a deficit in soil moisture, which determines the occurrence of drought. SMAPI is a relative drought index, not only can it reflect the degree of deviation from the normal state of soil moisture, but it also can effectively compare the drought characteristics in different regions and periods, which is beneficial to study large-scale droughts. SMAPI is capable of well reflecting the occurrence, development, and spatio-temporal change trends of large-scale droughts, with a clear physical meaning, strong spatiotemporal comparability and simple calculation [65].
The calculation method of SMAPI is shown in Equation (1):
S M A P I = S M S M ¯ S M ¯ × 100 %
Here, S M and S M ¯ represent the current soil moisture and the annual average value of the soil moisture in a certain period, from 1985 to 2014 in the study, and S M ¯ can be regarded as the mathematical expectation value of the soil moisture during the period. When S M A P I is less than −5%, drought occurs. Combining probability statistics and actual drought information, the drought classification standard based on S M A P I is shown in Table 1.
In this study, S M A P I of the soil layers of the upper (0–20 cm), the deep (20–100 cm) and the entire (0–100 cm) in three typical basins were calculated. And then the time series of the basin-average S M A P I was analyzed. If the continuous days when the average S M A P I less than −5% is more than 30 days, it is considered a drought occurred and recorded as a historical drought event. If the time interval between two drought events is less than five days, the two droughts will be merged into one. Due to the drought identification results of different soil layers being similar, the S M A P I of the entire soil layer is selected as the basis for historical drought identification.

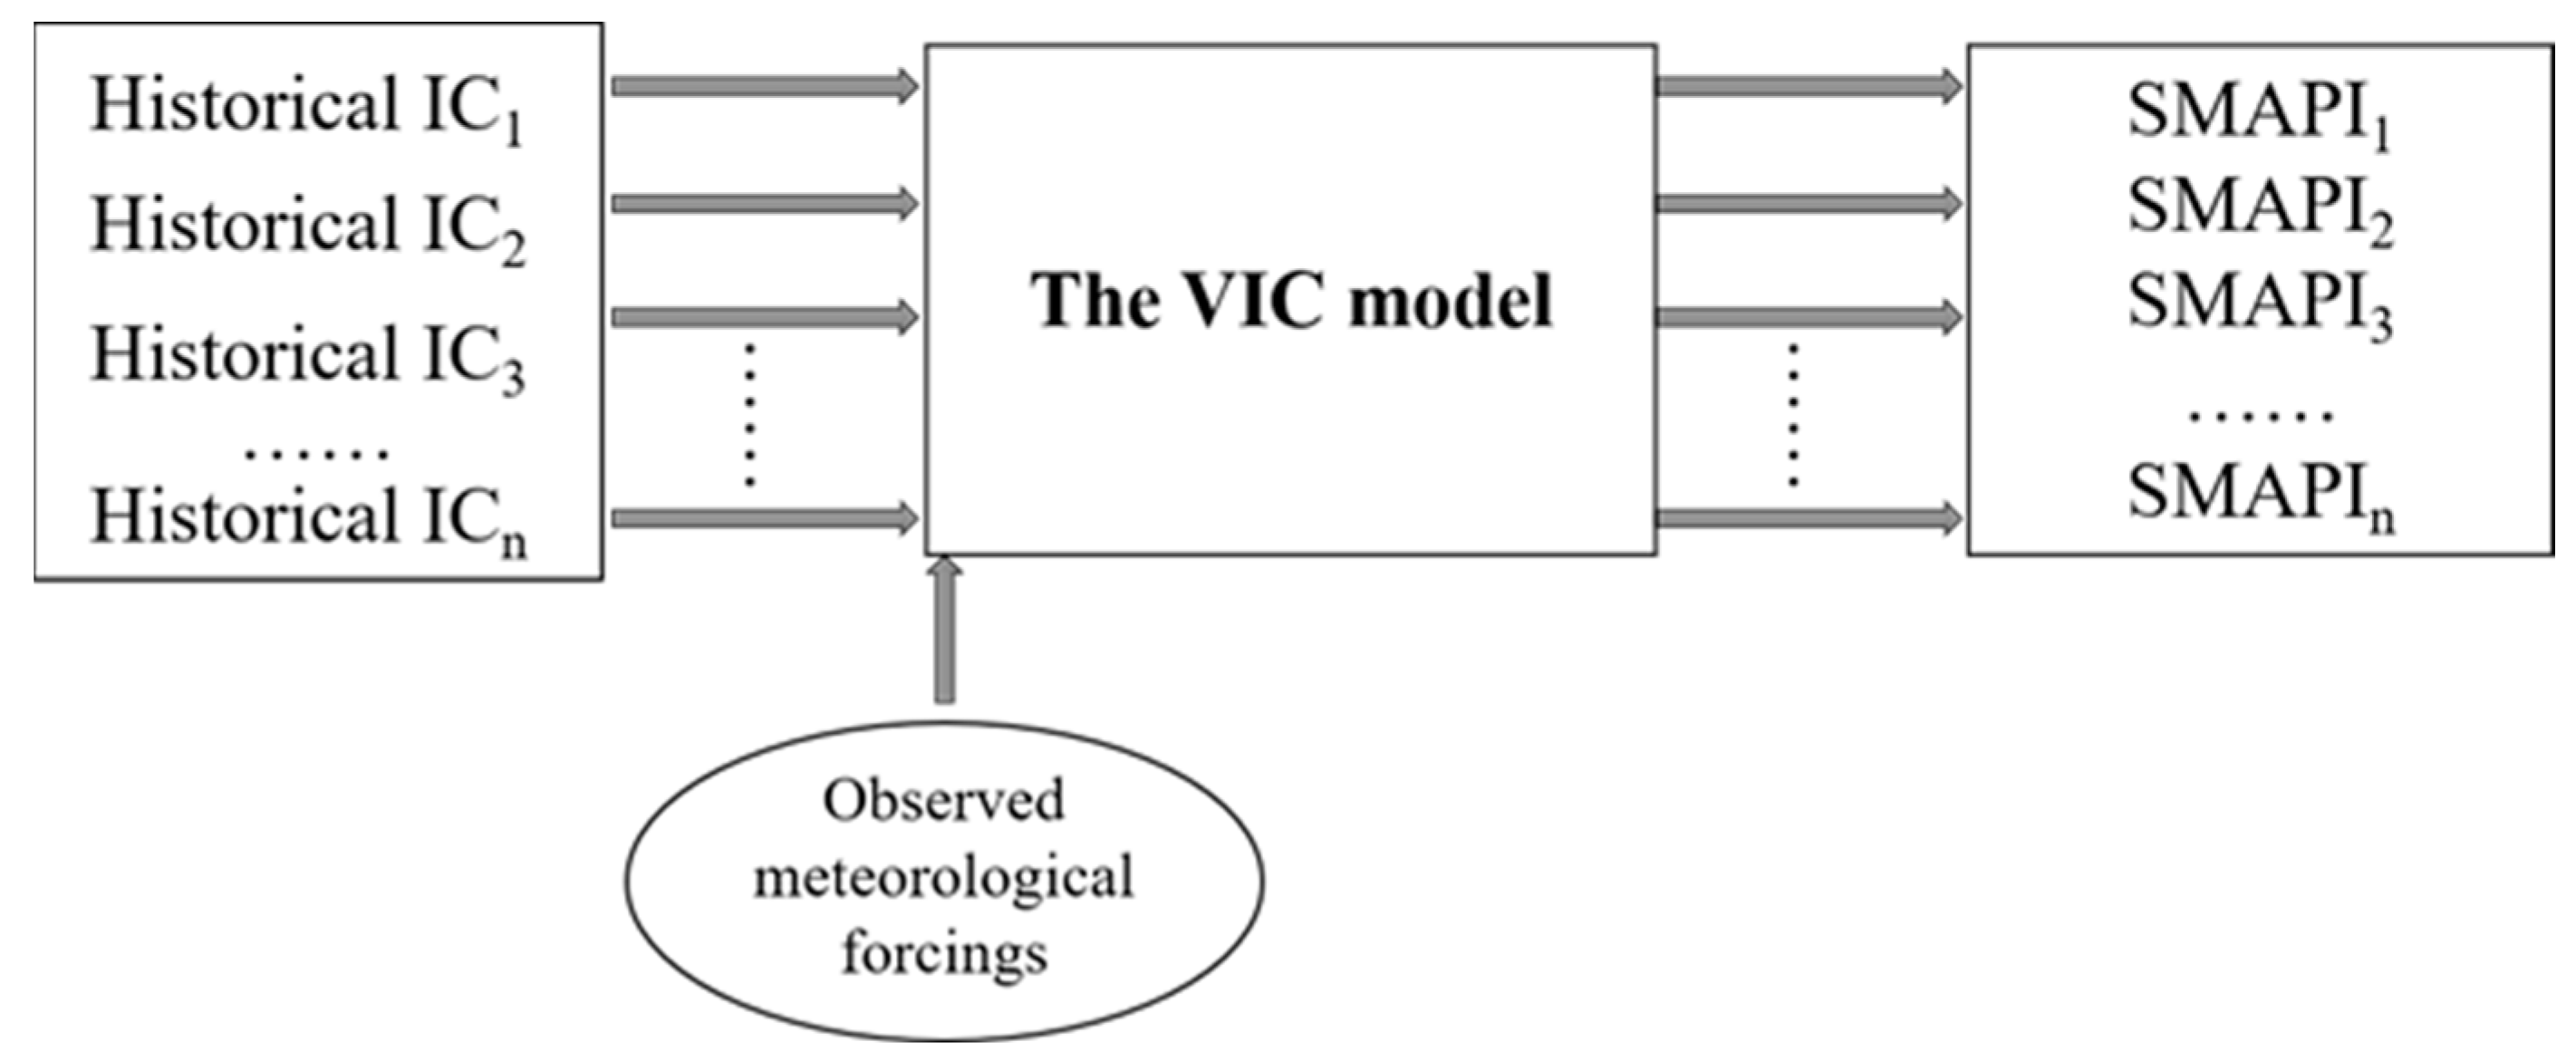
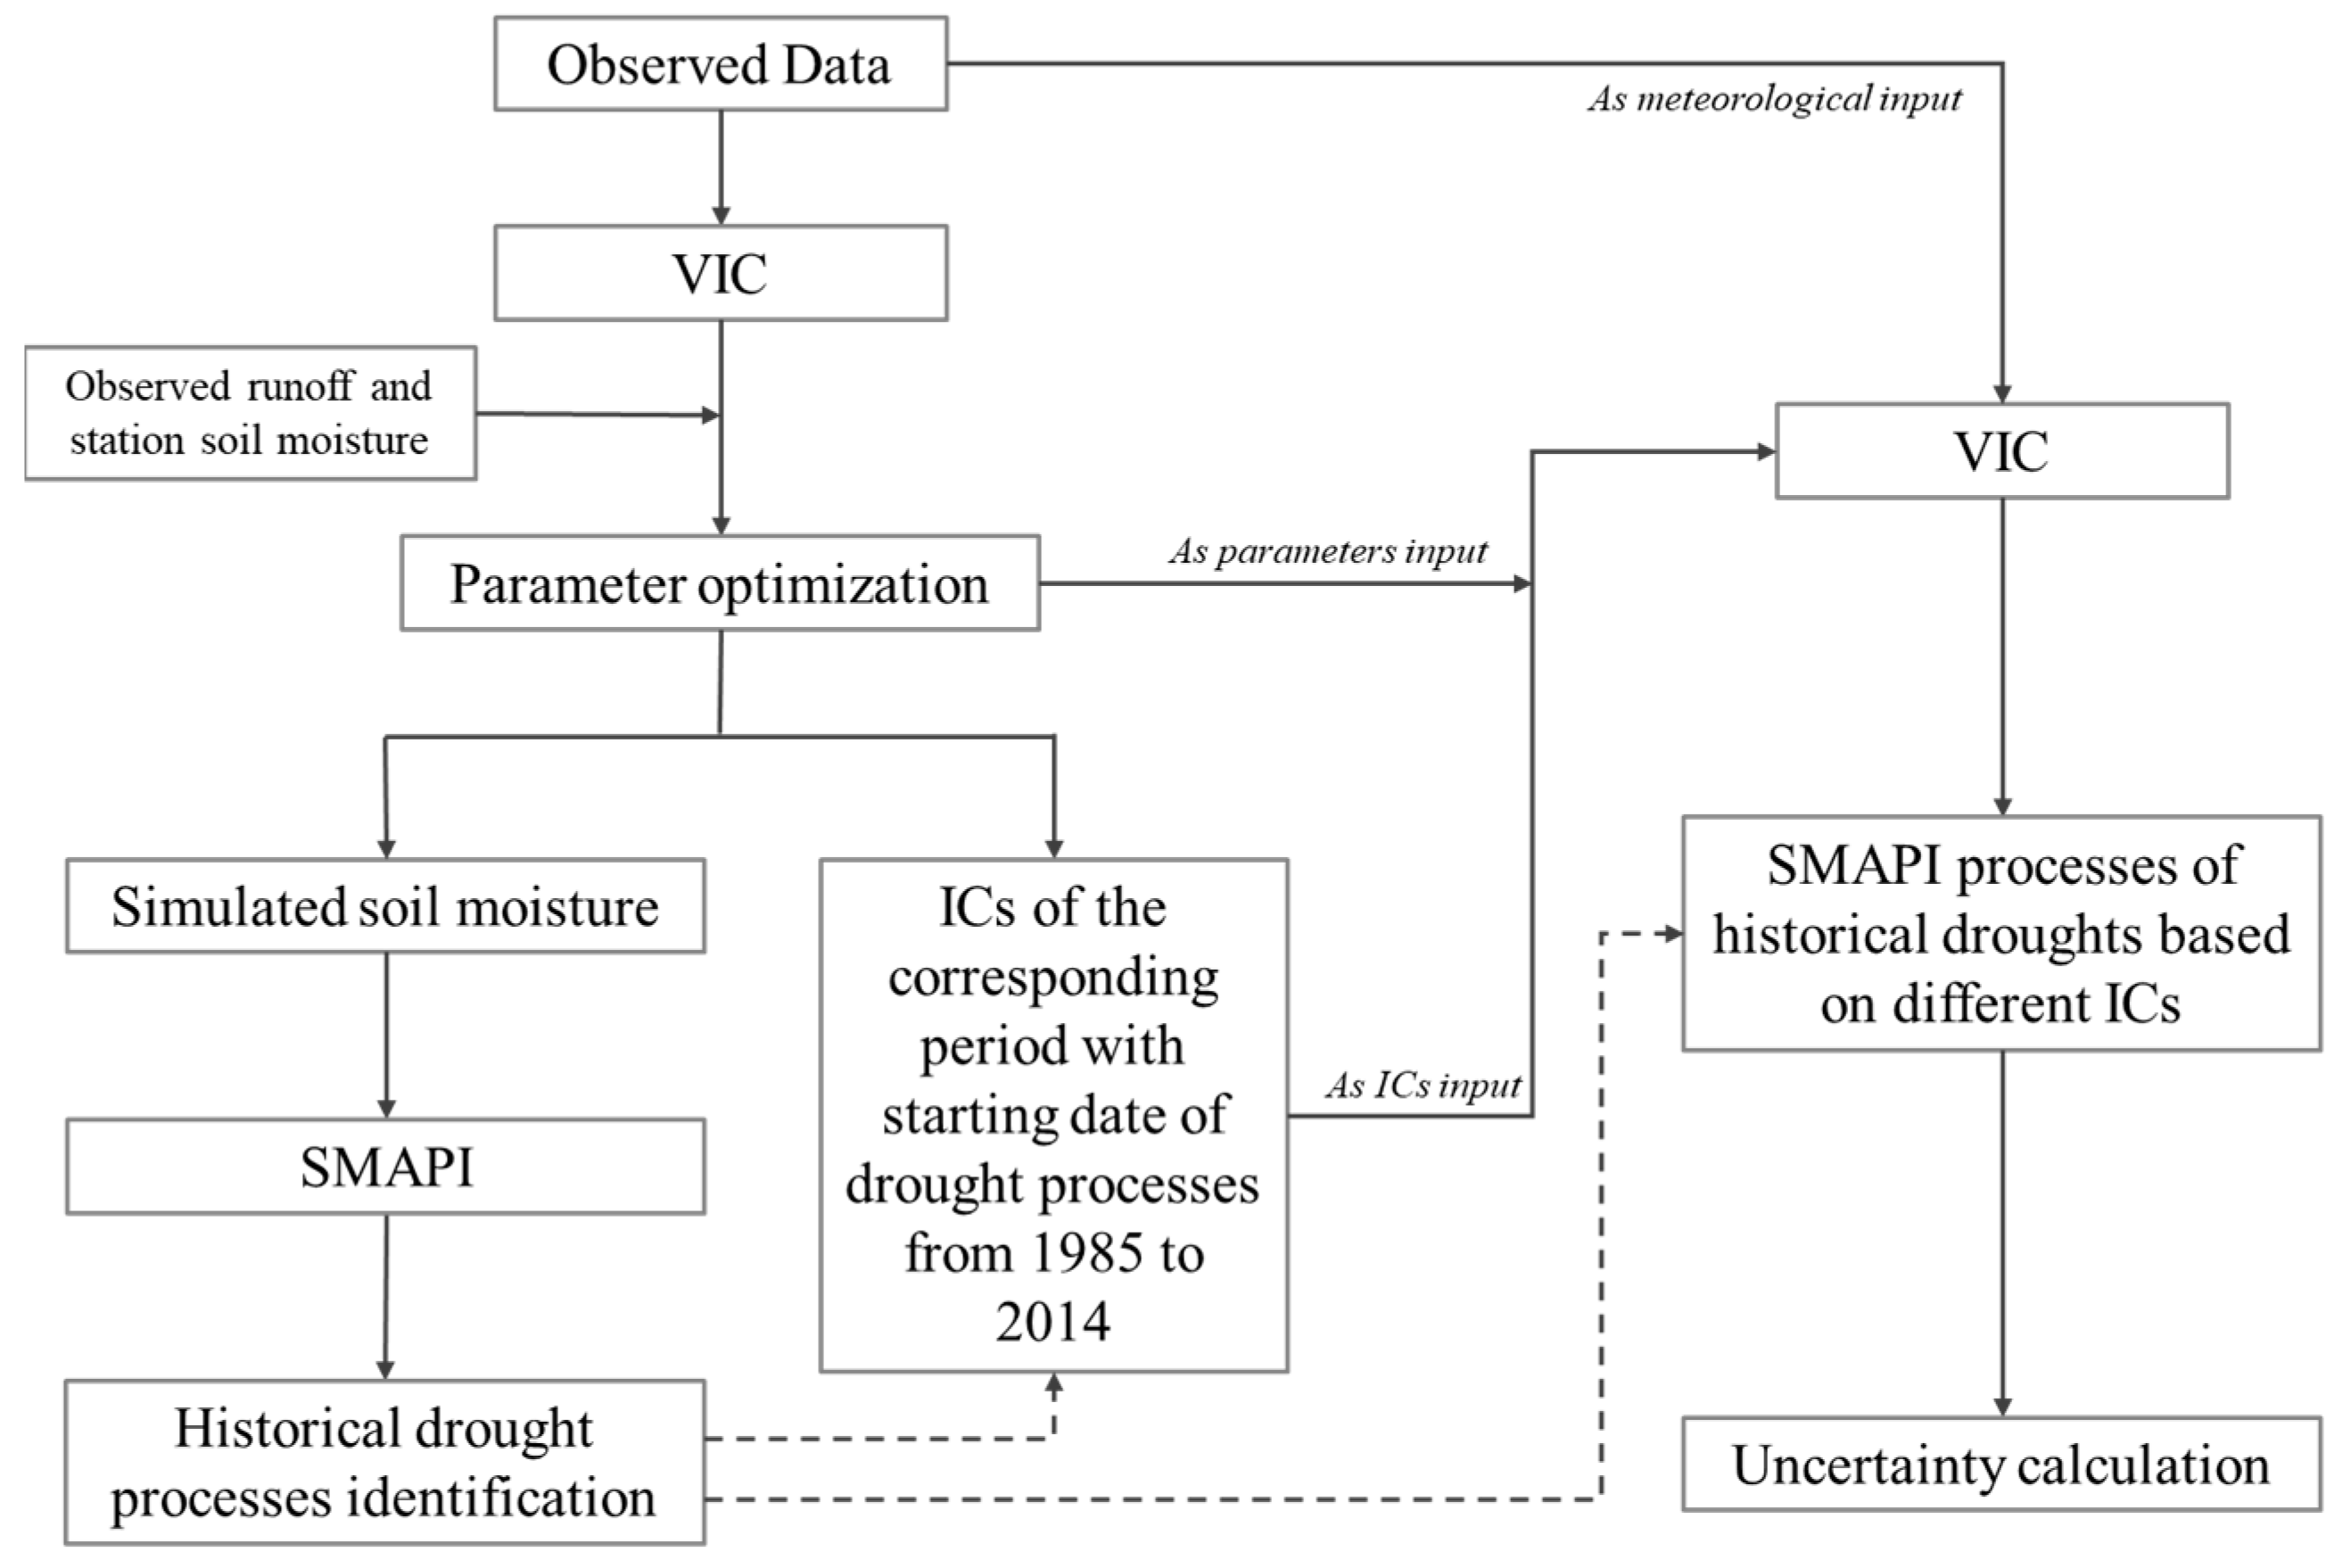
2.4.2. Uncertainty Construction of Drought Process Simulation

In the research, uncertainty, a measurement concept [66], is used to measure the uncertainty of drought process simulation. Due to the systematic and random error, the measurement results will change within a certain range with the change of actual measurement conditions, and it is difficult to obtain absolutely correct measurement results (true values). Therefore, the change range of the measurement results must be included when giving the measurement results. Since it is an estimated value, it is necessary to include the error limit and the confidence probability in this range. Uncertainty is the error limit used to characterize the dispersion degree of the measurement results, which is an interval in which the true values may be affected by various errors in the measurement process under a specified confidence probability (namenly confidence level). The uncertainty is generally represented by the standard deviation of the measured value [66]. The smaller the uncertainty of the measurement, the closer the measurement result is to the true value, and the higher the quality of the measurement. The uncertainty can be expressed by ± c σ ; here, c is the confidence coefficient and σ is the standard deviation. According to the integral of normal distribution function, when the confidence level is 68%, 75% and 95%, the uncertainty is ± σ , ± 1.15 σ and ± 2 σ , respectively. Generally, the confidence level of random uncertainty is taken as 95%.
When the concept of uncertainty is applied to meteorology, the observed value is the true value, while the forecast values are the measured values. The uncertainty is characterized by the Root Mean Square Error (RMSE) between the true and the measured values [66]. In this study, we introduce the concept of uncertainty into hydrology and regard the influence of ICs on the drought process simulation as a measurement problem. The SMAPIs based on the actual IC and observed meteorological data are the true values, while the SMAPIs based on the different ICs and observed meteorological data are the measured values. Therefore, the RMSE between observe-based SMAPIs and the SMAPIs based on different ICs is calculated, characterizing the uncertainty of the drought process simulations by ICs.
In order to investigate the uncertainty of ICs on drought process simulation, for each historical drought event, the observed meteorological data and the different ICs are used as the model’s input to obtain the soil moisture process based on different ICs. Here it should be noted that in order to reduce the influence of the drought processes simulation uncertainty by ICs, the observe-based historical ICs of the corresponding period with the starting date of drought processes from 1985 to 2014, reflecting the actual characteristics of soil moisture in the study area, used as the different ICs inputs, are obtained from VIC outputs according actual observed data as well. For all the drought processes simulation, the meteorological data used in VIC are observed precipitation and temperature. For example, if the drought occurred in the HRB on 16 January 2006, and ended on 23 February 2006, the ICs used are the 30 observe-based ICs on 16 January from 1985 to 2014, while the meteorological data used are the observed precipitation and temperature during the historical drought process. Afterward, daily SMAPIs based on different ICs are calculated to analyze and compare the temporal evolution characteristics of different historical droughts. The method structure is shown in Figure 6.
The calculation method of the uncertainty ( σ t ) is shown in Equation (2):
σ t = i = 1 n ( S M A P I t , i S M A P I t ) 2 n 1
Here, t represents the t-th day during the drought process, n represents the number of different ICs used in the study, i represents the i-th used IC, S M A P I t , i represents the corresponding S M A P I using the i-th IC of the t-th day, S M A P I t represents the observe-based S M A P I with actual IC of the t-th day, and σ t represents the uncertainty for the t-th day. The smaller σ t is, the smaller the deviation between the measured value and the true value, that is, the smaller the deviation between the SMAPIs based on different ICs and the actual IC. The whole method flowchart is shown in Figure 7.

3. Results

3.1. Simulation Results of the VIC Model

In this study, the VIC model at the grid resolution of 0.05° in each basin is constructed, and the grids of each basin are shown in Figure 1. The optimized hydrological parameters used in the study are shown in Table 2.

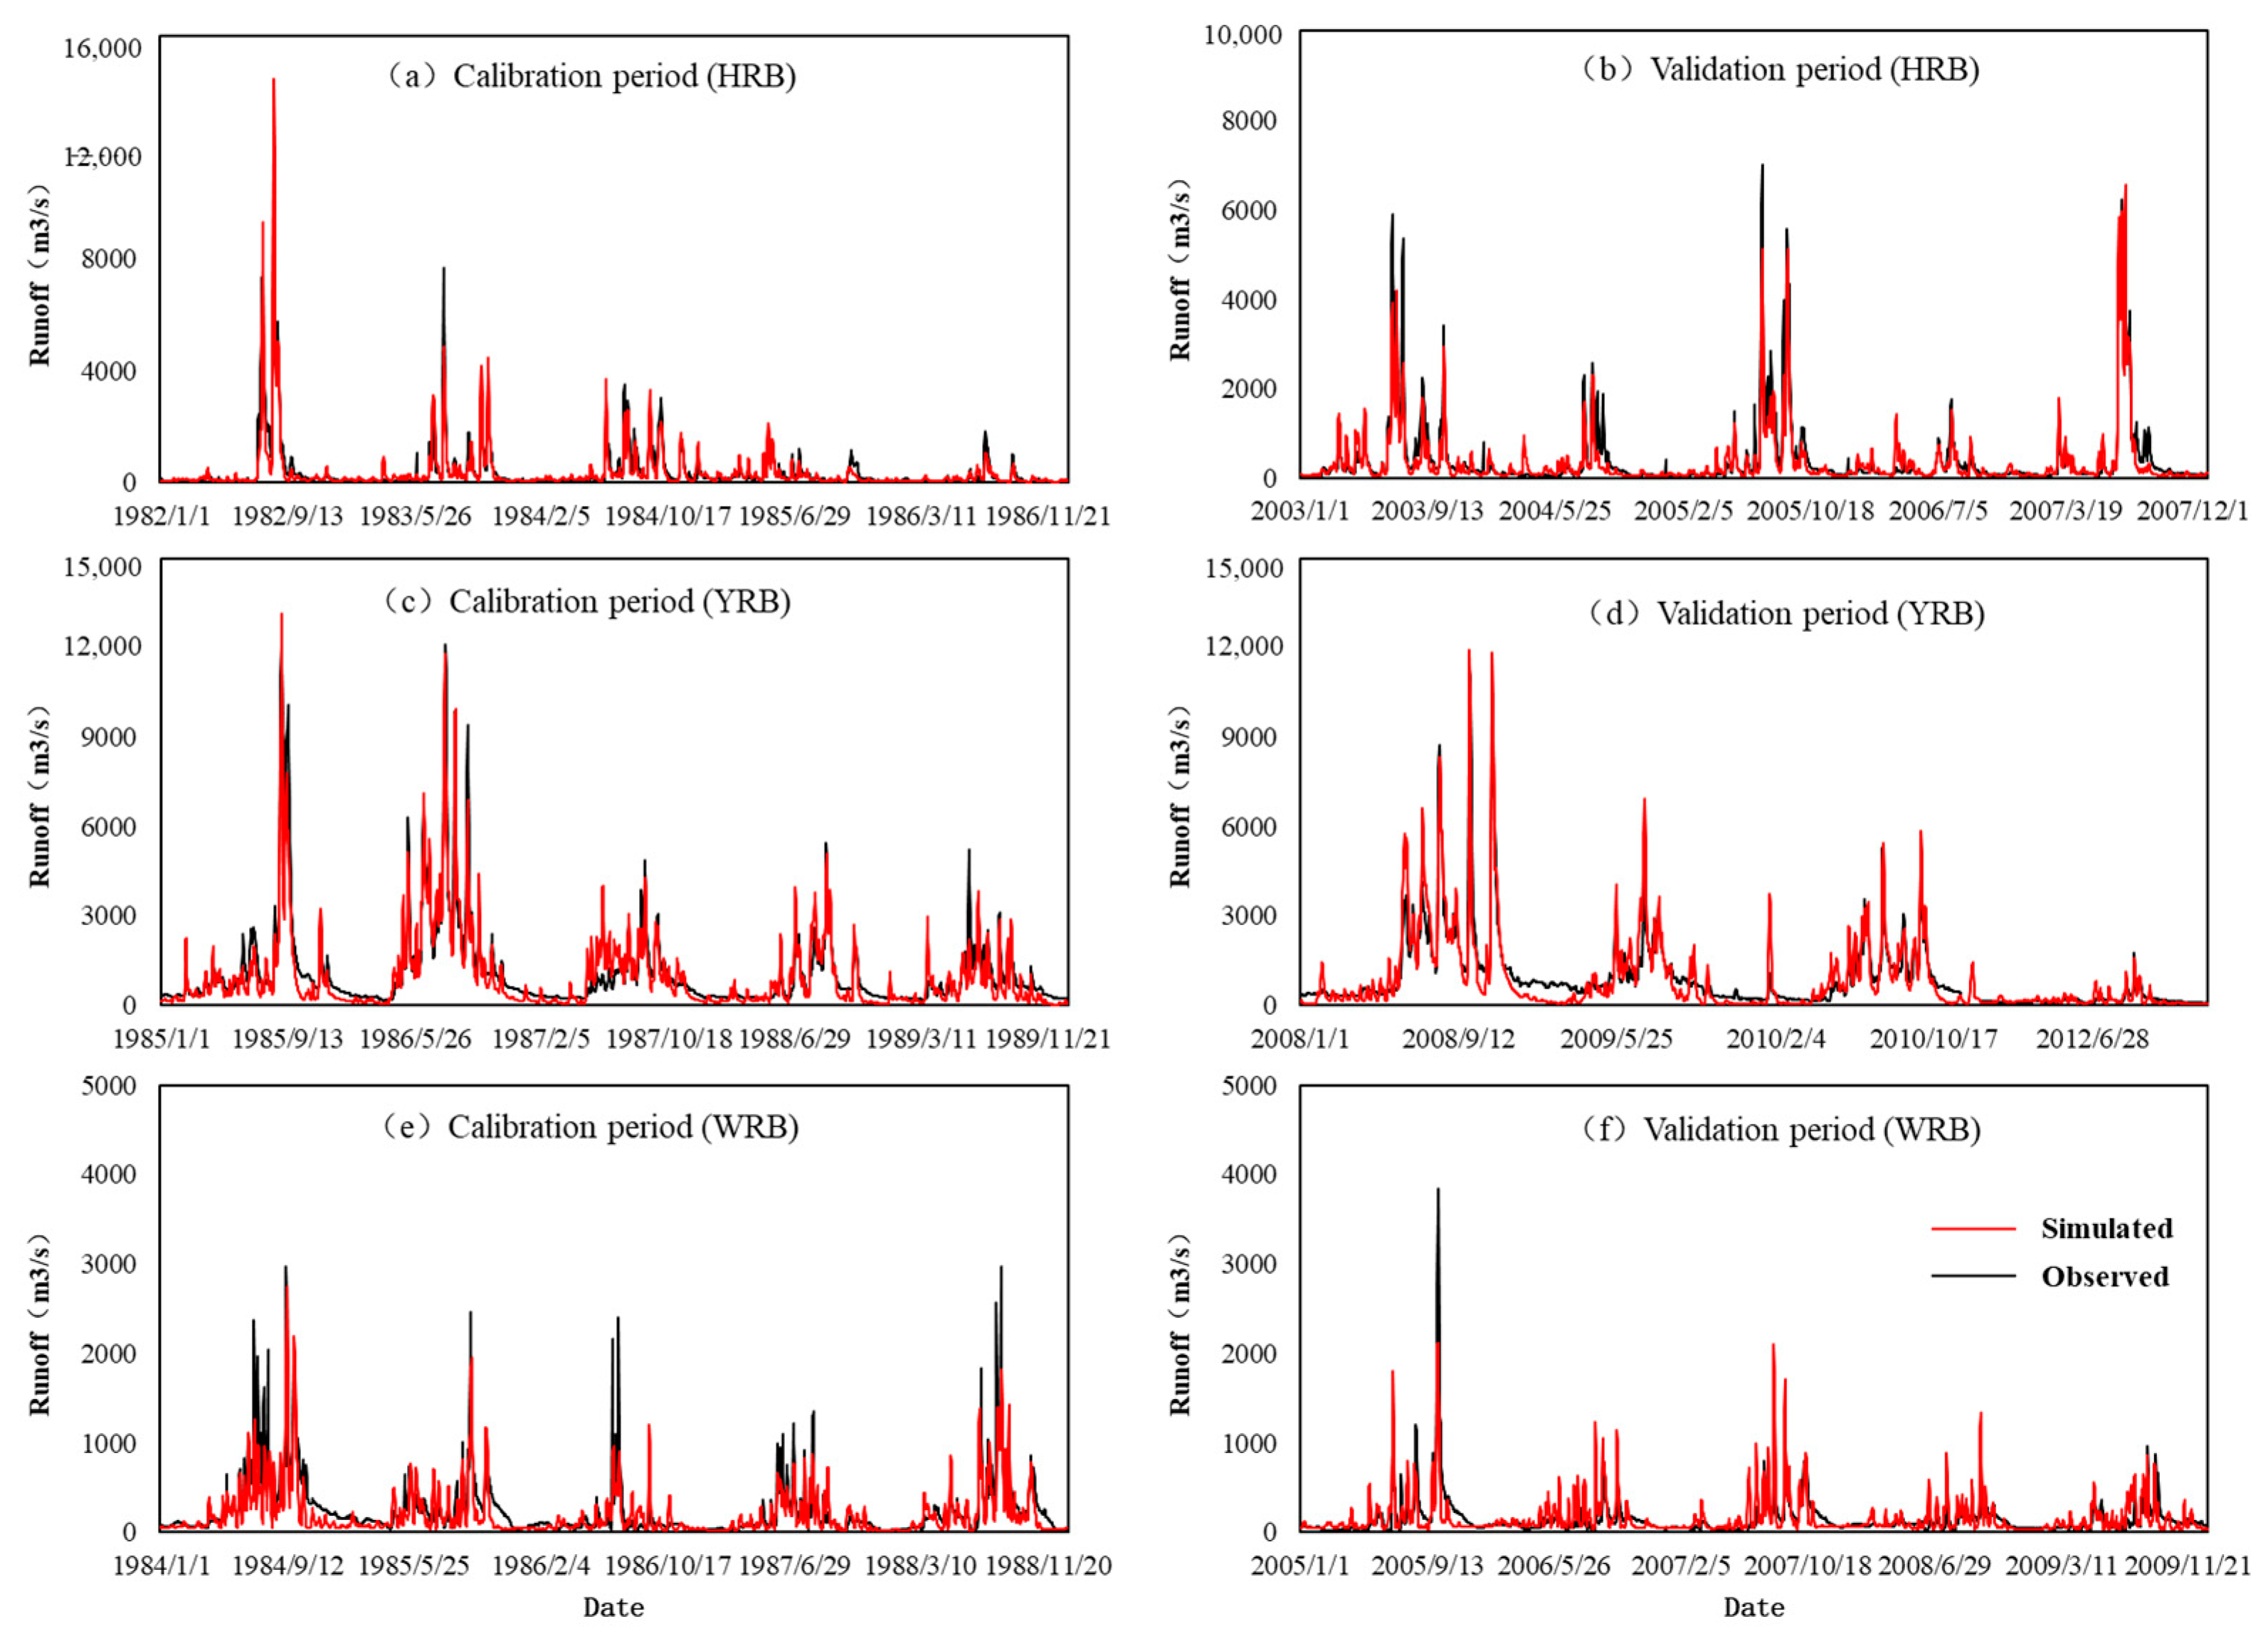
3.1.1. Validation of Runoff

In the study, daily relative error (RE) and Nash–Sutcliffe efficiency coefficient (NSE) were selected as the indicators to evaluate VIC simulation performance. RE reflects the credibility between simulated and observed runoff, and NSE represents the coincidence degree of simulated and observed runoff. Table 3 is a statistical table of the VIC model performance based on optimized hydrological parameters in three typical basins. It can be seen that the daily NSE in the three basins for calibration and validation periods all exceed 0.6. The daily NSE is up to 0.84 in the calibration period and 0.72 in the validation period in YRB, while the value is 0.68 and 0.83, respectively, in HRB. The NSE in WRB is the worst among the three basins. In terms of RE, for the calibration period, the daily value is −6.0% and 0.7% in the calibration and validation period in YRB, showing the best comprehensive performance among the three basins. In WRB, the daily RE is −12.8% in the calibration period while only 0.2% for the validation period.
Figure 8 shows the time series of observed and simulated runoff in the study basins in calibration and validation periods to more directly clarify the temporal variation. The black and red line represent the observed and simulated runoff, respectively. It can be seen from Figure 8 that the runoff process and runoff peak appearance time of the VIC model are basically consistent with the observation. Therefore, the model can reasonably reflect the runoff process and is an ideal model in the study basins.

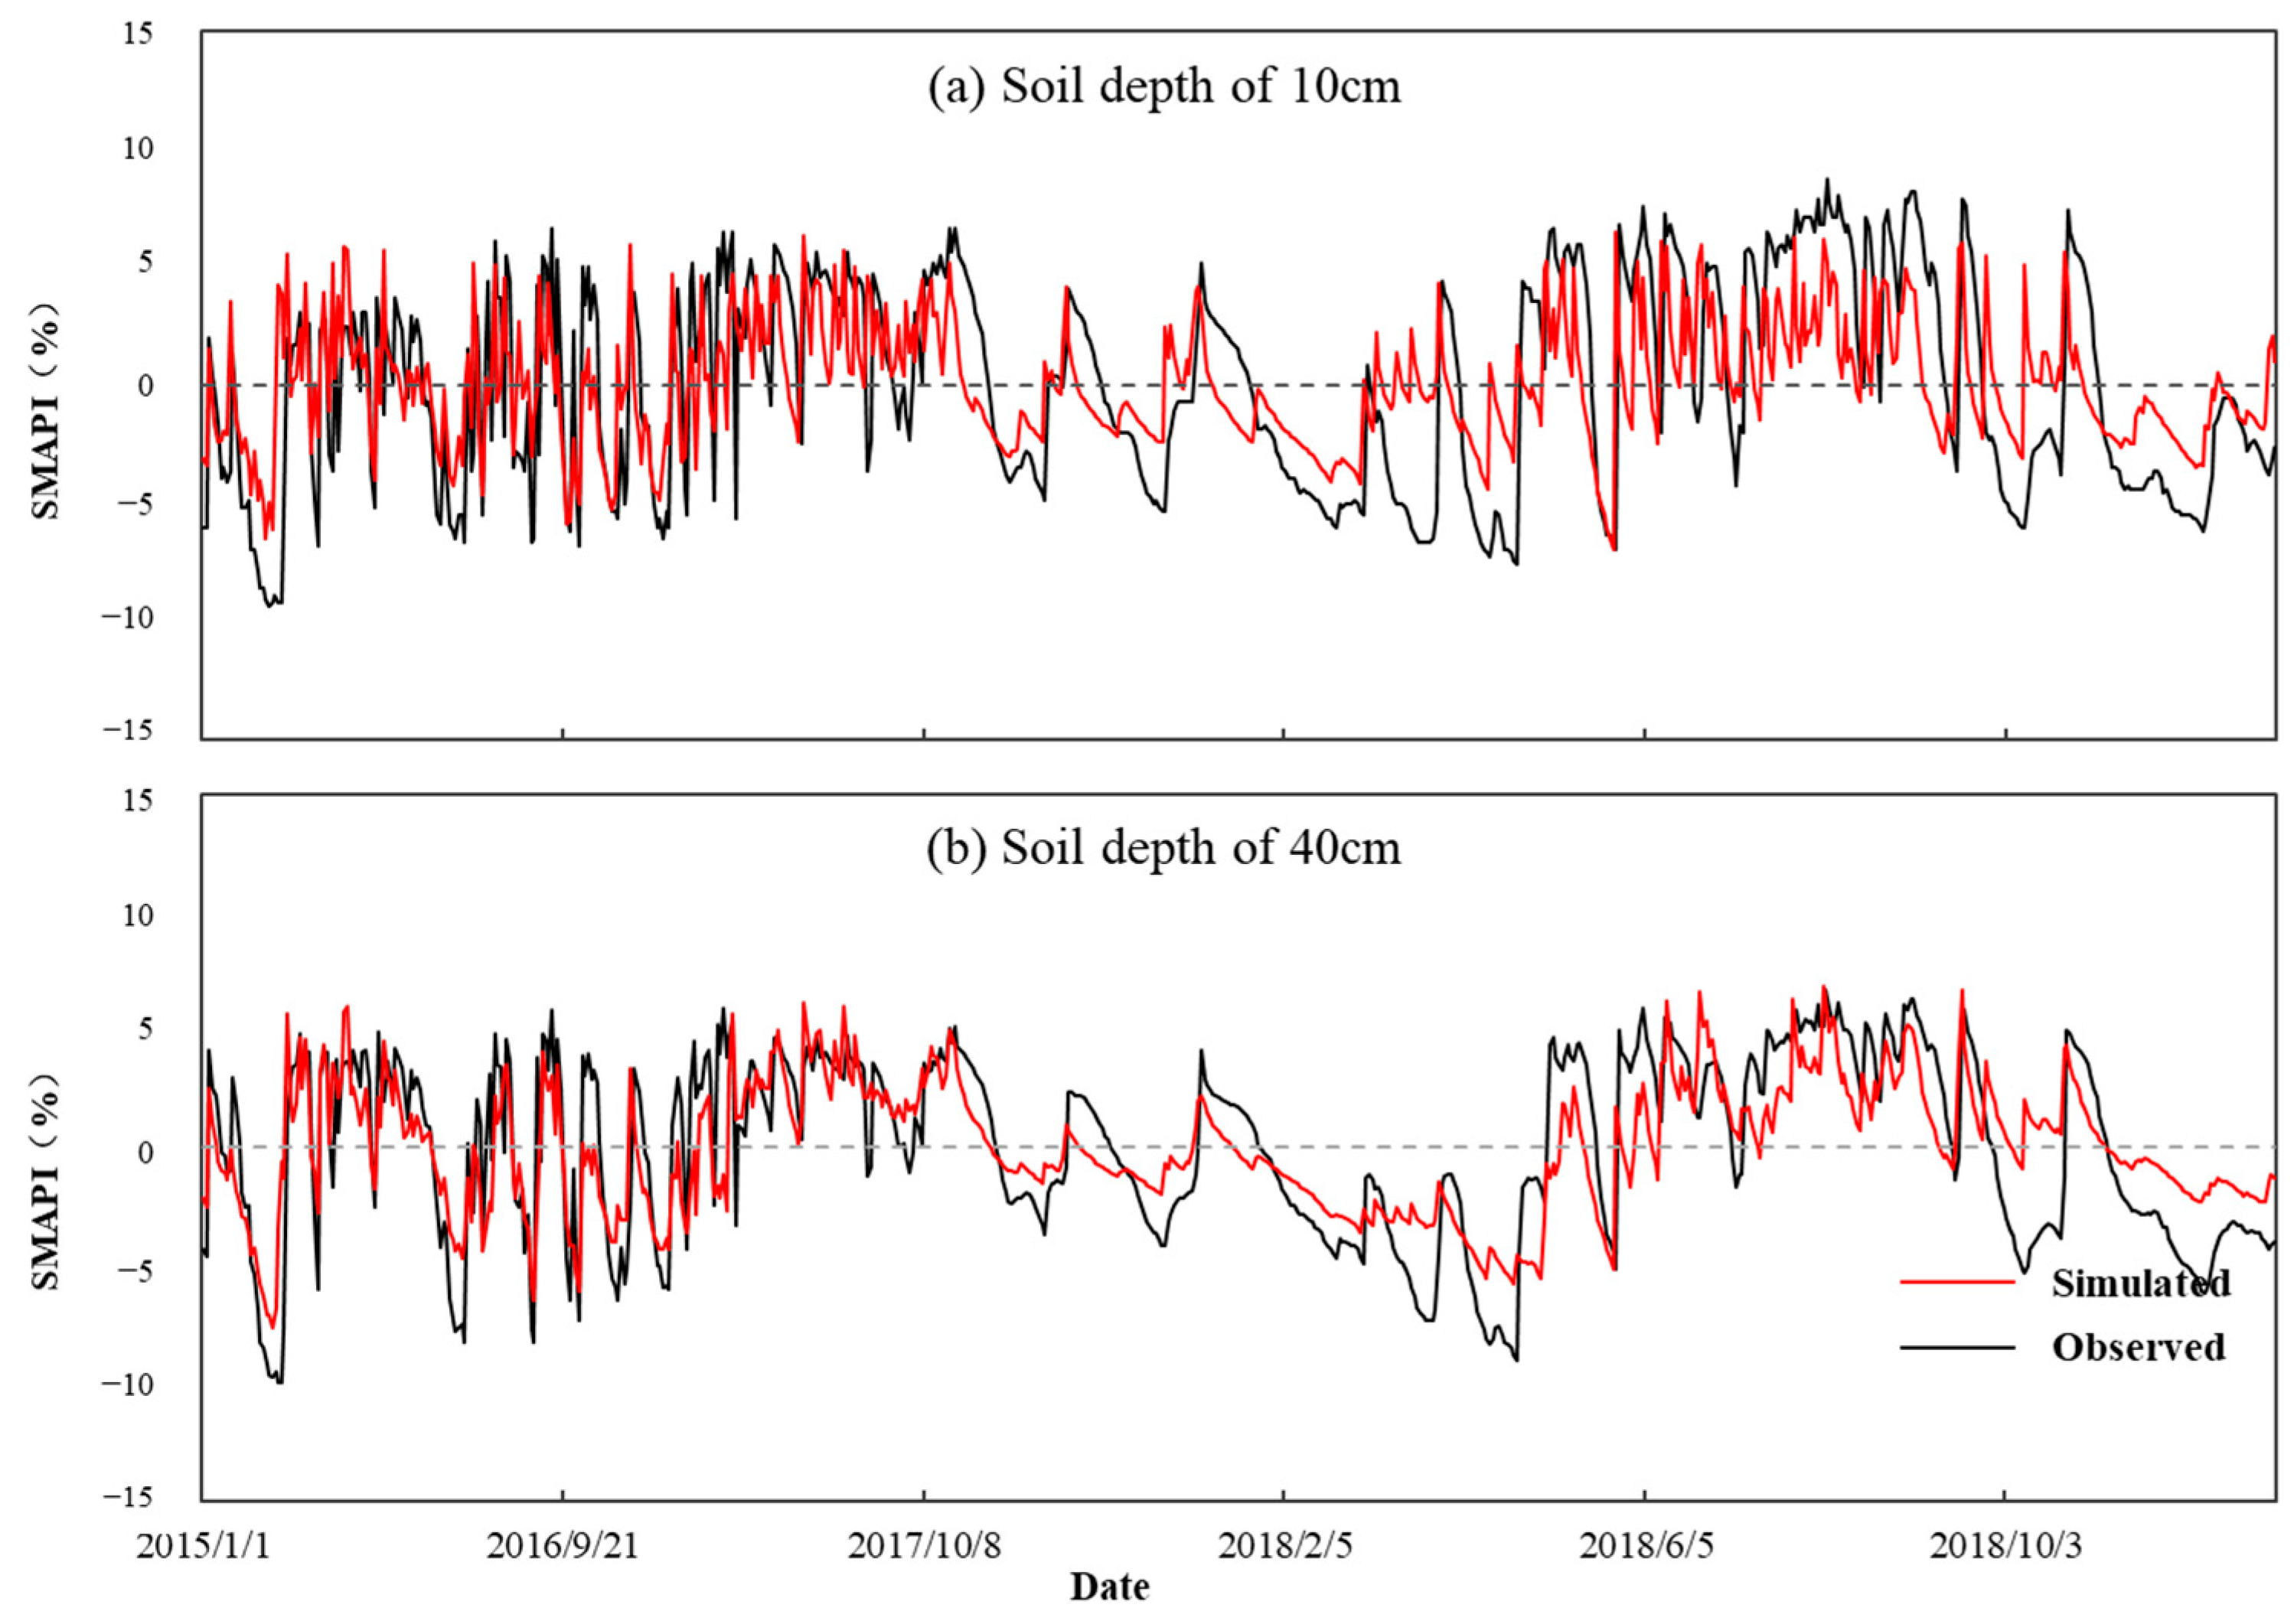
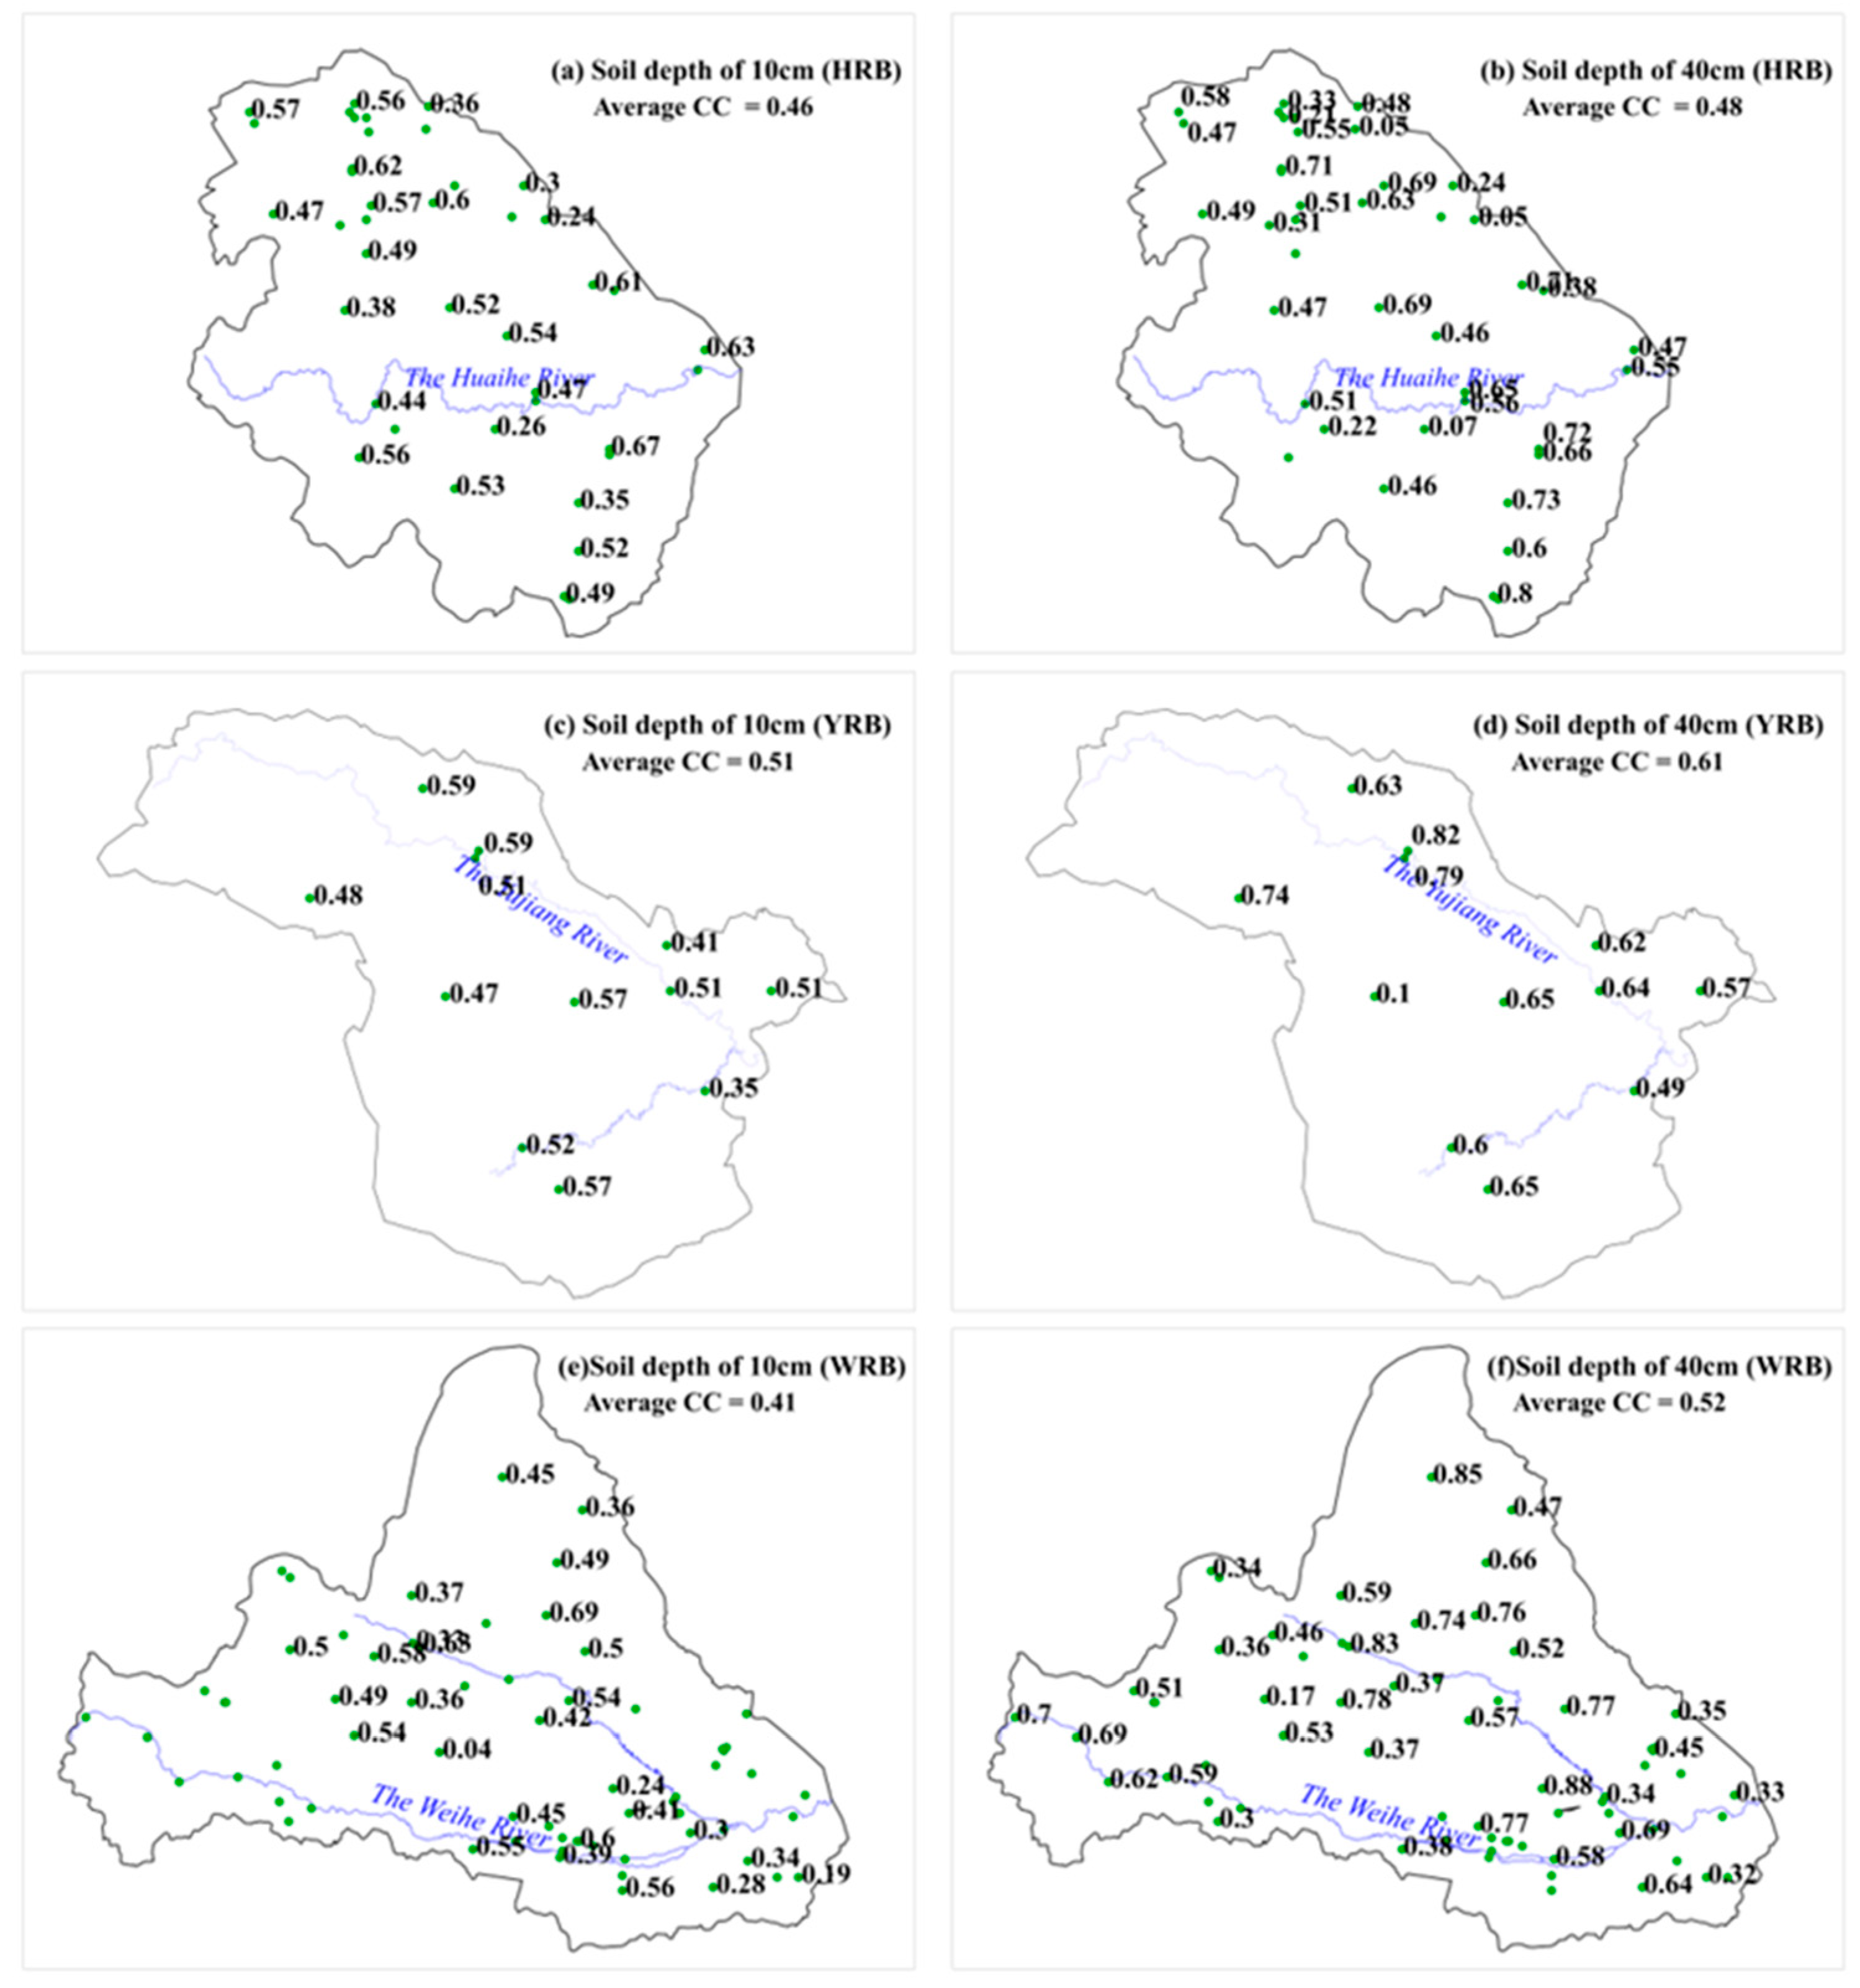
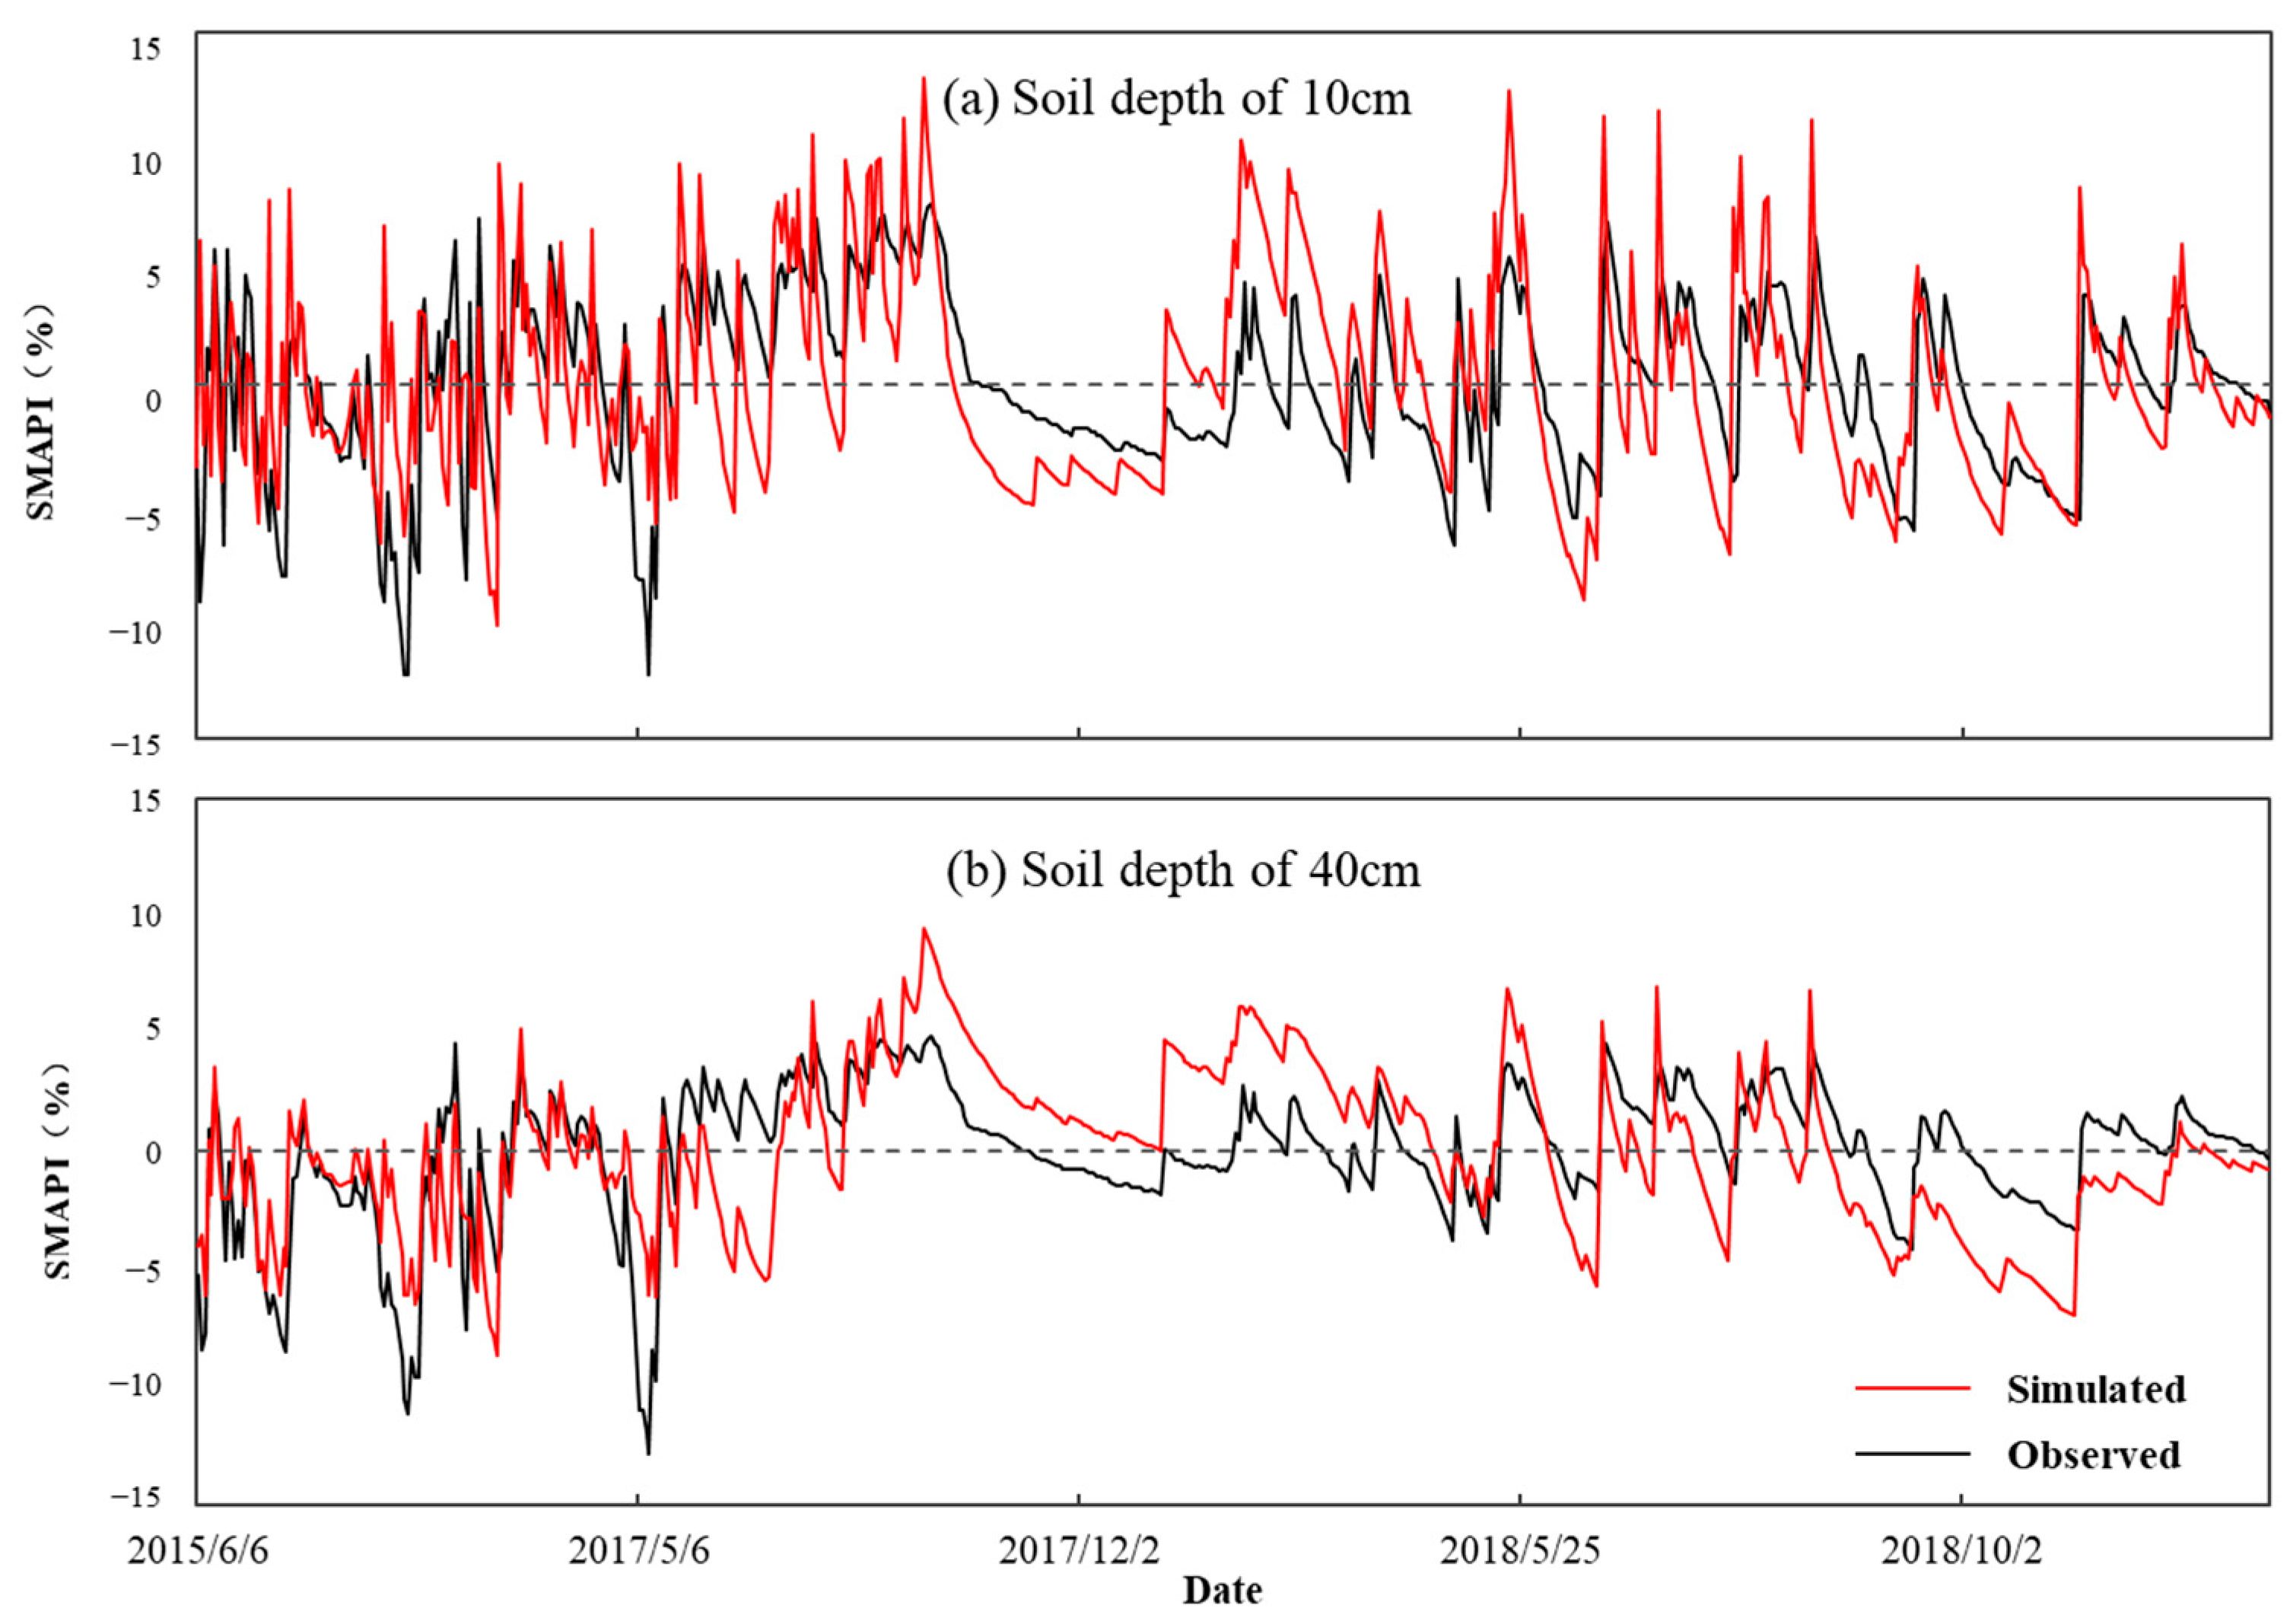
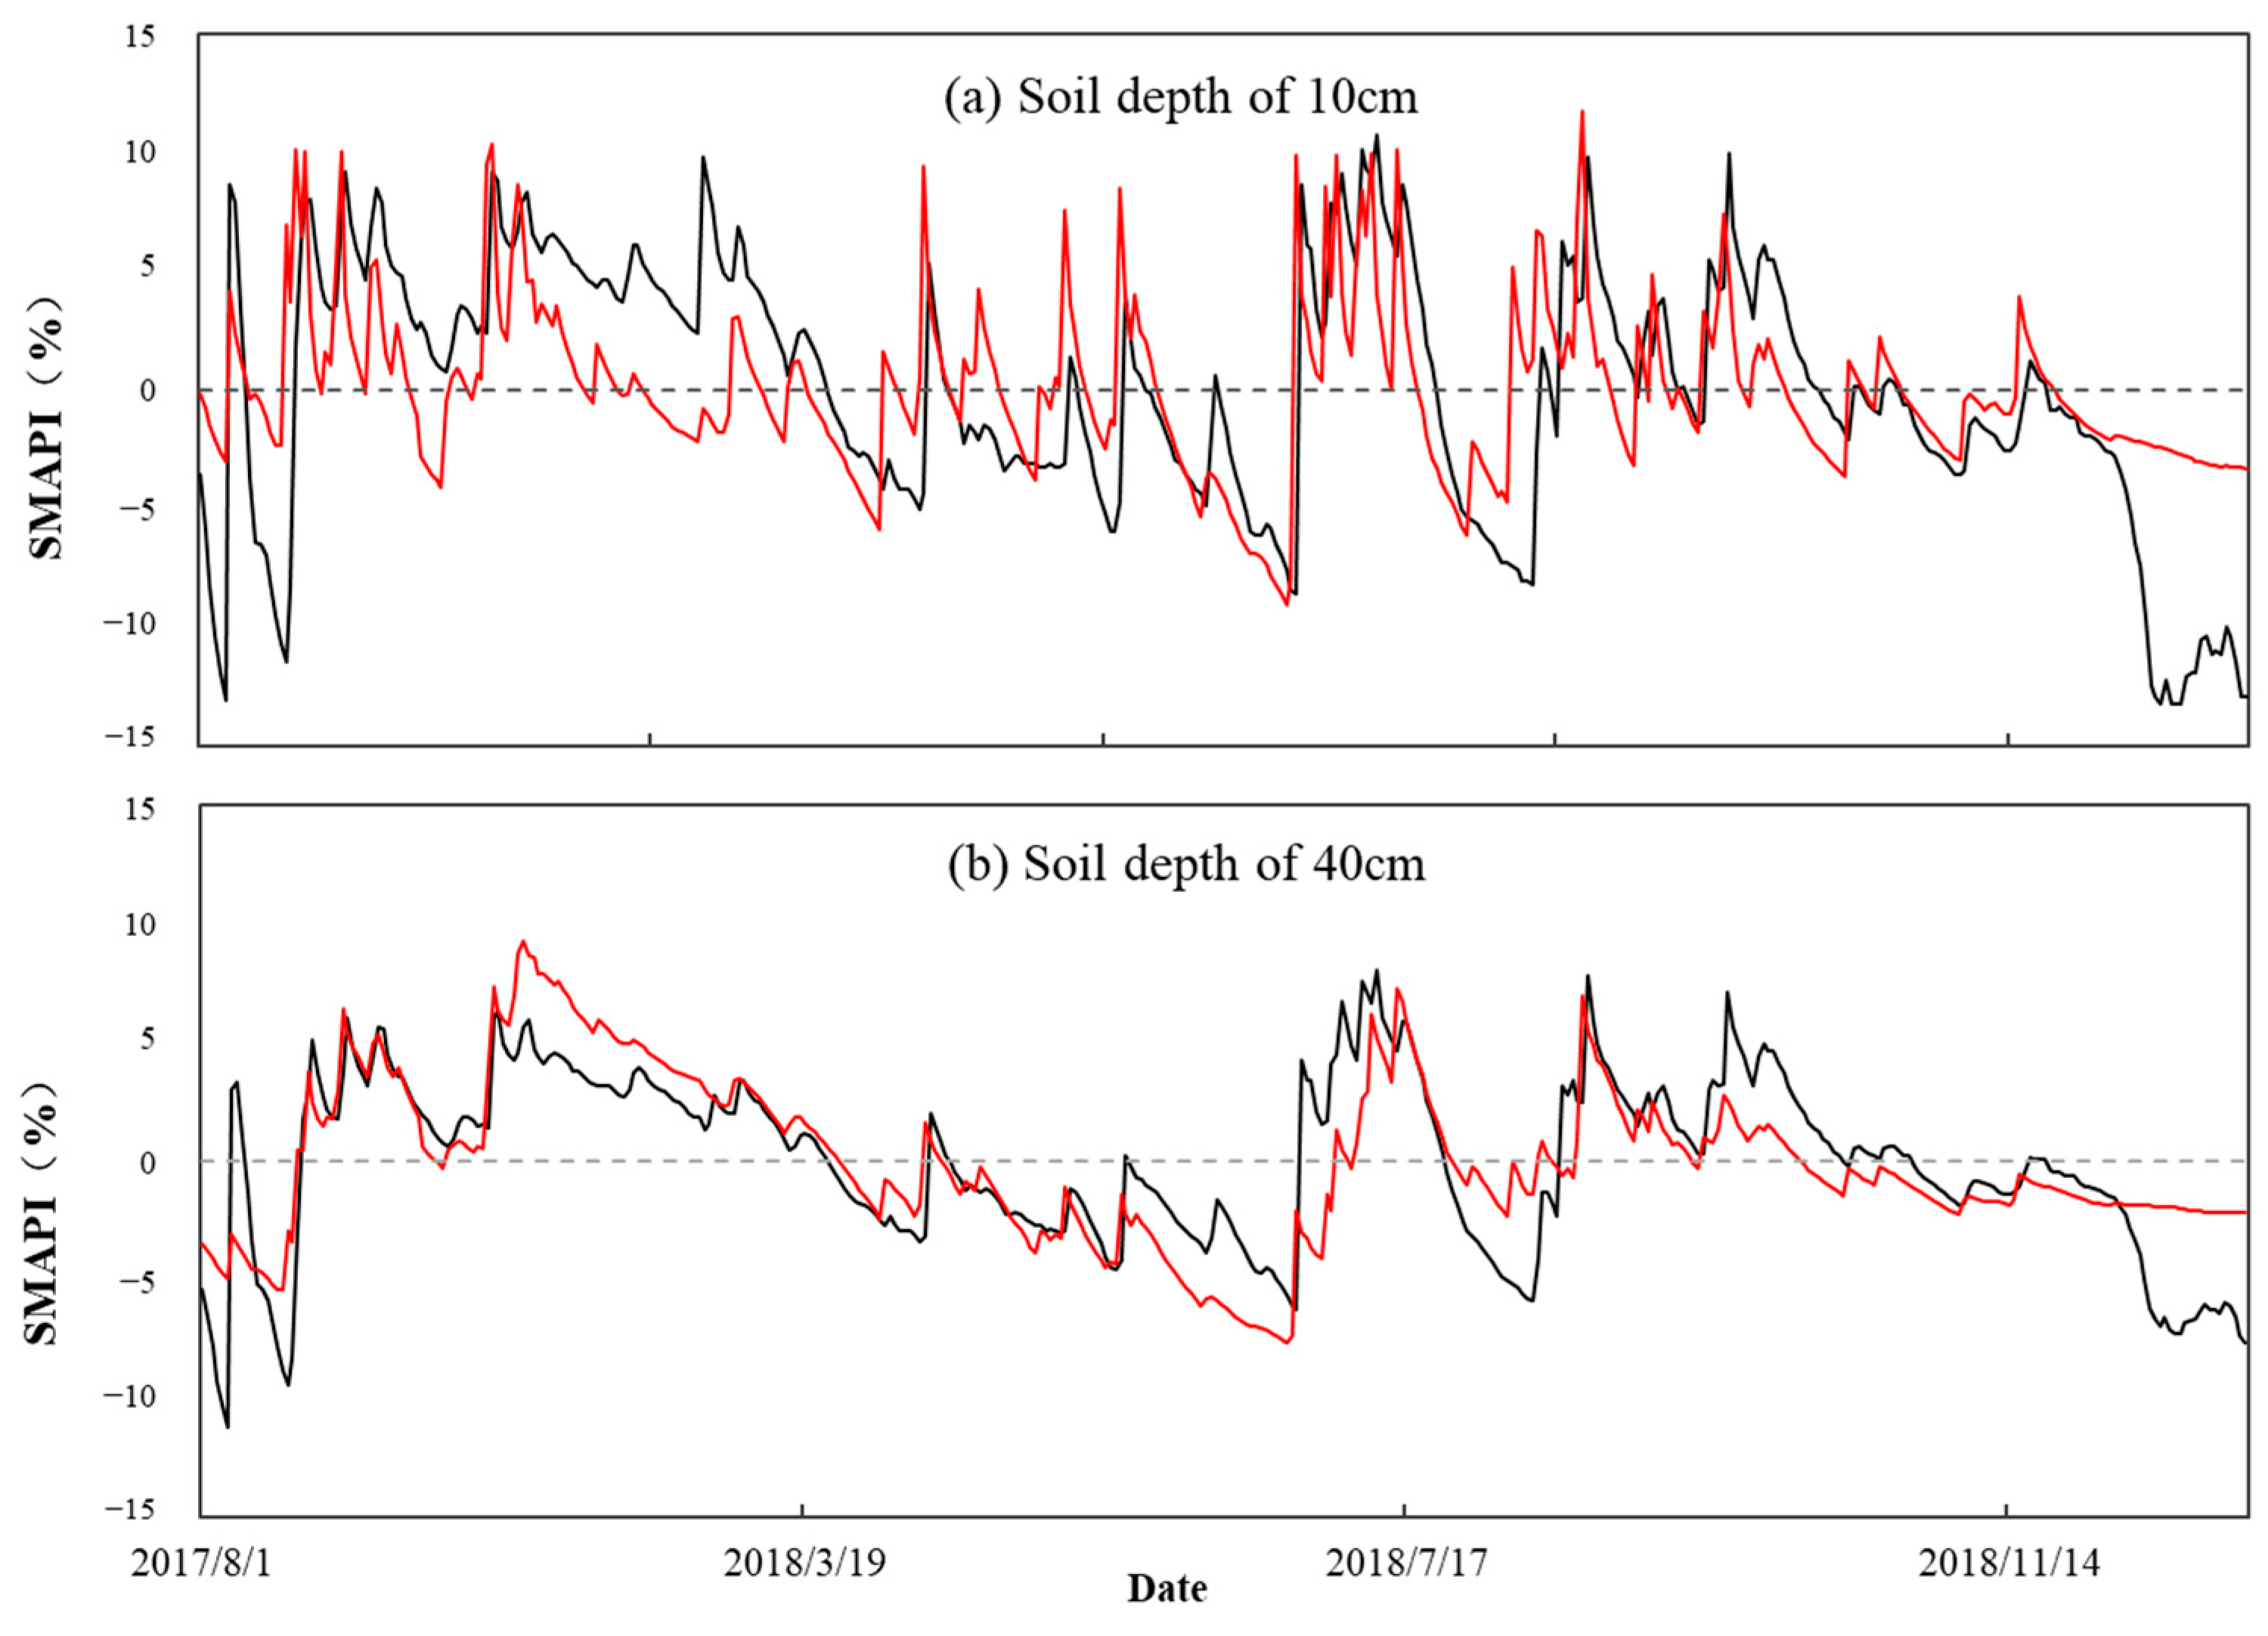
3.1.2. Validation of Soil Moisture

In order to further investigate the soil moisture simulation of the VIC model, in the study, the correlated coefficient (CC) between the observations from soil moisture stations and the simulated soil moisture of the grid in which the soil moisture stations are located was calculated. The soil depths of 10 cm and 40 cm were chosen and the time period is from 2015 and 2018. It is noted that the observed data are mass water content, while the simulated data are volumetric water content, so the bulk density from the VIC model is used to convert the observed mass water content into volumetric water content. Figure 9 shows the CC in the study basins. Overall, CC values of 40 cm are greater than that of 10 cm. In HRB, the average CC around are 0.46 and 0.48, respectively. The highest CC for the depths of 10 cm and 40 cm are 0.67 and 0.80, with 43.9% and 53.7% of stations greater than 0.5. In YRB, the CC between simulated and observed soil moisture is the best, with the highest for the depth of 40 cm reaching 0.82, and the percentage of stations exceeding 0.5 is 66.7% and 88.3%. The average value of the basin is 0.51 and 0.61, for the depths of 10 cm and 40 cm respectively. In WRB, for the soil depths of 10 cm and 40 cm, the average CC around, the highest value, and the percentage of stations greater than 0.5 are 0.41 and 0.52, 0.72 and 0.88, 31.8% and 54.5%, respectively.
In the study, SMAPI is chosen as the matrix reflecting the soil moisture, the time series of observe-based and simulated SMAPI of soil depth of 10 cm and 40 cm of the Bataizhen Station (located at 113.53° E, 33.34° N) in HRB, the Baise Station (located in 106.58° E and 23.86° N) in YRB and the Zhujiazui Station (located in 108.3° E, 35.16° N) in WRB are shown in Figure 10, Figure 11 and Figure 12, respectively. The SMAPI of 10 cm changes more obviously than that of 40 cm because the upper soil moisture is more sensible to and affected by precipitation, while the lower soil moisture is relatively steady. It also shows that the simulated SMAPI can roughly reflect the fluctuation characteristics of observe-based SAMPI, and the SMAPI of 40 cm is more consistent with the actual situations. Generally speaking, the soil moisture simulated by the VIC model has good consistency with the observed values, and the simulated SMAPI is able to be used reasonably in the study, especially in YRB.

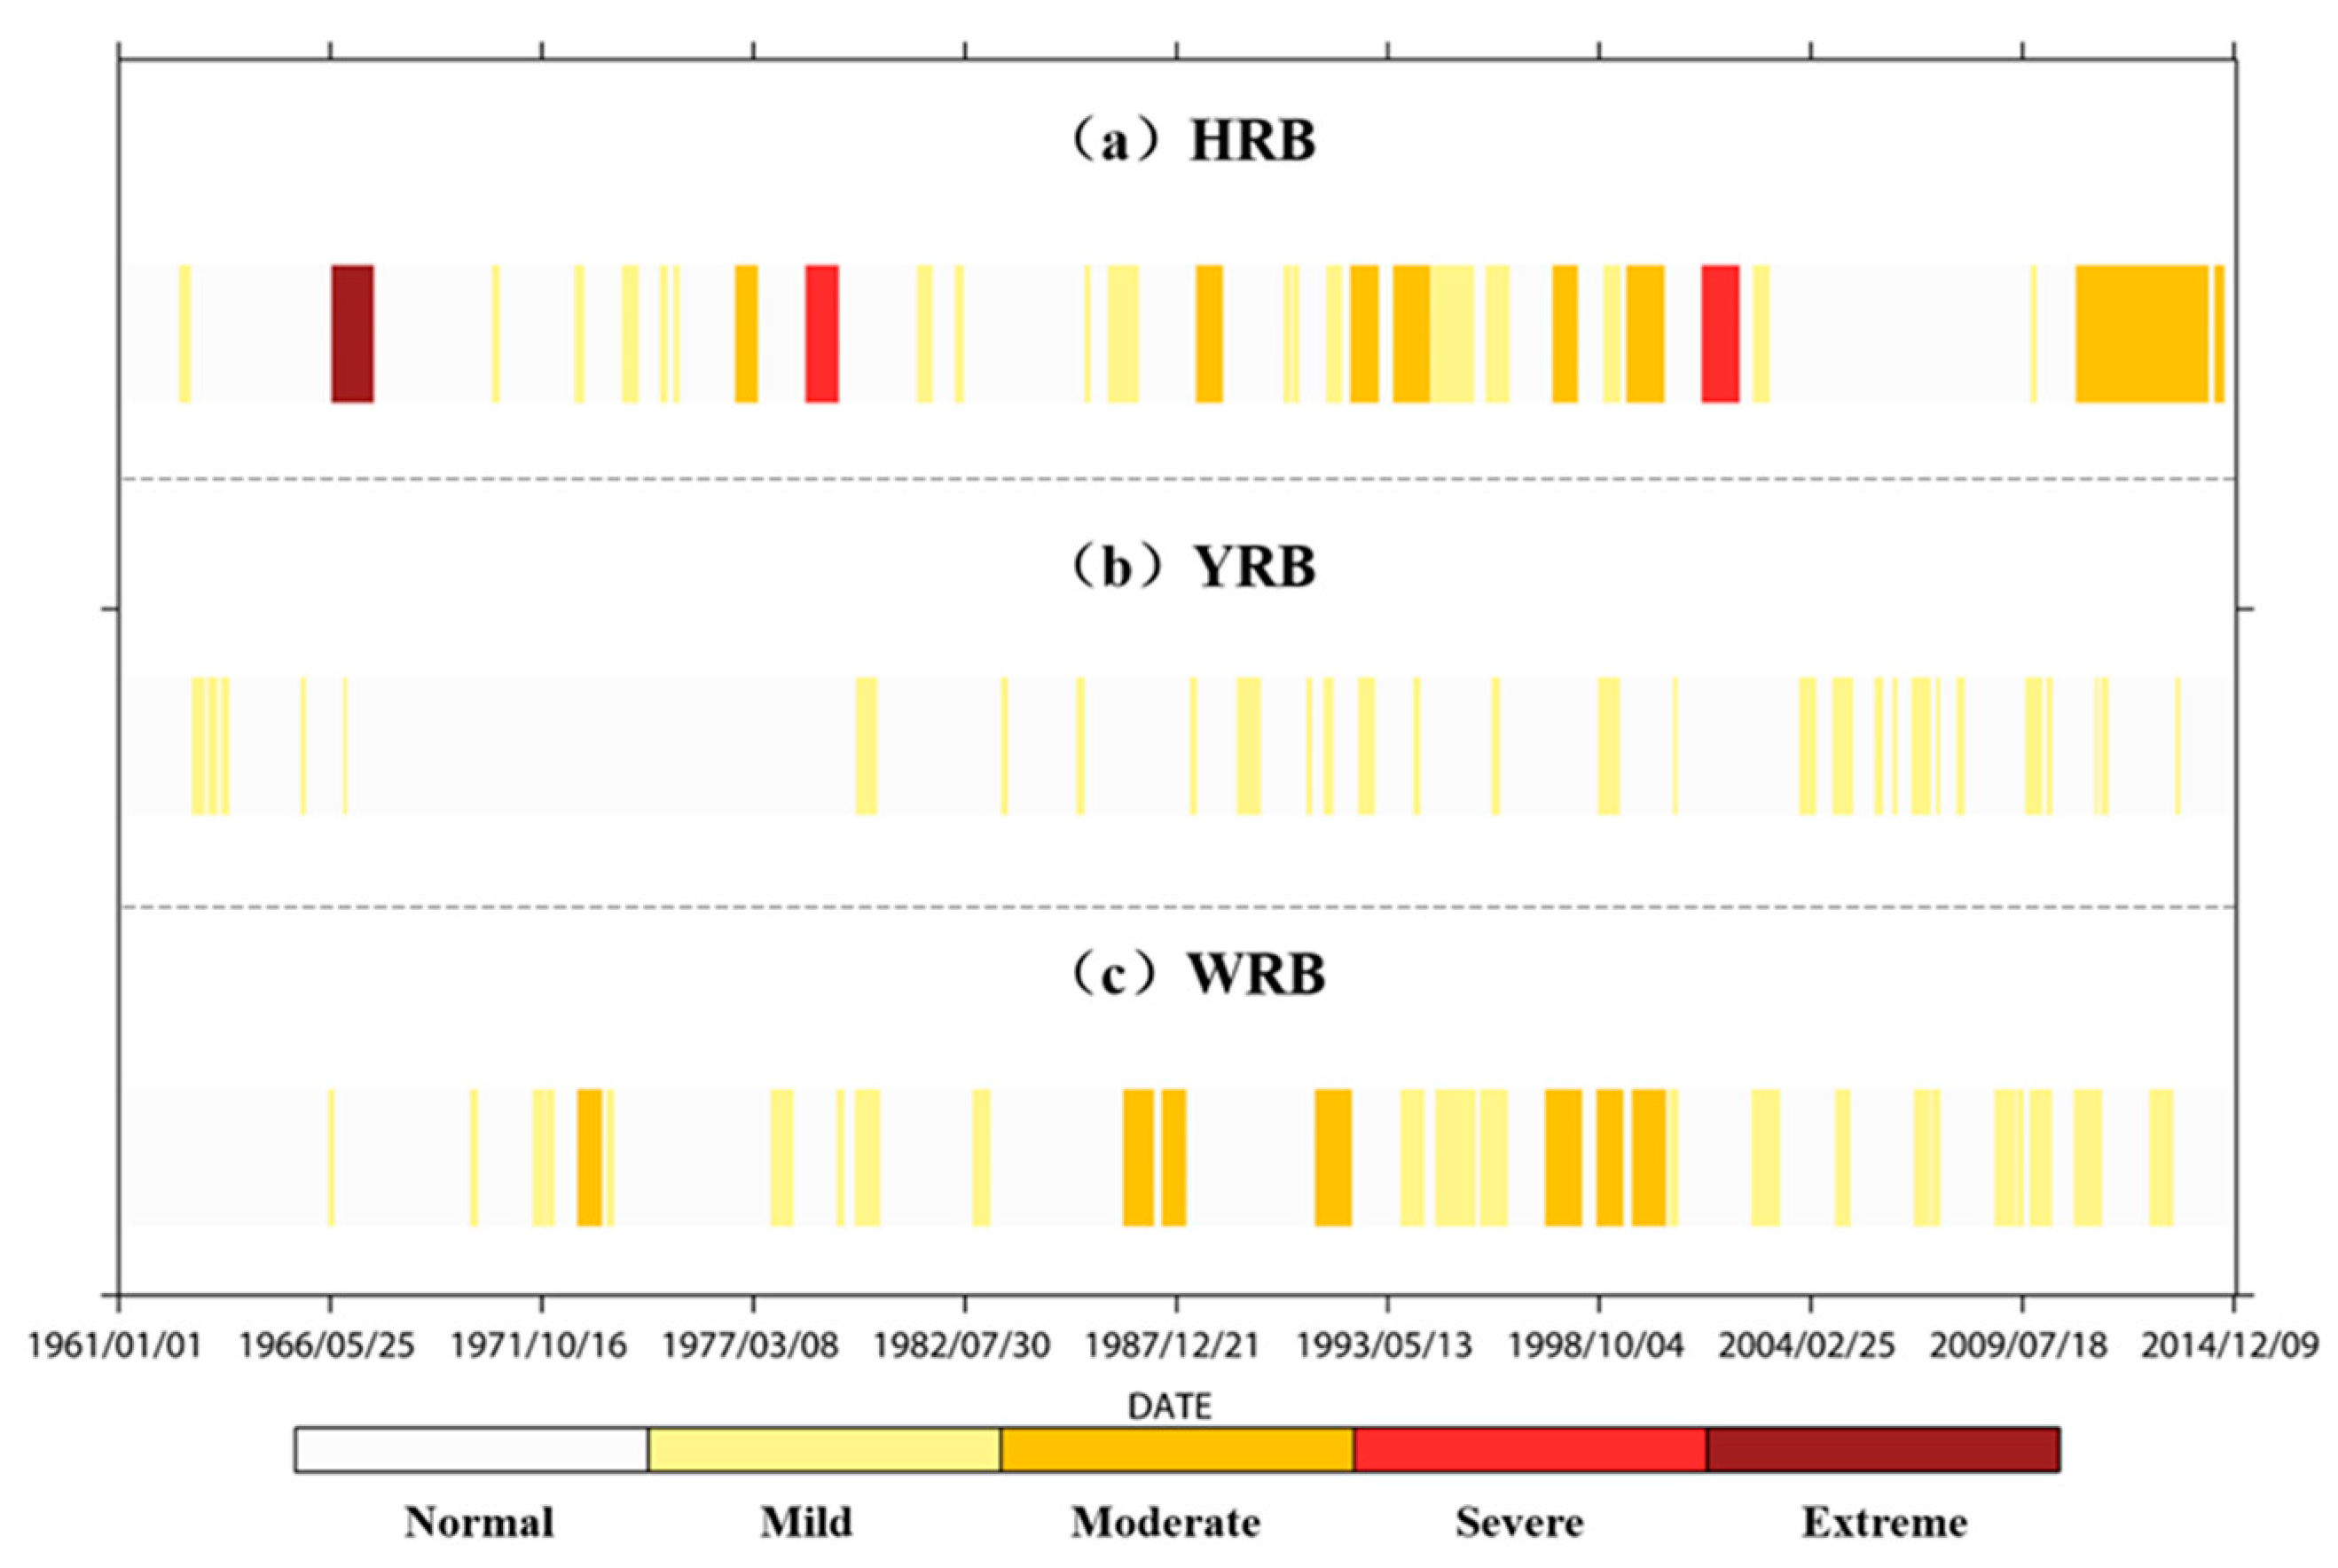
3.2. Identified Historical Drought Events

According to the method of drought process identification, there are 38, 35 and 51 typical drought processes identified from 1962 to 2014 in HRB, YRB and WRB, respectively. In this study, we chose 30 typical events in each basin shown in Figure 13. The results are consistent with the previous studies [56,67,68,69,70,71]. For example, in HRB, the extreme drought that occurred from June 1966 to May 1967 in the study is consistent with the study by Chen Xiaofeng [71], which pointed out that the Huaihe River Basin experienced a severe drought in 1966. In YRB, the identified drought events are consistent with previous studies [72,73]. Meanwhile, in the Weihe River Basin, the drought occurred in the 1970s, late 1980s, 1990s and early 2000s [67,74], and the majority of drought occurred in Huaxian Station from 1977 to 1980, in 1996, 1998, and from 2001 to 2003, especially in 1997 [75], consistent with this study. Therefore, the drought process identification method can effectively identify typical drought events in three basins, and the typical drought processes in the study are credible. At the same time, it is also shown that the WRB are prone to more severe droughts, while the droughts in YRB are mostly light and have a relatively shorter duration.

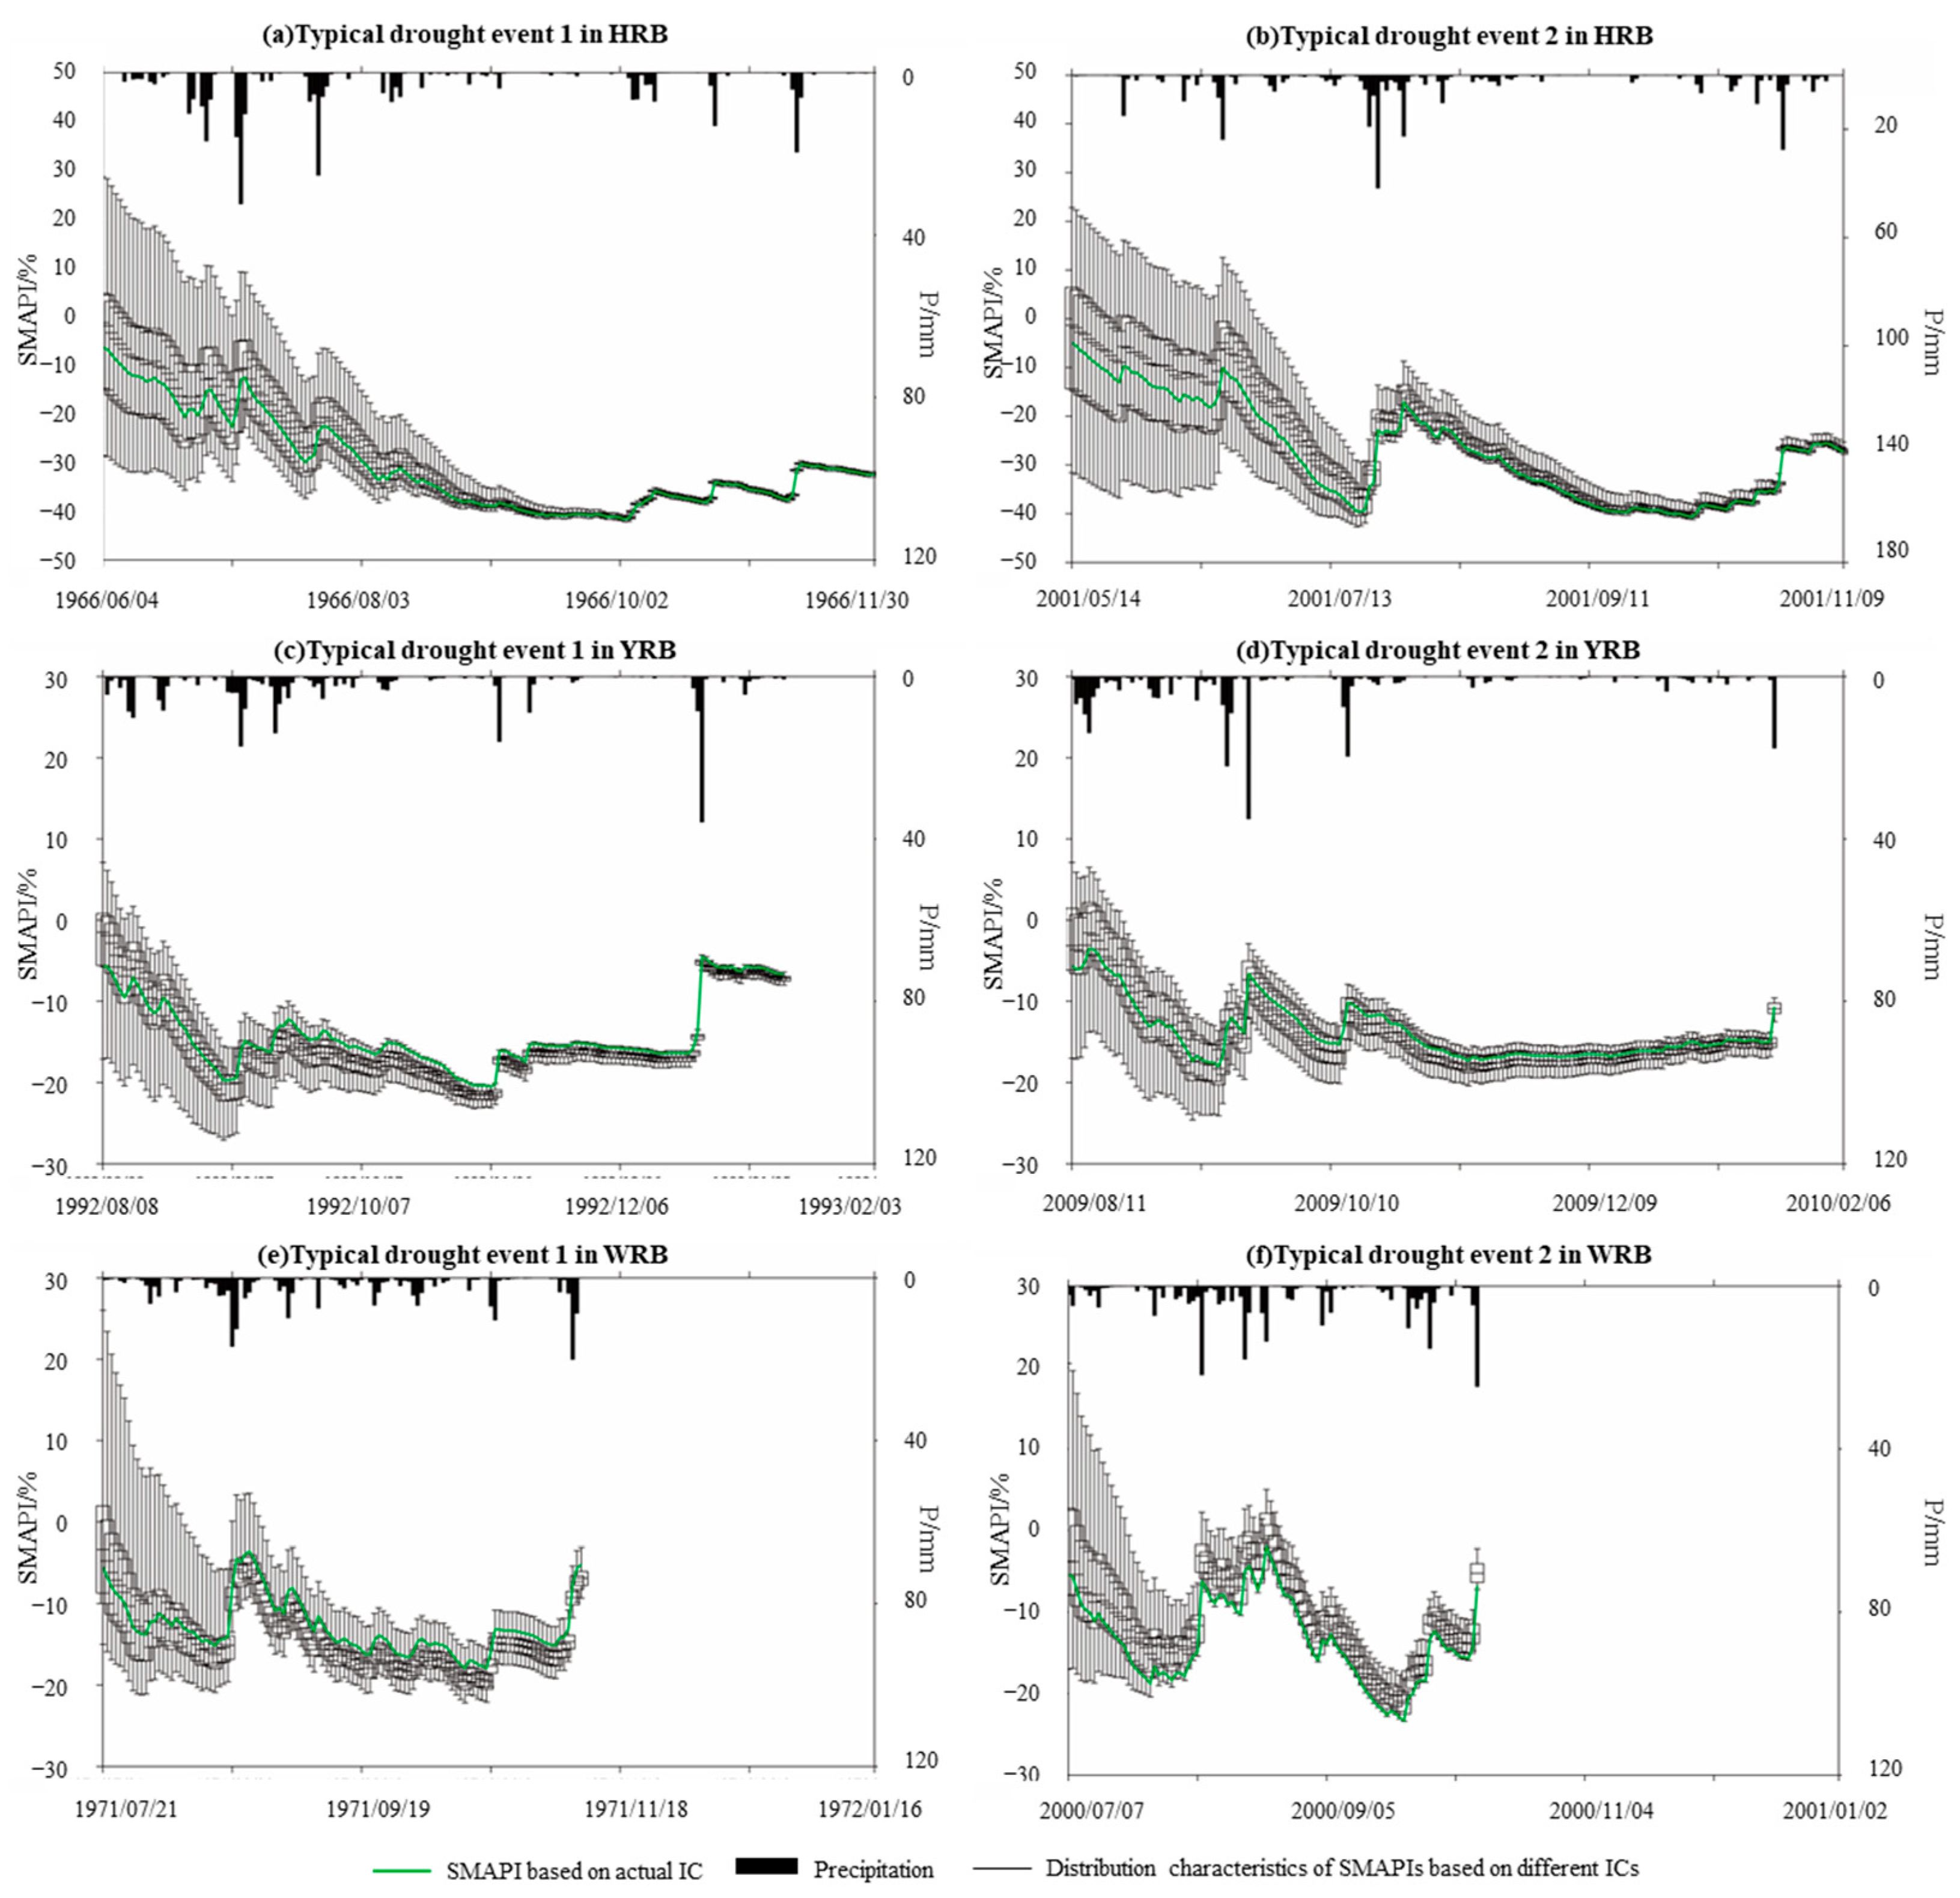
3.3. Drought Processes Based on Different Initial Conditions

In order to investigate the changes in the drought process using different ICs, the daily regional average SMAPIs during historical drought periods were calculated and boxplots were used to analyze the temporal evolution characteristics of SMAPI, as shown in Figure 14. Due to the different drought duration of each historical drought, in order to explore the impact of ICs, the changes in SMAPI from the beginning of the drought to the 180th day of drought occurrence were analyzed, so the drought duration in the horizontal axis of the graph is all 180 days.
Figure 14 shows two historical droughts in HRB, from 4 June 1966 to 3 July 1967 (Figure 14a) and from 14 May 2001 to 1 May 2002 (Figure 14b), two historical droughts in YRB, from 8 August 1992 to 13 January 1993 (Figure 14c) and from 11 August 2009 to 21 January 2010 (Figure 14d), two historical droughts in WRB, from 21 July 1971 to 9 November 1971 (Figure 14e) and 7 July 2000 to 10 October 2000 (Figure 14f), respectively. The daily boxplot represents the SMAPI values from the maximum, 75% percentile, median, 25% percentile, and minimum values for different ICs from the top line to the bottom, with black solid lines in Figure 14. The green line represents the time variation of SMAPI based on actual ICs, while the black bar chart represents the observed precipitation process. It can be seen that in the three study basins, the tendencies of SMAPIs based on different ICs are consistent. Moreover, with the development of drought, due to the impact of ICs reduced [21,43], the differences of SMAPI based on different ICs decrease continuously, bringing the SMAPI values using different ICs gradually converging, representing as the dispersion degree of boxplot decreases in the figure. Whenever precipitation occurs during a drought process, the value of SMAPI based on both actual and different ICs increases, meaning the uncertainty of the drought process in different soil ICs decreases.
There are differences in the impact of ICs on historical drought processes in different study basins. For instance, for the historical drought in Figure 14a, from the beginning of the drought to the 120th day of drought occurrence, the SMAPI values using different ICs were almost the same, indicating that the impact of the ICs on this historical drought lasted for about 120 days, and before the end of the drought, the ICs have little effect on drought process simulation. As for the historical drought that lasted for 164 days in Figure 14d, although the uncertainty of SMAPI decreased over time, there was still uncertainty in the SMAPIs when this drought ended, indicating that the impact of ICs lasted until the drought ended.

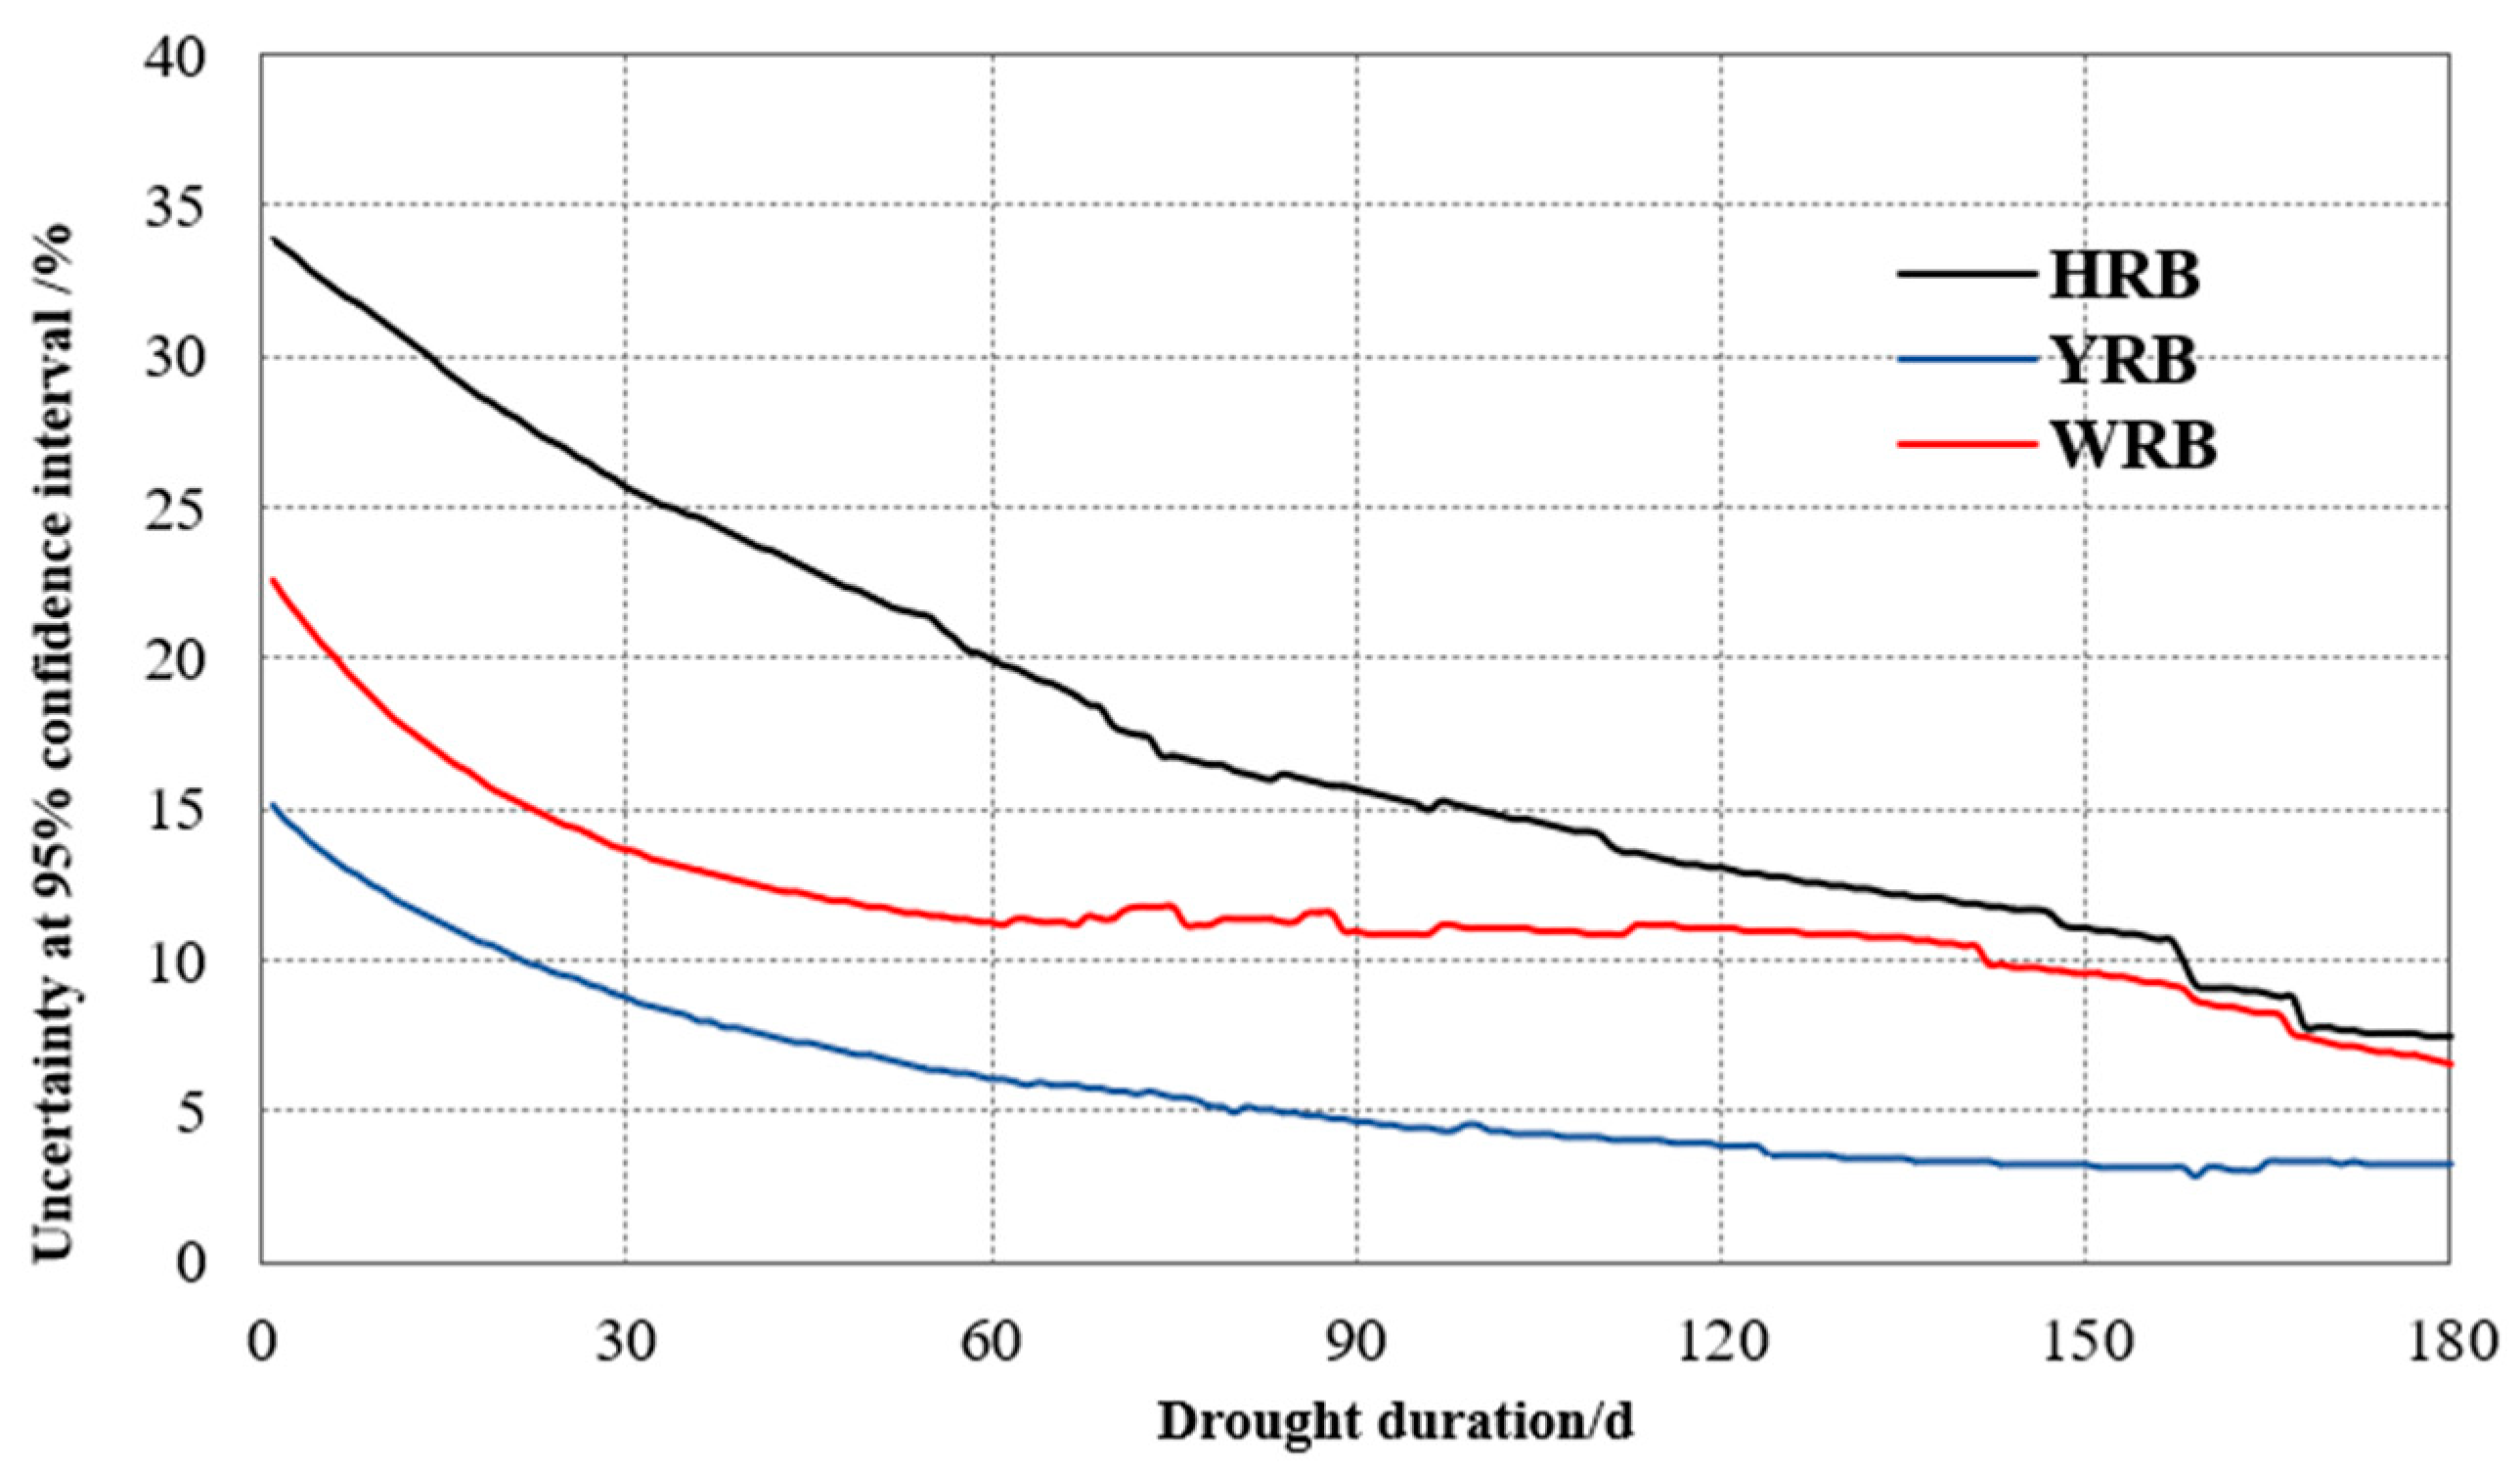
3.4. Uncertainty Characteristics of the Impact of Different Initial Soil States on Drought Processes

In order to explore the characteristics of uncertainty in drought processes using different ICs, based on Equation (2), the time series of uncertainty caused by ICs during the drought process in each basin was obtained. At the confidence interval of 95%, the uncertainty in the three basins is shown in Figure 15. It can be seen that the uncertainty of SMAPI gradually decreases over time in all three basins based on different ICs, but there are significant differences in the trend and speed of uncertainty change in different basins.
In detail, in HRB, the uncertainty is the highest, with an uncertainty of 33.9% when drought begins, and decreases fastest with the development of drought among the three basins, while in YRB, the uncertainty is the lowest, with 15.1% when drought occurs, and decreases the slowest. The WRB is between the other two basins.
Meanwhile, from Figure 15, it can also be seen that in YRB, when the drought develops to 90 days, the uncertainty is within 5%, indicating that the error of SMAPI values in the basin is within 5%. Therefore, after the 90th day of the drought process, the error of drought classification identification caused by ICs decreases. In the other two basins, when droughts last 160 day/150 days, the uncertainty decreases to 10%, indicating that the uncertainty caused by ICs are still more obvious than that in YRB.
There are still differences in the decrease rate of uncertainty in different drought periods in a certain basin. The rates are the fastest from the onset to the 30th day in all 3 basins. In HRB, the decrease rate is about half from the 30th to the 90th day, and about one-fourth from the 90th to the 180th day of that before the 30th day. In YRB, with the development of drought, the decrease rate between the 30th and 60th day is about half of that before the 30th day, while the uncertainty after the 60th day decreases gradually. In WRB, the uncertainty does not change significantly from the 60th to the 150th day during the drought process, and the subsequent decrease rate slightly increases.

4. Discussion

In order to further investigate the impact factors causing the difference of uncertainty by ICs in drought process simulation in different climate zones, in the study, characteristics of climate and land surface were further analyzed to get how the hydrothermal, soil and vegetation characteristics affect the uncertainty.
Revealing the impact of hydrothermal characteristics on the uncertainty of drought process simulation was conducted from three perspectives: precipitation, evaporation and temperature.
Firstly, we selected mean, standard deviation, departure coefficient and skewness coefficient to statistically analyze the characteristics of precipitation, evaporation and temperature from 1961 to 2014 in each basin. It shows that the average of the three variables in YRB is the highest among the three basins, followed by HRB and then WRB, while the standard deviation and departure coefficient of precipitation and evaporation are the highest in HRB, followed by WRB and then YRB. At the same time, temperature changes the most significantly in WRB, followed by HRB. And then to further clarify the hydrothermal characteristics, the study also focused on the changes in precipitation and temperature within the year. In HRB, the maximum daily precipitation appeared at the end of June and early July, while the maximum temperature appeared at the end of July, slightly lagging behind. The minimum daily precipitation and temperature both appeared in early January. In YRB, the daily precipitation starts to increase since May, continuously stays in the high-value zone from June to August, and then the precipitation in autumn and winter significantly decreases. Compared to precipitation, the temperature changes smoothly, and high/low temperatures appear at the corresponding periods with precipitation. The daily precipitation in WRB is obviously lower than the other two basins, and frequently reaches high values from the beginning of July to the end of August, consistent with Zhao et al. [76], while the temperature gradually increases from January to July, reaching the maximum, and then gradually decreases, with a more significant change than precipitation. Generally speaking, among the three basins, the hydrothermal characteristics in HRB vary the most significantly, followed by WRB and then YRB, so it can be seen that the fewer changes in precipitation and temperature, and the more consistent the occurrence time of high values of daily precipitation and temperature in the climate zone, the fewer ICs affected the uncertainty of drought processes.
In terms of soil characteristics, it is known that the change of soil moisture can not only affect the surface albedo, heat capacity, the growth status of land vegetation and evapotranspiration, but also affect the thermal properties and hydrological processes of the soil itself, leading to later precipitation changes and temperature anomalies [77,78,79]. The impact of soil moisture on climate has significant spatial characteristics. In dry–wet climate transition zones and monsoon areas, soil moisture has a strong feedback effect on precipitation and has a strong ability to control evapotranspiration [78,80]. HRB is located in a humid to semi-humid climate transition zone, with significant changes in precipitation, temperature and soil moisture [81], causing the high uncertainty of soil moisture, and the impact of ICs on drought processes, while YRB is located in the humid area of China, with abundant precipitation [82] and relatively humid soil. The change in soil moisture is relatively small, with low uncertainty. Therefore, the uncertainty of drought processes caused by ICs is low. In WRB located in the transition zone of a semi-humid and semi-arid climate [76], the precipitation and the variability of precipitation, evaporation and temperature in this basin are relatively lower than the other two and the change of soil moisture and its uncertainty are correspondingly lower, leading to lower uncertainty of drought processes simulation affected by ICs.
The study selected the soil type as the matrix of soil characteristics, and the soil types in each basin are based on that of the VIC model based on the soil database developed by Reynolds et al. [83]. From the perspective of soil type, clay has the largest porosity and poor water permeability [84], so more water can remain in clay, and the change of soil moisture is relatively small, while in sand with a relatively smaller porosity, better permeability and a larger variation in soil moisture, such as in YRB, the soil type is mainly clay, so the soil moisture and its effects on drought process simulation uncertainty are small. The soil type of HRB is loam, which contains more sand and silt than clay, with weaker porosity and stronger permeability than that of clay, causing less uncertainty of ICs on drought processes than that in YRB. And in WRB, the soil type is a mixture of clay and loam, and therefore with a moderate uncertainty in the three basins.
The global soil porosity estimates from European Space Agency’s CCI soil moisture data product V4.2 [85] were used to more intuitively demonstrate the impact of soil characteristics in different basins on the uncertainty of drought processes simulation, and the spatial distribution in the three basins is shown in Figure 16. From the figure, it can be seen that the porosity of YRB is the highest among the three basins, followed by HRB, and WRB has the lowest porosity. Based on the analysis above, it can be further verified that when the soil porosity is high, the uncertainty of the drought process results caused by ICs is low, and vice versa. It should be noted that although the soil porosity in WRB is slightly lower than that in HRB, the drought process uncertainty affected by ICs is influenced by multiple factors, so the contribution of each factor needs further in-depth research.
The vegetation types, representing vegetation characteristics, are another key factor that causes uncertainty differences in drought process simulation in different climatic zones. According to the VIC model extracted by the UMd land cover data developed by Hansen et al. [86], the main vegetation type in HRB is arable land, with loose quality causing significant changes in soil moisture. While the vegetation in the other two basins is mostly mixed forests and shrubs, the soil is denser than arable land, with relatively fewer changes in soil moisture. Therefore, HRB has the most significant uncertainty in drought simulation.

5. Conclusions

The impacts of IC on drought process simulation and prediction uncertainty based on atmospheric–hydrological coupling are different with the drought duration, basin size and region. This study proposes a quantitative method to analyze the effects in three typical basins, the HRB, the YRB and the WRB, located in different climatic zones, by investigating the uncertainty of simulated SMAPI with different ICs. Here, the VIC model is chosen as the hydrological model to get simulated SMAPI, and the model is proven ideal to reflect runoff and soil moisture, as well as historical drought events in the three basins. The results showed that the uncertainty of drought processes caused by ICs gradually decreases with the development of drought, reaching within 10% when droughts last for 5~6 months, and the decrease rate of uncertainty differs in different climate zones. Generally, the uncertainty and its decrease rate are the largest in HRB located in the transition zone between humid and semi-humid regions, followed by WRB located in the transition zone between semi-humid and semi-humid regions, and the smallest in YRB located in humid regions.
The differences in the hydrothermal, soil and vegetation characteristics in different climatic zones are the main factors causing uncertainty differences. The more obviously precipitation varies in the climate zone, the greater the change in soil moisture in the basin, and the greater the uncertainty of the drought process results. The temperature is also one of the main reasons for the uncertainty differences in drought processes among climate zones. The more uniform the water–heat distribution in climate zones, the lower the uncertainty of drought processes. In terms of land surface, the soil and vegetation types are important factors that affect the drought processes simulation uncertainty, especially since higher soil porosity brings lower uncertainty, and vice versa.
It should be noted that the drought process uncertainty affected by ICs is influenced by multiple factors, and the contribution of each factor associating with hydrothemal characteristics, soil and vegetation types needs further in-depth research.

Author Contributions

Conceptualization, Z.W., H.X. and H.H.; methodology, Z.W. and H.X.; software, H.X.; validation, H.X., Z.W. and R.C.; writing—original draft preparation, H.X.; writing—review and editing, H.X. and X.W. All authors have read and agreed to the published version of the manuscript.

Funding

This research was funded by the National Natural Science Foundation of China (No. U2240225) and the China Postdoctoral Science Foundation (Certificate Number: 2023M732317).

Data Availability Statement

The raw data can be obtained through public websites or water yearbooks, and the analyzed data and processed code used in this study can be accessed by contacting the corresponding author upon reasonable request.

Acknowledgments

The researchers show special thanks to Lifeng Luo, who is working in the Department of Geography, Environment, and Spatial Sciences at Michigan State University. The authors also would like to thank the editors and the anonymous reviewers for their comments, which helped improve the quality of the paper.

Conflicts of Interest

The authors declare no conflict of interest.

References

  1. Parmesan, C.; Morecroft, M.D.; Trisurat, Y. Climate Change 2022—Impacts, Adaptation and Vulnerability; GIEC: Geneva, Switzerland, 2023. [Google Scholar]
  2. Zhang, A.; Zhang, C.; Fu, G.; Wang, B.; Bao, Z.; Zheng, H. Assessments of Impacts of Climate Change and Human Activities on Runoff with SWAT for the Huifa River Basin, Northeast China. Water Resour. Manag. 2012, 26, 2199–2217. [Google Scholar] [CrossRef]
  3. Song, S.; Nie, Z.; Geng, X.; Shen, X.; Wang, Z.; Zhu, P. Response of runoff to climate change in the area of runoff yield in upstream Shiyang River Basin, Northwest China: A case study of the Xiying River. J. Groundw. Sci. Eng. 2023, 11, 89–96. [Google Scholar] [CrossRef]
  4. Liu, Y.; Xu, Y.; Zhao, Y.; Long, Y. Using SWAT Model to Assess the Impacts of Land Use and Climate Changes on Flood in the Upper Weihe River, China. Water 2022, 14, 2098. [Google Scholar] [CrossRef]
  5. Satoh, Y.; Yoshimura, K.; Pokhrel, Y.; Kim, H.; Shiogama, H.; Yokohata, T.; Hanasaki, N.; Wada, Y.; Burek, P.; Byers, E.; et al. The timing of unprecedented hydrological drought under climate change. Nat. Commun. 2022, 13, 3287. [Google Scholar] [CrossRef] [PubMed]
  6. Yang, P.; Zhang, S.; Xia, J.; Zhan, C.; Cai, W.; Wang, W.; Luo, X.; Chen, N.; Li, J. Analysis of drought and flood alternation and its driving factors in the Yangtze River Basin under climate change. Atmos. Res. 2022, 270, 106087. [Google Scholar] [CrossRef]
  7. Zhang, G.; Gan, T.Y.; Su, X. Twenty-first century drought analysis across China under climate change. Clim. Dyn. 2021, 59, 1665–1685. [Google Scholar] [CrossRef]
  8. Chen, L.; Wang, G.; Miao, L.; Gnyawali, K.R.; Li, S.; Amankwah, S.O.Y.; Huang, J.; Lu, J.; Zhan, M. Future drought in CMIP6 projections and the socioeconomic impacts in China. Int. J. Climatol. 2021, 41, 4151–4170. [Google Scholar] [CrossRef]
  9. Song, Z.; Xia, J.; She, D.; Li, L.; Hu, C.; Hong, S. Assessment of meteorological drought change in the 21st century based on CMIP6 multi-model ensemble projections over mainland China. J. Hydrol. 2021, 601, 126643. [Google Scholar] [CrossRef]
  10. Zhang, G.; Su, X.; Singh, V.P.; Ayantobo, O.O. Appraising standardized moisture anomaly index (SZI) in drought projection across China under CMIP6 forcing scenarios. J. Hydrol. Reg. Stud. 2021, 37, 100898. [Google Scholar] [CrossRef]
  11. Huang, T.; Wu, Z.; Xiao, P.; Sun, Z.; Liu, Y.; Wang, J.; Wang, Z. Possible Future Climate Change Impacts on the Meteorological and Hydrological Drought Characteristics in the Jinghe River Basin, China. Remote Sens. 2023, 15, 1297. [Google Scholar] [CrossRef]
  12. Lin, Q.; Wu, Z.; Zhang, Y.; Peng, T.; Chang, W.; Guo, J. Propagation from meteorological to hydrological drought and its application to drought prediction in the Xijiang River basin, South China. J. Hydrol. 2023, 617, 128889. [Google Scholar] [CrossRef]
  13. Xu, Z.; Wu, Z.; Shao, Q.; He, H.; Guo, X. From meteorological to agricultural drought: Propagation time and probabilistic linkages. J. Hydrol. Reg. Stud. 2023, 46, 101329. [Google Scholar] [CrossRef]
  14. Wilhite, D.A.; Glantz, M.H. Understanding: The drought phenomenon: The role of definitions. Water Int. 1985, 10, 111–120. [Google Scholar] [CrossRef]
  15. Kiem, A.S.; Johnson, F.; Westra, S.; van Dijk, A.; Evans, J.P.; O’Donnell, A.; Rouillard, A.; Barr, C.; Tyler, J.; Thyer, M.; et al. Natural hazards in Australia: Droughts. Clim. Chang. 2016, 139, 37–54. [Google Scholar] [CrossRef]
  16. Zhang, Y.; You, Q.; Chen, C.; Ge, J.; Adnan, M. Evaluation of Downscaled CMIP5 Coupled with VIC Model for Flash Drought Simulation in a Humid Subtropical Basin, China. J. Clim. 2018, 31, 1075–1090. [Google Scholar] [CrossRef]
  17. Luo, L.; Wood, E.F. Monitoring and predicting the 2007 U.S. drought. Geophys. Res. Lett. 2007, 34, L22702. [Google Scholar] [CrossRef]
  18. Yuan, X.; Wood, E.F.; Luo, L.; Pan, M. A first look at Climate Forecast System version 2 (CFSv2) for hydrological seasonal prediction. Geophys. Res. Lett. 2011, 38, L13402. [Google Scholar] [CrossRef]
  19. WU, Z.; LU, G.; GUO, H.; KUANG, Y. Drought monitoring technology based on simulation of soil moisture. J. Hohai Univ. (Nat. Sci.) 2012, 40, 28–32. [Google Scholar]
  20. Yuan, X.; Wood, E.F.; Ma, Z. A review on climate-model-based seasonal hydrologic forecasting: Physical understanding and system development. WIREs Water 2015, 2, 523–536. [Google Scholar] [CrossRef]
  21. Yuan, X.; Ma, F.; Wang, L.; Zheng, Z.; Ma, Z.; Ye, A.; Peng, S. An experimental seasonal hydrological forecasting system over the Yellow River basin—Part 1: Understanding the role of initial hydrological conditions. Hydrol. Earth Syst. Sci. 2016, 20, 2437–2451. [Google Scholar] [CrossRef]
  22. Wu, Z.; Xu, Z.; Xiao, H.; Wu, H. Spatio-Temporal Analysis of Drought Events in the Upper Reaches of Yangtze River Basin Based on Simulation of Soil Moisture. Resour. Environ. Yangtze Basin 2018, 27, 176–184. [Google Scholar]
  23. Boeing, F.; Rakovec, O.; Kumar, R.; Samaniego, L.; Schrön, M.; Hildebrandt, A.; Rebmann, C.; Thober, S.; Müller, S.; Zacharias, S.; et al. High-resolution drought simulations and comparison to soil moisture observations in Germany. Hydrol. Earth Syst. Sci. 2022, 26, 5137–5161. [Google Scholar] [CrossRef]
  24. Golden, H.E.; Lane, C.R.; Adnan, R.; Qiusheng, W. Improving global flood and drought predictions: Integrating non-floodplain wetlands into watershed hydrologic models. Environ. Res. Lett. 2021, 16, 1–5. [Google Scholar] [CrossRef]
  25. Chan, S.S.; Seidenfaden, I.K.; Jensen, K.H.; Sonnenborg, T.O. Climate change impacts and uncertainty on spatiotemporal variations of drought indices for an irrigated catchment. J. Hydrol. 2021, 601, 126814. [Google Scholar] [CrossRef]
  26. De Luca, D.L.; Apollonio, C.; Petroselli, A. The Benefit of Continuous Hydrological Modelling for Drought Hazard Assessment in Small and Coastal Ungauged Basins: A Case Study in Southern Italy. Climate 2022, 10, 34. [Google Scholar] [CrossRef]
  27. Lin, Q.; Wu, Z.; Liu, J.; Singh, V.P.; Zuo, Z. Hydrological drought dynamics and its teleconnections with large-scale climate indices in the Xijiang River basin, South China. Theor. Appl. Climatol. 2022, 150, 229–249. [Google Scholar] [CrossRef]
  28. Xing, Z.; Ma, M.; Su, Z.; Lv, J.; Yi, P.; Song, W. A review of the adaptability of hydrological models for drought forecasting. Proc. Int. Assoc. Hydrol. Sci. 2020, 383, 261–266. [Google Scholar] [CrossRef]
  29. Brigode, P.; Oudin, L.; Perrin, C. Hydrological model parameter instability: A source of additional uncertainty in estimating the hydrological impacts of climate change? J. Hydrol. 2013, 476, 410–425. [Google Scholar] [CrossRef]
  30. Shen, M.; Chen, J.; Zhuan, M.; Chen, H.; Xu, C.; Xiong, L. Estimating uncertainty and its temporal variation related to global climate models in quantifying climate change impacts on hydrology. J. Hydrol. 2018, 556, 10–24. [Google Scholar] [CrossRef]
  31. Anderson, G.J.; Lucas, D.D.; Bonfils, C. Uncertainty Analysis of Simulations of the Turn-of-the-Century Drought in the Western United States. J. Geophys. Res. Atmos. 2018, 123, 13219–13237. [Google Scholar] [CrossRef]
  32. Chaney, N.W.; Herman, J.D.; Reed, P.M.; Wood, E.F. Flood and drought hydrologic monitoring: The role of model parameter uncertainty. Hydrol. Earth Syst. Sci. 2015, 19, 3239–3251. [Google Scholar] [CrossRef]
  33. DeChant, C.M.; Moradkhani, H. Analyzing the sensitivity of drought recovery forecasts to land surface initial conditions. J. Hydrol. 2015, 526, 89–100. [Google Scholar] [CrossRef]
  34. Shi, X.; Yang, Z.; Xu, Z.; Li, Y. Effect of Uncertainty in Rainfall Input on Distributed Watershed Hydrological Simulation: A Case Study of Wuliehe River Basin. J. China Hydrol. 2014, 34, 26–32. [Google Scholar]
  35. Meresa, H.; Tischbein, B.; Mendela, J.; Demoz, R.; Abreha, T.; Weldemichael, M.; Ogbu, K. The role of input and hydrological parameters uncertainties in extreme hydrological simulations. Nat. Resour. Model. 2021, 35, e12320. [Google Scholar] [CrossRef]
  36. Smith, K.A.; Barker, L.J.; Tanguy, M.; Parry, S.; Harrigan, S.; Legg, T.P.; Prudhomme, C.; Hannaford, J. A multi-objective ensemble approach to hydrological modelling in the UK: An application to historic drought reconstruction. Hydrol. Earth Syst. Sci. 2019, 23, 3247–3268. [Google Scholar] [CrossRef]
  37. Samaniego, L.; Kumar, R.; Breuer, L.; Chamorro, A.; Flörke, M.; Pechlivanidis, I.G.; Schäfer, D.; Shah, H.; Vetter, T.; Wortmann, M.; et al. Propagation of forcing and model uncertainties on to hydrological drought characteristics in a multi-model century-long experiment in large river basins. Clim. Chang. 2016, 141, 435–449. [Google Scholar] [CrossRef]
  38. Ahmadalipour, A.; Moradkhani, H. Analyzing the uncertainty of ensemble-based gridded observations in land surface simulations and drought assessment. J. Hydrol. 2017, 555, 557–568. [Google Scholar] [CrossRef]
  39. Kundzewicz, Z.W.; Krysanova, V.; Benestad, R.E.; Hov, Ø.; Piniewski, M.; Otto, I.M. Uncertainty in climate change impacts on water resources. Environ. Sci. Policy 2018, 79, 1–8. [Google Scholar] [CrossRef]
  40. Nearing, G.S.; Tian, Y.; Gupta, H.V.; Clark, M.P.; Harrison, K.W.; Weijs, S.V. A philosophical basis for hydrological uncertainty. Hydrol. Sci. J. 2016, 61, 1666–1678. [Google Scholar] [CrossRef]
  41. Staudinger, M.; Seibert, J. Predictability of low flow—An assessment with simulation experiments. J. Hydrol. 2014, 519, 1383–1393. [Google Scholar] [CrossRef]
  42. Koster, R.D.; Suarez, M.J.; Heiser, M. Variance and Predictability of Precipitation at Seasonal-to-Interannual Timescales. J. Hydrometeorol. 2000, 1, 26–46. [Google Scholar] [CrossRef]
  43. Li, H.; Luo, L.; Wood, E.F.; Schaake, J. The role of initial conditions and forcing uncertainties in seasonal hydrologic forecasting. J. Geophys. Res. 2009, 114, D04114. [Google Scholar] [CrossRef]
  44. Wood, A.W.; Lettenmaier, D.P. An ensemble approach for attribution of hydrologic prediction uncertainty. Geophys. Res. Lett. 2008, 35, L14401. [Google Scholar] [CrossRef]
  45. Shukla, S.; Lettenmaier, D.P. Seasonal hydrologic prediction in the United States: Understanding the role of initial hydrologic conditions and seasonal climate forecast skill. Hydrol. Earth Syst. Sci. 2011, 15, 3529–3538. [Google Scholar] [CrossRef]
  46. Shukla, S.; Sheffield, J.; Wood, E.F.; Lettenmaier, D.P. On the sources of global land surface hydrologic predictability. Hydrol. Earth Syst. Sci. Discuss. 2013, 17, 2781–2796. [Google Scholar] [CrossRef]
  47. Yuan, X.; Wood, E.F.; Roundy, J.K.; Pan, M. CFSv2-Based Seasonal Hydroclimatic Forecasts over the Conterminous United States. J. Clim. 2013, 26, 4828–4847. [Google Scholar] [CrossRef]
  48. Sinha, T.; Sankarasubramanian, A. Role of climate forecasts and initial conditions in developing streamflow and soil moisture forecasts in a rainfall–runoff regime. Hydrol. Earth Syst. Sci. 2013, 17, 721–733. [Google Scholar] [CrossRef]
  49. Mo, K.C.; Lettenmaier, D.P. Hydrologic Prediction over the Conterminous United States Using the National Multi-Model Ensemble. J. Hydrometeorol. 2014, 15, 1457–1472. [Google Scholar] [CrossRef]
  50. Hao, Z.; Singh, V.P.; Xia, Y. Seasonal Drought Prediction: Advances, Challenges, and Future Prospects. Rev. Geophys. 2018, 56, 108–141. [Google Scholar] [CrossRef]
  51. Wood, A.W.; Hopson, T.; Newman, A.; Brekke, L.; Arnold, J.; Clark, M. Quantifying Streamflow Forecast Skill Elasticity to Initial Condition and Climate Prediction Skill. J. Hydrometeorol. 2016, 17, 651–668. [Google Scholar] [CrossRef]
  52. Lu, G.; Yan, G.; Wu, Z.; He, H. Analysis on aridification within last 50 years in China. Water Resour. Hydropower Eng. 2010, 41, 78–82. [Google Scholar]
  53. Jiashuai, G.; Qiongfang, L.; Mingyuan, N.; Qihui, C.; Pengfei, H.; Zhengmo, Z.; Tianshan, Z.; Yao, D.; Yun, S.; Xingye, H. An Analysis of Meteorological Drought Characteristics in the Upper Reaches of Huaihe River Based on Multidimensional Copula Function. China Rural Water Hydropower 2019, 8, 83–87, 92. [Google Scholar]
  54. Wei, Z.; Yi, L.; Qiongfang, L.; Liliang, R.; Tao, C. Drought Evaluation for Upper Reaches of the Huaihe River. J. China Hydrol. 2009, 29, 69–72. [Google Scholar]
  55. Hui, L.; Jingcai, W.; Jinbai, H.; Chenjuan, J. Comparative study on spatial and temporal distribution characteristics of meteorological drought in the upper and middle reaches of Huai River Basin based on SPI and SPEI. J. Water Resour. Water Eng. 2019, 39, 59–67. [Google Scholar]
  56. Lijie, Z.; Jian, L. Spatiotemporal change of drought at various time scales indicated by SPEI and SPI in Xijiang river basin. Plateau Meteorol. 2018, 37, 560–567. [Google Scholar]
  57. Rongjie, F.; Chaohua, J.; Lili, S.; Chunqing, G. An Analysis of Change Law of Runoff Sequences in Xijiang River Basin. China Rural Water Hydropower 2020, 1, 111–115, 124. [Google Scholar]
  58. Ruirui, X.; Peng, G.; Xingmin, M.; Xueke, C.; Chaojun, G. Dynamic of Streamflow and Sediment Load and Its Response to Human Activities in the Weihe River Basin. Yellow River 2020, 42, 17–24. [Google Scholar]
  59. Zhaoxia, J.; Jun, X.; Yang, K.; Dunxian, S.; Qiang, W. Spatial and Temporal Patterns of Droughts in Weihe River Basin Based on CI Drought Index. Yellow River 2017, 39, 86–91, 95. [Google Scholar]
  60. Liang, X.; Lettenmaier, D.P.; Wood, E.F.; Burges, S.J. A simple hydrologically based model of land surface water and energy fluxes for general circulation models. J. Geophys. Res. Atmos. 1994, 99, 14415–14428. [Google Scholar] [CrossRef]
  61. Sheffield, J.; Wood, E.F. Characteristics of global and regional drought, 1950–2000: Analysis of soil moisture data from off-line simulation of the terrestrial hydrologic cycle. J. Geophys. Res. 2007, 112, D17115. [Google Scholar] [CrossRef]
  62. Rosenbrock, H.H. An Automatic Method for Finding the Greatest or Least Value of a Function. Comput. J. 1960, 3, 175–184. [Google Scholar] [CrossRef]
  63. Wu, Z.; Lu, G.; Wen, L.; Lin, C.A. Reconstructing and analyzing China’s fifty-nine year (1951–2009) drought history using hydrological model simulation. Hydrol. Earth Syst. Sci. 2011, 15, 2881–2894. [Google Scholar] [CrossRef]
  64. Yao, M.; Yuan, X. Evaluation of summer drought ensemble prediction over the Yellow River basin. Atmos. Ocean. Sci. Lett. 2018, 11, 314–321. [Google Scholar] [CrossRef]
  65. Mao, Y.; Wu, Z.; He, H.; Lu, G.; Xu, H.; Lin, Q. Spatio-temporal analysis of drought in a typical plain region based on the soil moisture anomaly percentage index. Sci. Total Environ. 2017, 576, 752–765. [Google Scholar] [CrossRef] [PubMed]
  66. Feng, Y.; Dong, Z.; Qiaoqian, L.; Zhengquan, C. Real-Time Performance Evaluation of Numerical Weather Prediction Models Using Uncertainty Index. Meteorol. Sci. Technol. 2007, 35, 322–326. [Google Scholar]
  67. Fan, J.; Xu, F.; Sun, X.; Dong, W.; Ma, X.; Liu, G.; Cheng, Y.; Wang, H. Construction and Application of Hydrometeorological Comprehensive Drought Index in Weihe River. Atmosphere 2022, 13, 610. [Google Scholar] [CrossRef]
  68. Yanjun, L.; Xiaodong, Z.; Fan, L.; Jing, M. Analysis of Drought Evolvement Characteristics Based on Standardized Precipitation Index in the Huaihe River Basin. Procedia Eng. 2012, 28, 434–437. [Google Scholar] [CrossRef]
  69. Te, Z.; Ji, L.; Rong, W.; Wenjuan, C.; Xiaohua, D.; Zhouliang, S. Response of Vegetation to Meteorological Drought in Upper Huaihe River Basin. Res. Soil Water Conserv. 2020, 27, 213–219. [Google Scholar]
  70. Shen, H.; Yuan, F.; Ren, L.; Ma, M.; Kong, H.; Tong, R. Regional drought assessment using a distributed hydrological model coupled with Standardized Runoff Index. Proc. Int. Assoc. Hydrol. Sci. 2015, 368, 397–402. [Google Scholar] [CrossRef]
  71. Xiaoffen, C.; Zaimin, W.; Jun, H.; Zhenlong, W. Analysis of Drought Characteristics in the Huaihe River Basin in Recent 60 Years. South-to-North Water Transf. Water Sci. Technol. 2015, 11, 20–24. [Google Scholar]
  72. Zhang, Q.; Xiao, M.; Singh, V.P.; Chen, X. Copula-based risk evaluation of droughts across the Pearl River basin, China. Theor. Appl. Climatol. 2012, 111, 119–131. [Google Scholar] [CrossRef]
  73. Qiu, J.; Wang, Y.; Xiao, J. Spatiotemporal Distribution of Droughts in the Xijiang River Basin, China and Its Responses to Global Climatic Events. Water 2017, 9, 265. [Google Scholar] [CrossRef]
  74. Jingjing, F.; Shibo, W.; Fanfan, X.; Chenyu, W.; Dengfeng, L.; Tianling, Q.; Guanpeng, L.; Yao, C. Impact of ENSO events on meteorological drought in the Weihe River basin, China. Front. Earth Sci. 2023, 11, 1093632. [Google Scholar] [CrossRef]
  75. Zhao, P.; Lu, H.; Wang, W.; Fu, G. From meteorological droughts to hydrological droughts A case study of the Weihe River Basin, China. Arab. J. Geosci. 2019, 12, 364. [Google Scholar] [CrossRef]
  76. Zhao, G.; Mu, X.; Tian, P.; Wang, F.; Gao, P. Climate changes and their impacts on water resources in semiarid regions: A case study of the Wei River basin, China. Hydrol. Process. 2013, 27, 3852–3863. [Google Scholar] [CrossRef]
  77. Zhuguo, M.; Congbin, F.; Li, X.; Wenhai, C.; Shuwang, T. Some problems in the study on the relationship between soil moisture and climatic chagne. Adv. Earth Sci. 2001, 16, 563–566. [Google Scholar]
  78. Renhe, Z.; Li, L.; Zhiyan, Z. Variations of soil moisture over China and their influences on Chinese climate. Chin. J. Nat. 2016, 38, 313–319. [Google Scholar]
  79. Seneviratne, S.I.; Corti, T.; Davin, E.L.; Hirschi, M.; Jaeger, E.B.; Lehner, I.; Orlowsky, B.; Teuling, A.J. Investigating soil moisture–climate interactions in a changing climate: A review. Earth-Sci. Rev. 2010, 99, 125–161. [Google Scholar] [CrossRef]
  80. Li, M.; Ma, Z.; Niu, G.-Y. Modeling spatial and temporal variations in soil moisture in China. Chin. Sci. Bull. 2011, 56, 1809–1820. [Google Scholar] [CrossRef]
  81. Chenghu, S.; Weijing, L.; Zuqiang, Z.; Jinhai, H. Distribution and variation feathers of soil humudity anomaly in Huaihe River Basin and its Relationship with climatic anomaly. J. Appl. Meteorol. Sci. 2005, 16, 129–138. [Google Scholar]
  82. Niu, J.; Chen, J.; Sun, L. Exploration of drought evolution using numerical simulations over the Xijiang (West River) basin in South China. J. Hydrol. 2015, 526, 68–77. [Google Scholar] [CrossRef]
  83. Reynolds, C.A.; Jackson, T.J.; Rawls, W.J. Estimating soil water-holding capacities by linking the Food and Agriculture Organization Soil map of the world with global pedon databases and continuous pedotransfer functions. Water Resour. Res. 2000, 36, 3653–3662. [Google Scholar] [CrossRef]
  84. Noor, S.; Singh, A.; Chitra, R.; Gupta, M. Effect of Clay Content on Permeability and Compaction Parameters of Sand. Int. J. Latest Trends Eng. Technol. 2015, 5, 197–201. [Google Scholar]
  85. Saxton, K.E.; Rawls, W.J. Soil Water Characteristic Estimates by Texture and Organic Matter for Hydrologic Solutions. Soil Sci. Soc. Am. J. 2006, 70, 1569–1578. [Google Scholar] [CrossRef]
  86. Hansen, M.; DeFries, R.; Townshend, J.R.; Sohlberg, R. Global land cover classification at 1km resolution using a decision tree classifier. Int. J. Remote Sens. 2000, 21, 1331–1365. [Google Scholar] [CrossRef]
Figure 1. The aridified belt zone and geographical locations of the three typical basins, and the meteorological stations within and nearby, the soil moisture stations within, the main rivers and water systems within the basins, the location of hydrological stations.
Water 15 03286 g001
Figure 2. Average annual precipitation and temperature in three typical basins.
Water 15 03286 g002
Figure 3. The spatial distribution of (a) elevation, (b) precipitation and (c) temperature in HRB.
Water 15 03286 g003
Figure 4. The spatial distribution of (a) elevation, (b) precipitation and (c) temperature in YRB.
Water 15 03286 g004
Figure 5. The spatial distribution of (a) elevation, (b) precipitation and (c) temperature in WRB.
Water 15 03286 g005
Figure 6. The method structure to investigate the uncertainty of ICs on drought process simulation.
Water 15 03286 g006
Figure 7. Method flowchart of the study.
Water 15 03286 g007
Figure 8. The comparison of simulated and measured runoff process of the VIC Model in three basins.
Water 15 03286 g008
Figure 9. The correlation coefficients of VIC simulated and measured soil moisture at stations in the depths of 10 cm and 40 cm in three basins.
Water 15 03286 g009
Figure 10. The time series of observed and simulated SMAPI (in the soil depth of 10 cm and 40 cm) at the Bataizhen Station in HRB.
Water 15 03286 g010
Figure 11. The time series of observed and simulated SMAPI (in the soil depth of 10 cm and 40 cm) at the Baise Station in YRB.
Water 15 03286 g011
Figure 12. The time series of observed and simulated SMAPI (in the soil depth of 10 cm and 40 cm) at the Zhujiazui Station in WRB.
Water 15 03286 g012
Figure 13. 30 typical drought events in three study basins.
Water 15 03286 g013
Figure 14. The boxplot time series of SMAPI based on different ICs of typical drought events in different basins.
Water 15 03286 g014
Figure 15. The uncertainty at 95% confidence interval of SMAPI based on different ICs in three basins.
Water 15 03286 g015
Figure 16. The spatial distribution of soil porosity estimates in three basins.
Water 15 03286 g016
Table 1. Drought classification standard based on SMAPI.
SMAPIDrought Classification
S M A P I ≤ −25%Extreme
−25% < S M A P I ≤ −20%Severe
−20% < S M A P I ≤ −15%Moderate
−15% < S M A P I ≤−5%Mild
−5% < S M A P I ≤ 5%Normal
Table 2. Hydrological parameters of the three basins.
Parameters (Units)DescriptionHRBYRBWRB
b the shape parameter of saturation capacity curve0.10.280.12
D s m a x (mm)maximum velocity of baseflow0.0080.050.163
D s the fraction of D s m a x where non-linear baseflow begins31.581
W s the fraction of maximum soil moisture where non-linear baseflow occurs10.71
d 0 (m)the thickness of the first soil layer0.10.10.1
d 1 (m)the thickness of the second soil layer0.50.580.725
d 2 (m)the thickness of the third soil layer0.630.990.225
Table 3. The simulation performance of VIC in three basins.
BasinPeriodYearDaily RE (%)Daily NSE
HRBCalibration1966~1990−7.90.68
Validation1996~2007−8.50.83
YRBCalibration1981~1995−6.00.84
Validation2002~20100.70.72
WRBCalibration1980~1990−12.80.65
Validation2003~20120.20.63
Disclaimer/Publisher’s Note: The statements, opinions and data contained in all publications are solely those of the individual author(s) and contributor(s) and not of MDPI and/or the editor(s). MDPI and/or the editor(s) disclaim responsibility for any injury to people or property resulting from any ideas, methods, instructions or products referred to in the content.

