Article

Evolution Characteristics of Water Quality in Plain Reservoirs and Its Relationship with the Economic Development Response: A Case Study of Daheiting Reservoir in Northern China

1
State Key Laboratory of Simulation and Regulation of Water Cycle in River Basin, China Institute of Water Resources and Hydropower Research, Beijing 100038, China
2
Department of Water Ecology and Environment, China Institute of Water Resources and Hydropower Research, Beijing 100038, China
3
Key Laboratory of Water Safety for Beijing-Tianjin-Hebei Region of Ministry of Water Resources, Beijing 100038, China
4
Appraisal Center for Environment and Engineering, Ministry of Environmental Protection, Beijing 100012, China
*
Author to whom correspondence should be addressed.
Water 2023, 15(18), 3229; https://doi.org/10.3390/w15183229
Submission received: 22 July 2023 / Revised: 1 September 2023 / Accepted: 4 September 2023 / Published: 11 September 2023

Abstract

:
In order to explore the evolution characteristics of TP and NH3-N in Daheiting reservoir since its construction, and their response to economic development, the monitoring data of water quality from 1992 to 2018 and statistical data of socio-economic development in Qianxi County were analyzed to examine the interannual evolution of TP and NH3-N and their correlation with upstream water quality, various economic indicators, and the scale of cage fish culture. The results show that, influenced by economic development, the evolution process of TP and NH3-N in Daheiting reservoir can be divided into three stages. In Stage I, the economic development of Qianxi County was slow, and the water quality of upstream water and the reservoir was good, with TP and NH3-N concentrations remaining relatively stable. In Stage II, Qianxi County entered a period of rapid economic development, and the TP and NH3-N in upstream water and Daheiting reservoir both increased significantly, with TP exceeding the standard limit. In Stage III, the intensity of external pollution control increased, and all cages were removed from the reservoir. Both TP and NH3-N showed a downward trend, but TP still exceeded the standard limit. Pearson correlation analysis and RDA analysis revealed that the levels of TP and NH3-N in Daheiting reservoir were mainly affected by the water quality of upstream water and the development of primary industry (including cage fish culture).

1. Introduction

As global socio-economic development progresses, the demand for water resources is gradually increasing, and the quantity and quality of water resources have become important factors constraining social development. China’s per capita freshwater resources are only one-fourth of the world’s average level, and water use in northern China is severe. The construction of reservoirs has not only alleviated the problem of drinking water, but also brought certain economic benefits. In recent decades, China has accelerated the pace of dam construction [1]. According to data released by the Chinese Ministry of Water Resources, more than 98,000 reservoirs of various types have been built nationwide, with a total storage capacity of 898.3 billion m3. However, eutrophication is a widespread problem in China and around the world [2,3]. Many research scholars believe that the eutrophication of lakes and reservoirs is mainly caused by the excessive input of exogenous nutrients, such as nitrogen and phosphorus, which is closely related to the economic development model at the time [4]. Taking China as an example, in the early stage of reform and opening up, people had weak environmental awareness, and the country’s environmental protection policies were insufficient. Economic development was achieved at the expense of the environment, following the development concept of “pollute first and then treat”.
In 1991, American economists Grossman and Krueger [5] first empirically studied the relationship between environmental quality and per capita income, pointing out that the relationship between pollution and per capita income is “pollution rises with per capita GDP at low income levels, declines with GDP growth at high income levels”. In 1993, Panayotou [6] first called the relationship between environmental quality and per capita income the Environmental Kuznets Curve (EKC). And it has been verified in many research areas. Paudel (2005) [7], revisiting the environmental Kuznets curve (EKC) hypothesis for water pollution, showed evidence of the inverted U-shaped EKC relationships’ existence in America and Europe, while Lee (2010) [8] and Thompson (2014) [9] did the same. However, some recent studies have found that the relationship between the environment and economic growth is not necessarily in an inverted “U” shape due to environmental policy adjustments and other factors, such as “N” type and other modes [10,11,12]. Currently, there are three types of basic EKC models: the quadratic function (1), cubic function (2) and logarithmic function (3), as follows [13]:
y = a + b 1 x + b 2 x 2
y = a + b 1 x + b 2 x 2 + b 3 x 3
y = a + b 1 ln x + b 2 ( ln x ) 2 + b 3 ( ln x ) 3
Tianjin and Tangshan cities are located in the North China region of China, with urban populations of 13.73 million and 7.70 million, respectively, in 2021. In order to alleviate the water supply problems of the two cities, the “Luanhe River Diversion Project” was proposed in 1973, with the newly built Panjiakou Reservoir and Daheiting reservoir cascade reservoir serving as water sources [14]. Among them, construction of the Panjiakou Reservoir began in 1975, and it began impounding water in 1979. In April 1980, the project began to produce benefits, supplying agricultural water to the Tangshan area. In July 1983, it was ready to supply water to Tianjin, and officially began supplying water to Tianjin in September of that year. The Daheiting reservoir began construction in October 1973, and was basically completed and put into use in 1983. The Panjiakou Reservoir can regulate 1.95 billion m3 water annually, and supply 1.0 billion m3 water to Tianjin and Tangshan each year. Over the past 30 years, it has supplied a cumulative total of approximately 31.6 billion m3, effectively guaranteeing the water supply for industry, agriculture, and urban life in both cities. From the 1980s to before the 21st century, the water quality of the two reservoirs was good and met Class III of the Chinese Environmental Quality Standards for Surface Water (EQS 2002) [15]. Starting from the year 2000, the decade of gold development, the concentration of pollutants in the reservoir has rapidly increased and eutrophication has become increasingly severe, posing a significant threat to the water supply [16,17]. From June 2016 to November 2017, the water supply to Tianjin was stopped due to water quality issues. Therefore, the water quality standards and eutrophication problem of Daheiting reservoir urgently need to be improved.
Currently, the research on Daheiting reservoir has mainly focused on the monitoring and evaluation of water quality and eutrophication status, and has rarely analyzed the water-quality evolution process and influencing factors since the reservoir was built. Only by clarifying the historical causes of the deterioration of reservoir water quality can an accurate and effective treatment plan be proposed. This study is based on the TP and NH3-N monitoring data of Daheiting reservoir from 1992 to 2018, and sorts out the economic development trend and industrial structure changes of Qianxi County during this period, as well as the scale of cage fish culture and the historical changes of upstream water quality, and attempts to analyze the historical evolution characteristics and causes of water quality in Daheiting reservoir, in order to provide a theoretical basis for the improvement of water quality in the reservoir.

2. Materials and Methods

2.1. Study Area

The Daheiting reservoir is located in Qianxi County, Tangshan City, Hebei Province (Figure 1). The construction of the Daheiting reservoir started in October 1973, was basically completed and put into operation in 1983, and was completed in 1986. Daheiting reservoir is an annual regulating reservoir, with a total surface area of 25 km2 and storage capacity of 337 million m3. The crest elevation of the main dam is about 138.8 m (Yellow Sea elevation), the normal water storage level is 133.00 m, and the dead water level is 121.50 m. The maximum water depth in front of the dam can reach about 26 m. About 30 km upstream of it is the Panjiakou Reservoir, which is connected to the Panjiakou Reservoir through the lower pool, collectively referred to as the Pan Da Reservoir. The Daheiting reservoir controls a watershed area of 3.51 × 10⁴ km2, of which the watershed area between Panjiakou and Daheiting reservoir is 1400 km2. It is one of the important sources of drinking water in the Luanhe River system, and also one of the main sources of water in Tianjin.

2.2. Data Sources and Analysis

The water quality monitoring data of Pan Da Reservoir comes from the routine monitoring data of the Luanhe River Diversion Project Management Bureau, and the social and economic development data of Qianxi County are obtained through the Tangshan City Statistical Yearbook, including per capita GDP, GDP of the primary, secondary and tertiary industries, cage fish culture area and cage fish culture production (CFCP), etc. Pearson correlation analysis was performed in SPSS 20.0, p < 0.05 was used to determine significance, and origin 2018b was used for regression fitting and drawing. Redundancy analysis (RDA) was performed using CANOCO 5 to explain the relationship between water quality indicators and influencing factors. The map of the study area was drawn using ArcGIS 10.4.

3. Results and Analysis

3.1. Analysis of Water Quality Change

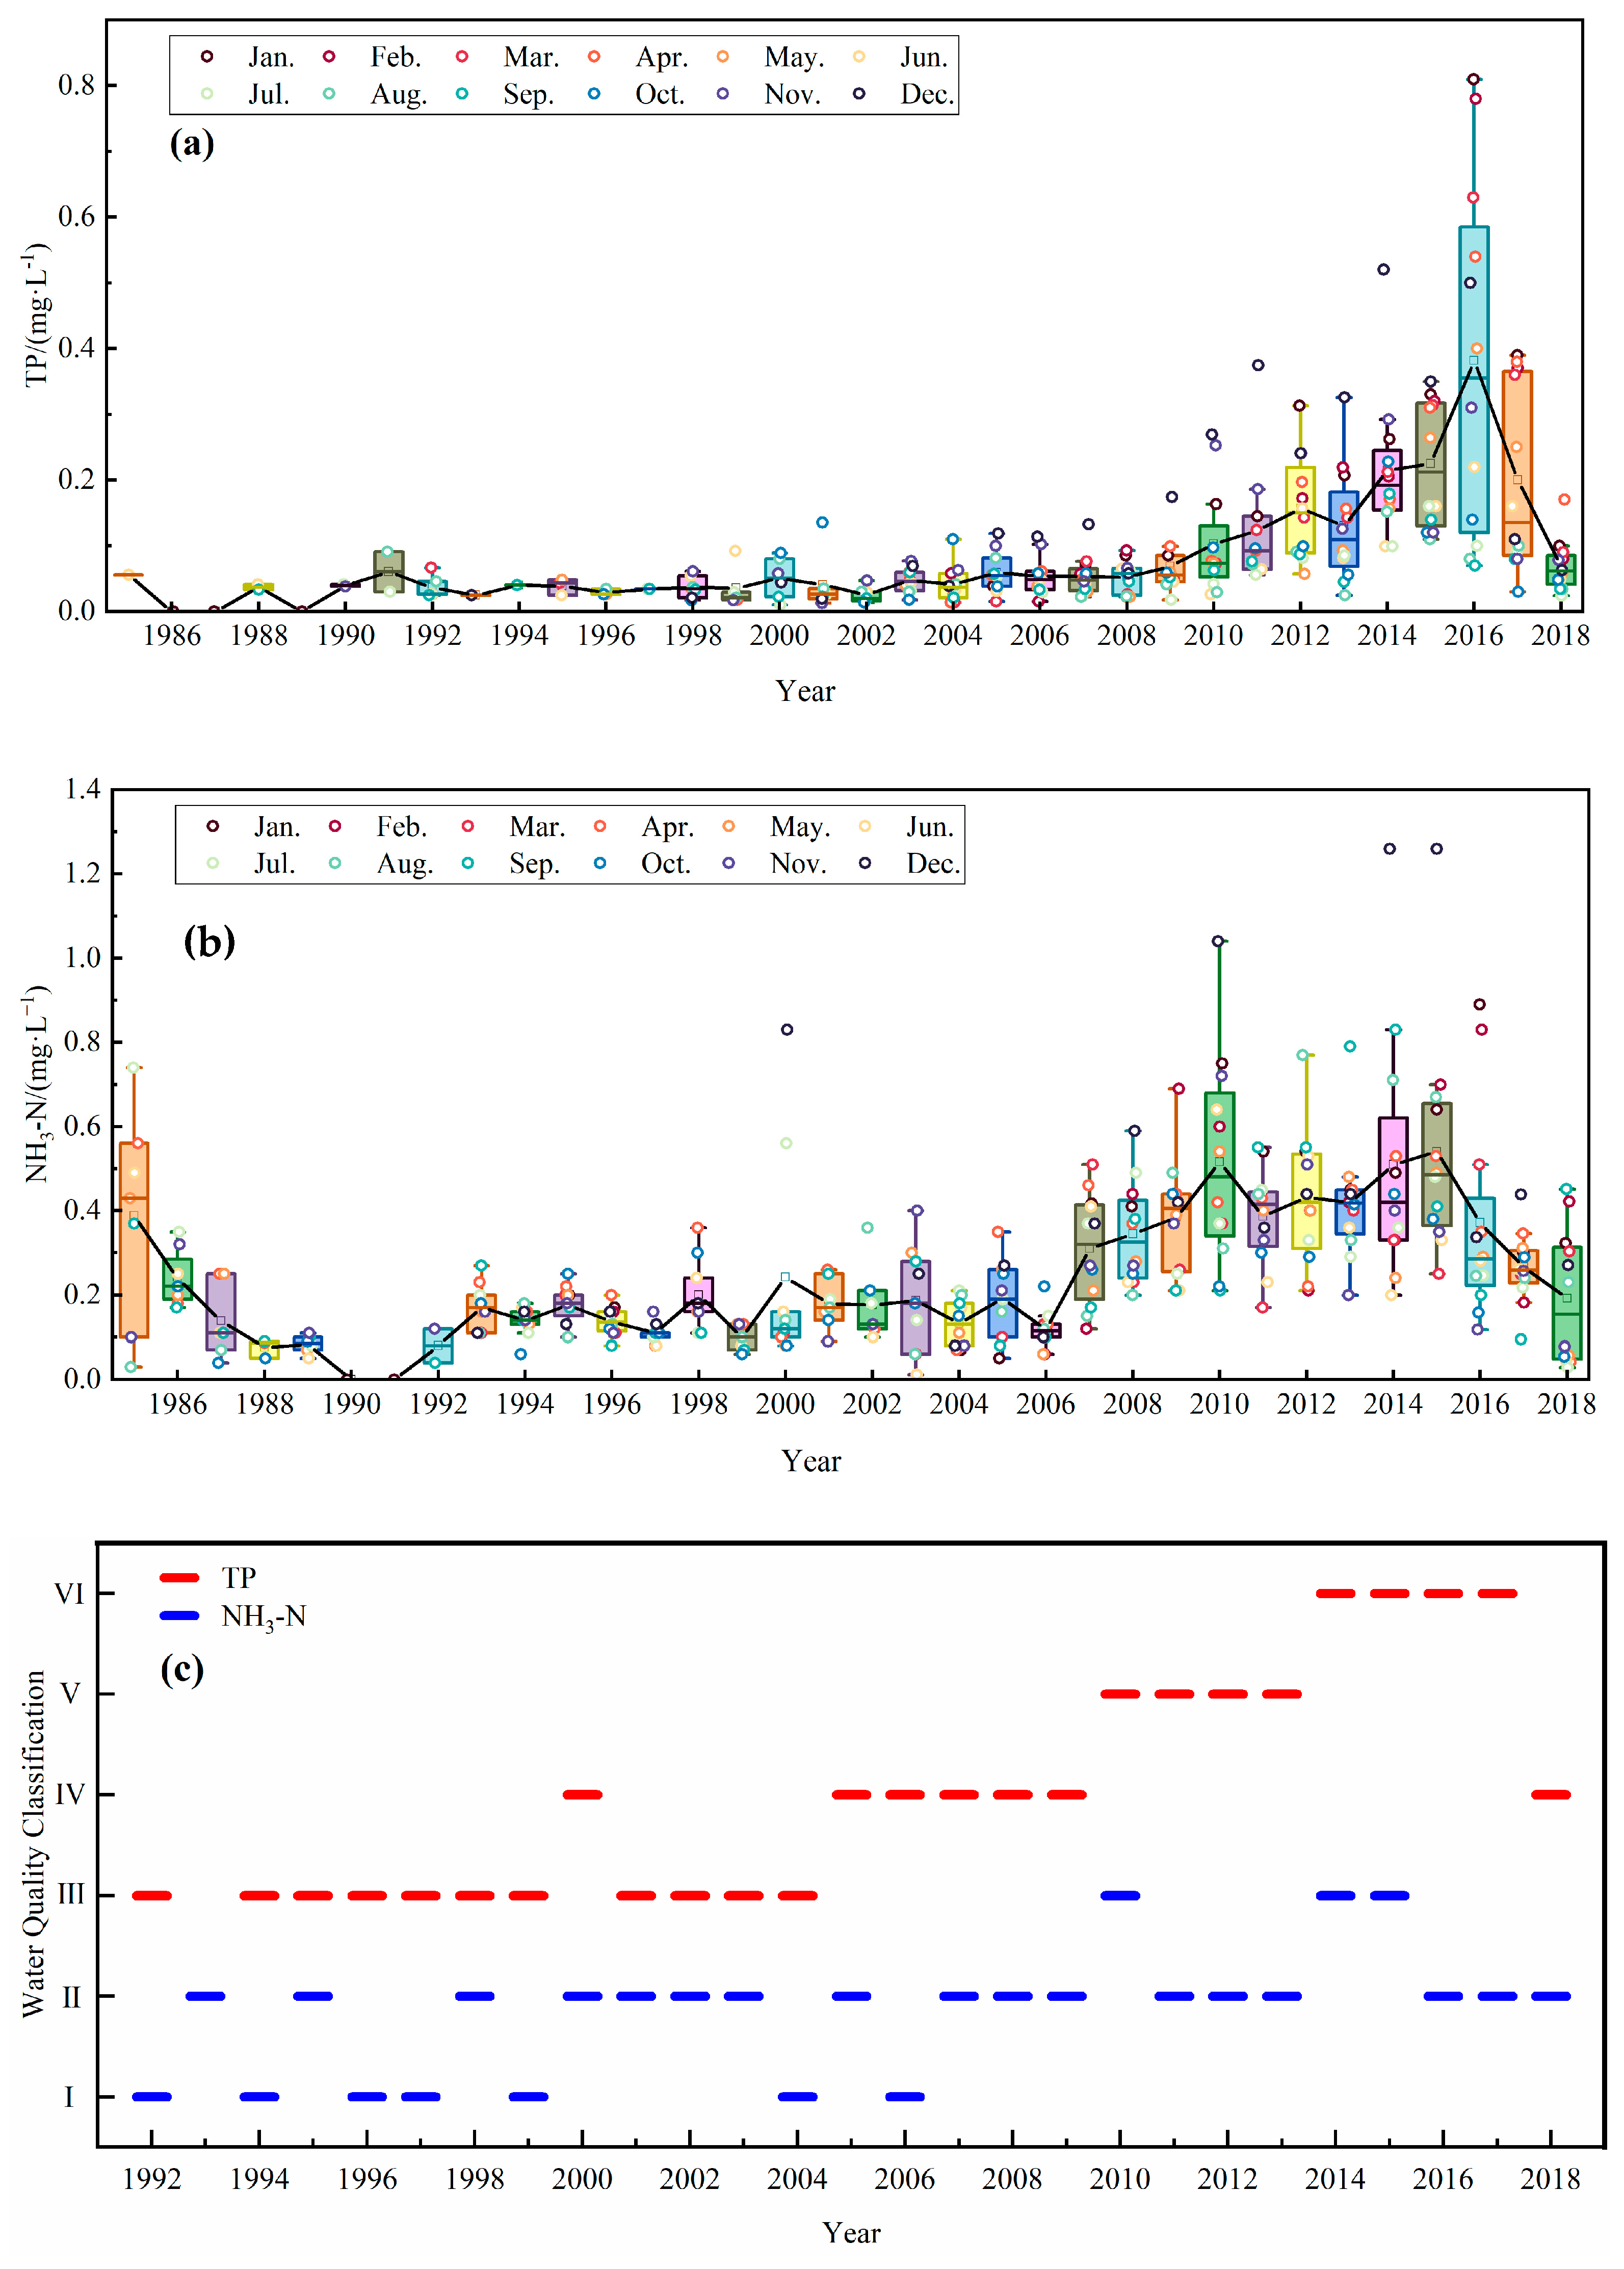
3.1.1. Analysis of Annual Changes in Water Quality

The interannual variation of TP in Daheiting reservoir showed a trend of increasing first and then decreasing (Figure 2a). Specifically, it can be divided into three stages. The first stage is from 1992 to 2006. The concentration of TP remained basically unchanged, and the overall level remained at about 0.04 mg/L, which met the water quality requirements of EQS Class III; in the second stage, from 2007 to 2016, the overall trend increased exponentially, from 0.054 mg/L in 2007 to 0.382 mg/L in 2016. It is generally believed that a TP concentration greater than 0.1 mg/L is a state of severe eutrophication [17,18,19,20]. It can be seen that the reservoir was in a state of severe eutrophication from 2010 to 2016. The third stage is from 2017 to 2018. The concentration of TP dropped rapidly. In 2018, it was 0.069 mg/L, which was Class IV of the EQS, and the TP still exceeded the standard (Figure 2c).
The interannual change trend of NH3-N in Daheiting reservoir is consistent with that of TP, which is also divided into three stages (Figure 2b). The first stage is from 1992 to 2006. The annual average value of this stage fluctuates, with 0.08 mg/L in 1992 and 0.12–0.24 mg/L in other years. It belongs to Class II or Class I water quality. The second stage is from 2007 to 2015. The NH3-N showed a significant upward trend, from 0.31 mg/L in 2007 to 0.54 mg/L in 2015, and the ammonia nitrogen concentration reached the highest value since the establishment of the reservoir. Among them, in 2010, 2014 and in 2015, it was Class III water quality. The third stage is from 2016 to 2018, and the NH3-N shows a linear downward trend, with an annual average of 0.19 mg/L in 2018. It can be seen that although the NH3-N concentration in the reservoir increased significantly in the second stage, it did not exceed the standard, and it met the Class III water quality requirements (Figure 2c).

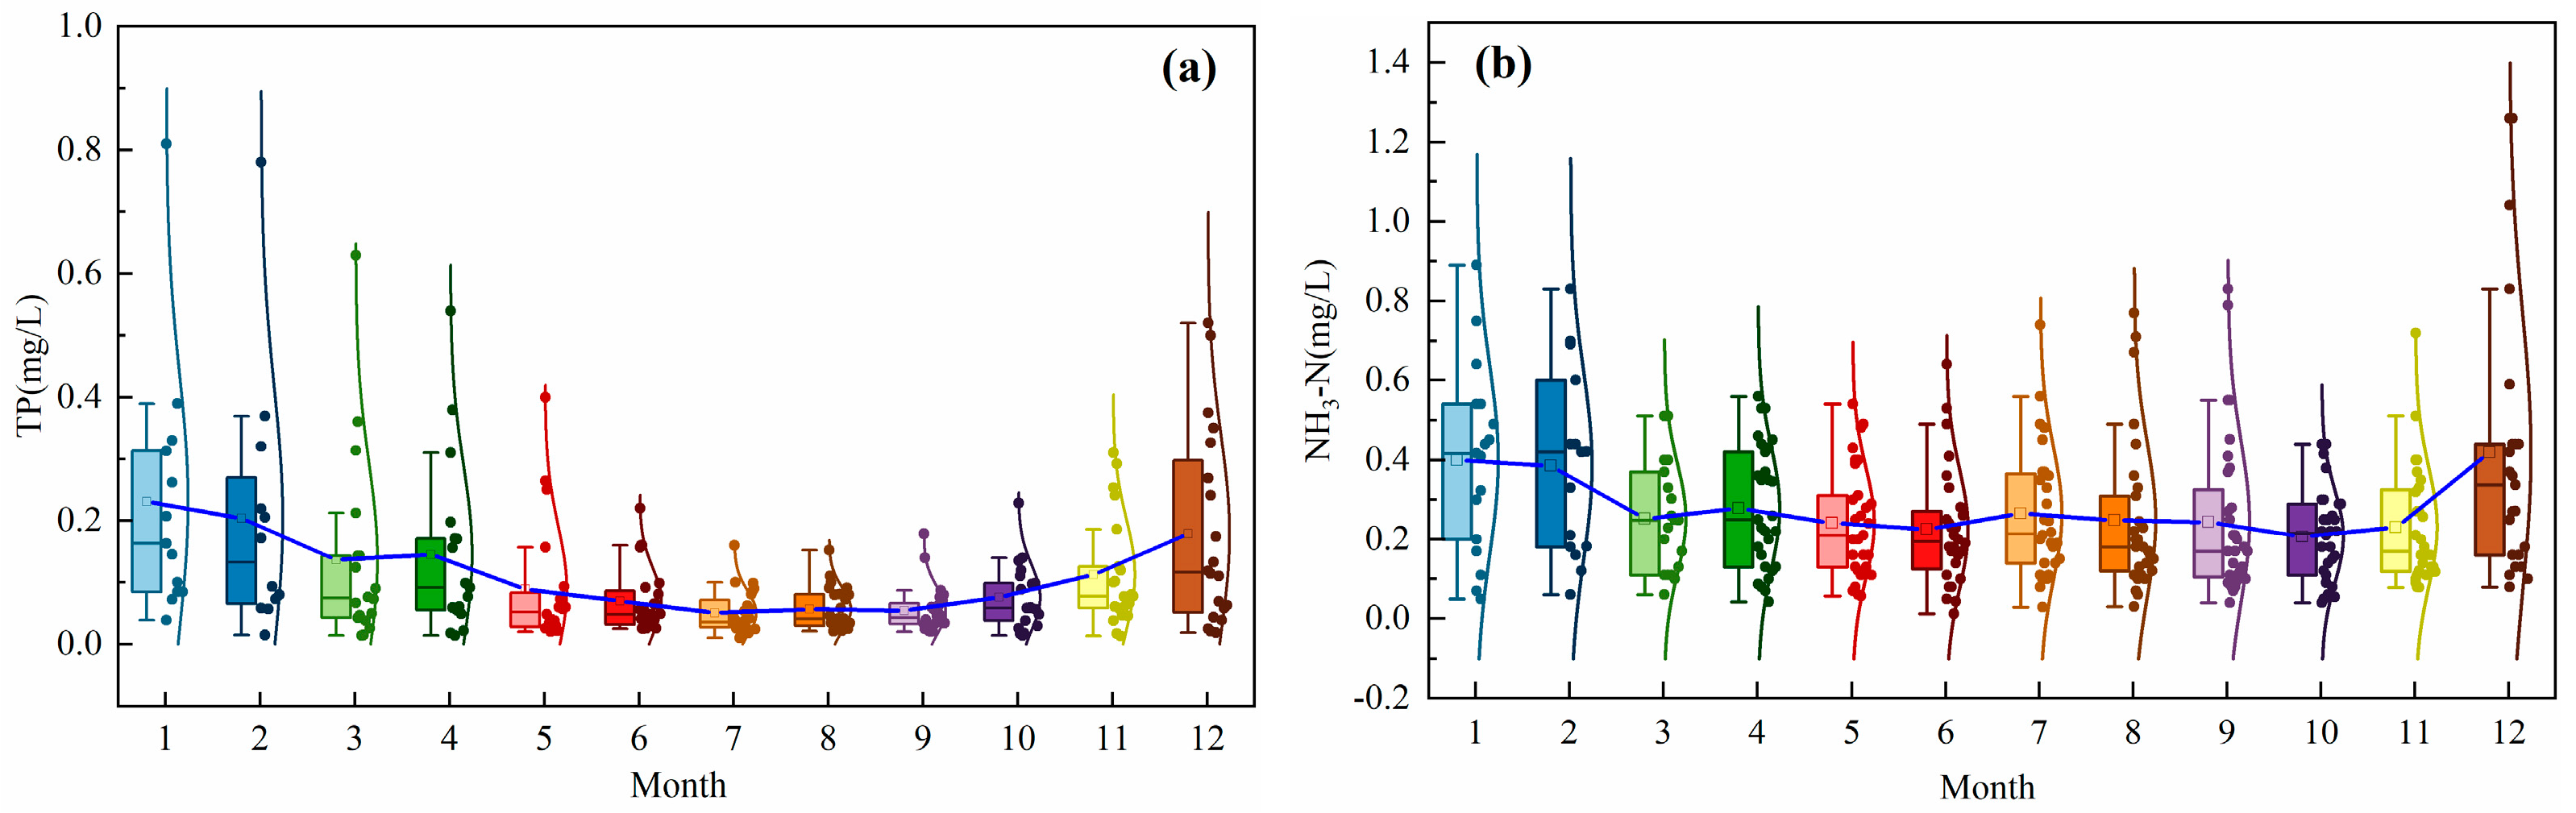
3.1.2. Analysis of Monthly Changes in Water Quality

Both TP (Figure 3a) and NH3-N (Figure 3b) in Daheiting reservoir showed obvious seasonal changes. Overall, TP is high in winter with a large interannual variation, and lowest in summer with small interannual variation. Among them, the maximum value of TP appeared in January, which was 0.231 mg/L, showing a state of severe eutrophication, which was inferior to Class V water quality, while it was the lowest in July to September, about 0.05 mg/L, meeting the requirements of Class III water quality. However, NH3-N is generally high in winter and low in other seasons, and the interannual variation range is slightly higher in winter than in other seasons. The maximum annual average concentration appeared in December, which was 0.42 mg/L, and the lowest occurred in October, which was 0.20 mg/L.

3.2. Analysis of Social and Economic Development Trends

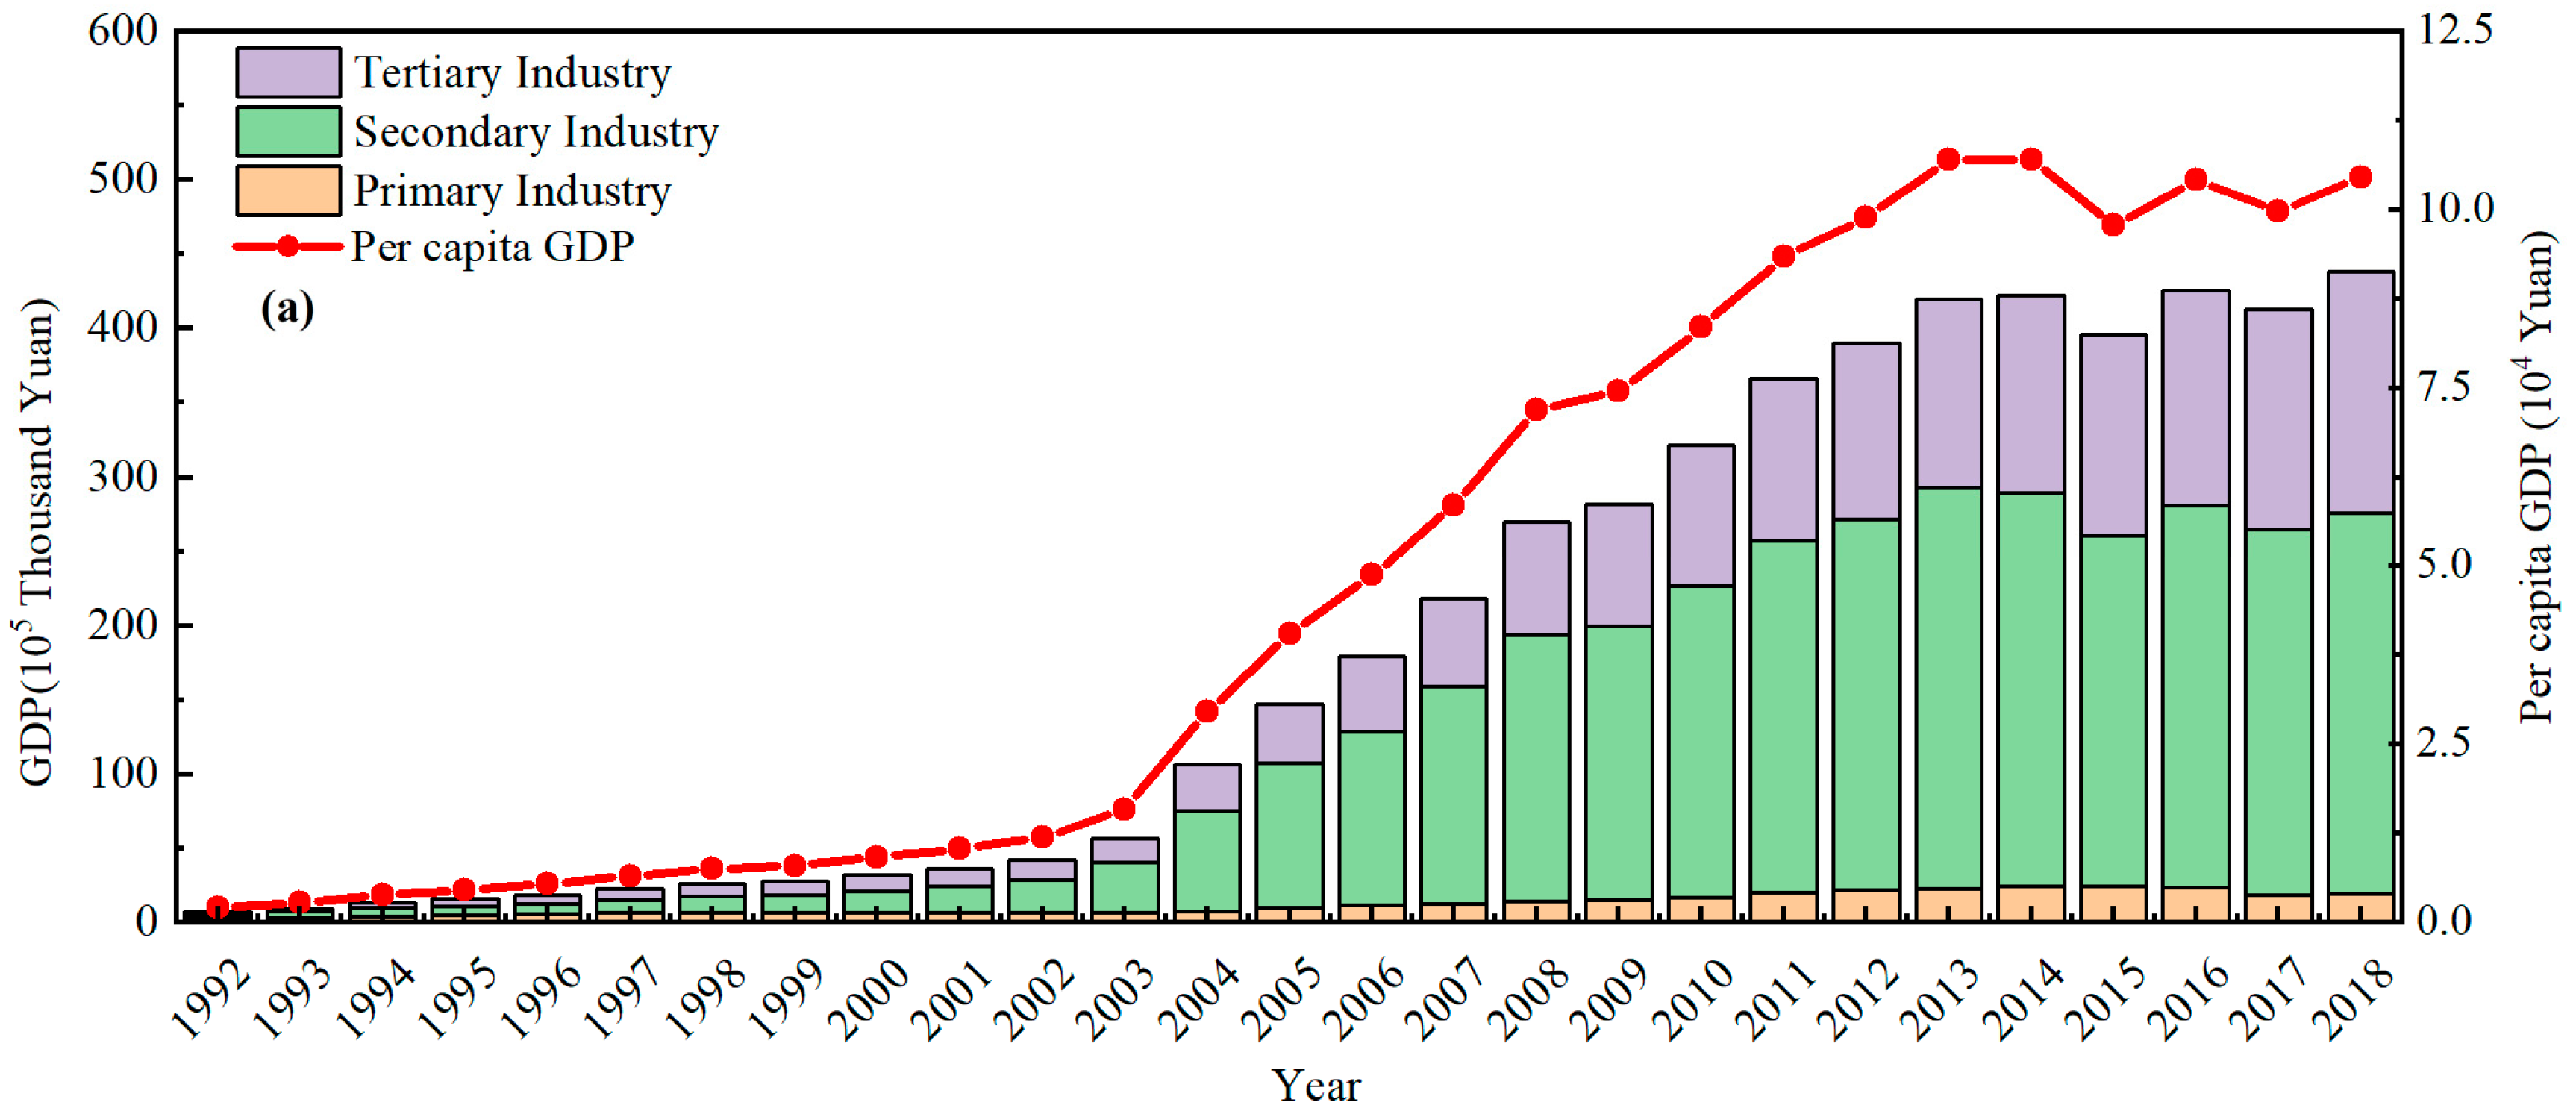
3.2.1. Trend Analysis of GDP

The output value of the three industries in Qianxi County and per capita GDP are shown in Figure 4a, which maintained a rapid growth rate from 1992 to 2013, and its GDP increased from CNY 7.05 × 10⁴ ten thousand to CNY 422.28 × 10⁴ ten thousand, an increase of about 60 times. From 2013 to 2018, the economic development slowed down, showing the characteristics of fluctuations. The per capita GDP also showed an obvious upward trend, especially during the period from 2003 to 2013: the per capita GDP increased from CNY 15,900 to CNY 107,000. From 2014 to 2018, economic development slowed down, and fluctuated around CNY 100,000.
In China, industries are divided into three categories. The primary industry includes agriculture, forestry, animal husbandry and fishery, while the secondary industry refers to the manufacturing, mining and construction sectors. The tertiary industry refers to industries other than the primary and secondary industries, including commerce, finance, trust, service industries and other industries that provide production and consumption services [21]. The industrial structure of Qianxi County has changed significantly, which is mainly reflected in the decline of the proportion of primary industry before 2004, from 30.9% to 7.23% (Figure 4b); The proportion of the secondary industry gradually increased, from 41.59% to 63.84%, and has always accounted for more than 50% of the total output value since 2002; the proportion of the tertiary industry did not change. After 2004, the proportion of the industrial structure in Qianxi County remained basically stable, the secondary industry had a slight downward trend, and the tertiary industry showed just the opposite.

3.2.2. Analysis of Cage Fish Culture Development Trend in Qianxi County

After the completion of the Daheiting reservoir, in order to drive the economic development of the surrounding areas, in 1990, the development of the “cage fish culture” was encouraged. In this study, the development of cage fish culture in Qianxi County was divided into three stages according to the changes in fish species and farming area (Figure 5). Stage I was from 1992 to 2006. In order to improve the income level of local residents, the government encouraged the development of cage fish culture [22]. At this stage, filter-feeding silver carp and bighead carp, which feed on phytoplankton and zooplankton, were mainly cultured, and no artificial feeding was required. Their farming areas were 25.77 × 10⁶ m2 and 27.74 × 10⁶ m2 in 1992 and 1993, respectively. In 1994, the total area of farming of silver carp and bighead carp were developed to 41.73 × 10⁶ m2 and remained until 2006. The production of aquatic products increased from 1200 tons in 1991 to 26,500 tons in 2006. The second stage was from 2007 to 2015. Affected by the large-scale fish-kill incidents in 2007, the aquaculture area in Qianxi County was greatly reduced to about 10.75 × 10⁶ m2. At the same time, in order to maintain a high cage-fish culture production, Grass carp were cultured in the reservoir, and fish food was artificially added for feeding. The annual production increased from 21,631 tons to 44,900 tons. The third stage was from 2016 to 2018. A series of water quality-deterioration problems, such as large-scale fish-kill incidents and algal blooms, occurred continuously in the Daheiting reservoir. In order to prevent further deterioration of the water quality, cages were removed from November 2016 to May 2017, and the aquaculture area in Qianxi County dropped again to 4.23 × 10⁶ m2. At the same time, the production of Grass carp dropped sharply to 12,610 tons and 12,720 tons.

3.3. Effects of Upstream Water on Water Quality Change of Daheiting Reservoir

The Daheiting reservoir mainly receives water from the Sahe and Panjiakou Reservoirs. Among them, the Sahe River has a much smaller flow rate, with an average annual runoff of 280 million m3, and its TP (Figure 6a) and NH3-N (Figure 6b) are significantly lower than those of the Panjiakou Reservoir [23]. Panjiakou Reservoir is located about 30 km upstream of Daheiting reservoir, with a total reservoir capacity of 2.93 billion m3, nine times the capacity of Daheiting reservoir [24]. It is about 1.33 billion m3 [25], meaning it can fill the Daheiting reservoir four times. Therefore, Daheiting reservoir mainly receives water from Panjiakou Reservoir, and the water quality of Panjiakou Reservoir will directly affect the water quality of Daheiting reservoir.
Domagalski [23] found that the main source of nutrients in Panjiakou Reservoir and Daheiting reservoir is the Luan River, and the water from the Luan River flows directly into the Panjiakou Reservoir. Therefore, using the monitoring data of TP and NH3-N in front of the dam of Panjiakou Reservoir as the upstream water quality, the impact of upstream water on the water quality change of Daheiting reservoir was analyzed. The results showed that the annual average change trend of TP and NH3-N in the upstream water was basically consistent with that of Daheiting reservoir, and there was a significant positive correlation between TP (Figure 7a) and NH3-N (Figure 7b) and the upstream water quality (R2 = 0.84, p < 0.01; R2 = 0.60, p < 0.01). It is one of the main sources of TP and NH3-N in Daheiting reservoir.

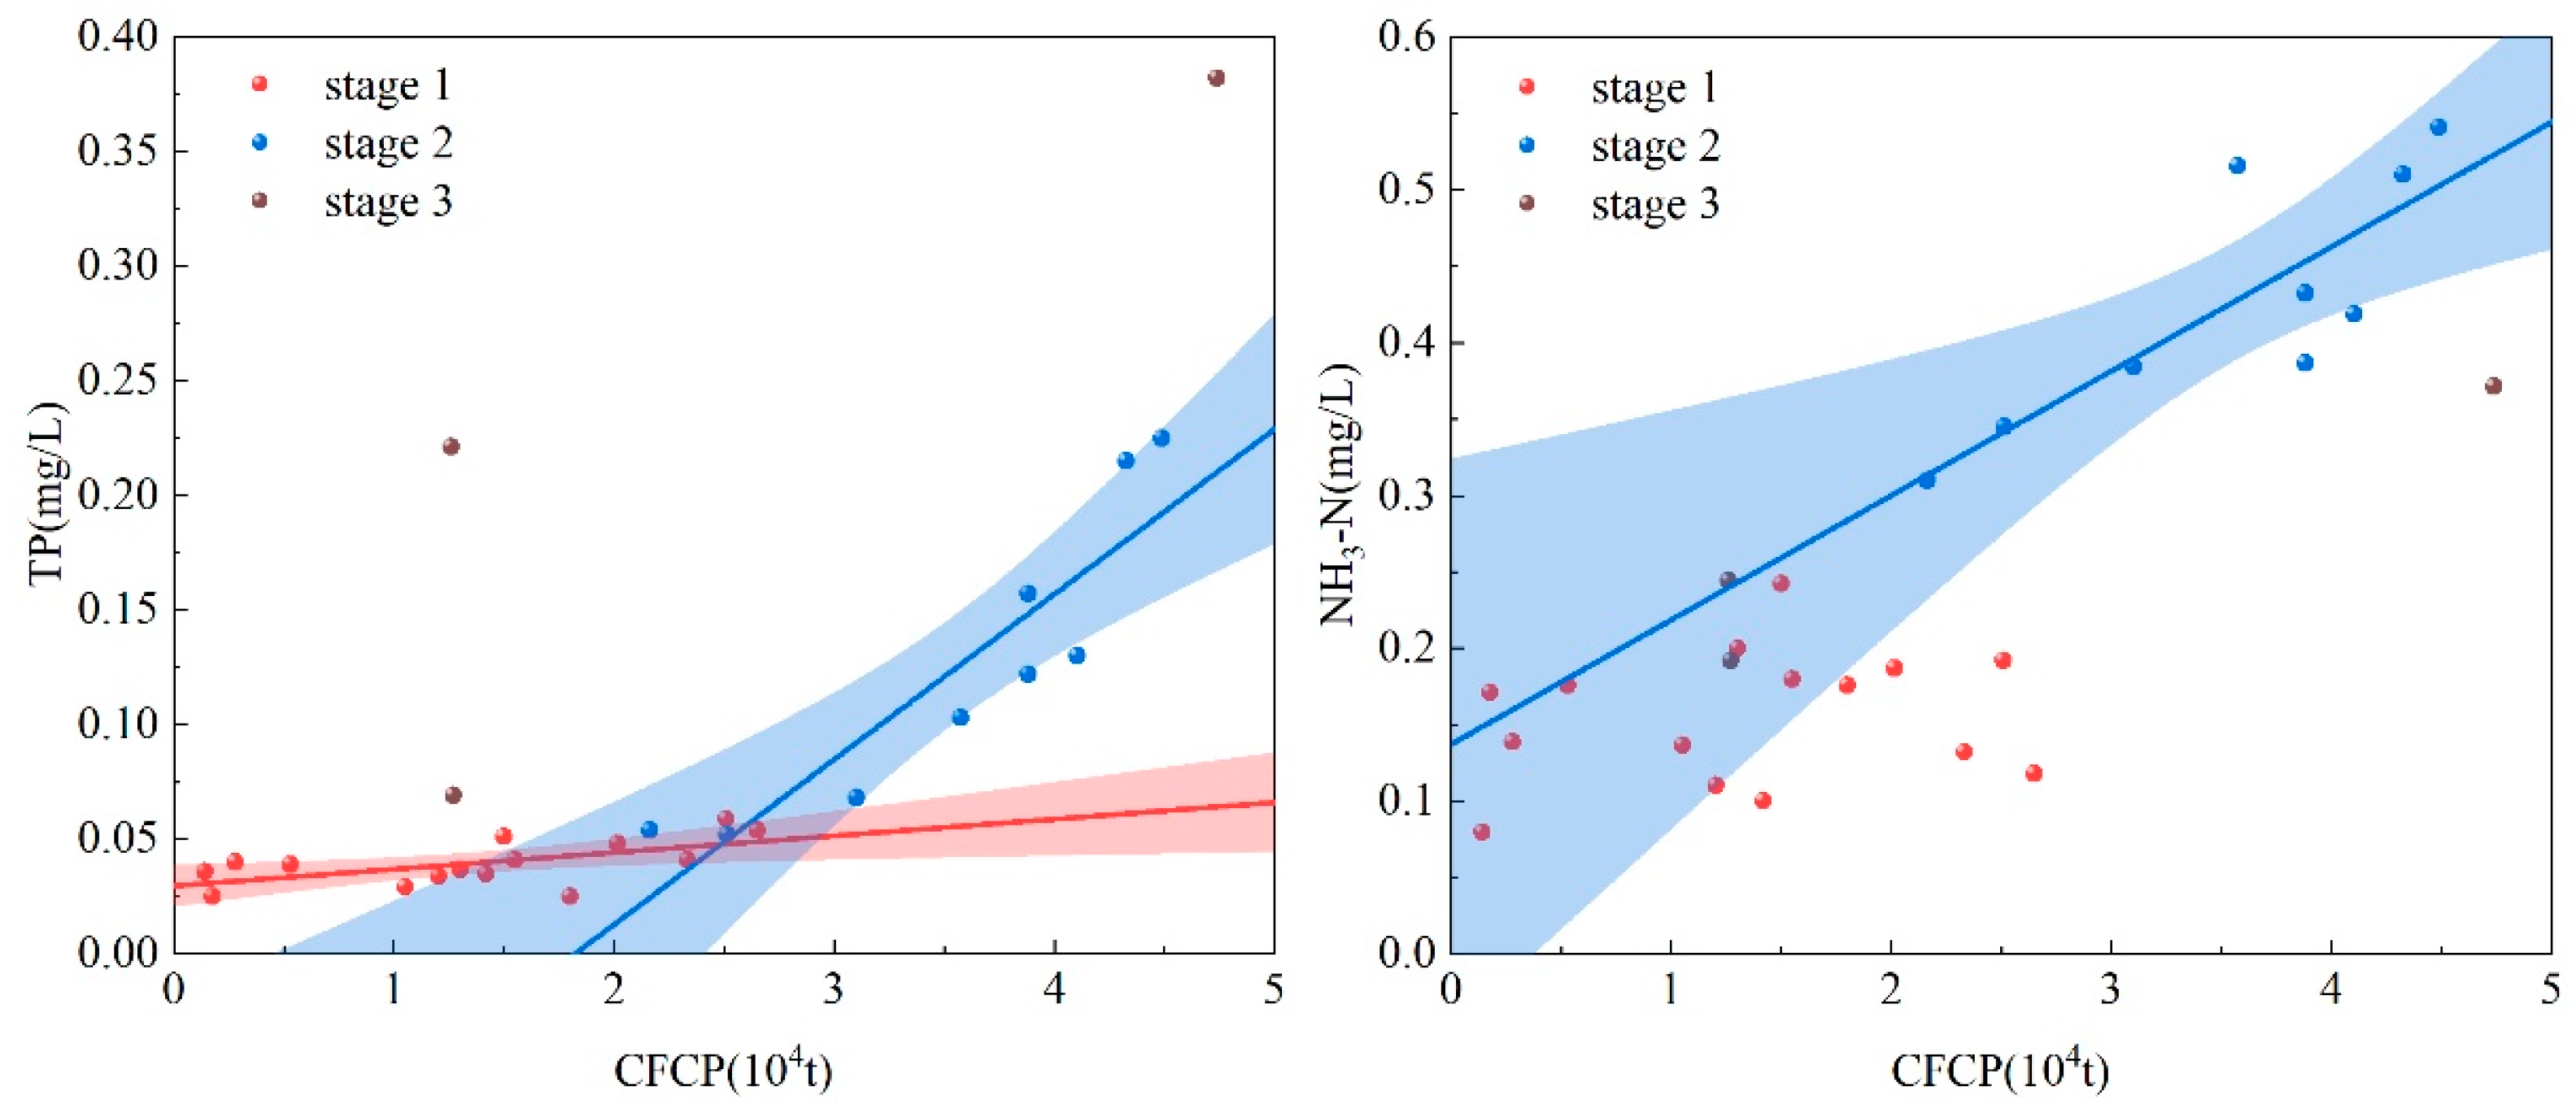
3.4. Effects of Cage-Fish Culture on Water Quality Changes in Daheiting Reservoir

Cage-fish culture in Daheiting reservoir is divided into three stages. In order to more accurately analyze the impact of cage-fish culture at each stage on the water quality of Daheiting reservoir, correlation analysis and regression analysis were carried out in stages using the basic data of the aquatic product yield in Qianxi County and the TP and NH3-N of Daheiting reservoir from 1992 to 2018(Table 1, Figure 8). The results showed that there was a significant correlation (p < 0.05) between TP and cage-fish culture production in stage one (1992–2006), but the fitting effect was not satisfactory (R2 = 0.36); there was no correlation between NH3-N and cage-fish culture production. At this stage, the reservoir mainly cultured silver carp and bighead carp. Bighead carp and silver carp have been proven to effectively inhibit the reproduction of Microcystis [26], thereby indirectly absorbing nitrogen and phosphorus nutrients. For example, Benjamin et al. found that phytoplankton accounted for about 63.5% of silver carp food [27]. Huang et al. [28] took Panjiakou Reservoir as the research object and found that bighead carp can reduce the concentration of TP in water by preying on phytoplankton. Therefore, although the cage culture area was larger at this stage, it did not have a significant impact on TP and NH3-N. The second stage was from 2007 to 2015. Compared with the first stage, the aquaculture area in this stage was greatly reduced, while the cage-fish culture production increased significantly. Both TP and NH3-N had a very significant positive correlation with cage-fish culture production (p < 0.01). Because the feed contains a large amount of pollutants such as nitrogen, phosphorus, and organic matter, after being put into the water body, the organic nitrogen gradually mineralizes to form NH3-N, which causes the concentration of NH3-N and TP in the water to increase [29,30]. Therefore, “cage fish culture” at this stage was one of the important factors that caused the obvious increase in reservoir TP and NH3-N. In the third stage (2016~2018), since the cages were completely removed, there was no correlation between TP and NH3-N and cage-fish culture production.

4. Discussions

We selected Qianxi County’s per capita GDP from 1991 to 2018 as the independent variable, and TP and NH3-N as the dependent variable, and used the mathematical model of EKC theory to conduct regression analysis. The results are as follows.
TP and per capita GDP show a “U”-shaped change pattern (Figure 9), and are in the right half of the “U” shape. This shows that with the development of the economy, the TP of the reservoir maintained an upward trend. The possible reasons for this phenomenon are the following: (1) There are many and complex factors affecting the TP change of Daheiting reservoir. Although there is a positive correlation between the two, it is still uncertain whether economic development is the main influencing factor. (2) The maximum water depth in front of the dam of Daheiting reservoir can reach 26 m, and there is a stable thermal stratification phenomenon from May to September. Phosphorus content in the mud is relatively high, gradually shifting from “sink” to “source”. During thermal stratification, the lack of oxygen at the bottom will cause a large amount of phosphorus to be released from the sediment to the overlying water body. After the thermal stratification disappears, TP quickly diffuses to the surface water body, resulting in an increase in the concentration of TP in the water body [15]. Therefore, there may be some hysteresis in the improvement of water quality, and this hypothesis can be further verified according to the monthly change law of TP in Daheiting reservoir.
NH3-N and per capita GDP are in an inverted “N” shape (Figure 9), and the inflection points appear when the per capita GDP is CNY 16,900 and CNY 92,600, corresponding to 2003 and 2011, respectively. Before 2003, the economic development of Qianxi County was slow, the industrial structure was in the adjustment stage, and the industry was still in the rising stage of development. At this time, economic development did not significantly increase the concentration of NH3-N. After 2003, the proportion of each industry structure was basically stable, and the secondary industry accounted for more than 60%. In 2007, the influence of artificial feed for cage fish culture was superimposed, which further intensified the input of exogenous NH3-N, and the concentration of NH3-N in the reservoir increased rapidly. From 2011 to 2015, China began to attach importance to and strengthen water-environment protection, and the State Council successively issued water-environment protection policies, such as “Opinions on Strengthening Key Environmental Protection Work” and “Notice on National Environmental Protection “Twelfth Five-Year Plan”” planning [14], especially after the release of the Action Plan for the Rule of Law in Water Pollution in 2015; this was the first time that a basic national policy of environmental protection had been implemented as a specific and strict government responsibility. The NH3-N in Daheiting reservoir fluctuated up and down. After the implementation of the net cage cleanup operation in Daheiting reservoir in 2016, NH3-N began to decrease year by year.
Through the above analysis, it can be found that the water quality change of Daheiting reservoir is closely related to the upstream water, economic development and cage-fish culture. However, the priority relationship between TP and NH3-N and the response of the above influencing factors is still unknown. For this reason, this study conducted further analysis through RDA (Redundancy analysis), and the results showed that the concentration of TP and NH3-N in the upstream Panjiakou Reservoir and the primary industry (including cage fish culture industry) are the factors that affect the TP and NH3-N concentration of Daheiting reservoir (Figure 10). Among them, upstream water is the primary factor affecting TP, and the primary industry (cage-fish farming) has a greater impact on NH3-N. It can be shown that the exogenous input of nutrients was the main factor of TP and NH3-N concentration during the second stage of the reservoir.

5. Conclusions

The interannual changes of TP and NH3-N in Daheiting reservoir can be divided into three stages: 1992–2006, 2007–2016 and 2017–2018. These periods demonstrated the characteristics of basically unchanged, a significant increase and a significant decrease in turn. Among them, both TP and NH3-N in the first stage met the water quality target requirements, and the change trend was basically not affected by economic development. In the second stage, there was a significant positive correlation. With the improvement in the economic level of China, the concentration of TP and NH3-N increased rapidly; in particular the content of TP was significantly exceeded, and the water body was in a state of severe eutrophication. In the third stage, the speed of economic development slowed down, environmental protection efforts were strengthened, and TP and NH3-N showed significant improvement again.
The TP and NH3-N of Daheiting reservoir were significantly correlated with the upstream water, cage-fish culture and the output value of various industries. Among them, the quality of upstream water quality and the primary industry (including cage-fish culture) were the primary factors affecting the changes in TP and NH3-N concentration, which was mainly reflected in the second and third stages, when the concentration of upstream water quality indicators increased and the net cages increased. The concentration of TP and NH3-N in the reservoir increased sharply due to the feeding of fish culture, and the TP and NH3-N decreased significantly after the cages were removed, but there was a certain lag in TP due to the influence of endogenous pollution.

Author Contributions

Writing—original draft preparation, B.L.; writing—review and editing, X.L. and B.L.; methodology, K.C.; visualization, C.L. and B.L.; data curation, S.W. All authors have read and agreed to the published version of the manuscript.

Funding

This research was funded by the National Basic Research Program of China (2021YFC3200903), independent research project of State Key Laboratory of Simulation and Regulation of Water Cycle in River Basin (NO. SKL2022ZD02).

Data Availability Statement

The data have been explained in the paper.

Acknowledgments

We thank Shaoming Wang and Enling Zhao from the Luanhe River diversion project management bureau for providing water quality data.

Conflicts of Interest

The authors declare no conflict of interest.

References

  1. Li, Z.; Ma, J.; Guo, J.; Paerl, H.W.; Brookes, J.D.; Xiao, Y.; Fang, F.; Ouyang, W.; Lunhui, L. Water quality trends in the Three Gorges Reservoir region before and after impoundment (1992–2016). Ecohydrol. Hydrobiol. 2019, 19, 317–327. [Google Scholar] [CrossRef]
  2. Shourian, M.; Moridi, A.; Kaveh, M. Modeling of eutrophication and strategies for improvement of water quality in reservoirs. Water Sci. Technol. 2016, 74, 1376–1385. [Google Scholar] [CrossRef]
  3. Yang, L.; Peng, S.; Zhao, X.; Li, X. Development of a two-dimensional eutrophication model in an urban lake (China) and the application of uncertainty analysis. Ecol. Model. 2017, 345, 63–74. [Google Scholar]
  4. Longyang, Q. Assessing the effects of climate change on water quality of plateau deep-water lake-A study case of Hongfeng Lake. Sci. Total Environ. 2019, 647, 1518–1530. [Google Scholar] [CrossRef] [PubMed]
  5. Grossman, G.M.; Krueger, A.B. Environmental Impacts of a North American Free Trade Agreement; National Bureau of Economic Research: Cambridge, MA, USA, 1991. [Google Scholar]
  6. Panayotou, T. Empirical Tests and Policy Analysis of Environmental Degradation at Different Stages of Economic Development; International Labour Office: Geneva, Switzerland, 1993. [Google Scholar]
  7. Paudel, K.P.; Zapata, H.; Susanto, D. An empirical test of environmental Kuznets curve for water pollution. Environ. Resour. Econ. 2005, 31, 325–348. [Google Scholar] [CrossRef]
  8. Lee, C.C.; Chiu, Y.B.; Sun, C.H. The environmental Kuznets curve hypothesis for water pollution: Do regions matter? Energy Policy 2010, 38, 12–23. [Google Scholar] [CrossRef]
  9. Thompson, A. Environmental Kuznets curve for water pollution: The case of border countries. Mod. Econ. 2014, 5, 66–69. [Google Scholar] [CrossRef]
  10. Tenaw, D.; Beyene, A.D. Environmental sustainability and economic development in sub-Saharan Africa: A modified EKC hypothesis. Renew. Sustain. Energy Rev. 2021, 143, 110897. [Google Scholar] [CrossRef]
  11. Al Sayed, A.; Sek, S.K. Environmental Kuznets curve: Evidences from developed and developing economies. Appl. Math. Sci. 2013, 7, 1081–1092. [Google Scholar] [CrossRef]
  12. Özokcu, S.; Özdemir, Ö. Economic growth, energy, and environmental Kuznets curve. Renew. Sustain. Energy Rev. 2017, 72, 639–647. [Google Scholar] [CrossRef]
  13. Ongan, S.; Isik, C.; Ozdemir, D. Economic growth and environmental degradation: Evidence from the US case environmental Kuznets curve hypothesis with application of decomposition. J. Environ. Econ. Policy 2021, 10, 14–21. [Google Scholar] [CrossRef]
  14. Wei, M.; Huang, S.; Li, L.; Zhang, T.; Akram, W.; Khatoon, Z.; Renaud, F.G. Evolution of water quality and biota in the Panjiakou Reservoir, China as a consequence of social and economic development: Implications for synergies and trade-offs between Sustainable Development Goals. Sustain. Sci. 2021, 17, 1385–1404. [Google Scholar] [CrossRef]
  15. Liu, C.; Wang, S.; Liu, X.; Zhou, H.; Li, B.; Du, Y.; Wang, L. Characteristics of water quality response to hypolimnetic anoxia in Daheiting Reservoir. Water Sci. Technol. 2022, 85, 2065–2075. [Google Scholar] [CrossRef]
  16. Yang, W.; Yao, J.; He, Y.; Huang, Y.; Liu, H.; Zhi, Y.; Qian, S.; Yan, X.; Jian, S.; Li, W. Nitrogen removal enhanced by benthic bioturbation coupled with biofilm formation: A new strategy to alleviate freshwater eutrophication. J. Environ. Manag. 2021, 292, 112814. [Google Scholar] [CrossRef] [PubMed]
  17. Smith, V.H.; Tilman, G.D.; Nekola, J.C. Eutrophication: Impacts of excess nutrient inputs on freshwater, marine, and terrestrial ecosystems. Environ. Pollut. 1999, 100, 179–196. [Google Scholar] [CrossRef]
  18. Nürnberg, G.K. Trophic state of clear and colored, soft-and hardwater lakes with special consideration of nutrients, anoxia, phytoplankton and fish. Lake Reserv. Manag. 1996, 12, 432–447. [Google Scholar] [CrossRef]
  19. Dodds, W.K.; Jones, J.R.; Welch, E.B. Suggested classification of stream trophic state: Distributions of temperate stream types by chlorophyll, total nitrogen, and phosphorus. Water Res. 1998, 32, 1455–1462. [Google Scholar] [CrossRef]
  20. Håkanson, L. A Review on Effect-Dose-Sensitivity Models for Aquatic Ecosystems. Int. Rev. Gesamten Hydrobiol. Hydrogr. 1994, 79, 621–667. [Google Scholar] [CrossRef]
  21. Jing, C.; Su, B.D.; Zhai, J.Q.; Wang, Y.J.; Lin, Q.G.; Gao, M.N.; Jiang, S.; Chen, Z.Y.; Jiang, T. Gridded value-added of primary, secondary and tertiary industries in China under Shard Socioeconomic Pathways. Sci. Data 2022, 9, 309. [Google Scholar] [CrossRef]
  22. Kang, G.; Yin, J.; Cui, N.; Ding, H.; Wang, S.; Wang, Y.; Qi, Z. The long-term and retention impacts of the intervention policy for cage aquaculture on the reservoir water qualities in Northern China. Water 2020, 12, 3325. [Google Scholar] [CrossRef]
  23. Domagalski, J.; Lin, C.; Luo, Y.; Kang, J.; Wang, S.; Brown, L.R.; Munn, M.D. Eutrophication study at the Panjiakou-Daheiting Reservoir system, northern Hebei Province, People’s Republic of China: Chlorophyll-a model and sources of phosphorus and nitrogen. Agric. Water Manag. 2007, 94, 43–53. [Google Scholar] [CrossRef]
  24. Liu, C.; Liu, X.; Zhou, H.; Li, B.; Wang, S.; Wang, L. Study on the threshold condition to suppress anoxic zone by large flow operation process. J. Hydraul. Eng. 2021, 52, 1217–1228. [Google Scholar] [CrossRef]
  25. Liu, C.; Liu, X.; Zhou, H.; Wang, S.; Li, B. Temporal and spatial evolution characteristics and driving factors of reservoir anoxic zone. J. Hydraul. Eng. 2019, 50, 1479–1490. [Google Scholar] [CrossRef]
  26. Geletu, T.T. Lake eutrophication: Control of phytoplankton overgrowth and invasive aquatic weeds. Lakes Reserv. Res. Manag. 2023, 28, e12425. [Google Scholar] [CrossRef]
  27. Tumolo, B.B.; Flinn, M.B. Diet of invasive silver carp (Hypophthalmichthys molitrix) in a mainstem reservoir ecosystem. J. Ky. Acad. Sci. 2019, 79, 3–11. [Google Scholar]
  28. Huang, S.; Wu, M.; Zang, C.; Du, S.; Domagalski, J.; Gajewska, M.; Gao, F.; Lin, C.; Guo, Y.; Liu, B. Dynamics of algae growth and nutrients in experimental enclosures culturing bighead carp and common carp: Phosphorus dynamics. Int. J. Sediment Res. 2016, 31, 173–180. [Google Scholar] [CrossRef]
  29. Hargreaves, J.A. Nitrogen biogeochemistry of aquaculture ponds. Aquaculture 1998, 166, 181–212. [Google Scholar] [CrossRef]
  30. Wu, M.; Huang, S.; Zang, C.; DU, S. Enclosure experimental research with fish culturing in the Panjiakou ReservoirⅡ.Effects of fish food and fish species on phosphorus flux. J. Hydraul. Eng. 2013, 44, 1204–1209. [Google Scholar] [CrossRef]
Figure 1. Map of Daheiting reservoir.
Water 15 03229 g001
Figure 2. Interannual changes of TP (a) and NH3-N (b) and water quality categories (c) in Daheiting reservoir from 1992 to 2018.
Water 15 03229 g002
Figure 3. Monthly changes of TP (a) and NH3-N (b) in Daheiting reservoir from 1992 to 2018.
Water 15 03229 g003
Figure 4. Economic development trend (a) and industrial structure (b) changes in Qianxi County from 1992 to 2018.
Water 15 03229 g004aWater 15 03229 g004b
Figure 5. Changes in the scale of cage fish culture industry in Qianxi County from 1992 to 2018.
Water 15 03229 g005
Figure 6. Interannual changes of TP (a) and NH3-N (b) in Pan Da Reservoir from 1992 to 2018.
Water 15 03229 g006aWater 15 03229 g006b
Figure 7. Correlation analysis of TP (a) and NH3-N (b) between Daheiting reservoir and upstream water quality.
Water 15 03229 g007
Figure 8. Correlation analysis between water quality index and cage-fish culture production of Daheiting reservoir.
Water 15 03229 g008
Figure 9. EKC fitting curve of water quality index and per capita GDP of Daheiting reservoir.
Water 15 03229 g009
Figure 10. RDA analysis between water quality index and various influencing factors in Daheiting reservoir.
Water 15 03229 g010
Table 1. Fitting results of water quality indicators and cage-fish culture production in Daheiting reservoir.
Water Quality FactorStageCurve FittingR2p
TPStage Ⅰy = 7.28 × 10⁻³ × x + 0.030.36<0.05
Stage Ⅱy = 0.07 × x − 0.130.81<0.01
Stage Ⅲ---
NH3-NStage Ⅰ---
Stage Ⅱy = 0.08 × x + 0.140.67<0.01
Stage Ⅲ---
Disclaimer/Publisher’s Note: The statements, opinions and data contained in all publications are solely those of the individual author(s) and contributor(s) and not of MDPI and/or the editor(s). MDPI and/or the editor(s) disclaim responsibility for any injury to people or property resulting from any ideas, methods, instructions or products referred to in the content.

