Article

Phosphate in Aqueous Solution Adsorbs on Limestone Surfaces and Promotes Dissolution

1
College of Environmental Science and Engineering, Guilin University of Technology, Guilin 541004, China
2
College of Civil and Architectural Engineering, Guangxi Vocational and Technical College of Communications, Nanning 530023, China
*
Author to whom correspondence should be addressed.
Water 2023, 15(18), 3230; https://doi.org/10.3390/w15183230
Submission received: 27 July 2023 / Revised: 29 August 2023 / Accepted: 7 September 2023 / Published: 11 September 2023
(This article belongs to the Special Issue Karst Dynamic System and Its Water Resources Environmental Effects)

Abstract

:
The use of large quantities of phosphorus-containing fertilizers has resulted in an increase in phosphorus content in the groundwater system, and phosphorus can be adsorbed on the surface of carbonate rocks, affecting their dissolution process and thus carbon sequestration and sink enhancement in carbonate rocks. Therefore, in this study, limestone was exposed to 2 mg/L and 100 mg/L phosphate solutions for 12 d through static batch adsorption experiments. The hydrochemical results showed that in 100 mg/L phosphate solution, a substitution reaction occurred to produce CaHPO4 precipitate, while the concentration of each ion in 2 mg/L phosphate solution was relatively stable and in dynamic equilibrium; combined with XRD and XPS analyses, the main mechanism of phosphate adsorption may be chemical precipitation, which is preferentially adsorbed to Ca sites on carbonate rocks, and the surface deposits are mainly CaHPO4 and a small amount of Mg2PO4(OH). The FTIR spectra were obtained in the range of 1040 cm−1–1103 cm−1 for observed phosphate vibrations, and the υ3 (asymmetric stretching) mode was more significant in the experimental group with a higher phosphate concentration. Raman spectra located near 149 cm−1 and 275 cm−1 involved Ca2+ or Mg2+ relative translations and vibrations, corroborating the FTIR spectroscopic results; a combination of XRD, XPS, FTIR, and Raman spectra confirmed that phosphate adsorption on limestone may be due to the interaction of electrostatic, chemical precipitation, and ligand exchange mechanisms. In addition, the SEM-EDS results showed that, with the combined effect of the water–rock chemical reaction and physical adsorption, metal–phosphorus phase precipitation was formed on the limestone surface, which promoted the dissolution of limestone and may have an unfavorable effect on the carbon sequestration and sinking of carbonate rocks.

1. Introduction

At the First World Climate Conference (FWCC) held in Geneva in February 1979, attendees emphasized the impact of global warming [1]. With the release of the Intergovernmental Panel on Climate Change (IPCC) Global Assessment Report on Climate Change, the term “climate warming” became increasingly widespread. Many scholars have committed to finding ways to curb global warming, and the concept of carbon neutrality was put forward, which is a series of ways to help recycle CO2 emissions to achieve positive and negative offset and zero CO2 emissions.
Carbonate rock is the world’s largest carbon reservoir, with an area of 22 million km2 [2], in which karst plays an essential role in carbon sequestration and emission reduction. The carbon sink flux of carbonate dissolution is 50.5% that of terrestrial vegetation, 68% that of forests, and 2.68 times that of scrubland, respectively [3]. Because numerous elements influence the dissolution of carbonate rocks, scientists both at home and abroad have conducted research in a variety of areas. Huang Fen [4] and colleagues discovered that when exogenous water enters the karst area, the carbon sink flux increases by 3–10 times due to the intensification of water–rock interaction. He Ruoxue [5] used the 14C method to study the influence of bacterial populations in karst water on karst carbon sinks, and the results revealed that the rate of carbon sequestration by bacteria accounted for 14.93% of that of zooplankton. Yaqiong Yuan [6] investigated the karst carbon sink effect of aquatic photosynthetic organisms and demonstrated that biological carbon pumping is critical in karst carbon sinks.
However, carbonic acid is not the only factor that dissolves carbonates, resulting in sink reduction; studies have shown that nitric and phosphoric acid produced by human activities can also have an impact on karst action, and different types of land use affect soil CO2 to varying degrees, controlling the carbon sink effect of karst processes [7,8]. Anthropogenic acids are implicated in karst action and modify the carbon cycle in the underground river basin of Qingmuguan, Chongqing, where agricultural activities are most intense [9]. Song Chao [10] and Liu Changli [11] conducted indoor simulation tests to compare the effects of farmyard fertilizer and compound fertilizer on the dissolution of carbonate rocks. Li S. L. researched agricultural karst watersheds in southern China and discovered that agricultural operations have a significant impact on the concentration and export of solutes in rivers, chronic nitrate and phosphate contamination of aquifers, and wet nitrogen deposition [12], which directly causes the dissolution of carbonate rocks by nitrate and phosphate, and which in turn causes the sink reduction phenomenon, so the mode of rational fertilization can increase the carbon sequestration capacity of karst landscapes while also improving crop yield [13]. Most scholars have analyzed the effect of fertilizer application on carbonate rock dissolution from a macroscopic point of view, but the study of the microscopic mechanism of phosphate dissolution on carbonate rock during fertilizer application is still insufficient: Salah El-Din El-Mofty [14] rationalized the mechanism of phosphate adsorption on the surface of calcite using thermodynamic calculations; J. Klasa [15] and Zhaoyong Zou [16] studied the dissolution of calcite in the presence of phosphate solutions using atomic force microscopy. Therefore, the present study utilizes hydrochemical processes in combination with various characterization tools such as XRD, XPS, FTIR, Raman spectroscopy, and SEM-EDS to provide strong evidence for experiments on the micromechanisms of phosphate adsorption on limestone, which is of crucial significance for the study of carbonate sequestration and sink enhancement in carbonate rocks.

2. Materials and Methods

2.1. Sample Selection and Preparation

The limestone sample utilized in this experiment came from Mao Village, Chaotian Township, Lingchuan County, Guilin City, Guangxi Province, and the primary components contained in the limestone sample were calcite with minor magnesite. Figure 1 displays the X-ray diffraction peak position.
The limestone block samples were cleaned with deionized water after being cut, crushed, and ball-milled into powder form through a 100-mesh screen, then dried in an oven at 105 °C for 24 h. KH2PO4 (analytically pure) was employed in this experiment to set up standby phosphorus solutions with low concentrations (2 mg/L) and high concentrations (100 mg/L), respectively.

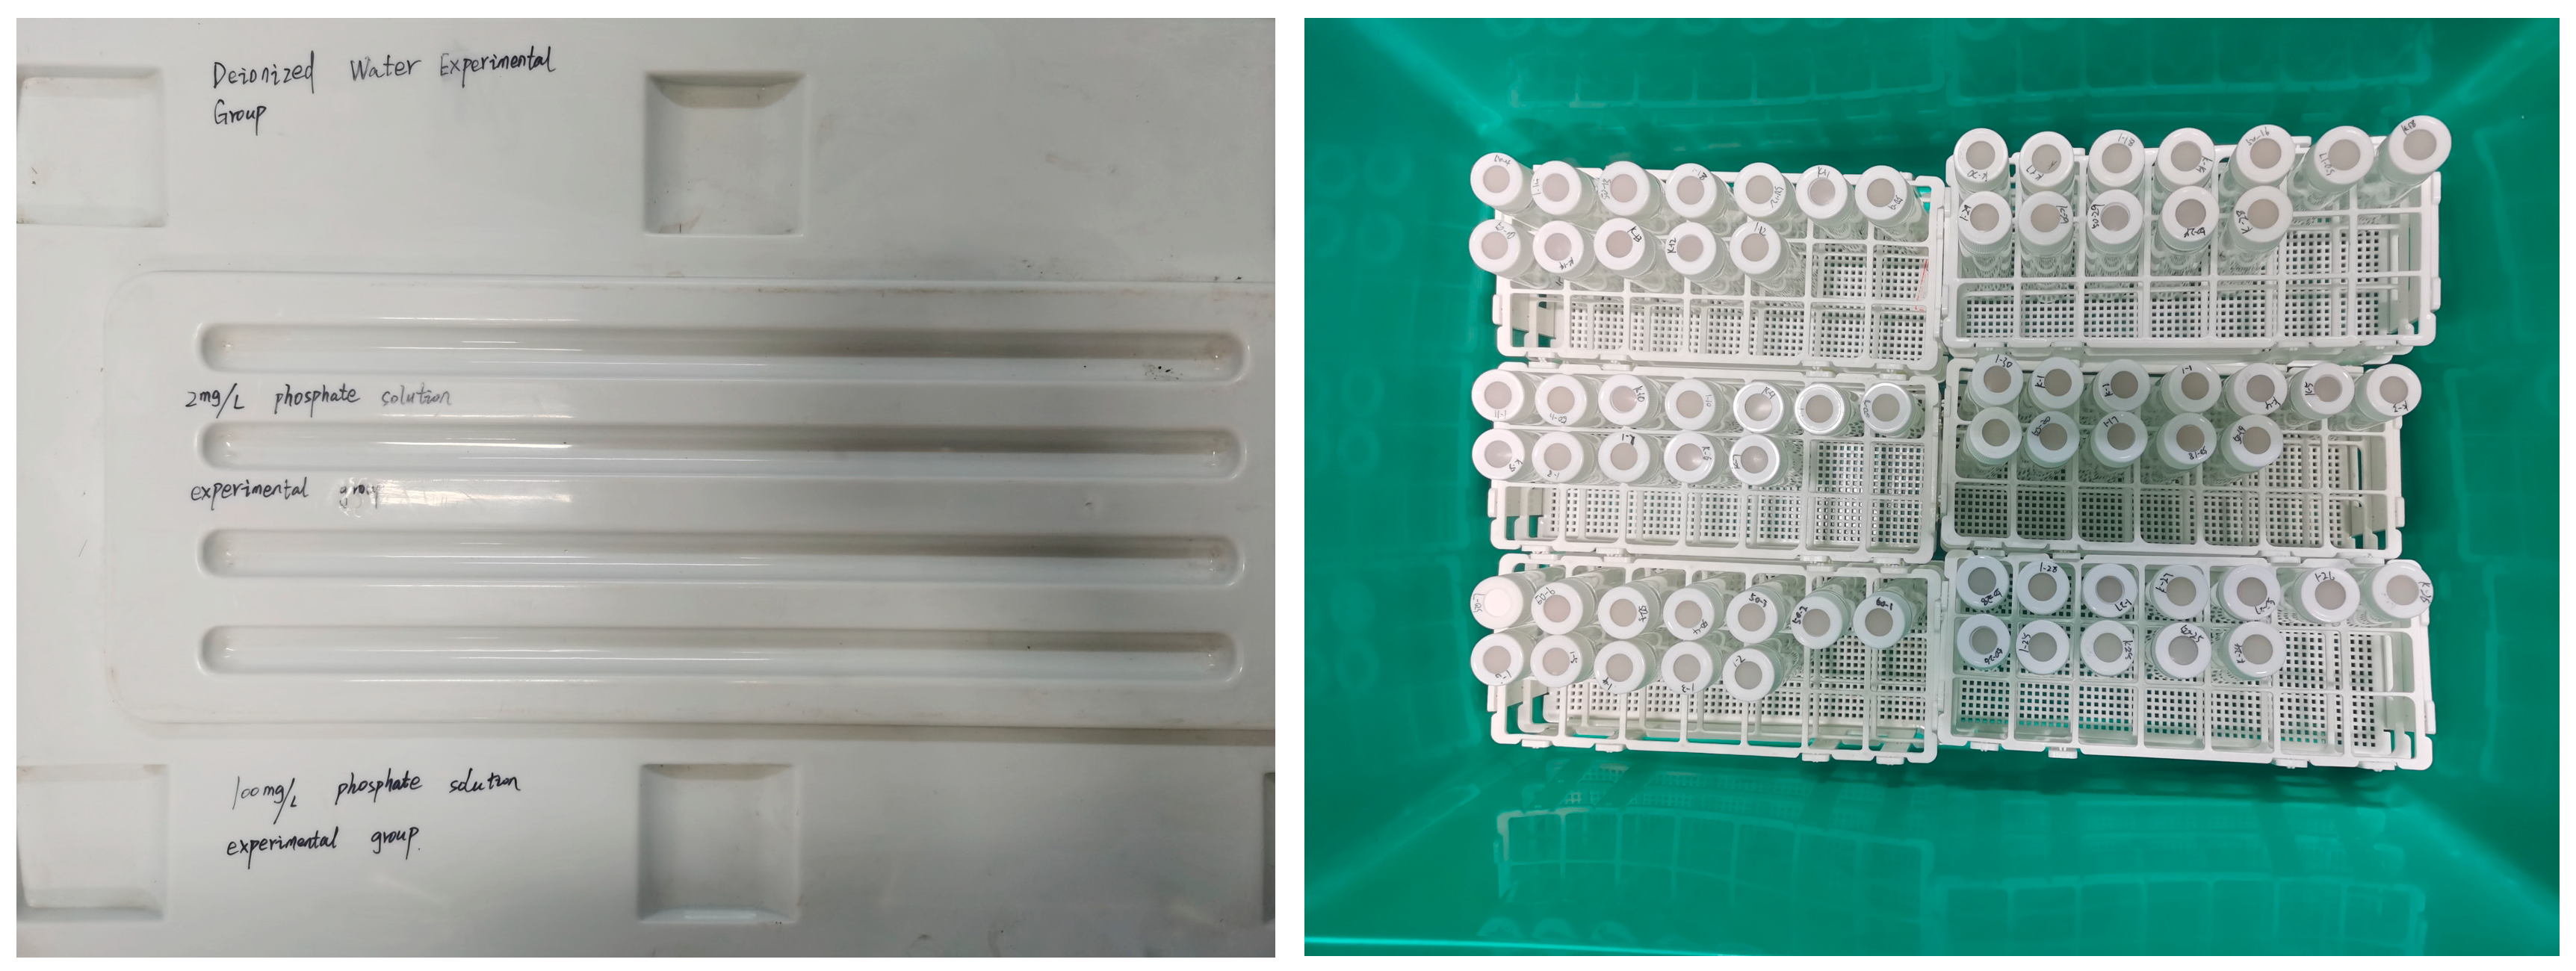
2.2. Static Adsorption Experiments

Two parallel experiments were set up and both were conducted in three groups, as shown in Figure 2: (A) control (deionized water), (B2) the low-phosphorus solution group (2 mg/L), and (B1) the high-phosphorus solution group (100 mg/L); we then filled a 50 mL glass-topped vial with a rubber gasket with 1 g of dry limestone powder and 50 mL of each of the three solutions indicated above. The experimental temperature was kept at roughly 23 °C, and the experimental area was sealed off from the outside atmosphere. The experiment continued for 12 days; one bottle was removed from each of the three experimental groups at 1 d intervals, and the solution pH and conductivity were measured using a portable multiparameter water quality analyzer. The bicarbonate was determined using a MERCK alkalinity titration kit with an accuracy of 0.001 mg/L. The solution in the glass bottle was filtered into a 10 mL centrifuge tube using a syringe with a 0.45 μm filter membrane, and the standard curve was configured with 1000 μg/mL Ca and Mg standard solutions with a gradient of 1 mg/L, 3 mg/L, 5 mg/L, 8 mg/L, and 10 mg/L. The cations (Ca2+, Mg2+) were analyzed in the aqueous solution using Inductively Coupled Plasma Emission Spectroscopy (ICP-OES), with detection limits of 0 ng/mL~1 ng/mL. Finally, the concentration of phosphorus in the solution was determined using the molybdenum blue colorimetric method and a TU-1810SPC UV spectrophotometer (λ = 700 nm; measurement accuracy: 0.1 mg/L) (we used a pipette gun to suck 2 mL of the solution in the glass bottle into the 50 mL colorimetric tube diluted to 25 mL, then added 4 mL of potassium persulfate solution and put it into the autoclave for digestion. Digestion was complete with 50 mL of ultrapure water, followed by the addition of 1 mL of ascorbic acid solution and 2 mL of molybdate solution).

2.3. Characterization of Materials

At the end of the adsorption experiments, the precipitated solids were collected and the solids were dried (oven-baked at 105 °C for 24 h), and the limestone powder was characterized in order to elucidate the mechanism of phosphorus adsorption on limestone during the experiments:
The crystal structure of the limestone powder before and after the experiment was characterized using an X-ray diffractometer (model X’Pert3 Power) with a Cu-target ceramic phototube of standard size design. The scanning method was a Theta/Theta goniometer, a vertical goniometer. The range of rotation during the test was 10°~80°.
In order to further verify the XRD results, a Fourier infrared spectrometer (model Nicolet) and a laser confocal Raman spectrometer (model Thermo Fisher Scientific DXR) were used to determine and analyze the changes in the functional groups of limestone powder before and after the adsorption. The equipment used was a Fourier infrared spectrometer with technical specifications of iS10, using KBr as a compression medium. The laser confocal Raman spectrometer was provided by the American Thermoelectric Company, using a 780-laser light source with a test range of 70 cm−1–3600 cm−1 and a test temperature of 298 K.
An X-ray photoelectron spectrometer (model ESCALAB 250Xi) was used to determine the chemical state of the elements on the limestone samples before and after adsorption and to provide effective validation for the characterization results of XRD, FTIR, and Raman spectra. The X-ray source was a monochromatized Al Ka (1486.6 eV) line source, and the full-spectrum picking passed through the spectra at an energy of 100 eV, with a step size of 1 eV; the narrow-spectrum picking passed through the spectra at an energy of 20 eV, with a step size of 0.1 eV. The vacuum of the test was 10–19 mbar, and all the measured spectral lines of the specimens were calibrated using the standard contamination peaks of C1s (BE = 284.8 eV).
Finally, the surface morphology of the limestone powder was recorded using a field emission scanning electron microscope (model JSM-7900M) coupled with an Oxford instruments technology energy spectrometer (model Ultim Max) to analyze the elemental composition. The test voltage was 1.5 kv, the current was 5 nA, and the WD was about 10 mm.

3. Results and Discussion

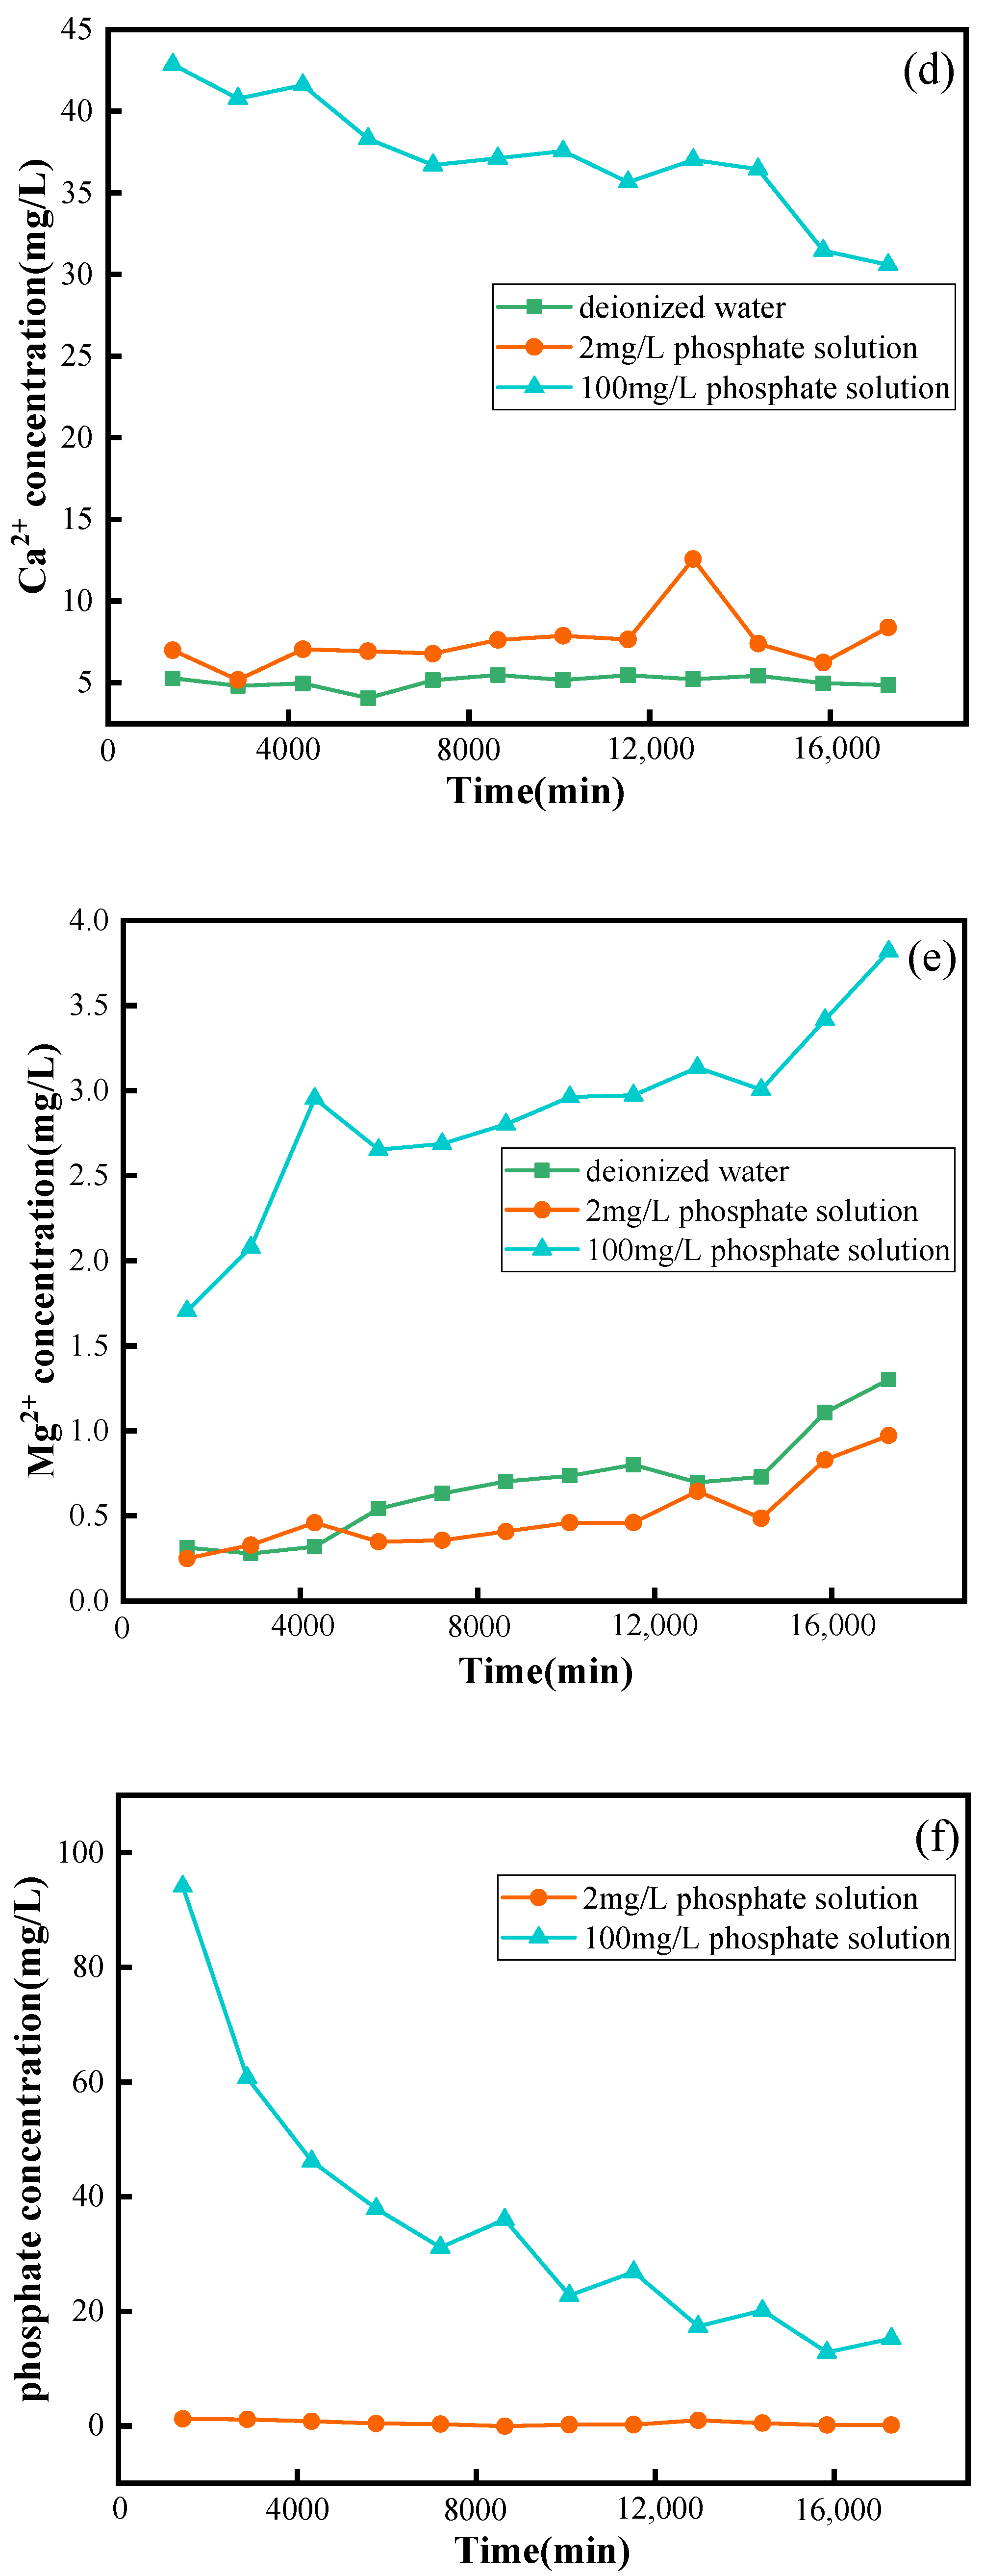
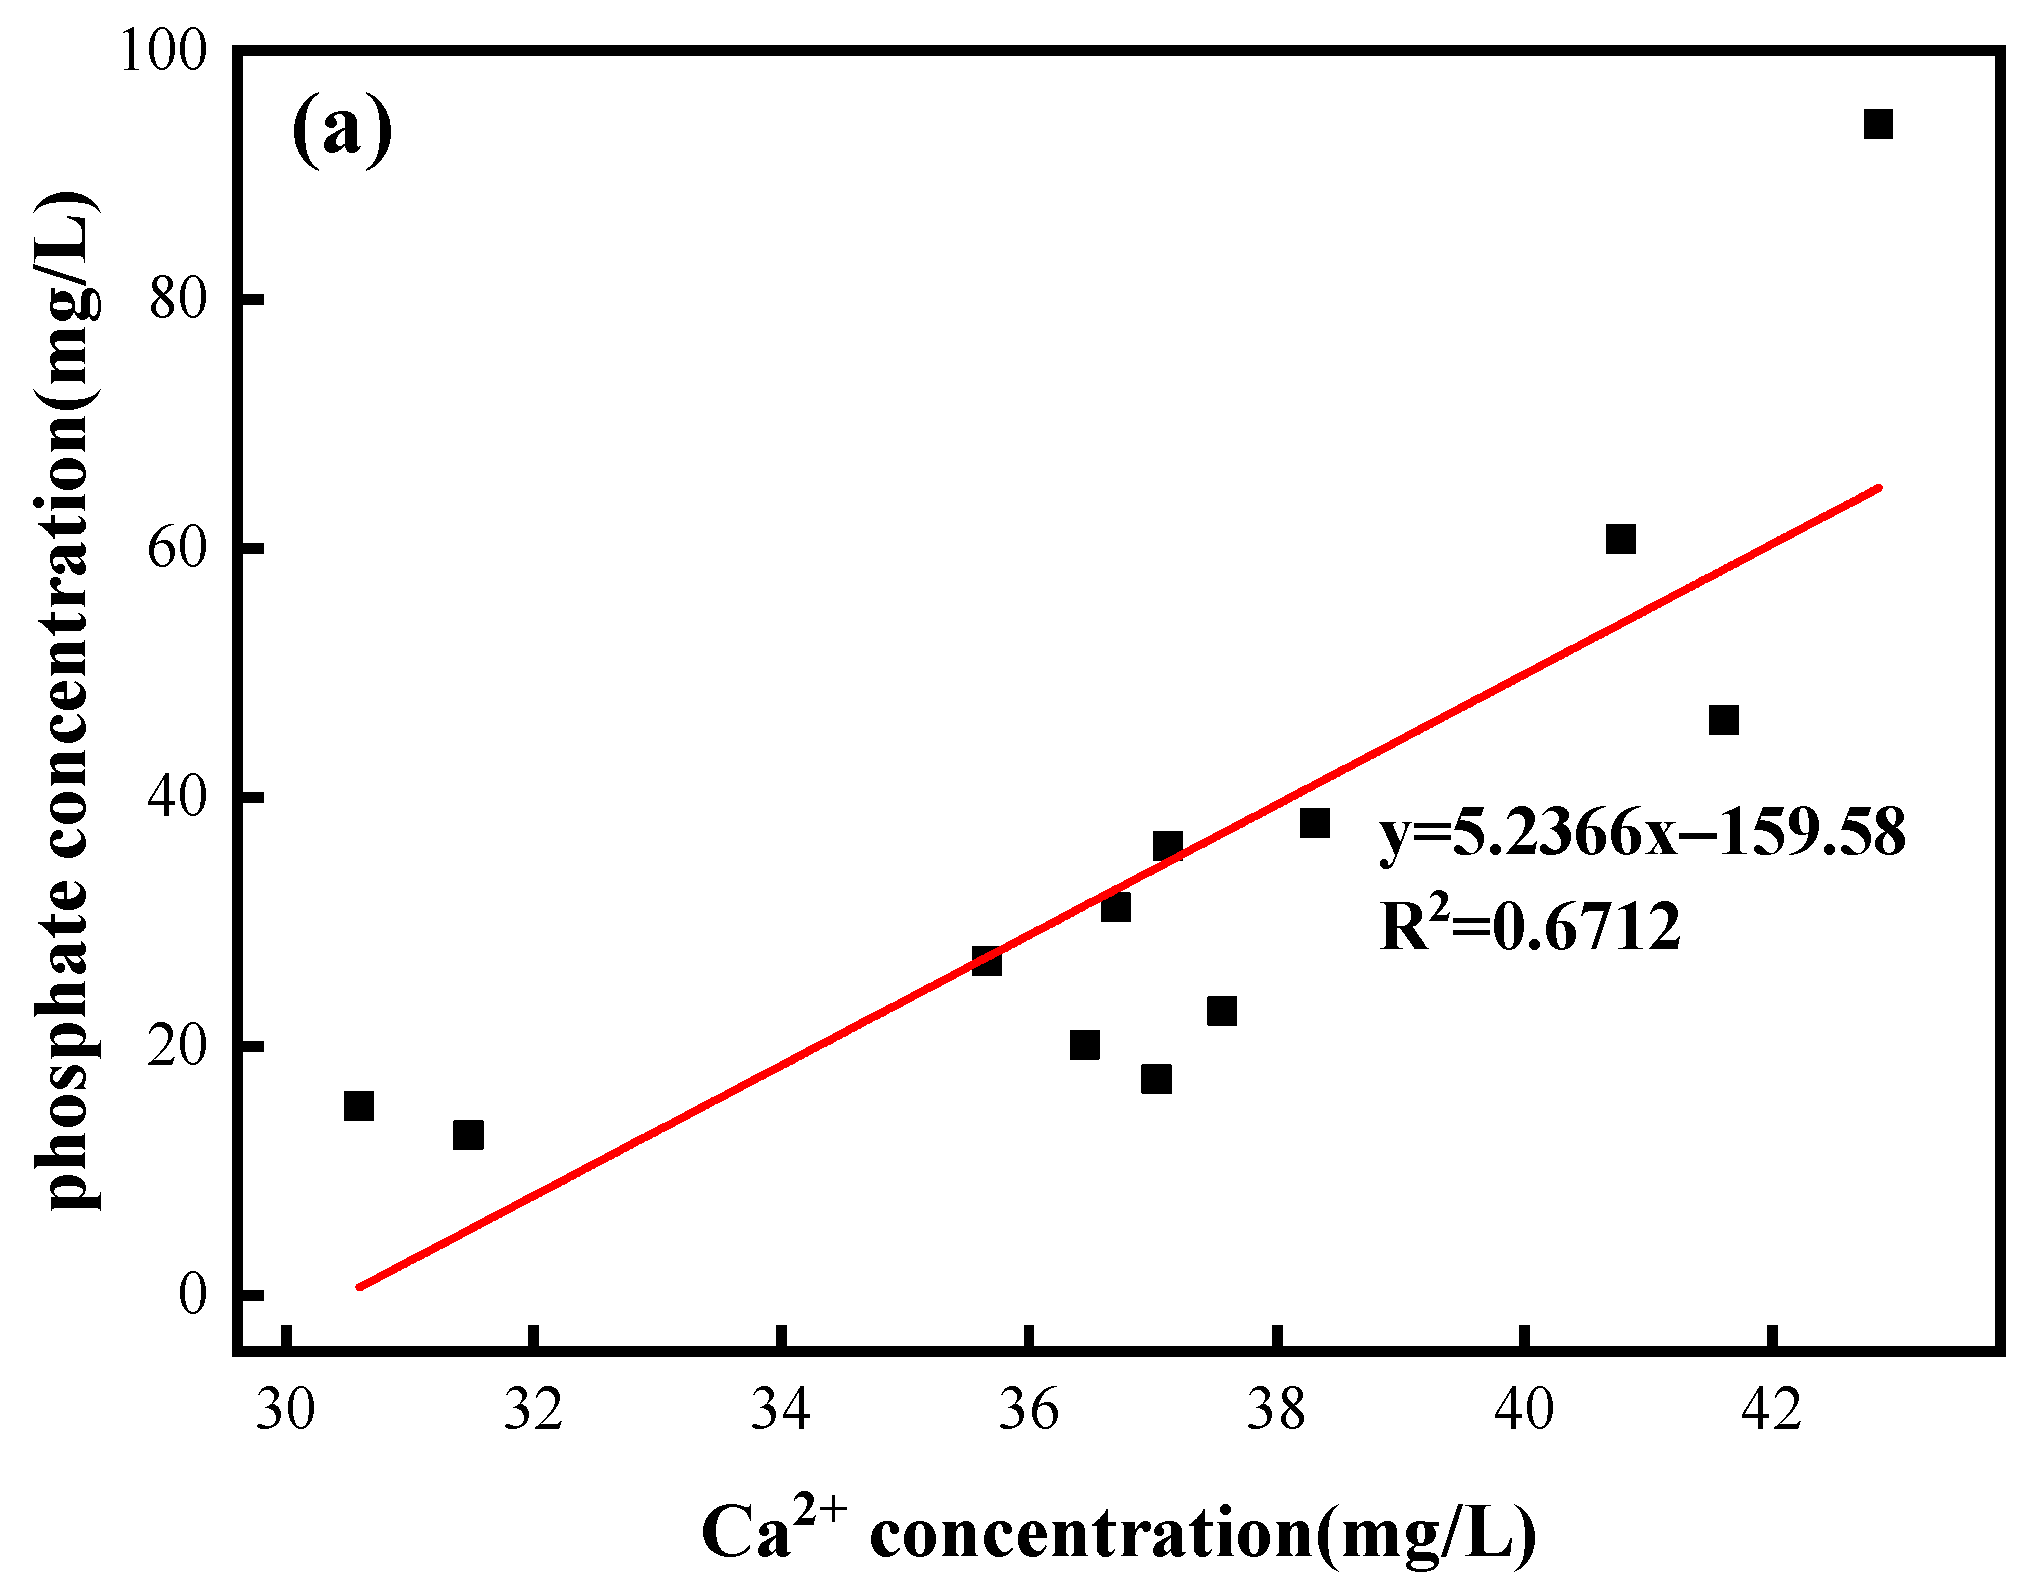
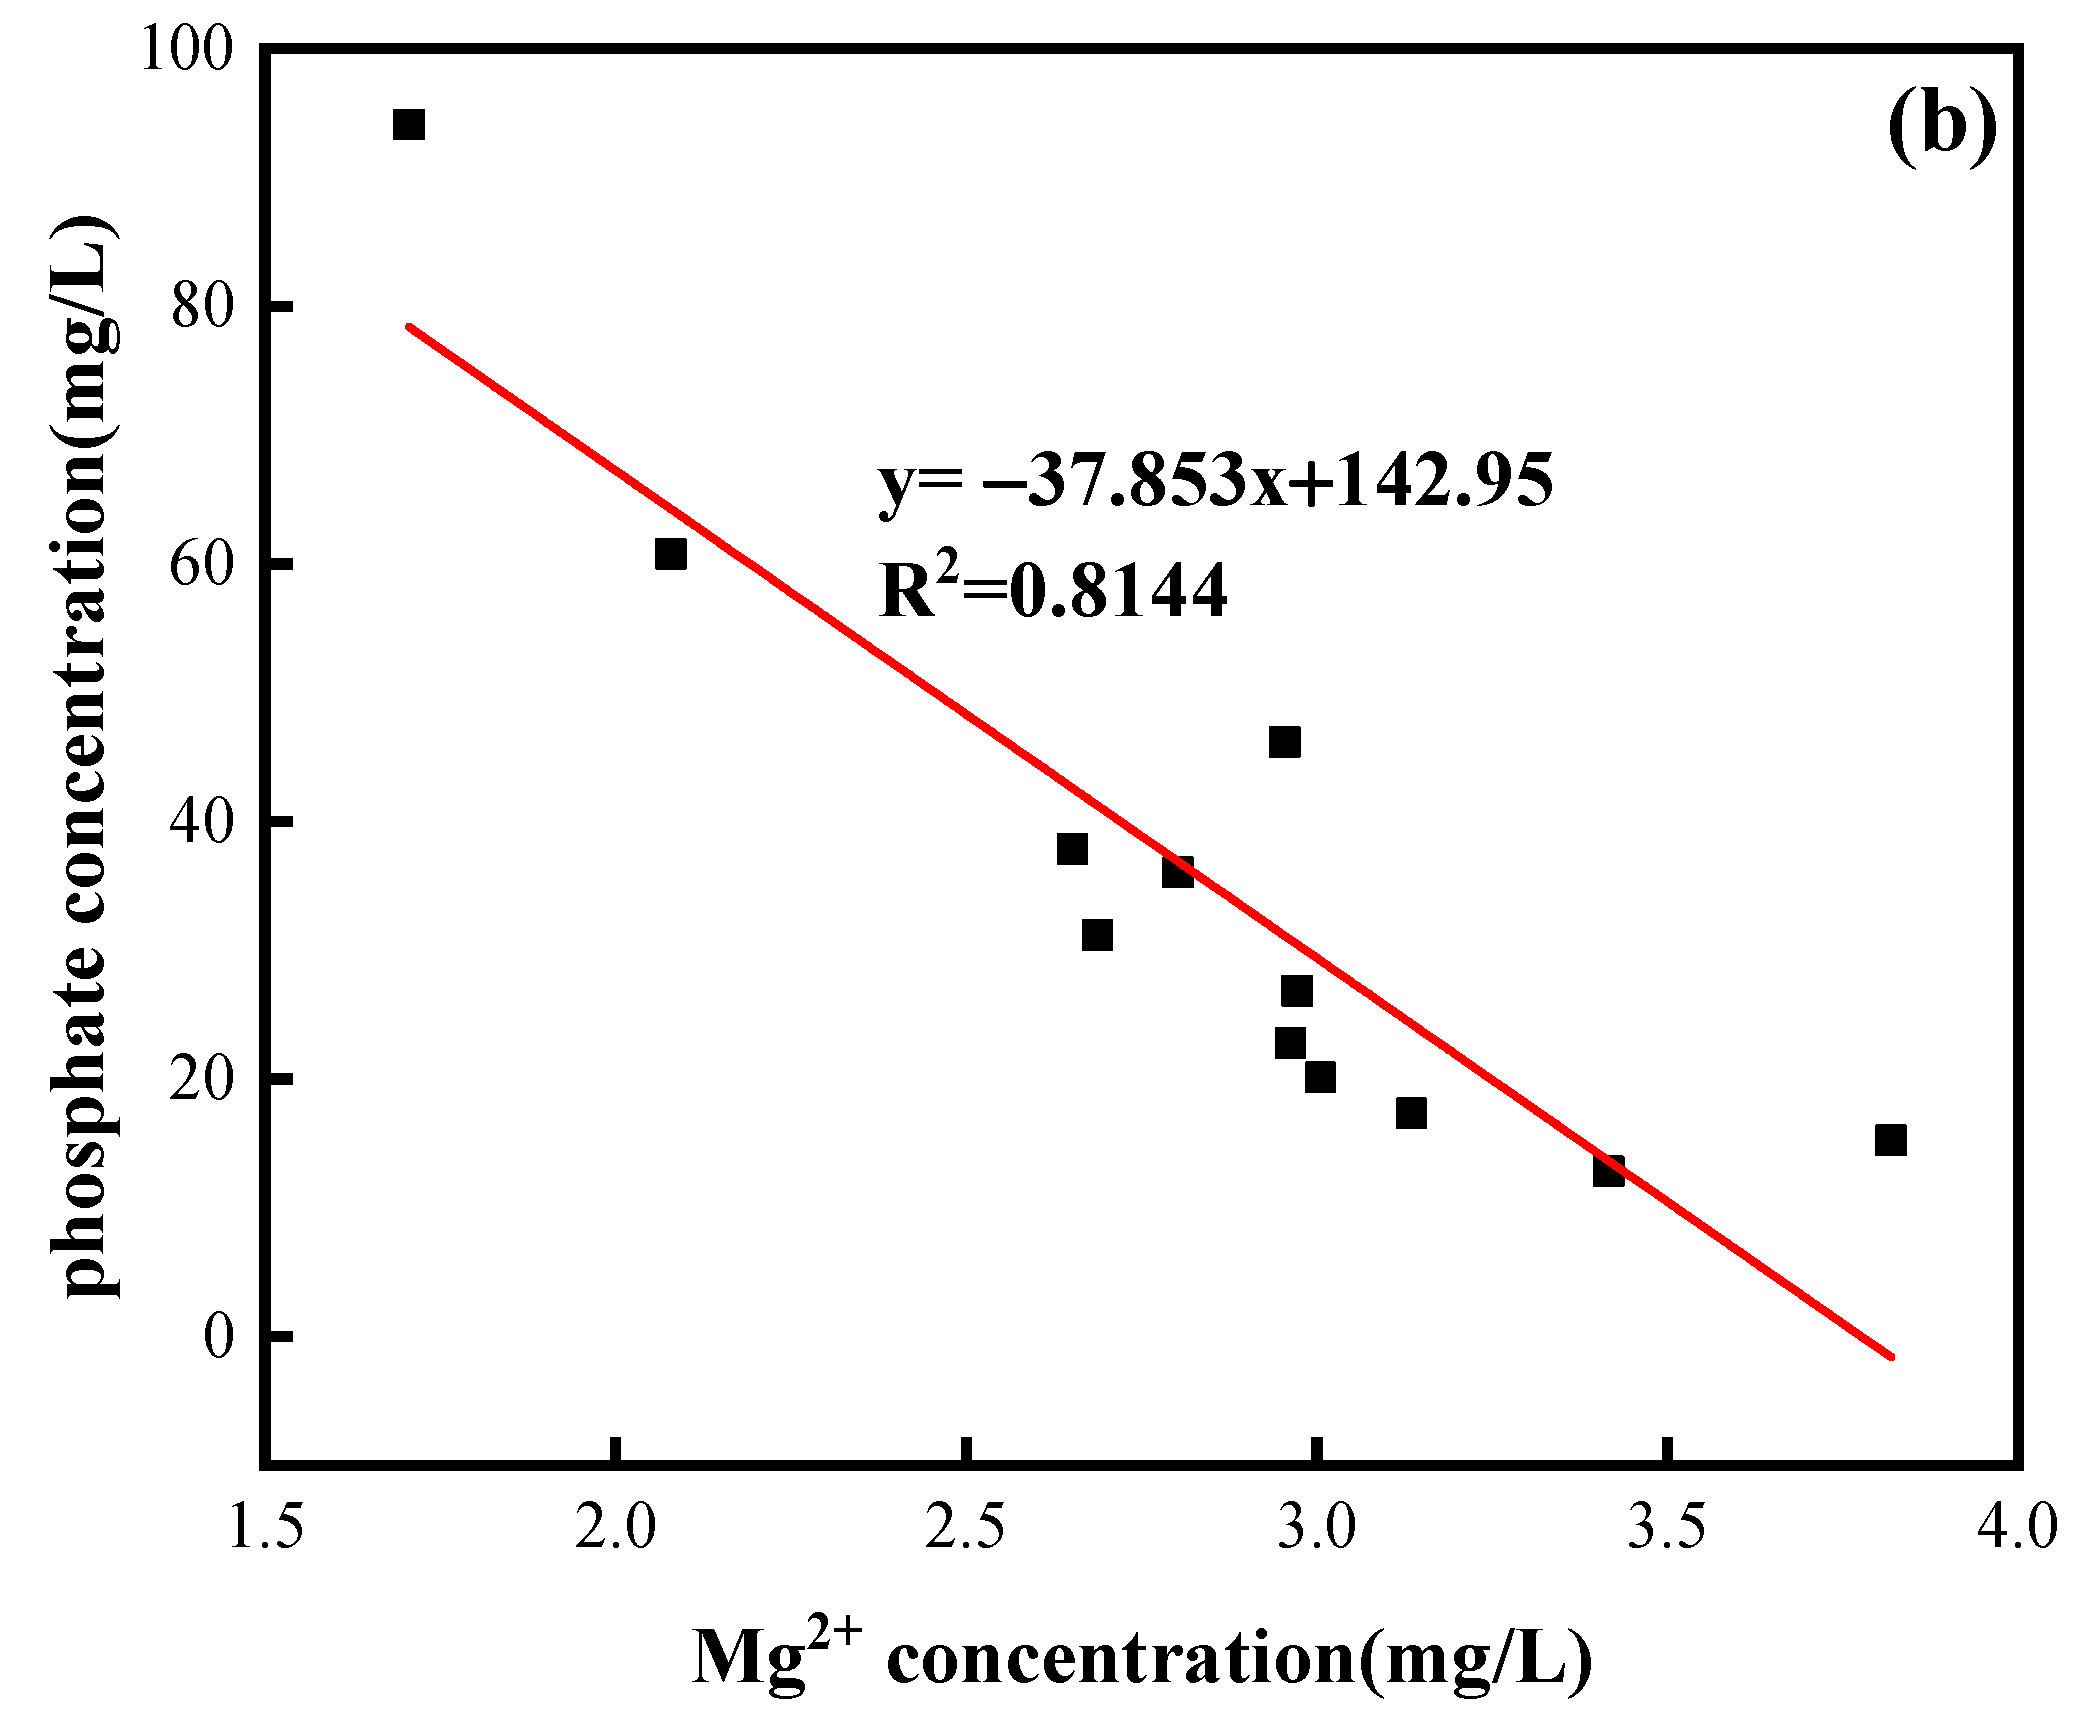
3.1. Phosphate Involvement in the Hydrochemical Processes of Limestone Dissolution

Figure 3 depicts the hydrochemical properties of limestone reacted in three separate reaction systems for 12 days, including total alkalinity (HCO3 concentration); conductivity; pH; and solution Ca2+, Mg2+, and phosphate concentrations. Because the water used for the tests was deionized, there was theoretically no SO42− and NO3 in the solution. It was measured to guarantee the rigor of the experiments, and no SO42− or NO3 were found in the solution. Figure 3a,b show the total alkalinity and conductivity, respectively, and it was discovered that in 100 mg/L phosphate solution, the conductivity increased from 446 μS/cm to 572 μS/cm initially, which increased with the increase in total alkalinity, whereas in the 2 mg/L phosphate solution, both were in the dynamic equilibrium state. By comparison, the conductivity and total alkalinity in the 100 mg/L phosphate solution were higher than in the experimental and control groups of the 2 mg/L phosphate solution, and more ions were displaced out of the solution, indicating that the high phosphate concentration could accelerate the dissolving action of the limestone. The major component of limestone is CaCO3, which is a slightly soluble salt that forms carbonate ions when it comes into contact with water; in the experiment, KH2PO4 produces phosphoric acid and potassium hydroxide when it comes into contact with water, and phosphoric acid ionizes in water to produce phosphate ions, both of which can react with hydrogen ions to make the solution appear alkaline [17]. The pH in all three experimental groups was more than 7, as seen in Figure 3c.
CO32− + H+ = HCO3
KH2PO4 + H2O = H3PO4 + KOH
H3PO4 = H2PO4 + H+
H2PO4 = HPO42− + H+
The concentrations of Ca2+, Mg2+, and phosphate ions in the 100 mg/L phosphate solution were higher than those in the other two experimental groups, as shown in Figure 3d–f, with the Ca2+ concentration changing from 42.86 mg/L to 30.59 mg/L and the phosphate ions concentration changing from 94.122 mg/L to 15.223 mg/L, with both showing a decreasing trend because of the simultaneous presence of CO32− and H2PO4 in the solution, which reacted to form HCO3 and HPO42−. Precipitation of CaHPO4 occurred as the solution alkalinity increased, eliminating phosphate and Ca2+ from the solution, which is in agreement with the findings of Song Y et al. [18]. The increase in Mg2+ concentration may be due to the fact that Ca2+ is more active than Mg2+, and phosphate is preferentially adsorbed on Ca sites [19], which results in more and more of the produced Mg2+ being retained in the solution due to an incomplete reaction. At the same time, the increase in alkalinity may interfere with the activity of other components in the solution, so the concentration of Ca2+ in the 2 mg/L phosphate solution was higher than that of the deionized water solution, but the concentration of Mg2+ was lower, which means this phenomenon could be linked to the highly hydrated ion Mg2+, which will cause a change in the solution’s hydration effect at the limestone–water interface [20].
CO32− + H2PO4 = HCO3 + HPO42−
Ca2+ + HPO42− = CaHPO4
A solution’s ionic strength increases with concentration; in high-strength ionic solutions, the rate of dissolution of limestone will increase due to charge screening that reduces the activity of the crystalline structural units and thus increases their solubility [15].
The correlation between Ca2+, Mg2+, and phosphate during the 12 d of the limestone reaction in the phosphate solution was examined in this work to better clarify the dissolving adsorption of limestone in the phosphate solution, as shown in Figure 4. The outcomes demonstrated a positive association between Ca2+ and phosphate in a 100 mg/L phosphate solution, with a correlation value of R2 = 0.6712; Mg2+ and phosphate had a negative connection, with an R2 value of 0.8144. As a result, Ca2+ had the greatest influence on the experimental adsorption process, while Mg2+ had the smallest impact. In the 2 mg/L phosphate solution, due to the concentration of the solution being lower, Ca2+, Mg2+, and phosphate had no obvious correlation, so they were not analyzed.

3.2. Characterization of Limestone before and after Dissolution
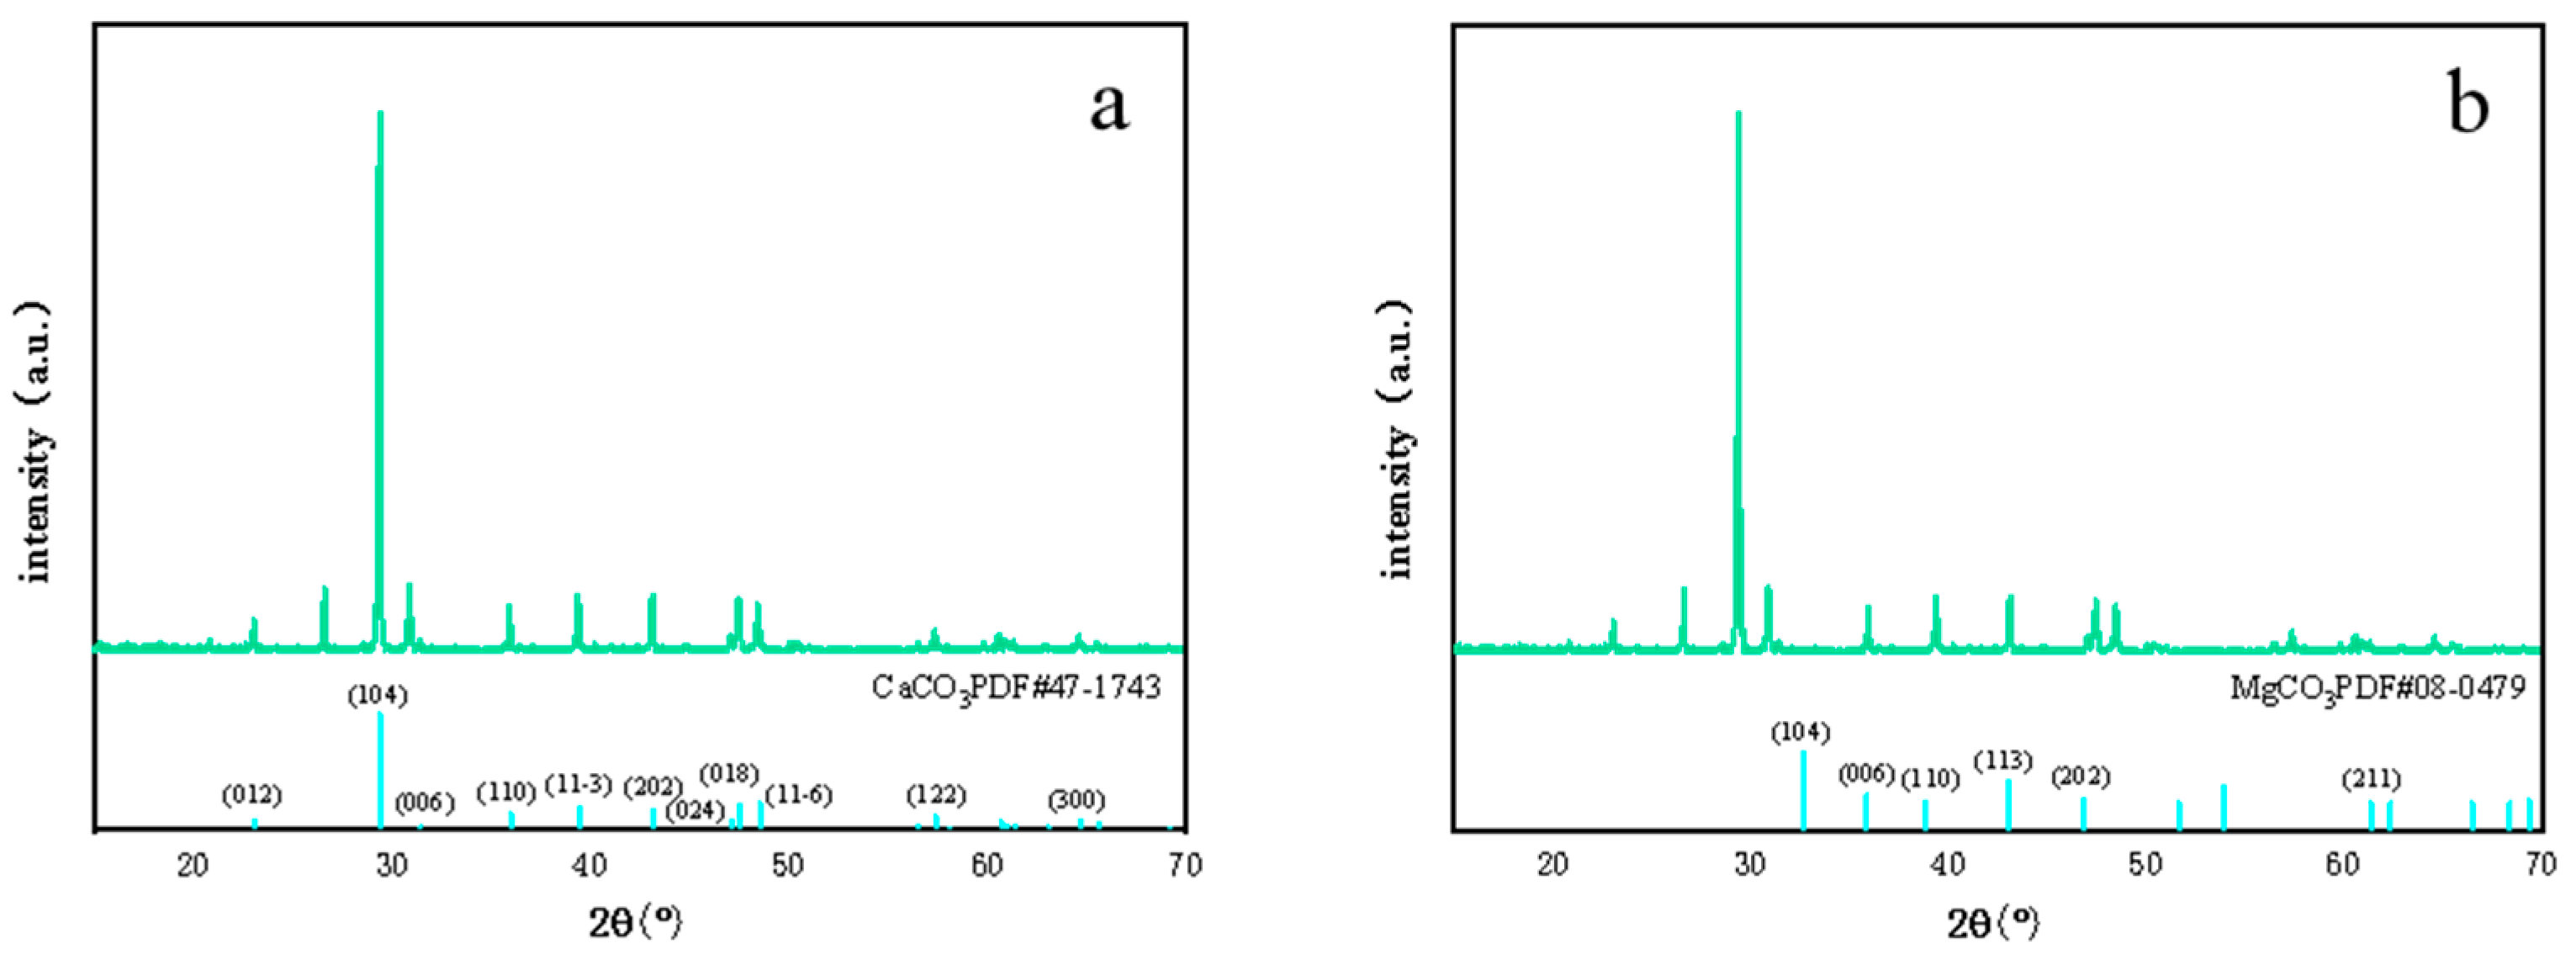
3.2.1. XRD Analysis

In order to further understand the nature of the limestone surface sediments, their structure was analyzed using XRD, and the X-ray diffraction patterns of original limestone samples dissolved in various solutions are shown in Figure 5. The changes in mineral species were detected using XRD in four experimental groups (a: initial sample of limestone, b: deionized water solution, c: 2 mg/L phosphate solution, d: 100 mg/L phosphate solution). This showed that limestone powder was dominated by strong peaks of CaCO3, and the initial sample of limestone powder contained a small amount of MgCO3; in the deionized water solution, the 2θ located at 18.15°, 28.75°, 34.15°, 47.17°, and 50.85° belong to the (001), (100), (101), (102), and (110) facets of Ca(OH)2 (PDF#04-0733), in addition to which a small number of weakly diffracted peaks about Ca(OH)2 appear. This suggests that CaCO3 in limestone and deionized water underwent a water–rock reaction to create Ca(OH)2, and a tiny quantity of CO2 was created in the process to ionize bicarbonate ions after the calcium carbonate was dissolved in water, which confirms that the pH was greater than 7 in all reactions and that the solution was basic.
In the low-concentration phosphate solution, the strong peaks at 2θ appearing at 24.8° (040), 26.1° (131), 26.8° (211), and 33.9° (122) correspond to the CaHPO4 standard diffraction peak cards (PDF#09-0077), while there are strong diffraction peaks at 20.9° (020), 29.3° (021), 30.5° (221), and 34.2° (220) that appear to conform to CaHPO4 standard diffraction peak cards (PDF#09-0077). In the high-concentration phosphate solution, the same diffraction peaks were observed at the same 2θ as the low concentration with relatively high peak intensities; these peaks correspond to the conventional diffraction peak cards of CaHPO4. The strong peaks at 2θ at 24.8° (040), 26.1° (131), 26.8° (211), 29.5° (002), and 30.9° (141) corresponded to the conventional diffraction peak cards of Mg2PO4(OH), and two additional strong peaks occurred in the experimental group with lower concentrations, but the intensity of the Mg2PO4(OH) peak decreased in the high-concentration experimental group.
According to the analysis of the above phenomenon, in the high-concentration experimental group, Ca2+ displaced from limestone reacted with phosphate ions in the solution to form a CaHPO4 precipitate, which was then adsorbed on the surface of limestone in large quantities. When most of the Ca sites were adsorbed by phosphate, the concentration of Ca2+ in the solution decreased sharply, at which time the unadsorbed phosphate found the less metal-active Mg sites to combine to form a small amount of Mg2PO4(OH), which explains the water chemical analysis of the phenomenon of increased Mg2+ concentration and decreased Ca2+ concentration in the high-concentration group. However, at the end of the experiment, the Mg2+ concentration in the low-concentration experimental group was lower than that of deionized water, which could be because there were still many sites not adsorbed after the binding of phosphate with Ca sites on the limestone surface in the low-concentration experimental group, and because the Ca2+ concentration in the solution was in dynamic equilibrium, inhibiting Mg2+ precipitation. Perassi I’s results showed that the factor controlling adsorption is the surface precipitation of Ca-P compounds, which occurs at high phosphate concentrations but cannot be completely ruled out at low concentrations, especially when the pH is between 7.0 and 9.0, which favors the precipitation of Ca-P compounds (i.e., CaHPO4) [21], in agreement with the results of this paper.

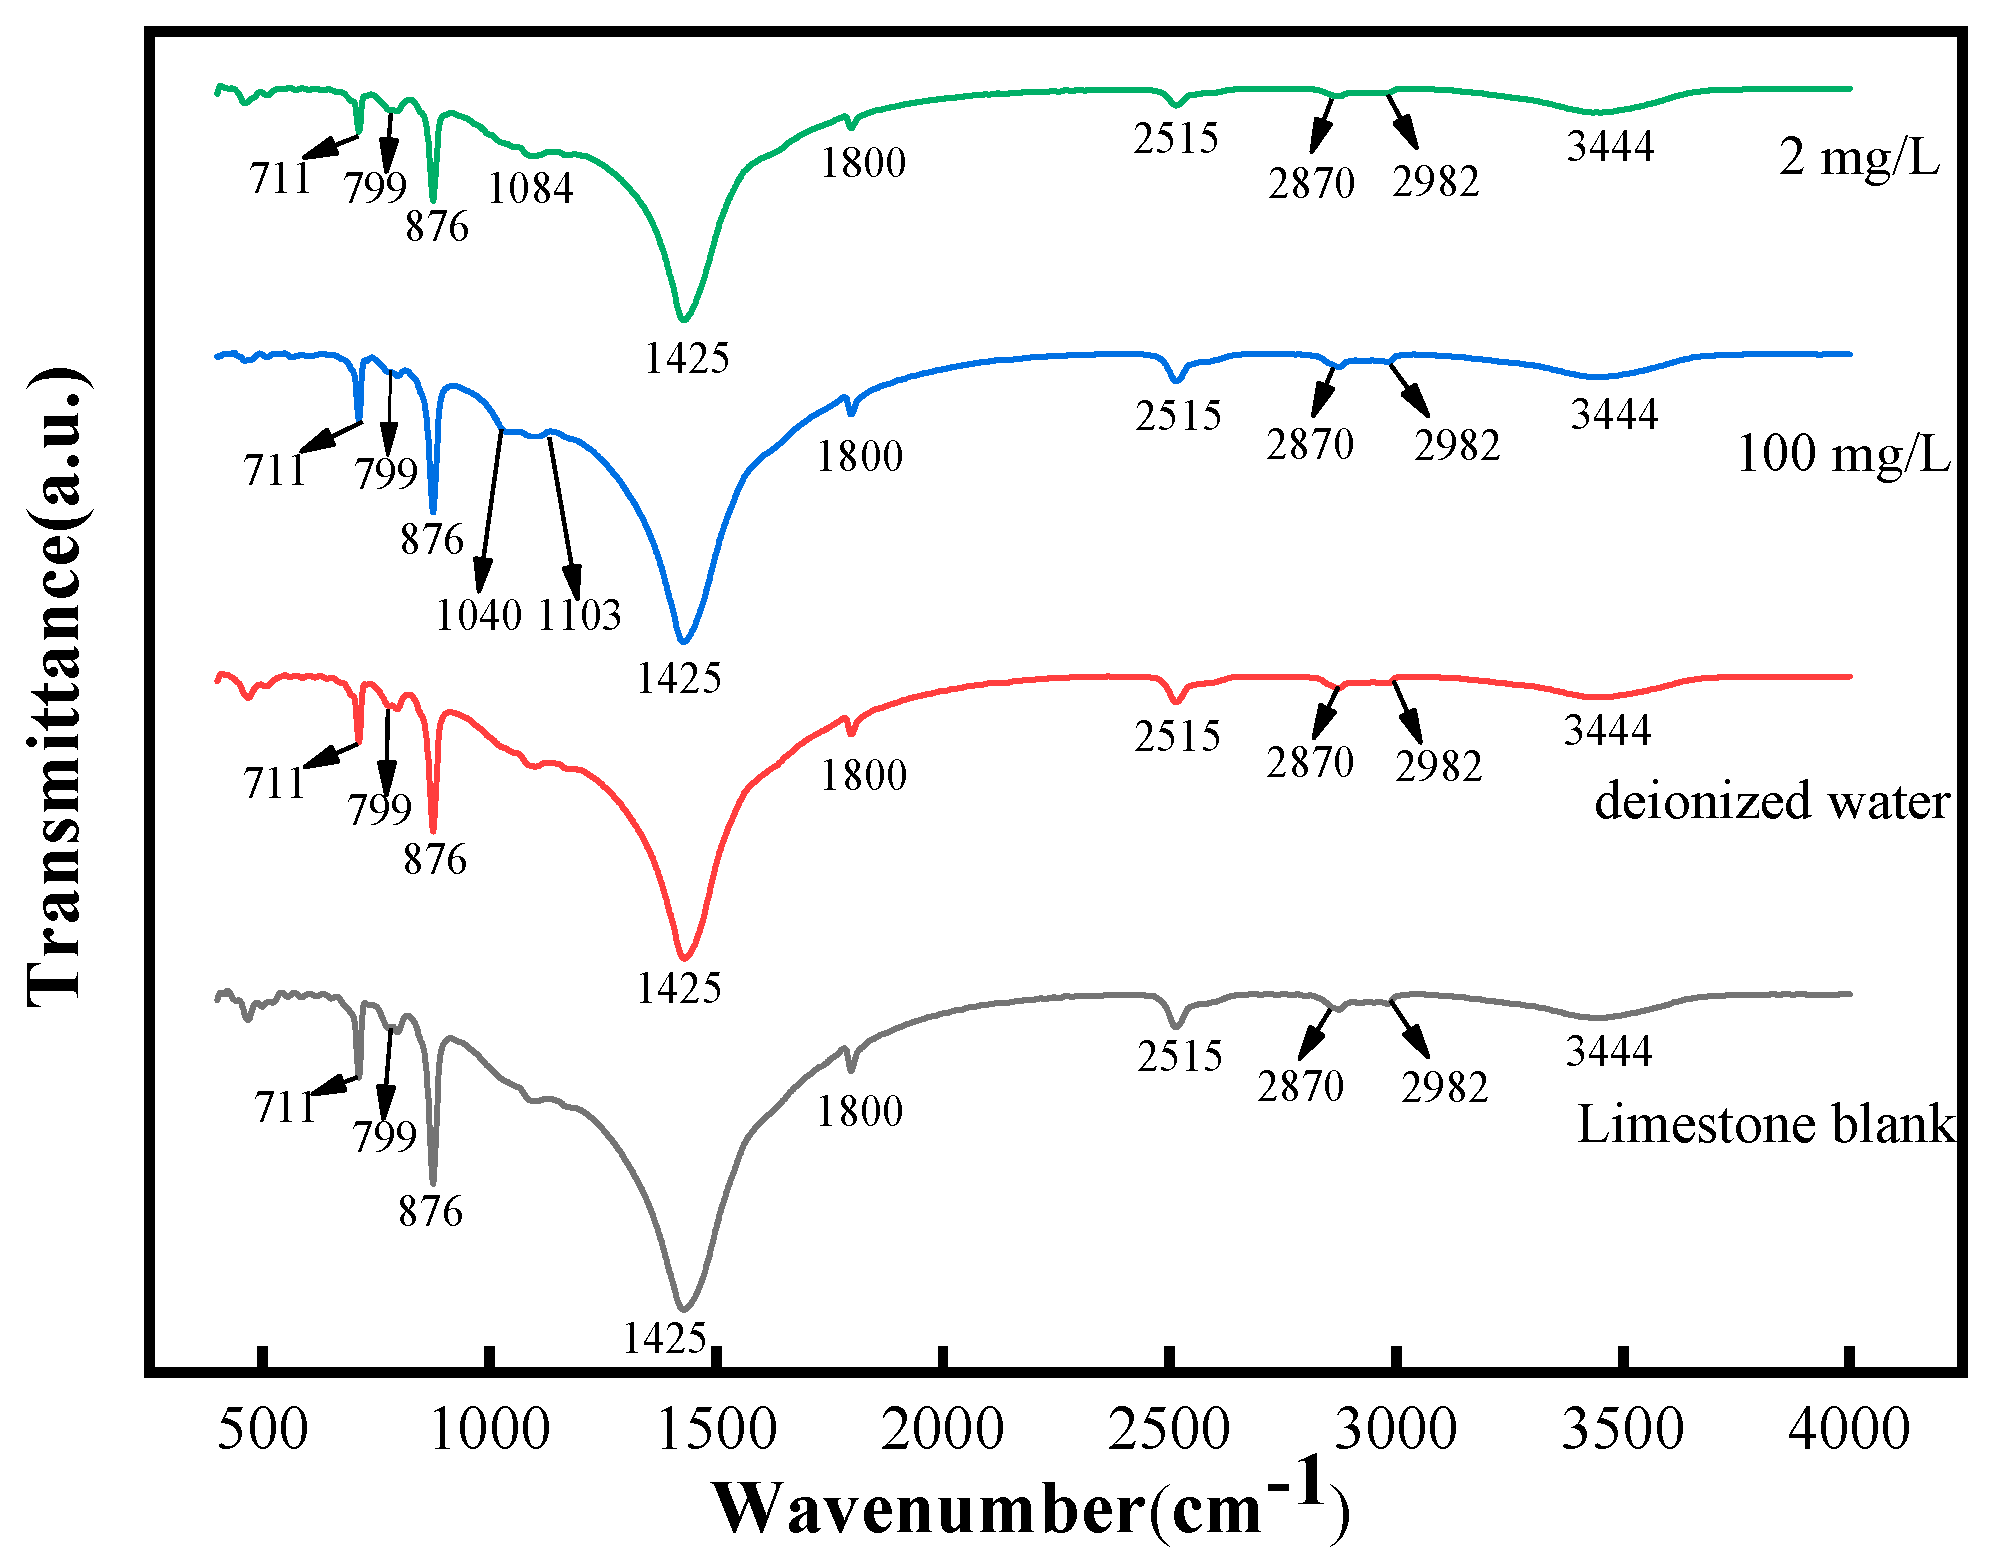
3.2.2. FTIR Analysis

Fourier infrared spectroscopy was employed in this experiment to investigate and confirm the limestone samples and the functional groups formed by their dissolution in various solutions. As shown in Figure 6, it can be observed that there are two sharp peaks at 711 cm−1 and 876 cm−1, and a wider transmission band was found at 1425 cm−1, which corresponds to the υ4 (in-plane bending vibration), υ2 (out-of-plane bending vibration), and υ3 (asymmetric stretching) absorption bands [22,23], confirming the presence of CaCO3, the most dominant minerals in limestone [24], and that the signal of the 1425 cm−1 adsorption vibration band is less the higher the phosphate content. Meanwhile, phosphate vibrations were also detected between 1040 cm−1 and 1103 cm−1 [25,26], with the υ3 (asymmetric stretching) mode being more significant in the experimental group with higher phosphate concentrations, demonstrating the efficiency of phosphate adsorption by limestone [27] and the production of calcium hydroxyphosphate [28]. The existence of a weak vibrational band between 2870 cm−1 and 2982 cm−1 and a bending band close to 3444 cm−1, both associated with stretching of the O-H bond [29], confirmed the XRD findings.

3.2.3. Raman Analysis
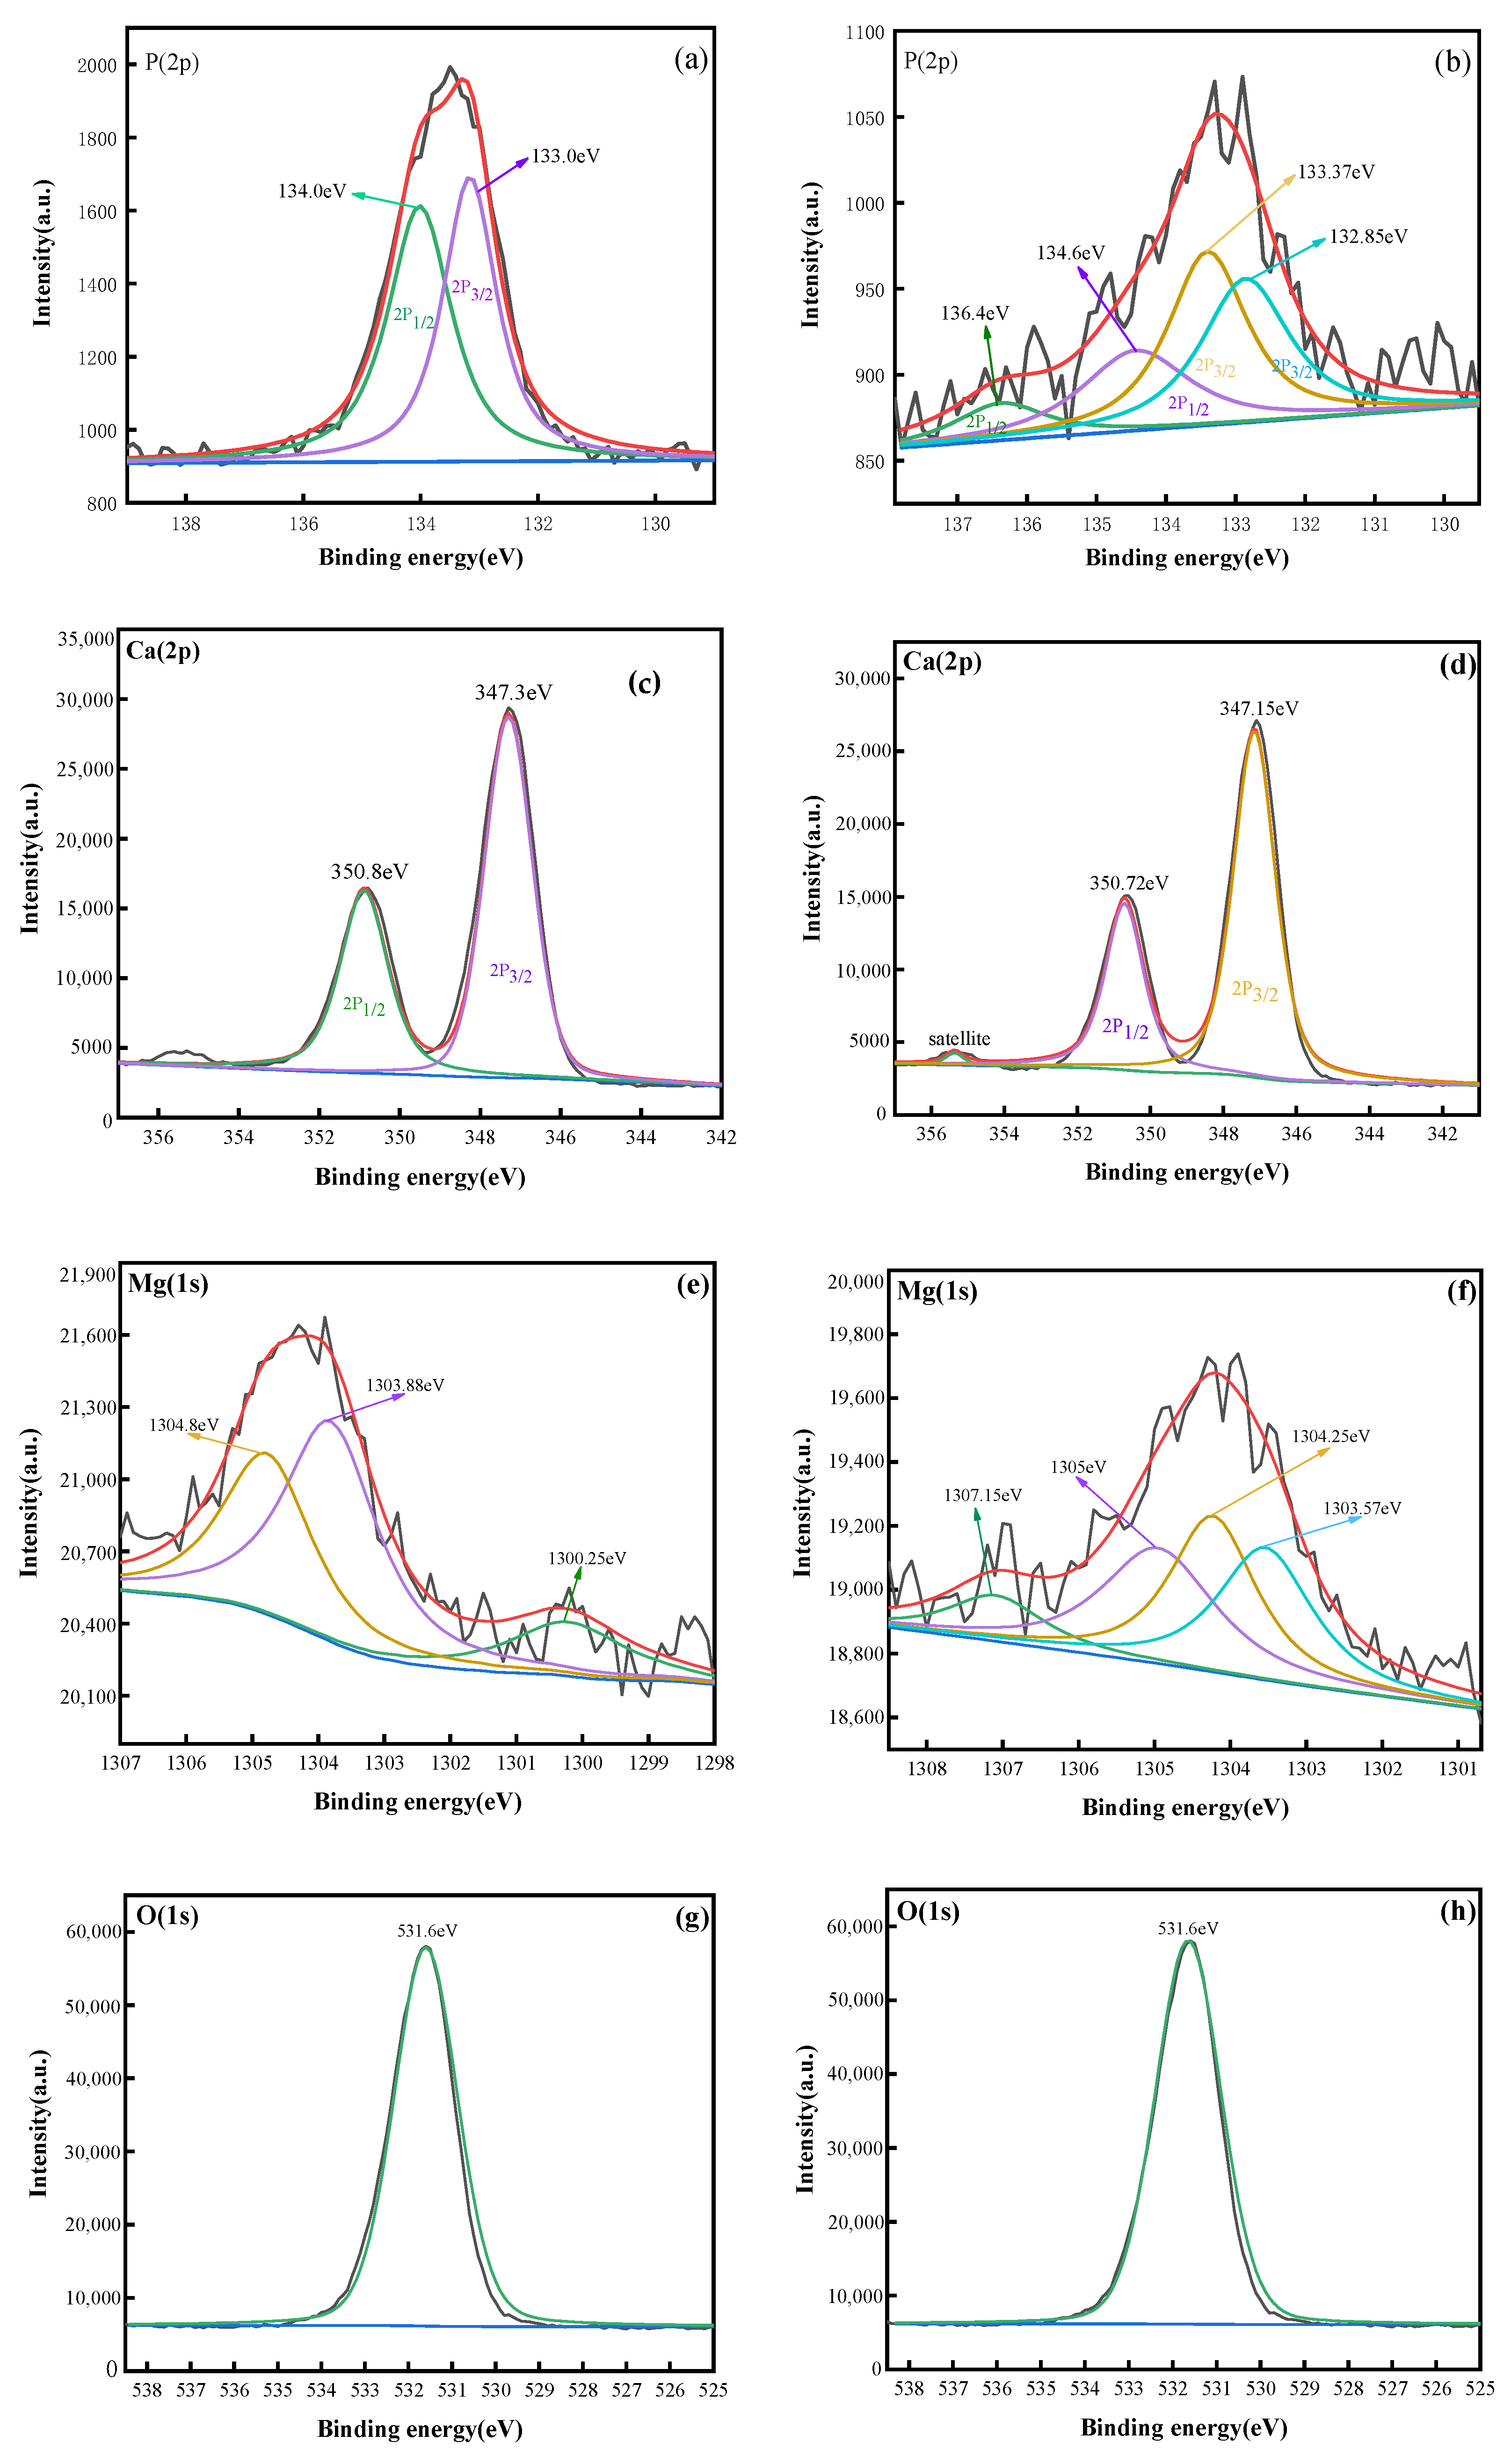
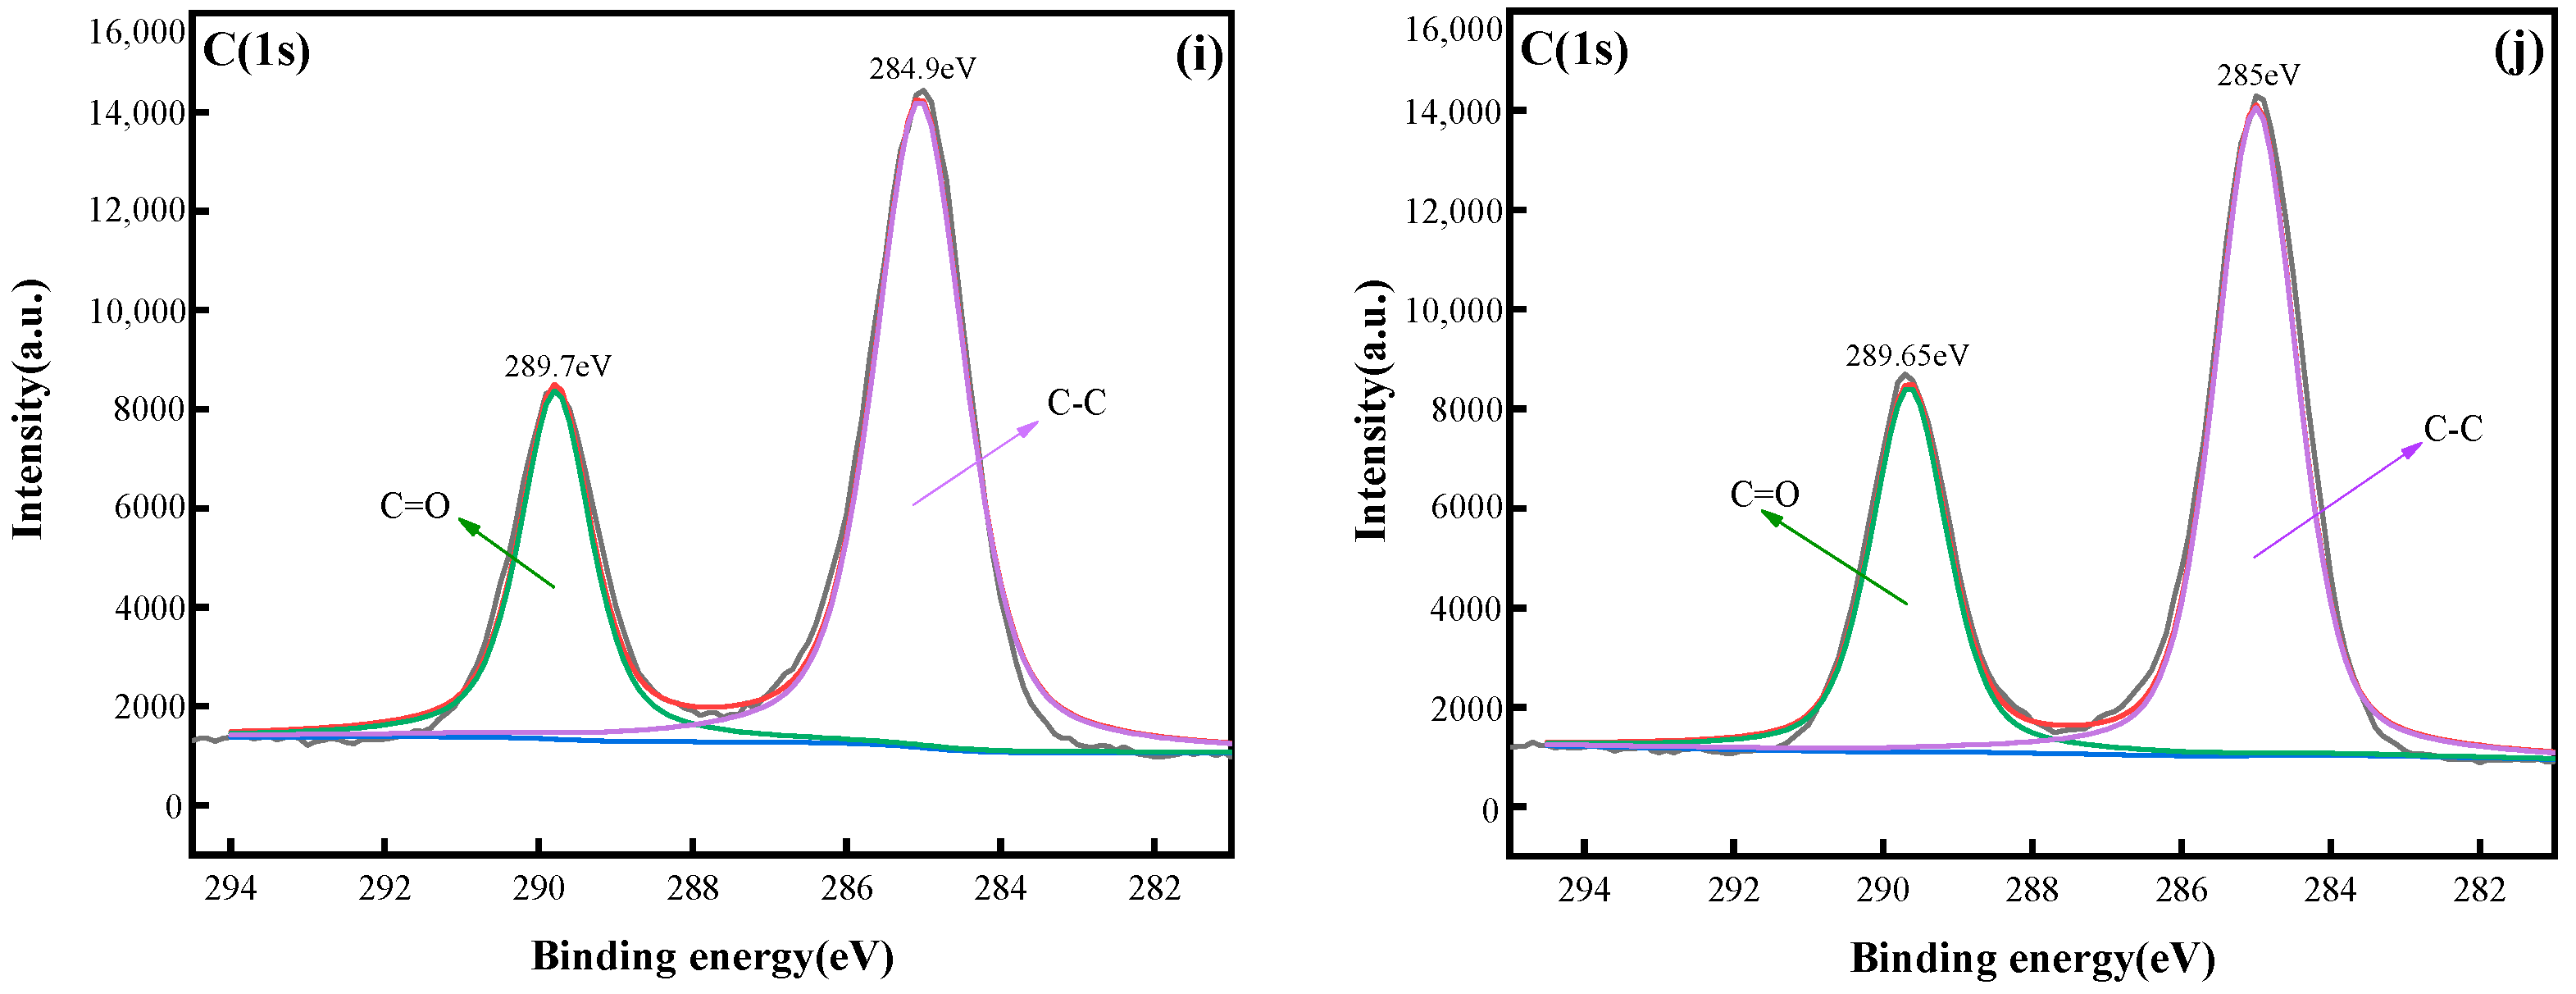
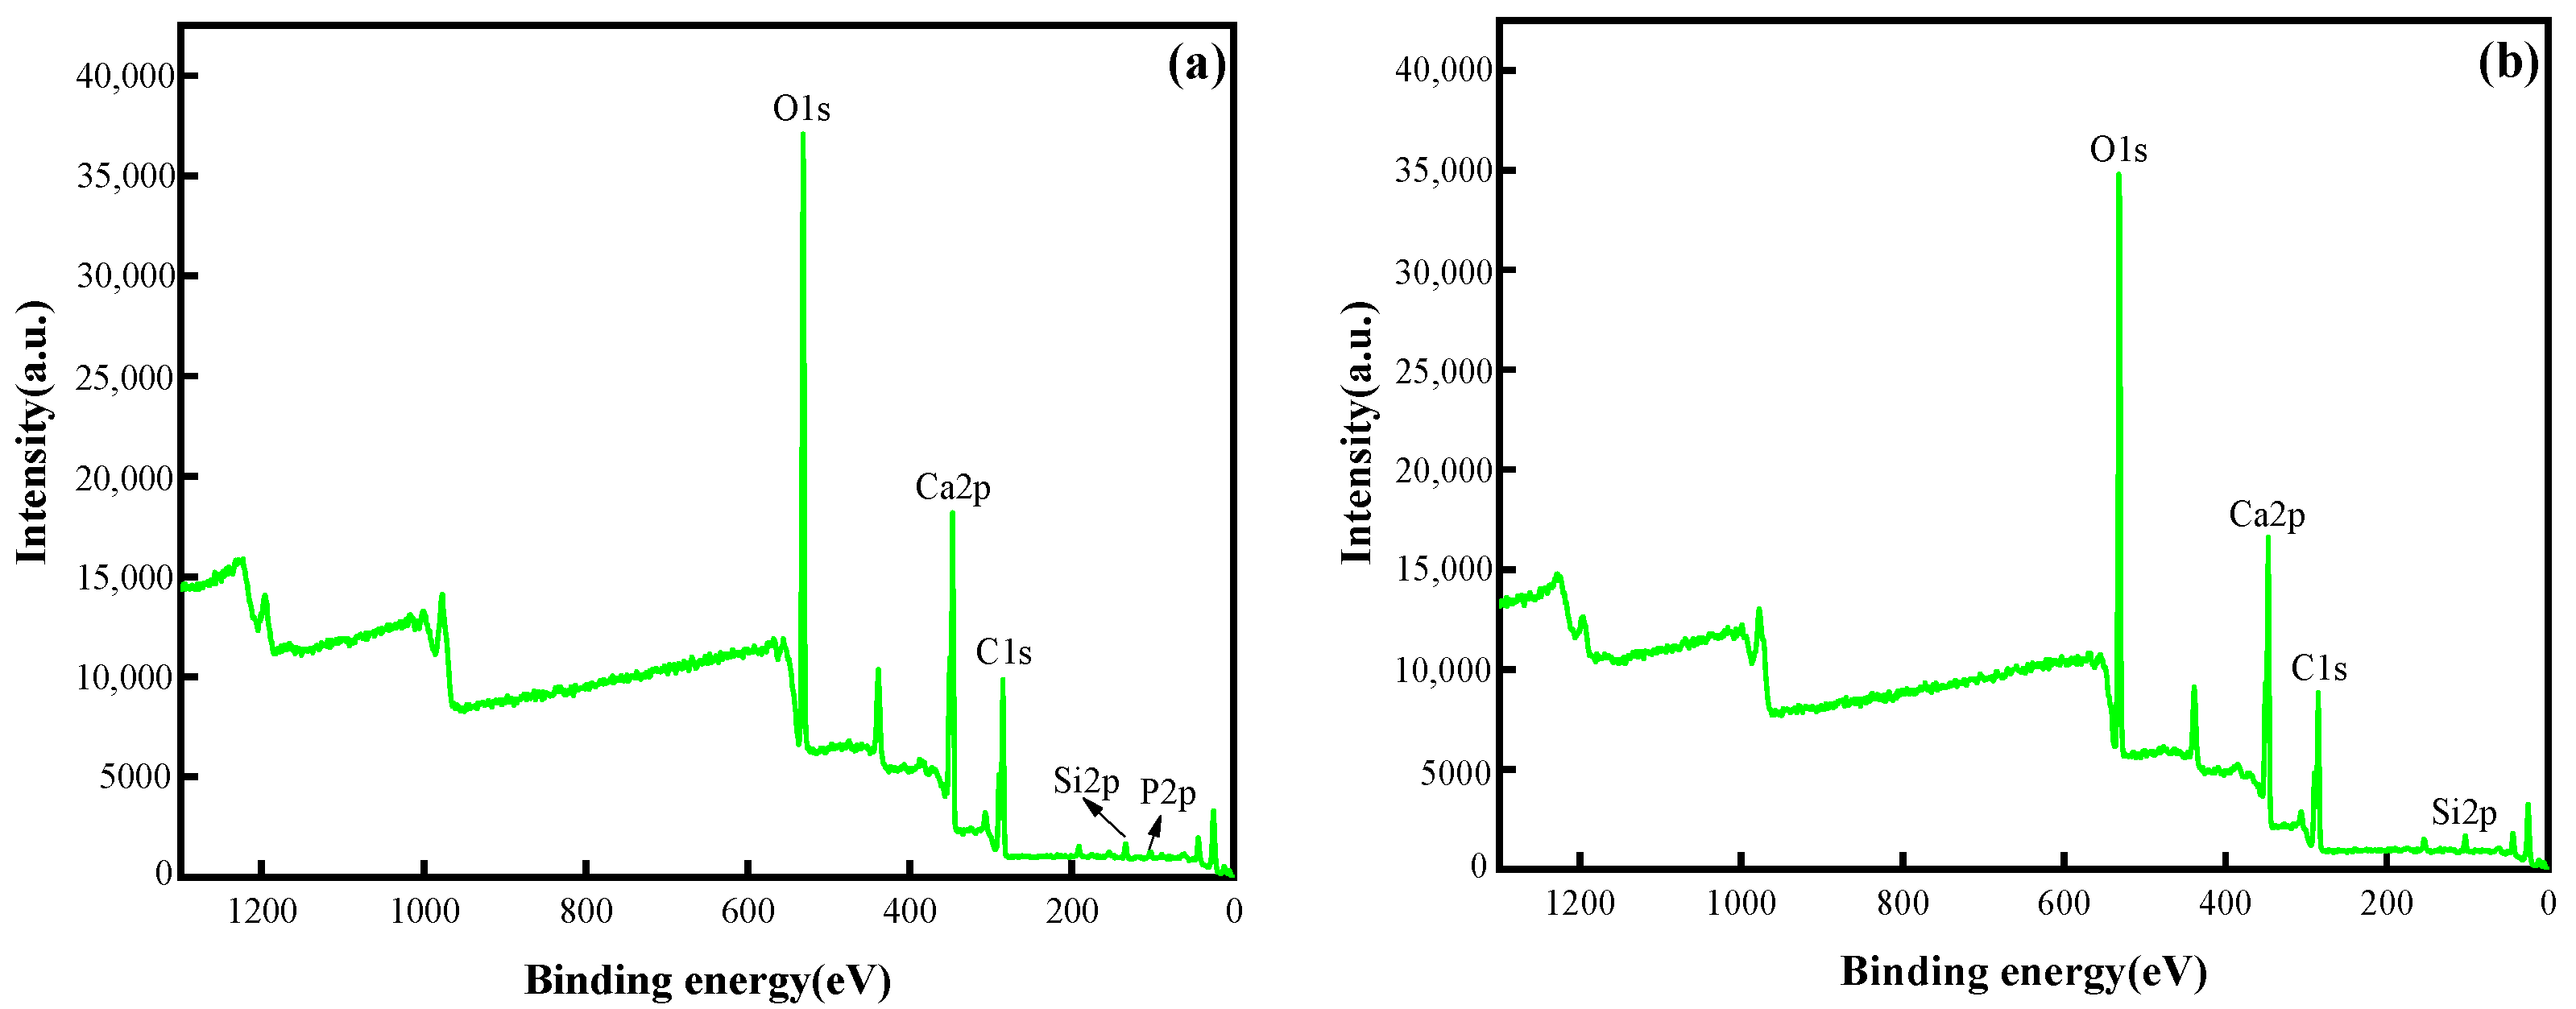
In this experiment, the limestone’s Raman spectra were examined in order to further validate the FTIR results (for more information, see Figure 7), because carbonates have six vibrational modes consisting of two external modes (translational T and rotational L) and four internal modes [30]. According to the findings, the internal modes of the CO32− υ4 symmetric deformation and υ1 stretching vibration are found at 706 cm−1 and 1081 cm−1 for the Raman activity spectrum bands of limestone, respectively [31], and external vibrational modes (translational T and rotational L) involving relative translation and vibration of metals (Ca2+ or Mg2+) are present in the Raman activity spectra between 149 cm−1 and 275 cm−1 [32]. As evidence of the presence of Ca2+ or Mg2+ activity on the limestone, the strength of the two external T and L modes was seen to increase sequentially from the original limestone to the low- to high-concentration experimental group, with the trend being the more concentrated the experimental solution, the greater the Ca2+ and Mg2+ activity [33]. It was discovered that the Raman shifts were gradually biased towards short waves in these bands of 149 cm−1, 275 cm−1, 708 cm−1, and 1083 cm−1, observed from high concentration to low concentration and then to the initial limestone. A small peak appeared at 405 cm−1, which may be a feature of the Ca-P phase [34,35].

3.2.4. XPS Analysis

In this experiment, after 12 days of dissolution in 100 mg/L and 2 mg/L KH2PO4 solutions, the surface chemical states and elemental compositions of limestone were examined using X-ray photoelectron spectroscopy (XPS). The XPS spectra of high-resolution P2p are given in Figure 8a,b. Since they follow linear fitting, the result further confirms phosphate retention on limestone. The data demonstrate that two distinctive peaks are found in the 100 mg/L KH2PO4 solution (Figure 8a) at 133.0 eV and 134.0 eV, which correspond to P2p3/2 and P2p1/2 of P, respectively [36], indicating that HPO42− (134.0 eV) and PO43− (133.0 eV) are the major ionic forms of phosphate in this experimental group [37]. Meanwhile, three prominent distinctive peaks at 134.6 eV, 133.37 eV, and 132.85 eV were observed in the 2 mg/L KH2PO4 solution (Figure 8b), showing that in this experimental group, phosphate predominately resided in the ionic forms of H2PO4 (134.6 eV) and PO43− (132.85 eV and 133.37 eV) [38], and the binding energies of the same phosphate ions were shifted in different experimental groups, suggesting that these phosphate ions are primarily correlated with Ca2+, leading to Ca-P precipitation, while not excluding the possibility of leading to Mg-P precipitation. At the same time, active calcium substances such as calcium and magnesium compounds can rapidly release Ca2+ into the solution and react with phosphates to produce various Ca-P precipitates [39]. Additionally, according to Sø H U’s model, the three main substances adsorbed by phosphate on calcite in the pH range of 7–9.1 are CaHPO4, HPO42−, and CaPO4 [19]. This fully corroborates the water chemistry process and the results in XRD.
The high-resolution XPS spectra of Ca2p in limestone samples in 100 mg/L and 2 mg/L phosphate solutions are shown in Figure 8c,d, where the 100 mg/L experimental group showed two peaks at 347.3 eV and 350.8 eV, respectively. In addition, two peaks at 347.15 eV and 350.72 eV, corresponding to the 2p3/2 and 2p1/2 spin orbitals, were seen in the 2 mg/L experimental group [40]. From low to high concentrations, there was also a slight increase in the Ca2p binding energy. When the orbital peak intensities were compared, it was discovered that the two orbital peaks in the 100 mg/L experimental group were more intense than those in the 2 mg/L experimental group. This indicates that in the 100 mg/L experimental group, CaCO3 in limestone had a more violent ionic substitution reaction with phosphate, leading to more Ca-P precipitation, fully verifying the analytical results of XRD, FTIR, and Raman spectroscopy.
The O1s orbitals showed symmetric peaks in Figure 8g,h, and it was noted that the characteristic peaks were situated at 531.6 eV in both the 100 mg/L and 2 mg/L experimental groups. The peaks between 531 eV and 533.5 eV were identified as the P-O bond binding in the phosphate group in a previous study [41].
The high-resolution Mg1s XPS maps were deconvolved, as shown in Figure 8e,f, and it was discovered that three distinctive peaks appeared in the 100 mg/L experimental group, of which 1304.8 eV was attributed to Mg(OH)2 and 1303.88 eV to MgO [42]. It was speculated from the findings of the XRD analysis that 1300.25 eV might be related to the Mg-P compounds; four distinctive peaks observed in the 2 mg/L experimental group, of which 1037.15 eV was assigned to Mg2PO4(OH) [43], 1035 eV to MgCO3 [44], 1304.25 eV to Mg(OH)2, and 1303.57 eV to MgO [42]. These findings indicate that Mg-P compounds moved to the region of higher binding energy at lower Mg concentrations, whereas other Mg-containing compounds’ binding energies increased as the Mg concentration increased, suggesting that Mg2+ interacted with phosphates and other carriers [45].
Figure 8i,j show the high-resolution C1s XPS spectra of limestone from various experimental groups. The characteristic peaks of the 100 mg/L experimental group were located at 289.7 eV and 284.9 eV, and those of the 2 mg/L experimental group were located at 289.65 eV and 285 eV, which were attributed to the carbonate (CO32−) [46] and C-C single bond [47], respectively. The binding energies of C1s did not differ considerably between the two experimental groups, but with the ligand exchange mechanism between carbonate and phosphate ions [48], the peak of carbonate (CO32−) was weakened due to the increased phosphate content on the adsorbent surface, whereas the C-C peak did not change appreciably.
The analysis of the limestone samples in various concentrations of phosphate solutions was completed using X-ray photoelectron spectroscopy (XPS). Figure 9a displays the full-scan spectrum of the limestone sample in a 100 mg/L phosphate solution, demonstrating the appearance of the P2p peak, which indicates that phosphate was successfully adsorbed on the limestone and the slightly shifted Ca2p peak. The phenomenon can be interpreted as follows: Ca2+ in solution reacted with phosphate ions to produce a chemical precipitate (CaHPO4), which adsorbed to the limestone surface, and further verified the occurrence of Ca-P solid-phase precipitation in the reaction system; however, no P2p peak was found in the full-scan spectra of the 2 mg/L phosphate solution in Figure 9b, which may be due to the low concentration of phosphate in the solution, which did not reach the minimum detection standard of the instrument.

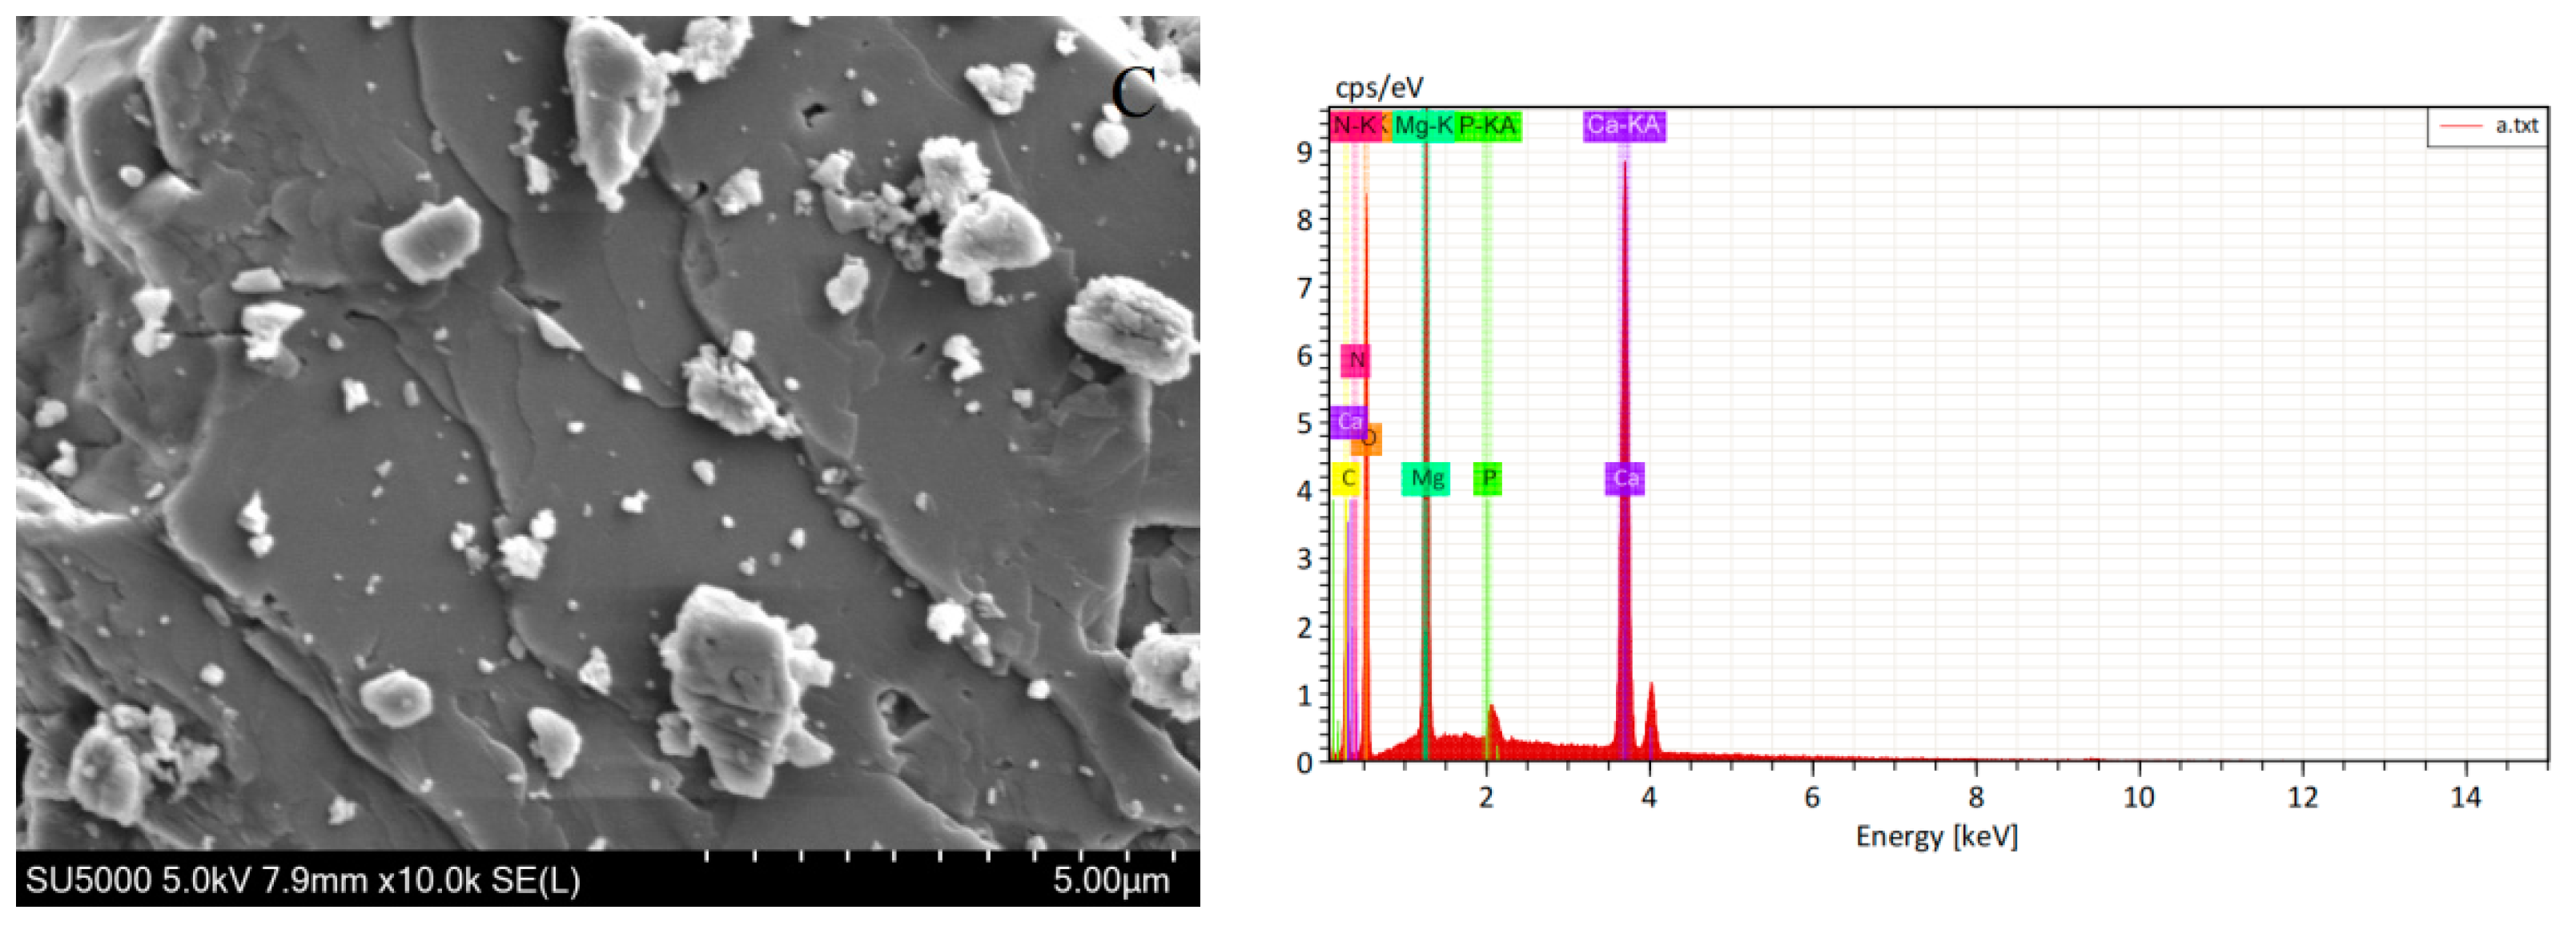
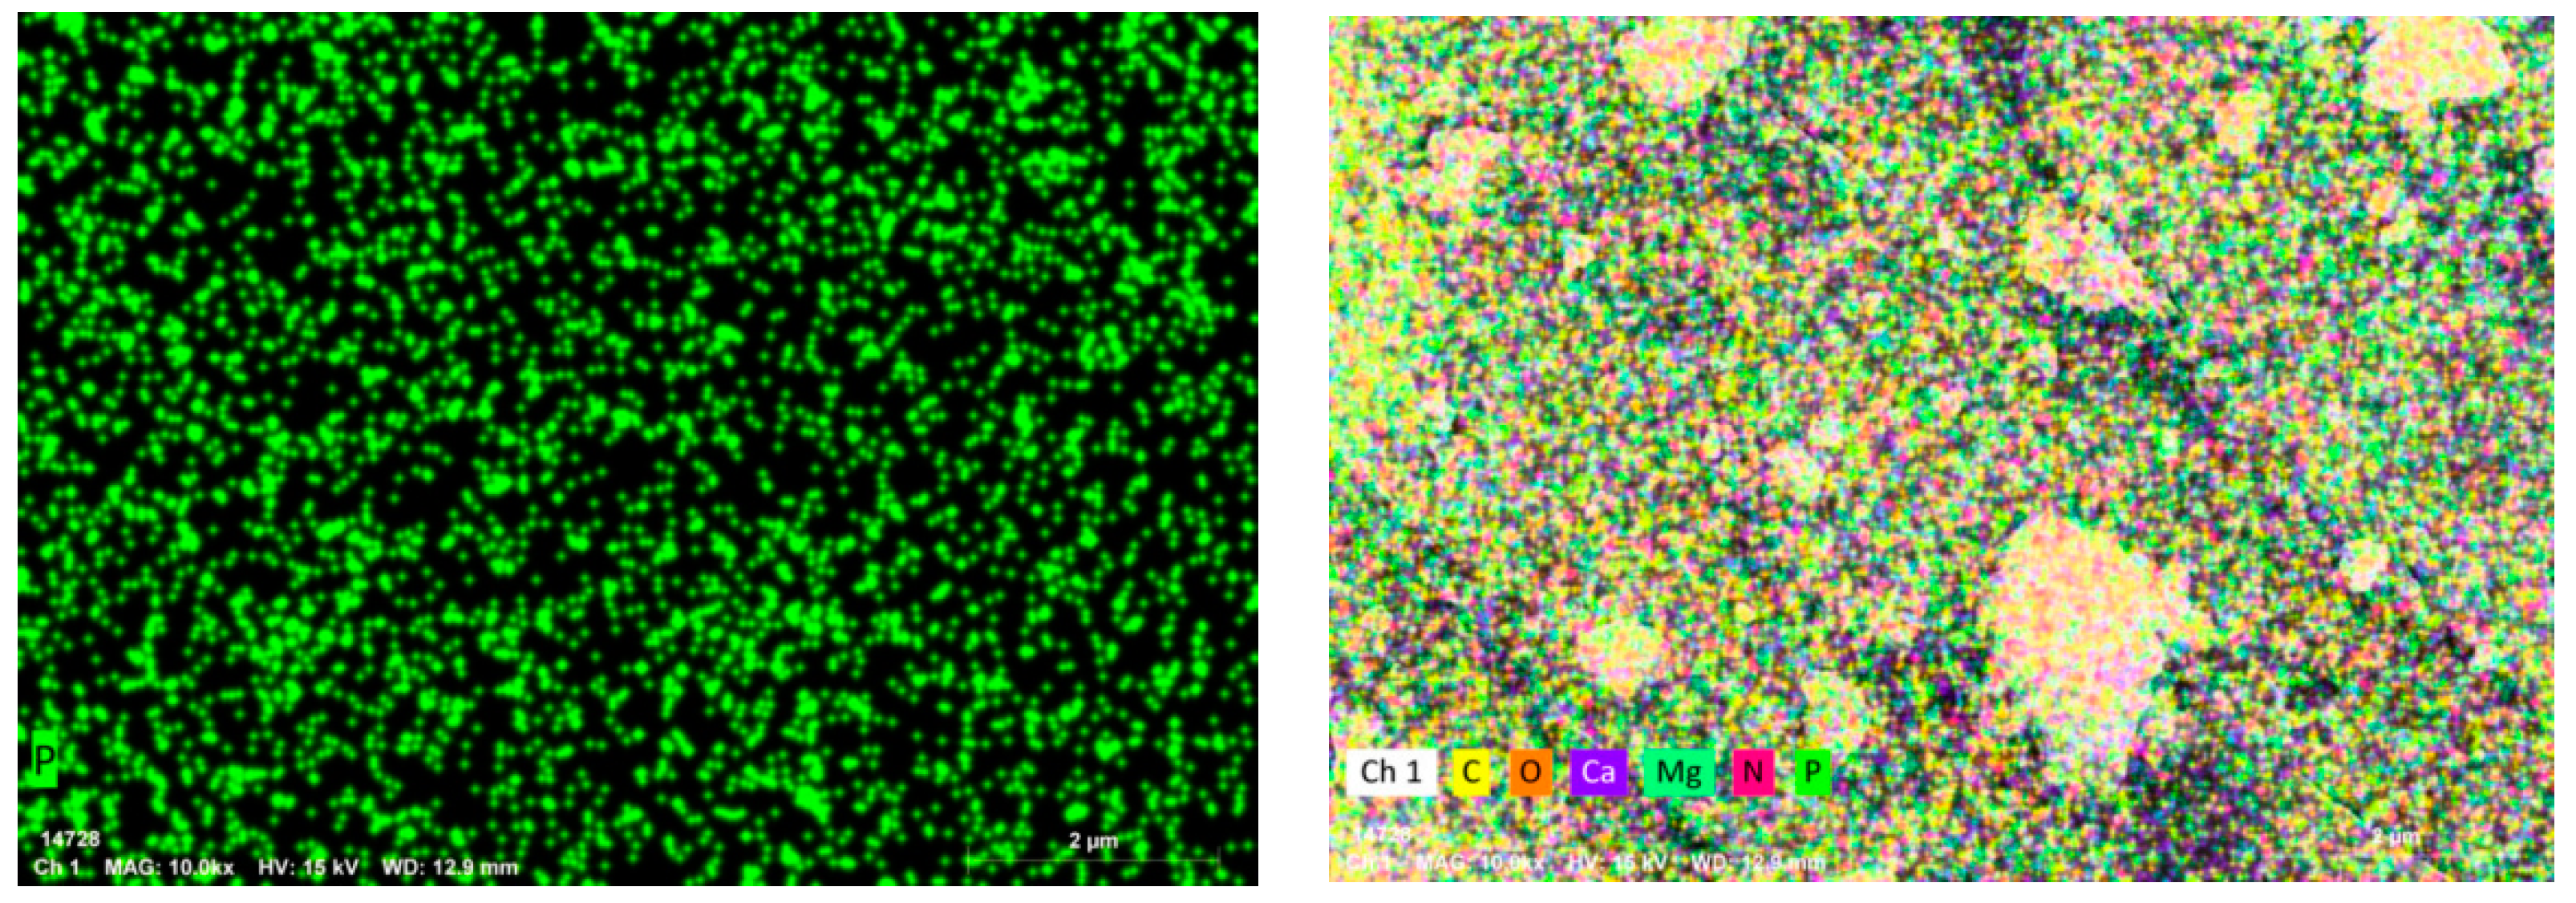
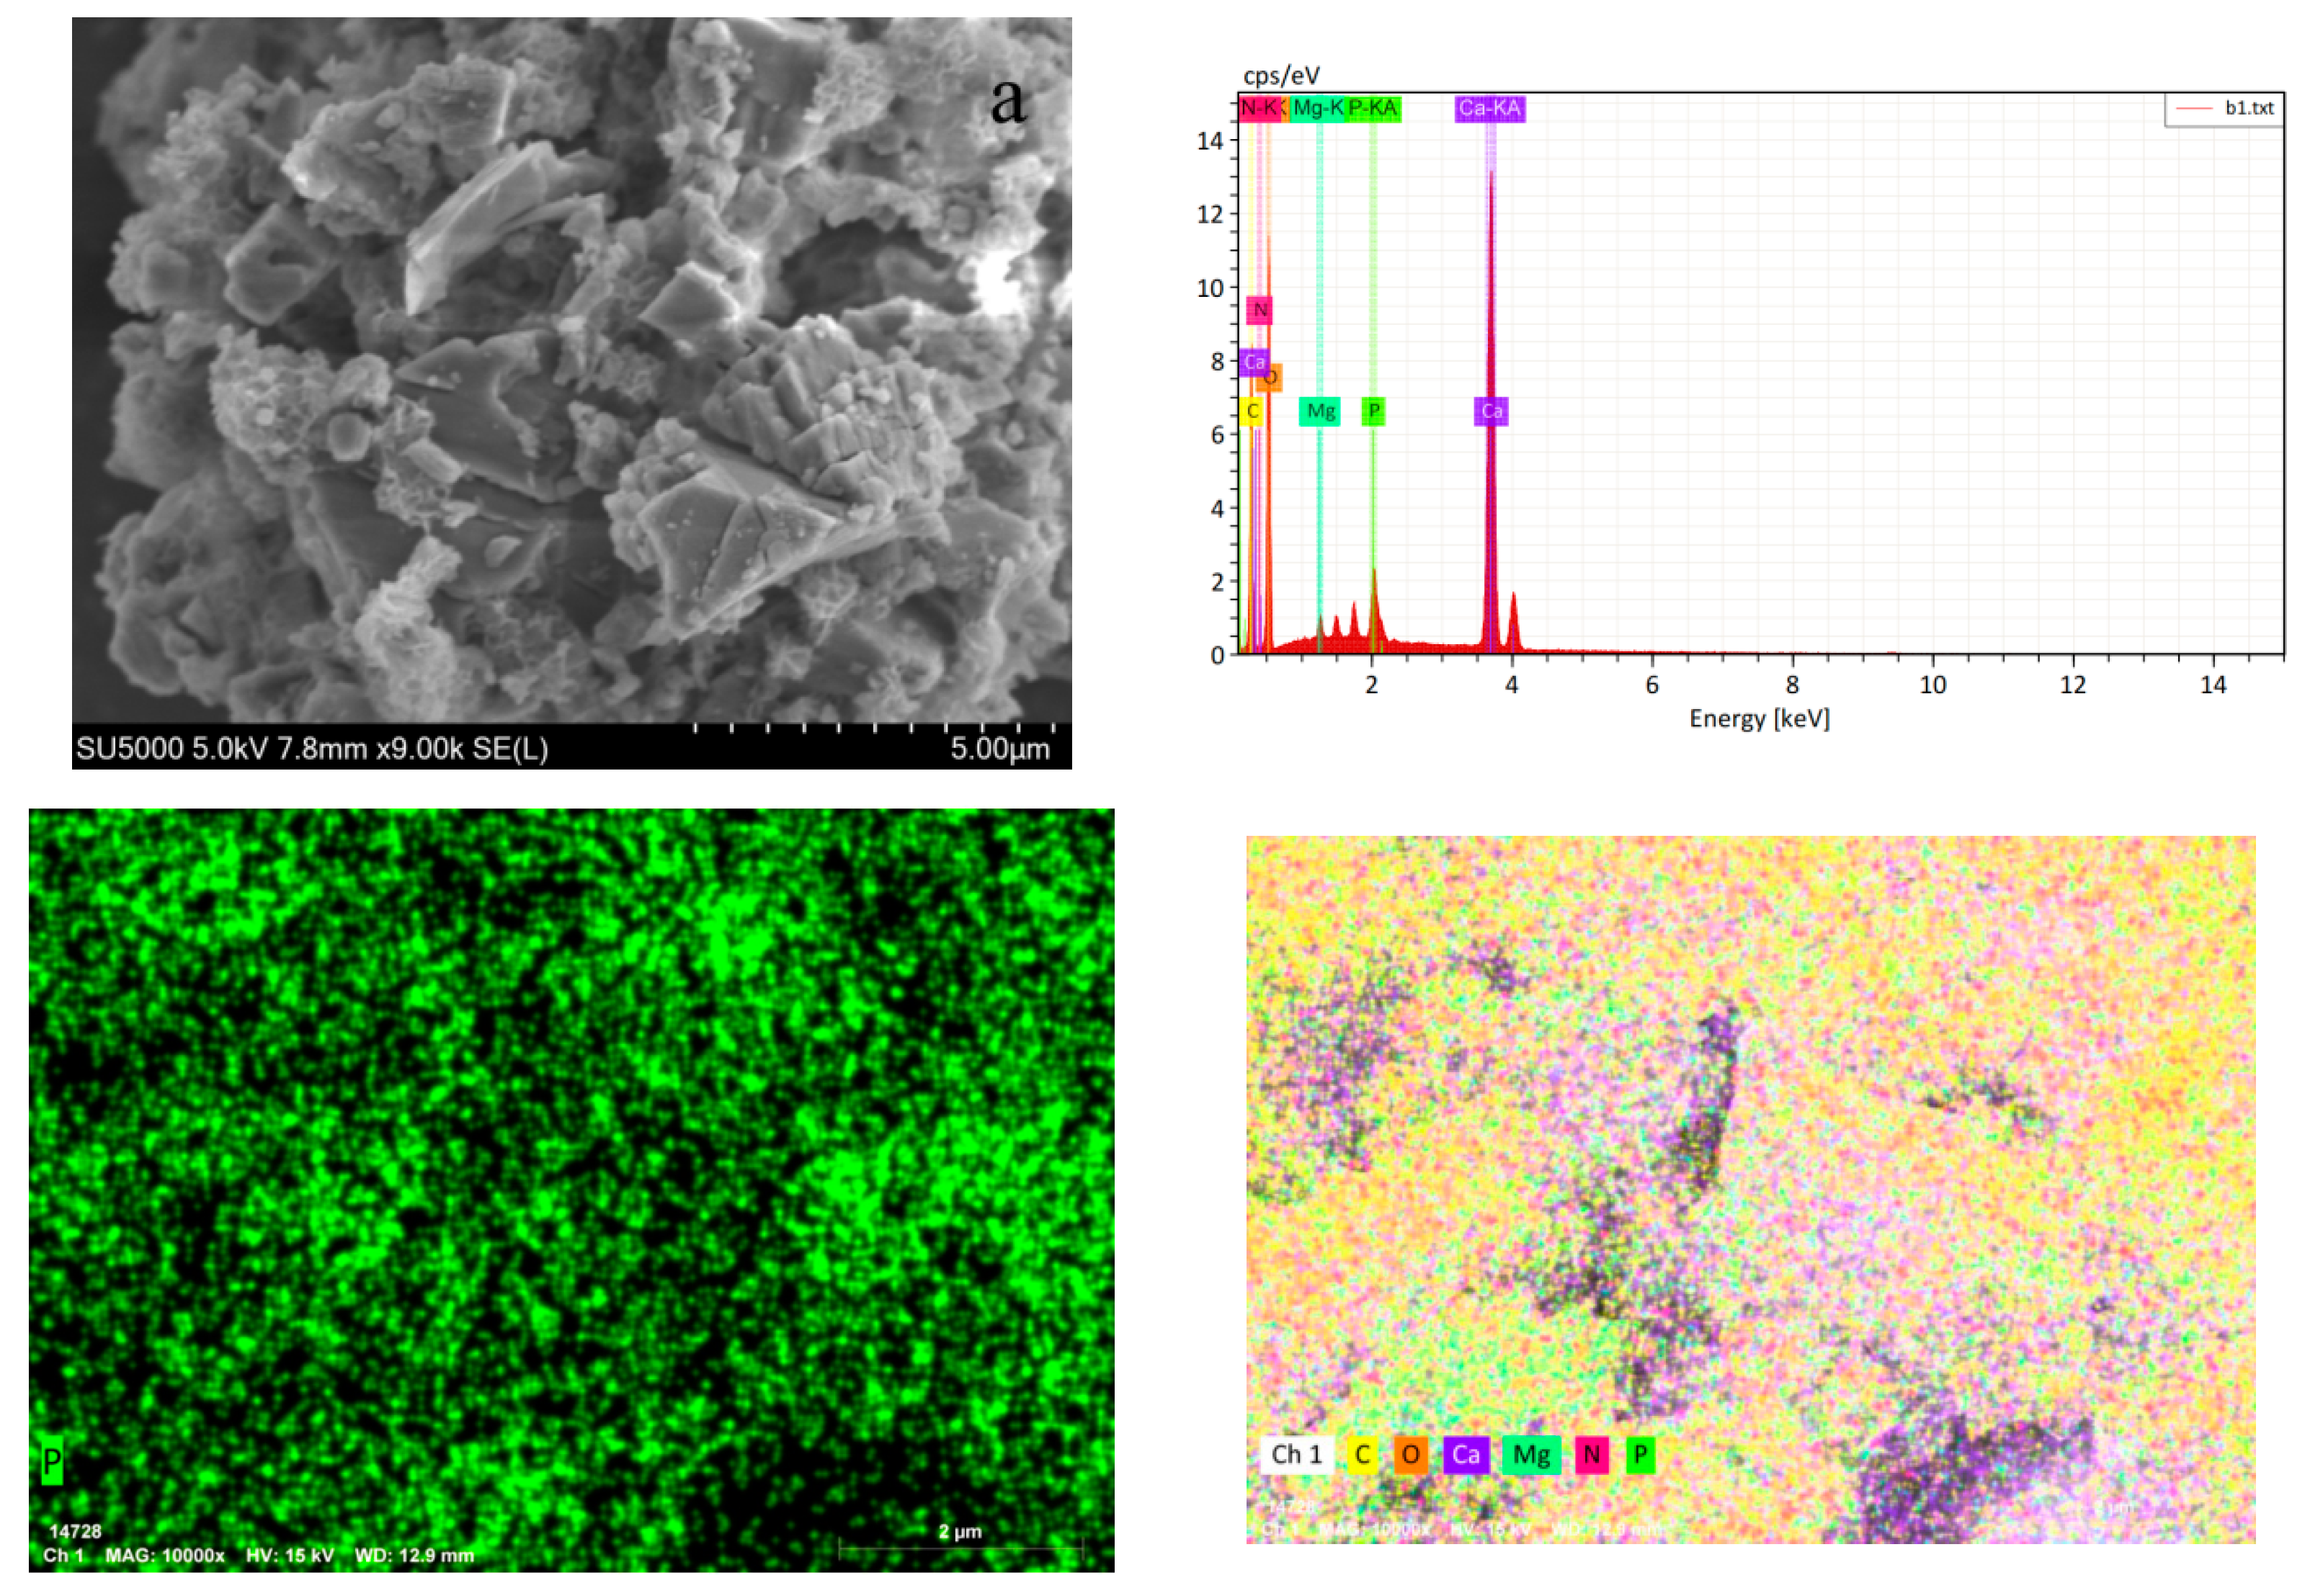
3.2.5. SEM/EDS Analysis

To further clarify the retention mechanism of phosphate on limestone, this experiment used scanning electron microscopy (SEM) to characterize and determine the microscopic patterns of the three sets of experiments, and the elemental distributions were identified using energy spectrometry (EDS) (Figure 10: deionized water; Figure 11: 2 mg/L phosphate solution; Figure 12: 100 mg/L phosphate solution).
Figure 10 depicts the limestone’s SEM picture after it had been subjected to deionized water for 12 days. The white particles that had formed on the steps were thought to be Ca(OH)2 based on the semi-quantitative XRD study conducted in this experiment and verified by EDS spectroscopy(As shown in Table 1): before phosphate adsorption, the limestone surface primarily included O, C, Ca, and Mg elements with a very low amount of P elements; Figure 11’s SEM picture of the limestone after it had been subjected to a 2 mg/L phosphate solution for 12 days shows that the surface of the limestone had developed clear fissures and dissolution steps, and EDS spectroscopy revealed that the surface of limestone was composed of O, C, Ca, Mg, and P after adsorption(As shown in Table 2). The Ca content was significantly higher than that of the experimental group of deionized water, but the Mg content was significantly lower, which is consistent with the water–chemical process in this experiment. As can be seen in Figure 12, SEM pictures of limestone following exposure to a 100 mg/L phosphate solution for 12 days reveal considerable morphological changes, including a rough surface and numerous irregular etch pits, pores, and clusters, and EDS spectra allow for the observation of the primary components of O, C, Ca, Mg, and P(As shown in Table 3). The combined SEM-EDS shows that cluster aggregation leads to nucleation and growth of Ca-P phases on limestone surfaces [49,50], and the hydrochemical process, XRD analysis, confirmed this finding. In the two phosphate solution experimental groups, it was discovered by comparing the EDS energy spectra that the O content on the limestone’s surface increased, possibly due to the adsorption of P-O or O-P-O [51]. While the high-concentration group’s Mg content on the surface of the limestone was significantly higher than that of the low-concentration group, the high-concentration group’s Ca content was lower than that of the low-concentration group. Previous studies have shown that Mg has a higher hydration energy than Ca, which may prevent the growth of crystals [52]. Therefore, using SEM-EDS analysis, after physical adsorption as well as the water–rock reaction [53], the surface precipitation of the metal-P phase was formed, which was uniformly adsorbed on the surface of limestone and played a certain role in promoting the dissolution of limestone, but it was extremely unfavorable to carbonate rock carbon sequestration and sink enhancement.

3.3. Discussion of Adsorption Model and Adsorption Mechanism

The common crystal structure of calcium carbonate is the cubic densest stacking of CO32− ions, with Ca2+ ions filling the octahedral voids between the CO32− ions; magnesium carbonate consists of four oxygen atoms and one magnesium atom arranged in a positive octahedral arrangement, and thus calcium carbonate is of the same octahedral ligand structure as magnesium carbonate. The experimentally produced CaHPO4 and Mg2PO4(OH) possess different crystal properties from those of magnesium carbonate and calcium carbonate. Therefore, XRD, infrared spectroscopy, and Raman spectroscopy were used in the experiments. Although the principles of the three detection methods are different, all of them are able to reflect the elemental composition and crystal structure of the solid phase through the molecular structure and vibration modes of the molecular groups inside the solid phase. XRD analysis shows that the main mechanism of adsorption is surface precipitation, which occurs when the concentration of each component in the precipitate exceeds the solubility product of the precipitate. This reaction usually occurs rapidly and is irreversible [54]. The infrared spectra of limestone involved in the reaction in 100 mg/L, 2 mg/L, and deionized water were found to be basically the same as the peaks of the initial sample of limestone in Figure 6, and no new peaks appeared, which indicated that the solid-phase interior was still dominated by limestone, and the crystal structure was still an octahedral ligand. Figure 7 demonstrates the Raman spectra of the limestone of each experimental group, and all three of them show spectral peaks at 149 cm1, 275 cm1, which is due to the alternating distribution of Ca2+ and Mg2+ in the limestone, and the appearance of two external vibrational modes (translational T and rotational L) [32], and at the same time the three of them are also basically the same in the position of the other peaks, which once again suggests that the solidus interior is dominated by the limestone, and the crystal structure is an octahedral allotrope. Then, according to the analytical results of XPS characterization tests, another mechanism of adsorption of phosphate by limestone is mainly the intrasphere complexation through the ligand exchange process [55], in which the hydroxyl group in limestone introduces covalent chemical bonding between the phosphate ions and the calcium and magnesium cations on its surface, releasing other anions previously bound to the calcium and magnesium ions, e.g., CO32− [56]. Thus, phosphate ions can form inner-sphere complexes on limestone surfaces that are less affected by changes in ionic strength due to direct coordination with surface groups [21]. The inner-sphere coordination is composed of several phosphate molecules connected to a metal atom with three oxygen bonds, which is one of the most important factors determining the behavior during adsorption. Therefore, based on the ligand exchange mechanism and the calculation methods available [57], in order to be able to observe the micro-mechanism of phosphate adsorption on limestone more intuitively, the formation of CaHPO4 and Mg2PO4(OH) via phosphate adsorption on the Ca or Mg position of carbonate rock was simulated using VESTA crystal modeling software (https://jp-minerals.org/vesta/en/, accessed on 28 August 2023), as shown in Figure 13. In addition, according to the analysis of water chemistry conclusions, another important factor of the adsorption mechanism is ion exchange; when an anion in the solution is absorbed by limestone, its original anion will be released into the solution in equal amounts to maintain the electrically neutral state of the whole aqueous solution [58].

4. Conclusions

The interaction between phosphate solution and limestone powder at concentrations of 2 mg/L and 100 mg/L was examined in this experiment using different characterization and detection techniques, including XRD, FTIR, Raman, XPS, and SEM-EDS. In combination with the investigation of hydrochemical processes in the adsorption experiments, it was discovered that CaHPO4 precipitation occurred in 100 mg/L phosphate solution, while the concentration of each ion in the 2 mg/L phosphate solution was relatively stable, and it had dynamic equilibrium; therefore, the high concentration of phosphate promotes an increase in the limestone’s dissolution rate, suggesting that another important factor in the adsorption mechanism is ion exchange. By combining XRD and XPS analyses, the main mechanism of phosphate adsorption may be chemical precipitation, which is preferentially adsorbed to Ca sites on carbonatite, with surface deposits consisting mainly of CaHPO4 and a small amount of Mg2PO4(OH), as well as a few other Ca-P/Mg-P compounds. Infrared wavelengths between 1040 cm1 and 1103 cm1 were found to have phosphate vibrations, and the relative translations and vibrations of the metal (Ca2+ or Mg2+) were implicated in the external vibrational modes (translational T and rotational L) at 149 cm1 and 275 cm1 in the Raman band. Raman and FTIR data in combination show that the limestone efficiently adsorbs phosphate, resulting in Ca-P precipitation (calcium hydroxyphosphate). SEM-EDS results show that after the combined effect of physical adsorption as well as aqueous rock reaction, a surface precipitate of metal–phosphorus phase was formed, which was uniformly adsorbed on the limestone surface and contributed to limestone dissolution. On the basis of the above multiple characterizations, the adsorption mechanism was further explored and adsorption models were fabricated, in which XRD analysis showed that the main mechanism of adsorption was surface precipitation; FTIR and Raman spectra indicated that limestone was still dominant within the solid phase after adsorption, and that the crystal structure was an octahedral ligand; and XPS revealed that another adsorption mechanism for phosphate by limestone was mainly the ligand-exchange mechanism, which led to intrasphere complexation. In conclusion, the adsorption mechanism of phosphate on limestone is mainly ion exchange, surface precipitation and ligand exchange, and high concentration of phosphate not only has more obvious adsorption mechanism on limestone, but also has a greater promotion effect on its dissolution. Despite numerous studies demonstrating that limestone can be used as an adsorbent to remove phosphate and other pollutants, carbonate rock remains the most significant global carbon reservoir. However, with fertilizer and other anthropogenic activities producing phosphate, carbonate rock faces a threat, and as a result, carbon sequestration sinks have a very detrimental effect.

Author Contributions

Conceptualization, L.L. and W.W.; methodology, W.W.; validation, L.L., W.W. and Z.J.; formal analysis, W.W.; investigation, W.W.; resources, L.L.; data curation, W.W.; writing—original draft preparation, W.W.; writing—review and editing, L.L.; visualization, A.L.; supervision, L.L.; project administration, L.L.; funding acquisition, L.L. All authors have read and agreed to the published version of the manuscript.

Funding

This research was funded by the Scientific Research Project of Guilin University of Technology (GLUTQD2013010) (doctoral research start-up fund) and the Guangxi Basic Ability Enhancement Project for Young and Middle-aged Teachers (2020KY06034).

Data Availability Statement

Not applicable.

Acknowledgments

The authors would like to thank the Guilin University of Technology Scientific Research Project (GLUTQD2013010) (Doctoral Research Initiation Fund) and the Guangxi Basic Ability Enhancement Project for Young and Middle-aged Teachers (2020KY06034) for financial support of this study.

Conflicts of Interest

The authors declare no conflict of interest.

References

  1. Zheng, S.Z. World Climate Conference. World Agric. 1981, 12, 44–45. [Google Scholar]
  2. Yuan, D. The carbon cycle in karst. Z. Geomorpholo-Gie Neue Folge China 1997, 108, 91–102. [Google Scholar]
  3. Li, W.L.; Bai, B.; Cao, J.H. The “invisible” carbon sink effect. Pop. Land Resour. Sci. Cult. 2018, 2, 18–23. [Google Scholar]
  4. Huang, F.; Tang, W.; Wang, J.L. Impact of exogenous water on karst carbon sinks. China Karst 2011, 30, 4. [Google Scholar]
  5. He, R.X. Research on the Influence of Bacterial Communities in Karst Water Bodies on Karst Carbon Sinks; Southwest University: Chongqing, China, 2017. [Google Scholar]
  6. Yuan, Y.Q. Effects of Aquatic Photosynthetic Organisms on Water Chemistry and Karst Carbon Sinks in the Li River Basin; Southwest University: Chongqing, China, 2016. [Google Scholar]
  7. Lan, J.C.; Xiao, S.Z. Research progress on the impact of land use change on soil organic carbon and karst carbon sinks in karst areas. J. Ecol. 2017, 36, 2633–2640. [Google Scholar]
  8. Zhao, R.Y.; Li, J.H.; Dong, L.L. Characterization of temporal and spatial soil CO2 changes in karst springs under different land use types and analysis of sources. J. Ecol. Environ. 2020, 29, 81. [Google Scholar]
  9. Zhang, X.B.; Jiang, Y.J.; Qiu, S.L. Impacts of agricultural activities on carbon sinks in karst: A case study of Chongqing Qingmuguan underground river basin. Adv. Earth Sci. 2012, 27, 466. [Google Scholar]
  10. Song, C.; Liu, C.L.; Wang, J.K. Indoor simulation study on the effect of cow dung fertilizer and compound fertilizer on the erosion of carbonate rock specimens. Earth Environ. 2011, 39, 597–604. [Google Scholar]
  11. Liu, C.L.; Zhang, Y.; Song, C. Effects of agricultural fertilizer application on karst dissolution and its ecological significance. China Geol. 2015, 6, 205–214. [Google Scholar]
  12. Li, S.L.; Xu, S.; Wang, T.J. Effects of agricultural activities coupled with karst structures on riverine biogeochemical cycles and environmental quality in the karst region. Agric. Ecosyst. Environ. 2020, 303, 107120. [Google Scholar] [CrossRef]
  13. Sun, Q.; Ruan, Y.; Chen, P. Effects of mineral-organic fertilizer on the biomass of green Chinese cabbage and potential carbon sequestration ability in karst areas of Southwest China. Acta Geochim. 2019, 38, 430–439. [Google Scholar] [CrossRef]
  14. El-Mofty, S.E.D.; El-Midany, A. Calcite flotation in potassium oleate/potassium dihydrogen phosphate system. J. Surfactants Deterg. 2015, 18, 905–911. [Google Scholar] [CrossRef]
  15. Klasa, J.; Ruiz-Agudo, E.; Wang, L.J. An atomic force microscopy study of the dissolution of calcite in the presence of phosphate ions. Geochim. Cosmochim. Acta 2013, 117, 115–128. [Google Scholar] [CrossRef]
  16. Zou, Z.; Xie, J.; Macias-Sanchez, E. Nonclassical crystallization of amorphous calcium carbonate in the presence of phosphate ions. Cryst. Growth Des. 2020, 21, 414–423. [Google Scholar] [CrossRef]
  17. Sawyer, C.N.; McCarty, P.L.; Parkin, G.F. Chemistry for Environmental Engineering and Science; McGraw-Hill: New York, NY, USA, 2003. [Google Scholar]
  18. Song, Y.; Weidler, P.G.; Berg, U. Calcite-seeded crystallization of calcium phosphate for phosphorus recovery. Chemosphere 2006, 63, 236–243. [Google Scholar] [CrossRef]
  19. Sø, H.U.; Postma, D.; Jakobsen, R. Sorption of phosphate onto calcite; results from batch experiments and surface complexation modeling. Geochim. Cosmochim. Acta 2011, 75, 2911–2923. [Google Scholar] [CrossRef]
  20. Ruiz-Agudo, E.; Putnis, C.V.; Lopez-Jimenez, C.; Navarro, R.C. An atomic force microscopy study of calcite dissolution in saline solutions: The role of magnesium ions. Geochim. Cosmochim. Acta 2009, 73, 3201–3217. [Google Scholar] [CrossRef]
  21. Perassi, I.; Borgnino, L. Adsorption and surface precipitation of phosphate onto CaCO3–montmorillonite: Effect of pH, ionic strength and competition with humic acid. Geoderma 2014, 232, 600–608. [Google Scholar] [CrossRef]
  22. Ruffolo, S.A.; Comite, V.; La Russa, M.F.; Belfiore, C.M.; Barca, D.; Bonazza, A.; Crisci, G.M.; Pezzino, A.; Sabbioni, C. An analysis of the black crusts from the Seville Cathedral: A challenge to deepen the understanding of the relationships among microstructure, microchemical features, and pollution sources. Sci. Total Environ. 2015, 502, 157–166. [Google Scholar] [CrossRef]
  23. Samanta, A.; Chanda, D.K.; Das, P.S.; Ghosh, J.; Mukhopadhyay, A.K.; Dey, A. Synthesis of nano calcium hydroxide in aqueous medium. J. Am. Ceram. Soc 2016, 99, 787–795. [Google Scholar] [CrossRef]
  24. Wang, L.; Sondi, I.; Matijević, E. Preparation of uniform needle-like aragonite particles by homogeneous precipitation. J. Colloid Interface Sci. 1999, 218, 545–553. [Google Scholar] [CrossRef]
  25. Destainville, A.; Champion, E.; Bernache-Assollant, D.; Laborde, E. Synthesis, characterization and thermal behavior of apatitic tricalcium phosphate. Mater. Chem. Phys. 2003, 80, 269–277. [Google Scholar] [CrossRef]
  26. Meejoo, S.; Maneeprakorn, W.; Winotai, P. Phase and thermal stability of nanocrystalline hydroxyapatite prepared via microwave heating. Thermochim. Acta 2006, 447, 115–120. [Google Scholar] [CrossRef]
  27. Novais, S.V.; Zenero, M.D.O.; Tronto, J.; Conz, R.F.; Cerri, C.E.P. Poultry manure and sugarcane straw biochars modified with MgCl2 for phosphorus adsorption. J Environ. Manag. 2018, 214, 36–44. [Google Scholar] [CrossRef] [PubMed]
  28. Han, Y.S.; Hadiko, G.; Fuji, M.; Takahashi, M. Factors affecting the phase and morphology of CaCO3 prepared by a bubbling method. J. Eur. Ceram. Soc. 2006, 26, 843–847. [Google Scholar] [CrossRef]
  29. Torit, J.; Phihusut, D. Phosphorus removal from wastewater using eggshell ash. Environ. Sci. Pollut. Res. 2019, 26, 34101–34109. [Google Scholar] [CrossRef] [PubMed]
  30. Boro, J.; Konwar, L.J.; Deka, D. Transesterification of non-edible feedstock with lithium incorporated eggshell derived CaO for biodiesel production. Fuel Process. Technol. 2014, 122, 72–78. [Google Scholar] [CrossRef]
  31. Gunasekaran, S.; Anbalagan, G.; Pandi, S. Raman and infrared spectra of carbonates of calcite structure. J. Raman Spectrosc. 2006, 37, 892–899. [Google Scholar] [CrossRef]
  32. Couture, L. Etude des spectres de vibration de monocristaux ioniques. Ann. Phys. 1947, 2, 5–94. [Google Scholar] [CrossRef]
  33. Murphy, A.E.; Jakubek, R.S.; Steele, A. Raman spectroscopy provides insight into carbonate rock fabric based on calcite and dolomite crystal orientation. J. Raman Spectrosc. 2021, 52, 1155–1166. [Google Scholar] [CrossRef]
  34. Wang, L.J.; Ruiz-Agudo, E.; Putnis, C.V.; Menneken, M.; Putnis, A. Kinetics of calcium phosphate nucleation and growth on calcite: Implications for predicting the fate of dissolved phosphate species in alkaline soils. Environ. Sci. Technol. 2012, 46, 834–842. [Google Scholar] [CrossRef]
  35. Wang, L.J.; Li, S.; Ruiz-Agudo, E.; Putnis, C.V.; Putnis, A. Posner’s cluster revisited: Direct imaging of nucleation and growth of nanoscale calcium phosphate clusters at the calcite-water interface. CrystEngComm 2012, 14, 6252–6256. [Google Scholar] [CrossRef]
  36. Gomes, G.C.; Borghi, F.F.; Ospina, R.O. Nd: YAG (532 nm) pulsed laser deposition produces crystalline hydroxyapatite thin coatings at room temperature. Surf. Coat. Technol. 2017, 329, 174–183. [Google Scholar] [CrossRef]
  37. Jia, Z.; Zeng, W.; Xu, H.; Li, S.; Peng, Y. Adsorption removal and reuse of phosphate from wastewater using a novel adsorbent of lanthanum-modified Platanus biochar. Process Saf. Environ. Prot. 2020, 140, 221–232. [Google Scholar] [CrossRef]
  38. Li, S.; Zeng, W.; Xu, H.; Jia, Z.; Peng, Y. Performance investigation of struvite high-efficiency precipitation from wastewater using silicon-doped magnesium oxide. Environ. Sci. Pollut. Res. Int. 2020, 27, 15463–15474. [Google Scholar] [CrossRef] [PubMed]
  39. Yin, H.; Kong, M. Simultaneous removal of ammonium and phosphate from eutrophic waters using natural calcium-rich attapulgite-based versatile adsorbent. Desalination 2014, 351, 128–137. [Google Scholar] [CrossRef]
  40. Yang, Y.; Wang, H.; Yan, F.Y. Bioinspired porous octacalcium phosphate/silk fibroin composite coating materials prepared by electrochemical deposition. ACS Appl. Mater. Interfaces 2015, 7, 5634–5642. [Google Scholar] [CrossRef]
  41. Moulder, W.F.S.J.F.; Sobol, P.E.; Bomben, K.D. Handbook of X-ray Photoelectron Spectroscopy; Physical Electronic Inc.: Eden Prairie, MN, USA, 1995. [Google Scholar]
  42. Wu, J.; Huang, X.; Chen, H. Fabrication of Cu-Al2O3/ceramic particles by using brick particles as supports for highly-efficient selenium adsorption. J. Environ. Chem. Eng. 2021, 9, 105008. [Google Scholar] [CrossRef]
  43. Hou, Y.; Peng, J.; Wang, M. Tribochemical behavior of pure magnesium during sliding friction. Metals 2019, 9, 311. [Google Scholar]
  44. Chubar, N. XPS determined the mechanism of selenite (HSeO3) sorption in the absence/presence of sulfate (SO42−) on Mg-Al-CO3 Layered double hydroxides (LDHs): Solid phase speciation focus. J. Environ. Chem. Eng. 2023, 11, 109669. [Google Scholar] [CrossRef]
  45. Din, I.U.; Alotaibi, M.A.; Alharthi, A.I. Synthesis, characterization, and activity of CeO2-supported Cu-Mg bimetallic catalysts for CO2 to methanol. Chem. Eng. Res. Des. 2023, 192, 158–166. [Google Scholar] [CrossRef]
  46. Stipp, S.L.; Hochella, M.F., Jr. Structure and bonding environments at the calcite surface as observed with X-ray photoelectron spectroscopy (XPS) and low energy electron diffraction. Geochim. Cosmochim. Acta 1991, 55, 1723–1736. [Google Scholar] [CrossRef]
  47. Hu, X.; Xue, Y.; Liu, L.; Zeng, Y.; Long, L. Preparation and characterization of Na2S-modified biochar for nickel removal. Environ. Sci. Pollut. Res. Int. 2018, 25, 9887–9895. [Google Scholar] [CrossRef] [PubMed]
  48. Wang, Z.; Miao, R.; Ning, P. From wastes to functions: A paper mill sludge-based calcium-containing porous biochar adsorbent for phosphorus removal. J. Colloid Interface Sci. 2021, 593, 434–446. [Google Scholar] [CrossRef]
  49. Yin, H.; Kong, M.; Fan, C. Batch investigations on P immobilization from wastewaters and sediment using natural calcium-rich sepiolite as a reactive material. Water Res. 2013, 47, 4247–4258. [Google Scholar] [CrossRef]
  50. Kõiv, M.; Liira, M.; Mander, Ü.; Mõtlep, R.; Vohla, C.; Kirsimäe, K. Phosphorus removal using Ca-rich hydrated oil shale ash as filter material—The effect of different phosphorus loadings and wastewater compositions. Water Res. 2010, 44, 5232–5239. [Google Scholar] [CrossRef]
  51. Park, J.H.; Wang, J.J.; Xiao, R. Effect of pyrolysis temperature on phosphate adsorption characteristics and mechanisms of crawfish char. J. Colloid Interface Sci. 2018, 525, 143–151. [Google Scholar] [CrossRef]
  52. Falini, G.; Gazzano, M.; Ripamonti, A. Magnesium calcite crystallization from water-alcohol mixtures. Chem. Commun. 1996, 26, 1037–1038. [Google Scholar] [CrossRef]
  53. Liao, Y.; Chen, S.; Zheng, Q. Removal and recovery of phosphorus from solution by bifunctional biochar. Inorg. Chem. Commun. 2022, 139, 109341. [Google Scholar] [CrossRef]
  54. Sparks, D.L.; Hartemink, A.E.; McBratney, A.B. Elucidating the fundamental chemistry of soils; past and recent achievements and future frontiers. Geoderma 2001, 100, 303–319. [Google Scholar] [CrossRef]
  55. Zhang, P.; He, M.; Huo, S. Recent progress in metal-based composites toward adsorptive removal of phosphate: Mechanisms, behaviors, and prospects. Chem. Eng. J. 2022, 446, 137081. [Google Scholar] [CrossRef]
  56. Loganathan, P.; Vigneswaran, S.; Kandasamy, J.; Bolan, N.S. Removal and recovery of phosphate from water using sorption. Crit. Rev. Environ. Sci. Technol. 2014, 44, 847–907. [Google Scholar] [CrossRef]
  57. Jiang, W.; Gao, Z.Y.; Khoso, S.A. Selective adsorption of benzhydroxamic acid on fluorite rendering selective separation of fluorite/calcite. Appl. Surf. Sci. 2018, 435, 752–758. [Google Scholar] [CrossRef]
  58. Huang, X.; Huang, L.; Babu Arulmani, S.R. Research progress of metal organic frameworks and their derivatives for adsorption of anions in water: A review. Environ. Res. 2022, 204, 112–381. [Google Scholar] [CrossRef] [PubMed]
Figure 1. Diffractogram of (a) calcite CaCO3 and (b) magnesite MgCO3 in limestone determined using X-ray diffractometer.
Water 15 03230 g001
Figure 2. Experimental setup and experimental environment of the experimental group.
Water 15 03230 g002
Figure 3. Variation in hydrochemical parameters of limestone over 12 d under three different reaction conditions. (a) TIC concentration in solution; (b) conductivity in solution; (c) pH in solution; (d) concentration of calcium ions in solution; (e) concentration of magnesium ions in solution; (f) phosphate concentration in solution.
Water 15 03230 g003aWater 15 03230 g003b
Figure 4. Correlation between Ca2+, Mg2+, and phosphate over 12 d of limestone reaction in phosphate solution. (a) Correlation of Ca2+ with phosphate; (b) correlation of Mg2+ with phosphate.
Water 15 03230 g004aWater 15 03230 g004b
Figure 5. X-ray diffraction patterns of initial samples of limestone dissolved in different solutions. (a) The initial sample of limestone; (b) deionized water solution; (c) 2 mg/L phosphate solution; (d) 100 mg/L phosphate solution.
Water 15 03230 g005
Figure 6. Fourier infrared spectra of the initial sample of limestone and its dissolution in different solutions.
Water 15 03230 g006
Figure 7. Raman profiles of the initial sample of limestone and its dissolution in different solutions.
Water 15 03230 g007
Figure 8. XPS profiles of limestone samples in different concentrations of phosphate solution. (a) XPS spectra of high-resolution P2p of limestone samples in 100 mg/L solution; (b) XPS spectra of high-resolution P2p of limestone samples in 2 mg/L solution; (c) XPS spectra of high-resolution Ca2p of limestone samples in 100 mg/L solution; (d) XPS spectra of high-resolution Ca2p of limestone samples in 2 mg/L solution; (e) XPS spectra of high-resolution Mg1s of limestone samples in 100 mg/L solution; (f) XPS spectra of high-resolution Mg1s of limestone samples in 2 mg/L solution; (g) XPS spectra of high-resolution O1s of limestone samples in 100 mg/L solution; (h) XPS spectra of high-resolution O1s of limestone samples in 2 mg/L solution; (i)XPS spectra of high-resolution C1s of limestone samples in 100 mg/L solution; (j) XPS spectra of high-resolution C1s of limestone samples in 2 mg/L solution.
Water 15 03230 g008aWater 15 03230 g008b
Figure 9. XPS full spectra of limestone samples in different concentrations of phosphate solutions. (a) XPS full spectrum of limestone samples in 100 mg/L phosphate solution; (b) XPS full spectrum of limestone samples in 2 mg/L phosphate solution.
Water 15 03230 g009
Figure 10. SEM/EDS images of limestone samples after 12 days of reaction in deionized water solution.
Water 15 03230 g010aWater 15 03230 g010b
Figure 11. SEM/EDS images of limestone samples after 12 days of reaction in 2 mg/L phosphate solution.
Water 15 03230 g011
Figure 12. SEM/EDS images of limestone samples after 12 days of reaction in the 100 mg/L phosphate solution.
Water 15 03230 g012
Figure 13. Schematic representation of phosphate adsorption to form (a): CaHPO4 and (b): Mg2PO4(OH) at Ca or Mg sites in carbonate rocks. Purple ball is Ca; green ball is Mg; black ball is C; pink ball is O; yellow ball is P; blue ball is H.
Water 15 03230 g013
Table 1. Results of EDS energy spectra of limestone surface after 12 d dissolution in deionized water solution.
ElementalLine TypeApparent Concentrationwt%wt% Sigma
OK23,33544.784.37
CK730011.691.34
CaK59,38930.380.73
MgK35,21512.950.56
PK380.010.00
Total: 100.00
Table 2. Results of EDS energy spectra of limestone surface after 12 d dissolution in 2 mg/L phosphate solution.
ElementalLine TypeApparent Concentrationwt%wt% Sigma
OK40,17845.35.4
CK34,64721.772.64
CaK119,19432.190.98
MgK12560.190.04
PK36470.540.05
Total: 100.00
Table 3. Results of EDS energy spectra of limestone surface after 12d dissolution in the 100 mg/L phosphate solution.
ElementalLine TypeApparent Concentrationwt%wt% Sigma
OK32,12046.485.37
CK19,98218.442.25
CaK90,66232.340.94
MgK23730.580.06
PK10,0012.160.1
Total: 100.00
Disclaimer/Publisher’s Note: The statements, opinions and data contained in all publications are solely those of the individual author(s) and contributor(s) and not of MDPI and/or the editor(s). MDPI and/or the editor(s) disclaim responsibility for any injury to people or property resulting from any ideas, methods, instructions or products referred to in the content.

