Article

Effect of Hydrochar Modification on the Adsorption of Methylene Blue from Aqueous Solution: An Experimental Study Followed by Intelligent Modeling

1
Environmental Health Research Center, Research Institute for Health Development, Kurdistan University of Medical Sciences, Sanandaj 66179-13446, Iran
2
Leibniz Institute for Agricultural Engineering and Bioeconomy, Max-Eyth-Allee 100, 14469 Potsdam-Bornim, Germany
*
Author to whom correspondence should be addressed.
Water 2023, 15(18), 3220; https://doi.org/10.3390/w15183220
Submission received: 9 August 2023 / Revised: 6 September 2023 / Accepted: 8 September 2023 / Published: 10 September 2023
(This article belongs to the Special Issue Removal of Micropollutants in Water)

Abstract

:
Wheat straw, which is a carbon-rich precursor and a common agriculture waste in Sanandaj, was modified to produce hydrochar with high adsorption capacity by the hydrothermal carbonization (HTC) method. The hydrochars were tested as adsorbents to remove methylene blue (MB) from aqueous solution, and the effects of various interfering parameters, including pH, MB concentration, and adsorbent dosage, were investigated using artificial neural networks (ANNs) on adsorption modeling. Adsorption isotherms and kinetics were studied to explain the MB adsorption process. The prepared hydrochars were characterized using Brunauer–Emmett–Teller (BET), scanning electron microscopy-energy dispersive X-ray analysis (SEM-EDAX), and high-performance liquid chromatography (HPLC) instruments. The maximum MB removal efficiency achieved by hydrochar modified by KOH (0.1 M) and adsorption data fitted well with the Langmuir isotherm and pseudo-second-order kinetics. In terms of elemental composition, the hydrochar sample contained 52.19% carbon (C), 3.37% hydrogen (H), 0.1% nitrogen (N), 0.15% sulfur (S), and 35.66% oxygen (O). The ash content in the sample was 8.50%. The recorded hydrogen-to-carbon ratio (H/C) and oxygen-to-carbon ratio (O/C) indicated a shift towards humification, implying the influence of KOH addition during the hydrochar production process. Additionally, the specific surface area of the hydrochar, as measured by the BET method, was found to be 11.54 m²/g. Among the aromatics, a significant presence of hydroxymethylfurfural (HMF) was detected, with a concentration of 4.70 g/kg DM. The modeling results demonstrated that the concentration of MB had the most substantial impact on the predicted removal, followed by pH, adsorbent dosage, and contact time.

1. Introduction

In recent years, water pollution by various natural and synthetic substances has become a global problem. Most of these compounds are toxic to living organisms and accumulate in plant and animal tissues. Therefore, removing such materials from water is of great importance [1]. Also, in order to meet strict water quality standards, the identification and development of new methods to control pollutants are essential [2]. Organic dyes are typical pollutants in effluents from industries such as textiles, plastics, paper, cosmetics, food processing, and so forth [3]. Dyes have properties like high toxicity, carcinogenicity, mutagenicity, and so on. Thus, if they are poorly treated before being discharged into the environment, they can lead to serious environmental problems and human health threats [4]. Unfortunately, it has been reported that a huge number of dye products (more than 100 thousand) have been released into water bodies [5].
Methylene blue (MB) is utilized in different industries to color paper, cotton, wool, silk, and so forth. It has been stated that this substance causes a number of risks to human health, like respiratory, eye, digestive, and mental problems [6]. It is worth noting that several processes like chemical coagulation, electrochemical removal, membrane filtration, photodegradation reactions, and physical adsorption have been applied to remove MB from industrial effluents [7]. Among these measures, adsorption has been introduced as an effective way to remove MB from aquatic solutions [8].
It has been documented that carbon-based adsorbents like activated carbon (AC), hydrochar, and biochar are known as the most efficient and sometimes the most cost-effective adsorbents in the removal of inorganic and organic contaminants from water and wastewater. In comparison with AC, the final cost of biochar and hydrochar applied for contaminant removal is cheaper [1,9]. The production of AC requires a higher temperature and a longer activation process, while biochar and hydrochar are produced easier with less energy and are therefore less expensive [10,11].
The wet biomass materials such as wheat straw, biosolids and so forth, under the hydrothermal carbonization (HTC) process, could be converted to an energy-dense and carbon-rich adsorbent [12]. A plus factor of hydrochar production, unlike biochar, is that moderate temperatures from 180 to 350 °C are needed in the presence of water at autogenous pressures for a few hours [13]. Since the structure of biomass materials is complex, the chemistry of the HTC process has not been well understood. In the HTC process, some reaction mechanisms like hydrolysis, decarboxylation, dehydration, aromatization, and polymerization happen simultaneously [13]. It should be pointed out that two factors are completely effective in determining elemental compositions as well as physicochemical characteristics of hydrochar, which are feedstock type and HTC processing conditions [14]. Therefore, by changing the type of feedstock and optimizing the operating parameters of the HTC process, it is highly likely that a hydrochar with proper properties will be generated.
Hydrochar-based adsorbents benefit from a few unique features, such as considerable oxygen-containing functional groups like hydroxyl, phenolic, carbonyl, or carboxylic on their surface, which make them a suitable option for the removal of different pollutants [15]. Nonetheless, hydrochar suffers from drawbacks such as low surface area and weak porosity, thereby declining its adsorptive removal properties of contaminants [16]. Thus, it is of great importance to enhance the surface area and porosity of hydrochars to enable suitable adsorption. In a few studies, it has been stated that, in acidic conditions, the carbon amount and higher heating value (HHV) of hydrochar increase [17]. That is, the addition of acid to the HTC reactor may trigger the hydrolysis reactions, thereby declining activation energy as well as modifying hydrochar characteristics [17]. Furthermore, modified hydrochars have more oxygen-containing functional groups on their surface; consequently, they have the capability to remove cationic contaminants from aqueous solutions [18]. KOH has been introduced as an acid to functionalize biomass-based materials, and the resulting hydrochar has the following properties: high selectivity and specificity, as well as increased adsorption capacity [19].
Wheat straw is one of the agricultural by-products that is widely produced in any part of the world annually. The plus factor of this waste is that it can be used for the production of hydrochar-based adsorbents with unique features. In this research, the major objectives were as follows: (1) to prepare hydrochars through the HTC process of wheat straw; (2) to modify the hydrochar by means of KOH; (3) to characterize the wheat straw-derived hydrochar and KOH-modified hydrochar (HCKOH) via Fourier transform infrared (FT-IR) spectroscopy, elemental analysis, and BET (Brunauer–Emmett–Teller); (4) to investigate and compare the produced adsorbents: wheat straw-derived hydrochar and HCKOH in MB removal.

2. Materials and Methods

2.1. Chemicals

The chemicals used in the experiments have been commercially available and analytically graded. ZnCl2, H3PO4, KOH, and MB were purchased from Merck. Deionized water was used in all experiments.

2.2. Preparation of Pristine and Modified Adsorbents

Pristine and modified hydrochar were prepared from wheat straw by the hydrothermal method. The wheat straw was supplied from agricultural lands in Sanandaj City, Kurdistan Province, Iran. Raw wheat straw was placed in deionized water for 24 h to remove the organic pollutants, dried at 60 °C for 24 h prior to hydrothermal processes, and then milled into particles between 0.5 and 2 mm. ZnCl2, H3PO4, and KOH were used as modifiers. Briefly, hydrochars were prepared by adding 10 g milled wheat straw and 120 mL of different modifiers, ZnCl2 (1 M), H3PO4 (1 M), and KOH (0.1, 0.5, and 1 M), to a stainless-steel reactor. The reactor was placed in an oven at 220 °C for 12 h. In the next step, the reactor contents were washed with 100 mL of water, filtered with a fiberglass filter, and dried at 60 °C for 24 h. HCKOH (0.1 M), which showed the best adsorption efficiency, was prepared at three different temperatures (220, 230, and 240 °C).

2.3. pHzpc for KOH-Modified Hydrochar

In order to determine the zero point of charge, an aliquot of 50 mL of NaCl solution was prepared in five different beakers, and the pH was adjusted from 2 to 10 by adding acid and basic solutions (NaOH and HCl 0.01 M). Then, 0.15 g of HCKOH was added to each beaker, covered by parafilm, and shaken for 24 h. Subsequently, the final pH of the solution was detected and plotted against the initial pH. According to other studies, the point where the curve crosses the line pH initial = pH final is considered pHzpc [20,21].

2.4. Adsorption Experiments

At the first step, the adsorption efficiency of different adsorbents was investigated. Then, the effects of different interfering parameters like pH, hydrochar dosage, and MB concentration on adsorption efficiency were assessed. Batch experiments were undertaken in 250 mL beakers, each containing 100 mL of MB, on an orbital shaker (120 rpm). MB concentrations were determined using UV-Vis spectrometry (DR 5000, Hack, Ca) at a wavelength of 668 nm. NaOH and HCl were used for adjusting pH. At 30 min time intervals, samples were taken, filtered with fiberglass, and then centrifuged for 10 min prior to spectroscopy.
The removal efficiency of the dye was calculated by the following equation:
R e m o v a l   ( % ) = C 0 C t C 0 × 100
The MB adsorption kinetics on the HCKOH at different time intervals and different MB concentrations were calculated as detailed below [22]:
P s e u d o   f i r s t   o r d e r   k i n e t i c s :   L n q e q t = l n q e k 1 × t
P s e u d o   s e c o n d   o r d e r   k i n e t i c s :   t q e = 1 K 2 q e 2 + 2 q e

2.5. Desorption and Reusability Experiments

In order to determine the MB desorption, the adsorption–desorption experiments were carried out at 10 mg/L MB and 2 g/L HCKOH for 120 min. After each cycle, the MB-loaded HCKOH were mixed with 100 mL of water to either pH 3, 7, or 11 and shaken for 24 h at room temperature. Then, the solutions were filtered, and MB concentrations were detected in the media. Afterwards, the filtered residuals were washed several times and oven dried for the next adsorption experiment.

2.6. Adsorption Isotherm

The models of the adsorption isotherms are investigated to provide detailed facts about the surface adsorbent properties of the KOH-modified hydrochar. The observed data of methylene adsorption on HCKOH are fitted to the Freundlich, Langmuir, Temkin, and Dubinin–Radushkevich (D–R) models.
The liner equation of the Langmuir isotherm is presented as follows:
1 q e = 1 K L   q m a x × 1 C e + 1 q m a x
where Ce is the dye concentration in the solution at equilibrium (mg/L), qe is the dye concentration on the sorbent at equilibrium (mg/g), qmax is the Langmuir constant representing the maximum adsorption capacity of the solute per unite weight of the adsorbent (mg/g), and KL is the adsorption equilibrium constant (L mg−1), which is related to the energy of the adsorption [21].
The dimensionless constant separation factor (RL), which indicates the crucial characteristic of the Langmuir isotherm and shows the favorability of the adsorption, calculated as follows [23]:
R L = 1 1 + K L C 0  
The value of RL indicates the adsorption properties; there are probabilities for the RL value where it can be linear (RL = 1), favorable (0 < RL < 1), unfavorable (RL > 1), or irreversible (RL = 0).
The Freundlich line model equation is shown as follows:
L o g q e = L o g   K F + 1 n + L o g C e
where n and KF are isotherm constants, which indicate the intensity of the adsorption and the adsorption capacity, respectively [24].
The Temkin isotherm contains a factor that considers adsorbent–adsorbate interactions [25]. The model is given by the following equation [26]:
q e = R T b T L n   K T + R T B T L n C e  
where Ce is equilibrium strength of the adsorbate, R is the gas constant (8.314 J/mol/K), and T is temperature at 298 K. BT and KT are Temkin constants representing the adsorption heat (J mol−1) and the equilibrium binding constant (L mg−1), respectively [27].
The D–R model is expressed mathematically by Equation (7) [28]:
Q e = Q m e β ε 2

2.7. Characterization of Adsorbent

Elemental carbon, hydrogen, nitrogen, and sulfur were measured using an Elemental Analyzer (Vario El) from the Elementar Analyse system in Hanau, Germany, while the oxygen content was derived using the following equation: O% = 100 − (C% + H% + S% + N% + Ash%). The ash content (ash%) of hydrochar and biomass was determined through a two-step process. Initially, the samples were subjected to 105 °C for 24 h to calculate the total solids (TS%) according to DIN EN 14775 standards. Subsequently, a further treatment at 550 °C for 5 h was performed. The higher heating value (HHV) of the hydrochar was calculated based on a correlation (Equation (2)) presented in a previous study [29]. The calculation involved the carbon and oxygen percentages of the samples on a dry basis, represented by C and O, respectively.
H H V ( M J / k g ) = 0.3853 C + 44.98 / O
The total surface area of both raw wheat straw and hydrochar was determined by nitrogen adsorption–desorption at 77 K using a Brunauer–Emmett–Teller (BET) instrument (TriStar II by Micromeritics, Norcross, GA, USA). To examine the surface morphology of the samples, a Phenom ProX Desktop SEM-EDX instrument (USA) was employed. The metal, phosphorus, and sulfur levels in the hydrochar were examined using an ICP-OES instrument (ICAP6300 Duo by Thermo Scientific, Waltham, MA, USA) that had an autosampler (ASX-520 by CETAC Technologies, Omaha, NE, USA). The FTIR spectra of the hydrochar were recorded using a Nicolet iS5 ATR-FTIR device (Thermo Scientific, Madison, WI, USA). The HPLC technique (Dionex ICS 3000; Thermo Fisher Scientific Inc., USA) was utilized to measure the concentration of aromatics, including HMF, furfural, catechol, phenol, guaiacol, and cresol, in the hydrochar. Sugars (glucose, sucrose, and fructose) and organic acids (acetic acid, lactic acid, and formic acid) were quantified using an Ultimate 3000 instrument from DIONEX. The sample preparation procedure and method for measurement of aromatics, sugars, and organic acids, as well as the sample, can be found in our previous work [30].

2.8. Neural Network Modeling

The structure of the neural network (NN) used in this study consists of an input layer, one or more hidden layers, and an output layer. The purpose of the NN is to discover nonlinear relationships between dye removal efficiency and various adsorption variables. The study employed JMP 17 pro software (from SAS) to predict the efficiency of MB adsorption, following a procedure outlined in a previous reference [31]. The data was randomly divided into training (70%) and validation (30%) subsets using the Holdback method. The input layer of the ANN included four variables: contact time, pH, adsorbent dosage, and MB concentration. Two different structures of the hidden layer, TanH and Gaussian, with a number of 1–20 neurons were compared, and TanH was selected based on its higher R2 and RMSE values: Table 1 shows the optimum number of neurons in the hidden layers of TanH and Gaussian structures. The optimal number of neurons in the hidden layer was determined to be 15, based on the lowest RMSE of 5.20 and the highest R2 of 0.95 achieved for the training dataset.
This configuration also showed good performance for the validation dataset, with an RMSE of 3.15 and an R2 of 0.96. Figure 1 represents the final structure of the neural network, illustrating the input, hidden, and output layers.

3. Results and Discussion

3.1. MB Removal Efficiency with Different Adsorbents

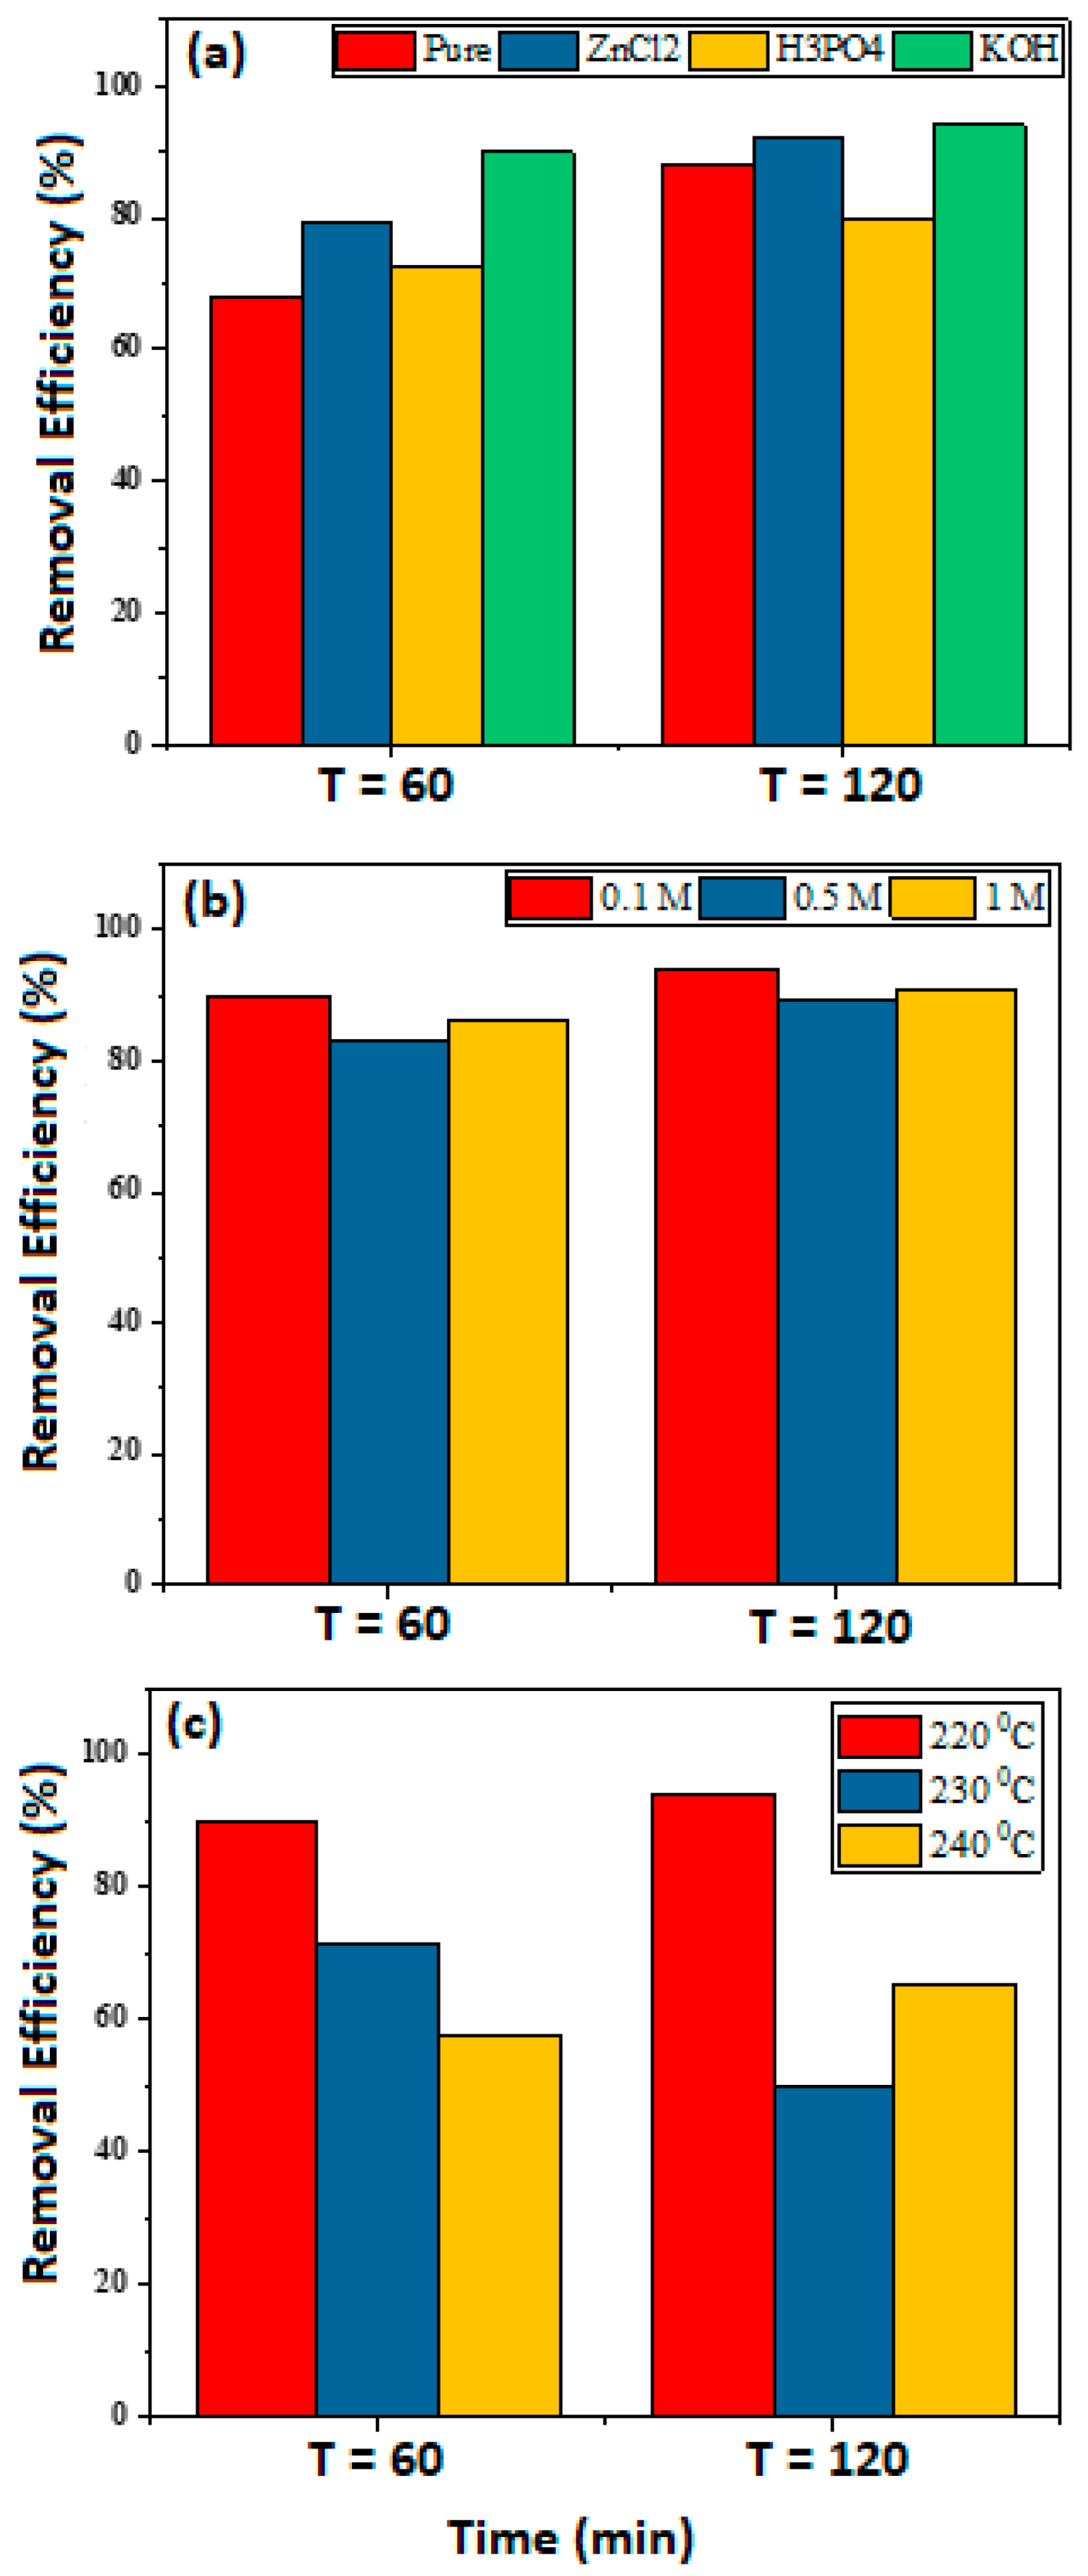
The removal efficiency of MB with different modified adsorbents was investigated. The results showed that HCKOH had the highest removal efficiency compared to other modified hydrochars (Figure 2a). Thus, HCKOH was selected as the best adsorbent in this study, and the following experiments were carried out to determine the optimal removal condition.

3.2. Effect of Interfering Parameters on MB Removal Efficiency

3.2.1. KOH Modification and Preparing Temperature

Different concentrations of KOH were applied to modify hydrochar derived from wheat straw. Also, in order to assess the effects of preparing temperature on the hydrochar efficiency, 1 M HCKOH samples at three different preparation temperatures (220, 230, and 240 °C) were produced, and their efficiency for MB removal was tested. Hydrochar modification with KOH not only leads to a higher surface area but also increases the activation yield and total pore volume due to the increased oxygen-containing functional groups on the surface of the adsorbent (1). The removal efficiency of 0.1, 0.5, and 1 M HCKOH was 94, 90, and 89%, respectively (Figure 2b). This shows that increasing the KOH concentration from 0.1 to 1 did not significantly increase the MB removal efficiency. Hydrochar preparation temperature also showed that an activation temperature of 220 increased the surface area and porosity of hydrochar, but higher temperatures caused a decrease in the porosity and adsorption efficiency due to the combination of the already prevailing pores [32]. Based on these results, 0.1 M HCKOH with a hydrothermal temperature preparation of 220 °C has the highest adsorption potential (Figure 2c). Therefore, this adsorbent was chosen as the best adsorbent, and the rest of the experiments were carried out to optimize MB removal.

3.2.2. Effect of pH and pHzpc

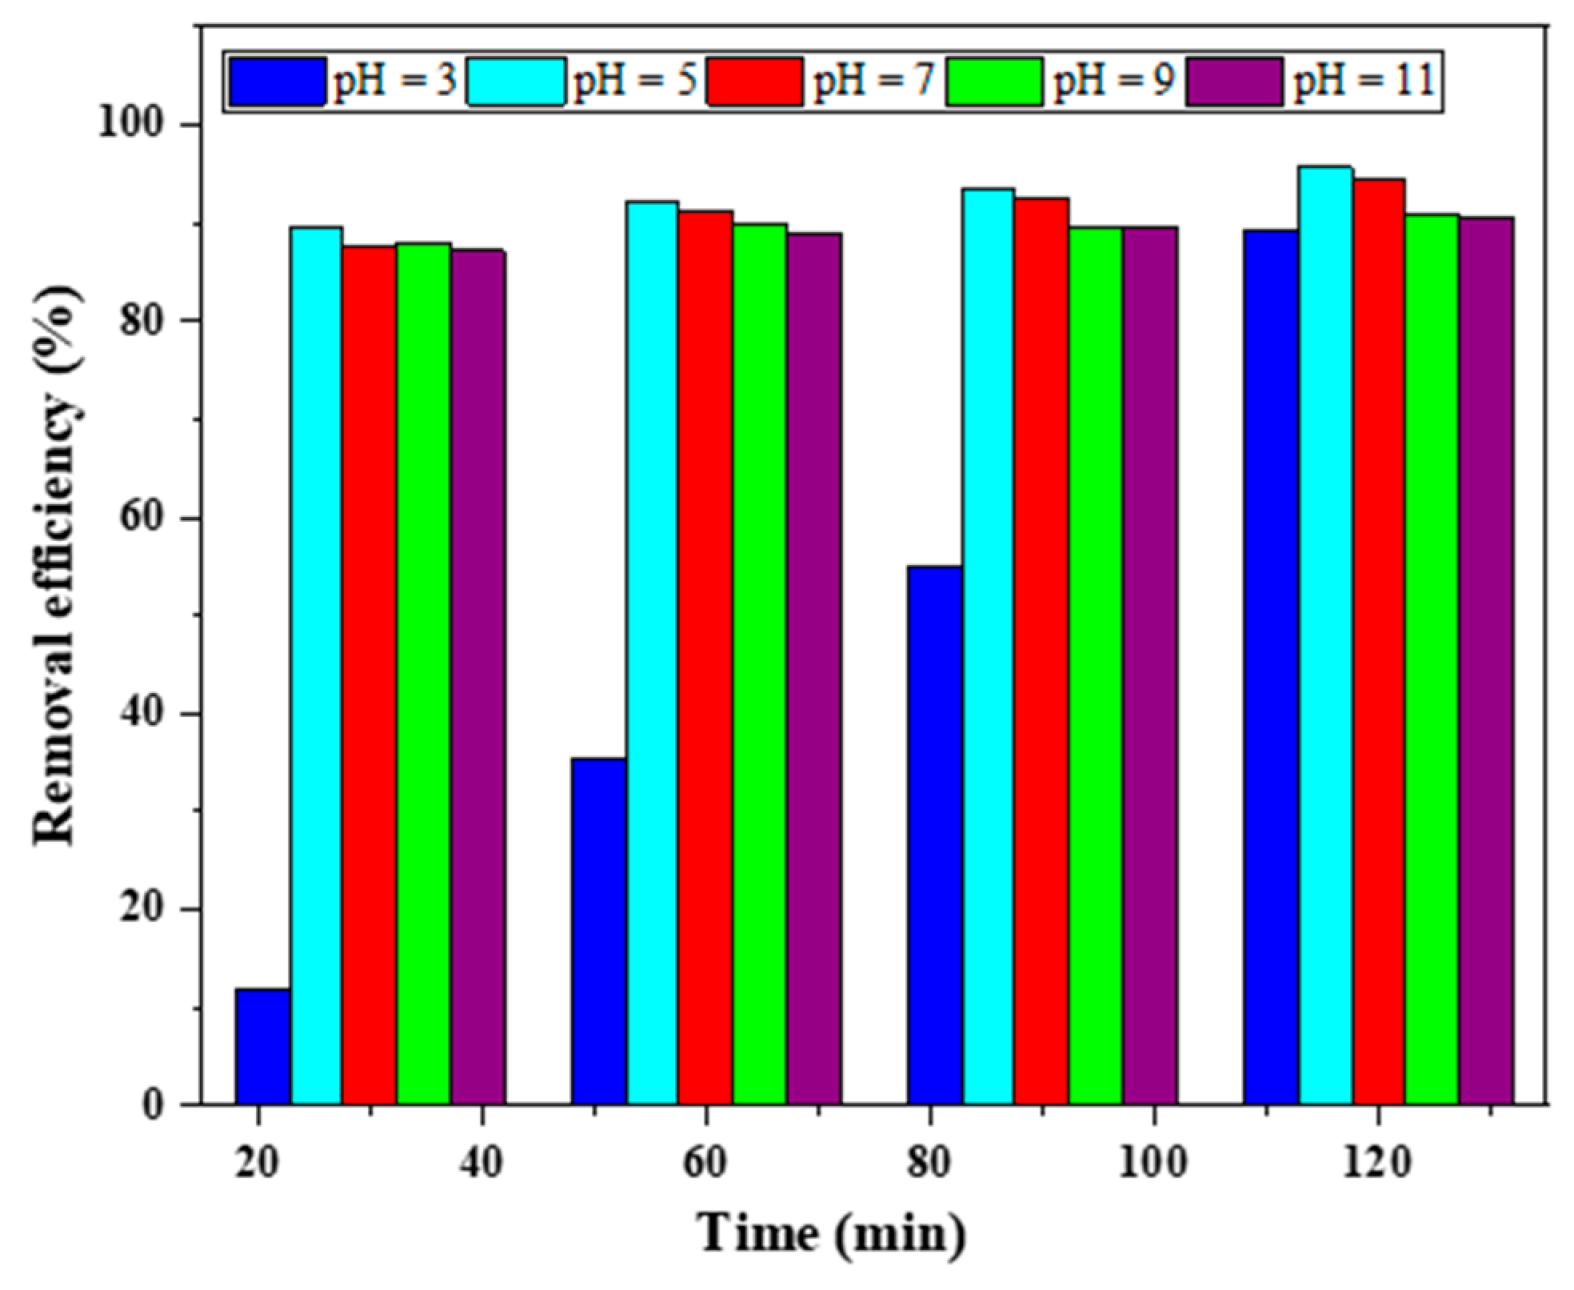
The initial pH of the dye can affect the adsorbent surface because pH has direct effects on the surface charge of the adsorbent and the ionization of the dye [33]. In this study, the effect of pH on the MB adsorption by hydrochar was investigated at a pH range between 3 and 11; meanwhile, MB and KOH-modified HCH concentrations were fixed at 10 mg/L and 2 g/L, respectively, in all the experiments (Figure 3).
The removal efficiency of MB by 0.1 M HCKOH dramatically increased from 54 to 93% as pH increased from 3 to 5–7 during 30 min. However, when the pH exceeded 5, the adsorption efficiency reached a plateau. At low pH, H+ in the solution further disturbs the bonding between the dye and adsorbent, competing with MB to occupy the active site on the adsorbent surface [34,35]. These results can be further explained by considering the impact of pH solutions on MB and the surface charge of hydrochar. The pHzpc of hydrochar was around 8, which means that the adsorbent is positively charged in acidic solutions (pH < pHzpc) and negatively charged in basic solutions (pH > pHzpc). Therefore, the low adsorption of MB on the HCKOH in strong acidic solutions can be explained by electrostatic repulsion between the cationic dye and the positively charged HCKOH [36].

3.2.3. Effect of Hydrochar Dosage

The adsorbent amount will influence the removal efficiency, so to optimize the adsorbent dosage, varied dosages of 0.5 to 3 g/L at a MB concentration of 10 mg/L, a pH of 5.3, and during 120 min were tested (Figure 4). The adsorption percentage significantly increased as the adsorbent dosage was raised from 0.5 to 1 g/L. However, when the adsorbent dosage was further raised, the gain in removal efficiency was marginal. These results are in line with our previous work [37], which showed that, with increasing adsorbent dosage, the removal efficiency also increased. These findings can be explained by the adsorbent’s higher surface area and superficial active sites.

3.2.4. Effect of MB Concentration

The MB removal efficiency by HCKOH during 120 min was 89, 88, 71, 65, and 62% for initial MB concentrations of 5, 10, 20, 30, and 40 mg/L, respectively. Removal efficiency decreased at higher concentrations, suggesting a saturation of binding sites on the adsorbent (Figure 5). The adsorption capacity of HCKOH was affected by the MB concentration in the media, and the amount of MB adsorbed increased from 4.46 to 24.5 mg/g during 120 min. The motive force provided by the increased solute concentration can overcome the resistance to mass transfer between the solid and liquid phases. Therefore, the removal efficiency decreases at higher solute concentrations, while the adsorption capacity (mg/1) will increase with increasing solute concentration. These observations accord with those reported by Kohzadi et al. and Yudha et al. [20,37].

3.2.5. Desorption and Reusability Experiments

The desorption experiments were performed at three different pH values: 3, 7, and 11. The results showed that the highest adsorption amount occurred at pH 3, which was 1.59 mg/L, while it was 0.47 and 1.12 mg/L at pH 7 and 11, respectively. Moreover, the reusability experiments indicated that the initial removal efficiency of 89% decreased to 67 and 50% in the second and third cycles, which is in accordance with Ghanim et al. [19].

3.3. Adsorption Isotherms

In this study, for Cmax from 5 to 40 mg/L, the values of RL ranged from 0.25 to 0.04, which indicates HCKOH can be considered favorable for the adsorption of MB.
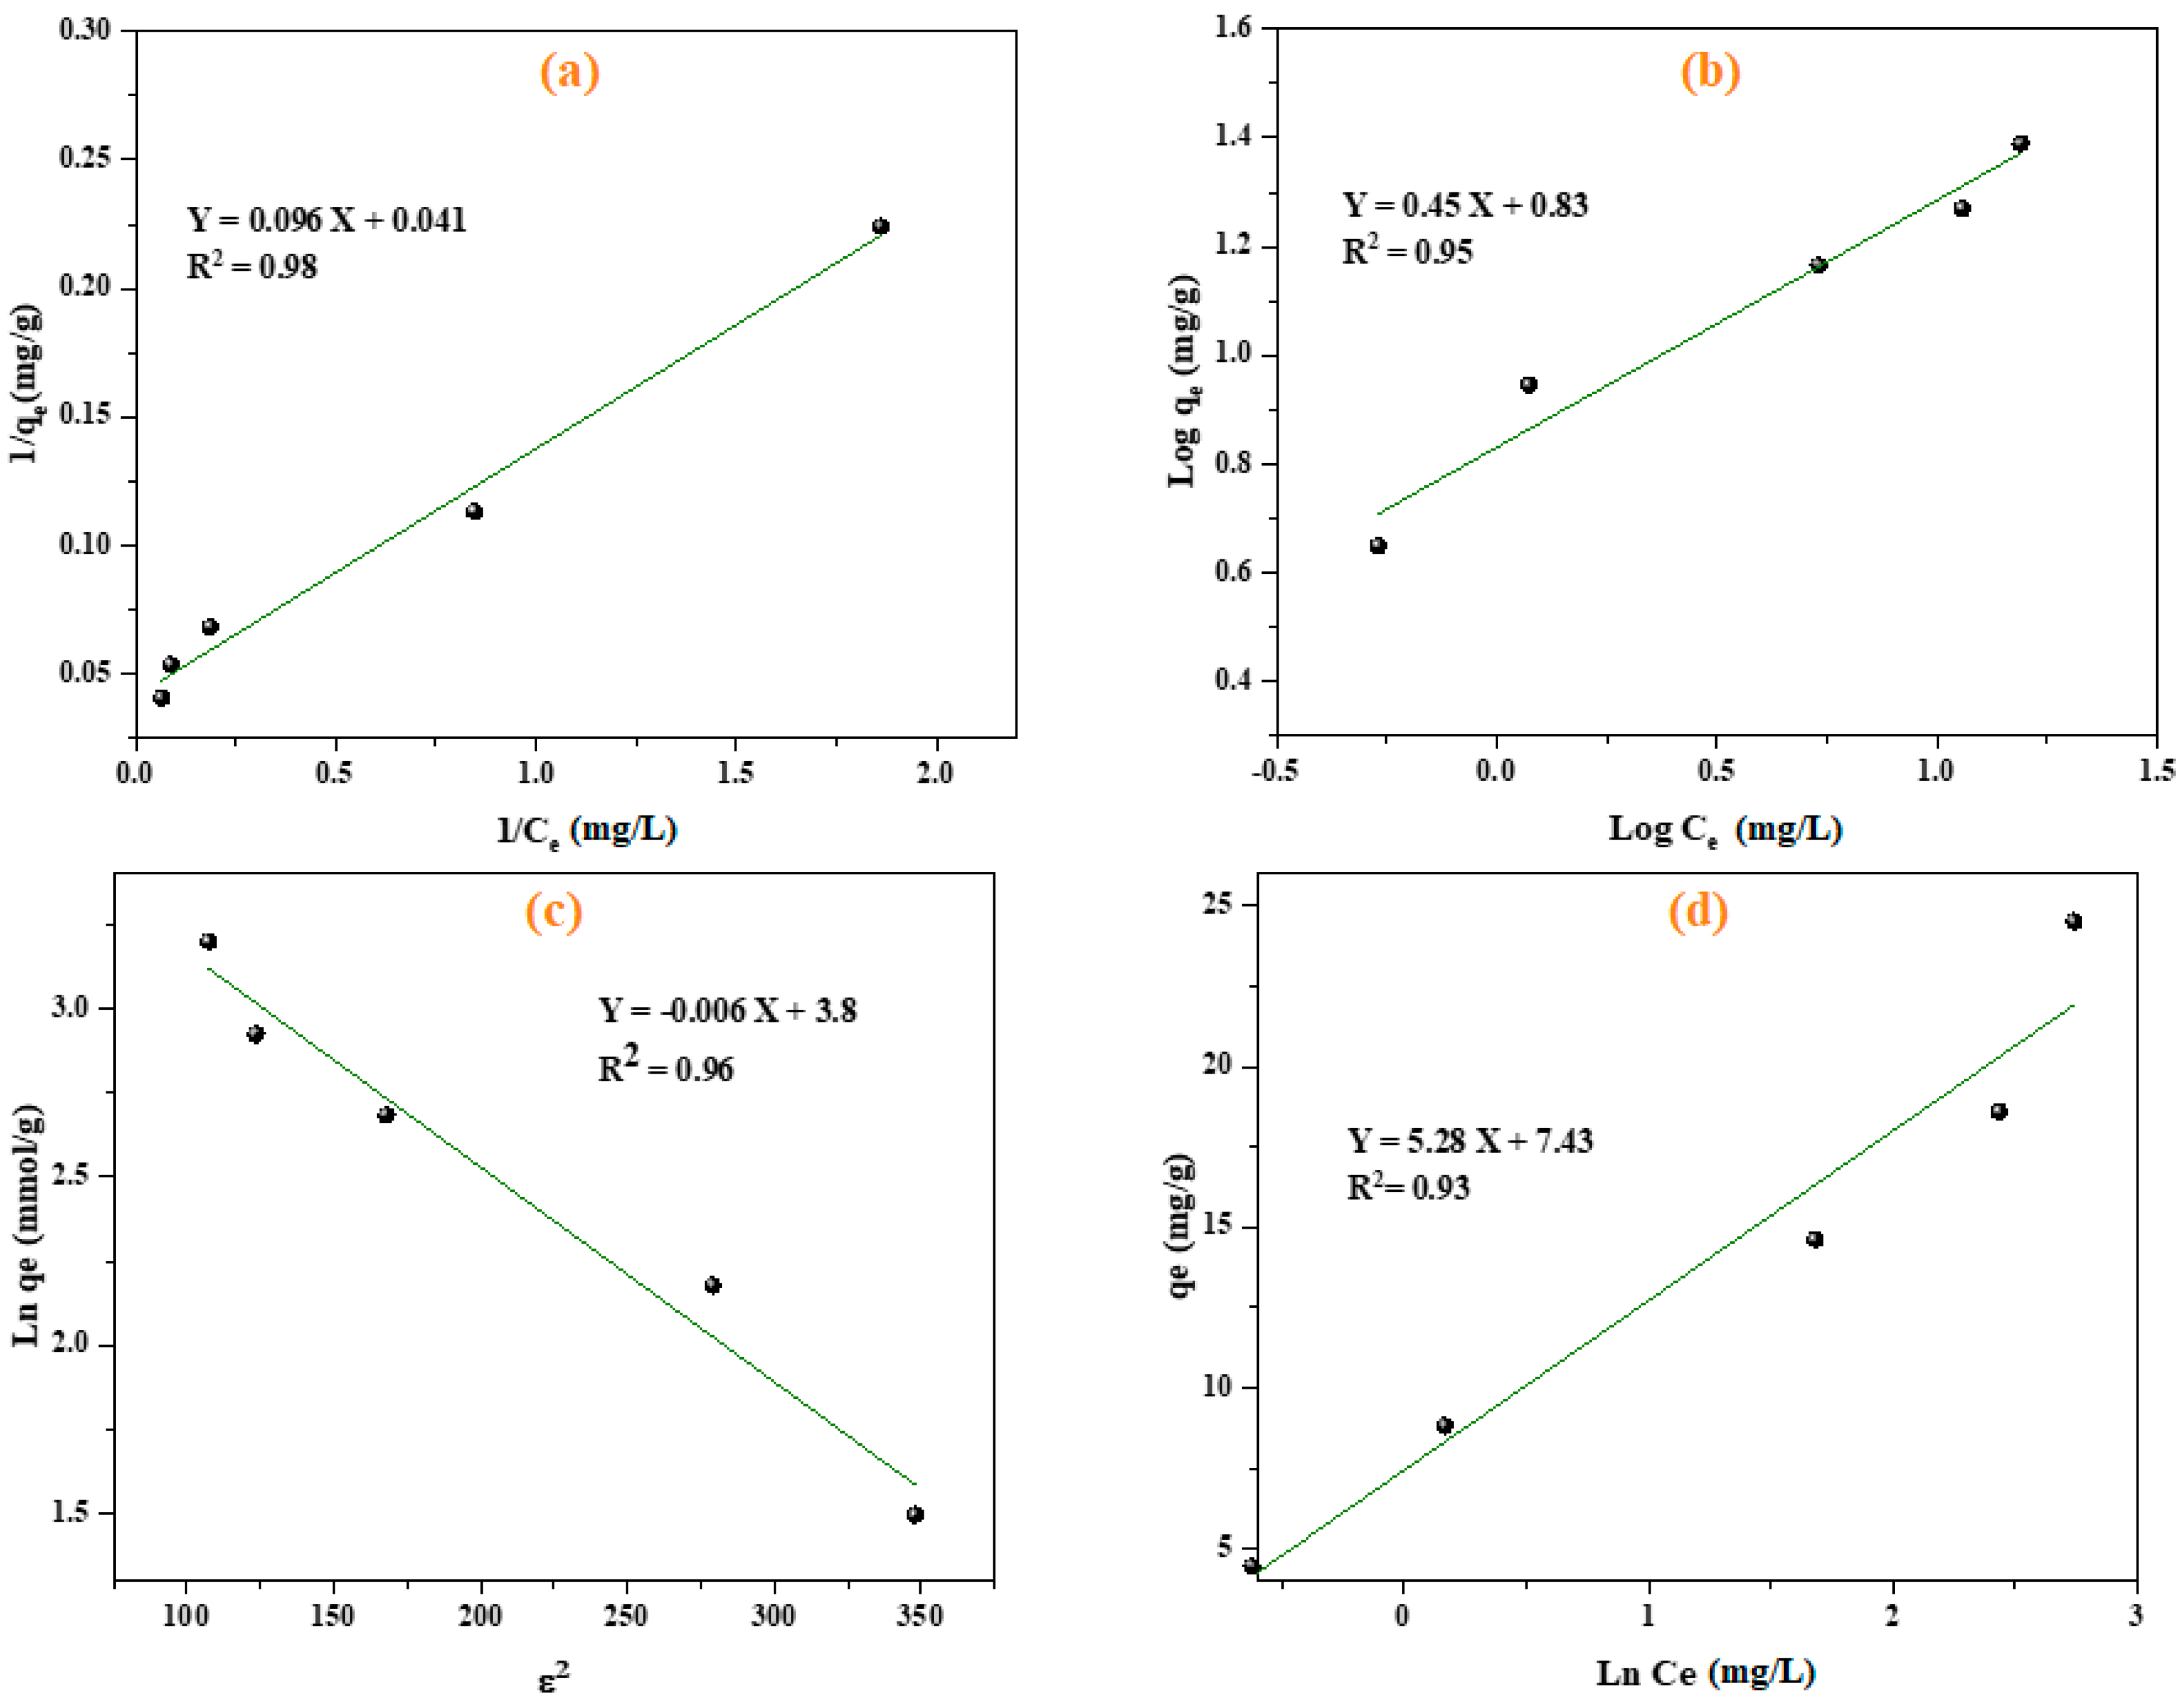
In the Langmuir model, monolayer adsorption occurs on a homogeneous surface, with each site carrying an equal number of adsorbed molecules and no interactions between adjacent molecules. In contrast, Freundlich adsorption assumes that the multilayer adsorption process is localized at a heterogeneous surface. The KL and qmax were calculated through a plot of 1/Ce vs. 1/qe at 0.42 L/mg and 24.15 mg/g, respectively. As shown in the Freundlich model results (Table 2), 1/n is lower than 1, indicating a normal distribution, as reported by Dada et al. [38]. KF, which is an approximate indicator of adsorption capacity, was 6.77 mg/g [38].
The fitted parameters indicated in Table 2 reveal that both Langmuir and Freundlich models can be used to fit the adsorption process of MB on the HCKOH, while the Langmuir model with a slightly higher R2 = 0.98 value can fit the adsorption data better. The R2 value of 0.96 for the Freundlich model shows that the surface of the samples tends to be inhomogeneous and that the adsorption of MB is not limited to a single layer [39]. Figure 6 shows that the adsorption capacity increased with the adsorption equilibrium concentration [40].
By ignoring the extremely low and large values of concentrations, the Temkin model assumes that the fall in the heat of adsorption of all the molecules in the layer decreases linearly with coverage due to adsorbent–adsorbate interactions and that the adsorption is characterized by a uniform distribution of the binding energies [41]. From the plot of qe vs. lnCe, BT and KT can be calculated from the slopes and intercepts, respectively. The values of the Temkin adsorption heat constant and equilibrium binding constant were 5.28 (J/mol) and 4.07 (L mg−1), respectively.
The Dubinin–Radushkevich (D–R) model is a more general model in which assumptions are not based on homogenous surfaces or constant adsorption potential. The D–R isotherm model was developed to account for the effect of the porous structure of the adsorbents, and it gives insight into the biomass porosity as well as the adsorption energy [42]. This model is applied to estimate the mean free energy of adsorption per mole of the adsorbate (E, kJ mol−1) and provides information to find out the type of adsorption, i.e., physical or chemical adsorption.
A linear graph of the D–R isotherm was obtained with a correlation coefficient of R2  =  0.97 when plotted between ε2 and lnqe (mmol/g). Table 2 also shows the results of the D–R adsorption model. E values were found to be 8.83 (kJ/mol), illustrating that the adsorption process is influenced by chemical ion exchange. The positive value of E indicates that the sorption process is endothermic, and a higher solution temperature would favor the sorption process.

3.4. Kinetic Experiments for the KOH-Modified Hydrochar

Kinetic study is an important physicochemical assessment for the basic traits of adsorbent quality [43].
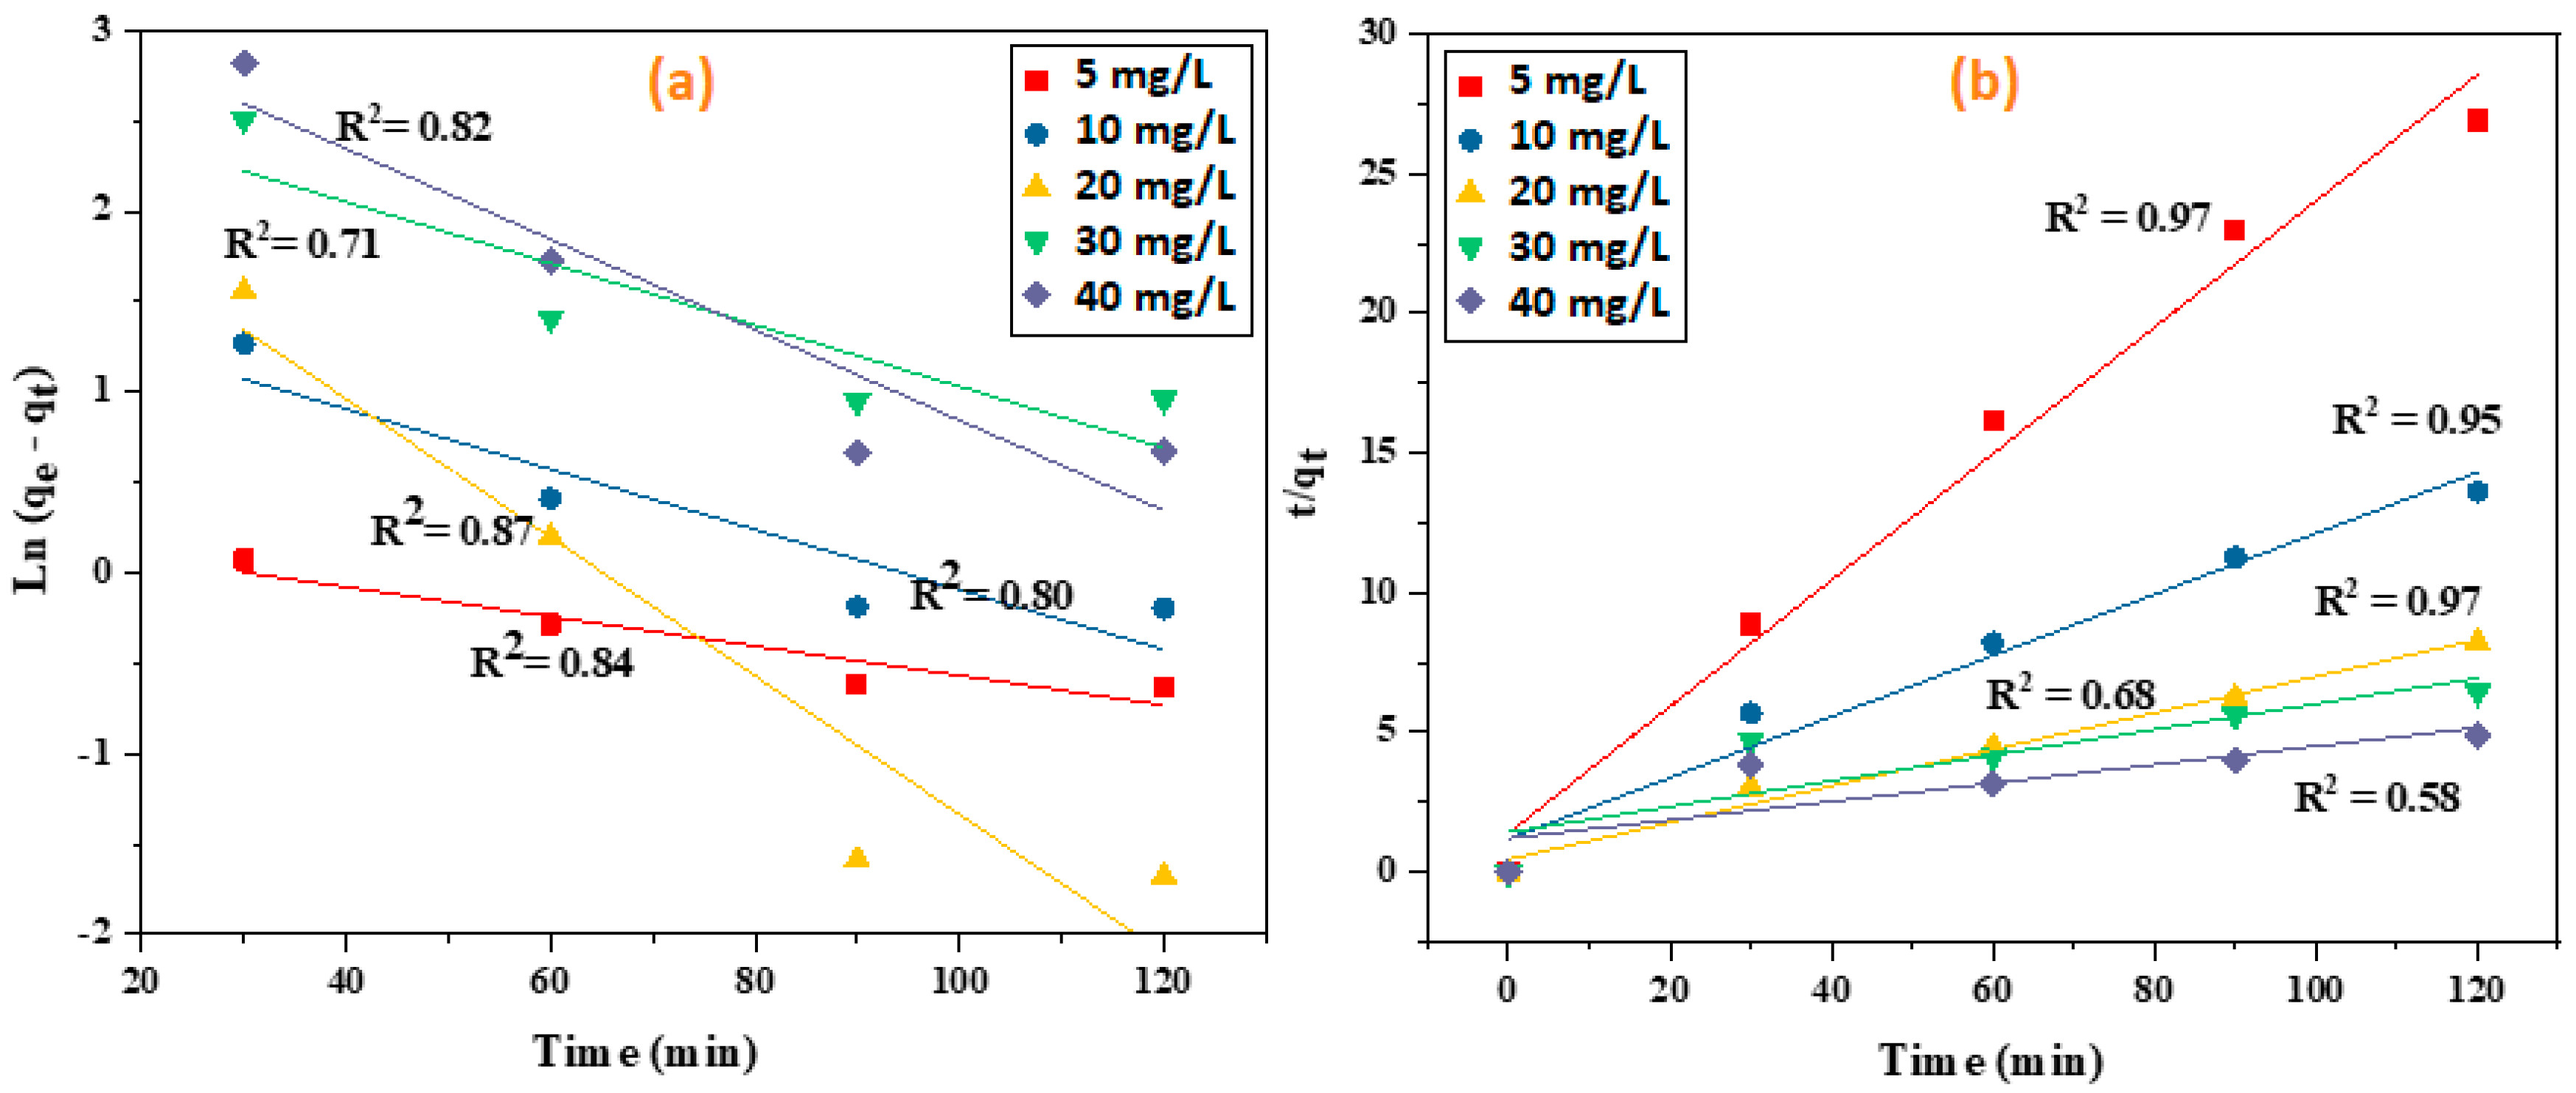
The calculated fitting parameters of pseudo-first- and pseudo-second-order kinetics are presented in Table 3, and model fitting curves are illustrated in Figure 7. The kinetic fitting parameters indicated that the pseudo-second-order kinetic model was more suitable for demonstrating the adsorption performance of the samples on HCKOH, as it shows higher R2 values than the pseudo-first-order kinetic model and better describes the adsorption behavior of the synthesized adsorbent. Therefore, the above results suggest that chemisorption might play a dominant role in adsorption reactions [44].

3.5. Characterization of the 0.1 M KOH-Modified Hydrochar

Table 4 presents the concentrations of organic compounds in hydrochar. The analysis of sugars in the sample showed that glucose was present at a concentration of 0.10 g/kg DM. Sucrose was also detected, albeit at a lower concentration of 0.03 g/kg DM. Traces of fructose were found, with a concentration of 0.01 g/kg DM. In terms of acids, lactic acid was the most abundant, with a concentration of 3.81 g/kg DM. Acetic acid was also present, at a concentration of 1.44 g/kg DM. Formic acid was slightly lower, with a concentration of 1.27 g/kg DM. The higher concentration of lactic acid compared to acetic and formic acids in the sample can be attributed to the presence of KOH during the process [30]. Among the aromatics, a significant presence of HMF (hydroxymethylfurfural) was detected, with a concentration of 4.70 g/kg DM. Furfural was found in smaller amounts, at a concentration of 0.45 g/kg DM. Phenol, catechol, and cresol were below the detection limit of the instrument used for analysis. Guaiacol, another aromatic compound, was present in the sample but at a relatively low concentration of 0.14 g/kg DM.
The results obtained for hydrochar analysis are presented in Table 5. Hydrochar composition is characterized by carbon (C%), hydrogen (H%), nitrogen (N%), sulfur (S%), oxygen (O%), ash content (ash%), hydrogen-to-carbon ratio (H/C), oxygen-to-carbon ratio (O/C), higher heating value (HHV) in (MJ/kg), and the specific surface area determined by the Brunauer–Emmett–Teller method (BET) in square meters per gram (m²/g). In terms of elemental composition, the hydrochar sample contained 52.19% carbon (C), 3.37% hydrogen (H), 0.1% nitrogen (N), 0.15% sulfur (S), and 35.66% oxygen (O%). The ash content in the sample was 8.50%. The obtained results align with the findings reported in the publication [30]. The recorded (O/C) ratio of 0.51 shows a shift towards humification as reported in [30], implying the influence of KOH addition during the hydrochar production process. This addition facilitated a series of chemical reactions that promote the transformation of biomass components into more condensed and complex structures resembling humic substances. The higher heating value (HHV) of the hydrochar was determined to be 21.37 MJ/kg. Additionally, the specific surface area of the hydrochar, as measured by the BET method, was found to be 11.54 m²/g.
Table 6 presents the concentrations of major ICP elements in the hydrochar. The hydrochar demonstrates noteworthy levels of certain elements, with particularly high values observed for calcium (875.72 mg/kg DM), aluminum (430.16 mg/kg DM), sulfur (365.11 mg/kg DM), iron (357.57 mg/kg DM), and potassium (295.35 mg/kg DM). The high concentrations of Ca, Al, S, and Fe in the hydrochar are likely derived from the biomass and could potentially accumulate within it. Additionally, other trace elements such as magnesium (176.10 mg/kg DM) and phosphorus (38.49 mg/kg DM) are also present at significant concentrations.
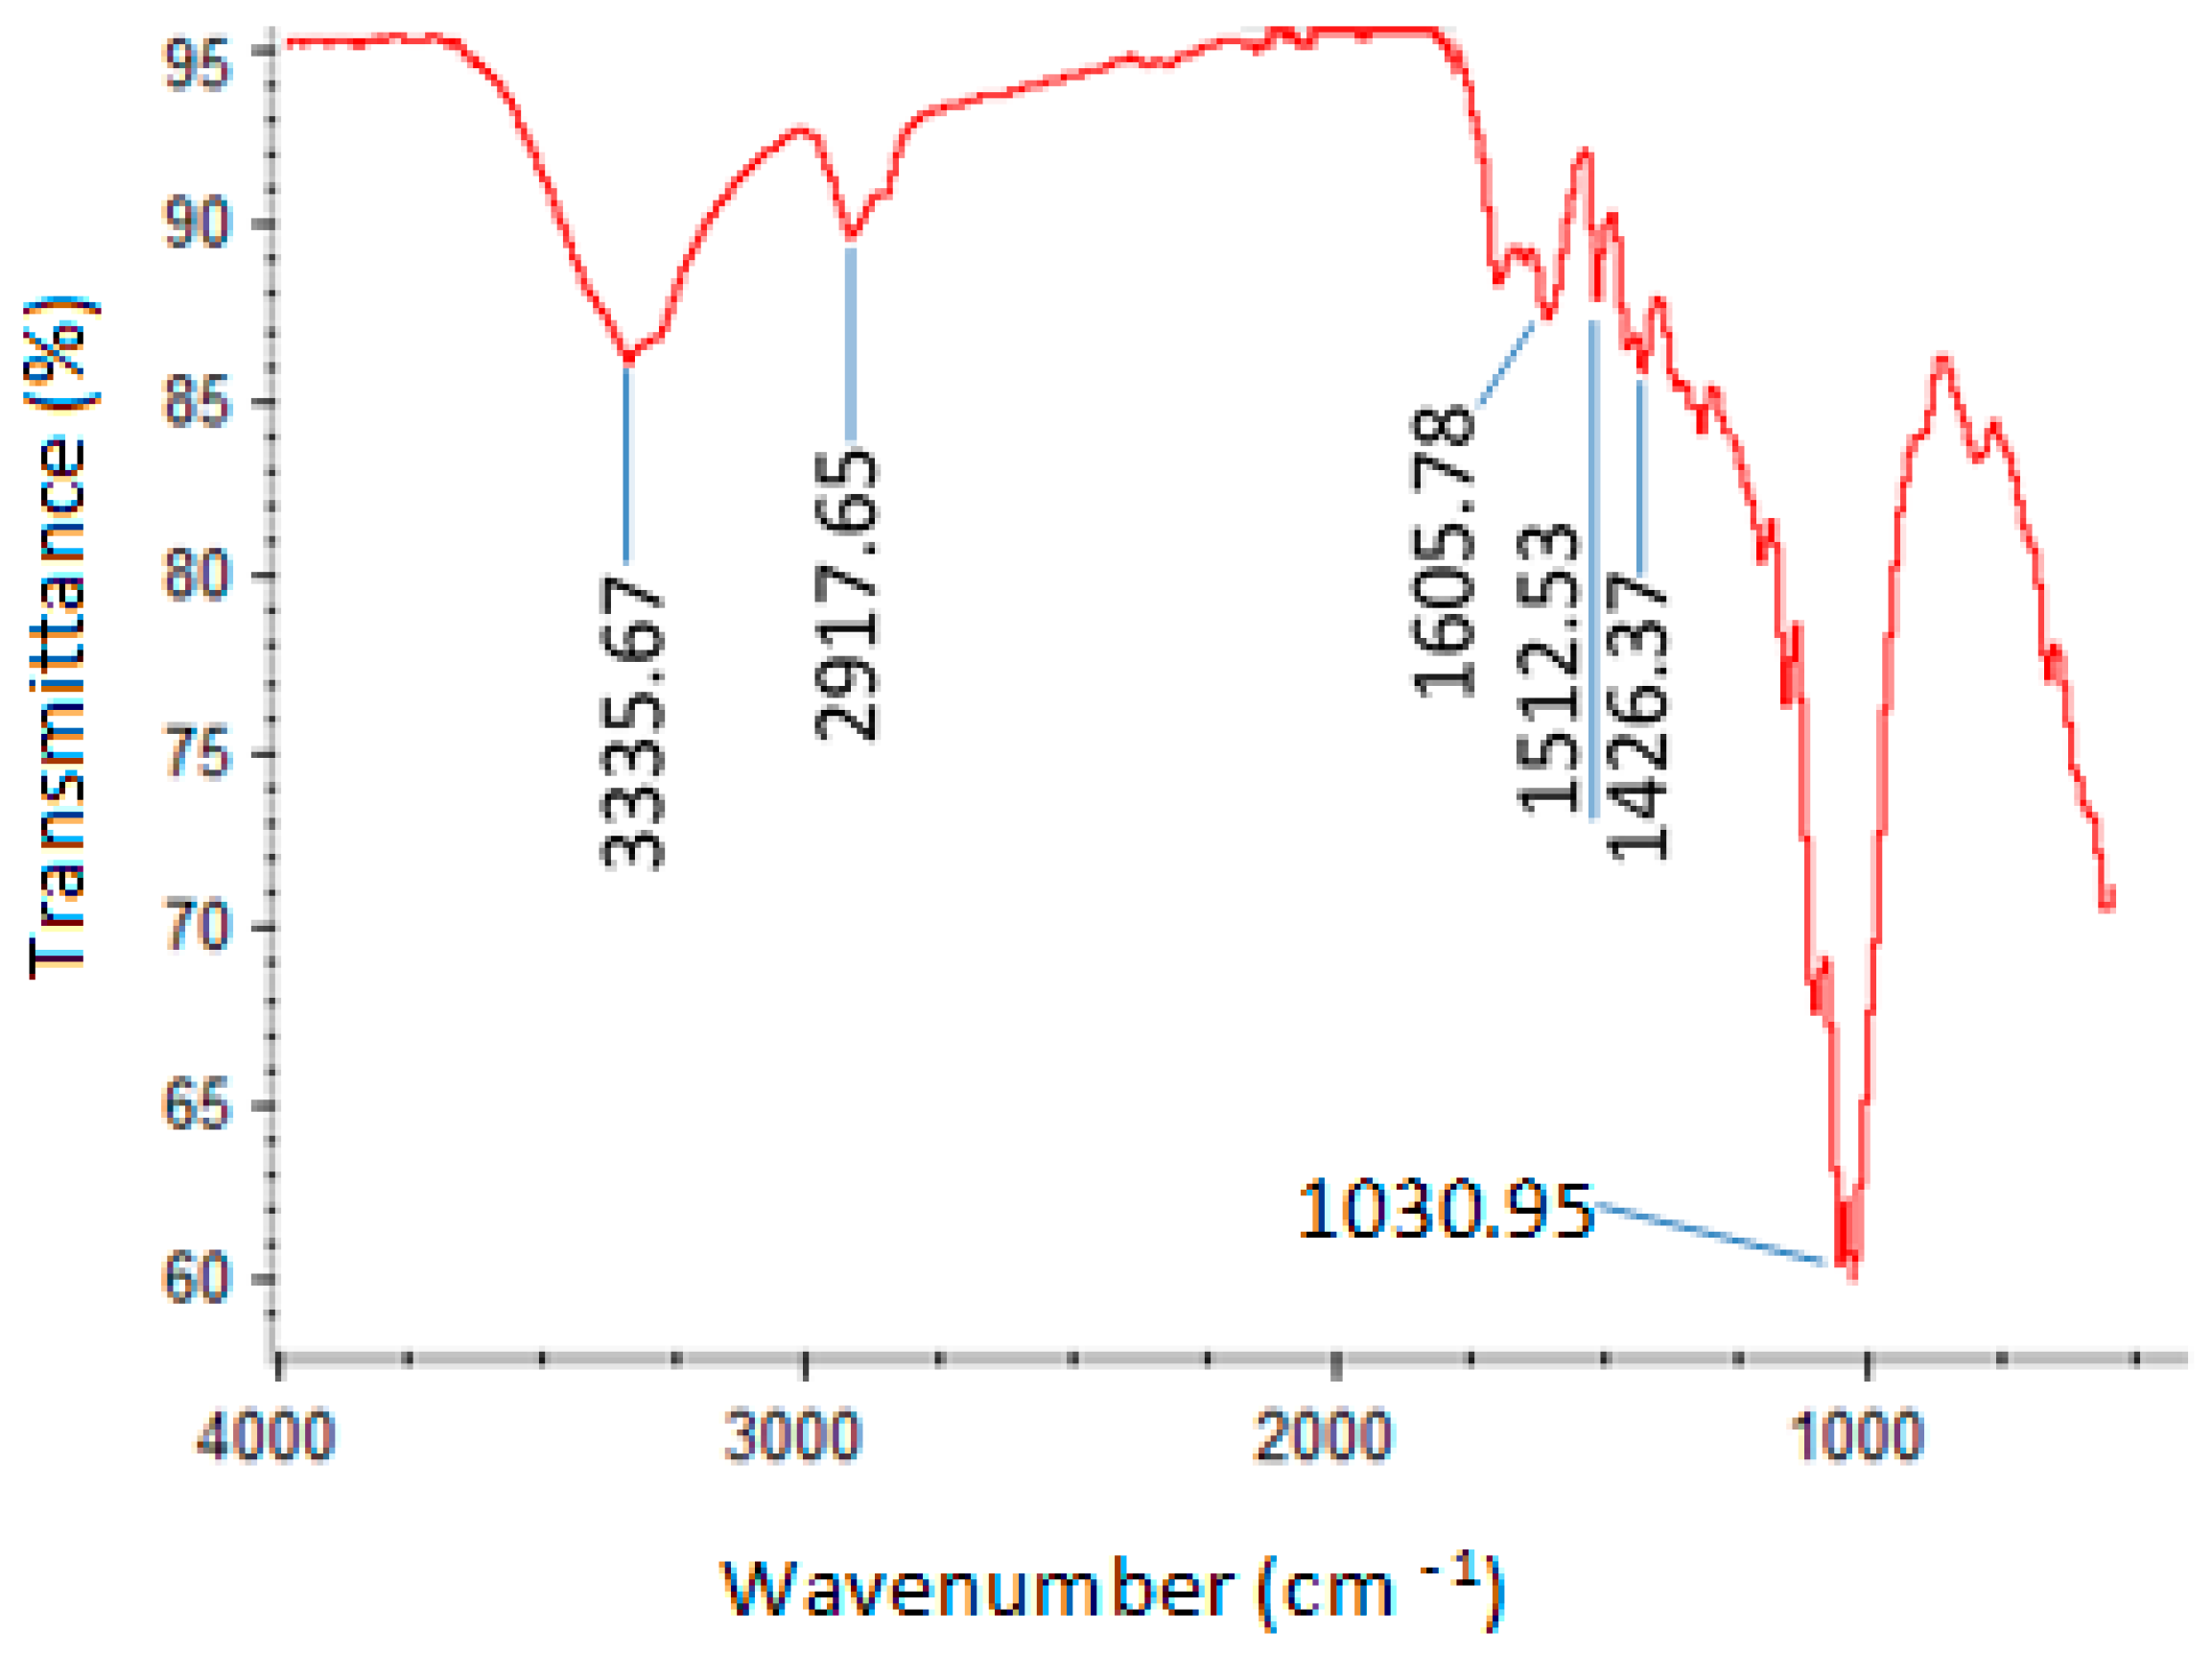
Figure 8 exhibits the FTIR spectrum of the hydrochar, offering insights into its chemical composition and functional groups. Prominent peaks observed at 3335.67 cm−1 indicate the presence of hydroxyl (OH) groups, while the band at 2917.65 cm−1 suggests aliphatic C-H bonds [30]. A weak peak at 1605.78 cm−1 signifies aromatic C=C stretching vibrations, with an additional peak at 1512.23 cm−1 indicating C=C bonds in aromatic compounds. The presence of C-O stretching vibrations is evident from the band at 1030.95 cm−1, possibly indicating alcohol, phenol, ether, or ester groups in the hydrochar.
The elemental composition of the hydrochar, as determined by the energy-dispersive X-ray (EDX) method (Figure 9), shows a significant agreement in terms of carbon content (C%) when compared to the values obtained from the ultimate analysis presented in Table 5. The presence of a spherical-like solid structure observed in the hydrochar, as depicted in the SEM photos, suggests the occurrence of polycondensation reactions involving furans, specifically HMF and furfural, leading to the formation of secondary hydrochar on the surface of the primary hydrochar. However, despite the addition of KOH during the process, the relatively high concentration of HMF and the measured pH of the hydrochar indicate that the amount of KOH utilized was insufficient to effectively prevent the formation of secondary spherical-like hydrochar structures (Table 5).

3.6. Neural Network Modeling (NN)

Figure 10 depicts the comparison between the actual and predicted MB removal using NN models. As can be seen here and reported in the Materials and Methods section, the NN with the TanH method was used as the structure of the hidden layer, and the 15 neurons used in this layer gave the highest accuracy for both training and validation. This model exhibited high accuracy in predicting the adsorption of MB, with R2 values of 0.95 for training and 0.96 for validation. The Gaussian method showed the same accuracy (R2 = 0.95) for training while showing lower accuracy for the validation dataset (R2 = 0.88).
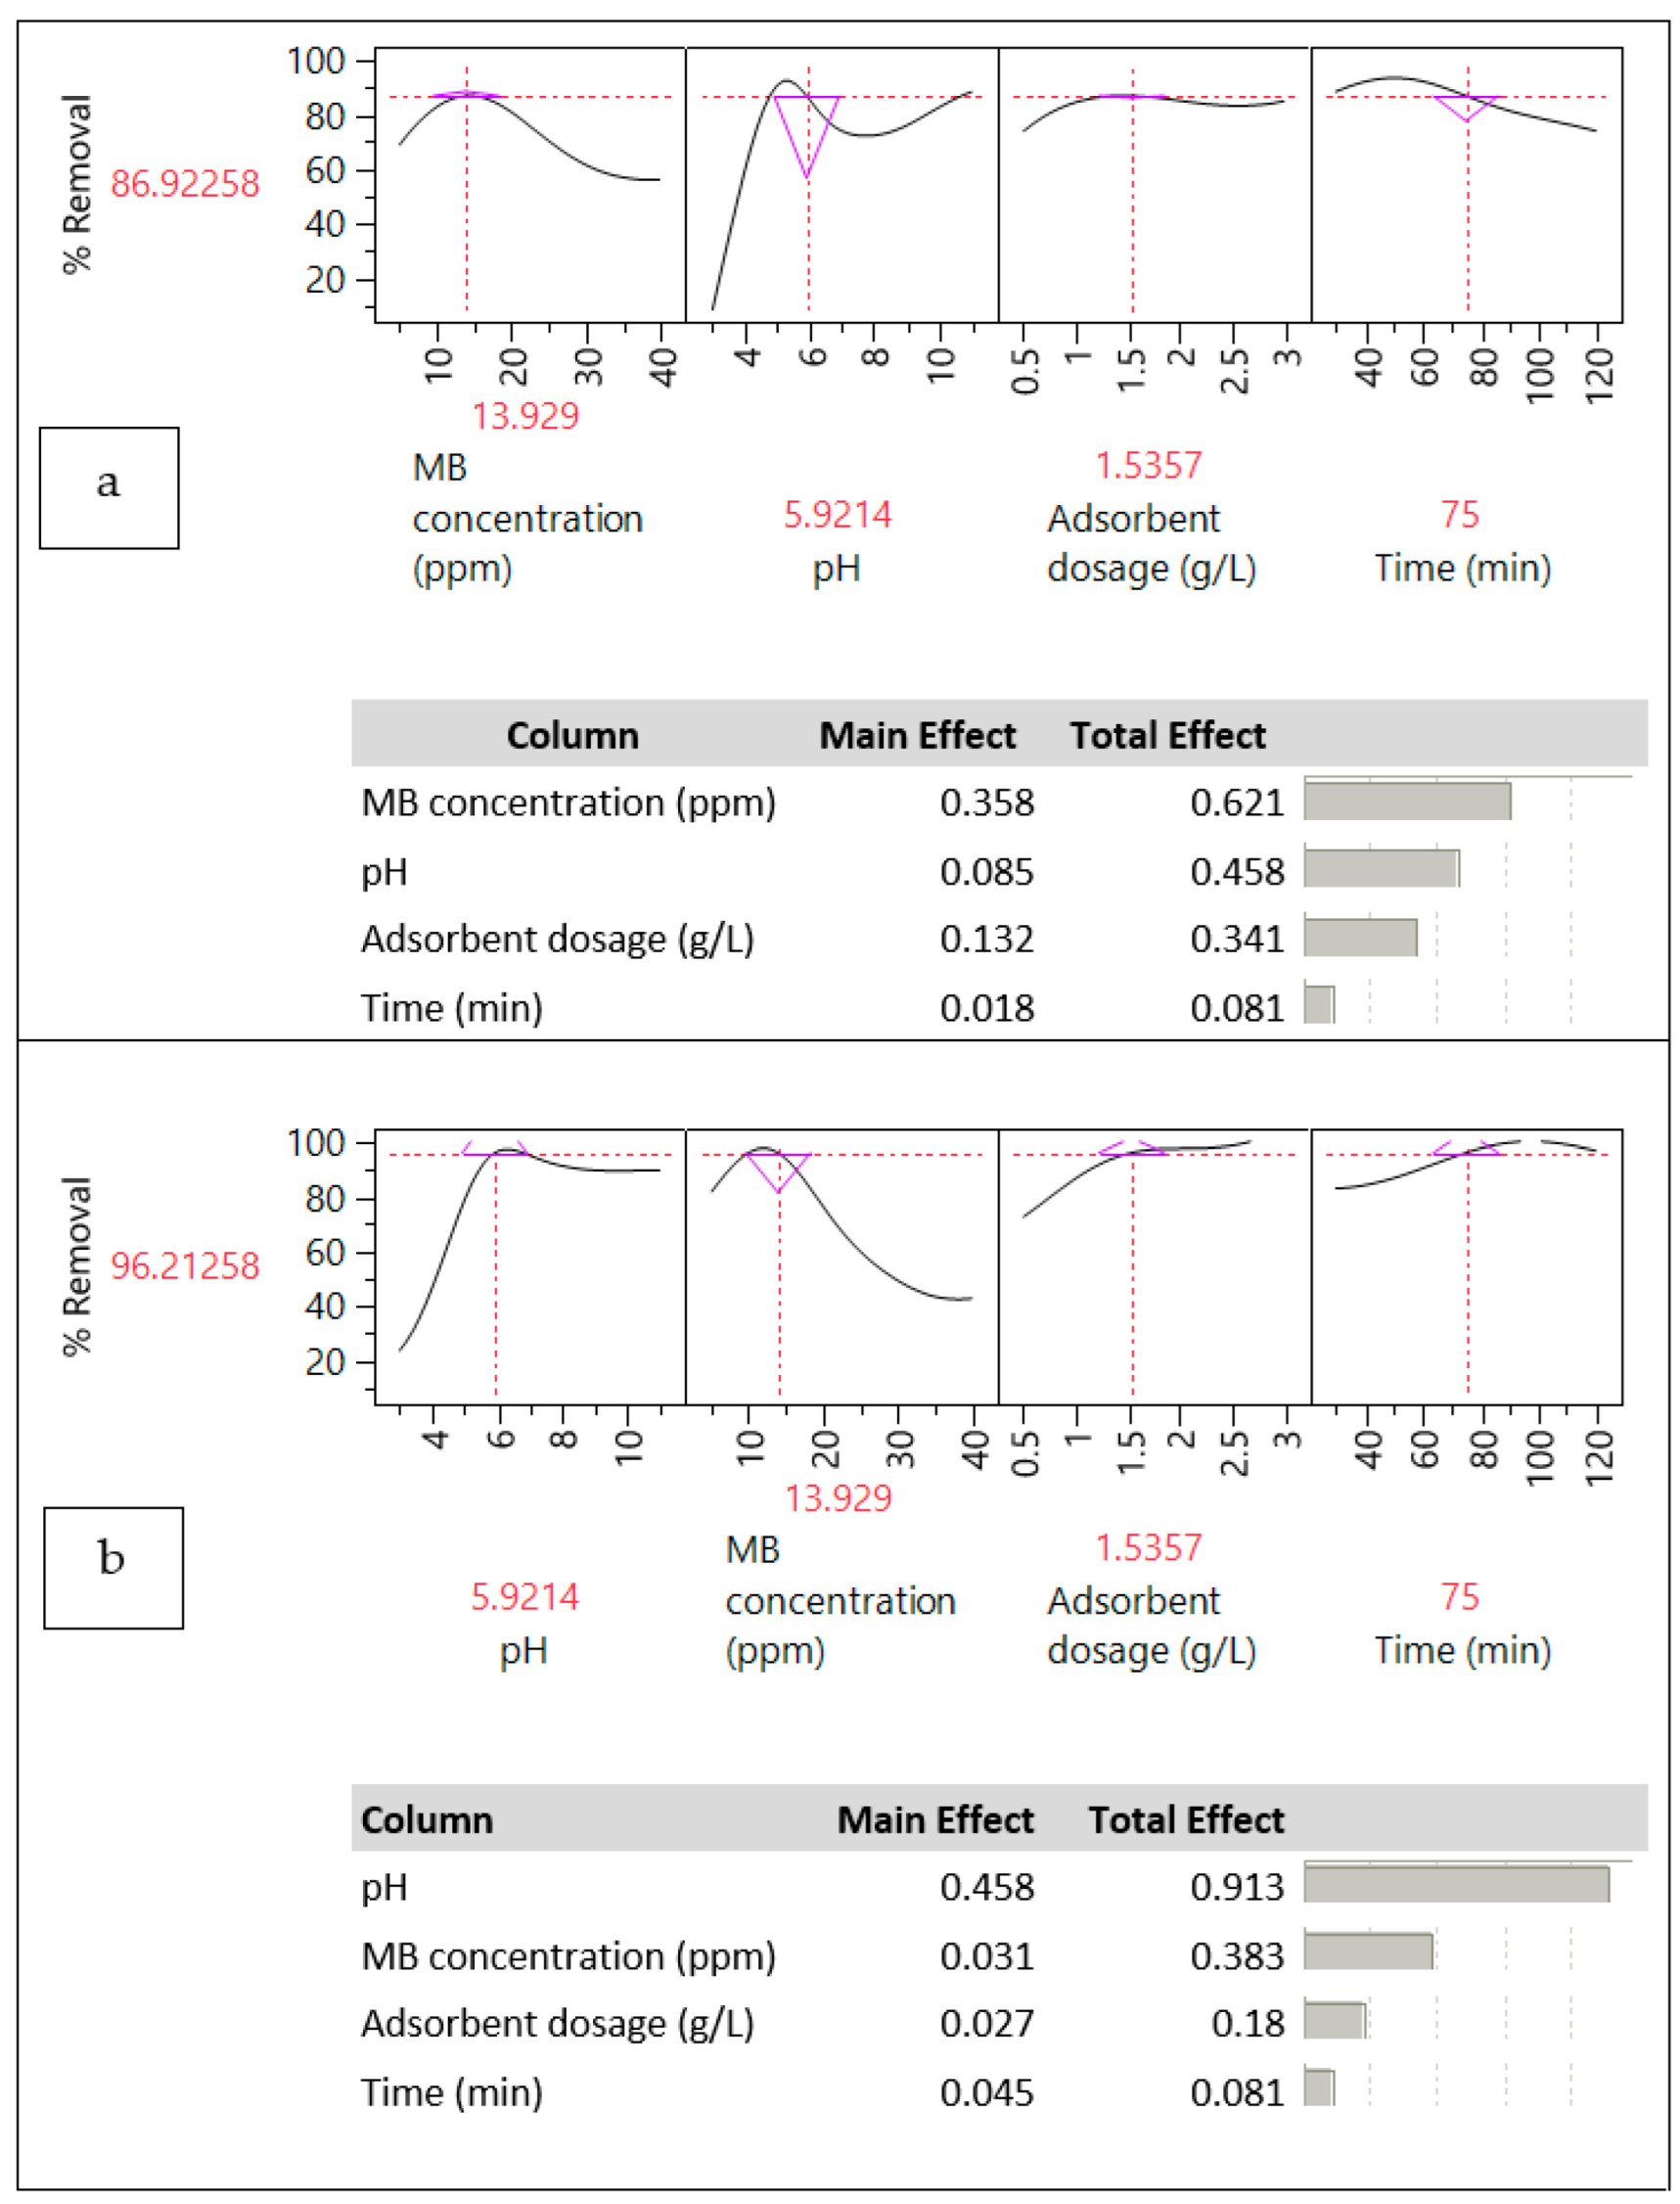
By utilizing the TanH model, optimal conditions for adsorption were determined, including an MB concentration of 13.93 ppm, a pH of 5.92, an adsorbent dose of 1.54 g/L, and a contact time of 75 min (Figure 11a). The main effect analysis highlights the relative contributions of individual factors when considered independently, while the total effect demonstrates their combined impact on removal efficiency (Figure 11a). The results demonstrate that the concentration of MB had the most substantial impact on the predicted removal, followed by pH, adsorbent dosage, and contact time. Similarly, the Gaussian model (Figure 11b) yielded the same optimized condition. However, the sensitivity analysis of this model reveals that pH had the greatest influence on the predicted removal, followed by MB concentration, adsorbent dosage, and contact time. These findings enable the estimation of MB adsorption under specific conditions within the scope of the conducted experiments.

4. Conclusions

This study focused on the production of hydrochar from wheat straw as an inexpensive adsorbent to remove MB from aqueous solutions. The 0.1 M HCKOH showed the highest adsorption capacity and 85% MB removal efficiency during 120 min. Moreover, ANN modeling results indicated that the concentration of MB had the most substantial impact on the predicted removal, followed by pH, adsorbent dosage, and contact time. The elemental composition of the produced hydrochar showed 52.19% carbon content and a shift towards humification, implying the effects of KOH modification. In conclusion, this study demonstrates the possibility of converting wheat straw, an agricultural waste, to an adsorbent for MB dyes. This study confirms that the HTC process improves key chemical and physical characteristics of the hydrochars compared to the original biomass and presents a major prospect for further research on the adsorption of wastewater using the KOH-modified hydrochar.

Author Contributions

S.K.: Execution of the experiments and initial draft of the manuscript; N.M.: Conceptualization and methodology; N.A. and K.G.: analysis; A.M.: conceptualization, methodology, investigation, and writing the original draft of the manuscript. All authors have read and agreed to the published version of the manuscript.

Funding

Research reported in this publication was supported by the Elite Researcher Grant Committee under award number [4000202] from the National Institutes for Medical Research Development (NIMAD), Tehran, Iran.

Data Availability Statement

All data generated or analyzed during this study are included in this published article.

Acknowledgments

We are grateful to the National Institutes for Medical Research Development for financial support and also to Kurdistan University of Medical Sciences for technical and equipment support.

Conflicts of Interest

The authors declare no conflict of interest.

References

  1. Park, J.-H.; Ok, Y.S.; Kim, S.-H.; Cho, J.-S.; Heo, J.-S.; Delaune, R.D.; Seo, D.-C. Competitive adsorption of heavy metals onto sesame straw biochar in aqueous solutions. Chemosphere 2016, 142, 77–83. [Google Scholar] [CrossRef]
  2. Jung, K.-W.; Ahn, K.-H. Fabrication of porosity-enhanced MgO/biochar for removal of phosphate from aqueous solution: Application of a novel combined electrochemical modification method. Bioresour. Technol. 2016, 200, 1029–1032. [Google Scholar] [CrossRef] [PubMed]
  3. Farhan Hanafi, M.; Sapawe, N. A review on the water problem associate with organic pollutants derived from phenol, methyl orange, and remazol brilliant blue dyes. Mater. Today Proc. 2020, 31, A141–A150. [Google Scholar] [CrossRef]
  4. Zhou, F.; Li, K.; Hang, F.; Zhang, Z.; Chen, P.; Wei, L.; Xie, C. Efficient removal of methylene blue by activated hydrochar prepared by hydrothermal carbonization and NaOH activation of sugarcane bagasse and phosphoric acid. RSC Adv. 2022, 12, 1885–1896. [Google Scholar] [CrossRef]
  5. Tkaczyk, A.; Mitrowska, K.; Posyniak, A. Synthetic organic dyes as contaminants of the aquatic environment and their implications for ecosystems: A review. Sci. Total Environ. 2020, 717, 137222. [Google Scholar] [CrossRef] [PubMed]
  6. Santoso, E.; Ediati, R.; Kusumawati, Y.; Bahruji, H.; Sulistiono, D.O.; Prasetyoko, D. Review on recent advances of carbon based adsorbent for methylene blue removal from waste water. Mater. Today Chem. 2020, 16, 100233. [Google Scholar] [CrossRef]
  7. Morin-Crini, N.; Lichtfouse, E.; Fourmentin, M.; Ribeiro, A.R.L.; Noutsopoulos, C.; Mapelli, F.; Fenyvesi, É.; Vieira, M.G.A.; Picos-Corrales, L.A.; Moreno-Piraján, J.C.; et al. Removal of emerging contaminants from wastewater using advanced treatments. A review. Environ. Chem. Lett. 2022, 20, 1333–1375. [Google Scholar] [CrossRef]
  8. Söğüta, E.G.; Ergana, E.; Kılıçb, N.Ç.; Dönmezb, H.; Akbaşb, E. Methylene blue adsorption from aqueous solution by functionalized perlites: An experimental and computational chemistry study. Desalin. Water Treat. 2021, 217, 391–410. [Google Scholar] [CrossRef]
  9. Deng, J.; Liu, Y.; Liu, S.; Zeng, G.; Tan, X.; Huang, B.; Tang, X.; Wang, S.; Yan, Z. Competitive adsorption of Pb (II), Cd (II) and Cu (II) onto chitosan-pyromellitic dianhydride modified biochar. J. Colloid Interface Sci. 2017, 506, 355–364. [Google Scholar] [CrossRef]
  10. Tan, X.; Liu, Y.; Zeng, G.; Wang, X.; Hu, X.; Gu, Y.; Yang, Z. Application of biochar for the removal of pollutants from aqueous solutions. Chemosphere 2015, 125, 70–85. [Google Scholar] [CrossRef]
  11. Shan, D.; Deng, S.; Zhao, T.; Wang, B.; Wang, Y.; Huang, J.; Yu, G.; Winglee, J.; Wiesner, M.R. Preparation of ultrafine magnetic biochar and activated carbon for pharmaceutical adsorption and subsequent degradation by ball milling. J. Hazard. Mater. 2016, 305, 156–163. [Google Scholar] [CrossRef]
  12. Maniscalco, M.P.; Volpe, M.; Messineo, A. Hydrothermal carbonization as a valuable tool for energy and environmental applications: A review. Energies 2020, 13, 4098. [Google Scholar] [CrossRef]
  13. Pauline, A.L.; Joseph, K. Hydrothermal carbonization of organic wastes to carbonaceous solid fuel—A review of mechanisms and process parameters. Fuel 2020, 279, 118472. [Google Scholar] [CrossRef]
  14. Wang, T.; Zhai, Y.; Zhu, Y.; Li, C.; Zeng, G. A review of the hydrothermal carbonization of biomass waste for hydrochar formation: Process conditions, fundamentals, and physicochemical properties. Renew. Sustain. Energy Rev. 2018, 90, 223–247. [Google Scholar] [CrossRef]
  15. Juela, D.M. Promising adsorptive materials derived from agricultural and industrial wastes for antibiotic removal: A comprehensive review. Sep. Purif. Technol. 2022, 284, 120286. [Google Scholar]
  16. Liu, Z.; Quek, A.; Balasubramanian, R. Preparation and characterization of fuel pellets from woody biomass, agro-residues and their corresponding hydrochars. Appl. Energy 2014, 113, 1315–1322. [Google Scholar] [CrossRef]
  17. Qian, W.-C.; Luo, X.-P.; Wang, X.; Guo, M.; Li, B. Removal of methylene blue from aqueous solution by modified bamboo hydrochar. Ecotoxicol. Environ. Saf. 2018, 157, 300–306. [Google Scholar] [CrossRef] [PubMed]
  18. Yang, X.; Wan, Y.; Zheng, Y.; He, F.; Yu, Z.; Huang, J.; Wang, H.; Ok, Y.S.; Jiang, Y.; Gao, B. Surface functional groups of carbon-based adsorbents and their roles in the removal of heavy metals from aqueous solutions: A critical review. Chem. Eng. J. 2019, 366, 608–621. [Google Scholar] [CrossRef] [PubMed]
  19. Ghanim, B.; O’dwyer, T.F.; Leahy, J.J.; Willquist, K.; Courtney, R.; Pembroke, J.T.; Murnane, J.G. Application of KOH modified seaweed hydrochar as a biosorbent of Vanadium from aqueous solution: Characterisations, mechanisms and regeneration capacity. J. Environ. Chem. Eng. 2020, 8, 104176. [Google Scholar] [CrossRef]
  20. Yudha, S.P.; Tekasakul, S.; Phoungthong, K.; Chuenchom, L. Green synthesis of low-cost and eco-friendly adsorbent for dye and pharmaceutical adsorption: Kinetic, isotherm, thermodynamic and regeneration studies. Mater. Res. Express 2019, 6, 125526. [Google Scholar] [CrossRef]
  21. Kim, U.-J.; Kimura, S.; Wada, M. Highly enhanced adsorption of Congo red onto dialdehyde cellulose-crosslinked cellulose-chitosan foam. Carbohydr. Polym. 2019, 214, 294–302. [Google Scholar] [CrossRef] [PubMed]
  22. Agbovi, H.K.; Wilson, L.D. Adsorption processes in biopolymer systems: Fundamentals to practical applications. Nat. Polym. Based Green Adsorbents Water Treat. 2021, 1, 1–51. [Google Scholar]
  23. Akrawi, H.S.Y.; Al-Obaidi, M.A.; Abdulrahman, C.H. Evaluation of Langmuir and Frendlich isotherm equation for Zinc Adsorption in some calcareous soil of Erbil province north of Iraq. IOP Conf. Ser. Earth Environ. Sci. 2021, 761, 012017. [Google Scholar] [CrossRef]
  24. Dawood, S.; Sen, T.K. Removal of anionic dye Congo red from aqueous solution by raw pine and acid-treated pine cone powder as adsorbent: Equilibrium, thermodynamic, kinetics, mechanism and process design. Water Res. 2012, 46, 1933–1946. [Google Scholar] [CrossRef]
  25. Muinde, V.M.; Onyari, J.M.; Wamalwa, B.; Wabomba, J.N. Adsorption of malachite green dye from aqueous solutions using mesoporous chitosan–zinc oxide composite material. Environ. Chem. Ecotoxicol. 2020, 2, 115–125. [Google Scholar] [CrossRef]
  26. Sumanjit; Rani, S.; Mahajan, R. Equilibrium, kinetics and thermodynamic parameters for adsorptive removal of dye Basic Blue 9 by ground nut shells and Eichhornia. Arab. J. Chem. 2016, 9, S1464–S1477. [Google Scholar] [CrossRef]
  27. Das, A.; Pal, A.; Saha, S.; Maji, S.K. Behaviour of fixed-bed column for the adsorption of malachite green on surfactant-modified alumina. J. Environ. Sci. Health Part A 2009, 44, 265–272. [Google Scholar] [CrossRef] [PubMed]
  28. Günay, A.; Arslankaya, E.; Tosun, I. Lead removal from aqueous solution by natural and pretreated clinoptilolite: Adsorption equilibrium and kinetics. J. Hazard. Mater. 2007, 146, 362–371. [Google Scholar] [CrossRef] [PubMed]
  29. Marzban, N.; Libra, J.A.; Hosseini, S.H.; Fischer, M.G.; Rotter, V.S. Experimental evaluation and application of genetic programming to develop predictive correlations for hydrochar higher heating value and yield to optimize the energy content. J. Environ. Chem. Eng. 2022, 10, 108880. [Google Scholar] [CrossRef]
  30. Tkachenko, V.; Marzban, N.; Vogl, S.; Filonenko, S.; Antonietti, M. Chemical insights into the base-tuned hydrothermal treatment of side stream biomasses. Sustain. Energy Fuels 2023, 7, 769–777. [Google Scholar] [CrossRef]
  31. Marzban, N.; Moheb, A.; Filonenko, S.; Hosseini, S.H.; Nouri, M.J.; Libra, J.A.; Farru, G. Intelligent modeling and experimental study on methylene blue adsorption by sodium alginate-kaolin beads. Int. J. Biol. Macromol. 2021, 186, 79–91. [Google Scholar] [CrossRef] [PubMed]
  32. Hunsom, M.; Autthanit, C. Adsorptive purification of crude glycerol by sewage sludge-derived activated carbon prepared by chemical activation with H3PO4, K2CO3 and KOH. Chem. Eng. J. 2013, 229, 334–343. [Google Scholar] [CrossRef]
  33. Kołodyńska, D.; Wnętrzak, R.; Leahy, J.; Hayes, M.; Kwapiński, W.; Hubicki, Z. Kinetic and adsorptive characterization of biochar in metal ions removal. Chem. Eng. J. 2012, 197, 295–305. [Google Scholar] [CrossRef]
  34. Muinde, V.M.; Onyari, J.M.; Wamalwa, B.; Wabomba, J.; Nthumbi, R.M. Adsorption of Malachite Green from Aqueous Solutions onto Rice Husks: Kinetic and Equilibrium Studies. J. Environ. Prot. 2017, 8, 215–230. [Google Scholar] [CrossRef]
  35. Zhang, J.; Cai, D.; Zhang, G.; Cai, C.; Zhang, C.; Qiu, G.; Zheng, K.; Wu, Z. Adsorption of methylene blue from aqueous solution onto multiporous palygorskite modified by ion beam bombardment: Effect of contact time, temperature, pH and ionic strength. Appl. Clay Sci. 2013, 83, 137–143. [Google Scholar] [CrossRef]
  36. Baek, M.H.; Ijagbemi, C.O.; Se-Jin, O.; Kim, D.S. Removal of Malachite Green from aqueous solution using degreased coffee bean. J. Hazard. Mater. 2010, 176, 820–828. [Google Scholar] [CrossRef]
  37. Kohzadi, S.; Marzban, N.; Libra, J.A.; Bundschuh, M.; Maleki, A. Removal of RhB from water by Fe-modified hydrochar and biochar—An experimental evaluation supported by genetic programming. J. Mol. Liq. 2023, 369, 120971. [Google Scholar] [CrossRef]
  38. Dada, A.O.; Olalekan, A.P.; Olatunya, A.M.; Dada, O.J. Langmuir, Freundlich, Temkin and Dubinin–Radushkevich isotherms studies of equilibrium sorption of Zn2+ unto phosphoric acid modified rice husk. IOSR J. Appl. Chem. 2012, 3, 38–45. [Google Scholar]
  39. He, Y.; Lin, X.; Yan, T.; Zhang, X.; Zhou, J.; Chen, Y.; Luo, X. Selective adsorption of uranium from salt lake-simulated solution by phenolic-functionalized hollow sponge-like adsorbent. J. Chem. Technol. Biotechnol. 2019, 94, 455–467. [Google Scholar] [CrossRef]
  40. He, T.; Zhou, X.; Bao, Z.; Fu, S.; Lin, X. Preparation of hydrochar by one-step hydrothermal carbonization with potassium ferrate-assisted activation for the removal of tetracycline in water. J. Chem. Technol. Biotechnol. 2023, 98, 2039–2050. [Google Scholar] [CrossRef]
  41. Inyinbor, A.A.; Adekola, F.A.; Olatunji, G.A. Kinetics, isotherms and thermodynamic modeling of liquid phase adsorption of Rhodamine B dye onto Raphia hookerie fruit epicarp. Water Resour. Ind. 2016, 15, 14–27. [Google Scholar] [CrossRef]
  42. Hu, Q.; Zhang, Z. Application of Dubinin–Radushkevich isotherm model at the solid/solution interface: A theoretical analysis. J. Mol. Liq. 2019, 277, 646–648. [Google Scholar] [CrossRef]
  43. Rind, I.K.; Memon, N.; Khuhawar, M.Y.; Soomro, W.A.; Lanjwani, M.F. Modeling of cadmium(II) removal in a fixed bed column utilizing hydrochar-derived activated carbon obtained from discarded mango peels. Sci. Rep. 2022, 12, 8001. [Google Scholar] [CrossRef]
  44. Peng, H.; Cao, J.; Xiong, W.; Yang, Z.; Jia, M.; Sun, S.; Xu, Z.; Zhang, Y.; Cai, H. Two-dimension N-doped nanoporous carbon from KCl thermal exfoliation of Zn-ZIF-L: Efficient adsorption for tetracycline and optimizing of response surface model. J. Hazard. Mater. 2020, 402, 123498. [Google Scholar] [CrossRef] [PubMed]
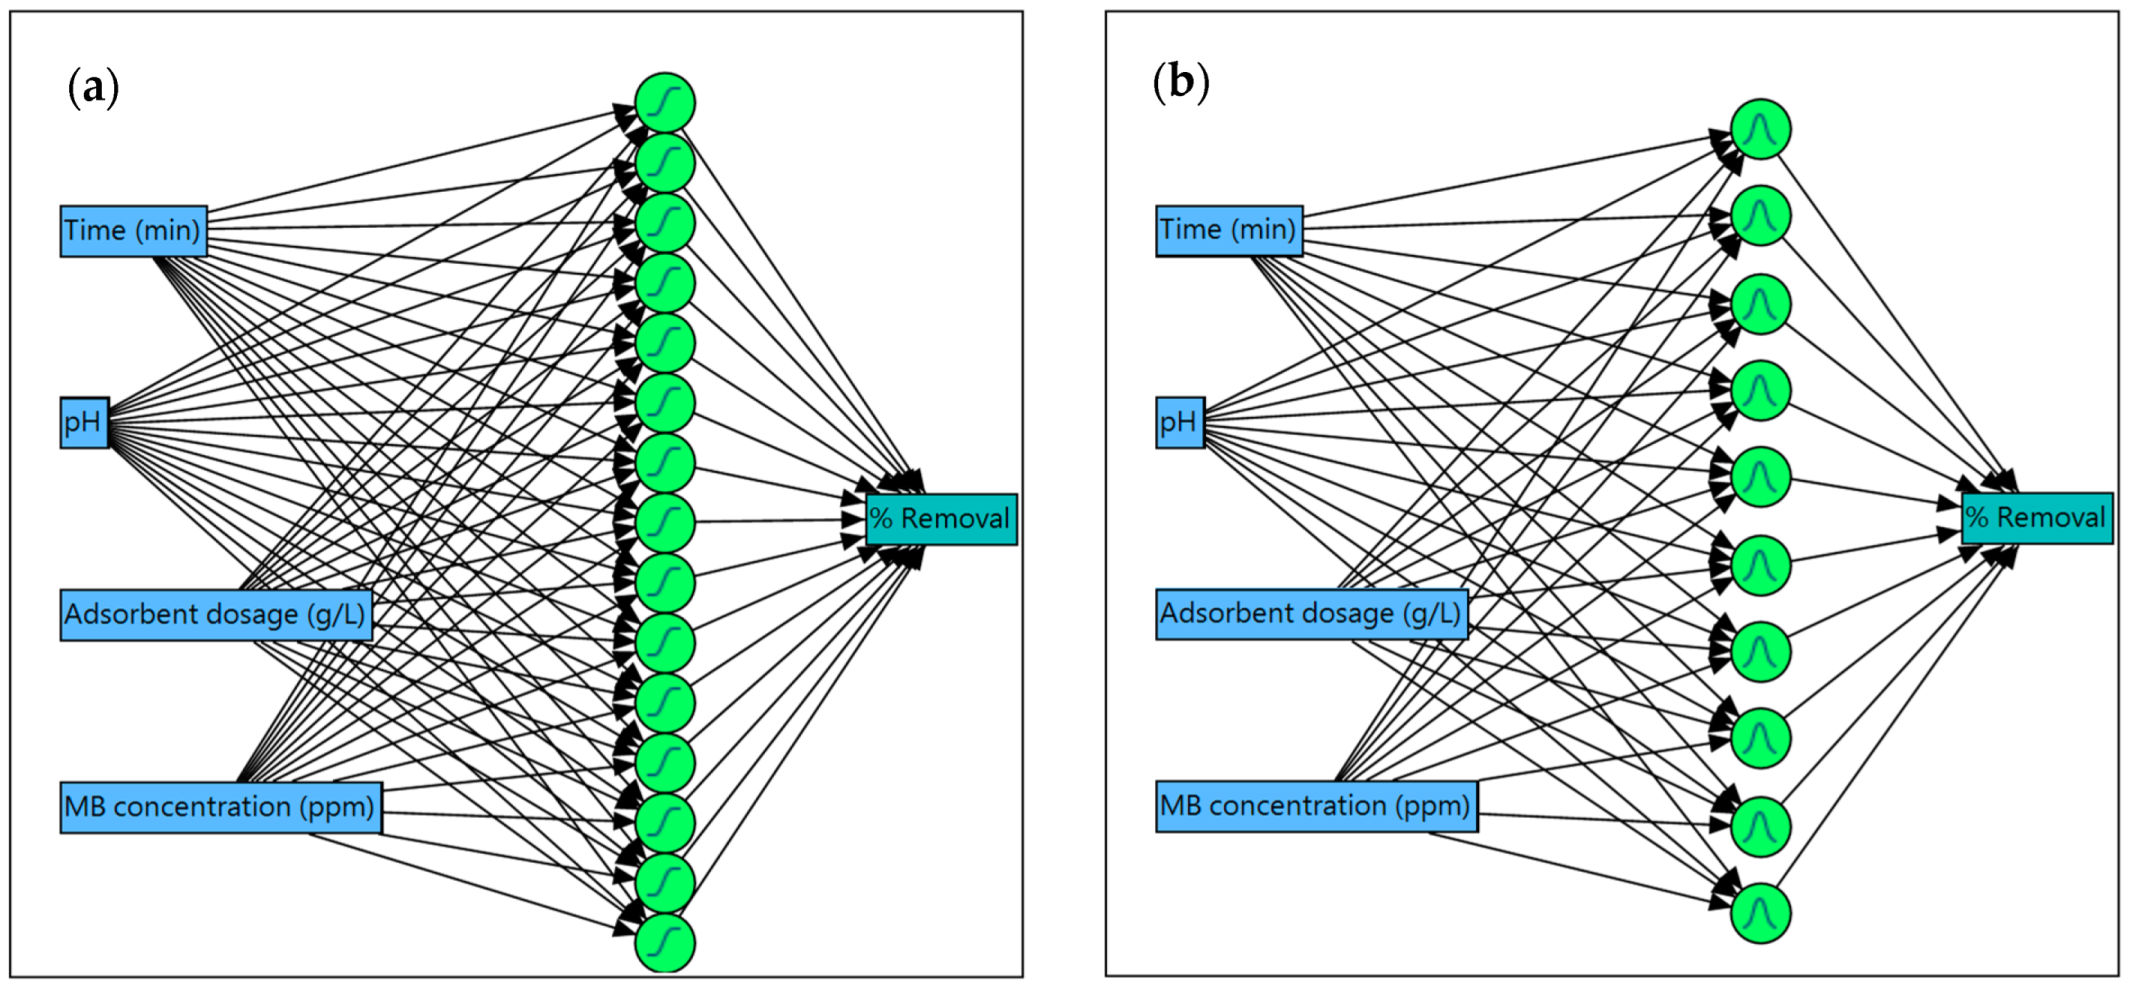
Figure 1. Structure of a neural network with one hidden layer using (a) TanH with 15 neurons and (b) Gaussian with 10 neurons.
Water 15 03220 g001
Figure 2. Plots of MB removal efficiency vs. time: (a) pure and modified hydrochar with ZnCl2, H3PO4, and KOH; (b) hydrochar modified with 0.1, 0.5, and 1 M KOH; (c) hydrochar prepared at different temperatures.
Water 15 03220 g002
Figure 3. Effect of pH on the MB removal efficiency by 0.1 M HCKOH.
Water 15 03220 g003
Figure 4. Effect of different hydrochar dosages (g/L) on MB removal efficiency by 0.1 M HCKOH.
Water 15 03220 g004
Figure 5. Plot of removal efficiency versus time at different MB concentrations. Experiments were run at 1 mg/L 0.1 M HCKOH for 120 min.
Water 15 03220 g005
Figure 6. Langmuir (a), Freundlich (b), Dubinin–Radushkevich (c), and Temkin (d) isotherms of MB adsorption on the 0.1 M HCKOH.
Water 15 03220 g006
Figure 7. (a) Pseudofirstorder and (b) pseudo-second-order kinetic models for the adsorption of MB by HCKOH.
Water 15 03220 g007
Figure 8. FTIR spectrum of the HCKOH used as an adsorbent.
Water 15 03220 g008
Figure 9. SEM and EDX analysis of the hydrochar, illustrating the morphological features and elemental composition of the sample.
Water 15 03220 g009
Figure 10. Comparison of actual and predicted MB removal for training and validation of (a) the NN model using the TanH method and (b) the NN model using the Gaussian method.
Water 15 03220 g010
Figure 11. Prediction profiler and sensitivity analysis: (a) TanH method; (b) Gaussian method.
Water 15 03220 g011
Table 1. Optimized number of neurons and their corresponding RMSE and R2.
GroupSampleTanHGaussian
Number of NeuronsRMSER2Number
of Neurons
RMSER2
Training36155.200.95105.040.95
Validation183.150.965.400.88
Table 2. Adsorption isotherm parameters of MB adsorption on 0.1 M HCKOH.
ModelsParametersValue
Langmuir
qmax (mg g−1)24.15
KL (L mg−1)0.42
R20.98
RL0.05–0.31
Freundlich model
KF6.77
n2.2
R20.96
D–R model
Q0 (mmol g−1)44.7
KD-R0.006
R20.97
E (KJ mol−1)8.83
Temkin model
B (J mol−1)5.288
KT (L g−1)4.07
BT468.5
R20.94
Table 3. Kinetic fitting parameters for the adsorption of MB on the HCKOH at different MB concentrations.
MB Conc.
mg L−1
qe,expPseudo-First OrderPseudo-Second Order
qe,cal
mg g−1
K1
min−1
R2qe,cal
mg g−1
K2
mg g1min−1
R2
54.461.27−0.00010.844.420.0360.97
108.814.80−0.00040.809.140.0090.95
2014.6212.06−0.00060.8715.380.0090.97
3018.6015.33−0.00020.7121.450.0010.68
4024.5128.210.00040.8230.300.00090.58
Table 4. Concentrations (g/kg DM) of sugars, acids, and aromatics in hydrochar.
Name of CompoundConcentration (g/kg DM)
SugarsGlucose0.10
Sucrose0.03
Fructose0.01
AcidsAcetic acid1.44
Lactic acid3.81
Formic acid1.27
AromaticsHMF4.70
Furfural0.45
Phenol-
Catechol-
Guaiacol0.14
Cresol-
Table 5. Composition and properties of the hydrochar.
pHC%H%N%S%O%Ash%H/CO/CHHV (MJ/kg)BET (m2/g)
4.0652.193.370.10.1535.668.500.780.5121.3711.54
Table 6. Hydrochar’s elements (mg/kg DM) measured by the ICP-OES method.
ElementConcentration mg/kg DMElementConcentration mg/kg DM
Al430.16Mg176.10
Ca875.72Mn7.87
Cd0.16P38.49
Co0.14Pb2.43
Cr39.76S365.11
Cu1.13Sn16.38
Fe357.57V1.39
K295.35Zn11.41
Disclaimer/Publisher’s Note: The statements, opinions and data contained in all publications are solely those of the individual author(s) and contributor(s) and not of MDPI and/or the editor(s). MDPI and/or the editor(s) disclaim responsibility for any injury to people or property resulting from any ideas, methods, instructions or products referred to in the content.