Article

Customer Complaints-Based Water Quality Analysis

Department of Information Systems Engineering, Kocaeli University, 41001 Kocaeli, Turkey
*
Author to whom correspondence should be addressed.
Water 2023, 15(18), 3171; https://doi.org/10.3390/w15183171
Submission received: 9 August 2023 / Revised: 29 August 2023 / Accepted: 30 August 2023 / Published: 5 September 2023
(This article belongs to the Special Issue Smart Technologies for Urban Water Systems)

Abstract

:
Social media has become a useful instrument and forum for expressing worries about various difficulties and day-to-day concerns. The pertinent postings containing people’s complaints about water quality as an additional source of information can be automatically acquired/retrieved and analyzed using natural language processing and machine learning approaches. In this paper, we search social media for a water quality analysis and propose a scalable messaging system for quality-related issues to the subscribers. We classify the WaterQualityTweets dataset, our newly collected collection, in two phases. In the first phase, tweets are classified into two classes (water quality-related or not). In the second phase, water quality-related issues are classified into four classes (color, illness, odor/taste, and unusual state). The best performance results are BERT and CNN, respectively, for binary and multi-class classification. Also, these issues are sent to different subscribers via a topic-based system with their location and timing information. Depending on the topics that online users are interested in, some information spreads faster than others. In our dataset, we also predict the information diffusion to understand water quality issues’ spreading. The time and effort required for manual comments obtained through crowd-sourcing techniques will significantly decline as a result of this automatic analysis of water quality issues.

1. Introduction

Customer complaints can be a useful tool for spotting issues in a distribution system as soon as they arise. These complaints may reveal more serious structural difficulties with the distribution system, such as those related to product quality, delivery challenges, or customer service problems. Organizations can enhance their distribution networks and better serve their customers by proactively resolving these problems. Organizations can also find patterns and trends by monitoring and analyzing client complaints, which enables them to make data-driven decisions to enhance their distribution procedures [1,2].
Customer complaints about smart city infrastructures might vary and can involve a wide range of technologies and services. Customers frequently complain about the following categories of smart city infrastructures [3,4]: (i) Technical problems: interruptions, system flaws, or sluggish response times. (ii) Concerns about privacy arising from the acquisition, usage, and storage of personal data by smart city technologies. (iii) Cost: Customers may be dissatisfied with the price of smart city services or the effect that such initiatives have on their electricity and tax bills. (iv) Usability: Users of smart city technology or services may find them difficult to use, inconvenient, or hard to access. (v) Accessibility: Users may believe that not all areas of the city or all citizens have access to certain smart city technologies or services. (vi) Equity: Users may believe that some groups of individuals, such as the elderly, low-income inhabitants, or people with disabilities, are not adequately served by smart city services or are unable to access them. (vii) Security: Clients may be concerned about the safety of smart city technology and the protection of their personal data. It is possible to ensure that smart city infrastructures are created and implemented in a way that benefits all inhabitants and satisfies their requirements and expectations by addressing these kinds of consumer complaints [5,6].
Water distribution networks as a smart city infrastructure [7,8,9] are an example of distribution systems. Water is distributed from a source, such as a treatment plant, to customers, such as homes, companies, and public facilities, using networks of pipes, valves, pumps, and storage tanks. These networks are made to make sure that clients receive clean drinking water in a safe, effective, and consistent manner [10]. A network of primary pipes, service connections, and auxiliary infrastructure, including pressure-regulating facilities, storage facilities, and fire hydrants, are often included. For the public’s health, safety, and economic growth, a water distribution network’s quality and dependability are essential. Water utilities have a major duty to maintain and manage these systems [11,12]. It is vital to monitor the water quality of these networks and alert the related units by sensing customer complaints on social media.
A measure of the physical, biological, and chemical characteristics of water is its quality. Natural disasters like earthquakes, terrorist attacks, or human-made pollution can change the chemistry of water. Water corporations now utilize pollution warning systems to regulate the quality of drinking water. They use these systems to continuously monitor the pertinent environmental data and water quality at multiple measurement locations utilizing various sensors. In other words, it has been found that many of the water quality parameters are measured and monitored in real-world institutions with water-management systems, but they are not analyzed collectively at the point of determining the water quality, and observations are made by looking at a select number of determined parameters one at a time [13]. To accurately report changes in water quality, the existing systems also require a monitoring system that evaluates all measurement parameters based on measured values collectively. In other words, a fundamental necessity for the provision of clean and safe drinking water is a sufficient and accurate warning system that enables the early identification of any changes [14].
Water quality monitoring in a distribution system is a delicate and extraordinarily complex procedure affected by many variables. Because of the changing water quality data coming from multiple sources and treatment facilities as well as the variety of water paths in the system, it is impossible to predict the water quality at a specific stage in the system’s life. Because the data created are inconsistent with one another, there is also a lot of data pollution. Therefore, there needs to be some standardization to ensure comparability in the data generated. The institutional capacity for data collection, storage, and analysis at the local level is insufficient when problems with duplicate data generation, water-related data production processes, and data sharing are present. Effective log/data management in water-management systems is required in this case [15]. The primary concerns with the creation and use of data connected to water around the world also include the difficulty in accessing data in digital contexts and similar problems.
Where and how the water is used (such as for drinking water, industry, agriculture, and the energy sector) as well as where the water originates (rivers, lakes, coastal/transitional waters, and subsurface waters) are important factors in establishing water quality standards. When determining the quality of water to be used for agriculture, factors like salinity and ion toxicity are involved; however, when determining the quality of water to be used for drinking, factors like the water’s pH ratio, the amount of chlorine, and the dissolved oxygen should be considered. Risk assessments are conducted during the water quality management stage to determine the potential consequences of contaminants in water resources on aquatic ecosystems and human health as well as the analysis, rating, and necessary mitigation actions. General water quality standards [16] are established globally for water resources to reach a satisfactory degree of quality. The Environmental Protection Agency (EPA (https://www.epa.gov/), accessed on 30 June 2023) has intensified efforts to develop robust, exhaustive, and fully integrated surveillance and monitoring systems, including information on the quality of the world’s water supplies, that enable the early detection and awareness of diseases, pests, and hazardous substances. In this direction, environmental quality standards for EU-priority pollutants for water quality in water-management systems and for country-specific pollutants have been established in relation to the World Health Organization (WHO). The first edition of the Guidelines for Drinking-Water Quality (GDWQ) [17], which was released in 1958, serves as the international standard for establishing local and national water quality regulations. The GDWQ includes an evaluation of the health risks posed by various microbial, chemical, radiological, and physical contaminants that may be present in drinking water. Drinking water quality is typically assessed using several different metrics in the literature. Considering the information on water quality previously indicated, the proposed system depends on utility customers’ communication concerning indicators of water pollution, particularly odd flavor, odor, or appearance. It senses tweets and alerts when it catches water quality-related comments. Our system’s advantages include crisis communication during emergencies, two-way communication with customers and water service providers, and the identification of problems with water quality. Along with solutions such as direct communication with authority, sensors, measuring instruments, etc., the use of social media (as a supporter) is one of the solutions. Our daily lives now heavily involve social media. Social networking is a tool that many businesses and organizations use to better understand the consumer experience, handle emergencies, and boost security [18,19]. Water utilities can use social media as an extra tool for communication to connect with customers, handle customer issues, and support water quality management. Utility companies can use customer complaints to promptly address problems with water quality by using social listening, which is the act of comprehending and analyzing relevant keywords and hashtags. When many call center measures are complex formulae and it is challenging to properly articulate how changes are being achieved, this change in thinking for reporting problems is simple to quantify. Improvements in utility operation and customer service are evident when comparing the number of incidents reported via social media against the call center. The use of social media for monitoring is a customary practice worldwide. For instance, East Bay Municipal Utility District (EBMUD) used Cal State East Bay’s six-month certification program to train its workers in social media usage. Strategic planning, content creation, crisis communications, and reputation management were all included in the program. To reach all its more than 408,000 members and share information with the entire district, EBMUD expanded its use of social media to include Nextdoor, a neighborhood-based social networking service. Nextdoor also allows EBMUD to share project updates with only certain neighborhoods within its service area. A full-time digital communications manager has been hired by the District of Columbia Water and Sewer Authority (DC Water) to administer the organization’s social media accounts, create content, and engage with users. DC Water thinks that to grow an audience and demonstrate the human side of the account—that there is a real person behind the account—utilities need to develop their “brand voice” and offer interesting material.
The contributions of this work to the literature are as follows:
  • We collect a new dataset, WaterQualityTweets, to include different water quality issues specified by the EPA.
  • We proceed with two stages of classification for these issues.
  • Predicting information diffusion on customer complaints is proposed.
  • A scalable messaging system enables different water quality-related issues to be sent to different subscribers.
The rest of this paper is structured as follows. In Section 2, we give a literature review on the importance of social media in water quality, distributed systems in water quality, and information diffusion on social media. In Section 3, we provide specifics regarding the proposed work. First, our dataset is given, followed by text classification algorithms, distributed messaging systems, and information diffusion on WaterQualityTweets. Section 4 presents the experimental results, discussion, and a performance comparison with the state-of-the-art methods. The final section summarizes this work’s findings and gives limitations and future works.

2. Related Work

2.1. The Importance of Social Media in Water Quality

Over the past ten years, social media platforms have become a trustworthy medium for information and communication. Because of their ability to reach huge audiences globally, they are a preferred place to discuss and voice concerns over numerous domestic and international issues. Law enforcement, emergency management organizations, the public health community, and companies all keep an eye on security, disaster response, disease outbreaks [20], and customer satisfaction on social media [21]. Although social media monitoring is still a new practice in the water sector, it may be applied to similar goals given that customer complaints are a reliable way to identify the distribution system problems before they become serious.
The 2017 Water Research Foundation project (https://www.nacwa.org/docs/default-source/conferences-events/older-events/2017-summer/stratcomm-h2o/laura-ganus.pdf?sfvrsn=18c1f561_4, accessed on 30 June 2023) “Social media for water utilities” demonstrated how the water industry trailed behind other industries, such as the electric industry, in embracing social media. The survey found that just a small percentage of the 60 drinking water and wastewater utilities in the United States that had social media profiles really used it, and of those that did, only a small percentage was successful in reaching their customer base.
Numerous research projects are now being conducted to assess water quality via social media. “Water Quality in Social Multimedia [22]” is one of them. The WaterMM Task’s main objective is to analyze social media tweets on water security, safety, and quality. Participants in this work are provided with a collection of Twitter post IDs to download the text, the accompanying image, and the metadata of tweets that were selected using a keyword-based search that includes words or phrases about the quality of drinking water (e.g., strange color, odor, or taste, related illnesses, etc.). The challenge can be completed by participants using metadata, text features, picture characteristics, or a mix of the three [23,24].
Zheng et al. [25] propose a framework that enables surface water quality monitoring (SWQM) with a social media application used by citizen scientists. Volunteers perform sensory analysis by taking photographs of nearby water bodies. According to the analysis, four physical parameters (color, odor, turbidity, and pollutants) affecting the water quality are considered. These parameters are scored between 0 and 10. The collected data are then analyzed by comparing them with the real station data. Interaction between environmental educators and students or regular people can help determine the value of social media and the importance of environmental education. Nowadays, people use social media to communicate with others locally and globally about small-scale to large-scale environmental issues and to support environmental causes. It also gives regular people the capacity to monitor the quality of the air, water, and climate in their immediate surroundings and subsequently share this information with others. With various examples and case studies, Mallick and Bajpai [26] highlight some of the benefits of social media in raising environmental consciousness and fostering human connectivity.
Dewinta and Irawan [27] collect complaints made to state-owned drinking water companies through their social media apps. Customer complaints are modeled using LDA and SOM approaches. In this way, it is determined which organization is complained about the most by extracting information. In addition, when the complaints about water are classified, it is observed that the most common is pipe leak complaints. When the proposed model is converted into a real-time application, it may be possible to act against the customer complaints faster. Shan et al. [28] analyze the behavior of users on Weibo, the Chinese Twitter app, about “river pollution”. User sentiment analysis is carried out on issues related to river pollution. The proposed framework consists of four different dimensions called TSDD (trends, seasons, space, and dynamics). Meaningful results are obtained by associating each dimension with the other. For example, according to the findings of the research, people have more negative emotions in summer and winter than in other seasons. With these inferences, the proposed method is more useful for better urban planning than people’s mood analysis. Li et al. [29] analyze the public’s reaction to recycled water using the Weibo app. For the analysis, the behavior of the users in 34 different cities for the last 6 years is monitored. According to the results, the idea of recycled water is considered important in areas with water scarcity. However, the public has concerns about the safety of recycled wastewater.
Water scarcity is becoming a global problem in the world. Xiong et al. [30] investigate whether the information collected by Twitter users could serve as a guide to local governments in emergencies. In the 2019 Chennai water crisis, tweets on the social media application platform are analyzed. Using the latent Dirichlet allocation (LDA) method, the most frequently discussed issues are determined. The dataset is grouped by topic. Afterward, user sentiment analysis is performed on the subject. According to the emotional inferences, users expressed their concerns about the impact of drought during this process. In the study, it is concluded that the topics and contents on Twitter can reflect popular public opinion and even guide the decisions to be taken by the government. Also, collecting and analyzing these posts in real time will ensure a successful crisis management process.
Policymakers and water body administrators can be swiftly informed of potential incidents in their water bodies based on posts published by individuals on social media platforms. Numerous uses of social media data have been investigated, including mapping flood disasters. However, no research has been conducted on using social media to find problems with water quality. This might be the case because using social media to study water quality can create special difficulties. Out of the many different water quality measures that are monitored by state agencies, it is necessary to first pinpoint particular water quality parameters that the general public can understand and react to. Understanding water quality-related measures is the goal of this study. Second, it might be challenging to distinguish social media posts that are actually about problems with water quality. The variety of language can be deceptive because a message that uses a term may include completely unrelated information. We use manual labeling and natural language processing methods to address this problem. Third, it is challenging to pinpoint the area of problems with water quality due to posts that include spatial information. It can be difficult to extract relevant facts on water quality from vast amounts of data. This work attempts to address these issues and demonstrate the potential of utilizing social media data to create a practical and affordable tool for water quality monitoring.

2.2. Distributed Systems in Water Quality

The amount of data is growing swiftly at a rate of millions per second, with IoT data being the only type to have 50 billion linked sensors by 2025. Integrating, analyzing, and mining massive amounts of data require an effective and efficient framework as well as an algorithm to extract knowledge or create an accurate prediction [31]. Monitoring water quality at high speed is critical and difficult due to the ongoing evolution of data streams [32]. It can take a centralized algorithm hours or even days to compute and identify reliable results, and most existing and conventional water quality detection systems heavily rely on stationary data. To reduce the execution time and meet the need for real-time or almost-real-time detection and monitoring, parallel and distributed computing [33] is crucial, as shown in Figure 1.
Some studies using distributed systems can be listed as follows: Ahmed et al. [35] demonstrate a distributed Internet of Things system that can help farmers understand and participate in an automated irrigation system in agricultural fields. The technology created would give farmers the ability to irrigate remotely more effectively while also reducing over-watering of the field based on the actual soil watering needs. Hoskins and Stoianov [36] provide a method for tracking and analyzing the dynamic hydraulic circumstances in water distribution and transmission networks on an ongoing basis. Hydraulic disturbances and unsteady-state flows are characterized by the extraction of static and dynamic indicators using the developed distributed InfraSense data-recording and -management system. Amoretti et al. [37] demonstrate a distributed information system created as part of project POSITIVE that makes use of several best practices and tools already in use to facilitate precision watering. Zoss et al. [38] demonstrate a sizable fleet of compact, inexpensive, autonomous robots with sensing capabilities that holds great promise for the ubiquitous and persistent monitoring of inland and coastal water ecosystems. Through the remote monitoring of dissolved oxygen, pH, and temperature, Encinas et al. [39] built and put into place a distributed system for maintaining the water quality in aquaculture. This initiative will help monitor pond water quality remotely via a distributed monitoring system connected to the Internet of Things. The technology enables the cloud-based sharing of information that can be utilized to advance and enhance aquaculture operations, and it is modular, portable, affordable, and versatile. Tuna et al. [40] concentrate on the actual use of two distinct portable and affordable approaches for continuous water quality monitoring: a wireless sensor network (WSN)-based monitoring system and mini boats loaded with sondes and probes. In this paper, we implement distributed messaging and a light-streaming system for informing authorities about water quality-related tweets/issues.

2.3. Predicting Information Diffusion

The dissemination of information, news, or messages via social media platforms like Facebook, Twitter, Instagram, and others is referred to as information diffusion. Social media is becoming a well-liked and effective instrument for disseminating information to large audiences, and it is frequently used in a variety of contexts, such as politics, advertising, and social movements. Typically, a person or organization posts a message on a social media platform to start the process of information dispersion. The message may be conveyed using text, pictures, or videos. Once the message is uploaded, other users can share, like, comment on, or retweet it, which can help it get in front of a lot more people. The substance of the message, the social network structure of the users, the time of the message, and the usage of hashtags or other methods of categorizing and organizing content are just a few of the variables that can affect the speed and extent of information dissemination on social media. However, in the context of information diffusion on social media, the transmission of inaccurate or incorrect information is also a significant worry.
Many previous research investigations have concentrated on the topic of predicting popularity using the number of potential retweets as a gauge of popularity. Liangjie et al. [41] attempted to determine how several factors affect the spread of information on Twitter. They concentrated on both the user traits and the content characteristics of tweets. They proposed the idea of multi-class classification for the prediction problem since it is difficult to anticipate the precise number. Nasir et al. [42] solely used the features of tweets to predict retweeting behavior. They found that the number of followers of the user who started the tweet and the number of retweets do not correlate as strongly. It was shown that tweets regarding a broad popular topic were more likely to be retweeted than those about a particular personal topic. The majority of research that has modeled information cascades has either concentrated on network properties like the edge growth rate, width, and degree distribution [43] or on user properties like user significance [44]. In some additional studies, diffusion was examined by explicitly tracing the propagation pathways.

3. Materials and Methods

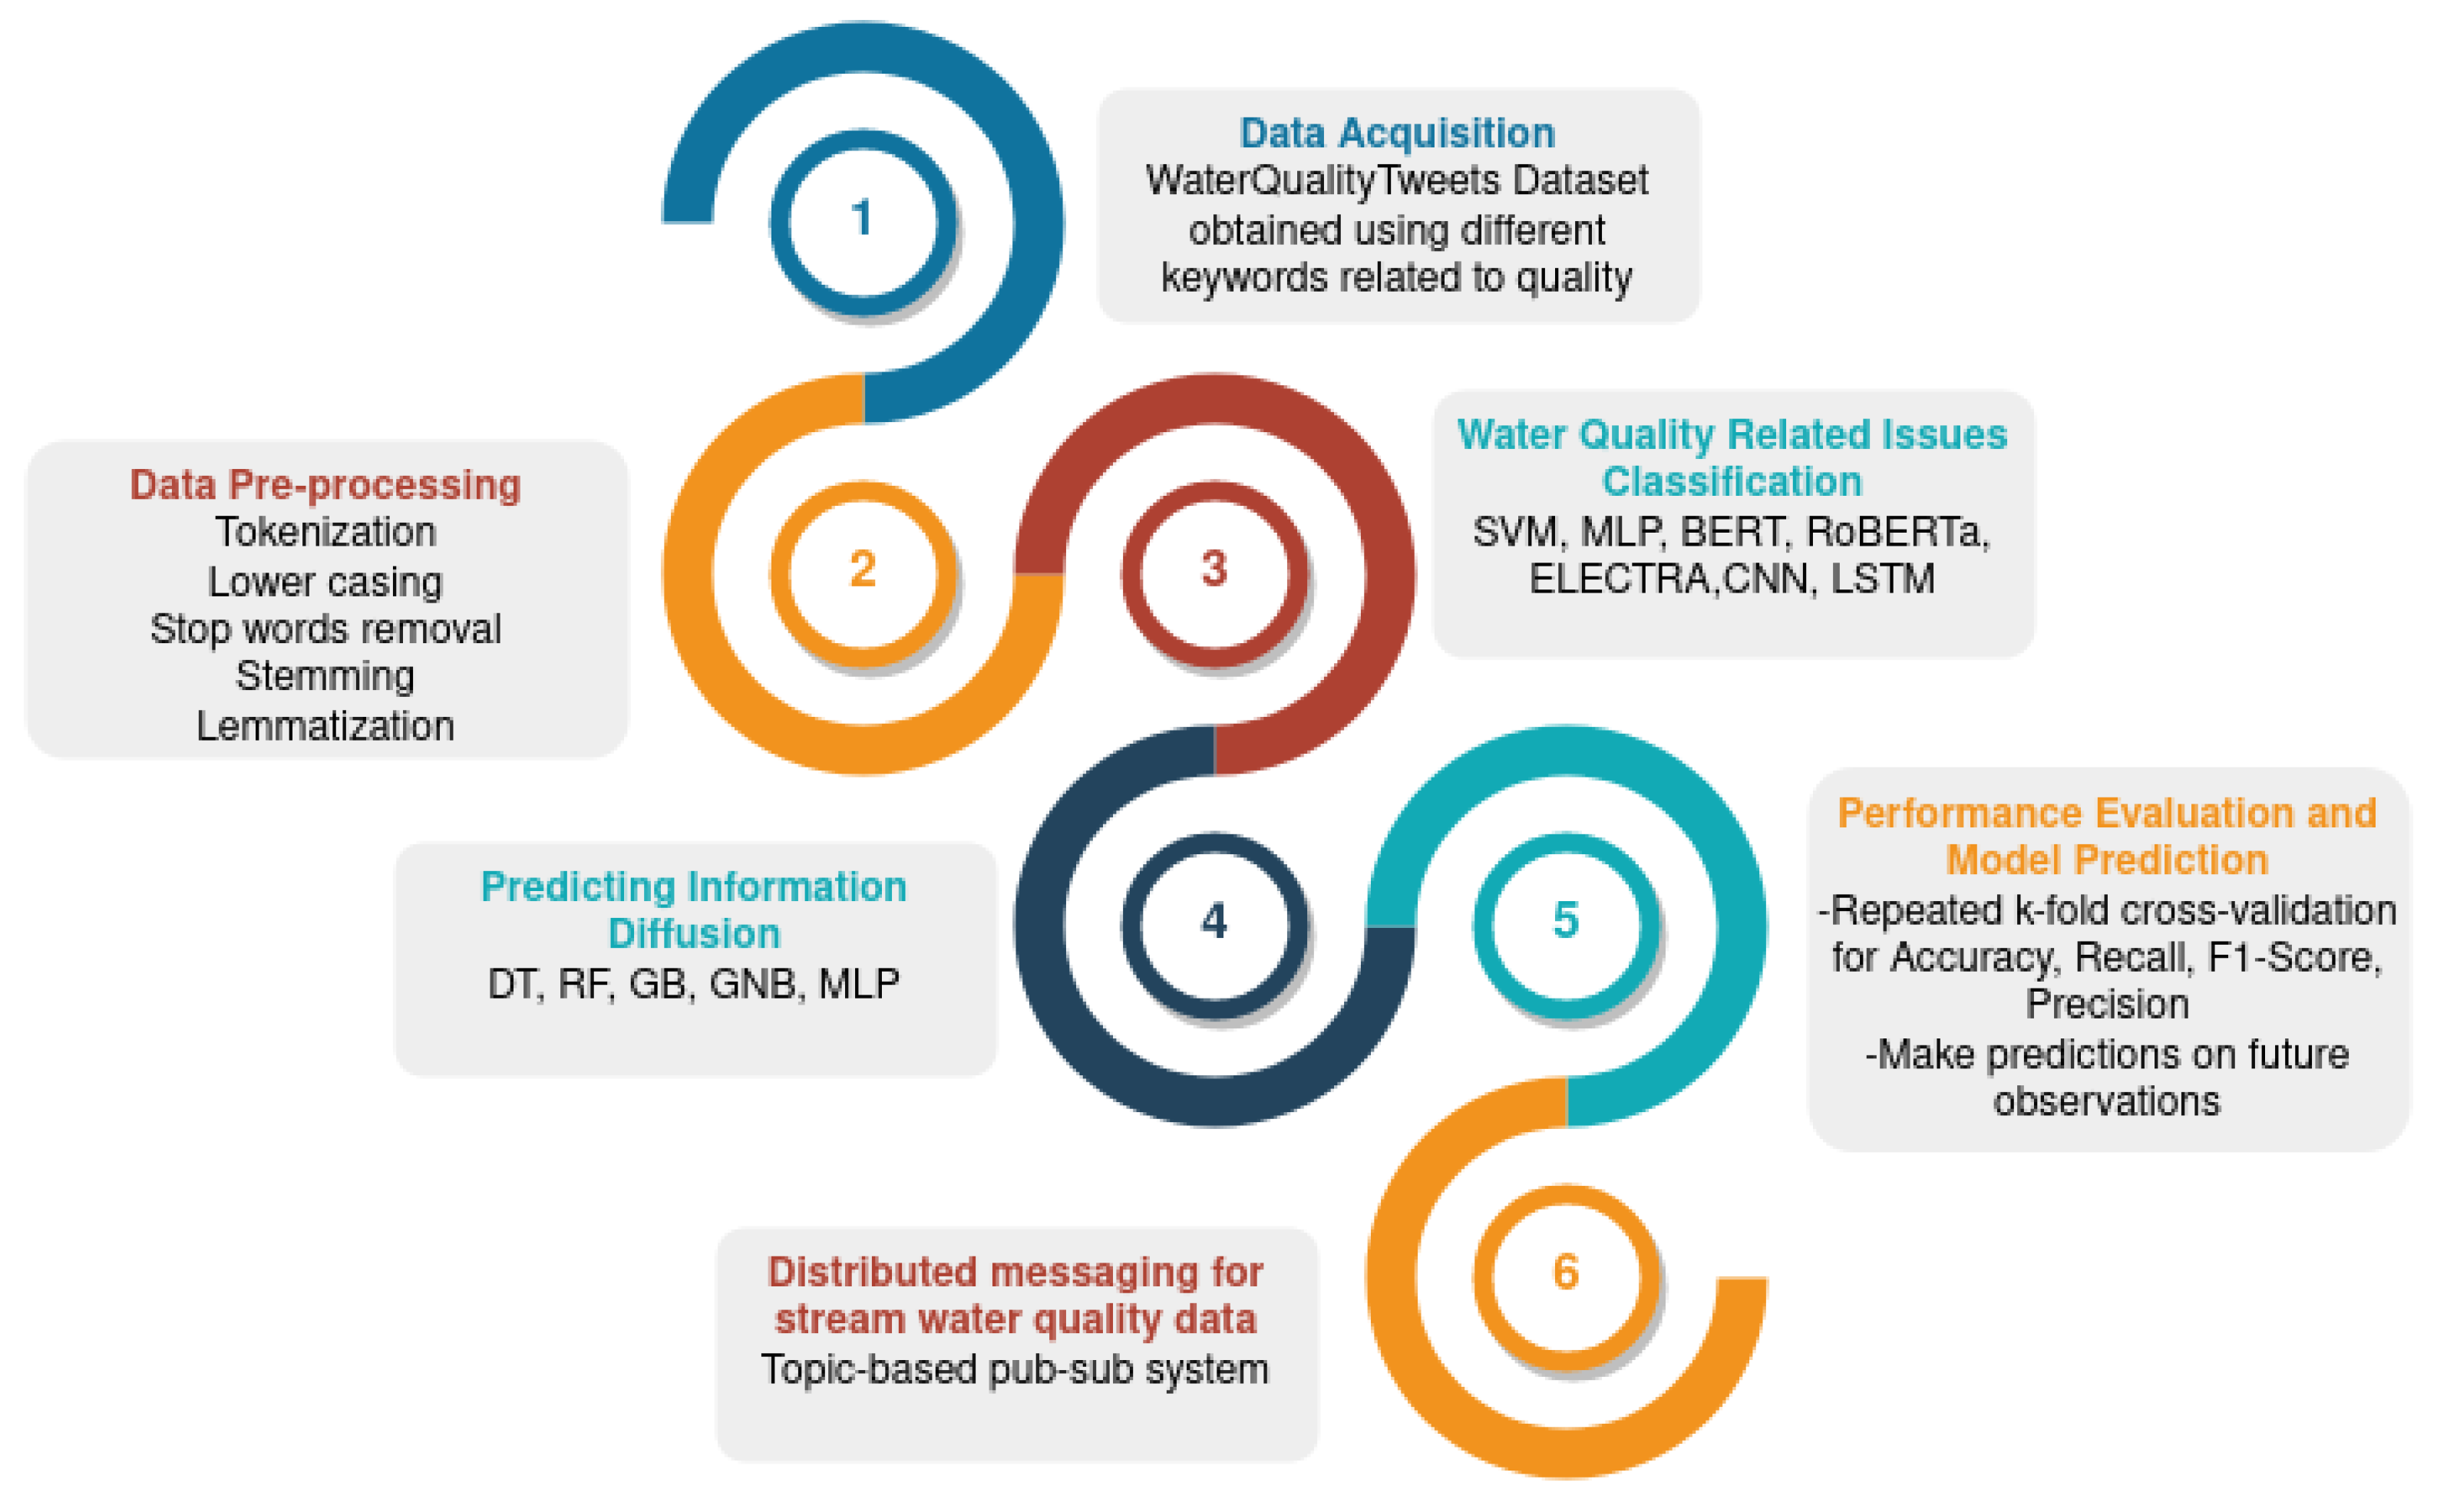
The proposed system’s materials and processes are presented in this section. Figure 2 shows the research flow.

3.1. Data Acquisition

We gathered the data comprising the WaterQualityTweets dataset from Twitter since 1 January 2015 using BeautifulSoap (https://www.crummy.com/software/BeautifulSoup/bs4/doc/, accessed on 30 June 2023) and Twitter API (https://developer.twitter.com/en/docs/twitter-api, accessed on 30 June 2023). This paper consists of two different classifications (binary and multi-class classifications). In the first one, we consider whether the data are related to water quality or not. If it is related to the water quality issue, the last one is considered. In this stage, it is determined which properties of water are included in the text data related to water quality.
Users can search for posts using Boolean keyword search strings like “OR”, “AND”, and “AND NOT” in many social media management applications. These strings are employed in keyword searches where users can create complex queries using Boolean operators. These searches are especially useful when looking for a keyword like “water“ that is used in numerous different contexts. We can eliminate useless search results by looking for posts that mention “water” “AND NOT” “swimming”. It is possible to identify the sources of water concerns by combining searches for drinking water with keywords for certain water quality problems related to color, odor, taste, illness, and unusual state. Therefore, we use different search keywords to obtain water quality-related data. We consider these keywords determined by the EPA as seen in Figure 3 and we organize them using Boolean expressions as given in Table 1. Also, we collect non-water quality posts for binary classification. Examples from the WaterQualityTweets dataset for each class are given in Table 2.

3.2. Data Pre-Processing

The raw data were subjected to several pre-processing operations. First, redundant columns, NaN, and NaT rows were removed from the tweets’ body column before it was converted to a string type. Then, using regular expressions, all tweets were converted to lowercase and non-alphabetic letters, URLs, hyperlinks, emojis (https://pypi.org/project/emoji/, accessed on 30 June 2023), special characters, extra new lines, and references to other users were eliminated. After that, texts were lemmatized with spaCy and cleaned up with Gensim (https://pypi.org/project/gensim/, accessed on 30 June 2023). Table 1 shows the class distribution of the WaterQualityTweets dataset. Table 3 shows the class distribution of WaterQualityTweets dataset.

3.3. Text Classification

After the data-cleaning steps, text classification is performed. The performance of many different classification algorithms such as SVM, CNN, LSTM, MLP, BERT, ELECTRA, and RoBERTa are analyzed. The following sub-sections briefly describe these algorithms.

3.3.1. BERT

BERT (Bidirectional Encoder Representations from Transformers) is a natural language processing algorithm introduced by Google in late 2018 [46]. The Transformer architecture allows self-learning of sequential data thanks to multiple head layers in a code block [47]. Instead of evaluating the words in the texts one by one, it provides deep and bidirectional language coding training, considering the right and left contexts [48]. In this way, it provides a better understanding of long and complex text data. Training a model brings with it computational, timing, and resource problems. To overcome these problems, different pre-trained BERT models are presented in the literature [49].

3.3.2. RoBERTa

Liu et al. [50] propose a Robustly Optimized BERT Pretraining Approach (RoBERTa) model that can match the outputs of a BERT-trained model or the improve performance. RoBERTa is suitable for longer work with more datasets. It also enables dynamically changing the masking model in the training phase and removing the Next Sentence Prediction (NSP) loss function [51]. While the BERT model uses static masking, the RoBERTa model uses dynamic masking strategies at every stage.

3.3.3. ELECTRA

ELECTRA refers to masked language modeling called “replace token detection” based on the BERT model [52]. The input is corrupted using some selected tokens instead of being masked. It is then estimated whether each token in the corrupted input has been exchanged. By changing the selected token, learning is provided for all subsets instead of a single input subset [53]. In addition, the ELECTRA model is more successful than BERT on downstream tasks.

3.3.4. SVM

Support vector machines (SVMs) is a supervised learning algorithm used in both classification and regression problems [54,55]. The main purpose of the SVM algorithm is to obtain a flat and high-dimensional feature space with the lowest loss function [56]. Unlike other algorithms, the problem can be defined as a convex optimization problem thanks to the regularization parameter [57].

3.3.5. CNN

The convolutional neural network (CNN) has been performing well in many areas such as image classification, natural language processing, and pattern and speech recognition in recent years. LeChun et al., in 1998, developed a multilayer artificial neural network called Lenet-5 [58]. The Lenet-5 neural network made it possible to recognize handwritten numbers from pixels. The most important feature that distinguishes CNN from other neural networks is the creation of a space-independent model by reducing the number of parameters [59]. Abstract feature extraction can be made more powerful with deep layers created using CNN. The complexity increases as the depth increases in the architecture. To overcome these complexities, different models such as AlexNet [60], VGGNet [61], Inseption [62], ResNet [63], and GoogleNet [64] have been introduced over the years.

3.3.6. MLP

Multilayer perceptron (MLP) is a fully connected feed-forward neural network consisting of at least three layers [65]. The output of each layer represents the input of the next layer [66]. The input of each layer is formed by weighing the neuron outputs from the previous layer. Initially, the weights are defined randomly. The weights are then adjusted as the model spreads. The neuron outputs are determined according to the activation functions used. The model continues to be trained by backpropagation until the obtained error value is lower than the expected error value.

3.3.7. LSTM

Long short-term memory (LSTM) is a powerful iterative neural network that enables learning of long-term dependencies without any loss of function in very deep networks [67,68]. It is used by Facebook, Amazon, and Google for purposes such as improving speech recognition and translations. LSTM consists of subnets called memory blocks that are constantly connected to each other [69]. Unlike other models, optional information can be added or removed with gates in the LSTM model.

3.4. Distributed Messaging for Stream Water Quality Data

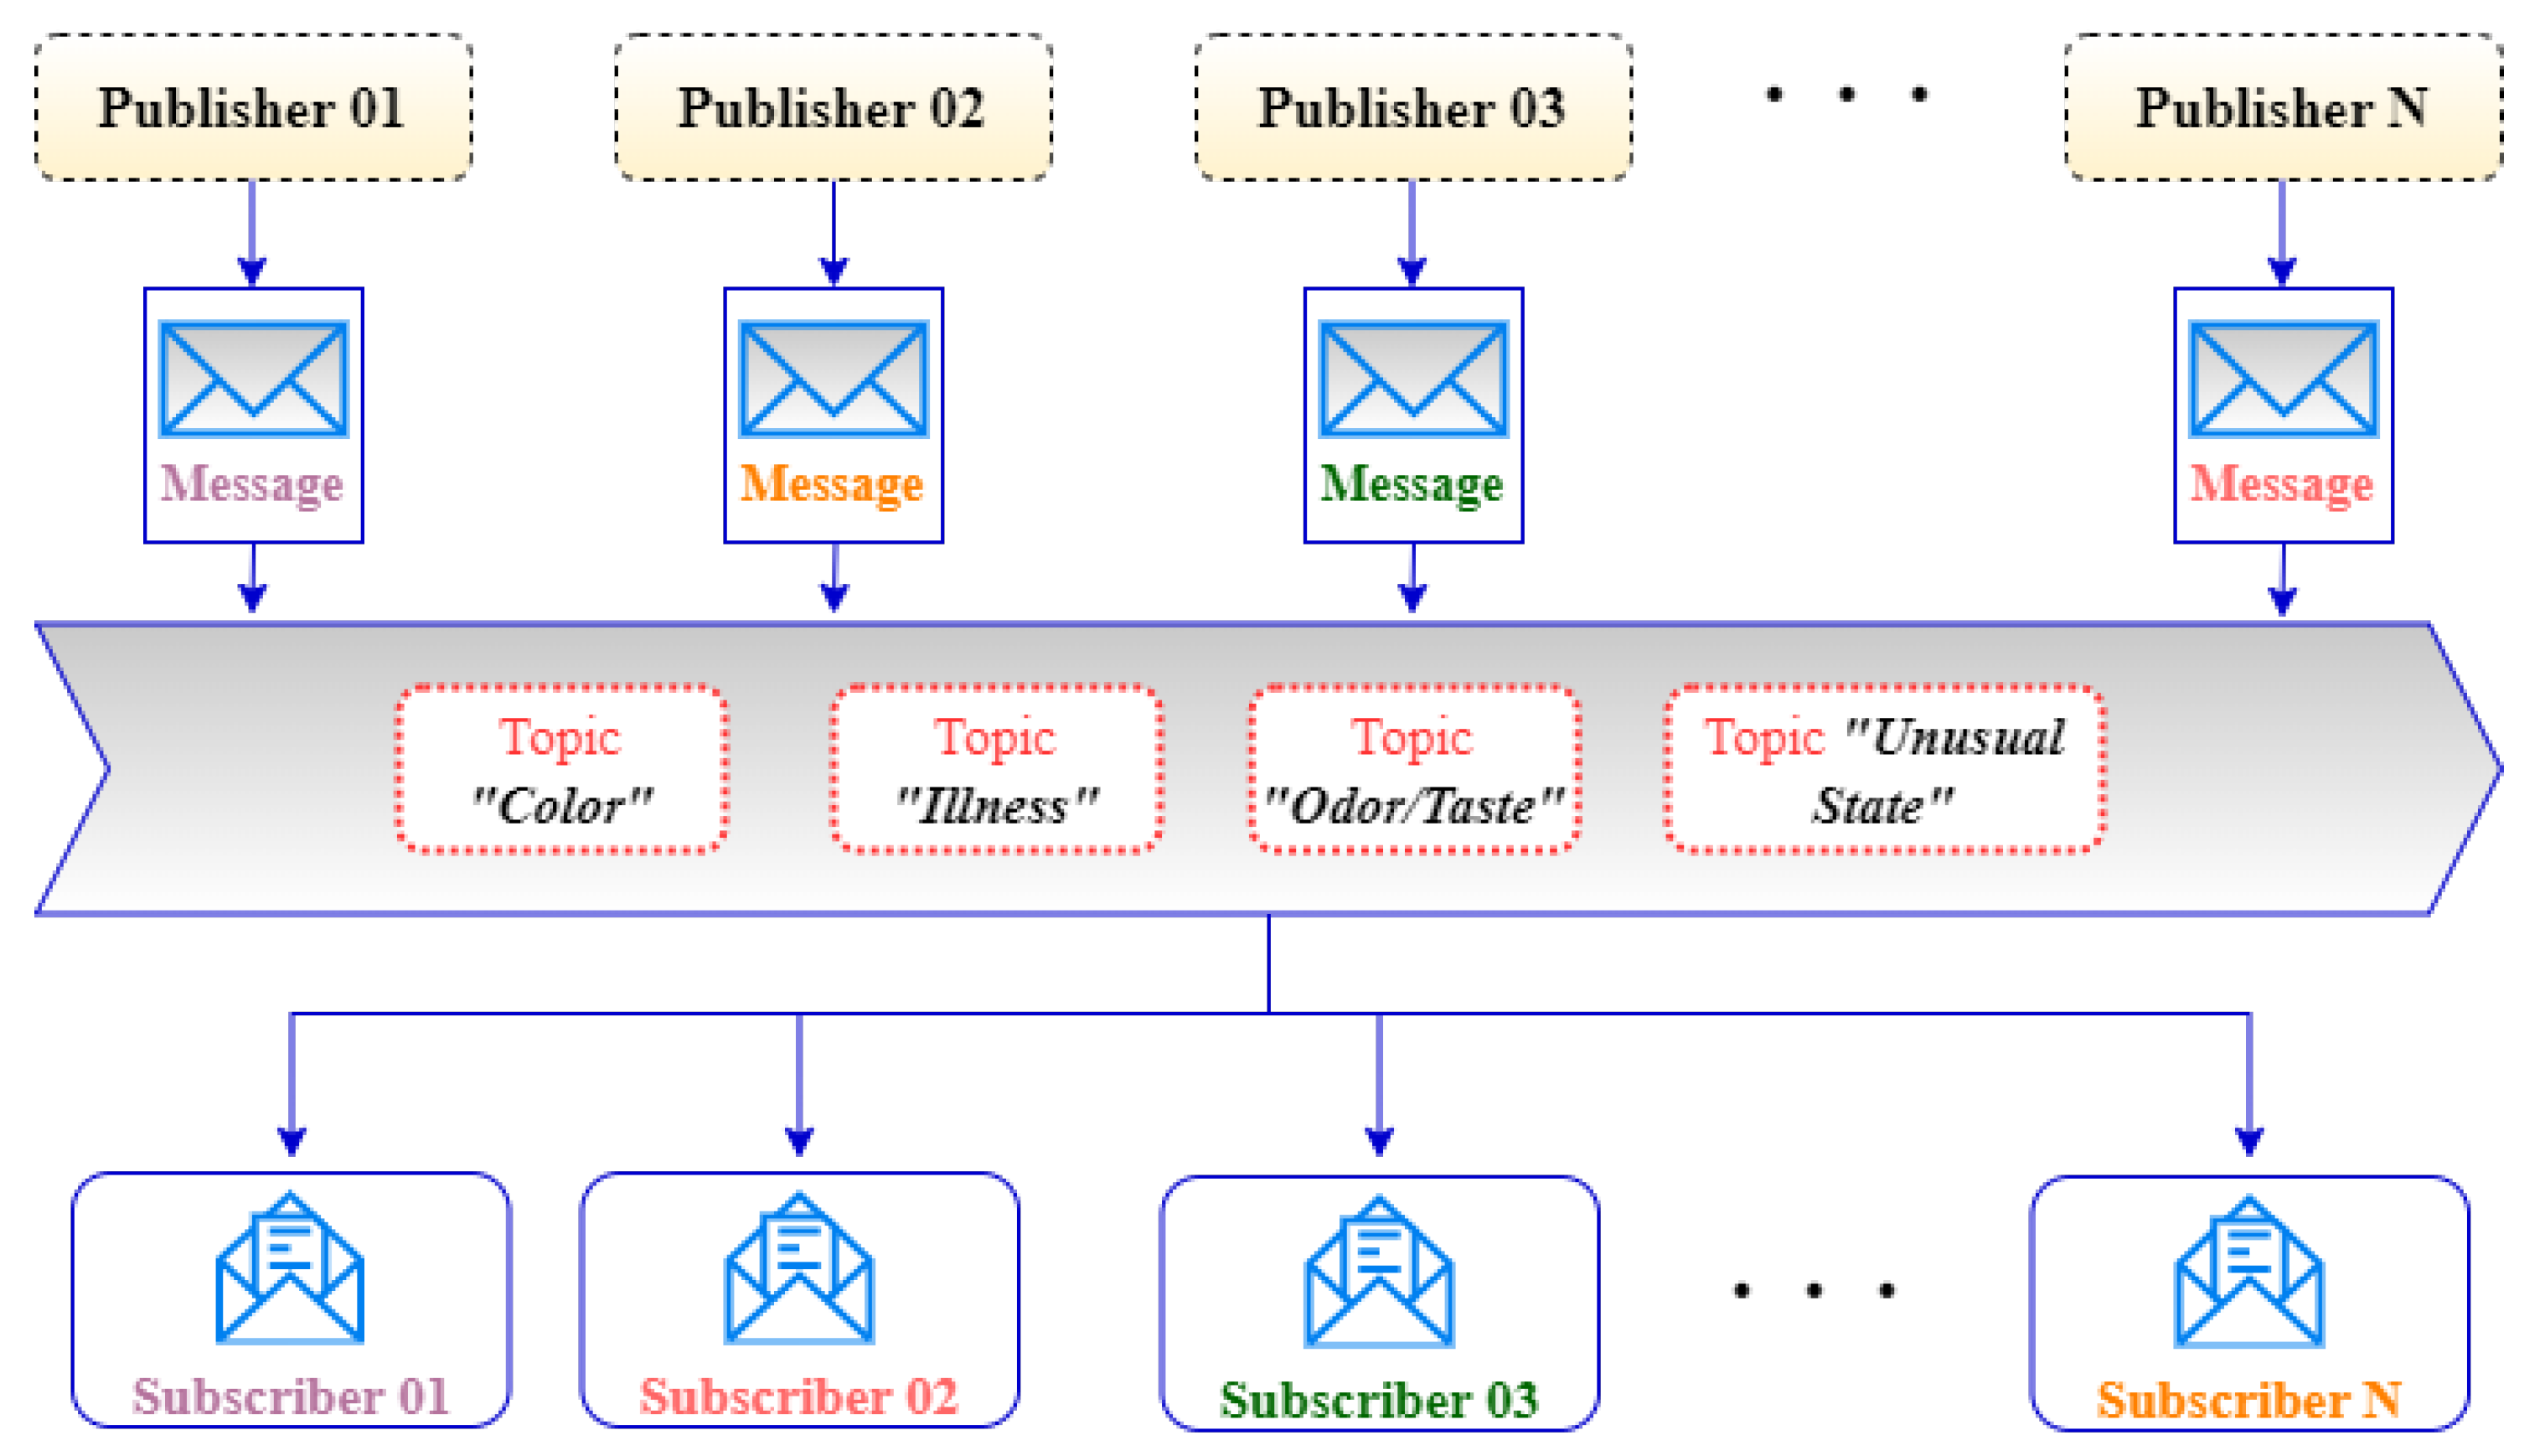
In this section, we focus on the distribution of the classified tweets to the subscribers/authorities using Apache Kafka. Apache Kafka is a messaging protocol suitable for scalable and distributed systems that enables communication between producers and consumers, allowing real-time consumption of information [70]. Another issue examined in addition to the real-time water quality detection model in the article is the distribution of the information obtained through the issue-based publish/subscribe system to the necessary institutions and organizations. The publish/subscribe (pub/sub) interaction is a form of message-based communication in a distributed environment. In this type of communication, producers/publishers publish the information, while consumers/subscribers subscribe to the information they want to receive. This is known as the job filtering or registration method. In general, it is divided into three parts: subject-based, content-based, and type-based filtering. (i) Topic-based filtering: messages are broadcast to topics (or logical channels). The consumer who registers on the relevant topic receives all messages published on that topic. (ii) Content-based: In the content-based model, if the attributes of the messages or the content match, the relevant messages are received by the consumers [71]. (iii) Type-based: In this model, the producer generates message objects, and the consumer only receives messages of that object type [72]. In this work, we use a topic-based filtering mechanism, as seen in Figure 4. Topics are the categorized form of the messages to be forwarded. A topic can be written by one or more producers, but also read by one or more consumers. All messages to be transmitted are stored on servers via topics. In this way, detected problem information is sent to subscribers via the dispatcher. Also, we send the time and location of the tweets within the topic message. Tweet data can contain geographical metadata. Thus, these coordinates are used to know the location of the water-related problem. We can extract the timestamp for a tweet ID by right-shifting the tweet ID by 22 bits and adding the Twitter epoch time of 1288834974657. Therefore, the time of the problem can be accessible in this way.

4. Experimental Results and Discussion

4.1. Exploratory Data Analysis on WaterQualityTweets Dataset

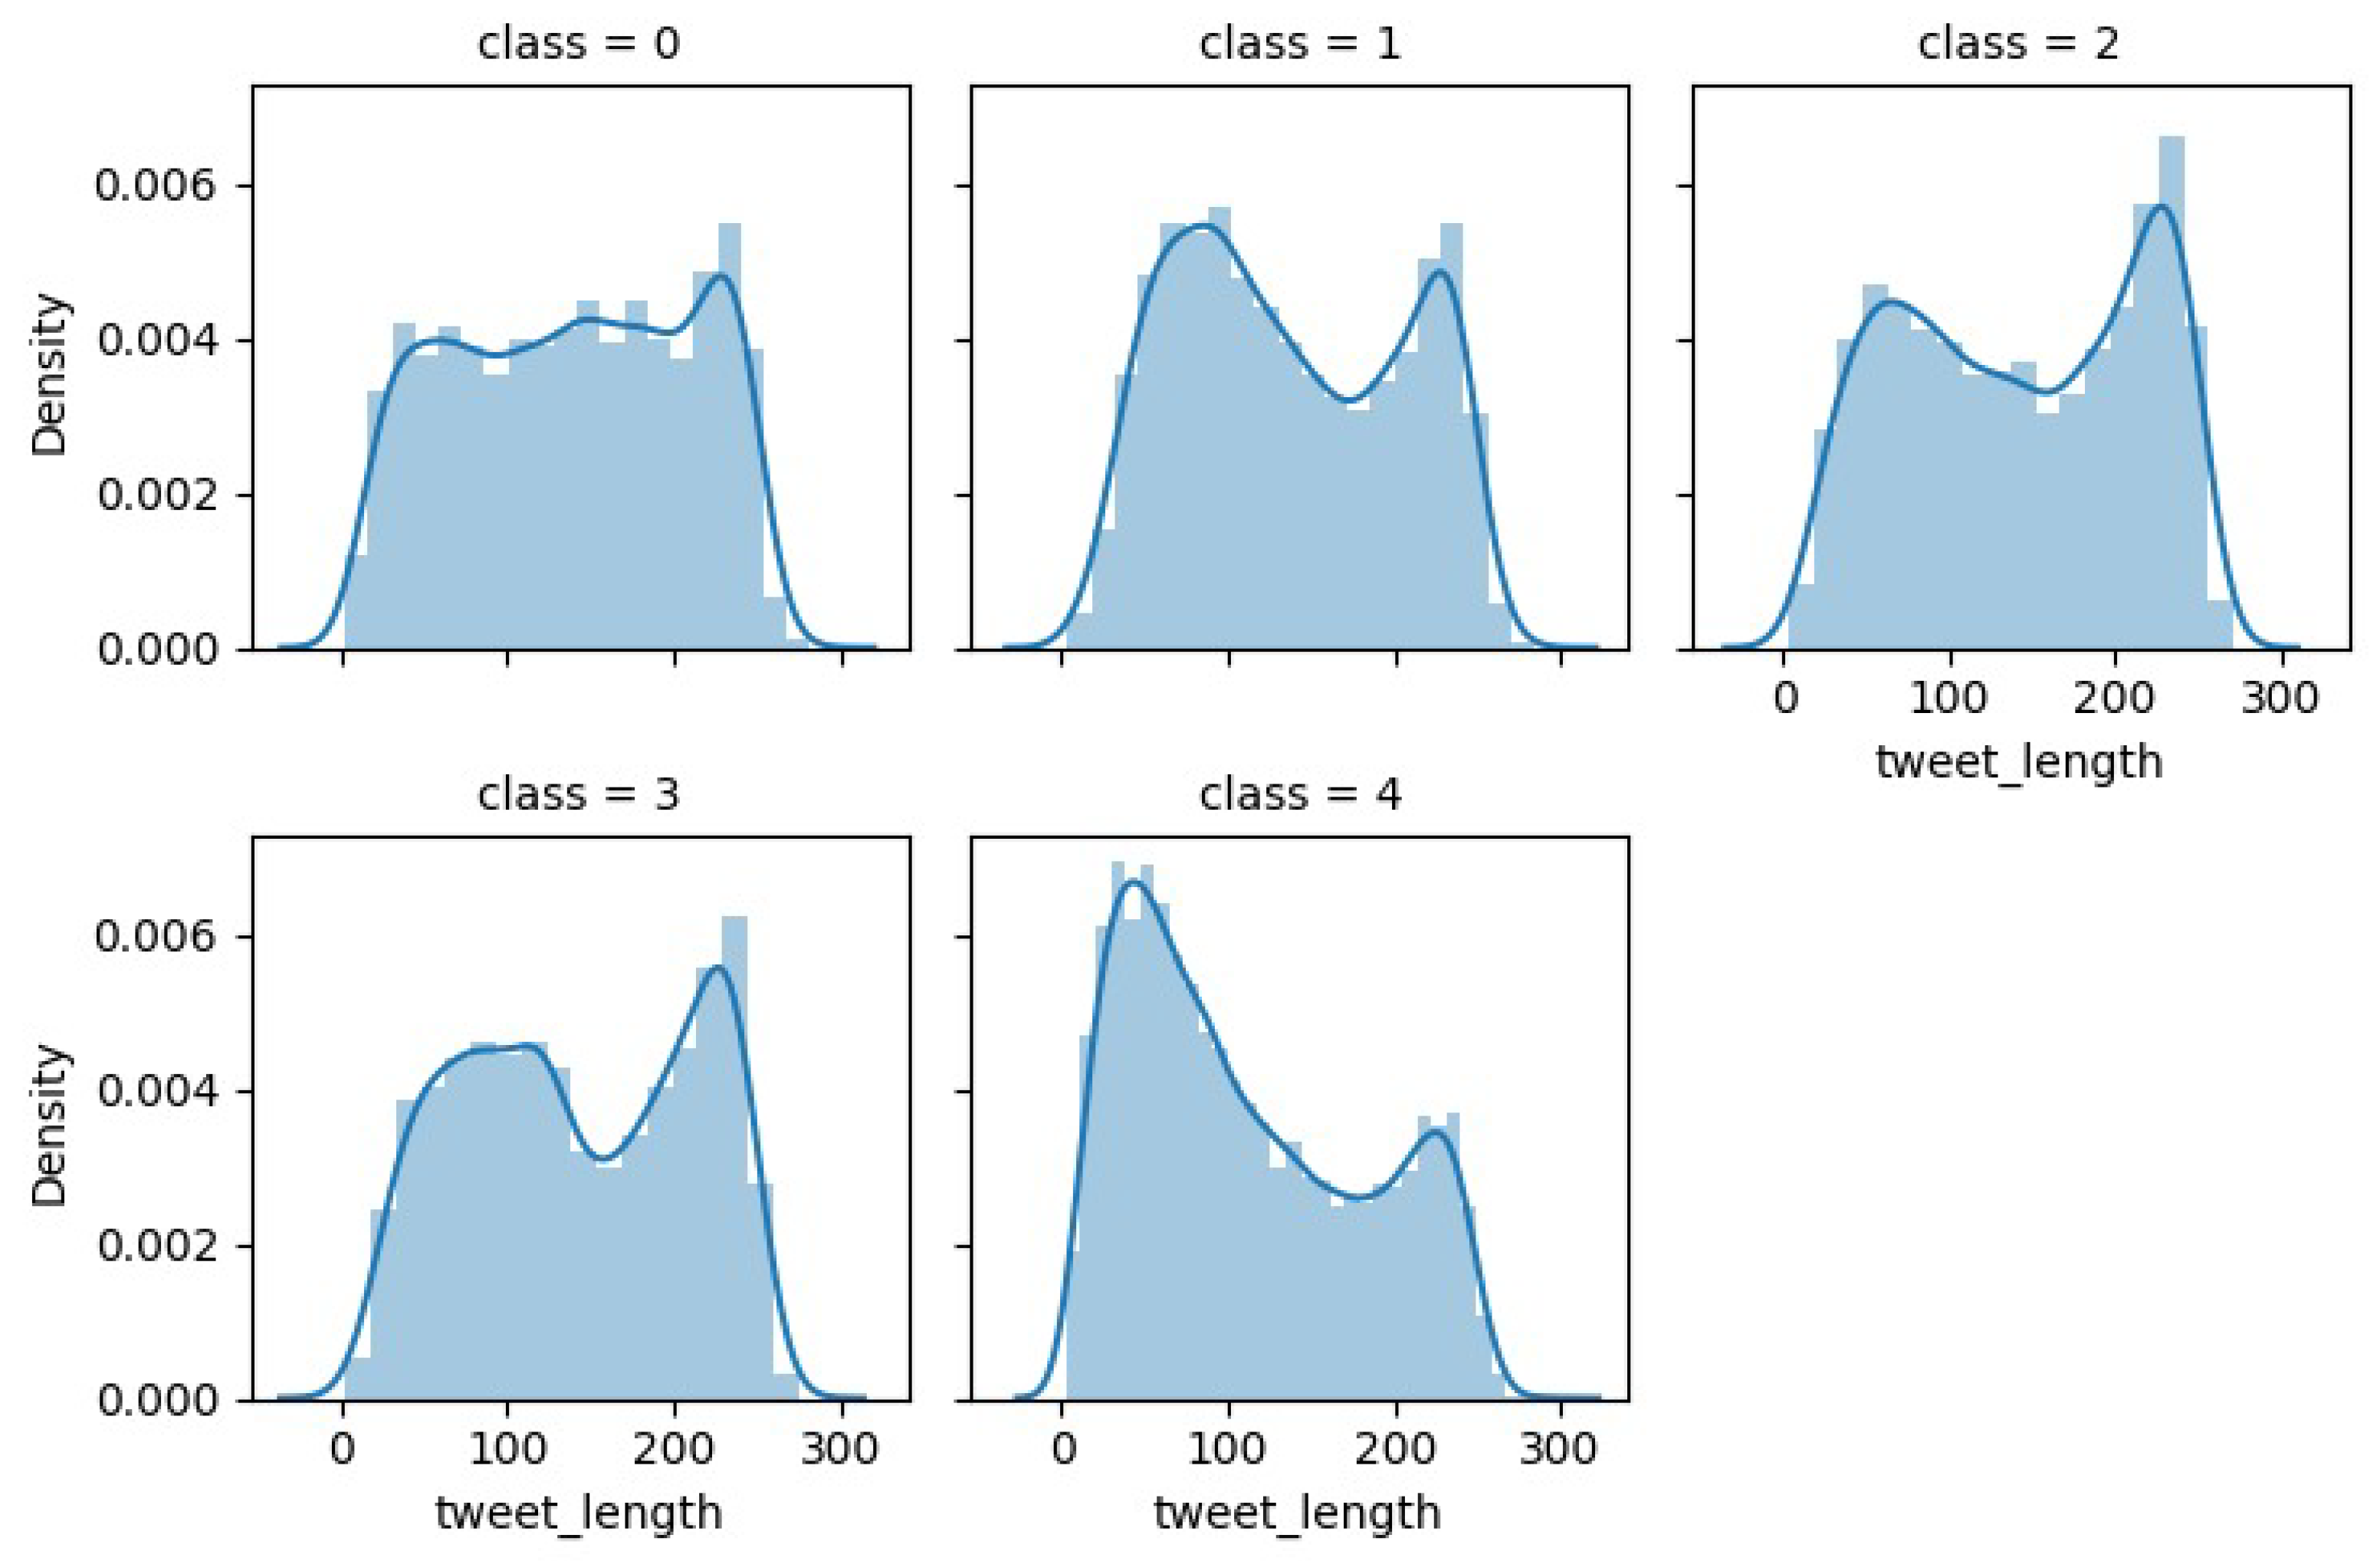
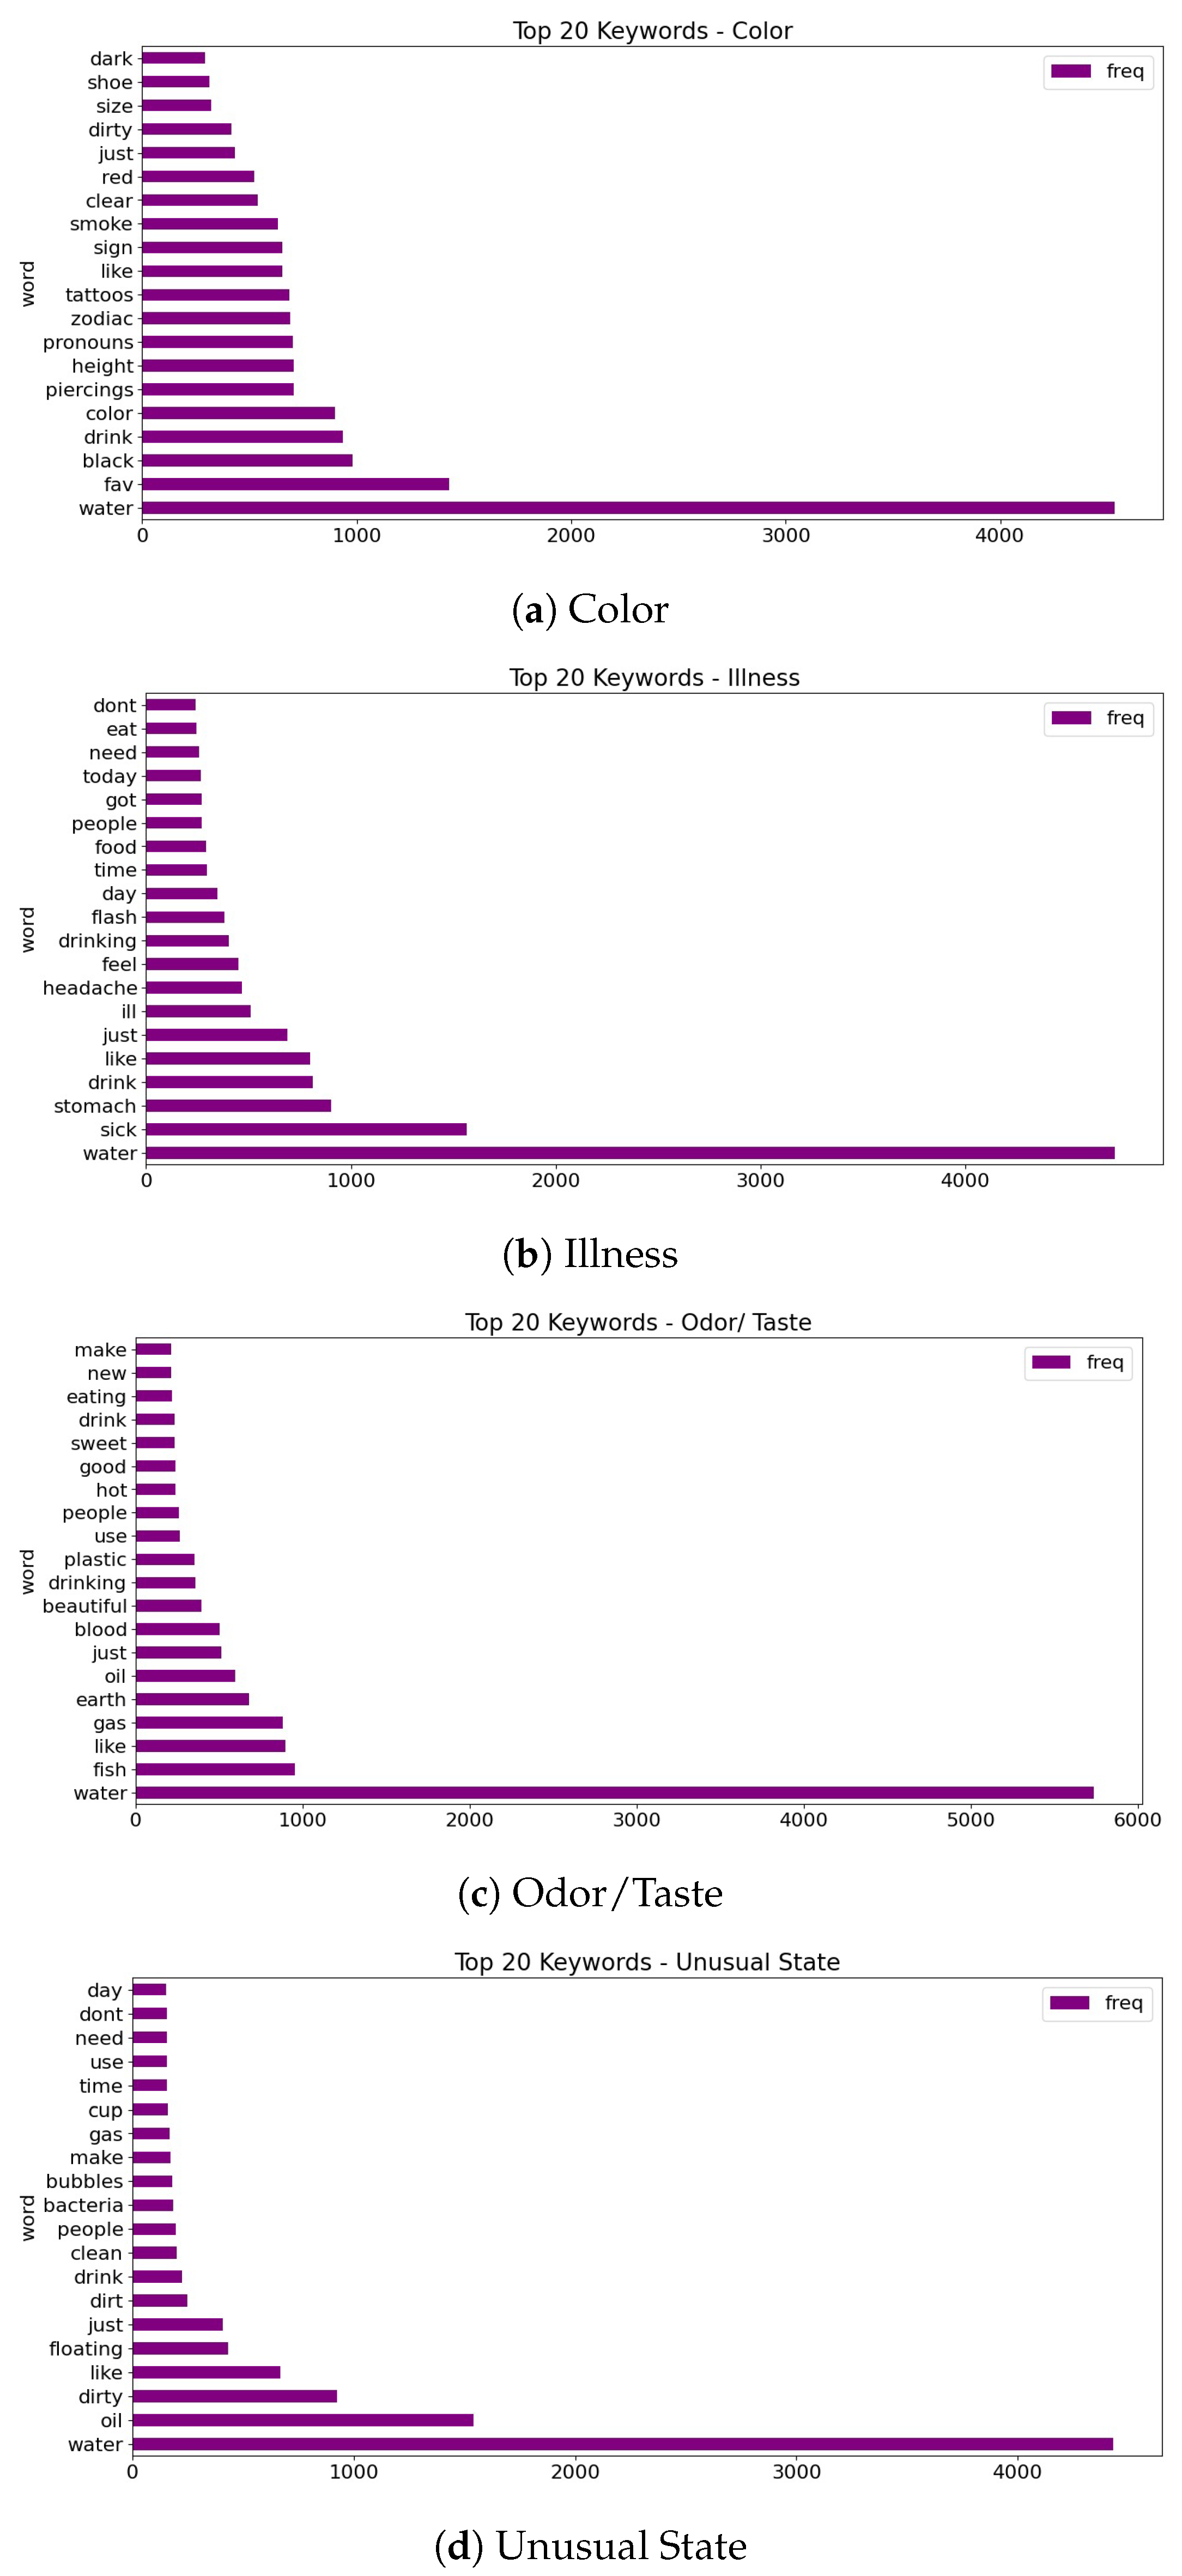
To obtain insights and comprehend patterns, correlations, and anomalies, exploratory data analysis (EDA), a crucial first stage in the data science process, comprises summarizing and displaying a dataset’s key features. The most frequently used words, hashtags, mentions, and sources in tweets, as well as the distribution of tweet lengths, sentiments, and timestamps, may all be found using EDA. This can reveal important details about the subjects being covered, the viewpoints being expressed, and the actions of tweeters. In this section, we focus on histograms to visualize the distribution of tweet lengths and the most frequently occurring words for each class in the dataset. Figure 5 shows a tweet length comparison for water quality-related vs. non-related tweets. Tweets unrelated to water quality tend to be slightly longer. Similarly, Figure 6 shows a tweet length comparison for all classes in the dataset, and odor/taste also tends to be slightly longer. Figure 7a shows the most frequently occurring words for each class. To give an example, water, fav, black, drink, color, dirty, and dark are words that are quite common in the color class.

4.2. Performance Metrics

Accuracy, precision, recall, and F1 score are used as performance metrics in this paper. These are formulated with true positive (TP), true negative (TN), false positive (FP), and false negative (FN) values. The degree to which the model accurately predicts the positive class (such as water quality-related tweets) is measured by the TP. In other words, the instance is positive as it is predicted to be by the model. The outcomes that the model correctly identifies as negatives (unrelated to water quality) are known as TN. When the model predicts that an instance belongs to a class when it does not, this is known as an FP. When a model predicts something as negative when it is actually positive, it is called an FN.
A c c u r a c y = T P + T N T P + T N + F P + F N
P r e c i s i o n = T P T P + F P
R e c a l l = T P T P + F N
F 1 S c o r e = 2 · P r e c i s i o n · R e c a l l P r e c i s i o n + R e c a l l

4.3. Binary Classification

After data pre-processing, binary classification (water quality-related or not) proceeds. The WaterQualityTweets dataset is split into 70% training and 30% test data. The performance analysis of the models is given in Table 4 with different metrics and model parameters. The best accuracy among the models is provided by the BERT algorithm. During the training, different combinations of parameters such as learning rate, batch size, activation function, loss function, and number of layers are tried. The BERT model focuses on the relationships between words instead of evaluating the words one by one thanks to the Transformer architecture. With this feature, it is seen that it detects whether a text is related to water quality with higher accuracy.

4.4. Multi-Class Classification

For a deeper classification of water quality-related tweets, the multi-class classification stage is started. Multi-class classification includes more specific features than binary classification. In this section, four main classes are thought to be related to water quality. These classes are determined by color, illness, odor/taste, and unusual states. The created dataset is split into 80% training and 20% test data. The performance analysis of the models is given in Table 5 with different metrics and model parameters. The best accuracy among the models is provided by the CNN algorithm. Contrary to binary classification, Transformer-based models are left behind in the multi-class classification problem. When using pre-trained models by Google, the layered architecture of the models is not good enough for multi-class classification. On the other hand, the CNN model created using certain parameters performs very well in abstract feature extraction. With this feature, it has been more successful in the multiple-classification problem.

4.5. Predicting Information Diffusion on WaterQualityTweets

In this section, we outline our suggested strategy for forecasting and analyzing information diffusion. We utilize the number of retweets as a target variable in our prediction models since it is the most representative indicator of information spread. Depending on the type of classification, we must label the data appropriately or, in other words, create classes from our numerical goal variable before applying any of the supervised machine learning models. Low (zero to ten retweets) and high (more than ten retweets) are the two classes we use. We consider the following features for our prediction model: tweet text, reply, like, and view. We employ the k-fold cross-validation technique for our research, which randomly divides the data into k samples and trains the model several times with each iteration providing a test for the subsequent instance. For our experiments, we evaluate our model using k = 10. We use the DT, RF, GB, GNB, and MLP algorithms for the prediction task. Table 6 shows the summary of results for the information diffusion prediction task. We can conclude that the DT, RF, and GB algorithms performed better than the others.

4.6. Comparison with the State-of-the-Art Work

This sub-section explains the comparison with the state-of-the-art work. Table 7 presents a comparison with the state-of-the-art studies in the literature. In social media posts, Ahmad et al. [23] offered an ensemble framework for analyzing water quality. Various pre-processing, data augmentation, classification, and fusion procedures are analyzed and assessed with this end in mind. Hanif et al. [24] suggested using the Bidirectional Encoder Representations from Transformers (BERT) method to find tweets on water quality. In addition, the technique makes use of Visual Geometry Group (VGG16), a pre-trained model on the ImageNet dataset, to binary categorize the photos according to whether they show signs of good water quality. Said et al. [73] analyze text and visual data obtained via Twitter for flood detection. Text-based data are collected in Italian and Turkish. For the classification of text data, three different methods were tried using the Bag of Words and BERT models. Visual data are correlated using ImageNet. When text- and image-based models (multi-model) are combined, an 80% F1 score is obtained for flood detection. Ayub et al. [74] analyze whether social media posts are related to water quality. There are three different models in the study, which focuses more on tweets with text content. After the BERT, XLM-RoBERTa, and LSTM algorithms are analyzed individually, all models are tested as a single fusion model. The fusion model does not show any significant improvement compared to the individual models. These studies only focus on binary classification (water quality-related or not). We also study multi-class classification for deeper analysis so the authority can take different actions based on different water quality issues. Also, we propose a scalable messaging system to send these different issues to the different topics and to the different subscribers. None of them has a scalable system.
To improve distribution system monitoring efforts, identify emerging water quality issues, and take action before they become problems, a water quality-sensing system offers a methodical framework. Thus, the principal findings show that social data related to water quality can be classified with different novel methods and their result may help the authorities take true actions via the scalable messaging system.
The use of social media data to analyze water quality can have both beneficial and detrimental effects. Positively, social media networks can offer real-time information from a lot of people, enabling the earlier discovery of problems with water quality and speedier responses. Social media can also improve the monitoring and management of water quality by raising public awareness and engagement. However, social media data can also provide difficulties in the analysis of water quality. Social media data may be inaccurate or biased and may not have undergone thorough scientific analysis. Concerns about privacy may also exist about the usage of personal data obtained via social media. It is crucial to rigorously validate and cross-check information collected from social media and to use it with other sources of information to overcome these difficulties.

5. Conclusions

The scientific community has recently become interested in water quality analysis, and several novel solutions involving various information sources have been put forth. One possibility for gathering pertinent comments on water quality has been crowd-sourcing, but recruiting enough people is a laborious and time-consuming procedure. A better platform for enlisting numerous volunteers in crowd-sourcing for water quality analysis is provided by social media platforms. This paper demonstrates how the ML and NLP techniques enable automatic analysis and information extraction from big datasets of social media messages (tweets). The classification results are significantly improved by employing a precise data-collection process and pre-processing steps. Also, a scalable messaging system enables the topic-based distribution of tweets to different subscribers.
Our paper has some limitations due to using Twitter data, as follows: (i) The difficulty of responding to rumors, misinformation, and critical remarks. (ii) While Twitter has a large user base, the number of tweets on a particular topic may be limited. This can impact the representativeness of the data. (iii) Twitter users may not be representative of the general population, as the platform may attract certain demographics more than others. This can impact the generalizability of the findings.
We will focus on the following topics in the future:
  • Explainability in water-management systems refers to the ability to explain the decisions and predictions that have been made by an AI-based system. Explainability can provide insight into why and how an AI-based system has arrived at a certain decision, enabling users to evaluate the accuracy and reliability of the system. This can be used by water-management teams to better identify areas of concern and inform decisions about how best to allocate resources and solve issues related to water quality, safety, and sustainability. Recent initiatives to increase black-box models’ explainability lie under the purview of XAI research.
  • Data visualization is the use of visual components to effectively communicate the relevance of large datasets and to find undiscovered data trends. Charts, graphs, maps, tables, and other visual representations of data are all examples of data visualization. Interactive data visualization, on the other hand, allows users to directly alter plot elements and create connections between several plots. Decision-makers can more easily and swiftly understand analytical data with the help of data visualization, especially those without a background in computer science or statistical analysis. In most cases, the graphical user interface (GUI) is furnished by the user interface layer of water-management systems, allowing users to export, view, and summarize data, along with editing the data quality.
  • The size of datasets is expanding quickly at a rate of millions per second. To extract knowledge or make an accurate prediction, integrating, analyzing, and mining enormous amounts of data requires an effective and efficient framework and an algorithm. Due to the continuous evolution of data streams, predicting water quality issues and monitoring water quality at high speed are crucial challenges. Most current and traditional techniques rely significantly on stationary data, and it can take a centralized algorithm hours or even days to compute and identify accurate results. Thus, parallel and distributed computing is critical in reducing the execution time, which can fit the need for real-time or near-real-time detection and monitoring.
  • Utilizing the additional data offered in the form of images and meta-data to improve the framework’s efficiency.
  • Implementing advanced fusion schemes through the assignment of merit-based weights to the contributing models.

Author Contributions

Conceptualization, S.B.K. and S.E.; methodology, S.E.; writing—original draft preparation, S.B.K. and S.E.; writing—review and editing, S.B.K. and S.E.; visualization, S.B.K.; supervision, S.E. All authors have read and agreed to the published version of the manuscript.

Funding

This study was supported by the Scientific and Technological Research Council of Turkey (TUBITAK), project number 122E610.

Institutional Review Board Statement

Not applicable.

Informed Consent Statement

Not applicable.

Data Availability Statement

Conflicts of Interest

The authors declare no conflict of interest. The funders had no role in the design of the study; in the collection, analyses, or interpretation of data; in the writing of the manuscript; or in the decision to publish the results.

References

  1. Del Vecchio, P.; Mele, G.; Passiante, G.; Vrontis, D.; Fanuli, C. Detecting customers knowledge from social media big data: Toward an integrated methodological framework based on netnography and business analytics. J. Knowl. Manag. 2020, 24, 799–821. [Google Scholar] [CrossRef]
  2. Shu, K.; Sliva, A.; Wang, S.; Tang, J.; Liu, H. Fake news detection on social media: A data mining perspective. Acm Sigkdd Explor. Newsl. 2017, 19, 22–36. [Google Scholar] [CrossRef]
  3. Quijano-Sánchez, L.; Cantador, I.; Cortés-Cediel, M.E.; Gil, O. Recommender systems for smart cities. Inf. Syst. 2020, 92, 101545. [Google Scholar] [CrossRef]
  4. Aguilera, U.; Peña, O.; Belmonte, O.; López-de Ipiña, D. Citizen-centric data services for smarter cities. Future Gener. Comput. Syst. 2017, 76, 234–247. [Google Scholar] [CrossRef]
  5. Komninos, N.; Bratsas, C.; Kakderi, C.; Tsarchopoulos, P. Smart city ontologies: Improving the effectiveness of smart city applications. J. Smart Cities 2016, 1, 1–16. [Google Scholar] [CrossRef]
  6. Eken, S. An exploratory teaching program in big data analysis for undergraduate students. J. Ambient. Intell. Humaniz. Comput. 2020, 11, 4285–4304. [Google Scholar] [CrossRef]
  7. Premkumar, M.; Jangir, P.; Sowmya, R.; Elavarasan, R.M. Many-objective gradient-based optimizer to solve optimal power flow problems: Analysis and validations. Eng. Appl. Artif. Intell. 2021, 106, 104479. [Google Scholar] [CrossRef]
  8. Pandya, S.B.; Ravichandran, S.; Manoharan, P.; Jangir, P.; Alhelou, H.H. Multi-objective optimization framework for optimal power flow problem of hybrid power systems considering security constraints. IEEE Access 2022, 10, 103509–103528. [Google Scholar] [CrossRef]
  9. Mirjalili, S.; Jangir, P.; Mirjalili, S.Z.; Saremi, S.; Trivedi, I.N. Optimization of problems with multiple objectives using the multi-verse optimization algorithm. Knowl.-Based Syst. 2017, 134, 50–71. [Google Scholar] [CrossRef]
  10. Quadar, N.; Chehri, A.; Jeon, G.; Ahmad, A. Smart water distribution system based on IoT networks, a critical review. In Proceedings of the Human Centred Intelligent Systems: KES-HCIS 2020 Conference, Split, Croatia, 17–19 June 2020; Springer: Berlin/Heidelberg, Germany, 2021; pp. 293–303. [Google Scholar]
  11. Nakhaei, M.; Akrami, M.; Gheibi, M.; Coronado, P.D.U.; Hajiaghaei-Keshteli, M.; Mahlknecht, J. A novel framework for technical performance evaluation of water distribution networks based on the water-energy nexus concept. Energy Convers. Manag. 2022, 273, 116422. [Google Scholar] [CrossRef]
  12. Daulat, S.; Rokstad, M.M.; Klein-Paste, A.; Langeveld, J.; Tscheikner-Gratl, F. Challenges of integrated multi-infrastructure asset management: A review of pavement, sewer, and water distribution networks. Struct. Infrastruct. Eng. 2022, 1–20. [Google Scholar] [CrossRef]
  13. Uddin, M.G.; Nash, S.; Olbert, A.I. A review of water quality index models and their use for assessing surface water quality. Ecol. Indic. 2021, 122, 107218. [Google Scholar] [CrossRef]
  14. Chen, Y.; Song, L.; Liu, Y.; Yang, L.; Li, D. A review of the artificial neural network models for water quality prediction. Appl. Sci. 2020, 10, 5776. [Google Scholar] [CrossRef]
  15. ÖzçelIk, I.; Iskefiyeli, M.; Balta, M.; Akpinar, K.O.; Toker, F.S. Center water: A secure testbed infrastructure proposal for waste and potable water management. In Proceedings of the 2021 9th International Symposium on Digital Forensics and Security (ISDFS), Elazig, Turkey, 8–29 June 2021; IEEE: Piscataway, NY, USA, 2021; pp. 1–7. [Google Scholar]
  16. Wade, T.J.; Pai, N.; Eisenberg, J.N.; Colford, J.M., Jr. Do US Environmental Protection Agency water quality guidelines for recreational waters prevent gastrointestinal illness? A systematic review and meta-analysis. Environ. Health Perspect. 2003, 111, 1102–1109. [Google Scholar] [CrossRef]
  17. WHO. Guidelines for Drinking-Water Quality; World Health Organization: Geneva, Switzerland, 2004; Volume 1. [Google Scholar]
  18. Yurtsever, M.M.E.; Shiraz, M.; Ekinci, E.; Eken, S. Comparing COVID-19 vaccine passports attitudes across countries by analysing Reddit comments. J. Inf. Sci. 2023, 01655515221148356. [Google Scholar] [CrossRef]
  19. Yavuz, A.; Eken, S. Gold Returns Prediction: Assessment based on Major Events. Eai Endorsed Trans. Scalable Inf. Syst. 2023. [CrossRef]
  20. Özgüven, Y.M.; Eken, S. Distributed messaging and light streaming system for combating pandemics. J. Ambient. Intell. Humaniz. Comput. 2021, 14, 773–787. [Google Scholar] [CrossRef]
  21. Shao, Z.; Sumari, N.S.; Portnov, A.; Ujoh, F.; Musakwa, W.; Mandela, P.J. Urban sprawl and its impact on sustainable urban development: A combination of remote sensing and social media data. Geo-Spat. Inf. Sci. 2021, 24, 241–255. [Google Scholar] [CrossRef]
  22. Andreadis, S.; Gialampoukidis, I.; Bozas, A.; Moumtzidou, A.; Fiorin, R.; Lombardo, F.; Karakostas, A.; Norbiato, D.; Vrochidis, S.; Ferri, M.; et al. Watermm: Water quality in social multimedia task at mediaeval 2021. In Proceedings of the MediaEval 2021 Workshop, Online, 13–15 December 2021. [Google Scholar]
  23. Ahmad, K.; Ayub, M.; Khan, J.; Ahmad, N.; Al-Fuqaha, A. Social Media as an Instant Source of Feedback on Water Quality. IEEE Trans. Technol. Soc. 2022. [Google Scholar] [CrossRef]
  24. Hanif, M.; Khawar, A.; Tahir, M.A.; Rafi, M. Deep Learning Based Framework for Classification of Water Quality in Social Media Data. In Proceedings of the MediaEval 2021 Workshop, Online, 13–15 December 2021. [Google Scholar]
  25. Zheng, H.; Hong, Y.; Long, D.; Jing, H. Monitoring surface water quality using social media in the context of citizen science. Hydrol. Earth Syst. Sci. 2017, 21, 949–961. [Google Scholar] [CrossRef]
  26. Mallick, R.; Bajpai, S.P. Impact of social media on environmental awareness. In Environmental Awareness and the Role of Social Media; IGI Global: Hershey, PA, USA, 2019; pp. 140–149. [Google Scholar]
  27. Dewinta, A.; Irawan, M.I. Customer complaints clusterization of government drinking water company on social media twitter using text mining. In Proceedings of the 2021 3rd East Indonesia Conference on Computer and Information Technology (EIConCIT), Surabaya, Indonesia, 9–11 April 2021; IEEE: Piscataway, NY, USA, 2021; pp. 338–342. [Google Scholar]
  28. Shan, S.; Peng, J.; Wei, Y. Environmental Sustainability assessment 2.0: The value of social media data for determining the emotional responses of people to river pollution—A case study of Weibo (Chinese Twitter). Socio-Econ. Plan. Sci. 2021, 75, 100868. [Google Scholar] [CrossRef]
  29. Li, L.; Liu, X.; Zhang, X. Public attention and sentiment of recycled water: Evidence from social media text mining in China. J. Clean. Prod. 2021, 303, 126814. [Google Scholar] [CrossRef]
  30. Xiong, J.; Hswen, Y.; Naslund, J.A. Digital surveillance for monitoring environmental health threats: A case study capturing public opinion from Twitter about the 2019 Chennai water crisis. Int. J. Environ. Res. Public Health 2020, 17, 5077. [Google Scholar] [CrossRef]
  31. Sun, A.Y.; Scanlon, B.R. How can Big Data and machine learning benefit environment and water management: A survey of methods, applications, and future directions. Environ. Res. Lett. 2019, 14, 073001. [Google Scholar] [CrossRef]
  32. Balta, S.; Zavrak, S.; Eken, S. Real-Time Monitoring and Scalable Messaging of SCADA Networks Data: A Case Study on Cyber-Physical Attack Detection in Water Distribution System. In Proceedings of the International Congress of Electrical and Computer Engineering, Virtual, 9–12 February 2022; Springer: Berlin/Heidelberg, Germany, 2022; pp. 203–215. [Google Scholar]
  33. Difallah, D.E.; Cudre-Mauroux, P.; McKenna, S.A. Scalable anomaly detection for smart city infrastructure networks. IEEE Internet Comput. 2013, 17, 39–47. [Google Scholar] [CrossRef]
  34. Wu, C.; Buyya, R. Cloud Data Centers and Cost Modeling: A Complete Guide to Planning, Designing and Building a Cloud Data Center; Morgan Kaufmann: Burlington, MA, USA, 2015. [Google Scholar]
  35. Ahmed, A.A.; Al Omari, S.; Awal, R.; Fares, A.; Chouikha, M. A distributed system for supporting smart irrigation using Internet of Things technology. Eng. Rep. 2021, 3, e12352. [Google Scholar] [CrossRef]
  36. Hoskins, A.; Stoianov, I. Infrasense: A distributed system for the continuous analysis of hydraulic transients. Procedia Eng. 2014, 70, 823–832. [Google Scholar] [CrossRef]
  37. Amoretti, M.; Rizzini, D.L.; Penzotti, G.; Caselli, S. A scalable distributed system for precision irrigation. In Proceedings of the 2020 IEEE International Conference on Smart Computing (SMARTCOMP), Bologna, Italy, 14–17 September 2020; IEEE: Piscataway, NY, USA, 2020; pp. 338–343. [Google Scholar]
  38. Zoss, B.M.; Mateo, D.; Kuan, Y.K.; Tokić, G.; Chamanbaz, M.; Goh, L.; Vallegra, F.; Bouffanais, R.; Yue, D.K. Distributed system of autonomous buoys for scalable deployment and monitoring of large waterbodies. Auton. Robot. 2018, 42, 1669–1689. [Google Scholar] [CrossRef]
  39. Encinas, C.; Ruiz, E.; Cortez, J.; Espinoza, A. Design and implementation of a distributed IoT system for the monitoring of water quality in aquaculture. In Proceedings of the 2017 Wireless Telecommunications Symposium (WTS), Chicago, IL, USA, 26–28 April 2017; IEEE: Piscataway, NY, USA, 2017; pp. 1–7. [Google Scholar]
  40. Tuna, G.; Arkoc, O.; Gulez, K. Continuous monitoring of water quality using portable and low-cost approaches. Int. J. Distrib. Sens. Netw. 2013, 9, 249598. [Google Scholar] [CrossRef]
  41. Hong, L.; Dan, O.; Davison, B.D. Predicting popular messages in twitter. In Proceedings of the 20th International Conference Companion on World Wide Web, Hyderabad, India, 28 March–1 April 2011; pp. 57–58. [Google Scholar]
  42. Naveed, N.; Gottron, T.; Kunegis, J.; Alhadi, A.C. Bad news travel fast: A content-based analysis of interestingness on twitter. In Proceedings of the 3rd International Web Science Conference, Koblenz, Germany, 14–17 June 2011; pp. 1–7. [Google Scholar]
  43. Shafiq, Z.; Liu, A. Cascade size prediction in online social networks. In Proceedings of the 2017 IFIP Networking Conference (IFIP Networking) and Workshops, Stockholm, Sweden, 12–16 June 2017; IEEE: Piscataway, NY, USA, 2017; pp. 1–9. [Google Scholar]
  44. Kupavskii, A.; Ostroumova, L.; Umnov, A.; Usachev, S.; Serdyukov, P.; Gusev, G.; Kustarev, A. Prediction of retweet cascade size over time. In Proceedings of the 21st ACM International Conference on Information and Knowledge Management, Maui, HI, USA, 29 October–2 November 2012; pp. 2335–2338. [Google Scholar]
  45. Mix, N.; George, A.; Haas, A. Social media monitoring for water quality surveillance and response systems. AWWA Water Sci. 2020, 112, 44. [Google Scholar] [CrossRef] [PubMed]
  46. Devlin, J.; Chang, M.W.; Lee, K.; Toutanova, K. Bert: Pre-training of deep bidirectional transformers for language understanding. arXiv 2018, arXiv:1810.04805. [Google Scholar]
  47. Vaswani, A.; Shazeer, N.; Parmar, N.; Uszkoreit, J.; Jones, L.; Gomez, A.N.; Kaiser, Ł.; Polosukhin, I. Attention is all you need. In Proceedings of the 31st Conference on Neural Information Processing Systems (NIPS 2017), Long Beach, CA, USA, 4–9 December 2017; Volume 30. [Google Scholar]
  48. Choi, H.; Kim, J.; Joe, S.; Gwon, Y. Evaluation of bert and albert sentence embedding performance on downstream nlp tasks. In Proceedings of the 2020 25th International Conference on Pattern Recognition (ICPR), Milan, Italy, 10–15 January 2021; IEEE: Piscataway, NY, USA, 2021; pp. 5482–5487. [Google Scholar]
  49. Gargiulo, F.; Minutolo, A.; Guarasci, R.; Damiano, E.; De Pietro, G.; Fujita, H.; Esposito, M. An ELECTRA-Based Model for Neural Coreference Resolution. IEEE Access 2022, 10, 75144–75157. [Google Scholar] [CrossRef]
  50. Liu, Y.; Ott, M.; Goyal, N.; Du, J.; Joshi, M.; Chen, D.; Levy, O.; Lewis, M.; Zettlemoyer, L.; Stoyanov, V. Roberta: A robustly optimized bert pretraining approach. arXiv 2019, arXiv:1907.11692. [Google Scholar]
  51. Chen, X.; Beaver, I.; Freeman, C. Fine-Tuning Language Models For Semi-Supervised Text Mining. In Proceedings of the 2020 IEEE International Conference on Big Data (Big Data), Atlanta, GA, USA, 10–13 December 2020; IEEE: Piscataway, NY, USA, 2020; pp. 3608–3617. [Google Scholar]
  52. Clark, K.; Luong, M.T.; Le, Q.V.; Manning, C.D. Electra: Pre-training text encoders as discriminators rather than generators. arXiv 2020, arXiv:2003.10555. [Google Scholar]
  53. Perera, N.; Nguyen, T.T.L.; Dehmer, M.; Emmert-Streib, F. Comparison of text mining models for food and dietary constituent named-entity recognition. Mach. Learn. Knowl. Extr. 2022, 4, 254–275. [Google Scholar] [CrossRef]
  54. Boser, B.E.; Guyon, I.M.; Vapnik, V.N. A training algorithm for optimal margin classifiers. In Proceedings of the Fifth Annual Workshop on Computational Learning Theory, Pittsburgh, PA, USA, 27-29 July 1992; pp. 144–152. [Google Scholar]
  55. Vapnik, V.N. Adaptive and learning systems for signal processing communications, and control. Stat. Learn. Theory 1998, 244–245. [Google Scholar] [CrossRef]
  56. Smola, A.; Schölkopf, B. From regularization operators to support vector kernels. Adv. Neural Inf. Process. Syst. 1997, 10. [Google Scholar]
  57. Azimi-Pour, M.; Eskandari-Naddaf, H.; Pakzad, A. Linear and non-linear SVM prediction for fresh properties and compressive strength of high volume fly ash self-compacting concrete. Constr. Build. Mater. 2020, 230, 117021. [Google Scholar] [CrossRef]
  58. LeCun, Y.; Bottou, L.; Bengio, Y.; Haffner, P. Gradient-based learning applied to document recognition. Proc. IEEE 1998, 86, 2278–2324. [Google Scholar] [CrossRef]
  59. Albawi, S.; Mohammed, T.A.; Al-Zawi, S. Understanding of a convolutional neural network. In Proceedings of the 2017 International Conference on Engineering and Technology (ICET), Antalya, Turkey, 21–23 August 2017; IEEE: Piscataway, NY, USA, 2017; pp. 1–6. [Google Scholar]
  60. Russakovsky, O.; Deng, J.; Su, H.; Krause, J.; Satheesh, S.; Ma, S.; Huang, Z.; Karpathy, A.; Khosla, A.; Bernstein, M.; et al. Imagenet large scale visual recognition challenge. Int. J. Comput. Vis. 2015, 115, 211–252. [Google Scholar] [CrossRef]
  61. Simonyan, K.; Zisserman, A. Very deep convolutional networks for large-scale image recognition. arXiv 2014, arXiv:1409.1556. [Google Scholar]
  62. Szegedy, C.; Vanhoucke, V.; Ioffe, S.; Shlens, J.; Wojna, Z. Rethinking the inception architecture for computer vision. In Proceedings of the IEEE Conference on Computer Vision and Pattern Recognition, Las Vegas, NV, USA, 27–30 June 2016; pp. 2818–2826. [Google Scholar]
  63. He, K.; Zhang, X.; Ren, S.; Sun, J. Deep residual learning for image recognition. In Proceedings of the IEEE Conference on Computer Vision and Pattern Recognition, Las Vegas, NV, USA, 27–30 June 2016; pp. 770–778. [Google Scholar]
  64. Szegedy, C.; Liu, W.; Jia, Y.; Sermanet, P.; Reed, S.; Anguelov, D.; Erhan, D.; Vanhoucke, V.; Rabinovich, A. Going deeper with convolutions. In Proceedings of the IEEE Conference on Computer Vision and Pattern Recognition, Boston, MA, USA, 7–12 June 2015; pp. 1–9. [Google Scholar]
  65. Hui, D.S.; Azhar, E.I.; Madani, T.A.; Ntoumi, F.; Kock, R.; Dar, O.; Ippolito, G.; Mchugh, T.D.; Memish, Z.A.; Drosten, C.; et al. The continuing 2019-nCoV epidemic threat of novel coronaviruses to global health—The latest 2019 novel coronavirus outbreak in Wuhan, China. Int. J. Infect. Dis. 2020, 91, 264–266. [Google Scholar] [CrossRef]
  66. Car, Z.; Baressi Šegota, S.; Andjelić, N.; Lorencin, I.; Mrzljak, V. Modeling the spread of COVID-19 infection using a multilayer perceptron. Comput. Math. Methods Med. 2020, 2020, 5714714. [Google Scholar] [CrossRef]
  67. Hochreiter, S.; Schmidhuber, J. LSTM can solve hard long time lag problems. Adv. Neural Inf. Process. Syst. 1996, 9, 473–479. [Google Scholar]
  68. Hochreiter, S.; Schmidhuber, J. Long short-term memory. Neural Comput. 1997, 9, 1735–1780. [Google Scholar] [CrossRef]
  69. Van Houdt, G.; Mosquera, C.; Nápoles, G. A review on the long short-term memory model. Artif. Intell. Rev. 2020, 53, 5929–5955. [Google Scholar] [CrossRef]
  70. Kreps, J.; Narkhede, N.; Rao, J. Kafka: A distributed messaging system for log processing. In Proceedings of the NetDB, Athens, Greece, 12–16 June 2011; Volume 11, pp. 1–7. [Google Scholar]
  71. Fabret, F.; Jacobsen, H.A.; Llirbat, F.; Pereira, J.; Ross, K.A.; Shasha, D. Filtering algorithms and implementation for very fast publish/subscribe systems. In Proceedings of the 2001 ACM SIGMOD International Conference on Management of Data, Santa Barbara, CA, USA, 21–24 May 2001; pp. 115–126. [Google Scholar]
  72. Eugster, P.T.; Guerraoui, R.; Sventek, J. Type-Based Publish/Subscribe. Ph.D. Thesis, Università della Svizzera Italiana (USI), Lugano, Switzerland, 2000. [Google Scholar]
  73. Said, N.; Ahmad, K.; Gul, A.; Ahmad, N.; Al-Fuqaha, A. Floods detection in twitter text and images. arXiv 2020, arXiv:2011.14943. [Google Scholar]
  74. Ayub, M.A.; Ahmad, K.; Ahmad, K.; Ahmad, N.; Al-Fuqaha, A. Nlp techniques for water quality analysis in social media content. arXiv 2021, arXiv:2112.11441. [Google Scholar]
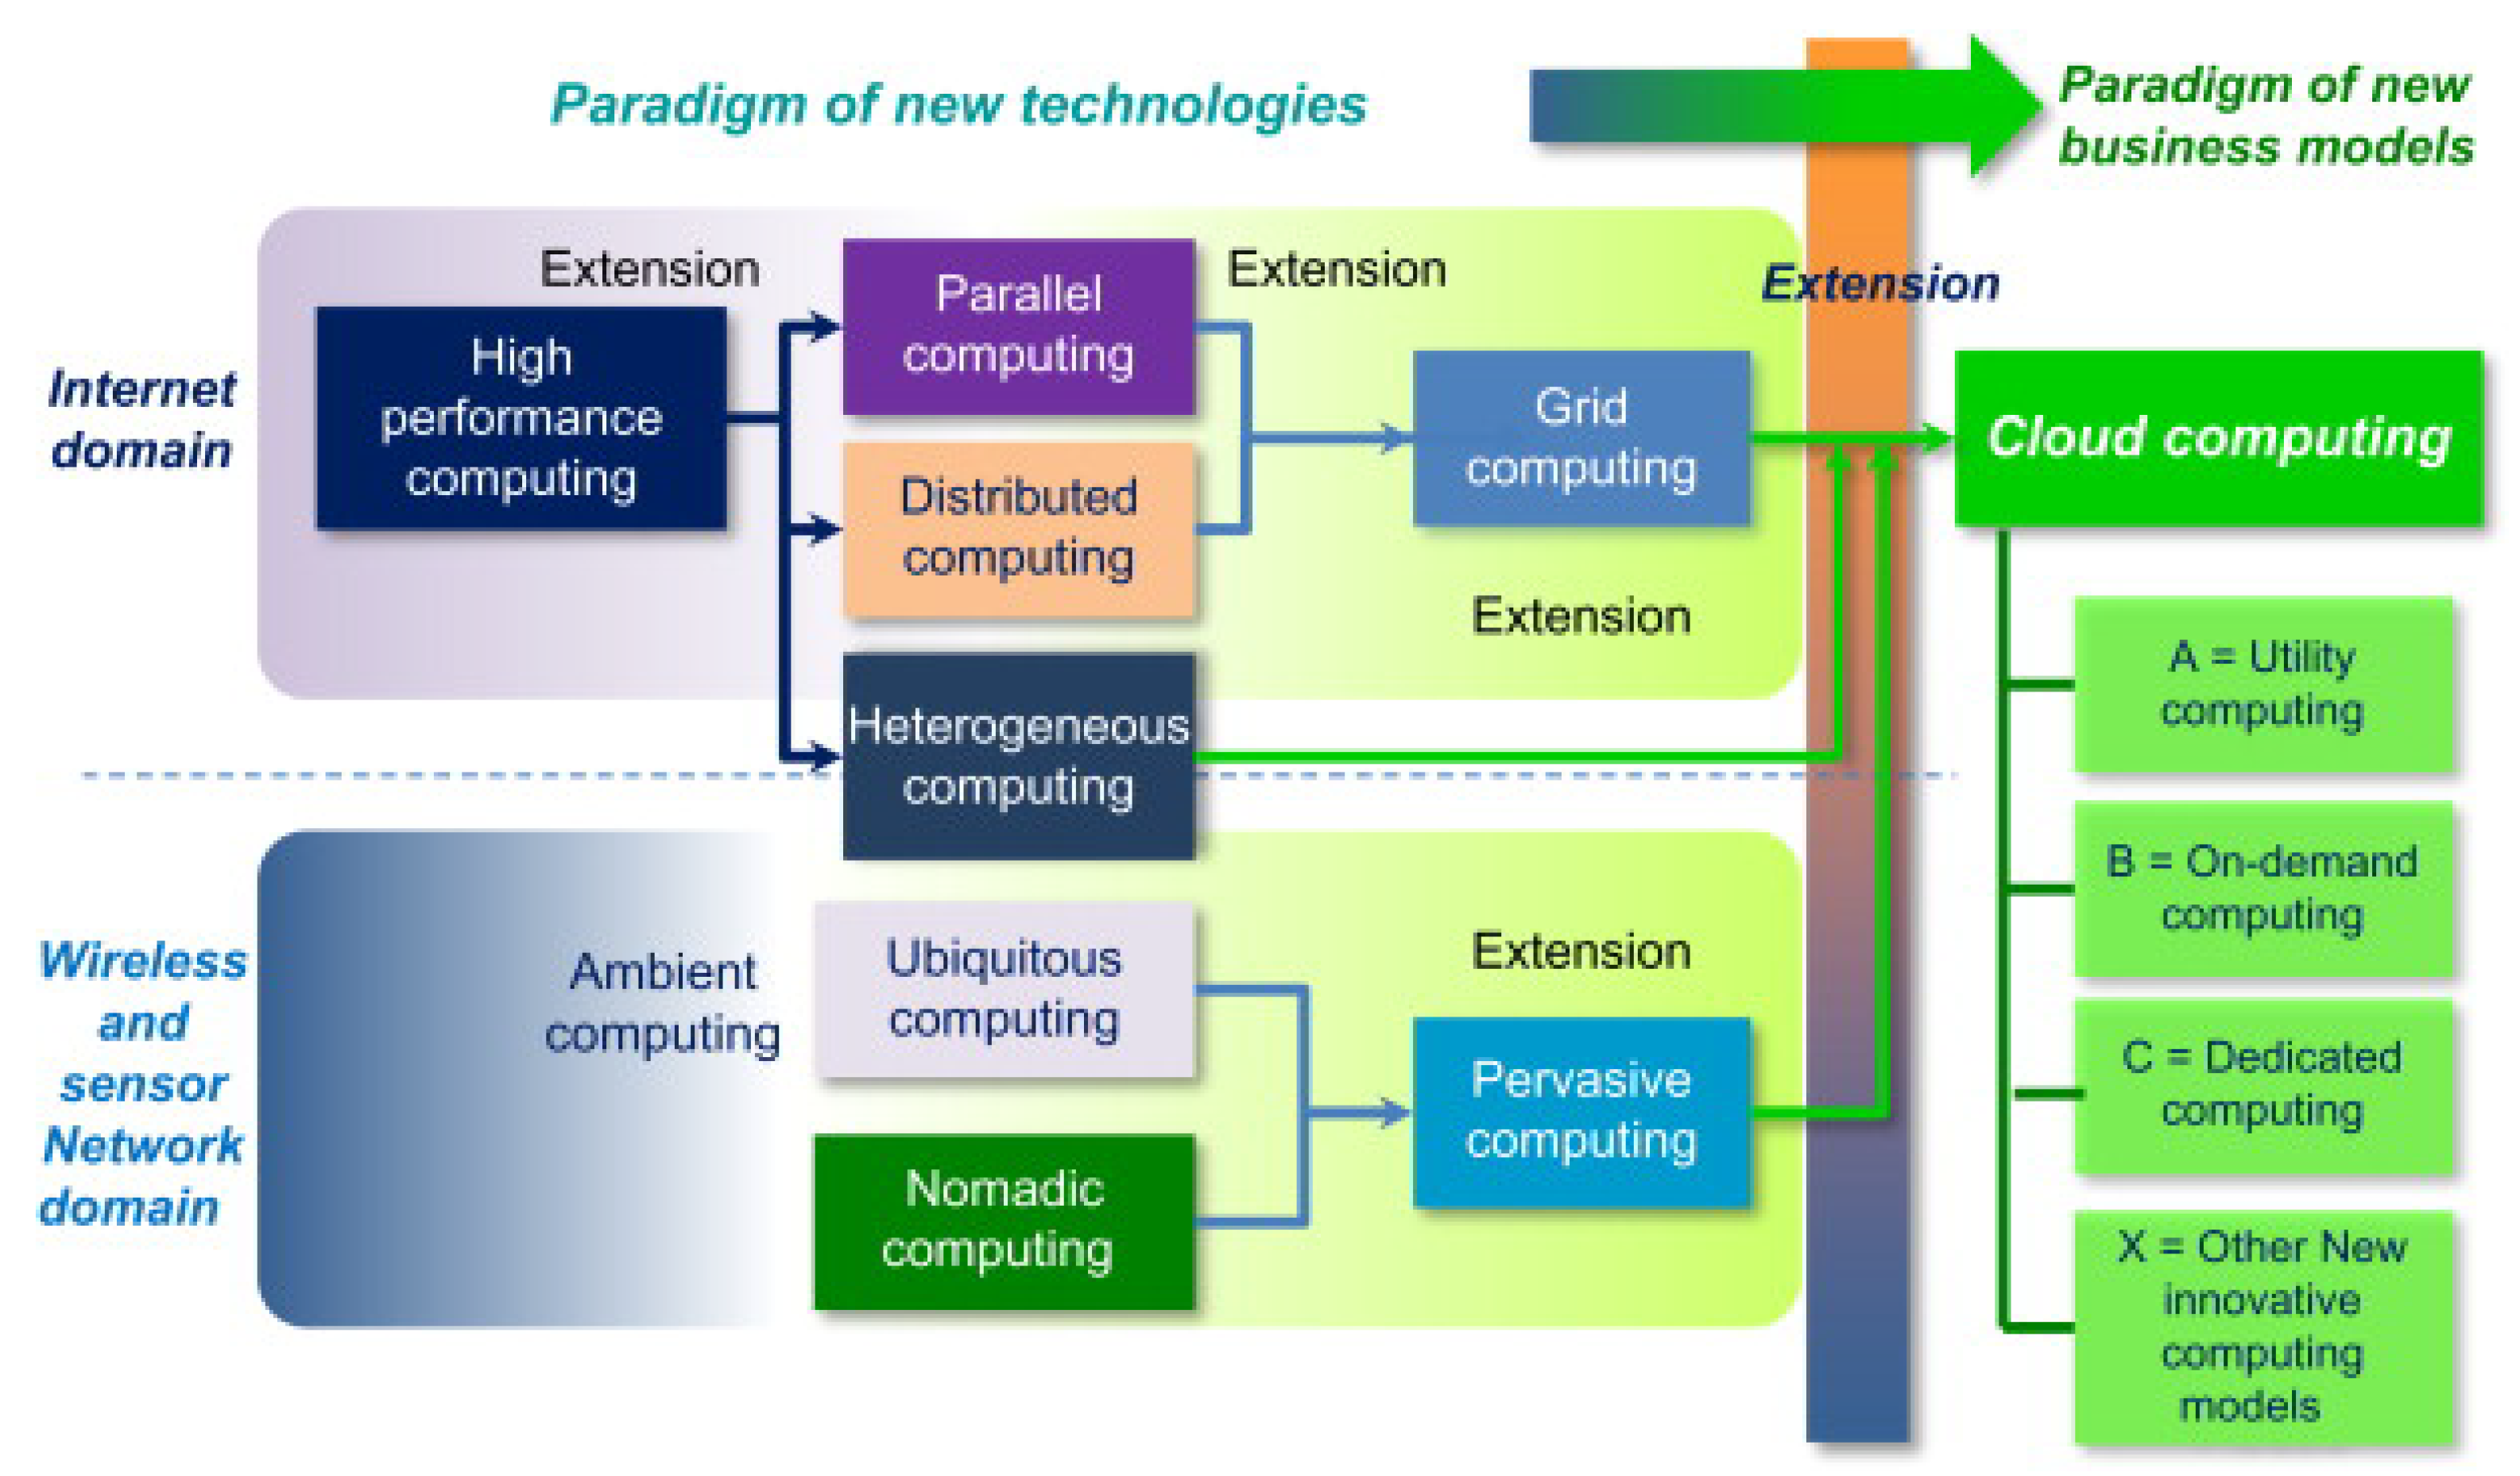
Figure 1. Paradigm shift from technologies to business models [34].
Water 15 03171 g001
Figure 2. Design elements for customer complaint surveillance of water-management system.
Water 15 03171 g002
Figure 3. Example water user complaint tier chart [45].
Water 15 03171 g003
Figure 4. Distributed messaging system for stream water quality data.
Water 15 03171 g004
Figure 5. Tweet length comparison for related and unrelated water quality tweets.
Water 15 03171 g005
Figure 6. Tweet length comparison for all classes in the dataset.
Water 15 03171 g006
Figure 7. Most frequently occurring words for each class.
Water 15 03171 g007
Table 1. Search keywords for data collection.
Words to Search For—e.g., using ‘OR’, ‘AND’
General Terms (to be called G.T.)
Drink water
Water
Bad
Wrong
Undrinkable Problem
Issue
Class 0—Color
Color
Colored
Discolored
Dirty/dirt
Unclear
Muddy
Chalky
Blurry
Sludgy
Slimy
Lime
Limy
Gray/grey
Dark
Red
Black
Brown
Yellow
Class 1—Illness
Illness
Sick
Ill
Made me
Vomit
Fire
Stomach
Megrim
 Puke
 Spew
 Headache
  Diarrhea
  Influenza
  Nausea
Class 2—Odor/Taste
Smells like
Tastes like
Taste
Odor
Smell
Mold
Mildy
Rotten
Ether
Oil
Metal
Petroleum
Plastic
Rust/rusty
Chlorine
Rubber
Sulfur
Gas
Chemical
Septic
Class 3—Unusual State
Looks
Appears
Unusual
Particles
Stain
Rust/rusty
Oil/oily
 Grease/Greasily
 Bacteria
 Bacterium
  Aluvyon
  Specks
  Cloudy
  Floaters
Words to Exclude—e.g., using AND NOT
Excellent
Perfect
Wonderful
Fabulous
Fantastic
Beautiful
 Flower
 Good
 Fine
  Sweet
  Pretty
  Clear
  Bright
Table 2. Examples from WaterQualityTweets dataset for each class.
TextClass
My fear of flying has me checking the age of the plane and I saw it was 20 and now I feel worse.unrelated
Reporter muddies the waters and complains about muddy water you are a big part of the problem.related (color)
Yes, the healthy colon absorbs water but diarrhea indicates ill health.related (illness)
I am washing my hands in this building and the water smells like rotten eggs.related (odor/taste)
I feel like they should test that water now they have got a chance. It is probably full of bacteria.related (unusual state)
Table 3. Class distribution of WaterQualityTweets dataset.
ClassNumber of Raw DataAfter Pre-Processing
unrelated54,99118,981
color19,7885032
illness10,7084825
odor/taste22,0385572
unusual state20,4154395
Table 4. Binary classification performance results.
ModelParametersAccuracyPrecisionRecallF1 Score
SVMLinearSVC0.95010.95010.95060.9504
CNNlr = 5 × 10⁻⁴, 1 × 10⁻³
Softmax+reLu
0.850.85250.850.8475
MLPlr = 5 × 10⁻⁴
Softmax+reLu
0.760.76250.76250.7575
LSTMlr = 5 × 10⁻⁴
Softmax+reLu
0.950.9450.9450.95
BERTlr = 1 × 10⁻⁵
Batch size = 6
0.960.9550.9550.955
RoBERTalr = 1 × 10⁻⁵
Batch size = 6
0.950.9550.9550.955
ELECTRAlr = 1 × 10⁻⁴
Batch size = 6
0.950.9550.9550.95
Table 5. Multi-class classification performance results.
ModelParametersAccuracyPrecisionRecallF1 Score
SVMLinearSVC0.800.800.800.80
CNNlr = 5 × 10⁻⁴
Softmax+reLu
0.850.85250.850.8475
MLPlr = 5 × 10⁻⁴
Softmax + reLu
0.760.76250.76250.7575
BERTlr = 1 × 10⁻⁵
Batch size = 32
0.830.8350.840.8325
RoBERTalr = 1 × 10⁻⁵
Batch size = 32
0.830.8350.83750.83
ELECTRAlr = 1 × 10⁻⁴
Batch size = 6
0.830.8350.830.8275
Table 6. Performance results for predicting information diffusion.
ModelParametersAccuracyPrecisionRecallF1 Score
DTmax_depth = 220.870.860.870.86
RFn_estimators = 200,
n_jobs = −1,                           
bootstrap = True
0.870.870.870.86
GB learning_rate = 0.01,
n_estimators = 80,
max_depth = 10
0.870.870.870.86
GNBvar_smoothing = 1 × 10−40.690.710.690.70
MLPrandom_state = 1,
max_iter = 500,
learning_rate = ïnvscaling
0.750.730.750.74
Table 7. Comparison with the state-of-the-art work.
RefModelsTechniques and MethodsData
Type
Data
Languages
Best Model Performance
(F1 Score)
[23]BERTParticle Swarm Optimization (PSO)
Genetic Algorithm (GA), Brute Force (BF)
Nelder–Mead and Powell’s optimization
TextItalian
English
BERT: 0.81
BERT + BF: 0.85
XLM-RoBERTa
LSTM
[24]BERT1. task: text data + translation + binary classification
2. task: image + text
Text
Visual
Italian
English
BERT: 0.31
BERT + VGG16: 0.24
VGG16
[73]BOWText classificationText
Visual
Italian
English
BOW: 0.77
BERT
ImageNetImage classificationImageNet: 0.75
[74]BERTBinary cross entropy
Adaptive Moments (Adam) optimizer
Text×BERT: 0.79
XLM-RoBERTa
LSTM3 layers: input, lstm, output
Fusion Model Late Fusion: 0.79
Our
Study
SVMThe first stage: binary classification
Learning rate: 1 × 10⁻⁵, batch size: 6
Max length: 128
TextEnglishBERT: 0.96
CNN
MLP
LSTMThe second stage: multi-class classification
Learning rate: 5 × 10⁻⁴,
Softmax + relu activation function
Categorical cross-entropy, Nadam optimizer
CNN: 0.8475
BERT
RoBERTA
ELECTRA
Disclaimer/Publisher’s Note: The statements, opinions and data contained in all publications are solely those of the individual author(s) and contributor(s) and not of MDPI and/or the editor(s). MDPI and/or the editor(s) disclaim responsibility for any injury to people or property resulting from any ideas, methods, instructions or products referred to in the content.