Article

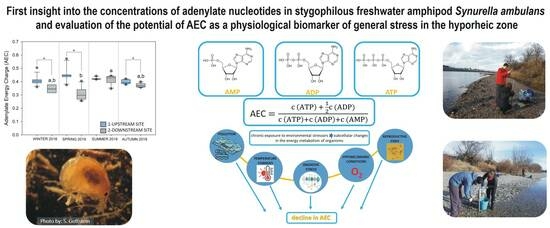
Energy Status of Stygophilous Amphipod Synurella ambulans as a Promising Biomarker of Environmental Stress in the Hyporheic Zone

1
Ruđer Bošković Institute, 10000 Zagreb, Croatia
2
Department of Biology, Faculty of Science, University of Zagreb, 10000 Zagreb, Croatia
3
Graduate School, University of Nova Gorica, Vipavska 13, 5000 Nova Gorica, Slovenia
*
Author to whom correspondence should be addressed.
Water 2023, 15(17), 3083; https://doi.org/10.3390/w15173083
Submission received: 13 July 2023 / Revised: 21 August 2023 / Accepted: 25 August 2023 / Published: 28 August 2023
(This article belongs to the Special Issue Groundwater and Connected Ecosystems)

Abstract

:
The hyporheic zone (HZ) is a sensitive ecotone in river ecosystems because of its biodiversity and susceptibility to human activities. Hyporheic fauna are exposed to multiple stressors that affect the physiology and metabolism of organisms and ultimately ecosystem functioning and biodiversity. This study aimed to quantify adenine nucleotides in the stygophilous freshwater amphipod Synurella ambulans and to evaluate the potential of adenylate energy charge (AEC) as a physiological biomarker of general stress in the HZ of the Sava River at sites with different intensities of environmental and anthropogenic stress. Field studies were conducted seasonally (in December 2018 and April, July, and October 2019) at two sampling sites, one upstream (1-UP) and the other downstream (2-DOWN) of the discharge from the wastewater treatment plant using the standard piston pump. The amphipod population from site 1-UP had significantly higher AEC values than the population from site 2-DOWN in all seasons except summer. Coordinated changes in AEC values with the ATP/ADP ratio indicated differences in energy status between the two populations. However, no changes in the apparent equilibrium constant of adenylate kinase were observed, except in spring at site 1-UP. Multiple linear regression models showed the strongest associations of AEC with Fe and Zn accumulated in amphipods, followed by environmental factors (conductivity, dissolved O2, and concentrations of nitrites and phosphates in the interstitial water). AEC was shown to be a useful index of environmental stress in S. ambulans because it can directly measure the change in available energy and thus the metabolic stress to which the organism is exposed. Finally, seasonal and spatial variations in AEC values reflected ecological status in the HZ.

Graphical Abstract

1. Introduction

Adenylate energy charge (AEC) was first described 55 years ago [1] as an indicator of the energy status of cellular metabolism and reflects the level of energy available from adenylate turnover. AEC has been used as an index for assessing the general condition of organisms because it can provide information on the stress response at the cellular level and can be applied in laboratory tests and directly in situ [2,3]. Over the years, it has been used in environmental studies to confirm changes in ecological or physiological parameters, such as pollution [4,5], pollution and hypoxic stress [6,7], thermal stress [8], anoxic conditions [9,10], starvation, moulting [11] or reproductive status [12], which lead to perturbations in the production of adenylates and generally to a decrease in AEC in studied organisms, mainly invertebrates, either freshwater or marine. As a ratio of the concentrations of adenosine triphosphate (ATP), diphosphate (ADP) and monophosphate (AMP) it varies theoretically from 0 to 1 with maximal values of 0.8–0.9 [13]. Unlike vertebrates, invertebrates can survive lower levels of energy charge (0.3–0.4) due to looser regulation and, in particular, low efficiency of the enzyme AMP deaminase [14]. This was particularly observed in the laboratory studies on crustaceans [4] and bivalves [9], as well as in the field study on bivalves Dreissena polymorpha (Pallas, 1771) [15] and Mytilus galloprovincialis Lamarck, 1819 [12]. Furthermore, all of these studies have demonstrated how accurately and reliably the stress state of an organism can be assessed and how universally AEC can be used as a tool for monitoring and assessing toxicity in different species and habitats. Although AEC has been shown to be a reliable and sensitive measure of stress in organisms in laboratory bioassay studies, it failed to reveal pollution stress in the example of a field study on the population of Hediste diversicolor (O.F. Müller, 1776) in the Western Scheldt estuary [16]. The population of H. diversicolor that could have shown reduced AEC under the field conditions did not occur at sites where pollution was too severe because it was unable to grow or reproduce [16], raising the question of the usefulness of H. diveriscolor as a bioindicator species. On the other hand, a recent study has shown that AEC is a highly informative indicator of stress, and it was found that, unlike currently used indicators derived from blood biochemistry, AEC can directly measure the change in available energy and thus the metabolic stress to which a given tissue of chondrichthyans is exposed [17]. Therefore, one of the motivations for our current study was to test whether AEC can be reliably applied in a challenged hypogean environmental compartment, the hyporheic zone (HZ), using the stygophilous amphipod as a potential bioindicator organism.
The HZ is an active ecotone between surface water and groundwater. In a river system, the exchange of water, nutrients, and organic matter occurs due to variations in runoff, topography, and porosity of the riverbed. The upwelling subsurface water provides nutrients, while the downwelling river water provides dissolved oxygen and organic matter to the microorganisms and invertebrates inhabiting the HZ [18,19]. Sediments in the HZ of river systems are often contaminated with trace metals that are a legacy of natural processes and anthropogenic activities [20]. Fortunately, the HZ plays a crucial role in reducing pollution and has been called the “river’s liver” because the microbial communities of the HZ form a natural bioreactor for chemical contaminants [21]. However, if the level of contamination exceeds the capacity of the HZ to filter and process these contaminants, it can negatively impact the river ecosystem and its inhabitants. Because the HZ is known to be an essential habitat for invertebrates that form the basis of food webs in rivers [22], aquatic food webs can potentially be compromised by the multitude of types of contaminants that affect water and sediments in the HZ.
Although the Sava River is a major watershed in south-eastern Europe and an important corridor linking five countries, its HZ as a specific ecotone under anthropogenic pressure was poorly investigated. The middle and lower reaches of the Sava River are polluted by wastewater discharges from settlements and agricultural runoff [23]. A recent study on bacterial communities in the same section of the Sava River as in our study revealed that discharge of insufficiently treated effluents from pharmaceutical production altered physicochemical characteristics of the river sediments and the resident bacterial communities, which contributed to the enrichment of resistance genes to clinically important antibiotics [24]. Concentrations of trace elements in sediments quantified in that study (As, Cd, Cr, Co, Cu, Pb, Ni, and Zn) were higher at the discharge and downstream sites than at the upstream sites [24]. In addition, in the same study area, concentrations of potentially toxic elements (Cd, Cr, Cu, Ni, Pb, and Zn) were determined in the fine-grained fraction (<63 µm) and bulk of the sediment, and for all of these elements, except Ni [25], the values were below the Predicted No Effects Concentration (PNEC) [26].
Species of interstitial fauna inhabiting the water in the interstices of unconsolidated sediments in the HZ, called hyporheos, may serve as sentinels of exposure to environmental stressors (both anthropogenic and natural) and environmental health effects. In groundwater-connected ecosystems, sentinel species, as bioindicators that accumulate and concentrate pollutants in their tissues, can provide warning signals of potential impacts on both epigean and hypogean environments at different levels of biological organization. In the study on the composition of interstitial fauna and identification of dominant groups of aquatic invertebrates in the HZ of the Sava River, the amphipod Synurella ambulans (F. Müller, 1846) had the highest number of individuals per sample [27]. The species S. ambulans is widely distributed in various freshwater ecosystems in Croatia. It is a common inhabitant of groundwater-connected ecosystems such as karst springs [28], interstitial waters next to streams, and eutrophic waters next to flooding rivers such as oxbow lakes and flooded forests [29], and it is also noted at the bottom of deep lakes [30]. Therefore S. ambulans could be a valuable sentinel species in groundwater-connected ecosystems such as the HZ. Recently, the use of the hyporheic amphipod S. ambulans as a bioindicator of metal contamination in the HZ was evaluated [31], demonstrating its strong ability to concentrate metals from the environment, even when metal concentrations in interstitial water and sediments did not exceed the environmental quality standards (EQS) set by national and EU directive [32]. Metals accumulated in S. ambulans showed the strongest association with metal exposure levels in interstitial water, making it a suitable bioindicator organism of chronic metal contamination in the HZ [31].
In the current study, we determined for the first time AEC in populations of S. ambulans sampled seasonally at two study sites in the HZ of the Sava River, upstream and downstream of the discharge of treated wastewater from the wastewater treatment plant (WWTP). The aim of this study was to evaluate the potential of the AEC of the stygophilous amphipod S. ambulans as a physiological biomarker of general stress in the HZ under different intensities of environmental and anthropogenic stress. The underlying biological questions were: Do the values of AEC in S. ambulans populations differ between sampling sites and seasons? To what extent can environmental variables and accumulated metals in S. ambulans explain the variability in AEC values? This study contributes to the understanding of the holistic view of the energy metabolism of this particular member of the macrofauna in the HZ as a challenging environmental compartment.

2. Materials and Methods

2.1. Study Area

The study area is located in the lower section of the Upper Sava River Plain (in the north-west of the Republic of Croatia) which belongs to the water body type HR-R_5b, as very large lowland river in the Pannonian ecoregion [32,33,34]. The Sava River is polluted by point sources, of which the discharges from the WWTP of the town of Zaprešić and the city of Zagreb are the most important in this area. Two sampling sites were selected on gravel bars of the Sava River at different distances from the wastewater outlet of the Zaprešić WWTP. The WWTP of the town of Zaprešić receives treated wastewater from the pharmaceutical industry, bakers’ yeast production and the wastewater from the local municipality, which is then treated and subsequently discharged into the Sava River. Only primary (mechanical) treatment is carried out in this WWTP. The first sampling site (1-UP) near the village of Medsave (45°50′04″ N, 15°46′32″ E) in the rural zone with agricultural land is located about 3 km upstream from this wastewater outlet, and the second sampling site (2-DOWN) in an urban area of the city of Zagreb, near the Jarun district (45°46′24″ N, 15°55′56″ E), is located about 13 km downstream from it. The two sampling sites were chosen in order to compare the energy status (concentrations of adenine nucleotides, ATP/ADP ratios, and AEC values) of S. ambulans populations upstream and downstream of the WWTP of the town of Zaprešić, as a point source of pollution with conditions of pronounced environmental stress.
Details about the study area with the map and the methods used to determine the physicochemical parameters and chemical composition of interstitial water and the sediments from the HZ were described in our recent publication [31].
The ecohydrological characteristics of the hyporheic zone at selected sampling sites that indicated downwelling at site 1-UP and upwelling at site 2-DOWN are shown in Tables S1–S3 and Figures S1–S3, along with a detailed explanation of these characteristics.

2.2. Amphipod Sampling

Amphipods were sampled at both sampling sites in four sampling campaigns—winter (9–10 December 2018), spring (2–3 April 2019), summer (23–24 July 2019), and autumn (22–23 October 2019)—in the HZ of the Sava River gravel bars using the standard Bou-Rouch piston pump [35]. A mobile steel pipe (Ø 50 mm, 110 cm long) with a perforated distal end (thirty-five 5 mm diameter holes) was embedded into the gravel bar and equipped with a hand piston pump. For each sample, 50 L of interstitial water were pumped from an average depth of 55 cm below the surface of the gravel bar and this procedure was repeated at at least three points (along the gravel bar) per sampling site. The sampling was carried out using a set of fine-meshed hand nets (100, 200 and 500 µm). Only amphipod specimens retained on the two largest nets (200 and 500 µm) were stored in polyvinyl chloride bottles and transported in a portable refrigerator to the laboratory for processing. The specimens were identified under stereomicroscope (Zeiss Stemi 2000 C, Carl Zeiss AG, Jena, Germany) based on the morphological characters for S. ambulans as described in [36], sorted, counted, snap-frozen in liquid nitrogen and then stored at −80 °C until further analyses.

2.3. Chemicals

Potassium dihydrogen phosphate (KH2PO4), dipotassium phosphate (K2HPO4), disodium phosphate (Na2HPO4), potassium hydroxide (KOH), potassium chloride (KCl), acetic acid (CH3COOH) and sodium acetate (CH3COONa) were of analytical grade (≥98%, Kemika, Zagreb, Croatia). Adenosine 5’-monophosphate (AMP), adenosine 5’-diphosphate (ADP), adenosine 5’-triphosphate (ATP), and tetrabutylammonium (TBA) hydroxide were of analytical grade (≥98%) as well as 3-(cyclohexylamino)-1-propanesulfonic acid (≥99%), all purchased from Sigma Aldrich (St. Louis, MO, USA). Internal standard adenosine (ADN) was of HPLC grade (≥99%) and obtained from Tokyo Chemical Industry, Japan. Perchloric acid (PCA), ACS reagent, 70%, was from Thermo Fisher Scientific (Waltham, MA, USA). Deionized (18 MΩ·cm) water, generated in-house using a Milli-Q System from Merck Millipore (Bedford, MA, USA) was used for mobile phase and solution preparation.

2.4. Preparation of Synuella ambulans Samples

Composite samples of S. ambulans for quantification of adenylates were prepared as described by Redžović et al. [37], who applied a modified method used by Díaz Enrich et al. [38]. Amphipods were pooled due to their small size and mass (10–50 specimens per sample, mass of a sample: 0.012–0.034 g; Table S4). The number of pooled samples per sampling site was six (N = 6), except in the winter sampling campaign, when it was ten (N = 10) at the site 1-UP and four (N = 4) at the site 2-DOWN (Table S4). In brief, composite samples were homogenized in 0.5 mL of 0.5 M ice-cold PCA using a Potter-Elvehjem homogenizer while keeping the sample tube in an ice bath. Samples were spiked prior to homogenization with 50.1 µL of internal standard solution (300 µM ADN), freshly prepared daily by dissolving in the mobile phase (150 mM KH2PO4/K2HPO4 and 100 mM KCl, pH = 6). The homogenate was centrifuged in a cooled centrifuge at 4 °C, 16,000× g for 5 min. After the centrifugation, a volume of 200 µL of supernatant was neutralized with the addition of 25 µL of 25% KOH and 150 µL of phosphate buffer (0.5 M Na2HPO4 and KH2PO4, pH = 8.2), and the final pH was 11. The mixture was vortexed and allowed to form a precipitate for 30 min on ice. The neutralized supernatant was again centrifuged at 16,000× g at 4 °C for 5 min and the supernatant was immediately analysed by ion-pair reverse-phase chromatography.

2.5. Separation and Quantification of Adenylates and AEC Calculation

Separation of adenylates was performed by ion-pair reverse-phase chromatography [39] using the HPLC system 1100 Series (Agilent, St. Clara, CA, USA) equipped with a diode array detector (DAD) and Hypersil ODS column C18 (125 mm × 4 mm, 5 µm particle size; guard column: Hypersil ODS, 10 × 4 mm, 5 μm; Thermo Fisher Scientific, Waltham, MA, USA). Separation conditions applied are presented in Table 1.
Concentrations of adenylates in S. ambulans samples were calculated using an external standard calibration method. Concentrations were determined from calibration curves constructed from known concentrations of standards (AMP, ADP, and ATP) in the range of working concentrations of 10, 12, 25, 50, 100, 200, and 300 µM. The AMP, ADP and ATP concentrations determined in the S. ambulans samples were calculated from the peak area of the respective nucleotide and expressed as µmol g−1 wet weight (w.w.). The final result was obtained by multiplying the adenylate concentration by the extraction recovery of internal standard ADN [37].
Adenylate energy charge (AEC) was calculated from measured concentrations of the three adenine nucleotides—ATP, ADP and AMP [1]—according to the following equation:
A E C = c A T P + 1 2 c ( A D P ) c A T P + c A D P + c ( A M P )
Adenylate kinase apparent equilibrium constant (Keq) was calculated from coordinated variation in AEC and ATP/ADP ratios [40], according to the following equation:
y = x + 0.5 x x 1 ( 1 4 K e q ) + 0.25 2 x 2
where x = AEC, y = ATP/ADP ratio and Keq = apparent equilibrium constant of adenylate kinase.

2.6. Data Analyses

Prior to data analyses, we tested the potential influence of pooling individual amphipods to obtain the composite samples on the analysed concentrations of adenine nucleotides (Spearman’s rho, p < 0.05) and found that this had no influence. In addition, to test whether the observed patterns in adenine nucleotide concentrations and calculated AEC are likely to be non-random, the autocorrelation of the data was examined using the Durbin–Watson statistic, which yielded values of less than 2, suggesting non-randomness. These tests were performed using SPSS® Statistics Version 20 (IBM, Armonk, NY, USA).
Considering the number of samples analysed (N = 6, except in winter at sampling site 1-UP N = 10 and at sampling site 2-DOWN N = 4) and the fact that the assumptions of normality and homogeneity of variance were not always met, the Mann–Whitney U test was applied to test the significance of differences in concentrations of AMP, ADP, ATP and total adenylate pool (TAP) and AEC in S. ambulans samples between two sampling sites. The significance of variability in adenylate concentrations and AEC between sampling seasons was tested using Kruskal–Wallis one-way analysis of variance on ranks for each sampling site. Differences were considered significant when p < 0.05. These statistical analyses were performed using SigmaPlot 11.0 (Systat Software, Chicago, IL, USA).
The effects of environmental factors as independent variables on AEC in S. ambulans as dependent variable were tested using stepwise multiple linear regression (MLR). Due to the large number of environmental factors and the rather limited number of data available in this study, the environmental factors were assigned to four groups of independent variables: (I) natural factors, i.e., physicochemical parameters of the interstitial water from the HZ: water temperature, concentration of dissolved oxygen, pH, electrical conductivity, alkalinity and total water hardness, (II) nutrient concentrations: orthophosphates (P-PO43−), nitrites (N-NO2), nitrates (N-NO3) and total organic carbon (TOC) in interstitial water and TOC in sediment from the HZ, (III) metal concentrations in the interstitial water from the HZ: Al, Cd, Co, Cr, Cu, Fe, Mn, Ni, Pb, Sn, Zn, Ca, K, Mg and Na, and (IV) metals in the fine sediment fraction from the HZ: Cd, Co, Cr, Cu, Mn, Ni, Pb, Sn and Zn. Also, metal concentrations accumulated in S. ambulans (Al, Cd, Co, Cr, Cu, Fe, Mn, Ni, Pb, Sn, Zn, Ca, K, Mg and Na) were tested as a fifth group of independent variables that can affect AEC as a dependent variable. Each group of independent variables and AEC as a dependent variable were analysed separately, so five independent MLR analyses were performed. The criterion used for the stepwise method was the probability of F statistic with p < 0.05 for entry and p > 0.10 for exclusion of a variable from the model. These analyses were performed using SPSS® Statistics Version 20 (IBM, Armonk, NY, USA).
For the MLR analyses, data on the above- listed environmental variables from the HZ and metal concentrations in S. ambulans were provided from the related study [31].

3. Results

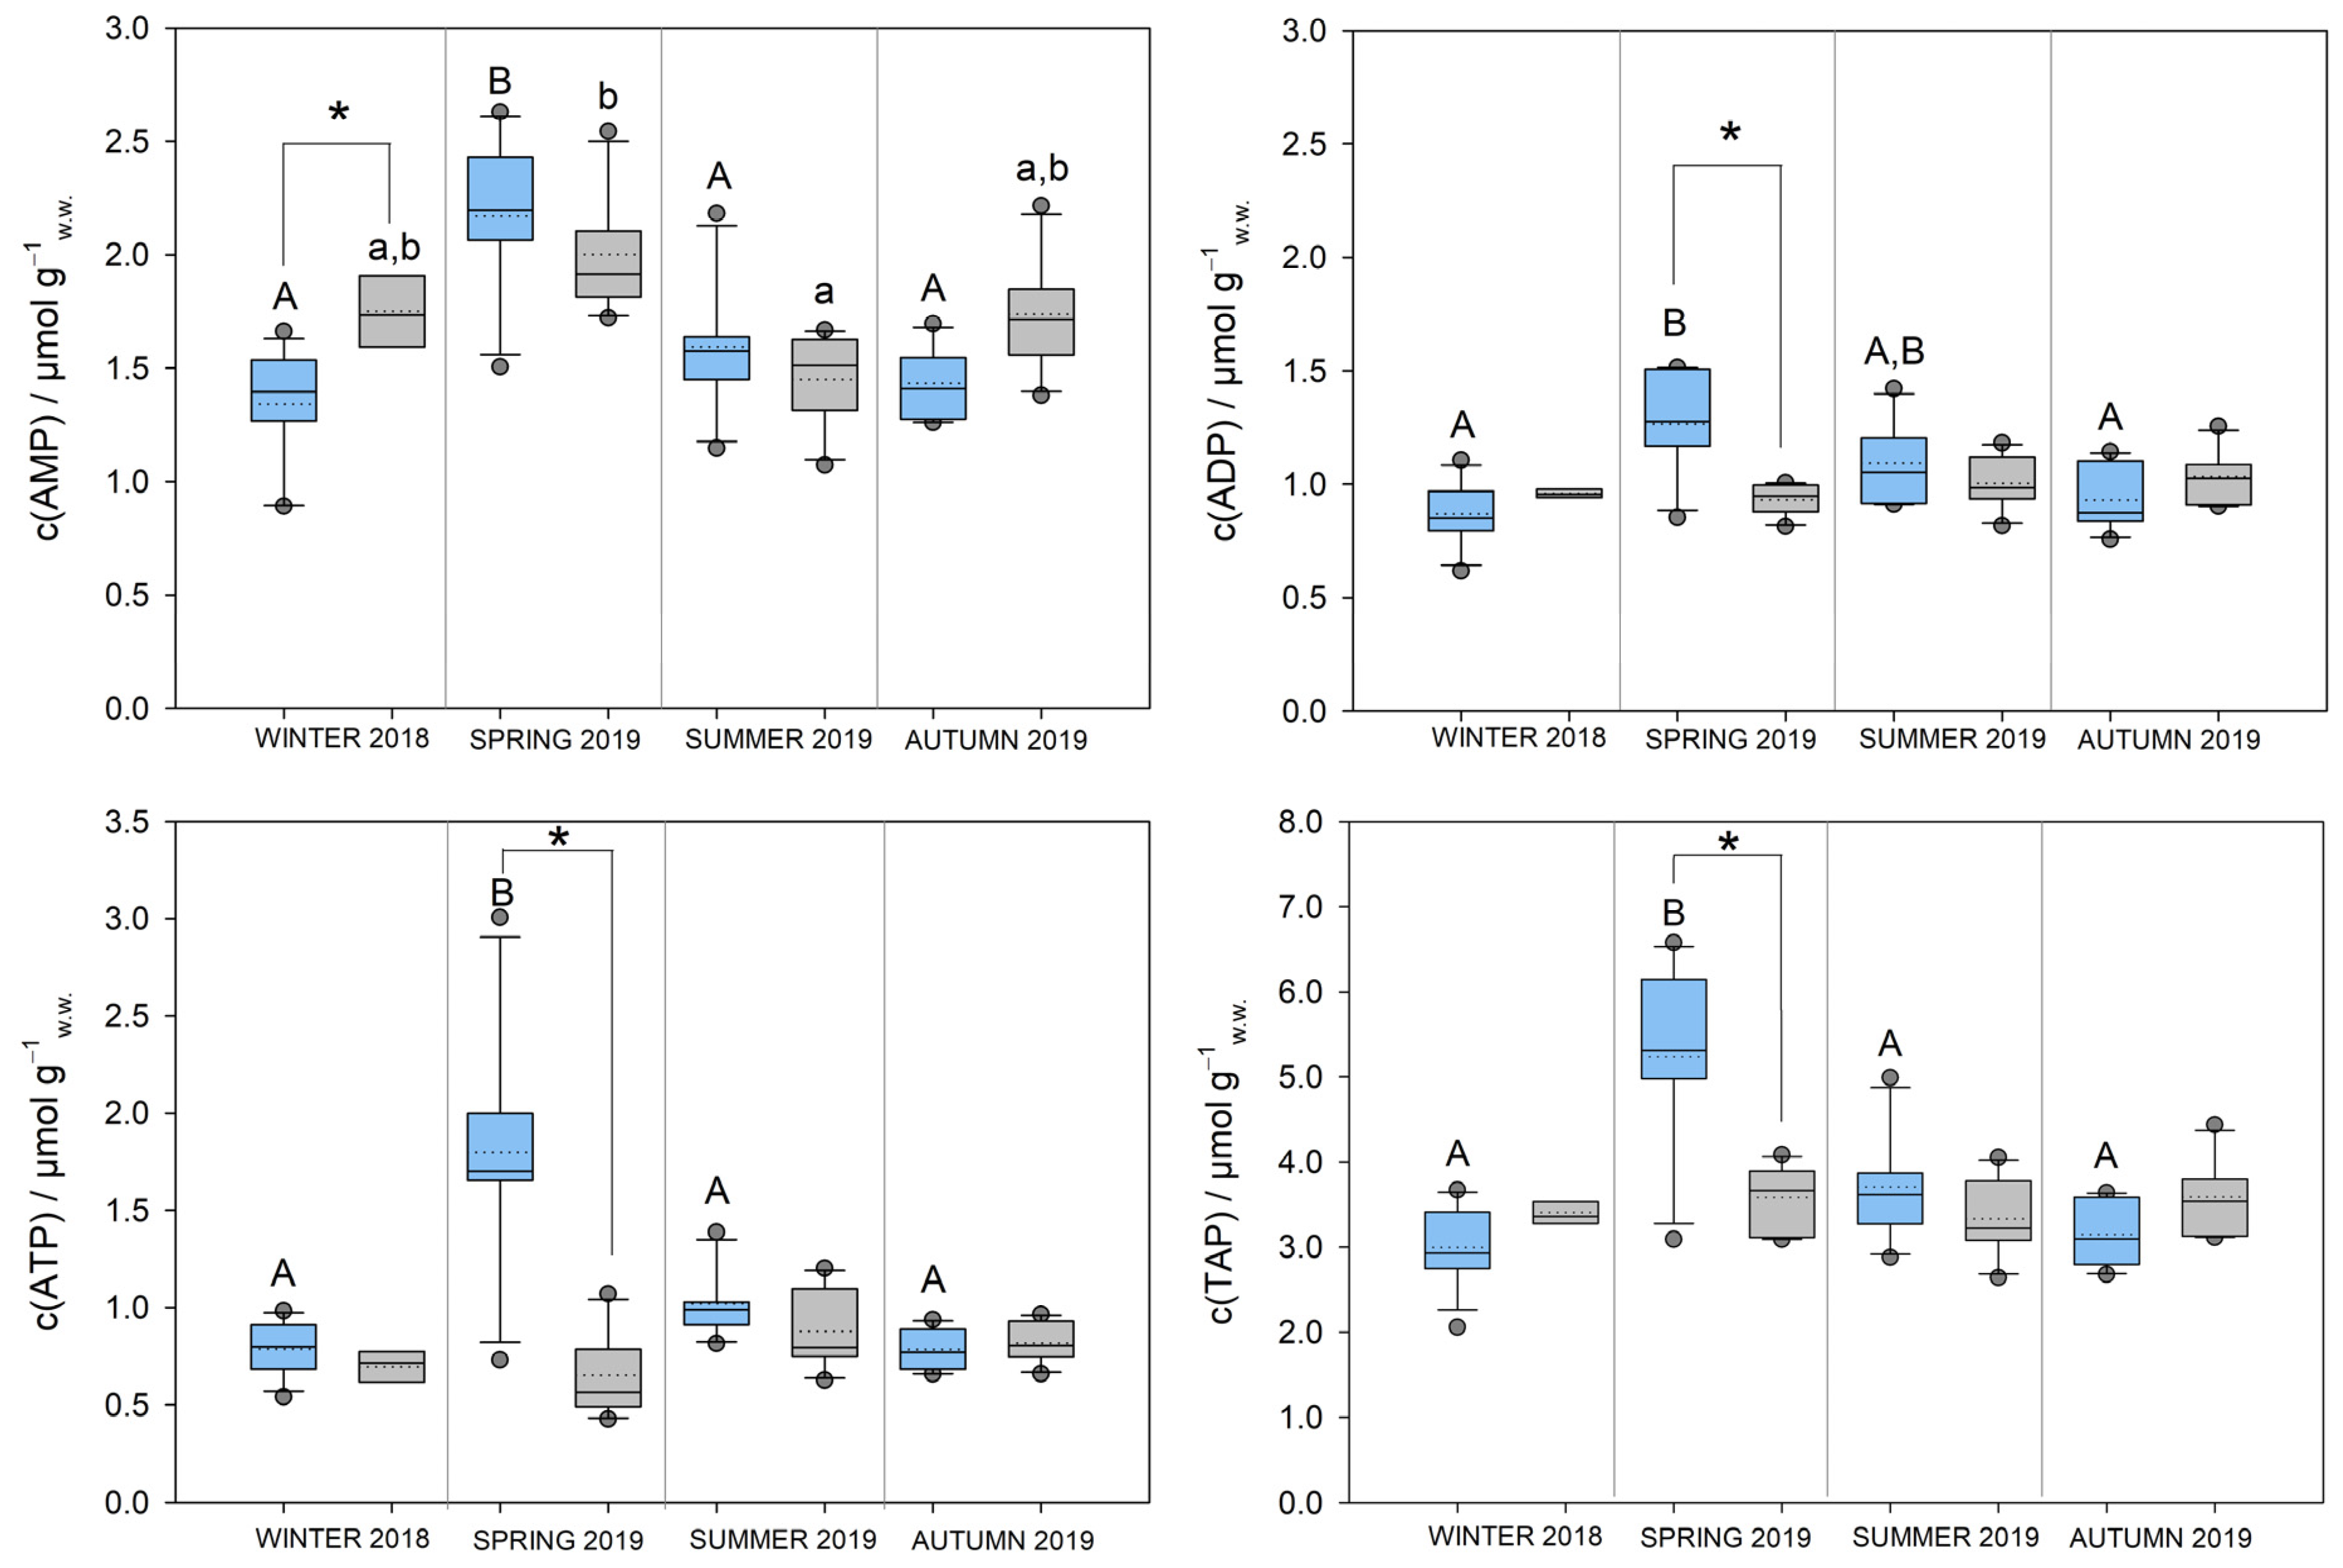
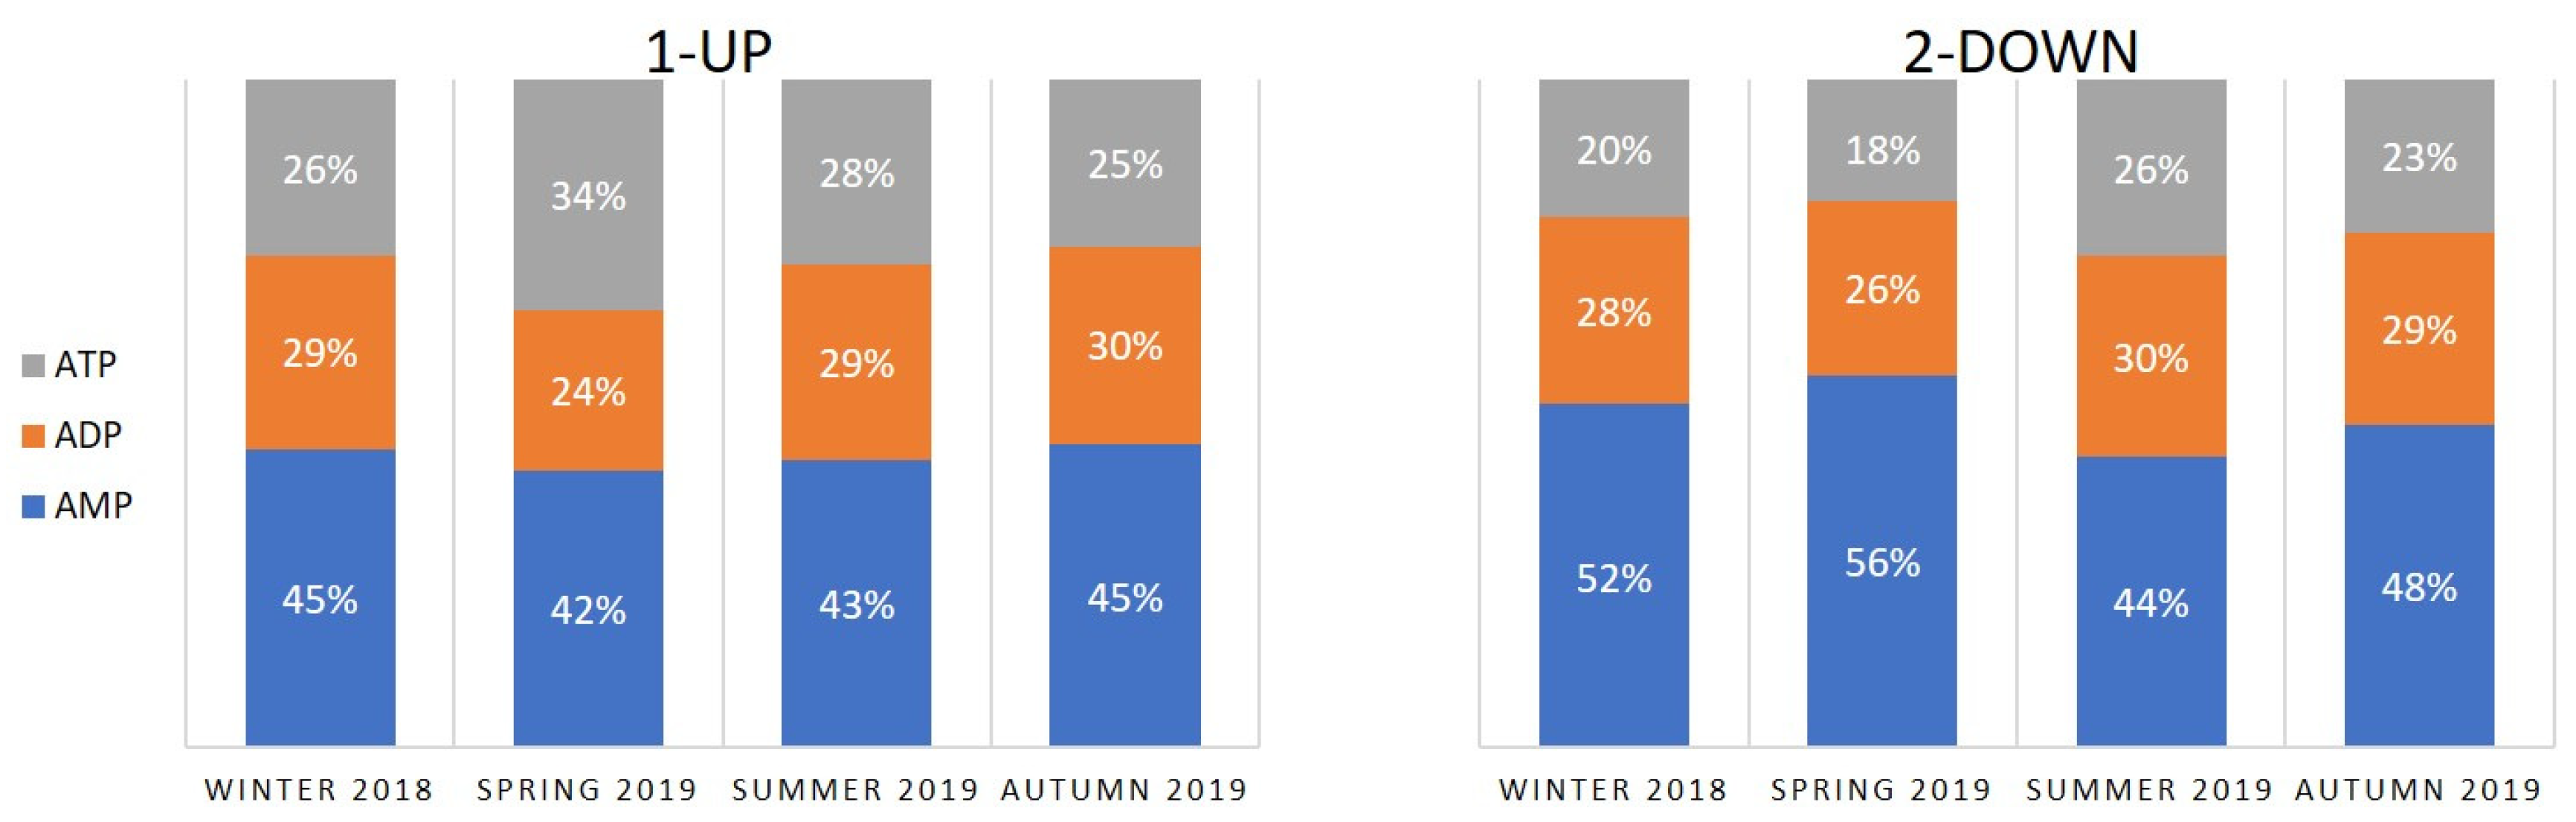
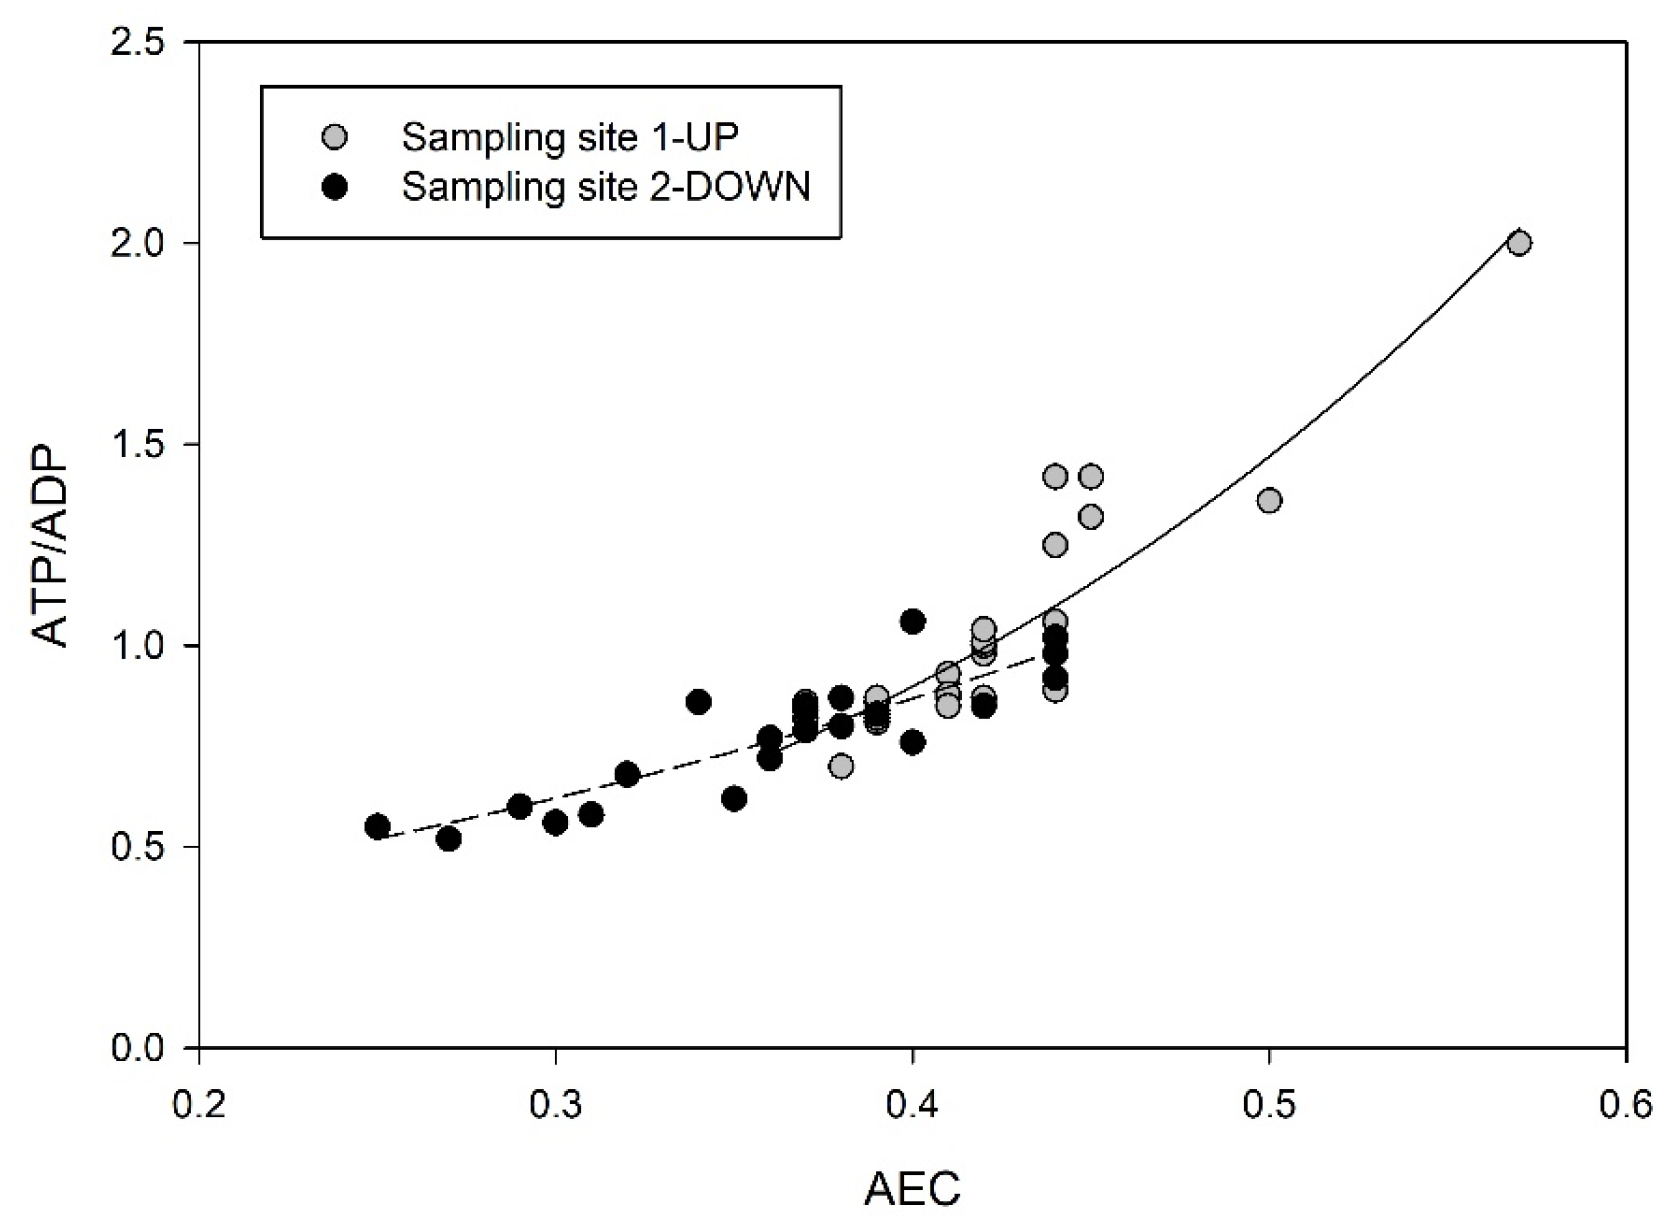
3.1. Concentrations of Adenine Nucleotides and Adenylate Energy Charge in S. ambulans

The results of the determination of adenylate concentrations in stygophilous amphipod S. ambulans from the HZ of the Sava River are presented in Figure 1.
The measured values for AMP, ADP and ATP were in the range of 0.89–2.63 µmol g−1w.w., 0.62–1.51 µmol g−1w.w. and 0.43–3.01 µmol g−1w.w., respectively. Comparing two sampling sites, significantly higher levels of ADP, ATP and total adenylate pool (TAP = sum of the concentrations of AMP, ADP and ATP) were observed in S. ambulans from sampling site 1-UP in spring, while the concentrations of AMP were higher in S. ambulans from sampling site 2-DOWN in winter (Figure 1). Significant seasonal differences in concentrations of all analysed adenylates and TAP were observed primarily in S. ambulans from sampling site 1-UP, with the highest values recorded in spring (Figure 1).
Expressed as a fraction of TAP, the largest fraction was accounted for by AMP, with values ranging from 42 to 56% in both sites and for all seasons studied (Figure 2). Larger AMP fractions were detected in S. ambulans from sampling site 2-DOWN than from sampling site 1-UP, especially in winter and spring.
The AEC values in S. ambulans calculated according to Equation (1) are presented in Table 2. When comparing the two S. ambulans populations in the study area, significantly higher AEC values were detected in the S. ambulans population from sampling site 1-UP in all seasons except summer (Table 2). When comparing seasonal sampling campaigns, there were no significant differences in AEC values of S. ambulans at sampling site 1-UP (Table 2). AEC values of S. ambulans at sampling site 2-DOWN were significantly different only between spring and summer (Table 2). Two populations of S. ambulans also differed in their ATP/ADP ratios, indicating a shift in cellular energy balance (Table 2 and Figure 3). Apparent equilibrium constant for adenylate kinase reaction (Keq) was significantly lower in populations from sampling site 2-DOWN only in spring (Table 3).

3.2. Effects of Environmental Variables and Metals Accumulated in the Organism on AEC of S. ambulans as Dependent Variable

The results of the stepwise MLR analysis of AEC as dependent variable and six natural factors as independent variables showed that 52.7% of the variance in AEC could be accounted for by the four predictors, collectively, F(4,45) = 12.511, p = 1 × 10⁻⁶ (degrees of freedom of regression and residuals, respectively, are given in brackets; Table 4). Looking at the individual contributions of the predictors, the results showed that conductivity, dissolved oxygen concentration, and alkalinity negatively predicted AEC value, while total water hardness positively predicted the AEC (Table 4). Two variables were excluded from the model, namely water temperature and pH.
The results of the stepwise MLR analysis of AEC as dependent variable and the second group of independent variables showed that 41.5% of the variance in AEC could be accounted for by the two predictors, collectively, F(2,47) = 16.665, p = 3 × 10⁻⁶ (Table 4). Looking at the individual contributions of the predictors, it can be seen that concentrations of N-NO2 and P-PO43− negatively predict the AEC value (Table 4). Three variables were excluded from the model, namely concentrations of nitrates, TOC in water and TOC in sediment.
Concentrations of dissolved trace elements (Al, Cd, Co, Cr, Cu, Fe, Mn, Ni, Pb, Sn and Zn) and macroelements (Ca, K, Mg and Na) in the interstitial water from the HZ of the Sava river studied previously [31] were classified as a third group of independent variables that could possibly affect the AEC level in S. ambulans as dependent variable, because they could be easily absorbed by the organism. The results of the stepwise MLR analysis showed that 42% of the variance in AEC could be explained by the model (F(2,25) = 9.045, p = 1.1 × 10⁻³, Table 3) with two predictors—the concentrations of Fe and Na in the interstitial water of the HZ. The concentration of Fe in interstitial water had a positive effect on AEC values, whereas Na had a negative effect (Table 4).
Similarly, the concentrations of trace elements (Cd, Co, Cr, Cu, Mn, Ni, Pb, Sn and Zn) in the fine fraction (<63 µm) of sediments from the HZ previously studied [31] were considered as a fourth group of independent variables potentially affecting AEC content in S. ambulans as dependent variable. The result of the stepwise multiple regression analysis showed that 26.8% of the variance in AEC could be explained by the model (F(1,14) = 5.121, p = 4 × 10⁻², Table 4) with one predictor—the concentration of Ni in the fine fraction of sediments from the HZ. It had a negative effect on AEC values (Table 4).
Since the accumulation of both essential and non-essential metals in an organism could cause the energy costs associated with the excretion and/or detoxification of the incoming metals, the effect of the concentrations of the accumulated metals in S. ambulans on the AEC values was also evaluated as the fifth group of independent variables in the MLR model. When we performed the stepwise MLR analysis with the concentrations of eleven trace elements (Al, Cd, Co, Cr, Cu, Fe, Mn, Ni, Pb, Sn and Zn) and four macroelements (Ca, K, Mg and Na) studied in S. ambulans [31] as independent variables, the highest percentage of variance (79.1%) in AEC as dependent variable could be explained only by the two predictors (F(2,20) = 37.912, p < 1 × 10⁻⁷, Table 4). Fe concentration in S. ambulans had a negative effect on AEC values, whereas Zn had a positive effect (Table 4).

4. Discussion

4.1. Energy Status of S. ambulans

The present study confirmed the temporal and spatial differences in concentration of all adenine nucleotides during one year of research. The highest adenine nucleotide concentrations found in two populations of S. ambulans from the HZ of the Sava River were those of AMP, followed by ADP and ATP (Figure 2 and Figure 3), which was in complete contrast to studies found in the literature [6,41,42]. Namely, we first compared the concentrations of each nucleotide in S. ambulans with concentrations measured in other invertebrate organisms under control experimental conditions or sampled at reference environmental sites, where possible. In comparison with another related amphipod species, but euryhaline and representative of epigean fauna, the amphipod Gammarus lacustris G.O. Sars, 1863, from a freshwater lake in Irkutsk (formed by a backwater of the Angara River, Russia) showed higher ATP and ADP, and lower AMP concentrations than in our study (2.56 ± 0.69 µmol g−1w.w., 0.35 ± 0.09 µmol g−1w.w., and 0.14 ± 0.04 µmol g−1w.w., respectively) [41]. Likewise, the concentrations of ATP, ADP and AMP measured in the whole organism of juvenile whiteleg shrimp Penaeus vannamei Boone, 1931 (Decapoda) obtained from optimal conditions in an aquaculture facility, were higher for ATP and ADP and lower for AMP (9.43 ± 0.46 µmol g−1w.w., 1.83 ± 0.35 µmol g−1w.w., and 0.32 ± 0.12 µmol g−1w.w., respectively) [42]. Similarly, in the tail muscle of the freshwater crayfish Cherax destructor Clark, 1936 (Decapoda) measured under control conditions, concentrations of ATP and ADP were higher and AMP lower (5.64 ± 0.75 µmol g−1, 1.12 ± 0.12 µmol g−1, and 0.20 ± 0.03 µmol g−1, respectively) [6] than in our study.
It is evident that the physiological adaptations to the challenges of life in the stygophilous amphipod species such as S. ambulans are geared toward a specialised energy metabolism, in which energy production involves an anaerobic metabolic pathway. The main environmental factors that prevail in the HZ are the alternation of hypoxic and normoxic conditions and the limitation of habitat, which restricts escape from unfavourable living conditions. Hypogean amphipods such as the representatives of the genus Niphargus have been shown to respond to long-term experimental severe hypoxia with a unique anaerobic metabolism characterised by a decrease in ATP and phosphagen, coupled utilisation of glycogen and glutamate, and accumulation of L-lactate, alanine, and succinate [43,44]. Although in this study we did not determine metabolites other than adenine nucleotides, a preliminary study on the activities of three enzymes (pyruvate kinase, PK = 39.5 µmol min−1 g−1w.w., phosphoenolpyruvate carboxykinase, PEPCK = 2.1 µmol min−1 g−1w.w., and lactate dehydrogenase, LDH = 1.93 µmol min−1 g−1w.w.) involved in energy metabolism was performed on S. ambulans to assess its anaerobic potential [45]. A low PK/PEPCK ratio of 18.8 and high LDH activity were determined (relative to epigean amphipod species [44]), which indicated increased anaerobic potential in S. ambulans and its ability to tolerate hypoxic conditions [45], like the stygobiotic species Niphargus rhenorhodanensis Schellenberg, 1937 [43]. Such physiological characteristics could explain low ATP concentrations that prevail during different seasons, as observed in our study (Figure 2 and Figure 3).
Given the low ATP concentrations and high AMP concentrations, and because AEC represents the ratio of adenine nucleotide concentrations (Equation (1)), it was expected that AEC values would be unusually low in S. ambulans (<0.5; Table 2). As early as the 1980s, three ranges of values for AEC in multicellular organisms or microorganisms in culture were defined, characteristic of optimal conditions (0.8 to 0.9), limiting or disturbed conditions (0.5 to ~0.75), and severe conditions (<~0.5) [2]. In all examples shown, organisms tested under anoxic conditions were found to have AEC values lower than 0.5 [2]. Indeed, very low AEC values of below 0.5 were found in several studies. Shrimps Palaemon varians Leach, 1814 (Decapoda) submitted experimentally to sublethal concentration of ammonia (0.5 mg L−1) for 14 days exhibited a marked consumption of ATP and consequently their AEC value decreased to 0.36 from 0.67 in control animals, which was interpreted as a type I signal—no lethality, and general and permanent lowering of all parameters [4]. Another laboratory experiment with the bivalve Mytilus galloprovincialis exposed to anaerobiosis (two types of treatments: exposed to air and to oxygen-free seawater) showed that AEC was highly affected by both treatments, and that after rapid breakdown of ATP in first 24 h, the latter ATP drop in 48 h was accompanied by a slight increase in ADP but strong increase in AMP, giving an AEC value of 0.35 in oxygen-free seawater [9]. In the field study for one year, AEC values in M. galloprovincialis mantle tissue varied from 0.8 in spring and summer to very low values in autumn and winter (0.06–0.1), which reflected the starvation and low temperature (environmental and nutritional conditions), but also the depletion of reserves during gonadal development and intense degradation of gametes in the post-spawning period [12]. In another field study, during the one-year reproductive cycle of the freshwater bivalve Dreissena polymorpha, AEC remained stable, with values 0.5–0.7 (May–November 2018), but unexpectedly low AEC values of 0.13–0.32 occurred in the spring (April–June 2019) when ATP concentrations decreased significantly and AMP increased; it was suggested that metabolic depletion may be a result of exceptional climatic events associated with pollution [15]. However, in specimens of the amphipod Gammarus fossarum Koch, 1836 transplanted and exposed at sites with varying levels of pollution, AEC (>0.8 at all sites in transplants and residents) and ATP/ADP ratio did not show any deficiency in cellular energy supply, although a trend toward lower AEC indices with increasing pollution was observed [46].
Although examined in different organisms, and in different experimental settings and conditions, these studies showed the potential of AEC to detect organisms’ responses to different types of stressors.
Coordinated variations of the ATP/ADP ratio with AEC were modelled as a function dependent on the numerical value of the reaction catalysed by adenylate kinase and it was suggested that changes in apparent equilibrium constant of adenylate kinase (Keq) might reveal ecotoxicological effects in invertebrates that would not be apparent in the adenylate concentrations and AEC [40]. One of the essential metabolic processes for cellular energy is the catalysed phosphotransfer reaction performed by the enzyme adenylate kinase, which is required for interconversion of adenine nucleotides and has been considered a key enzyme in energy metabolism for all organisms [47].
Our study showed that the variations in the ATP/ADP ratio with respect to AEC also conformed to the model given in [40], i.e., a “U-shaped” curve (Figure 3). ATP/ADP ratios determined in populations of S. ambulans at two sampling sites differed significantly (Mann–Whitney U test, p < 0.001; Table 2) showing a decrease at the downstream site, which clearly has conditions of pronounced environmental stress. However, in S. ambulans populations at the sampling site 2-DOWN a lowering of the ATP/ADP ratio was not accompanied by a significant decrease in Keq (with the exception of in spring, Table 3) relative to the values of Keq in the population at the site 1-UP. As a result, variations in environmental conditions at two sampling sites over the four seasons were reflected in both AEC values and a coordinated change in ATP/ADP with AEC in two populations of S. ambulans, while Keq was not perturbed. However, significantly higher Keq in spring at the site 1-UP could be related to reproductive efforts that are shown to present a considerable energetic demand. Indeed, a study on the population dynamics of S. ambulans in the HZ of the Sava River showed the highest reproductive peak in this season [48].
Another interesting finding of our study was a very low ATP/AMP ratio, which ranged from 0.4 to 1.5 at sampling site 1-UP and was even lower at sampling site 2-DOWN (from 0.2 to 0.7). By quantifying the ATP/AMP concentration ratio, the degree of metabolic stress within a tissue or organism can be estimated, which was inferred from the observed dose-dependent inverse relationship between tributyltin chloride (TBTCl) concentration and the ATP/AMP ratio in the digestive gland of experimentally exposed European oysters (Ostrea edulis Linnaeus, 1758) [49]. This was a function of decreasing ATP concentrations coupled with increased AMP concentrations. Following the exposure of oysters to very low exposure of 20 ng L−1 TBTCl, the ATP/AMP ratio halved [49]. Similarly, in our study, the ATP/AMP ratio was halved in the S. ambulans population at sampling site 2-DOWN in comparison to site 1-UP, indicating some degree of metabolic stress from living in a challenging environment.

4.2. Effects of Environmental Variables and Metals Accumulated in the Organism on Energy Status of S. ambulans

Based on the physicochemical characteristics of the interstitial water, the two selected sampling sites could be distinguished without any doubt: the upstream gravel bar as the downwelling zone and the downstream gravel bar as the upwelling zone (Supplementary Material, Section: Ecohydrological characteristics of the hyporheic zone at selected sampling sites). However, the question of differential levels of pollution at these two sites was more difficult to answer, even though site 2-DOWN is located downstream of the WWTP discharge. As expected, higher phosphate concentrations were found at site 2-DOWN, while nitrate concentrations were higher at site 1-UP (Figure S2). As previously reported, concentrations of metals, phosphates, and nitrates in interstitial water from the HZ can be considered moderately elevated, likely due to agricultural activities and WWTP discharge [31]. Therefore, the totality of hydrologic characteristics (type of water movement in sediments in the HZ, i.e., upwelling or downwelling), physicochemical characteristics, nutrient concentrations, and potential metal contaminants indicated that site 2-DOWN was a more stressful environment for native populations of S. ambulans. The interstitial fauna inhabiting HZ sediments have been shown to exhibit aggregate distribution patterns that could be related to many environmental parameters, including temperature, dissolved oxygen concentration, particulate and dissolved organic matter, microbial flora, permeability, porosity, grain size, substrate stability, bed roughness, channel morphology, or variations in discharge [50]. The S. ambulans populations examined in this study also exhibited such a patch distribution, with varying densities of individuals at different sampling points (between three and ten over approximately 40 m) along the two gravel bars. However, there were no significant differences between the two populations of S. ambulans in concentrations of AMP, except in winter, and ADP, ATP, and TAP, except in spring (Figure 1). Nevertheless, throughout the study period of one year, the concentrations of each adenine nucleotide in the population of S. ambulans from site 1-UP varied significantly, i.e., they showed seasonal fluctuations (significant differences with p < 0.05; Figure 1). The opposite was observed in the population of S. ambulans from site 2-DOWN, which showed less variable seasonal adenine nucleotide concentrations (with the exception of AMP), possibly due to more stable conditions at the microlocation with upwelling properties. Expressed as the ratio of adenine nucleotide concentrations, AEC showed significant differences between two studied populations of S. ambulans in all seasons except summer (Table 2), which might be related to more stable environmental conditions during the summer and to the resting physiological state after the active reproductive period in the spring [48].
The results of the stepwise MLR models showed that more than 50% of the variability in AEC could be explained by natural factors, with conductivity and dissolved oxygen concentration having the highest probability (Table 4). Conductivity can serve as a useful measure of dissolved inorganic materials, and it was higher during all seasons at the site 2-DOWN compared to 1-UP [31]. It has been shown that high conductivity positively correlates with several ecotoxic elements such as Ni, Pb, and Sn accumulated in S. ambulans [31], which could also be the explanation for the negative prediction of AEC values based on MLR model results (Table 4). Water in the groundwater-connected ecosystems like the HZ is usually undersaturated with dissolved oxygen, and it is assumed that its levels near industrial facilities, agricultural areas and urban areas are lower than in natural regions due to pollution and anthropogenic effects, which enhance chemical and biological oxygen consumption [51]. Moreover, the nutrient retention in the HZ of the regulated rivers without a continuous riparian corridor [52,53], such as the researched segment of the Sava River, could be the reason for the lower dissolved oxygen concentrations which were determined in the HZ in contrast to the river (Table S1); they showed a negative prediction of AEC values of S. ambulans in MLR model (Table 4), which was surprising but expected, since we found a relatively high anaerobic capacity in this stygophilous amphipod (PK/PEPCK ratio = 18.8). Amphipods living under unfavourable environmental conditions such as hypoxia may develop a strategy of metabolic depression, manifested by a decreased metabolic rate, leading to lower metal uptake and accumulation [42,54].
Concentrations of nitrites and phosphates explained 41.5% of the variability in AEC, and these factors negatively predicted the status of metabolic energy in S. ambulans in MLR model (Table 4). Nitrite anion (NO2) is a natural component of the nitrogen cycle in freshwater ecosystems, formed during the decomposition of organic material, and is an intermediate form of oxidation between ammonia and nitrate. Although there are no regulations in the EU for the concentration of nitrites in natural waters, the Croatian national legislation set the threshold value for good groundwater quality standards (GQS) at the concentration of 0.5 mg L−1 [32]. Nitrite concentrations are increasing in freshwater ecosystems as a consequence of several anthropogenic sources, such as urban sewage effluents and aquaculture [55]. Additionally, the loss of nitrification flora due to the toxic effects of antibiotics and unionized ammonia can lead to increased accumulation of nitrite in natural waters [55]. Research on fish and other aquatic animals has shown that nitrite disrupts numerous physiological functions, including ion regulation, respiration, and cardiovascular, endocrine and excretory processes [56]. Therefore, in our study, pollution from sewage treatment plant discharge and the effects of antibiotics [24] could explain the negative relationship between AEC in S. ambulans and nitrite concentrations (Table 4) in interstitial water from the HZ.
According to surface water quality standards (WQS, [32]), phosphate concentrations at site 2-DOWN exhibited less-than-good water quality status in all seasons except winter and even exceeded the GQS [32] in spring (Figure S2). This is further evidence of how increasing anthropogenic activities alter hydro-biogeochemical processes and nutrient fluxes in the HZ and threaten hyporheic communities and food webs [57]. Orthophosphate is an essential nutrient for plants, algae, and microorganisms and is the only form that algae can use for growth [58]. In such an environment, the metabolic energy status of S. ambulans could also depend on other hyporheic organisms such as phytobenthos, bacterial communities and other crustacean species as competitors for nutrients and oxygen.
According to the MLR models, groups of environmental variables that include metal concentrations in interstitial water and sediment explained a smaller percentage of AEC variability than natural factors and nutrients, but metals accumulated in S. ambulans explained the largest percentage of 79.1% (Table 4). In S. ambulans, accumulated Fe concentration was a highly significant negative predictor of energy metabolism (p < 1 × 10⁻⁷; Table 4), while accumulated Zn was a significant positive predictor (p < 4.2 × 10⁻⁴; Table 4). Due to the energy costs involved in excreting and/or detoxifying the incoming metals, metal accumulation has an impact on the ecology of crustaceans [59]. Additionally, heavy metals which are accumulated can cause toxicity through various mechanisms. One of these mechanisms involves the impairment of cellular respiration by the inhibition of various mitochondrial enzymes and the uncoupling of oxidative phosphorylation [60]. The redox properties and coordination chemistry of iron make it an essential element involved in a number of catalytic and transport processes in living cells. However, these very properties make iron dangerous, especially because it can generate reactive oxygen species [61]. Because many iron complexes have redox potentials accessible to endogenous biological reductants, they can produce oxidative stress through Fenton/Haber–Weiss chemistry that, among other disturbances, disrupts mitochondrial energy metabolism [61]. Such a case could possibly occur also in the studied populations of S. ambulans, which would explain accumulated Fe concentration as a highly significant negative predictor of AEC variability (Table 4).
Zinc is also an essential element that, unlike iron, is redox inert, and actually has antioxidant properties. It is a catalytic and structural cofactor in several hundred enzymes that play a role in protein biosynthesis, energy metabolism, and protection from damage, to name a few of the functions of zinc [62]. The significant positive prediction of AEC variability by Zn concentration in S. ambulans (Table 4) may therefore be a consequence of such important roles of Zn ions in cellular regulation, which are so far unique among the essential transition metal ions.
However, more detailed studies aimed at revealing the energy production and utilisation strategies of S. ambulans as a representative of hypogean stygophilous fauna, would be required.

5. Conclusions

This study provided the first insight into the concentrations of adenylate nucleotides and the AEC in the stygophilous freshwater amphipod S. ambulans. The potential of AEC as a physiological biomarker of general stress in the HZ was evaluated at two sites with different intensities of environmental and anthropogenic stress. The population from site 1-UP had significantly higher AEC values than the population from site 2-DOWN in all seasons except summer. Changes in ATP/ADP ratios indicated differences in energy status between the two populations. However, no spatial or temporal differences in the apparent equilibrium constant of adenylate kinase were observed in the S. ambulans populations, except in spring at site 1-UP, when it was elevated, probably due to reproductive effort. Of all the variables tested, the concentrations of Fe and Zn in S. ambulans showed the highest significant negative and positive associations with AEC, respectively. Also, several environmental factors appeared to influence AEC values in S. ambulans, namely conductivity, dissolved oxygen, and concentrations of nitrites and phosphates in the interstitial water, as they showed highly significant associations with AEC. Because AEC directly measures the change in available energy and thus the metabolic stress the organism is exposed to, it was shown as a useful biomarker of environmental stress in amphipods inhabiting groundwater-connected ecosystems in general. In addition, seasonal and spatial variation in AEC values has been shown to reflect ecological status in the HZ.

Supplementary Materials

The following supporting information can be downloaded at: https://www.mdpi.com/article/10.3390/w15173083/s1, Section Ecohydrological characteristics of the hyporheic zone at selected sampling sites containing Figure S1: Concentrations of macroelements (dissolved form) in the interstitial water from the HZ and in the river water (mean value and standard deviations, N = 3) determined at the sampling site 2-DOWN in four sampling campaigns; Figure S2: Concentrations of phosphates, nitrates and nitrites in the interstitial water from the HZ and in the surface water from the Sava River determined at both sampling sites in four sampling campaigns. In the graphs, threshold values are indicated for phosphates and nitrates: (i) good water quality (dark red dash line), (ii) very good water quality (green dash line) established for surface water of the river type HR_R-5b and (iii) good groundwater quality status (red dash dot line; established only for phosphates); Figure S3: Daily discharge (m3 s−1) in the Sava River, measured at the Zagreb gauging station (45°47′11.2″ N, 15°57′20.2″ E, near the sampling site 2-DOWN) during four sampling periods (period from 1 October 2018 to 31 October 2019 is shown). Data are provided from Meteorological and Hydrological Service of Croatia (DHMZ). Arrows point to the seasonal sampling campaigns; Table S1: Concentrations of dissolved oxygen (mg L−1) and oxygen saturation level (%) in the river water (river) and in the interstitial water from the hyporheic zone (HZ) measured in four seasons at two sampling sites on the Sava River; Table S2: Temperatures (°C) of the river water (river) and the interstitial water from the hyporheic zone (HZ) measured in four seasons at two sampling sites on the Sava River; Table S3a: Dissolved organic carbon concentrations (mg L−1) in the river water (river) and the interstitial water from the hyporheic zone (HZ) measured in four seasons at two sampling sites on the Sava River; Table S3b: Total organic carbon (%) in fine fraction (<63 µm) of sediment from the hyporheic zone measured in three seasons at two sampling sites on the Sava River; Table S4: Wet weight and number of pooled samples of Synurella ambulans (mean ± S.D) analysed per sampling site in each season (References [19,24,31,32] are cited in the Supplementary Materials).

Author Contributions

Conceptualization, M.E. and S.G.; formal analysis, M.E. and Z.R.; investigation, Z.R. and M.E.; resources, Z.R., M.E. and S.G.; writing—original draft preparation, Z.R. and M.E.; writing—review and editing, S.G. and M.C.; visualization, M.E.; supervision, M.E.; project administration, M.C., S.G. and M.E.; funding acquisition, M.E. and M.C. All authors have read and agreed to the published version of the manuscript.

Funding

This research was funded by the European Regional Development Fund, project KK.01.1.1.07.0023 “Qualitative and Quantitative Protein Analysis in Medicine and Biotechnology Industry” (Qua/Qua Protein) and by the Croatian Science Foundation, project IP-2014-09-4255 “Accumulation, subcellular mapping and effects of trace metals in aquatic organisms” (AQUAMAPMET).

Data Availability Statement

The data presented in this study are available on request from the corresponding author.

Acknowledgments

The authors sincerely thank Ivica Barač for his great help in the field work during the sampling campaigns. The authors are grateful to the Meteorological and Hydrological Service of the Republic of Croatia for providing the hydrological data.

Conflicts of Interest

The authors declare no conflict of interest.

References

  1. Atkinson, D.E. Energy charge of adenylate pool as a regulatory parameter. Interaction with feedback modifiers. Biochemistry 1968, 7, 4030–4034. [Google Scholar] [CrossRef] [PubMed]
  2. Ivanovici, A.M. Application of adenylate energy charge to problems of environmental impact assessment in aquatic organisms. Helgoland Mar. Res. 1980, 33, 556–565. [Google Scholar] [CrossRef]
  3. Koop, J.H.E.; Winkelmann, C.; Becker, J.; Hellmann, C.; Ortmann, C. Physiological indicators of fitness in benthic invertebrates: A useful measure for ecological health assessment and experimental ecology. Aquat. Ecol. 2011, 45, 547–559. [Google Scholar] [CrossRef]
  4. Marazza, D.; Bornens, P.; Le Gal, Y. Effect of ammonia on survival and adenylate energy charge in the shrimp Palaemonetes varians. Ecotox. Environ. Saf. 1996, 34, 103–108. [Google Scholar] [CrossRef]
  5. Zhang, J.; Zhang, M.; Jayasundara, N.; Ren, X.; Gao, B.; Liu, P.; Li, J.; Meng, X. Physiological and molecular responses in the gill of the swimming crab Portunus trituberculatus during long-term ammonia stress. Front. Mar. Sci. 2021, 8, 797241. [Google Scholar] [CrossRef]
  6. Morris, S.; van Aardt, W.J.; Ahern, M.D. The effect of lead on the metabolic and energetic status of the Yabby, Cherax destructor, during environmental hypoxia. Aquat. Toxicol. 2005, 75, 16–31. [Google Scholar] [CrossRef] [PubMed]
  7. Shofer, S.L.; Tjeerdema, R.S. Effects of hypoxia and toxicant exposure on adenylate energy charge and cytosolic ADP concentrations in abalone. Comp. Biochem. Physiol. 1998, 119, 51–57. [Google Scholar] [CrossRef]
  8. Werner, I.; Viant, M.R.; Rosenblum, E.S.; Gantner, A.S.; Tjeerdema, R.S.; Johnson, M.L. Cellular response to temperature stress in steelhead trout (Onchorynchus mykiss) parr with different rearing histories. Fish Physiol. Biochem. 2006, 32, 261–273. [Google Scholar] [CrossRef]
  9. Babarro, J.M.F.; Labarta, U.; Fernández Reiriz, M.J. Energy metabolism and performance of Mytilus galloprovincialis under anaerobiosis. J. Mar. Biol. Ass. UK 2007, 87, 941–946. [Google Scholar] [CrossRef]
  10. Isani, G.; Serra, R.; Cattani, O.; Cortesi, P.; Carpene, E. Adenylate energy charge and metallothionein as stress indices in Mytilus galloprovincialis exposed to cadmium and anoxia. J. Mar. Biol. Ass. UK 1997, 77, 1187–1197. [Google Scholar] [CrossRef]
  11. Dehn, P.F.; Haya, K.; Aiken, D.E. Adenylate energy charge, arginine phosphate and ATPase activity in juvenile Homarus americanus during the molt cycle. Comp. Biochem. Physiol. 1985, 81, 629–633. [Google Scholar] [CrossRef] [PubMed]
  12. Blanco, S.L.; Suárez, M.P.; San Juan, F. Seasonal changes of nucleotides in mussel (Mytilus galloprovincialis) mantle tissue. Comp. Biochem. Physiol. 2006, 143, 384–390. [Google Scholar] [CrossRef] [PubMed]
  13. Atkinson, D.E. Adenylate control and the adenylate energy charge. In Cellular Energy Metabolism and Its Regulation; Atkinson, D.E., Ed.; Academic Press Inc.: New York, NY, USA, 1977; pp. 85–107. [Google Scholar]
  14. Thébault, M.T.; Biegniewska, A.; Raffin, J.P.; Skorkowski, E.F. Short term cadmium intoxication of the shrimp Palaemon serratus: Effect on adenylate metabolism. Comp. Biochem. Phys. 1996, 113, 345–348. [Google Scholar] [CrossRef]
  15. Louis, F.; Rocher, B.; Barjhoux, I.; Bultelle, F.; Dedourge-Geffard, O.; Gaillet, V.; Bonnard, I.; Delahaut, L.; Pain-Devin, S.; Geffard, A.; et al. Seasonal monitoring of cellular energy metabolism in a sentinel species, Dreissena polymorpha (bivalve): Effect of global change? Sci. Total Environ. 2020, 725, 138450. [Google Scholar] [CrossRef]
  16. Verschraegen, K.; Herman, P.M.J.; Van Gansbeke, D.; Braeckman, A. Measurement of the adenylate energy charge in Nereis diversicolor and Nephtys sp. (Polychaeta: Annelida): Evaluation of the usefulness of AEC in pollution monitoring. Mar. Biol. 1985, 86, 233–240. [Google Scholar] [CrossRef]
  17. Guida, L.; Walker, T.I.; Reina, R.D. The adenylate energy charge as a new and useful indicator of capture stress in chondrichtyans. J. Comp. Physiol. B 2016, 186, 193–204. [Google Scholar] [CrossRef] [PubMed]
  18. Boulton, A.J.; Findlay, S.; Marmonier, P.; Stanley, E.H.; Valett, H.M. The functional significance of the hyporheic zone in streams and rivers. Annu. Rev. Ecol. Syst. 1998, 29, 59–81. [Google Scholar] [CrossRef]
  19. Mueller, B.M.; Schulz, H.; Lewandowski, J. Hyporheic zone and processes. In Encyclopedia of Inland Waters, 2nd ed.; Mehner, T., Tockner, K., Eds.; Elsevier: Amsterdam, The Netherlands, 2022; Volume 2, pp. 301–311. [Google Scholar] [CrossRef]
  20. Yu, K.; Duan, Y.; Liao, P.; Xie, L.; Li, Q.; Ning, Z.; Liu, C. Watershed-scale distributions of heavy metals in the hyporheic zones of a heavily polluted Maozhou River watershed, southern China. Chemoshpere 2020, 239, 124773. [Google Scholar] [CrossRef] [PubMed]
  21. Fischer, H.; Kloep, F.; Wilzcek, S.; Pusch, M.T. A river’s liver—Microbial processes within the hyporheic zone of a large lowland river. Biogeochemistry 2005, 76, 349–371. [Google Scholar] [CrossRef]
  22. Pacioglu, O. Ecology of the hyporheic zone: A review. Cave Karst Sci. 2009, 36, 69–76. [Google Scholar]
  23. Kapetanović, D.; Vardić Smrzlić, I.; Valić, D.; Teskeredžić, E.; Kolarević, S.; Sunjog, K.; Tomović, J.; Kračun-Kolarević, M.; Knežević-Vukčević, J.; Paunović, M.; et al. Microbial characterization of the Sava River. In The Sava River; Series The Handbook of Environmental Chemistry; Milačić, R., Ščančar, J., Paunović, M., Eds.; Springer-Verlag: Berlin/Heidelberg, Germany, 2015; Volume 31, pp. 201–228. [Google Scholar] [CrossRef]
  24. Milaković, M.; Vestergaard, G.; González-Plaza, J.J.; Petrić, I.; Šimatović, A.; Senta, I.; Kublik, S.; Schloter, M.; Smalla, K.; Udiković-Kolić, N. Pollution from azithromycin manufacturing promotes macrolide-resistance gene propagation and induces spatial and seasonal bacterial community shifts in receiving river sediments. Environ. Int. 2019, 123, 501–511. [Google Scholar] [CrossRef] [PubMed]
  25. Vdović, N.; Lučić, M.; Mikac, N.; Bačić, N. Partitioning of metal contaminants between bulk and fine-grained fraction in freshwater sediments: A critical appraisal. Minerals 2021, 11, 603. [Google Scholar] [CrossRef]
  26. Bakke, T.; Källqvist, T.; Ruus, A.; Breedveld, G.D.; Hylland, K. Development of sediment quality criteria in Norway. J. Soils Sediments 2010, 10, 172–178. [Google Scholar] [CrossRef]
  27. Gottstein, S.; Redžović, Z.; Erk, M.; Cindrić, M. The hyporheic composition of the Sava River in the city of Zagreb after more than 60 years of research. In Book of Abstracts of the International Conference City Windows in Nature, Zagreb, Croatia, 9–10/09/2021; Javna Ustanova Maksimir za Upravljanje Zaštićenim Područjima Grada Zagreba: Zagreb, Hrvatska, 2021; Available online: https://park-maksimir.hr/wp-content/uploads/2021/09/Knjiga-sazetaka.pdf (accessed on 15 May 2023).
  28. Žutinić, P.; Petrić, I.; Gottstein, S.; Gligora Udovič, M.; Kralj Borojević, K.; Kamberović, J.; Kolda, A.; Plenković-Moraj, A.; Trenjej, I. Microbial mats as shelter microhabitat for amphipods in an intermittent karstic spring. Knowl. Manag. Aquat. Ecosyst. 2018, 419, 7. [Google Scholar] [CrossRef]
  29. Gottstein, S.; Mihaljević, Z.; Perović, G.; Kerovec, M. The distribution of amphipods (Crustacea) in different habitats along the Mura and Drava river system in Croatia. In Limnological Reports; Horvatić, J., Ed.; Faculty of Education, J.J. Strossmayer University of Osijek: Osijek, Croatia; Croatian Ecological Society: Zagreb, Croatia, 2000; Volume 33, pp. 231–236. [Google Scholar]
  30. Gottstein Matočec, S.; Bakran-Petricioli, T.; Bedek, J.; Bukovec, D.; Buzjak, S.; Franičević, M.; Jalžić, B.; Kerovec, M.; Kletečki, E.; Kralj, J.; et al. An overview of the cave and interstitial biota of Croatia. Nat. Croat. 2002, 11 (Suppl. 1), 1–112. Available online: https://hrcak.srce.hr/file/52154 (accessed on 22 March 2023).
  31. Redžović, Z.; Erk, M.; Gottstein, S.; Sertić Perić, M.; Dautović, J.; Fiket, Ž.; Brkić, A.L.; Cindrić, M. Metal bioaccumulation in stygophilous amphipod Synurella ambulans in the hyporheic zone: The influence of environmental factors. Sci. Total Environ. 2023, 866, 161350. [Google Scholar] [CrossRef]
  32. GRC (Government of the Republic of Croatia). Directive on Water Quality Standard. Off. Gaz. 2019, 96. Available online: https://narodne-novine.nn.hr/clanci/sluzbeni/2019_10_96_1879.html (accessed on 2 February 2023).
  33. EEA (European Environment Agency). Ecoregions for Rivers and Lakes. 2009. Available online: https://www.eea.europa.eu/data-and-maps/figures/ecoregions-for-rivers-and-lakes (accessed on 2 February 2023).
  34. Tomas, D.; Čurlin, M.; Marić, A.S. Assessing the surface water status in Pannonian ecoregion by the water quality index model. Ecol. Indic. 2017, 79, 182–190. [Google Scholar] [CrossRef]
  35. Bou, C.; Rouch, R. Un nouveau champ de recherche sur la faune aquatique souterraine. Acad. Sci. Paris 1967, 265, 369–370. [Google Scholar]
  36. Karaman, G.S. Crustacea—Amphipoda of freshwaters. In Fauna d’Italia; Edizioni Calderini: Bologna, Italy, 1993; Volume 31, pp. 1–337. [Google Scholar]
  37. Redžović, Z.; Erk, M.; Svetličić, E.; Dončević, L.; Gottstein, S.; Hozić, A.; Cindrić, M. Determination of adenylate nucleotides in amphipod Gammarus fossarum by ion-pair reverse phase liquid chromatography: Possibilities of positive pressure micro-solid phase extraction. Separations 2021, 8, 20. [Google Scholar] [CrossRef]
  38. Díaz Enrich, M.J.; Villamarín, J.A.; Ramos Martínez, J.I.; Ibarguren, I. Measurement of adenosine 3′,5′-cyclic monophosphate and guanosine 3′, 5′-cyclic monophosphate in mussel (Mytilus galloprovincialis Lmk.) by high-performance liquid chromatography with diode array detection. Anal. Biochem. 2000, 285, 105–112. [Google Scholar] [CrossRef]
  39. Czarnecka, J.; Cieślak, M.; Michał, K. Application of solid phase extraction and high-performance liquid chromatography to qualitative and quantitative analysis of nucleotides and nucleosides in human cerebrospinal fluid. J. Chromatogr. B 2005, 822, 85–90. [Google Scholar] [CrossRef] [PubMed]
  40. Thébault, M.T.; Raffin, J.P.; Picado, A.M.; Mendonça, E.; Skorkowski, E.F.; Le Gal, Y. Coordinated changes of adenylate energy charge and ATP/ADP: Use in ecotoxicological studes. Ecotoxicol. Environ. Saf. 2000, 46, 23–28. [Google Scholar] [CrossRef] [PubMed]
  41. Vereshchagina, K.P.; Lubyaga, Y.A.; Shatilina, Z.; Bedulina, D.; Gurkov, A.; Axenov-Gribanov, D.V.; Baduev, B.; Kondrateva, E.S.; Gubanov, M.; Zadereev, E.; et al. Salinity modulates thermotolerance, energy metabolism and stress response in amphipods Gammarus lacustris. PeerJ 2016, 4, e2657. [Google Scholar] [CrossRef] [PubMed]
  42. Robles-Romo, A.; Arjona, O.; Racotta, I.S. Influence of sampling, storage, processing and optimal experimental conditions on adenylate energy charge in penaeid shrimp. Arch. Biol. Sci. 2014, 66, 651–666. [Google Scholar] [CrossRef]
  43. Hervant, F.; Mathieu, J.; Garin, D.; Fréminet, A. Behavioral, ventilatory, and metabolic responses to severe hypoxia and subsequent recovery of the hypogean Niphargus rhenorhodanensis and the epigean Gammarus fossarum (Crustacea: Amphipoda). Physiol. Zool. 1995, 68, 223–244. [Google Scholar] [CrossRef]
  44. Hervant, F. The activities of enzymes associated with the intermediary and energy metabolism in hypogean and epigean crustaceans. Comptes Rendus Acad. Sci.-Ser. III 1996, 319, 1071–1077. [Google Scholar]
  45. Redžović, Z.; Sokolova, I.; Erk, M.; Sokolov, E.; Gottstein, S. Anaerobic potential of Synurella ambulans (Müller, 1846) (Crustacea, Amphipoda) from hyporheic zone of Sava River and Stalnjak Spring, Croatia. In Book of Abstracts of 3rd Faculty of Science PhD Student Symposium, Zagreb, Croatia, 22/02/2019; Prirodoslovno-Matematički Fakultet Sveučilišta u Zagrebu: Zagreb, Croatia, 2019; Available online: https://www.pmf.unizg.hr/_download/repository/Knjiga_sazetaka_SSDS_PMF-a_2019.pdf (accessed on 3 February 2023).
  46. Schill, R.O.; Köhler, H.-R. Does the environment or the source of the population define stress status and energy supply in the freshwater amphipod, Gammarus fossarum? Ecotoxicology 2004, 13, 683–695. [Google Scholar] [CrossRef]
  47. De la Fuente, I.M.; Cortés, J.M.; Valero, E.; Desroches, M.; Rodrigues, S.; Malaina, I.; Martínez, L. On the dynamics of the adenylate energy system: Homeorhesis vs homeostasis. PLoS ONE 2014, 9, e108676. [Google Scholar] [CrossRef]
  48. Gottstein, S.; Redžović, Z.; Erk, M.; Sertić Perić, M.; Dautović, J.; Cindrić, M. Life history traits of the stygophilous amphipod Synurella ambulans in hyporheic zone of the Sava River, Croatia. Water, 2023; submitted. [Google Scholar]
  49. Zapata-Restrepio, L.M.; Hauton, C.; Hudson, M.D.; Williams, I.D.; Hauton, D. Toxicity of tributyltin to the European flat oyster Ostrea edulis: Metabolomic responses indicate impacts to energy metabolism, biochemical composition and reproductive maturation. PLoS ONE 2023, 18, e0280777. [Google Scholar] [CrossRef] [PubMed]
  50. Dole-Olivier, M.J.; Marmonier, P. Patch distribution of interstitial communities: Prevailing factors. Freshw. Biol. 1992, 27, 177–191. [Google Scholar] [CrossRef]
  51. Becher, J.; Englisch, C.; Griebler, C.; Bayer, P. Groundwater fauna downtown—Drivers, impacts and implications for subsurface ecosystems in urban areas. J. Contam. Hydrol. 2022, 248, 104021. [Google Scholar] [CrossRef] [PubMed]
  52. Boulton, A.J. Hyporheic rehabilitation in rivers: Restoring vertical connectivity. Freshw. Biol. 2007, 52, 632–650. [Google Scholar] [CrossRef]
  53. Harvey, J.; Gooseff, M. River corridor science: Hydrologic exchange and ecological consequences from bedforms to basins. Water Resour. Res. 2015, 51, 6893–6922. [Google Scholar] [CrossRef]
  54. Jakob, L.; Bedulina, D.S.; Axenov-Gribanov, D.V.; Ginzburg, M.; Shatilina, Z.M.; Lubyaga, Y.A.; Madyarova, E.V.; Gurkov, A.N.; Timofeyev, M.A.; Pörtner, H.O.; et al. Uptake kinetics and subcellular compartmentalization explain lethal but not sublethal effects of cadmium in two closely related amphipod species. Environ. Sci. Technol. 2017, 51, 7208–7218. [Google Scholar] [CrossRef]
  55. Alonso, A.; Camargo, J.A. Toxicity of nitrite to three species of freshwater invertebrates. Environ. Toxicol. 2006, 21, 90–94. [Google Scholar] [CrossRef]
  56. Jensen, F.B. Nitrite disrupts multiple physiological functions in aquatic animals. Comp. Biochem. Physiol. 2003, 135, 9–24. [Google Scholar] [CrossRef]
  57. Astiz, S.; Sabater, F. Anthropic effects on the meiofauna and physicochemical characteristics of the hyporheic zone in a Mediterranean stream. Eur. J. Environ. Sci. 2015, 5, 2. [Google Scholar] [CrossRef]
  58. Jansson, M. Phosphate uptake and utilization by bacteria and algae. Hydrobiologia 1988, 170, 177–189. [Google Scholar] [CrossRef]
  59. Marsden, I.D.; Rainbow, P.S. Does the accumulation of trace metals in crustaceans affect their ecology—The amphipod example? J. Exp. Mar. Biol. Ecol. 2004, 300, 343–371. [Google Scholar] [CrossRef]
  60. Viarengo, A.; Nott, J.A. Mechanisms of heavy metal cation homeostasis in marine invertebrates. Comp. Biochem. Physiol. 1993, 104, 355–372. [Google Scholar] [CrossRef]
  61. Huang, X.P.; O’Brien, P.J.; Templeton, D.M. Mitochondrial involvement in genetically determined transition metal toxicity: I. Iron toxicity. Chem.-Biol. Interact. 2006, 163, 68–76. [Google Scholar] [CrossRef] [PubMed]
  62. Maret, W. Zinc biochemistry: From a single zinc enzyme to a key element of life. Adv. Nutr. 2013, 4, 82–91. [Google Scholar] [CrossRef] [PubMed]
Figure 1. Concentrations of AMP, ADP, ATP and total adenylate pool (TAP) determined in S. ambulans from the HZ at two sampling sites at the Sava River presented as box plots (with upper and lower quartile; whiskers with 10th and 90th percentile; a solid line within the box marks the median and a dotted line marks the mean; sampling site 1-UP: light blue, sampling site 2-DOWN: light grey). Significant differences between sampling sites in the same season are indicated with an asterisk * (Mann–Whitney U test, p < 0.05), and differences among seasons with different letters (Kruskal–Wallis one-way analysis of variance on ranks, p < 0.05, capital letters in sampling site 1-UP and small letters in sampling site 2-DOWN).
Water 15 03083 g001
Figure 2. Concentrations of AMP, ADP and ATP in S. ambulans from the HZ at sampling sites 1-UP and 2-DOWN at the Sava River expressed as fractions (%) of the total adenylate pool (TAP).
Water 15 03083 g002
Figure 3. Coordinated changes of AEC and ATP/ADP ratios in S. ambulans from the HZ at two sampling sites on the Sava River. Each point represents a composite sample. Lines represent power regressions (R2 = 0.83 and 0.77 for populations from 1-UP and 2-DOWN, respectively).
Water 15 03083 g003
Table 1. Separation conditions applied for analyses of adenylates in amphipod S. ambulans.
HPLC ConditionsComposition, Concentration and Values
Mobile phase150 mM KH2PO4/K2HPO4 and 100 mM KCl; pH = 6
Ion-pairing agent10 mM tetrabutylammonium (TBA) hydroxide
Flow rate1 mL min−1
Detection/band width260 nm/80 nm
Injection volume3 µL
Elution time12 min
Table 2. Adenylate energy charge (AEC) and ATP/ADP ratio in S. ambulans from the HZ at two sampling sites at the Sava River (number of analysed pooled samples, N; mean values ± standard deviations). Significantly higher values at 1-UP sampling site are indicated with asterisk * (Mann–Whitney U test, p < 0.05), and significant seasonal differences are indicated with different letters (Kruskal–Wallis one-way analysis of variance on ranks, p < 0.05, capital letters in sampling site 1-UP and small letters in sampling site 2-DOWN).
1-UP2-DOWN
NAECATP/ADPNAECATP/ADP
Winter 2018100.41 ± 0.04 *0.91 ± 0.18 A,B40.34 ± 0.04 a,b0.73 ± 0.12
Spring 201960.46 ± 0.06 *1.38 ± 0.37 A,*60.31 ± 0.05 b0.69 ± 0.22
Summer 201960.42 ± 0.010.93 ± 0.07 A,B60.41 ± 0.04 a0.87 ± 0.14
Autumn 201960.40 ± 0.02 *0.85 ± 0.11 B60.37 ± 0.02 a,b0.79 ± 0.06
Table 3. Apparent equilibrium constant of adenylate kinase reaction (Keq) in S. ambulans from the HZ at two sampling sites at the Sava River (mean values ± standard deviations). Significantly higher values at 1-UP sampling site are indicated with asterisk * (Mann-Whitney U test, p < 0.05), and significant seasonal differences are indicated with different letters (Kruskal–Wallis one-way analysis of variance on ranks, p < 0.05, capital letters in sampling site 1-UP and small letters in sampling site 2-DOWN). Number of analysed pooled samples (N) is given in brackets.
1-UP2-DOWN
KeqKeq
Winter 20181.395 ± 0.186 A (10)1.313 ± 0.178 (4)
Spring 20192.345 ± 0.463 B,* (6)1.454 ± 0.340 (6)
Summer 20191.369 ± 0.221 A (6)1.243 ± 0.159 (6)
Autumn 20191.322 ± 0.222 A (6)1.332 ± 0.166 (6)
Table 4. Statistics of stepwise multiple linear regression models and variables entered in the respective model for levels of AEC in S. ambulans as dependent variable and five groups of independent variables.
ModelCoefficients
Independent
Variables
R2Fp * βtp **
(I) group 1 0.52712.5111 × 10−6
Conductivity −1.395−4.4515.6 × 10−5
Dissolved O2 −0.971−3.6816.2 × 10−4
Total water hardness 0.8933.9762.5 × 10−4
Alkalinity −0.491−2.4761.7 × 10−2
(II) group 2 0.41516.6653 × 10−6
Nitrites −0.463−3.8573.5 × 10−4
Phosphates −0.309−2.5791.3 × 10−2
(III) group 3 0.4209.0451.1 × 10−3
Fe in water 0.6113.8487.3 × 10−4
Na in water −0.447−2.8179.3 × 10−3
(IV) group 4 0.2685.1214 × 10−2
Ni in sediment −0.518−2.2634 × 10⁻²
Metal
accumulation 5
0.79137.912<1 × 10⁻⁷
Fe in S. ambulans −0.920−8.554<1 × 10⁻⁷
Zn in S. ambulans 1.4834.2194.2 × 10−4
Notes: R2—coefficient of determination; FF-statistic (used to test for the statistical significance of the regression model as a whole); β—regression coefficients of the independent variables; tt-statistic (used to test for the statistical significance of each independent variable); * p-value of the model; ** p-value of each independent variable; 1 (I) group of environmental variables which are natural factors: water temperature, concentration of dissolved oxygen, pH, electrical conductivity, alkalinity and total water hardness; 2 (II) group of environmental variables which are nutrient concentrations: P-PO43−, N-NO2, N-NO3, TOC in interstitial water and TOC in sediment from the HZ; 3 (III) group of environmental variables which are metal concentrations in the interstitial water from the HZ: Al, Cd, Co, Cr, Cu, Fe, Mn, Ni, Pb, Sn, Zn, Ca, K, Mg and Na; 4 (IV) group of environmental variables which are metal concentrations in the fine sediment fraction from the HZ: Al, Cd, Co, Cr, Cu, Fe, Mn, Ni, Pb, Sn, Zn; 5 metal concentrations accumulated in S. ambulans: Al, Cd, Co, Cr, Cu, Fe, Mn, Ni, Pb, Sn, Zn, Ca, K, Mg and Na.
Disclaimer/Publisher’s Note: The statements, opinions and data contained in all publications are solely those of the individual author(s) and contributor(s) and not of MDPI and/or the editor(s). MDPI and/or the editor(s) disclaim responsibility for any injury to people or property resulting from any ideas, methods, instructions or products referred to in the content.

