
Assessment of the Implementation Effect of a Gully Consolidation and Highland Protection (GCHP) Project Based on the GeoWEPP Model


 ,
,  ,
,  ,
,  and
and
Abstract
:1. Introduction
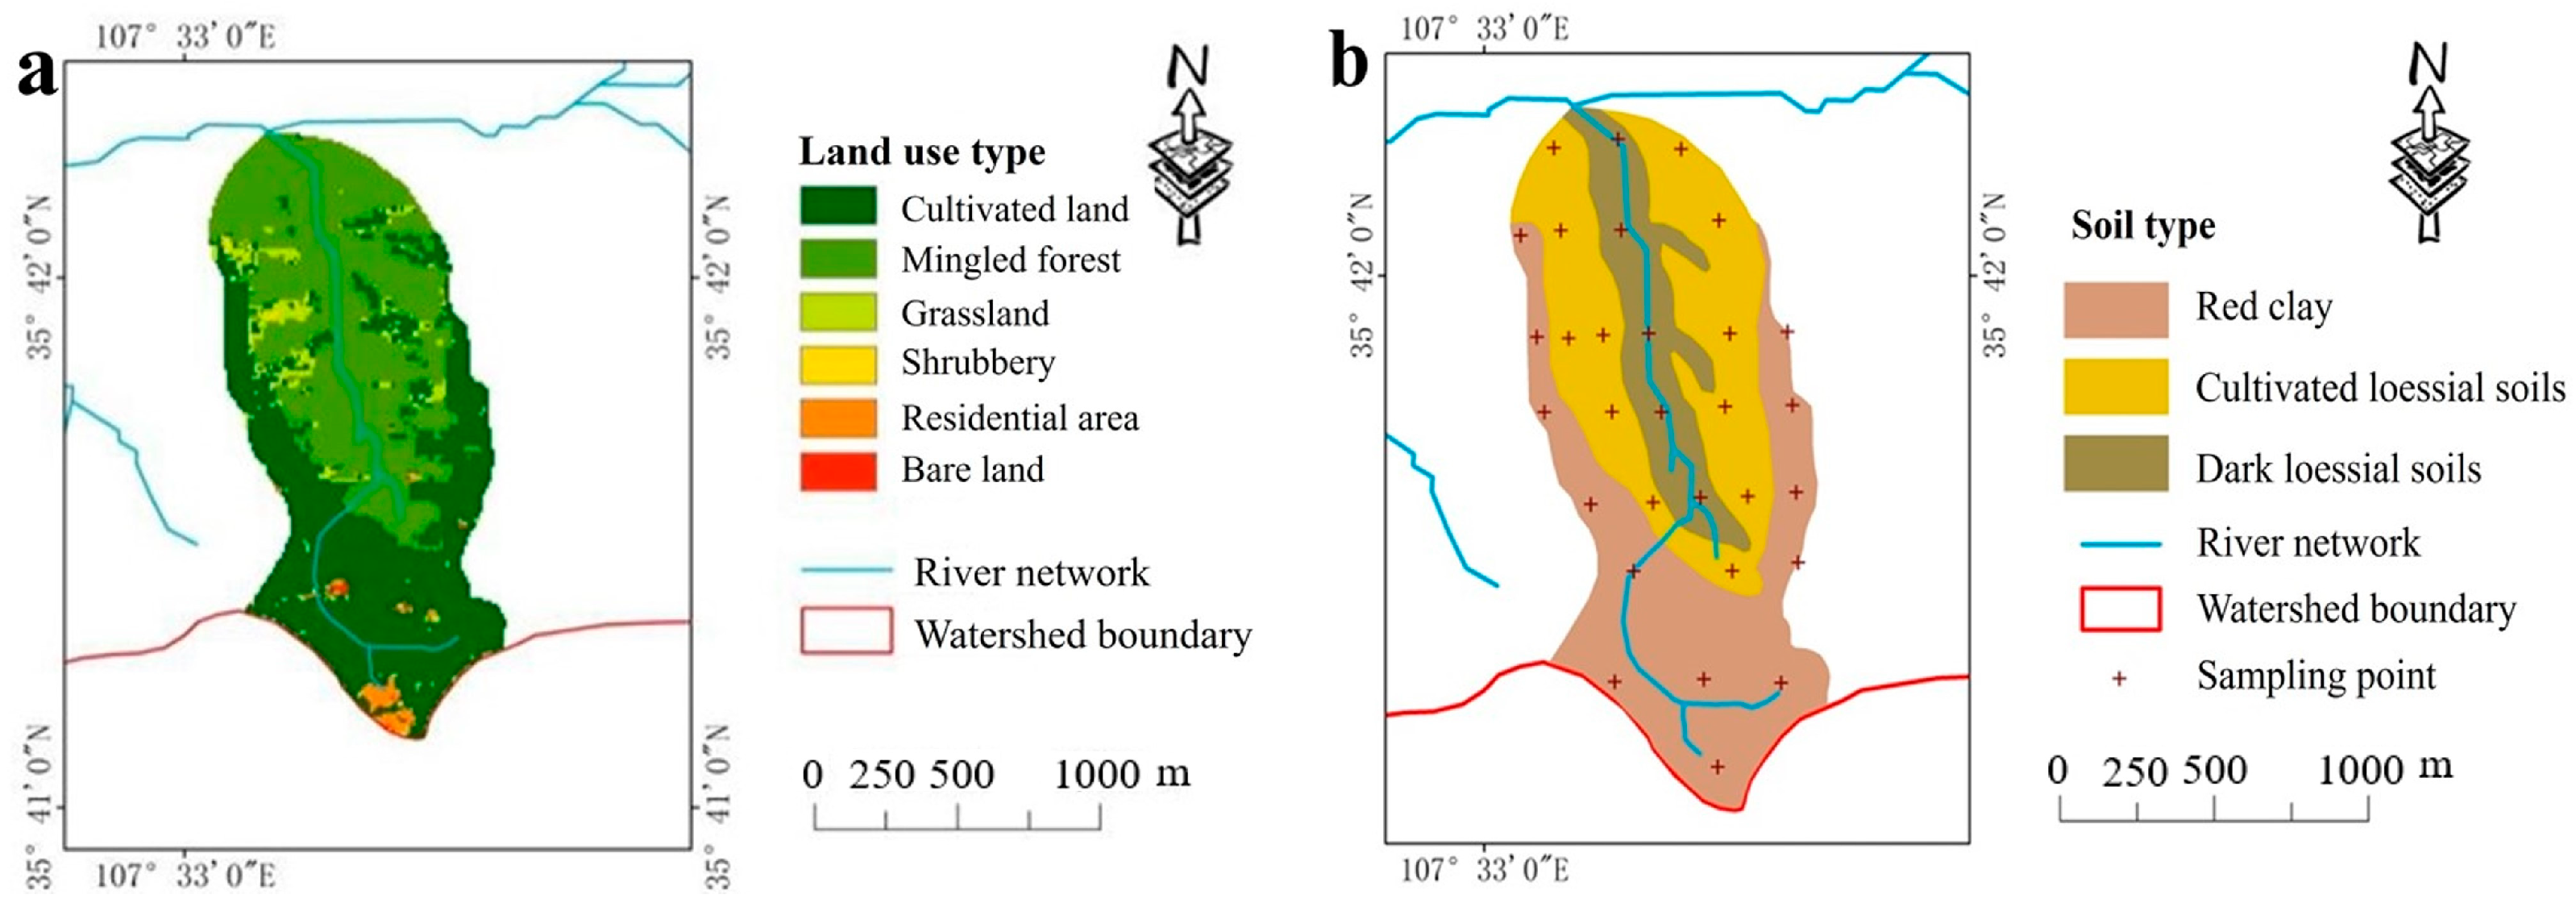
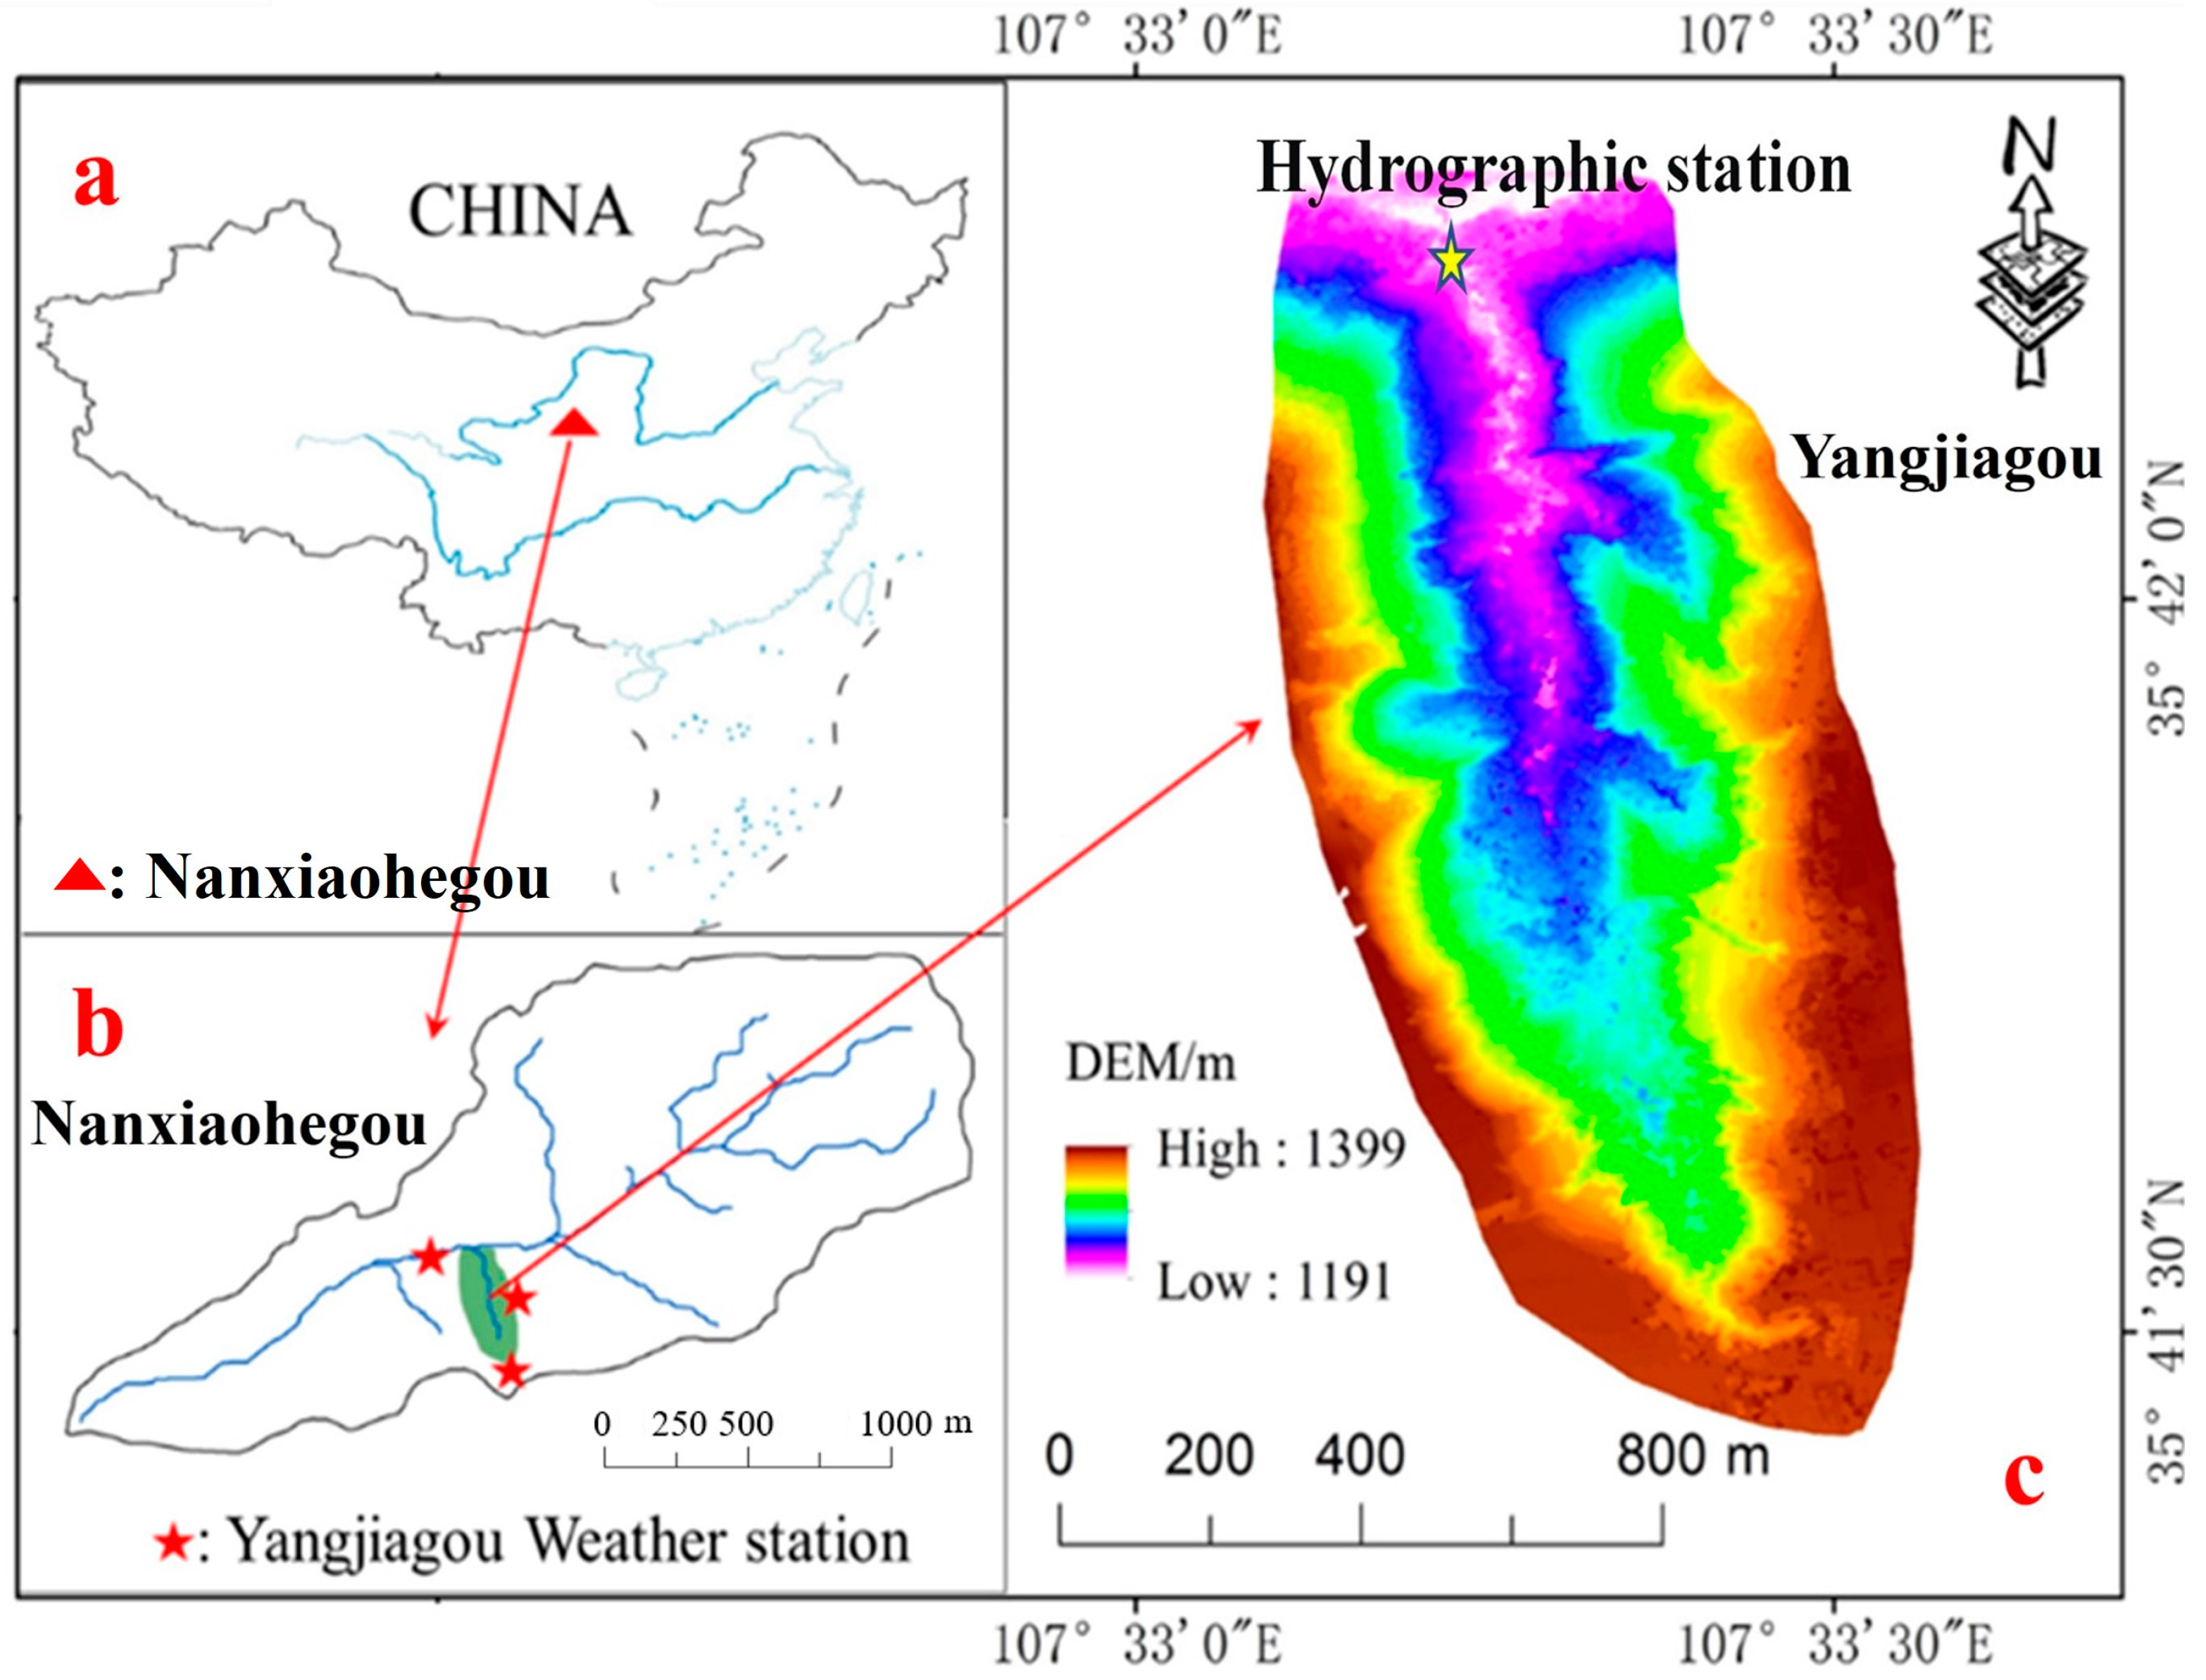
2. Study Area
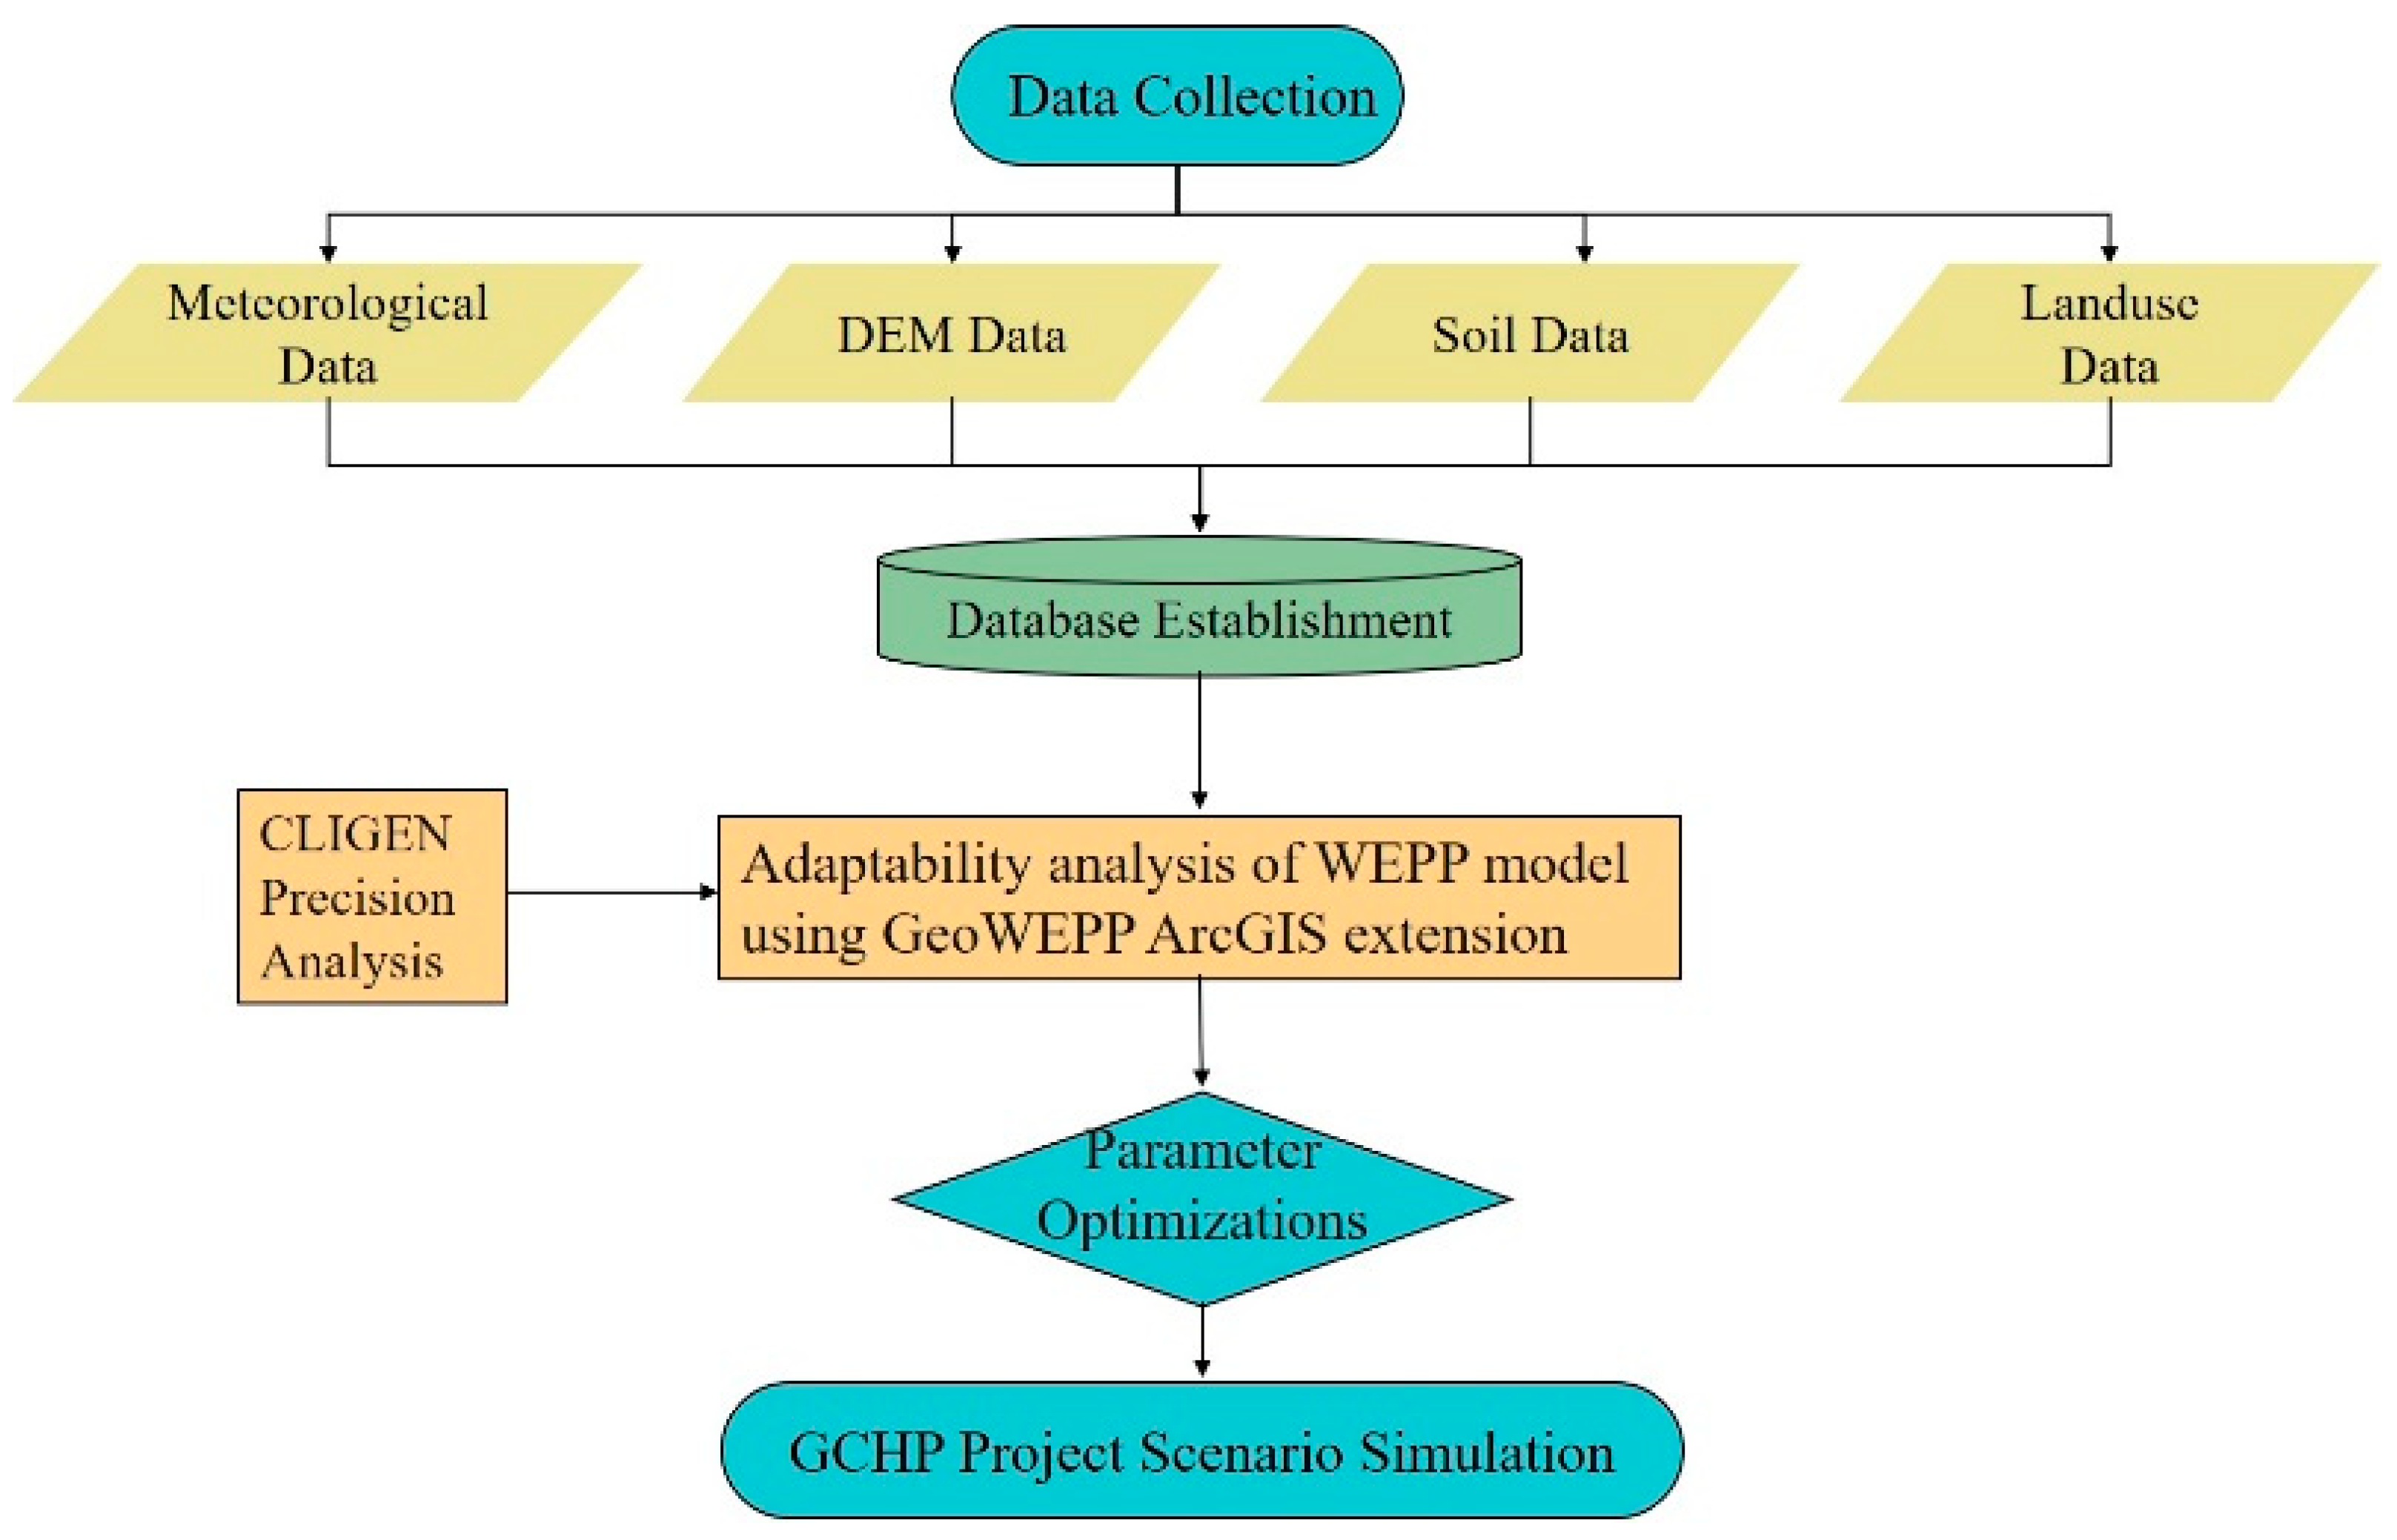
3. Method and Data
3.1. GeoWEPP Model
3.2. Data Collection
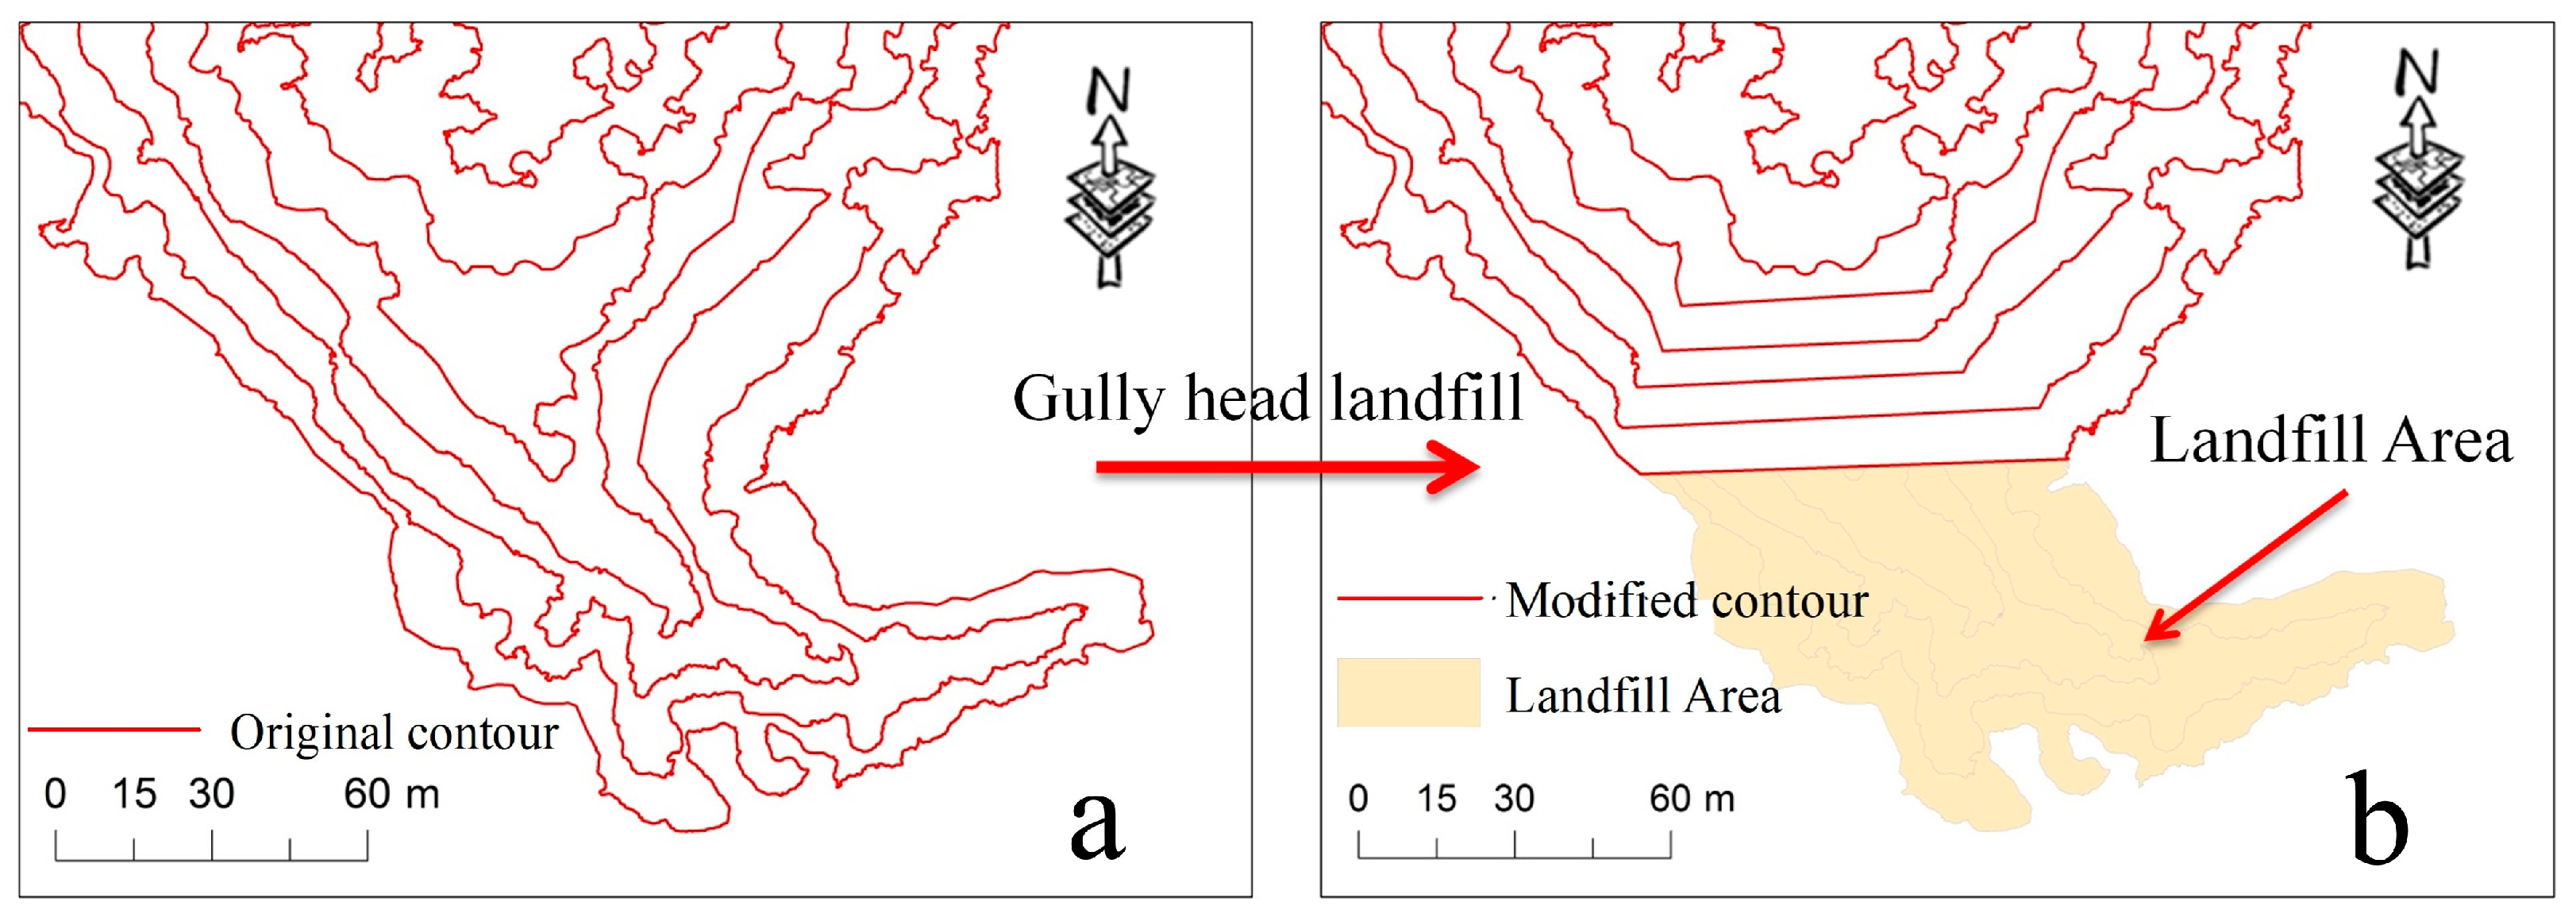
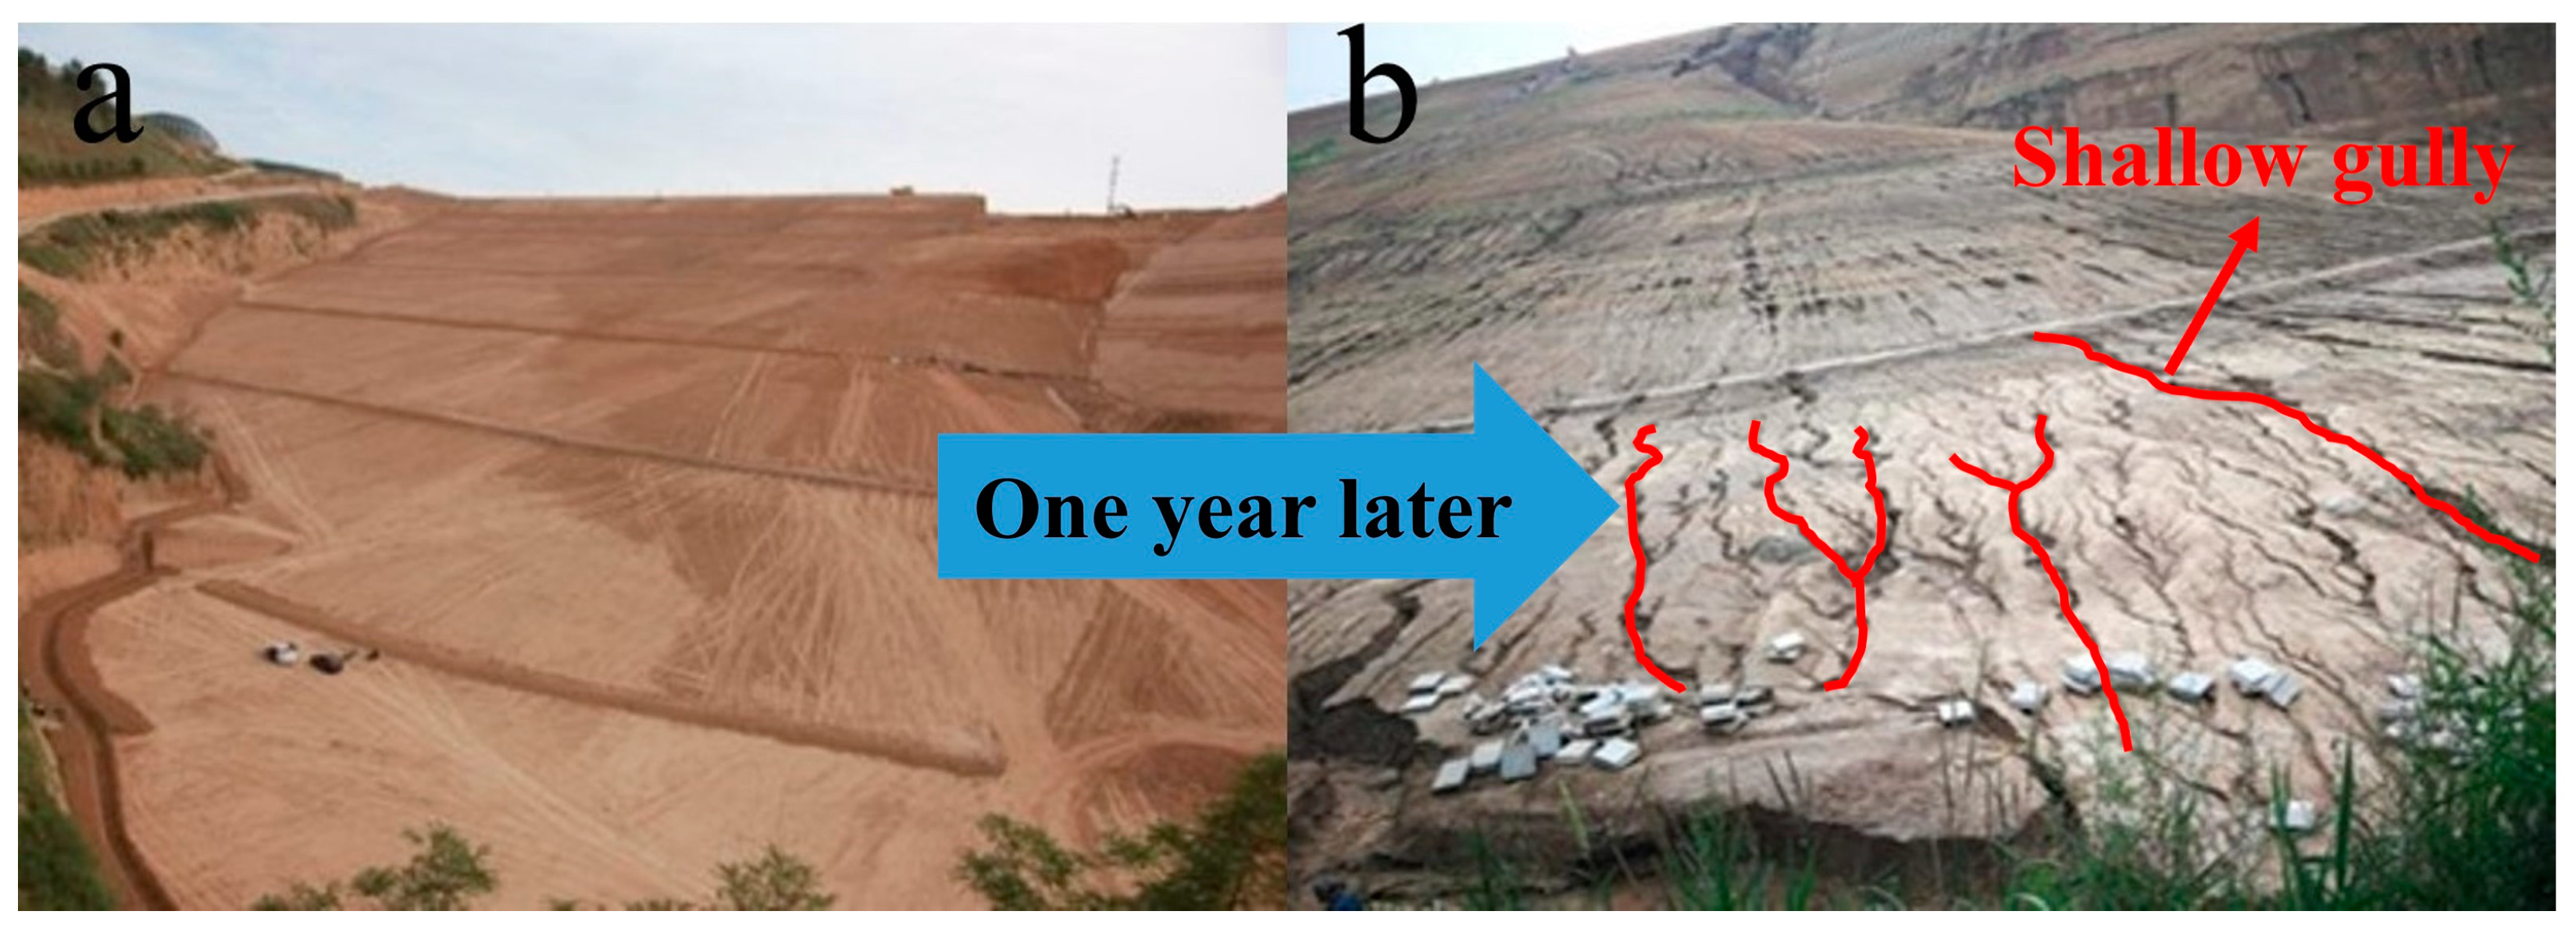
3.3. Gully Head Landfill Method
4. Results and Analysis
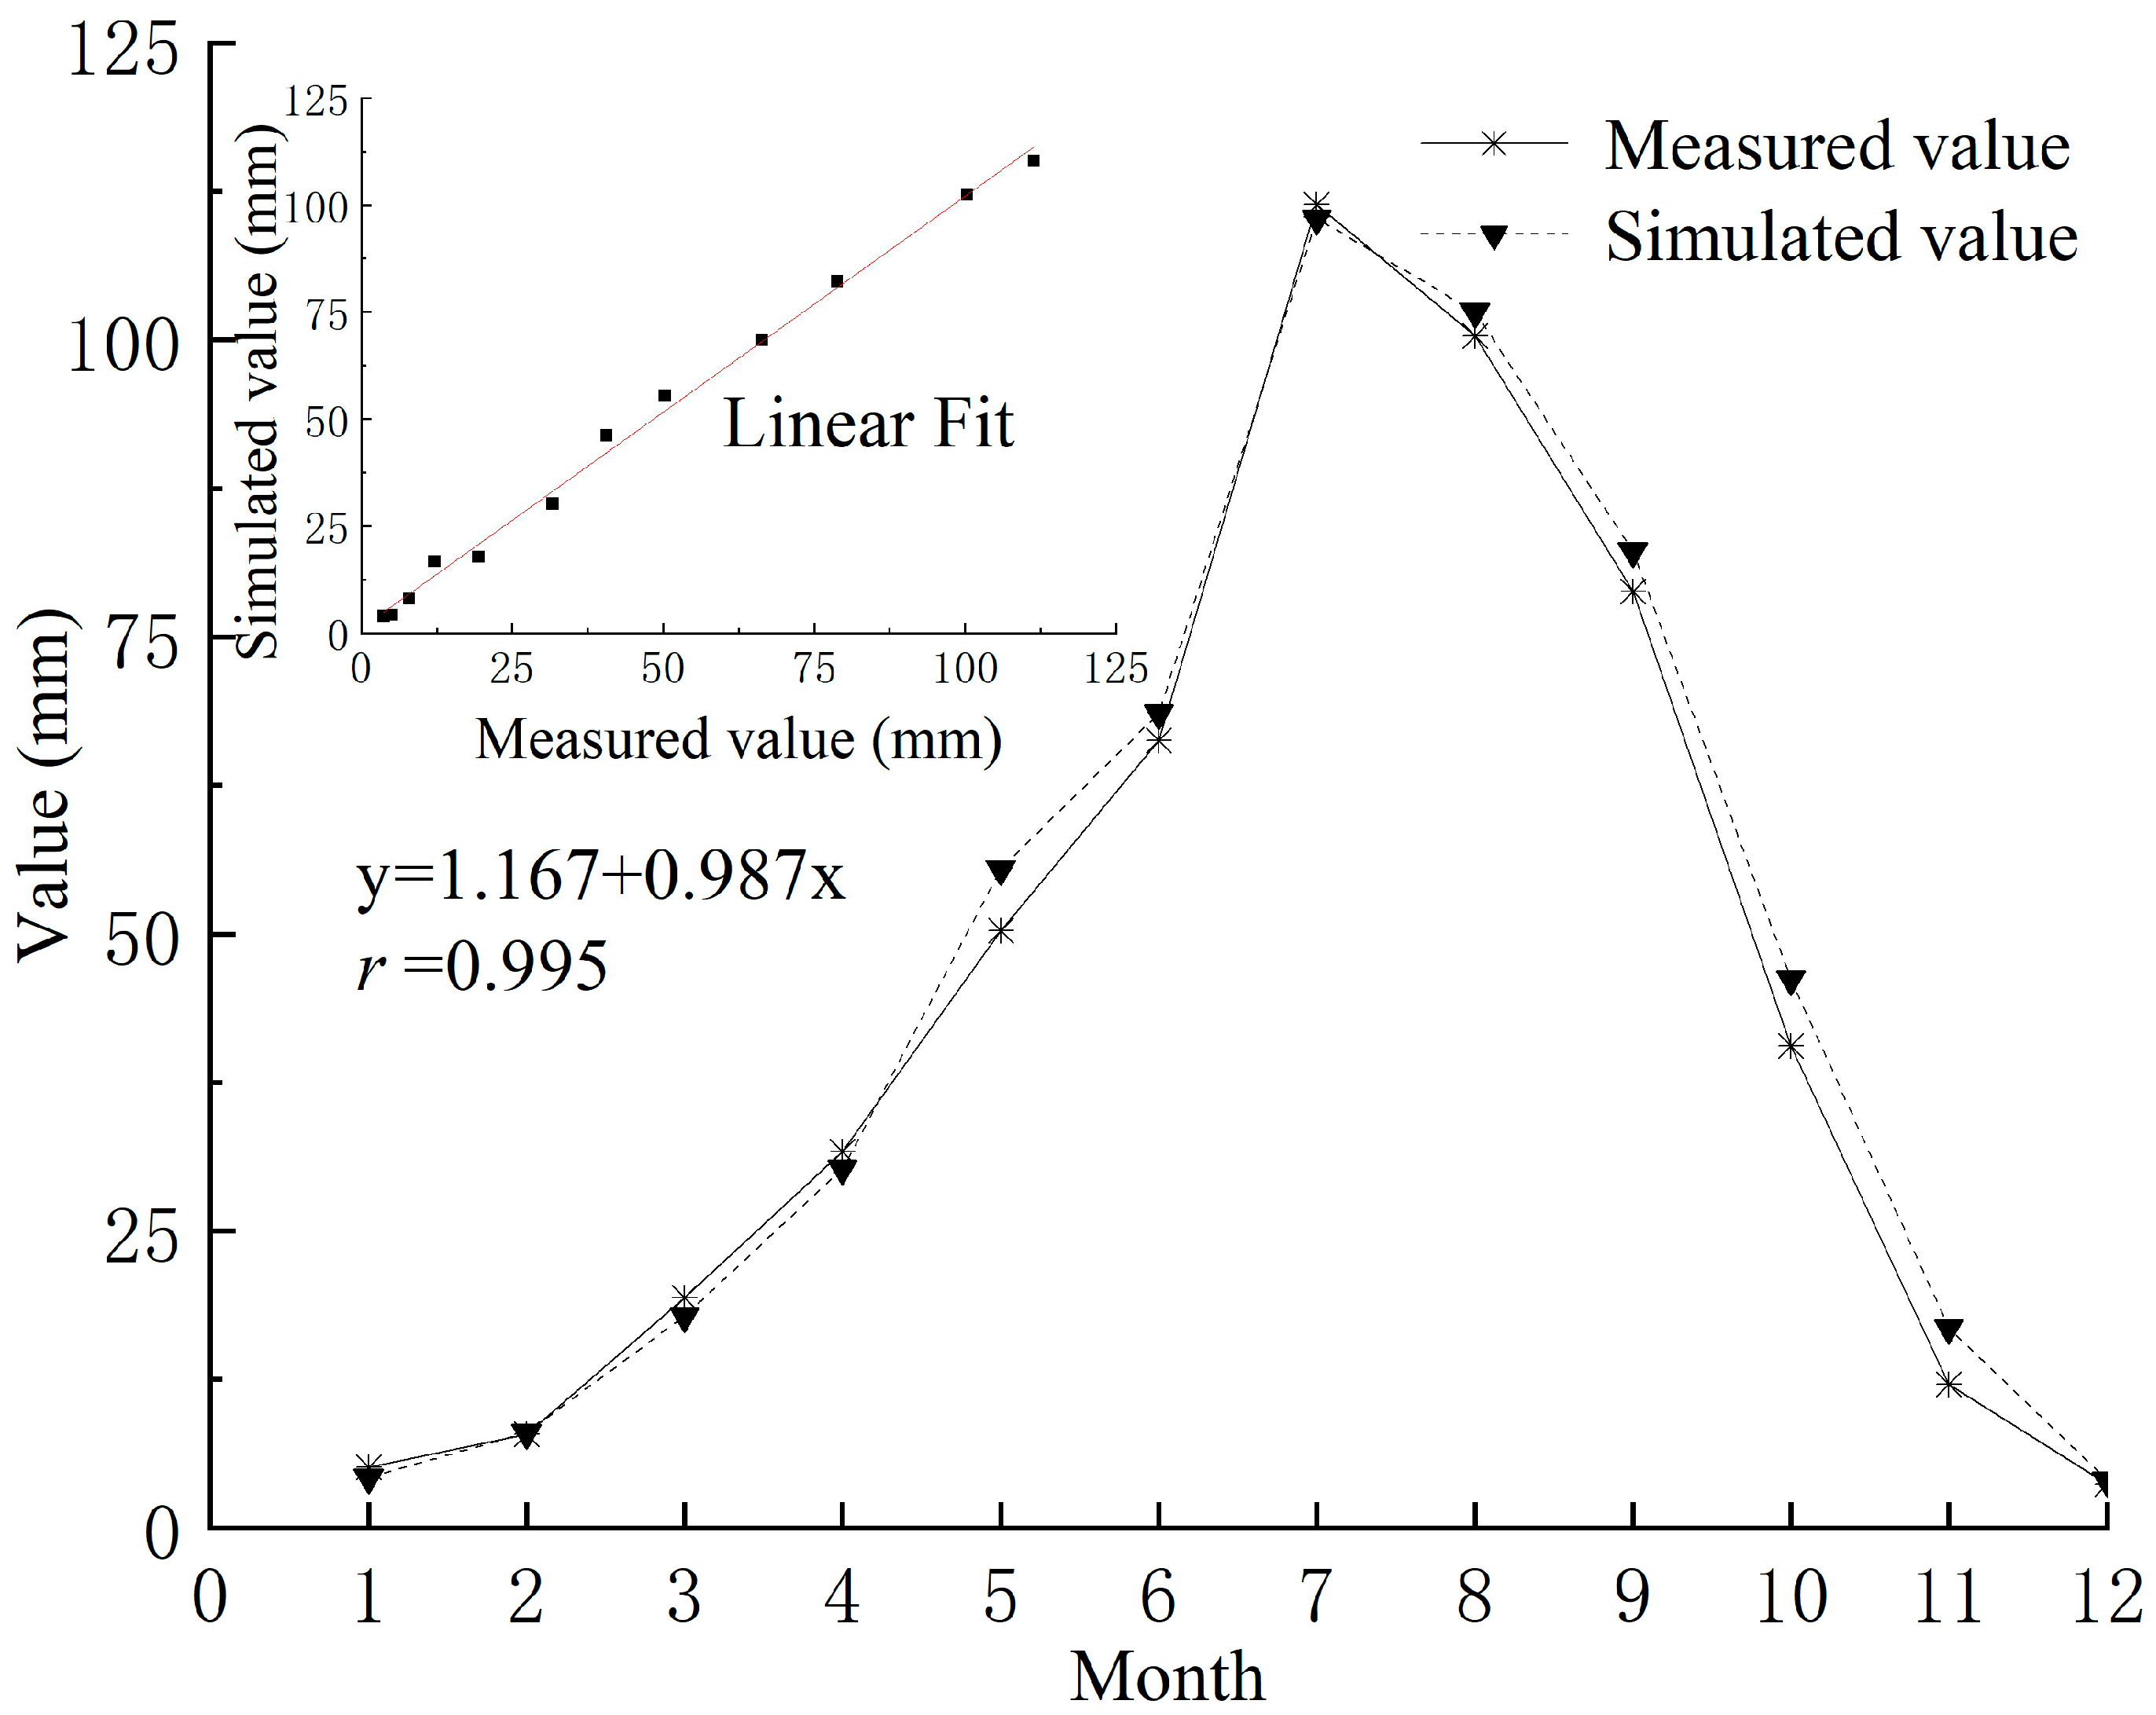
4.1. Accuracy Analysis of Climate Data Generated by CLIGEN
4.2. Evaluation of Simulation Accuracy of Watershed Runoff by GeoWEPP Model
4.3. Assessment of Implementation Effect for GCHP
4.4. Simulation of Erosion and Sediment Yield in Small Watershed under Gully Head Landfill Scenario
5. Discussion
6. Conclusions
- (1)
- The GeoWEPP model has good applicability in the YJG watershed. The relative error, correlation coefficient, and Nash–Sutcliffe efficiency coefficient were 13.248, 0.958, and 0.958, respectively, indicating that the GeoWEPP model has high accuracy in the simulation of erosion and sediment yield in the YJG watershed and can be used for various simulation analyses of erosion and sediment yield in the watershed.
- (2)
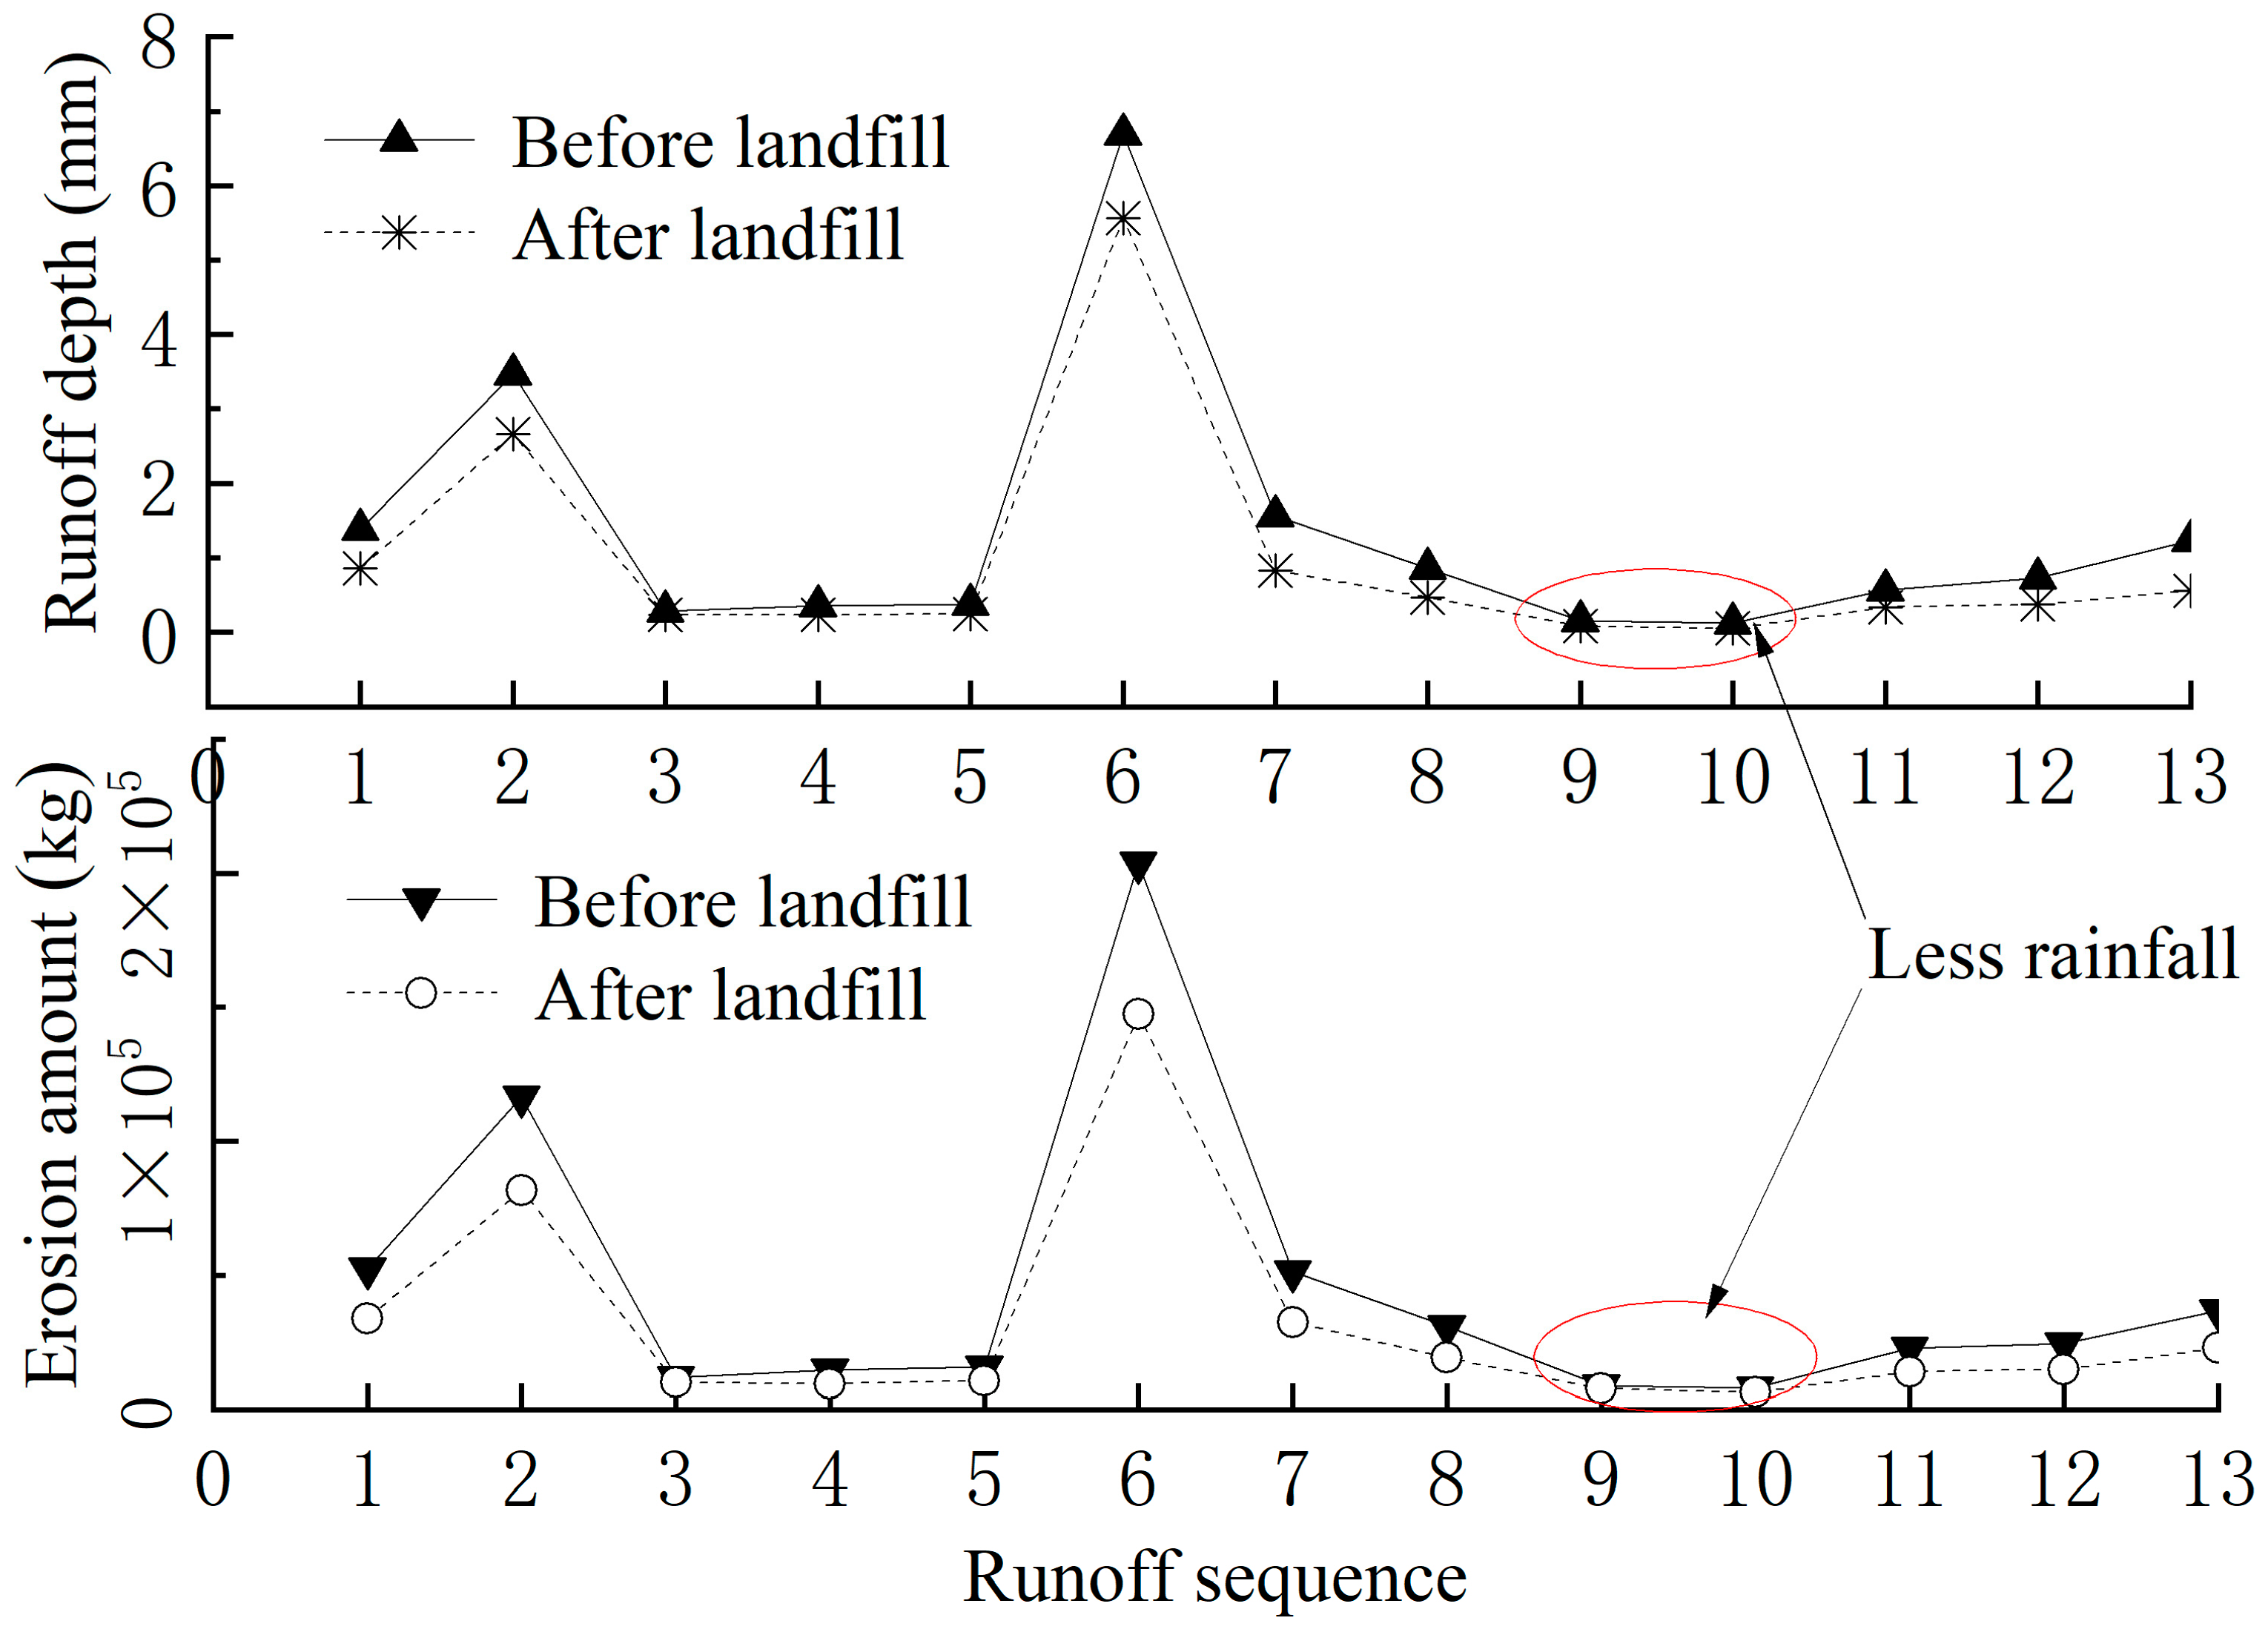
- According to the comparison of the simulation results, the sediment yield in the YJG area was reduced by 35.96%, and the annual runoff volume decreased by 13.13% after landfill, indicating that the gully head landfill effectively prevented the further erosion of the loess plateau and reduced the erosion area. Generally speaking, it alleviates the soil erosion problem in the YJG area.
- (3)
- The results of the hydrological analysis showed that new shallow gullies would develop around the gully head after the GCHP as time went on. Compared with the original water flow path, the length and quantity of gully heads become shorter and more. The development of fissures and sinks on the edge of the tableland provides advantageous channels for water flow. If necessary maintenance is lacking, new gullies will easily develop in the long run, thus promoting greater soil erosion in the watershed. In the gully region of the Loess Plateau, there is a mutual feedback effect between the GCHP (gully head landfill) and soil hydraulic erosion. In order to reduce the shrinkage rate of the plateau surface and slow down the development of soil hydraulic erosion in the watershed, the use of ecological measures to control the surface of the bare area of the gully head landfill area (e.g., the landfill area is covered with grassland) can be implemented, which is an important research direction for future GCHP projects.
Author Contributions
Funding
Data Availability Statement
Acknowledgments
Conflicts of Interest
References
- Mu, X.; Li, P.; Liu, B.; Zhao, G.; Gao, P.; Sun, W. Spatial-Temporal Development and Driving Mechanisms of Erosion on the Chinese Loess Plateau between 1901 and 2016. Yellow River 2022, 44, 36–45. [Google Scholar]
- Zhao, Z.; Huo, A.; Cheng, Y.; Luo, P.; Peng, J.; Elbeltagi, A.; Abuarab, M.E.-S.; Mokhtar, A.; Adnan, A. Impacts of Different Gully Consolidation and Highland Protection Models on the Runoff and Sediment Yield in Small Watershed of the Chinese Loess Plateau—A Case Study of Fengbugou in Qingyang City of Gansu. Water 2023, 15, 2764. [Google Scholar] [CrossRef]
- Li, F.; Zhou, Y.; Chen, R.; Liu, C.; Li, Y. Quantitative analysis of topographic features of Loess Tableland slopes based on DEM. Sci. Geogr. Sin. 2023, 43, 932–942. [Google Scholar]
- Huo, A.D.; Yang, L.; Luo, P.P.; Cheng, Y.X.; Peng, J.B.; Nover, D. Influence of landfill and land use scenario on runoff, evapotranspiration, and sediment yield over the Chinese Loess Plateau. Ecol. Indic. 2021, 121, 107208. [Google Scholar] [CrossRef]
- Zhao, Z.; Huo, A.; Liu, Q.; Peng, J.; Elbeltagi, A.; Abuarab, M.E.-S.; Abu-Hashim, M.S.D. Spatiotemporal Variation in the Coupling Relationship between Human Activities and Soil Erosion & mdash: A Case Study in the Weihe River Basin. Sustainability 2023, 15, 10785. [Google Scholar] [CrossRef]
- Mosbahi, M.; Benabdallah, S.; Boussema, M.R. Assessment of soil erosion risk using SWAT model. Arab. J. Geosci. 2013, 6, 4011–4019. [Google Scholar] [CrossRef]
- Safwan, M.; Alaa, K.; Omran, A.; Quoc, B.P.; Nguyen, T.T.L.; Van, N.T.; Duong, T.A.; Endre, H. Predicting soil erosion hazard in Lattakia Governorate (W Syria). Int. J. Sediment Res. 2021, 36, 207–220. [Google Scholar] [CrossRef]
- Admas, M.; Melesse, A.M.; Abate, B.; Tegegne, G. Soil Erosion, Sediment Yield, and Runoff Modeling of the Megech Watershed Using the GeoWEPP Model. Hydrology 2022, 9, 208. [Google Scholar] [CrossRef]
- Tichavsky, R.; Polaskova, L.; Galia, T. Recent gully erosion intensity in an agricultural landscape underlain by fluvioglacial sediments (NE Czechia). Land Degrad. Dev. 2023, 34, 3295–3313. [Google Scholar] [CrossRef]
- Wilkinson, S.N.; Kinsey-Henderson, A.E.; Hawdon, A.A.; Hairsine, P.B.; Bartley, R.; Baker, B. Grazing impacts on gully dynamics indicate approaches for gully erosion control in northeast Australia. Earth Surf. Process. Landf. 2018, 43, 1711–1725. [Google Scholar] [CrossRef]
- Gebre, A.M.; Belete, M.D.; Belayneh, M.Z. Object-based image analysis (OBIA)-based gully erosion dynamics, sediment loading rate and sediment yield study in Lake Hawassa Sub-basin, Ethiopia. Nat. Resour. Model. 2023, 36, e12368. [Google Scholar] [CrossRef]
- Ghimire, S.K.; Higaki, D.S.; Bhattarai, T.P. Gully erosion in the Siwalik Hills, Nepal: Estimation of sediment production from active ephemeral gullies. Earth Surf. Process. Landf. 2006, 31, 155–165. [Google Scholar] [CrossRef]
- Valentin, C.; Poesen, J.; Li, Y. Gully erosion: Impacts, factors and control. Catena 2005, 63, 132–153. [Google Scholar] [CrossRef]
- Parkner, T.; Page, M.J.; Marutani, T.; Trustrum, N.A. Development and controlling factors of gullies and gully complexes, East Coast, New Zealand. Earth Surf. Process. Landf. 2006, 31, 187–199. [Google Scholar] [CrossRef]
- Anderson, R.L.; Rowntree, K.M.; Le Roux, J.J. An interrogation of research on the influence of rainfall on gully erosion. Catena 2021, 206, 105482. [Google Scholar] [CrossRef]
- Dong, Y.F.; Cao, W.Y.; Nie, Y.; Xiong, D.H.; Cheng, S.X.; Duan, X.W. Influence of soil geography on the occurrence and intensity of gully erosion in the Hengduan Mountain region. Catena 2023, 222, 106841. [Google Scholar] [CrossRef]
- Saxton, N.E.; Olley, J.M.; Smith, S.; Ward, D.P.; Rose, C.W. Gully erosion in sub-tropical south-east Queensland, Australia. Geomorphology 2012, 173, 80–87. [Google Scholar] [CrossRef]
- Chen, Z.; Xu, X.; Liu, B.; Wang, Z.; Kou, Z. Research on the Relationship between Land Use Types and Soil Erosion Response in Yangjiagou. Yellow River 2010, 32, 87–88+91. [Google Scholar]
- Huang, Z. Analysis of Soil and Water Conservation Effect of Gully Consolidation and Highland Protection (Check Dam); Chang’an University: Xi’an, China, 2021. [Google Scholar]
- Gelder, B.; Sklenar, T.; James, D.; Herzmann, D.; Cruse, R.; Gesch, K.; Laflen, J. The Daily Erosion Project—Daily estimates of water runoff, soil detachment, and erosion. Earth Surf. Process. Landf. J. Br. Geomorphol. Res. Group 2018, 43, 1105–1117. [Google Scholar] [CrossRef]
- Yu, G.; Li, Z.; Zhang, M.; Pei, L. Regulation mechanism of soil and water conservation measures on gravity erosion in small watershed of Loess Plateau. Chin. J. Soil Sci. 2012, 49, 9. [Google Scholar]
- Zgłobicki, W.; Janicki, G.; Rodzik, J. Geomorphic effects of land use changes (a case of the Gutanów loess catchment, Poland). Geogr. Časopis 2002, 54, 39–57. [Google Scholar]
- Yang, L. Application of GeoWEPP model in ditch crossing soil landfill engineering. IOP Conf. Ser. Earth Environ. Sci. 2023, 1143, 012023. [Google Scholar] [CrossRef]
- Wang, J.; Zheng, F.; Jiang, Z.; Zhang, X. Prediction of soil erosion under different slope lengths in Loess hilly region based on WEPP. J. Beijing For. Univ. 2008, 30, 6. [Google Scholar]
- Huo, A.; Zhao, Z.; Luo, P.; Zheng, C.; Peng, J.; Abuarab, M. Assessment of Spatial Heterogeneity of Soil Moisture in the Critical Zone of Gully Consolidation and Highland Protection. Water 2022, 14, 3674. [Google Scholar] [CrossRef]
- Yue, D.; Zhu, M.; Yang, C.; Wang, H.; Miao, J.; Chen, G.; Wang, D. Comparation of soil erosion effects on the Qiaozigou Watershed based on the GeoWEPP model. J. Lanzhou Univ. (Nat. Sci.) 2020, 56, 96–105+111. [Google Scholar]
- Zhang, X.M.; Cao, W.H.; Xin-Xiao, Y.U.; Zhen, P.L. Evaluation of applicability of GeoWEPP model on Loess Plateau in China. J. Sediment Res. 2011, 56, 50–54. [Google Scholar]
- Jin, Z.; Peng, J.B.; Zhuang, J.Q.; Feng, L.; Huo, A.; Mu, X.M.; Wang, W.L. Gully erosion and expansion mechanisms in loess tablelands and the scientific basis of gully consolidation and tableland protection. Sci. China Earth Sci. 2023, 66, 821–839. [Google Scholar] [CrossRef]


| Relative Error | Correlation Coefficient | Nash-Sutcliffe Efficiency Coefficient | |
|---|---|---|---|
| Model calibration period (1–6) | 13.248 | 0.997 | 0.994 |
| Model validation period (7–13) | 43.876 | 0.958 | 0.958 |
| Name | Annual Runoff/m3 | Annual Sediment/t |
|---|---|---|
| Measured value | 481,198.56 | 9.756 |
| Simulated value | 570,882 | 11.4 |
| Simulated value after GCHP | 495,952 | 7.3 |
Disclaimer/Publisher’s Note: The statements, opinions and data contained in all publications are solely those of the individual author(s) and contributor(s) and not of MDPI and/or the editor(s). MDPI and/or the editor(s) disclaim responsibility for any injury to people or property resulting from any ideas, methods, instructions or products referred to in the content. |
© 2023 by the authors. Licensee MDPI, Basel, Switzerland. This article is an open access article distributed under the terms and conditions of the Creative Commons Attribution (CC BY) license (https://creativecommons.org/licenses/by/4.0/).
Share and Cite
Luo, Y.; Huo, A.; Yang, L.; Zhao, Z.; Ahmed, A.; Elbeltagi, A.; Abuarab, M.E.-S.; Ganjidoust, H. Assessment of the Implementation Effect of a Gully Consolidation and Highland Protection (GCHP) Project Based on the GeoWEPP Model. Water 2023, 15, 2971. https://doi.org/10.3390/w15162971
Luo Y, Huo A, Yang L, Zhao Z, Ahmed A, Elbeltagi A, Abuarab ME-S, Ganjidoust H. Assessment of the Implementation Effect of a Gully Consolidation and Highland Protection (GCHP) Project Based on the GeoWEPP Model. Water. 2023; 15(16):2971. https://doi.org/10.3390/w15162971
Chicago/Turabian StyleLuo, Yi, Aidi Huo, Luying Yang, Zhixin Zhao, Adnan Ahmed, Ahmed Elbeltagi, Mohamed EL-Sayed Abuarab, and Hossein Ganjidoust. 2023. "Assessment of the Implementation Effect of a Gully Consolidation and Highland Protection (GCHP) Project Based on the GeoWEPP Model" Water 15, no. 16: 2971. https://doi.org/10.3390/w15162971
APA StyleLuo, Y., Huo, A., Yang, L., Zhao, Z., Ahmed, A., Elbeltagi, A., Abuarab, M. E.-S., & Ganjidoust, H. (2023). Assessment of the Implementation Effect of a Gully Consolidation and Highland Protection (GCHP) Project Based on the GeoWEPP Model. Water, 15(16), 2971. https://doi.org/10.3390/w15162971