1. Introduction
Malan loess is a porous fragile weakly cemented yellowish wind-formed sediment formed in the Late Pleistocene (Q
3) of the Fourth Series in arid and semi-arid regions; it is one of the most common materials in the Loess Plateau, where Malan loess plays an important role in various infrastructures such as housing, arable land, roads, and railroads [
1,
2,
3,
4,
5]. During its long formation process, Malan loess has formed different types of pores that affect its hydrogeological geotechnical properties. Because loess pores are characterized by high porosity and vulnerability, it is important for the identification and quantitative characterization of loess pores. Geological hazards are mostly developed in the Malan loess layer [
6,
7,
8]. In order to ensure engineering construction and people’s life and property safety, Malan loess has become the focus of relevant research by researchers in the field of hydrogeology and engineering geology [
3,
9].
With the application of photoelectric microscope, microcomputer image, and X-ray diffraction in this field, various structural parameters (size, shape, number, volume, and total porosity) of pores in loess can be extracted [
9]. Xing Li used CT scanning technology to quantitatively characterize the loess macropores under the effect of vegetation restoration on the Loess Plateau and predicted the loess saturation permeability coefficient of different vegetation root regions [
10,
11].
Malan loess is a typical porous medium and contains many phases in the process of water transport in Malan loess porous media. The study of macroscopic fluid seepage simulation in loess multiphase pore media requires an organic linkage of microscopic, fine, and macroscopic behaviors [
12]. The volume averaging method simultaneously volume averages the microscopic equilibrium equations and the microscopic constitutive equations to obtain the macroscopic equilibrium equations and the macroscopic constitutive equations [
13,
14,
15,
16,
17,
18]. Compared with the classical theoretical coupling method and mixture theory, the volume averaging method not only realizes the coupling of the seepage processes in multiphase porous media studied in a unified hydrodynamic framework, but also can use the pore-scale information to derive effective local volume averaging equations [
13,
15,
16,
18].
With the development of 3D visualization software, CT-based extraction of pore parameters and feature studies of porous media have become more convenient [
19,
20,
21,
22,
23,
24]. Li et al. proposed a method for pore and fracture classification and extraction based on shape factor by using CT and AVIZO software to study the pore and fracture structure of paleosols [
9]. Based on the solution of the closure problem, AVIZO software, combined with CT scanned images using the volume averaging method, developed a program package for solving the permeability coefficient tensor and seepage simulation. Using this solver package, the images obtained from CT scans can be analyzed and seepage simulations can be performed [
25,
26].
Generally, the permeability coefficient of loess needs to be measured with a ring knife; then, the soil permeability meter is used to measure the permeability coefficient. In this sampling method, the ring knife should be thrown into the soil during the field sampling process; then, the sample is taken out. During the sampling process, the natural structure of loess will be changed by vibration and pressure, resulting in errors in the measurement value of the permeability coefficient [
27,
28,
29,
30]. There is a difference between the seepage process of seepage in the loess taken out by the ring knife and the natural seepage process in the intact loess. The process of this sampling is based on ensuring the direction of loess deposition by chipping a square loess block on a large soil mass, which disturbs the loess sample very little and basically does not change the natural structure of the loess.
In this study, the CT scanning technique was used to scan the Malan loess sample from Jiuzhoutai, Lanzhou (northwestern part of the Loess Plateau, China); the porosity of the reconstructed 3D pore space after segmenting the specific yield of the intact Malan loess sample as the threshold of the scanned image was used as the characterization of the connected large pore space. The absolute permeability tensor calculation module and the absolute permeability experiment simulation module in AVIZO software were used to solve the absolute permeability tensor of Malan loess using the 3D pore space reconstructed by CT scan in combination with the volume averaging method, as well as to perform simulation of the seepage process.
2. Study Area and Data Preparation
2.1. Collection and Preparation of Malan Loess Samples
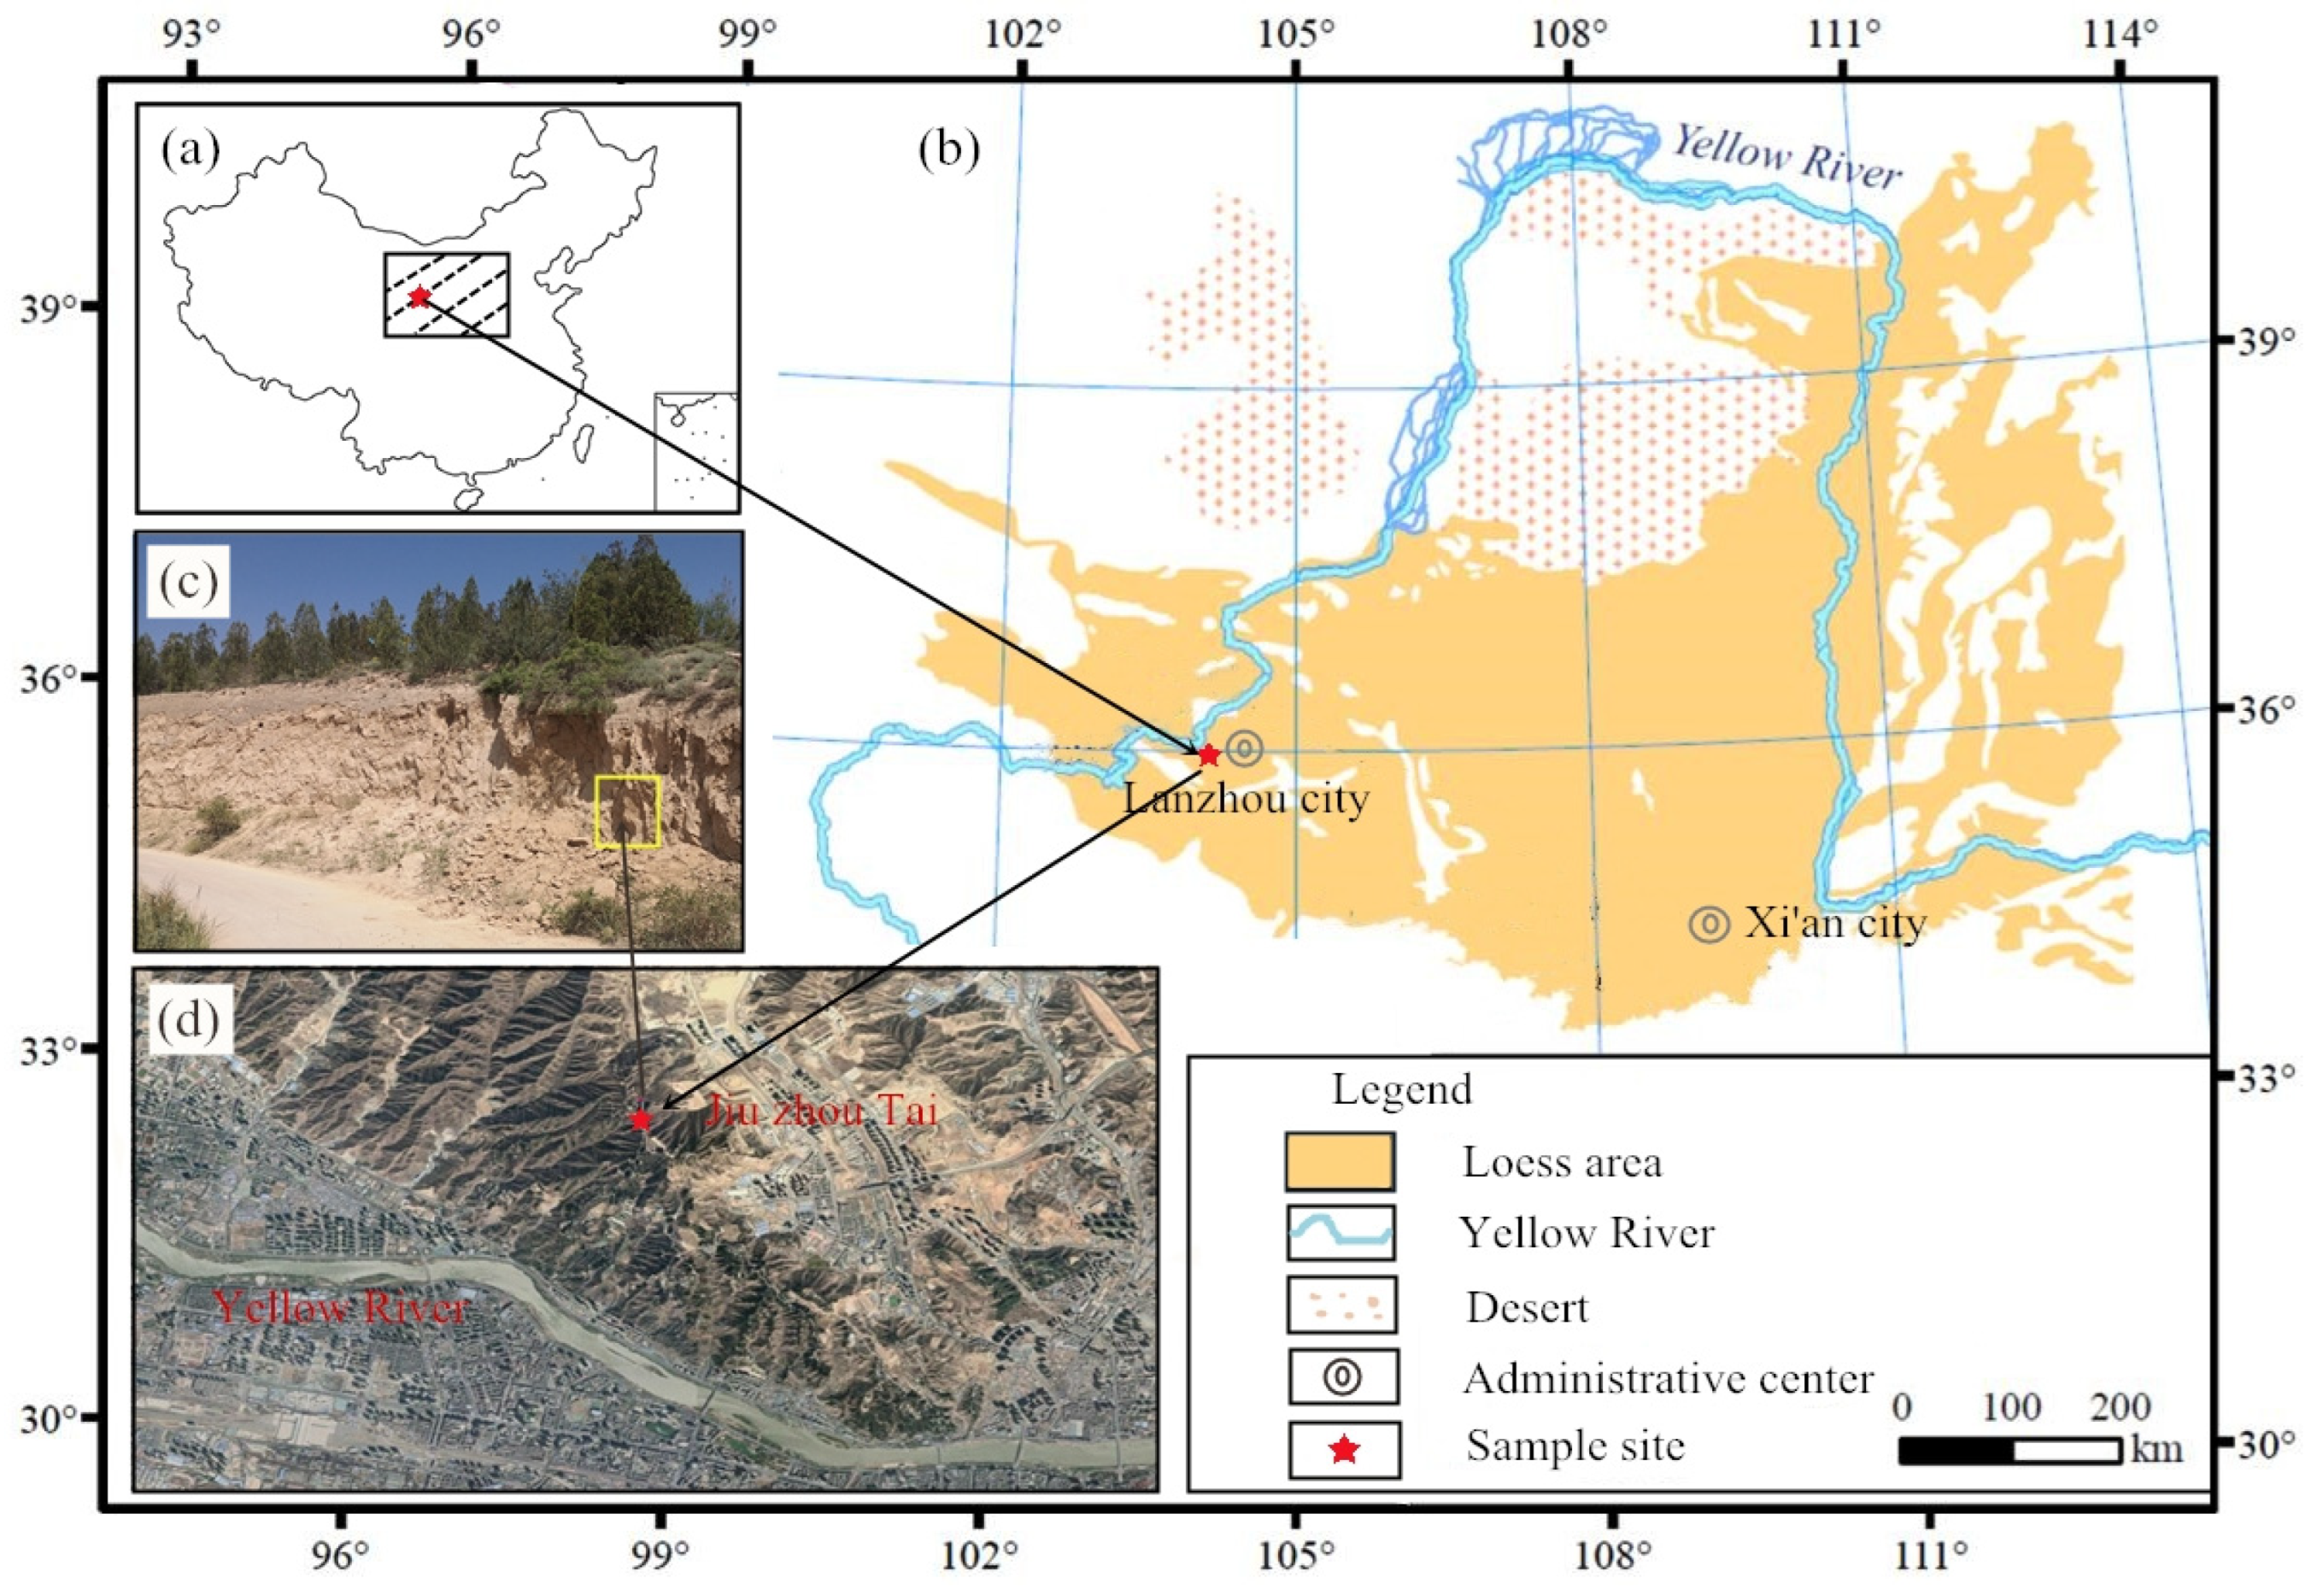
The sampling site was located in northwestern China, Lanzhou City, Gansu Province, Jiuzhoutai. The loess profile of Lanzhou Jiuzhoutai is covered by the highest terrace river gravel layer of the Yellow River in Lanzhou section, with a measured thickness of 318.2 m. Among them, the wind-formed loess is 297.2 m thick, which is the thickest wind-formed loess profile in the world with the most developed loess sequence [
31,
32,
33,
34]. The coordinates of the sampling point are 103.784105° E, 36.101807° N, 2023 m above sea level, taking L
1 Malan loess. Malan loess is light yellow in color, with developed vertical pore space and visible soil agglomerates.
Figure 1 shows the location of the intact Malan loess sampling site and the intact Malan loess layer in the field.
A complete square intact Malan loess column with a side length of 10 cm was taken at the sampling point and the orientation of the loess sample was always kept constant during the process of sample making. The made square loess sample was carefully brought to the laboratory and dried in an oven at 105 °C for 10 h. The weight of the sample was measured to be 1213 g and the dry density of the intact Malan loess sample was 1.213 g/cm
3. When making samples, the excess soil samples were cut out and divided into three parts and some basic physical properties of the loess samples were measured by a Malven Mastersizer 2000 laser analyzer (photoelectric liquid limit and plastic limit combined tester Inmalvern Instruments Co., Ltd., Worcestershire, UK); then, the average value was found. Around the sampling point, three samples were taken by a ring knife with a diameter of 61.8 mm and a height of 40 mm; the permeability coefficient of the soil samples was measured by TST-55 variable-head permeameters (Nanjing Ningxi Soil Instrument Co., Ltd., Nanjing, China) and the average value was obtained. The results are shown in
Table 1.
2.2. CT Scan and CT Image Calibration
CT scanning is a non-destructive testing technique that helps to obtain the pore structure inside the intact Malan loess sample. The ray detector of the CT unit accepts X-rays that have been attenuated by the soil sample and transforms the received signal into a series of grayscale image slices. This CT scan of loess specimens was carried out in the highway laboratory of Chang’an University, Xi’an, Shanxi Province, China. In order to obtain clear grayscale image slices, by continuously adjusting the values of scanning parameters, the scanning voltage was finally set to 205 kV, current to 0.34 mA, 300 ms (integration time), 1.39 (magnification), Detector Type to Y.XRD1620, and Detector. By setting this set of scanning parameters in the CT unit, clear grayscale image slices were finally obtained. There were 697 slices in the vertical direction and the resolution was 143.25 μm, with a magnification of 1.41 and a pixel size of 1024 × 1024.
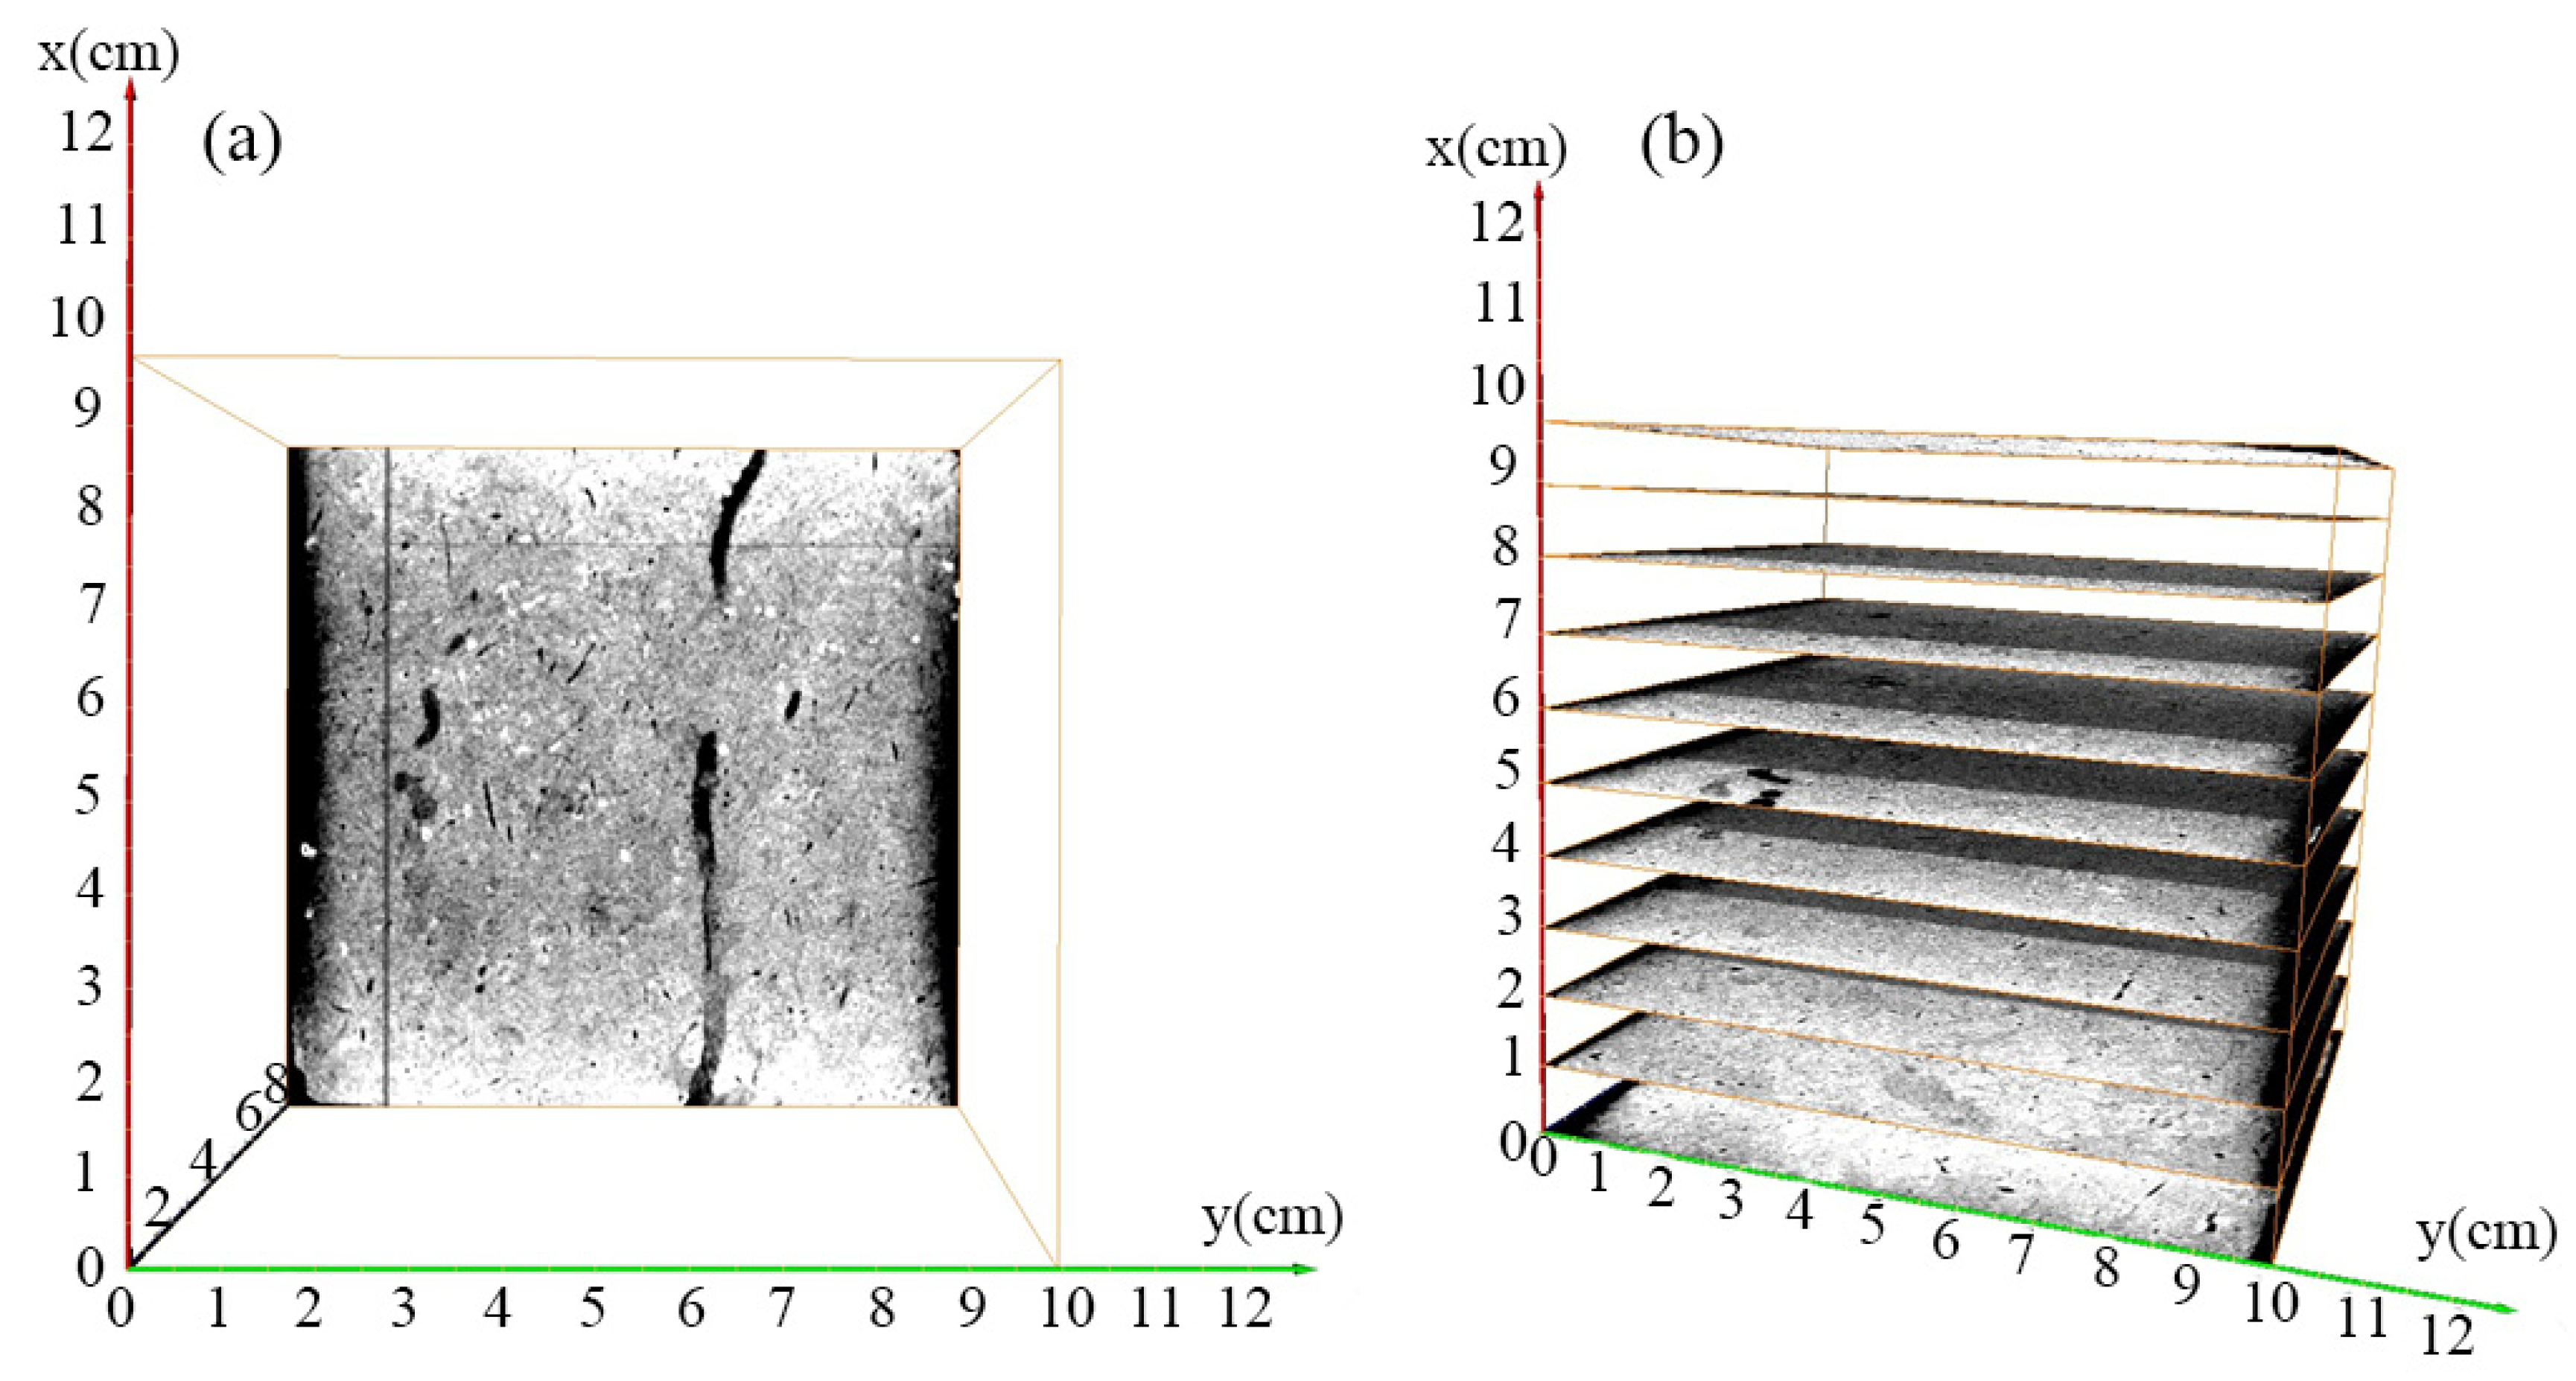
Figure 2a shows the 308th slice of the CT scan of the loess sample along the Z-direction.
The scanned slice images were subjected to image calibration, image filtering, image segmentation, pore 3D reconstruction, permeability tensor calculation, and seepage simulation using AVIZO software. In order to obtain accurate measurements, the images were calibrated before performing image reconstruction. Depending on the image size, the size of the sample, and the magnification at scanning, the calibration of the length unit was first performed in the AVIZO software. The coordinate axis units in the reconstructed 3D model were expressed in centimeters and the accuracy units were expressed in microns. When the 3D model was reconstructed, the vertical seepage direction along the X axis was positive and the horizontal seepage occurred in the Y- and Z-directions.
Figure 2b shows the slice model after calibration of the 3D model of loess sample.
3. Methods
3.1. CT Image Processing
After the CT scan image calibration is completed, it is necessary to process the CT scan image to extract the pore structure in the intact Malan loess sample and conduct seepage simulation. When processing the gray slice of CT scan, the filter analysis is firstly carried out to remove the noise in the gray slice. Then, the image is segmented by threshold to obtain the binary image.
3.1.1. Image Filtering Analysis (Bilateral Filtering)
In the process of the CT scanning experiment, due to the existence of pores of different scales, loess particles of different density components in the intact Malan loess, as well as the influence of instrument operation and environmental noise during the scanning process, there are noise points on the images obtained by scanning. In order to obtain high quality results, the scanned images need to be filtered in order to eliminate the noise while preserving the edge contours and geometry of the pore space and to provide a basis for further segmentation of the pore space with grayscale images. The commonly used filtering methods are divided into five major categories, including smoothing filter, edge detection filter, sharpening filter, frequency domain conversion filter, and grayscale conversion filter. After various filtering analyses of CT scans, it is found that a better grayscale image can be obtained by filtering with the bilateral filter method in smoothing filtering for this intact Malan loess sample. Bilateral filter is a local image smoothing technique proposed by Tomasi and Manduchi. It is a compromise process combining the spatial proximity and pixel value of the image, while considering the spatial domain information and gray similarity, to preserve edges and remove noise. Bilateral filtering is a nonlinear filter that takes into account the pixel Euclidean distance and pixel local grayscale differences in the weighted average of the surrounding pixel grayscale values, which smooths the uniform area while highlighting the aperture edges well, making it capable of both noise reduction and edge preservation.
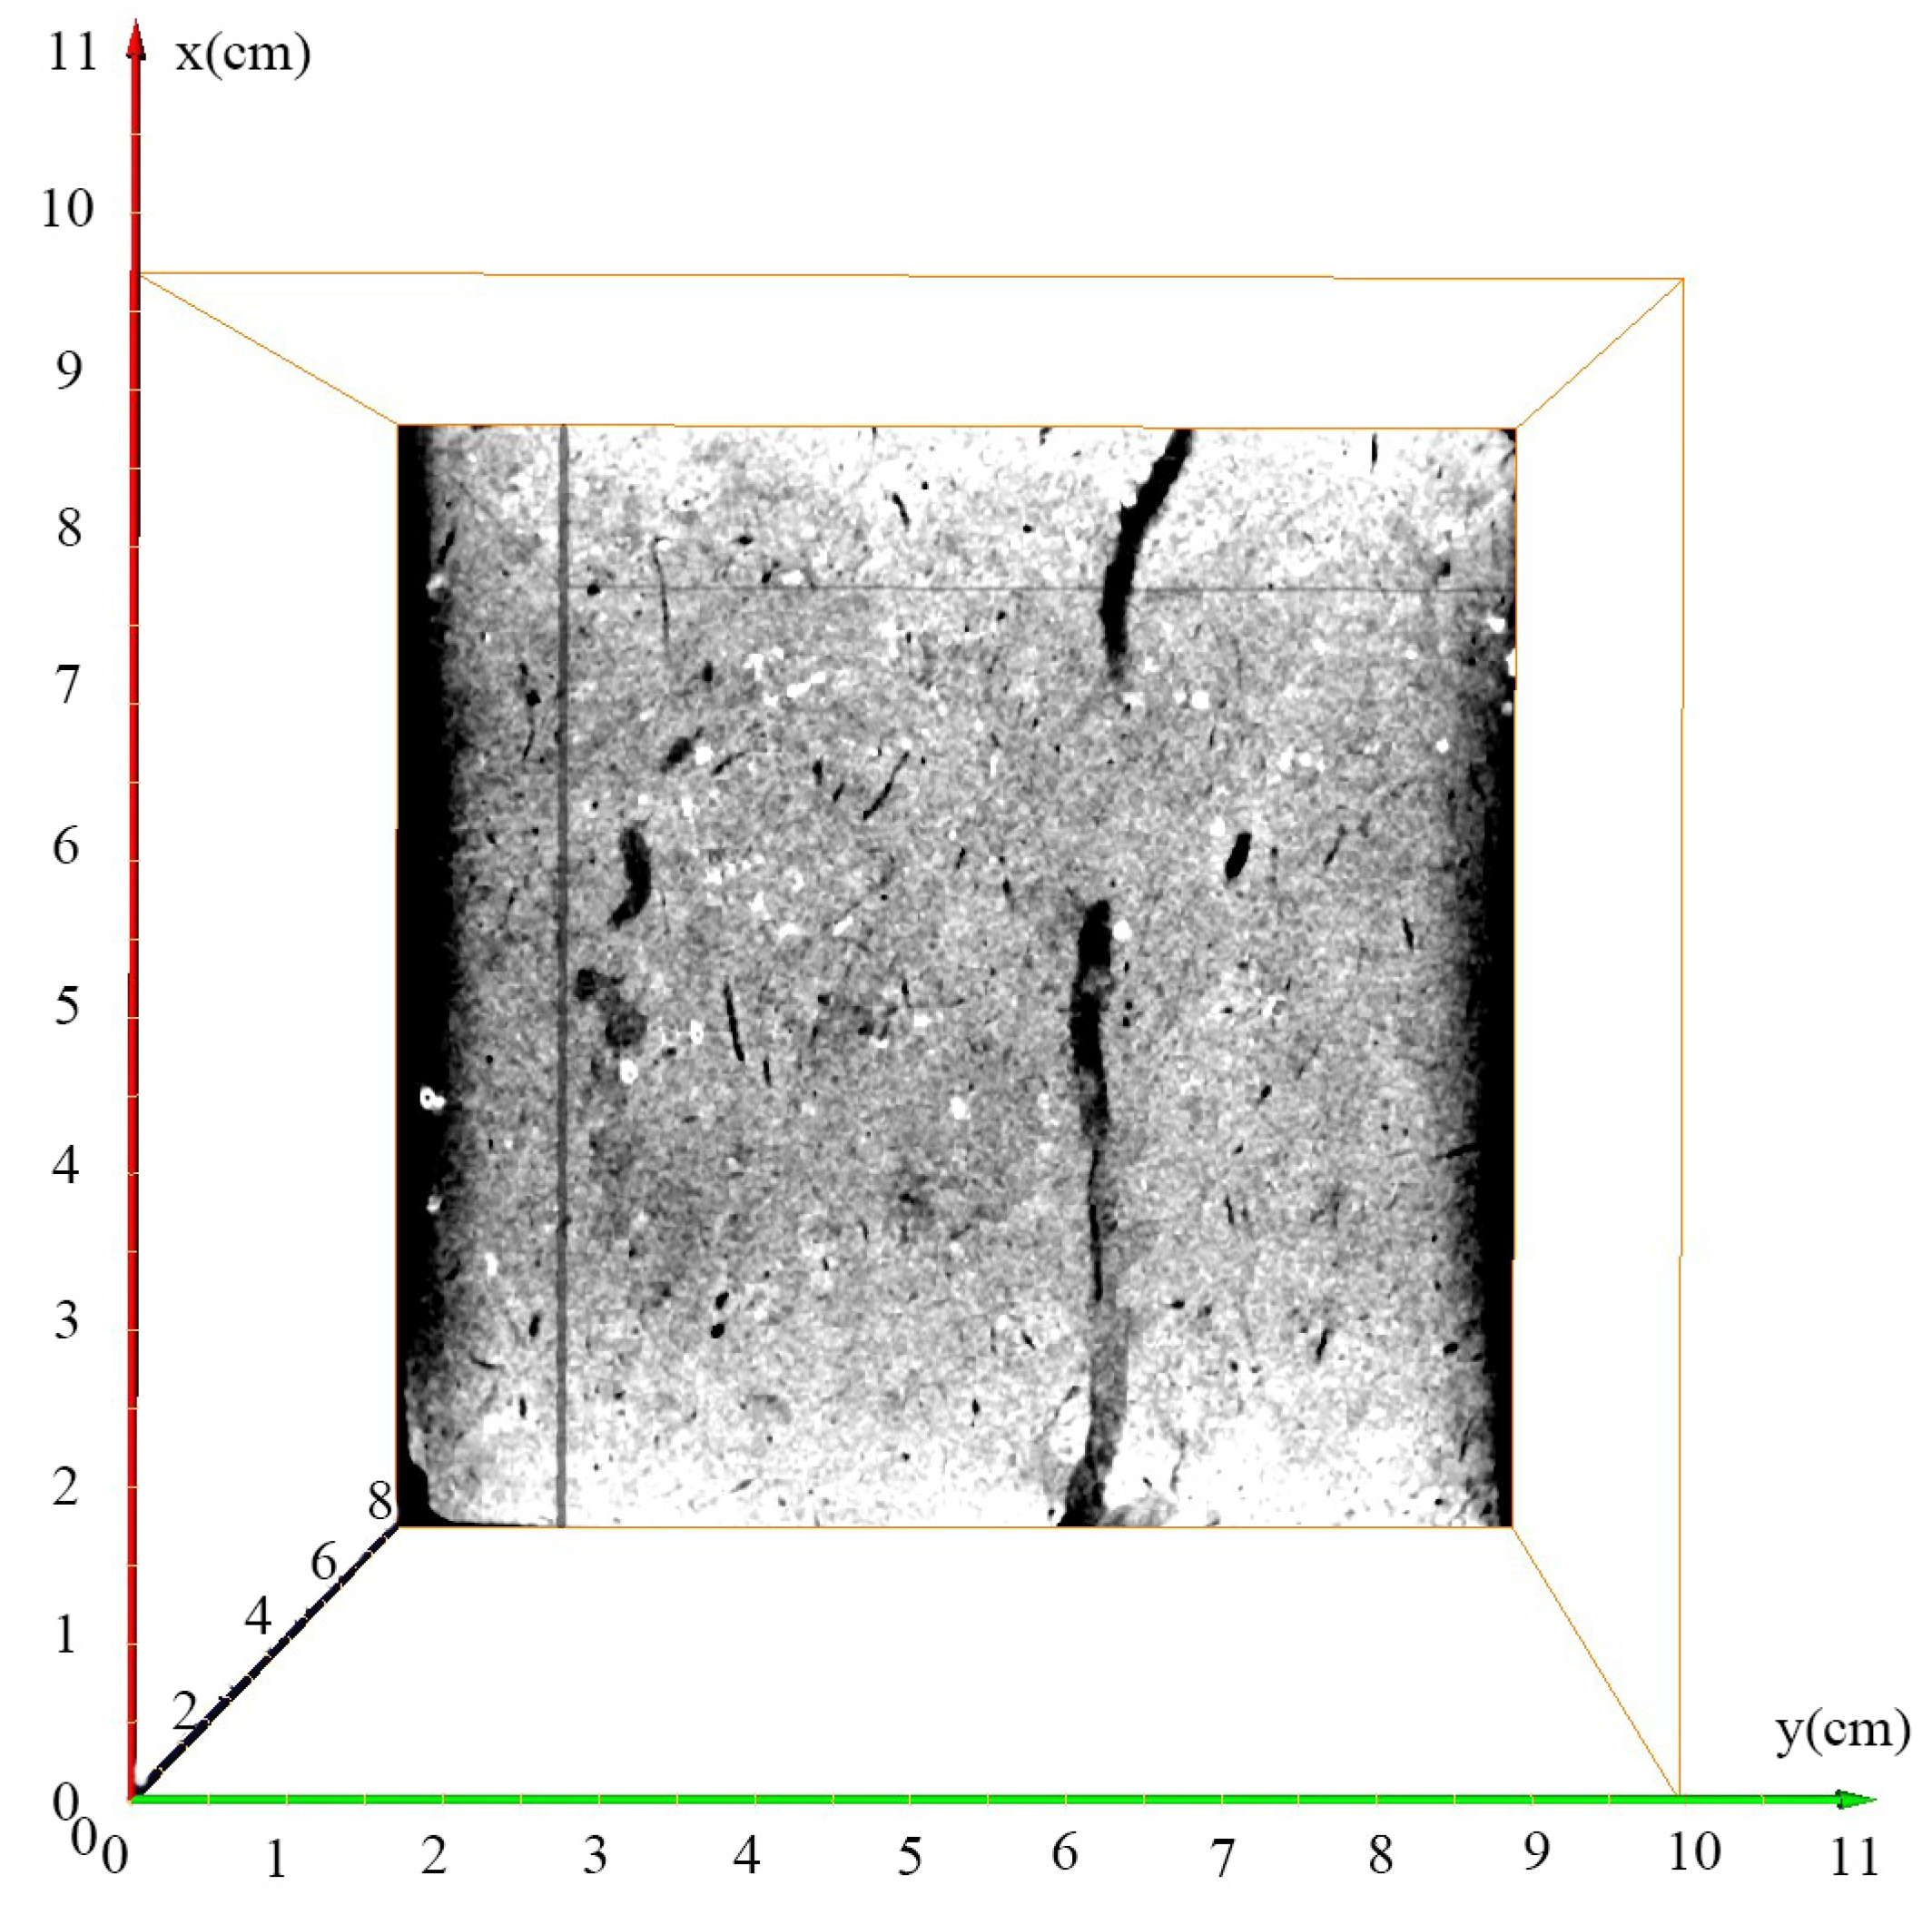
Figure 3 shows the image after the bilateral filtering process.
3.1.2. Image Segmentation
After the bilateral filtering process, the loess sample slices are a series of grayscale images that cannot be directly reconstructed in three dimensions and require threshold segmentation of the grayscale images. The purpose of threshold segmentation is to extract the pores and skeleton structure of loess samples. Through the reconstruction of the 3D model, the porosity of the reconstructed model is calculated; then, the porosity of the reconstructed 3D model is constantly adjusted. According to the comparison between the porosity of the measured loess samples and the porosity of the reconstructed 3D model, the threshold value corresponding to the relatively small error between the calculated porosity of the 3D reconstructed model and the measured porosity is selected. In this study, the specific yield of the loess is used as the threshold classification criterion for the porosity of the connected pores in the loess.
3.2. Intact Loess Seepage Experiment
Specific yield is the volume share of gravity water that can be released in the unit volume of saturated soil under the action of natural gravity, usually expressed as μ. Generally, the specific yield of loess is measured by filling a loess sample into a measuring cylinder [
35,
36,
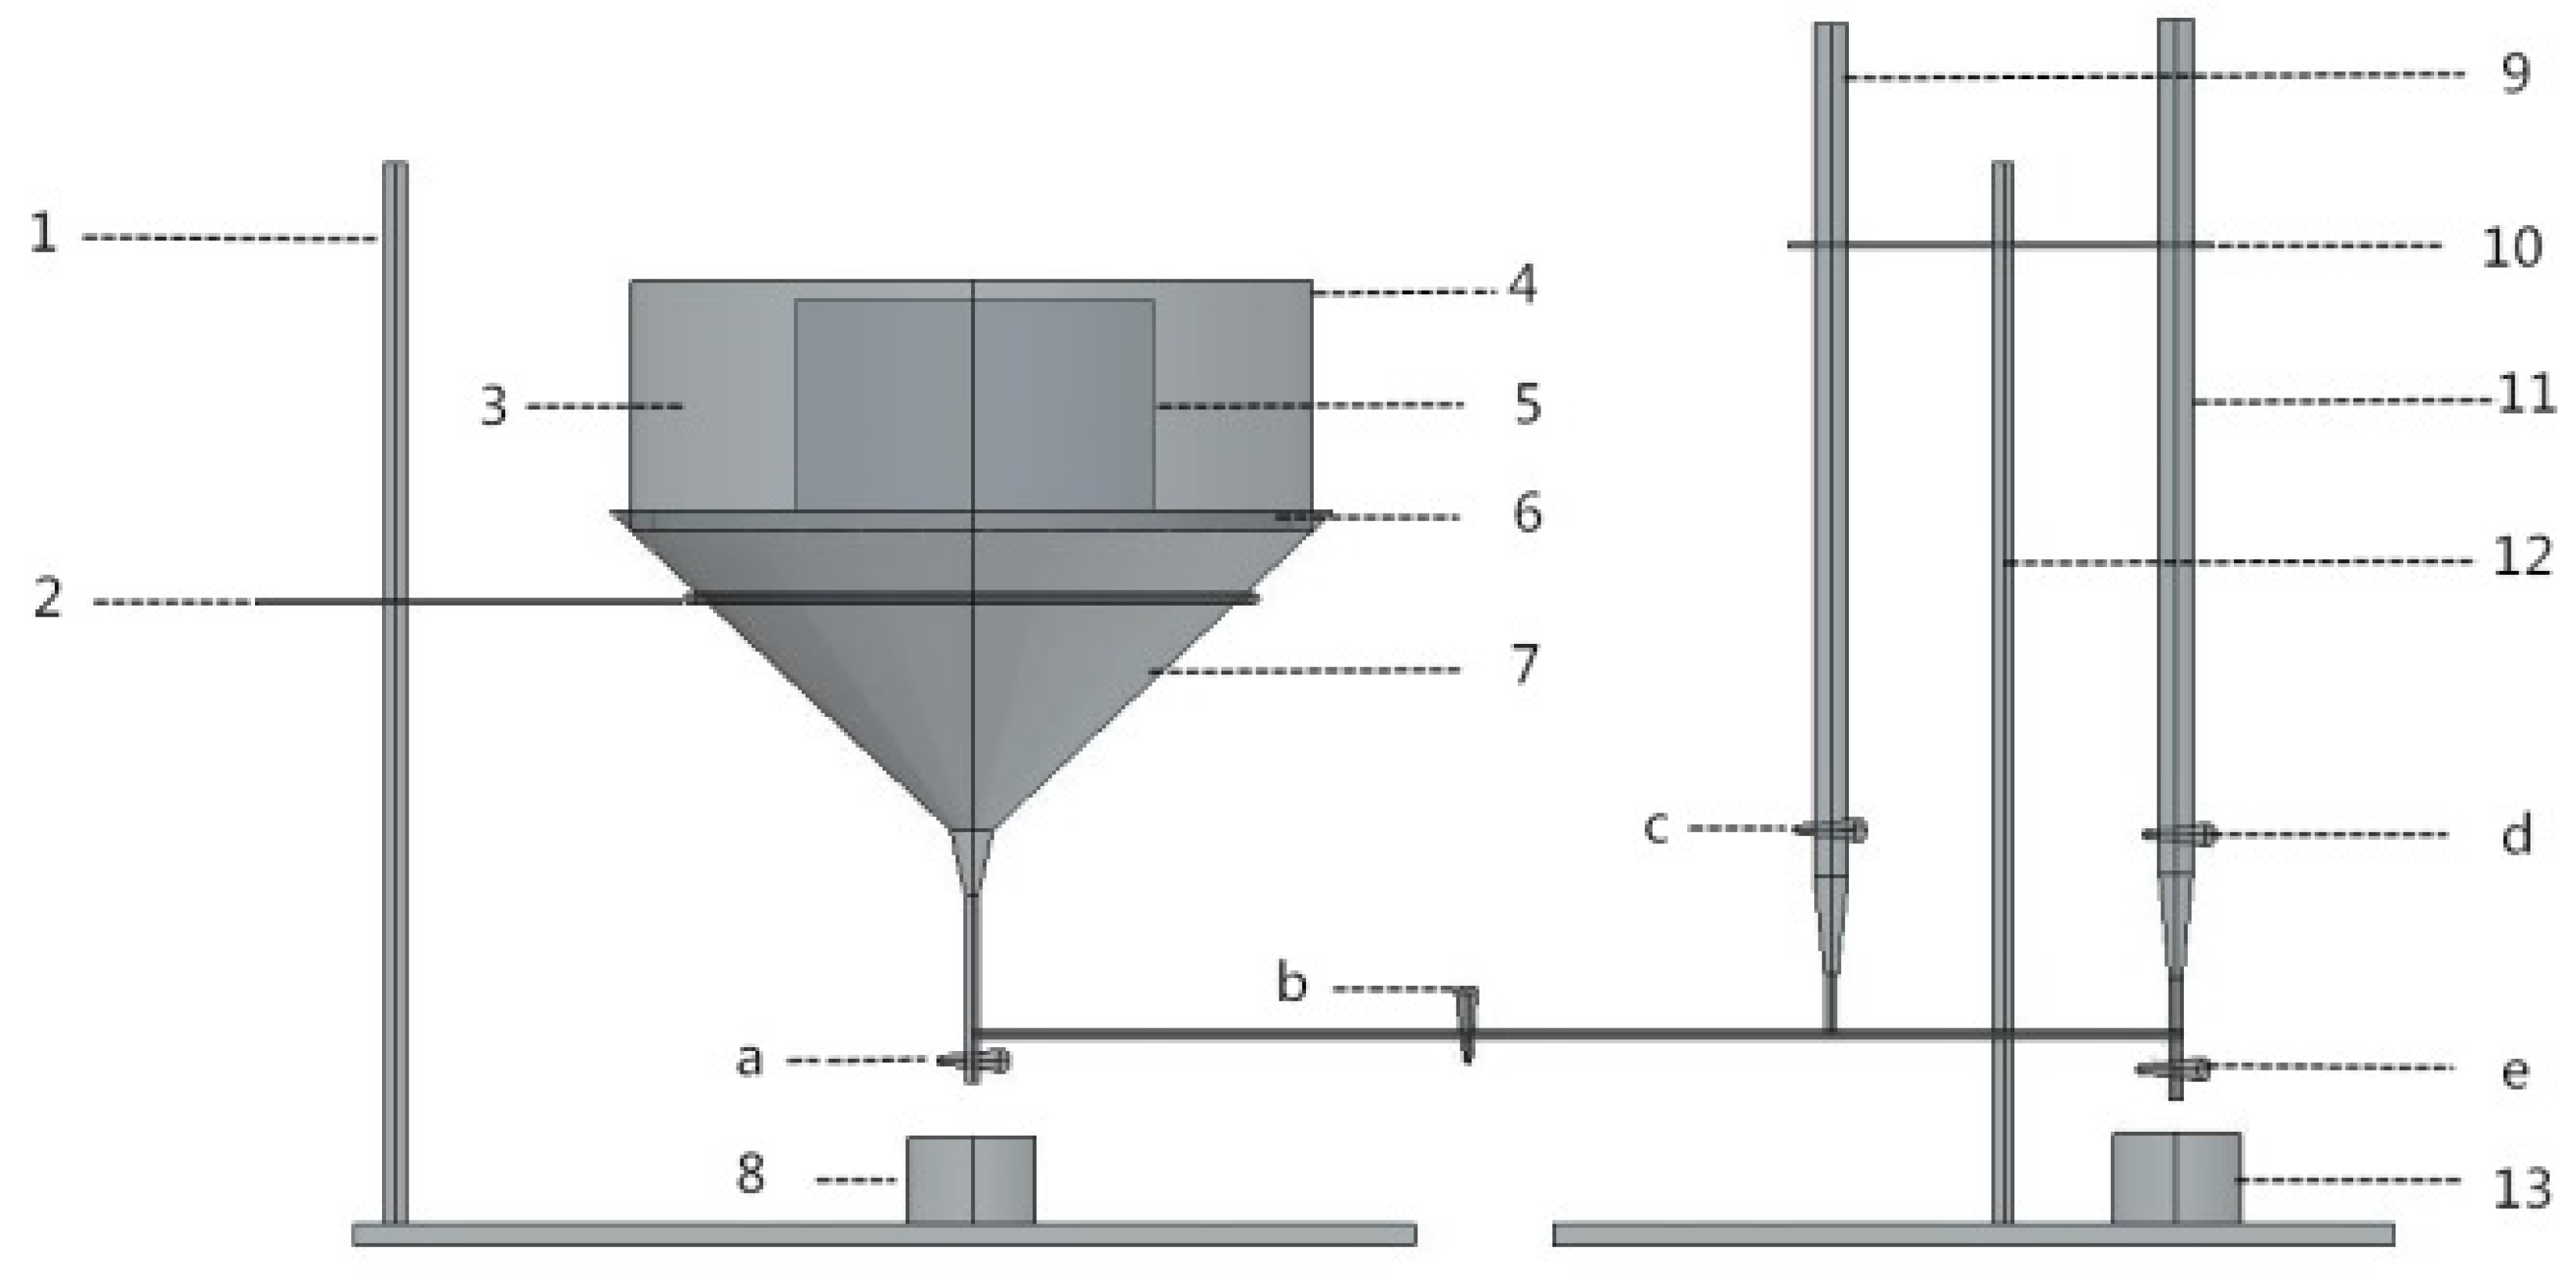
37]. How to be able to determine the specific yield of loess samples without disturbing the original structure of the loess is the key to delineating the three-dimensional reconstruction threshold of the loess samples. The present determination of the specific yield of intact loess samples was measured by a device of my own design. The device is shown in
Figure 4, where 1 and 12 are iron stands; 2 is a funnel stand; 3 is glass glue; 4 is 160 mm diameter and 120 mm high PVC tube; 5 is 10 cm × 10 cm × 10 cm loess specimen; 6 is 150 mm diameter and 10 mm high permeability stone; 7 is a plastic funnel; 8 and 13 are beakers; 9 and 11 are 100 mL burettes; 10 is a butterfly clip; a, b, c, d, and e are switches. The experimental procedure is divided into 4 steps.
Step 1: put the penetration stone 6 in the middle of the PVC pipe 4, fill the pores between the penetration stone 6 and the PVC pipe 4 with glass glue 3, let the glass glue 3 dry, and then glue the PVC pipe 4 to the plastic funnel 7.
Step 2: Connect the sample made in step 1 to the experimental setup and turn off switch e and switch a. Turn on switch c, switch d, and switch b. Add water from the top of burette 9 and burette 11 until the water is not over the surface of permeability stone 6. Turn on switch e and drain the water until the top surface of permeability stone 6 is at the same height as the water surface. Turn off switch b, turn off switch e, and record the water level height H1 in the burette. Then, turn on switch a and let it stand for 5 h; measure the volume of water in beaker 8 as V1. Empty the water from beaker 8 and beaker 13.
Step 3: Dry the dried intact Malan loess sample and place the dried sample in the middle of the infiltration stone 6. Use the PVC pipe 4 to encircle the sample and the infiltration stone 4 until the height of the glass glue 3 is the same as the height of the surface of the intact Malan loess sample 5, with a distance of 10 mm from the upper part of the PVC pipe 4. Then, let it stand until the glass glue 3 is dry. Attach the sample made in step 3 to the experimental setup. Turn off switch e and switch a. Turn on switches c, b, and d. Slowly add water from the top of burette 9 and burette 11 until the water level reaches the water level height H1 recorded in step 2.
Step 4: Continue adding water in burette 9 (keeping the water level at (H1 + 100 mm)) and let the water seep slowly through sample 5 until the water is not over the surface of sample 5. Then, turn on switch e and slowly release the water until the surface of sample 5 and the water surface are at the same height. Close switches e and b, open switch a, and let stand for 10 h; measure the volume of 8 in the beaker as
V4. The volume of Malan loess specimen 5 is recorded as
V0. The sample specific yield is calculated as shown in Equation (1) and the sample specific yield is calculated as shown in
Table 2:
3.3. Theoretical Approach
To study the seepage process of water flow in the intact Malan loess, it is necessary to introduce the volumetric average method to relate microscopic, fine, and macroscopic behaviors. The volumetric average method is widely used to derive continuity equations for multiphase systems, enabling the study of coupled multiphase porous media seepage processes within a unified hydrodynamic framework; the information at the pore scale can be used to derive effective local volume averaging equations. An equation that is valid in a particular phase can be spatially smoothed to produce a valid equation anywhere. In Malan loess porous media, we want to know how water is transferred through the pores. Because the loess has a complex structure of porous media, it is impossible to analyze how water is transported in the pores with effective transport equations. We can use the reconstructed pore information after CT scanning to derive effective local volume averaging equations instead of solving this problem with effective transport equations and boundary conditions.
3.3.1. Absolute Penetration Rate
It is necessary to introduce the concept of absolute permeability in the seepage process of intact Malan loess. Absolute permeability is the ability of porous medium material to transport single-phase fluid. The unit is square micrometer (μm
2); 1d = 0.9869233 μm
2. Absolute permeability indicates the intrinsic property of porous media material, which is only related to the pore structure of porous media material and has nothing to do with other external conditions [
38,
39,
40,
41].
In Equation (2):
Q is the overall flow rate (unit: m
3·s
−1) through the porous medium of the intact Malan loess;
S is the cross-sectional area (unit: m
2) of the fluid flowing through the intact Malan loess sample;
K is the permeability coefficient (unit: m
2·s
−1) [
42,
43,
44].
In Equation (3): k is the absolute permeability (unit: m2); μ is the viscosity of the fluid (unit: Pa·s); ΔP is the pressure difference (unit: Pa) applied around the intact Malan loess sample; L is the length of the sample in the direction of flow (unit: m); Q/S is called the flow velocity v, which indicates the average velocity or Darcy velocity of the fluid through the surface of the intact Malan loess sample.
In order to calculate absolute permeability, it is necessary to solve the Stokes equation, which is a simplification of the Navier–Stokes equation, considering that water is an incompressible fluid, the density of water is constant, it is a Newtonian fluid, the viscosity of water is constant and it is a steady flow in the seepage process, and the seepage velocity does not change with time. This kind of flow in the undisturbed Malan loess is a laminar flow form with low flow velocity and no turbulent flow [
45,
46].
In Equation (4): is the scattering operator; is the gradient operator; is the velocity of the fluid in the fluid phase (unit: m/s); μ is the viscosity of water (unit: Pa·s); is the Laplace operator; P is the fluid pressure of the material in the fluid phase (unit: Pa).
After solving equation system 4, the estimation of the permeability coefficient includes the application of Darcy’s law. All values of this equation can be derived from the solution of the system of equations (Q, ∆P). It is calculated by the absolute permeability experimental simulation module. The water used for this percolation simulation is used as the fluid for the simulation, which can satisfy the percolation conditions of the Stokes equations.
3.3.2. Solving Stokes Equation Based on Volume Average
In order for the equation to be valid over the entire volume, the scale must be varied. Volume averaging is a technique to achieve scale variation. Its main goal is to achieve spatial smoothing by averaging the equation over the volume. This very censored universal theory leads to a closure problem, which transforms the Stokes equations into a tensor problem [
13,
16,
17,
18].
In Equation (5):
is a tensor that can be considered as the source of velocity space deviation (we call it the velocity perturbation field);
is a vector that can be considered as the source of pressure space deviation (we call it the pressure perturbation field);
is the unit tensor. The absolute permeability tensor can be calculated according to Equation (4), which is converted into a tensor and calculated as follows:
In Equation (6): is the permeability tensor. The permeability tensor shows the permeability intensity in any direction along the space. The permeability tensor shows the anisotropy of the porous medium and the relationship between the permeability intensity and the flow direction.
3.3.3. Boundary Conditions
There are two methods for estimating absolute permeability when solving for absolute permeability. The first method is based on experimental simulations of the resolution of the Stokes equations; the second method uses the volume-averaging method to solve the closed-loop problem of the Stokes equations. The first method requires setting three boundary conditions as: (1) the fluid does not slip at the solid interface; (2) a pixel-wide solid phase plane (no slip state) is added to the image surface that is not perpendicular to the mainstream direction, which isolates the Malan loess sample from the outside world and no liquid flows out of the system; (3) the experimental input condition is added to the image surface perpendicular to the mainstream direction by creating a stable region over which the pressure is quasi-static so that the fluid can diffuse freely over the input surface of the sample.
The second approach is to solve the closed-loop problem for the Stokes equations by the volume averaging method. In this case, the tensor problem is solved by imposing periodic boundary conditions to close and the geometry of the no-slip condition is imposed at the fluid-to-solid interface. In this way the porous medium is assumed to represent a macroscopic infinitely large material and therefore the selected region has to be representative of the porous medium sample.
3.3.4. Equation Solving
Since the matrices of this class of equations are singular, they cannot be solved by the fully implicit method (matrix inversion). That is why some time derivative terms are introduced into the system. The introduction of time derivative terms in the system of equations allows the iteration of the problem to be solved. When the time derivative tends to zero, a unique solution is obtained. The time introduced in the equation has no physical meaning. The finite volume method is used to solve the equations when solving the physical model. The equations are discretized on a staggered grid, allowing a better estimation of the no-slip boundary conditions. The pressure unknowns are located at the center of the pixel and the velocity unknowns are discretized at the surface of the pixel. The discrete scheme assumes that the voxels are isotropic.
4. Results and Analysis
4.1. Analysis of Seepage Experiment Results
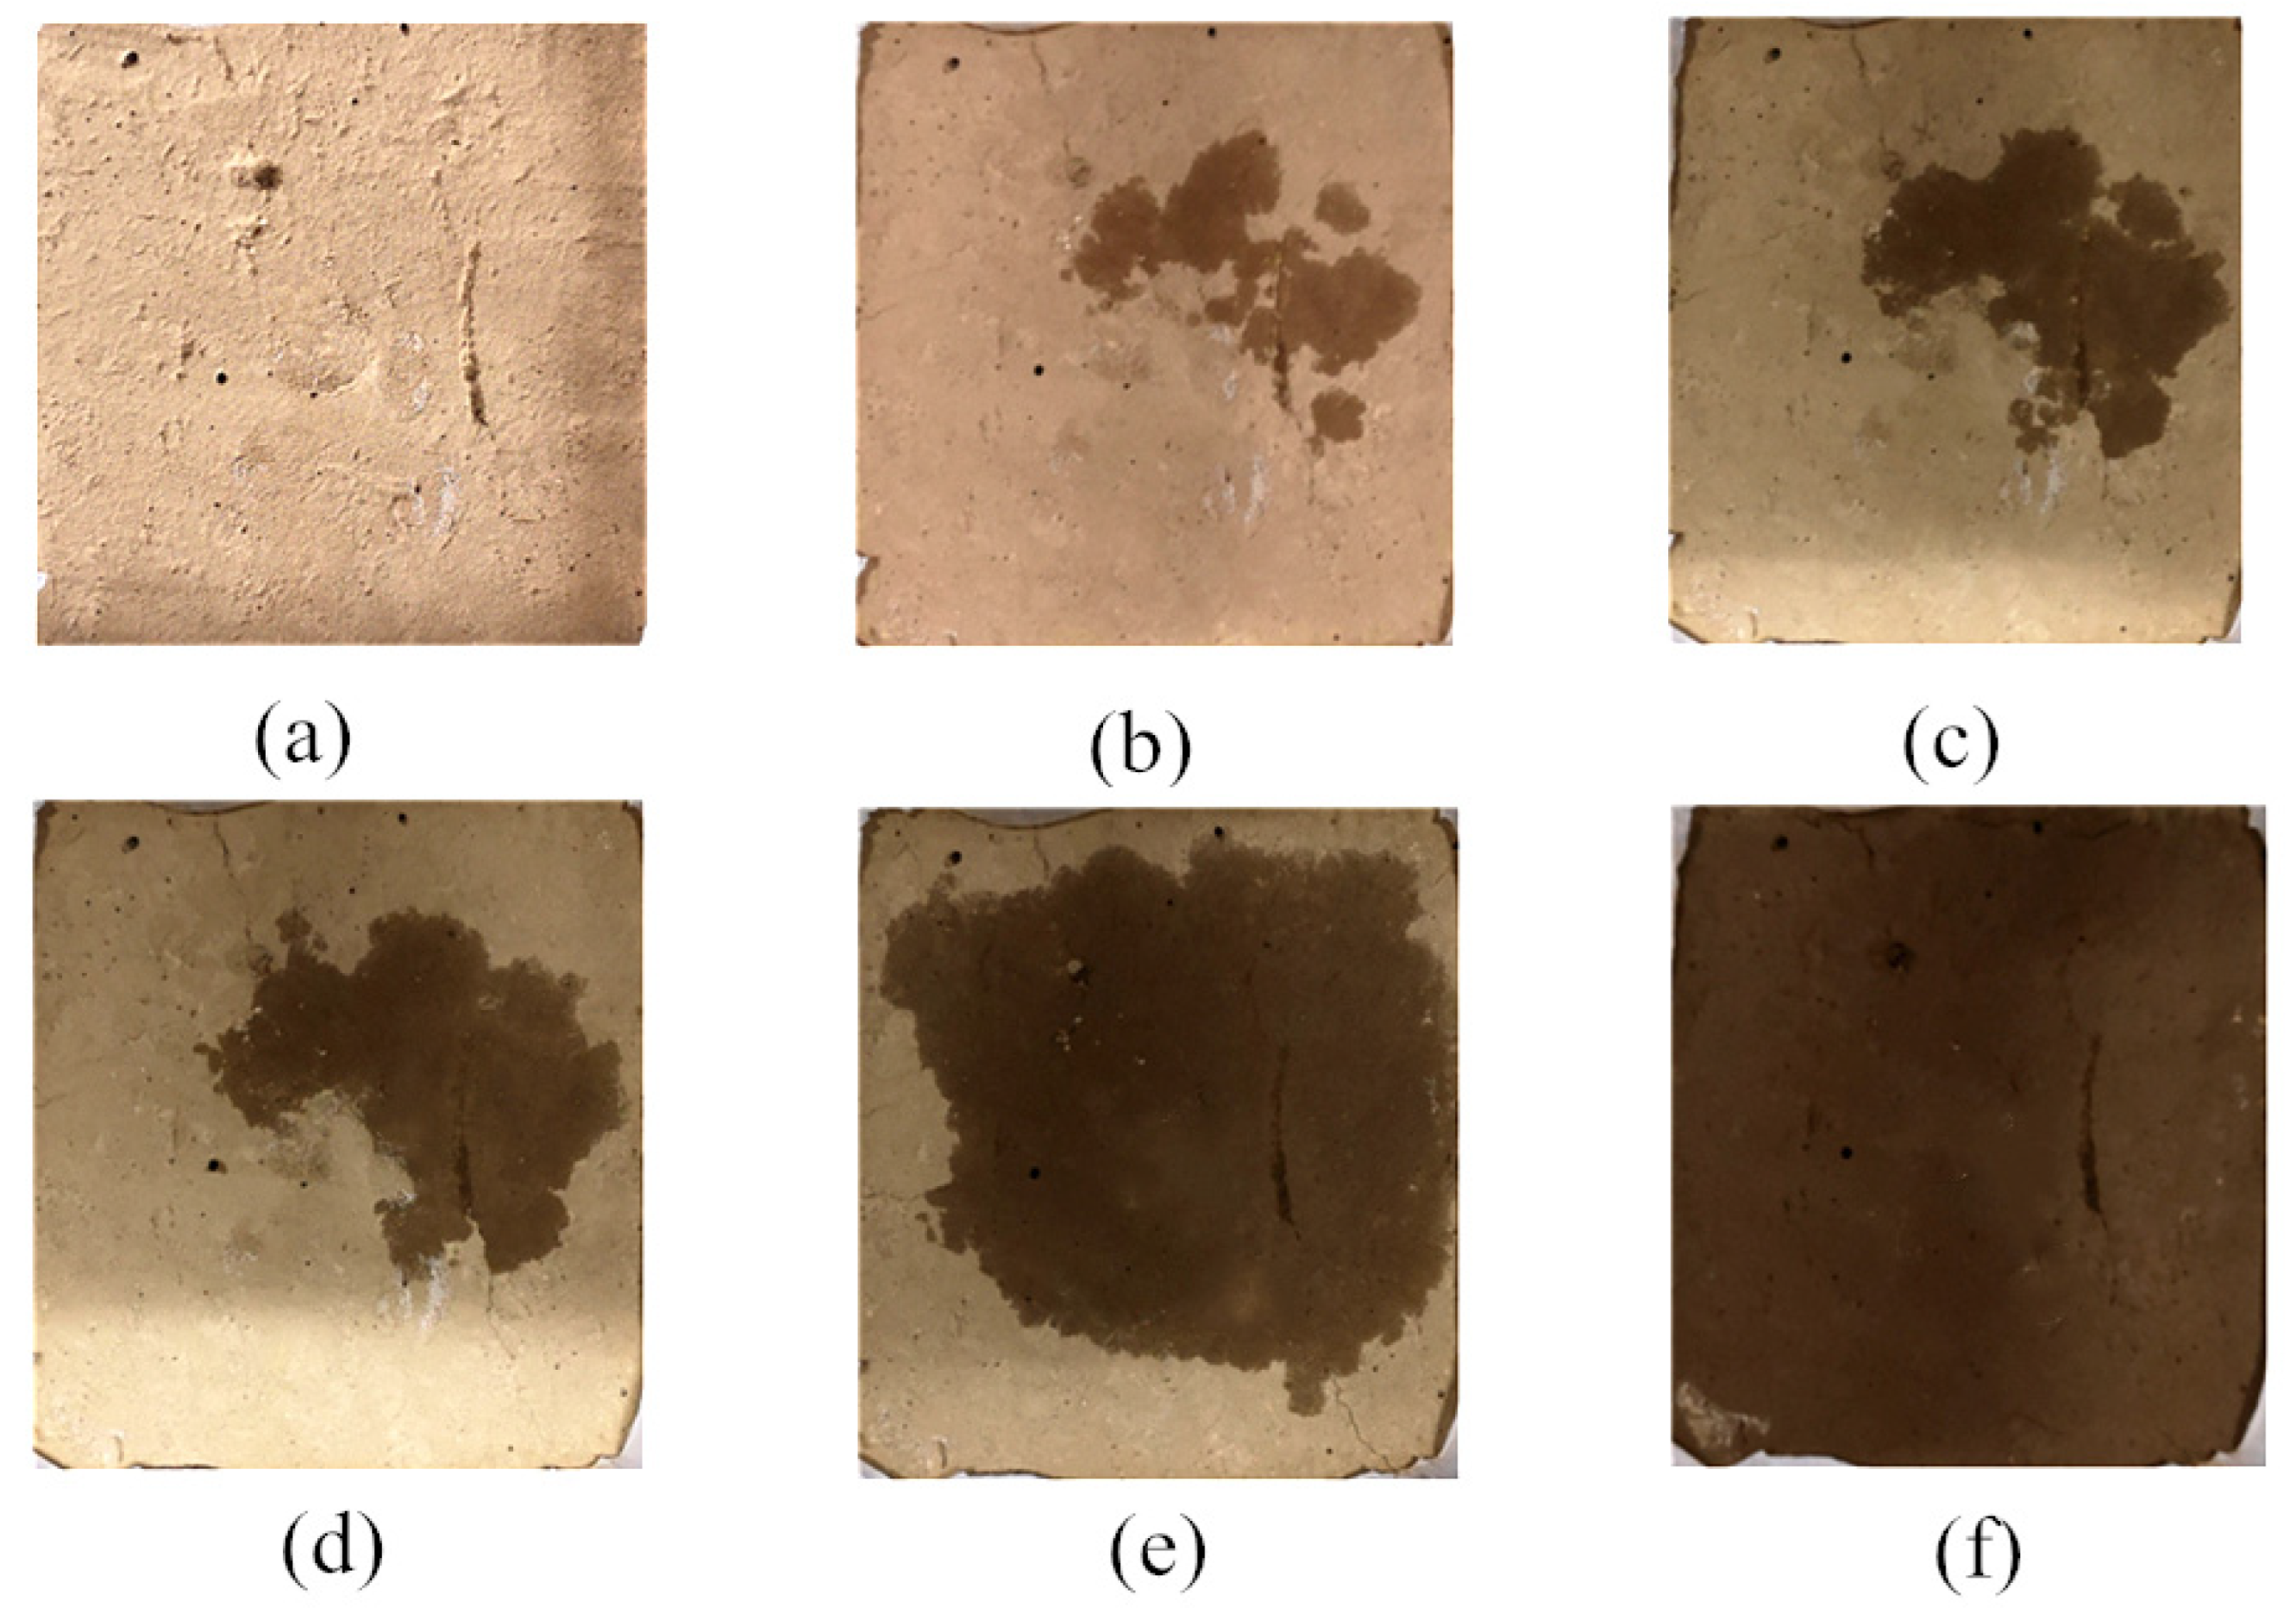
In the process of the seepage experiment, the seepage process in the intact Malan loess sample lasted for a total of 680 s from the starting state when the photo was taken and observed until the end of the seepage experiment. a, b, c, d, and e in
Figure 5 show the seepage state on the surface of the loess sample at 0 s, 480 s, 489 s, 498 s, 545 s, and 680 s, respectively. From this set of images, it can be seen that the water flow in the loess first seeped along some seepage channels to the surface of the loess first and then percolated in the lateral direction through small pores.
4.2. 3D Structure Reconstruction
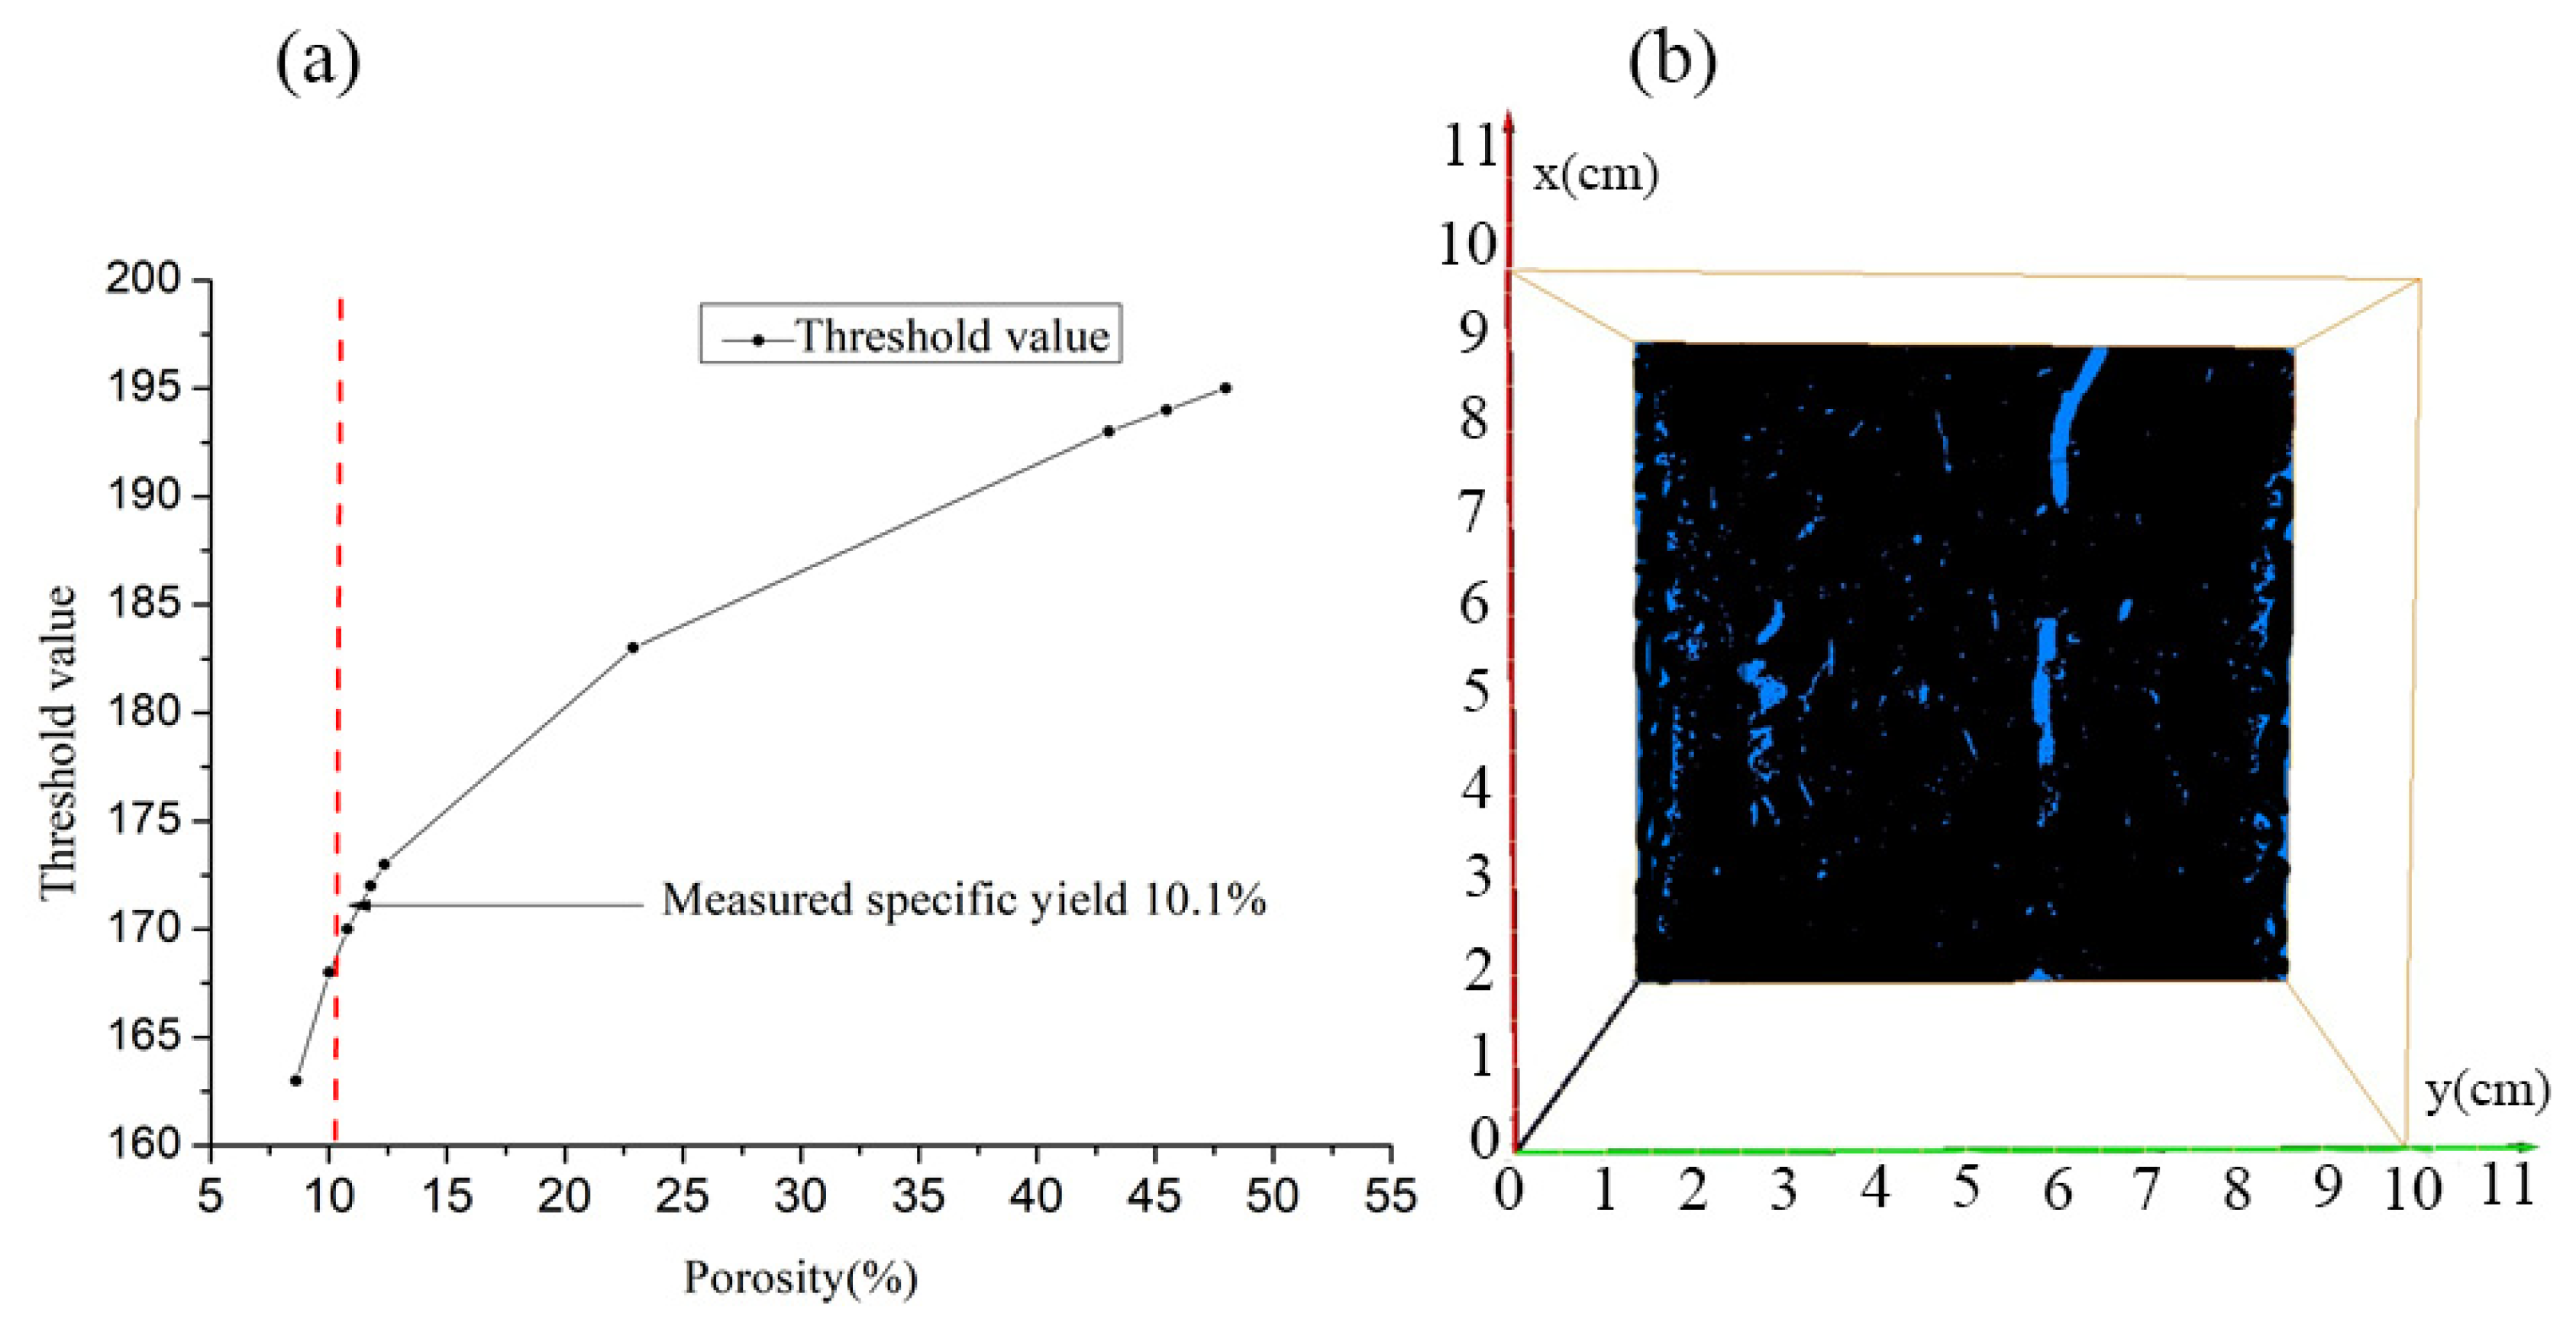
The multi-thresholding segmentation method was used for this thresholding. Multi-thresholding is a threshold segmentation algorithm for CT scan image data; the method is also applicable to binary segmentation of other grayscale images. In this experiment, five different regions were extracted by four different thresholds; two regions, external and internal, were predefined and the image segmentation of CT scan images could be performed by adjusting the size of the thresholds. The specific yield of the loess sample was experimentally measured to be 10.1%. Then, the threshold value was adjusted several times in AVIZO software to select the threshold value corresponding to a relatively small error between the model porosity and the measured specific yield. The final threshold value selected was 170 and the model porosity was 10.08%. The process of threshold selection is shown in
Figure 6a. The 308th slice along the Z-direction after the threshold segmentation is shown in
Figure 6b.
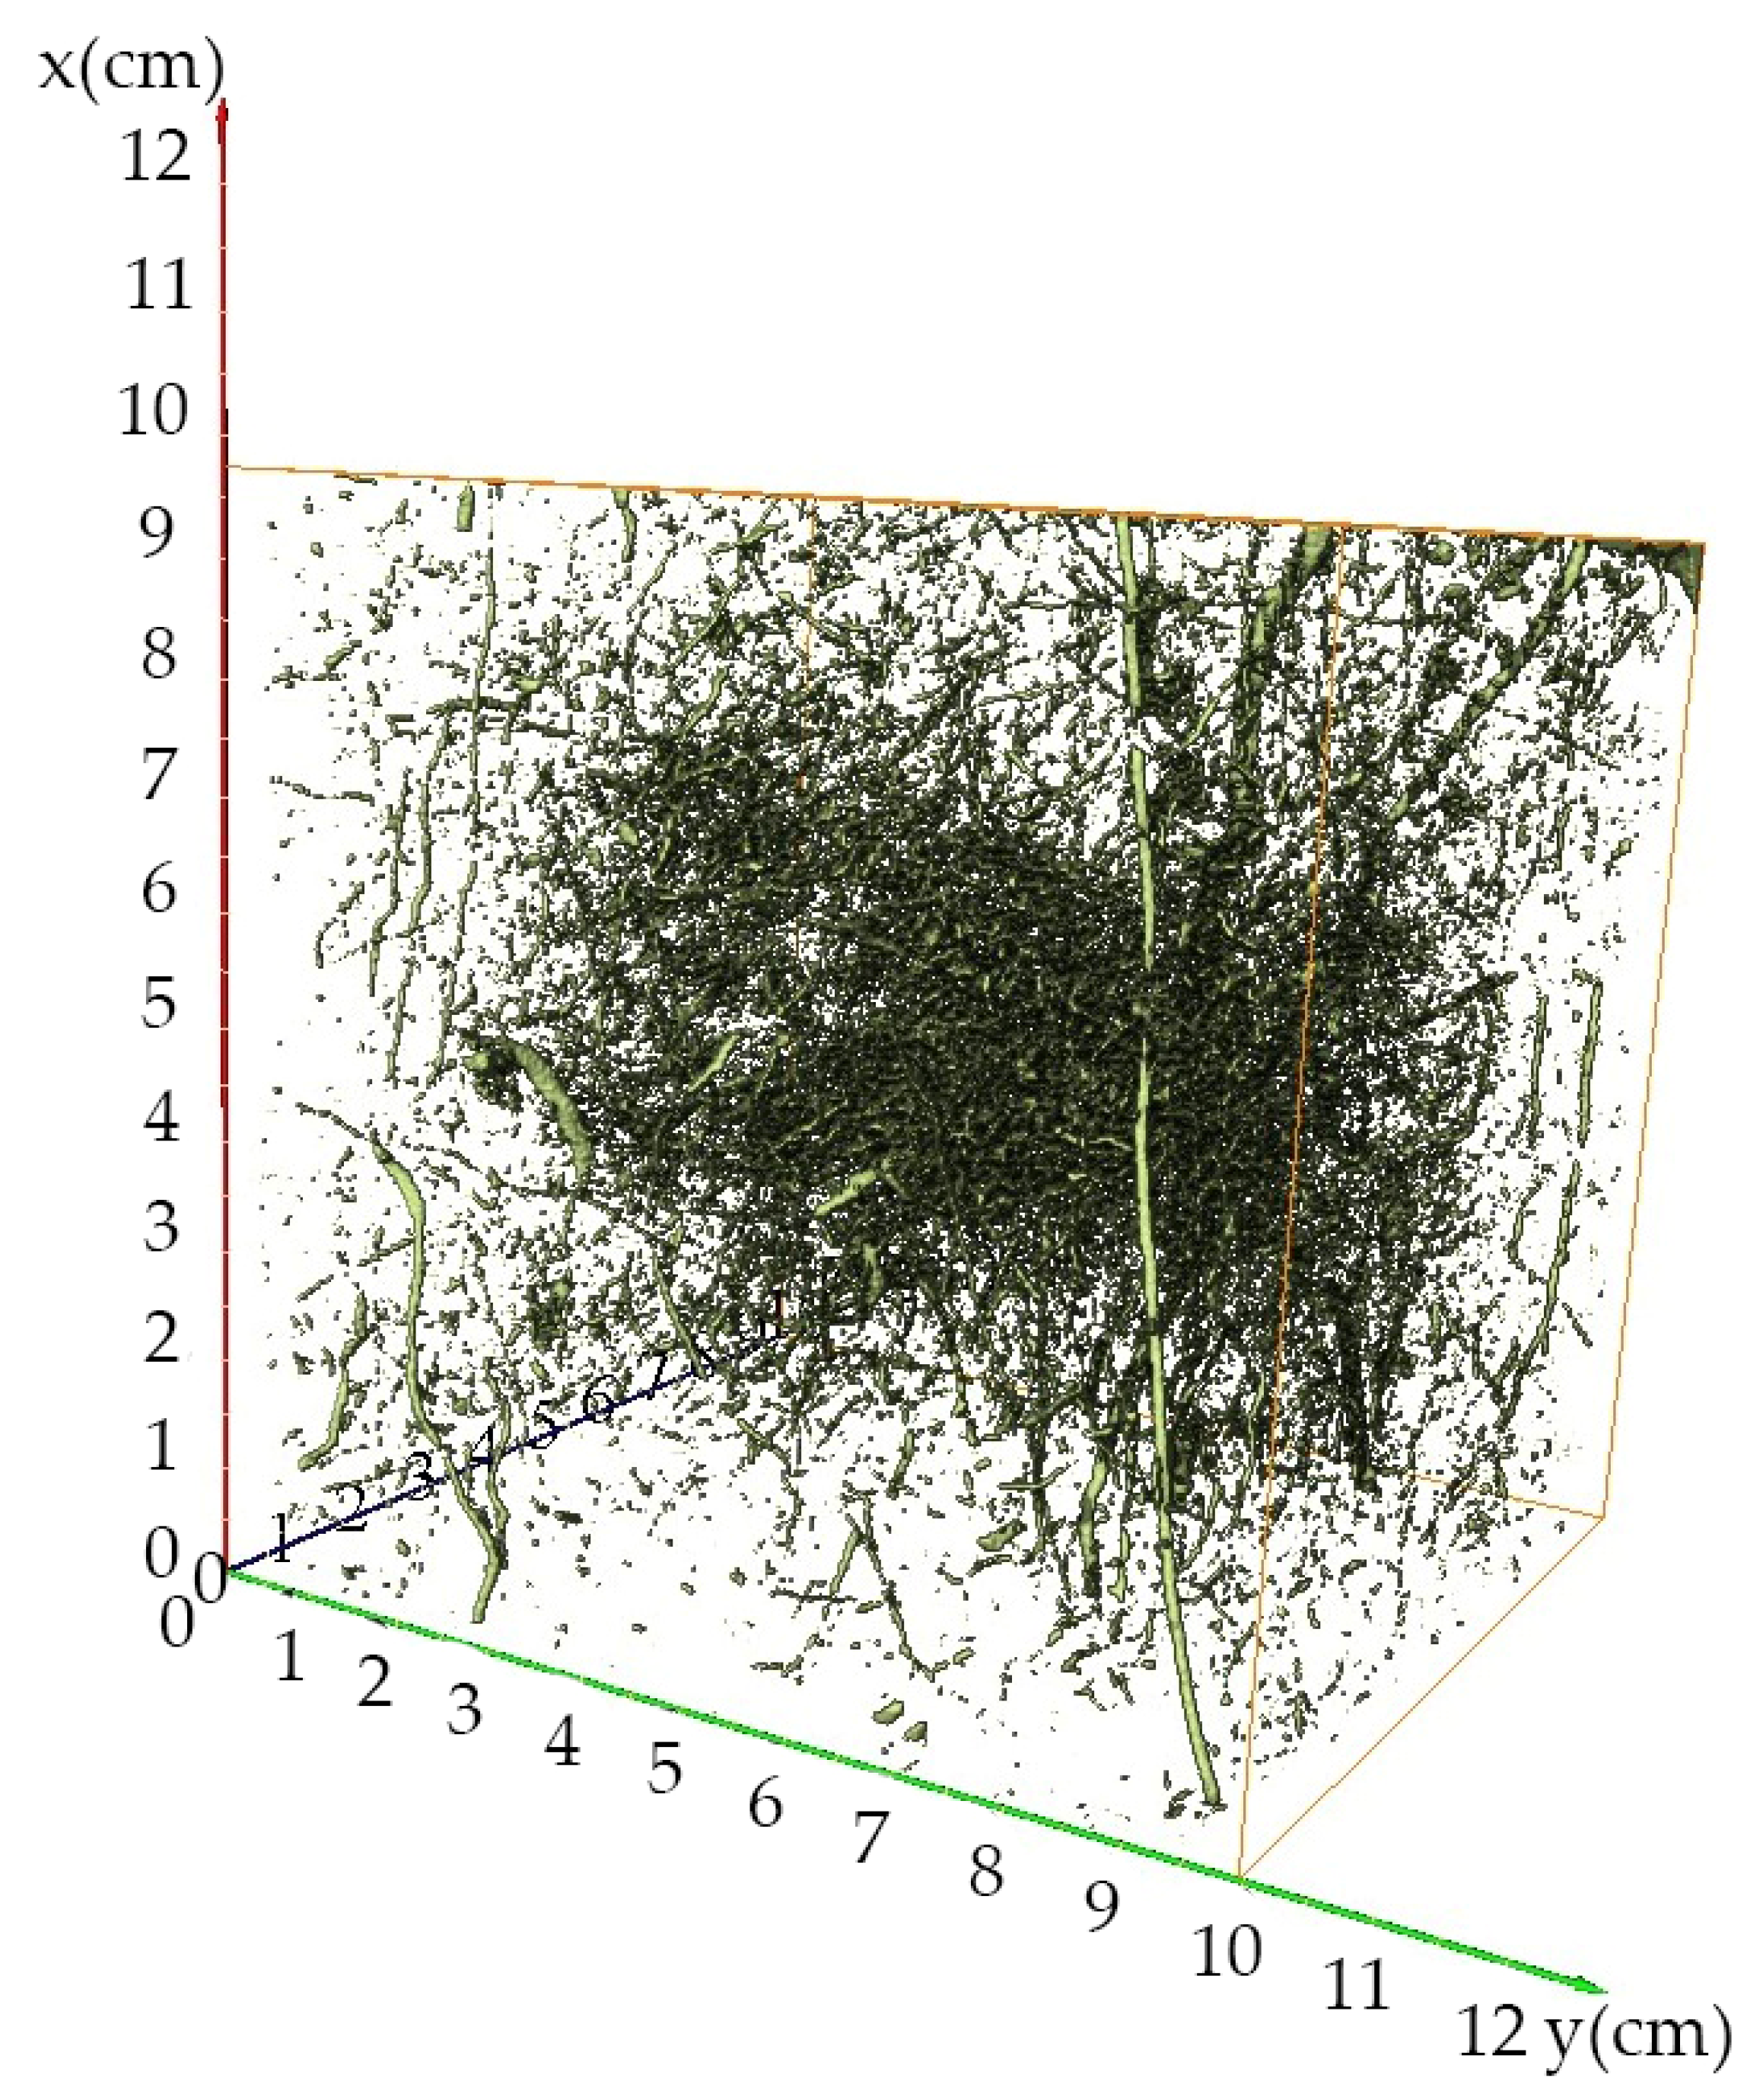
In this study, based on the volume reconstruction of porous media technique in AVIZO software, the 3D reconstruction of the threshold segmented image was carried out; the 3D pore structure model of the intact Malan loess sample obtained is shown in
Figure 7. The pore identification could identify 56,837 pores; the volume of the largest pore was 0.576142 cm
3, the volume of the smallest pore was 2.92 × 10
−6 cm
3, and the average volume of the pores was 0.001777 cm
3.
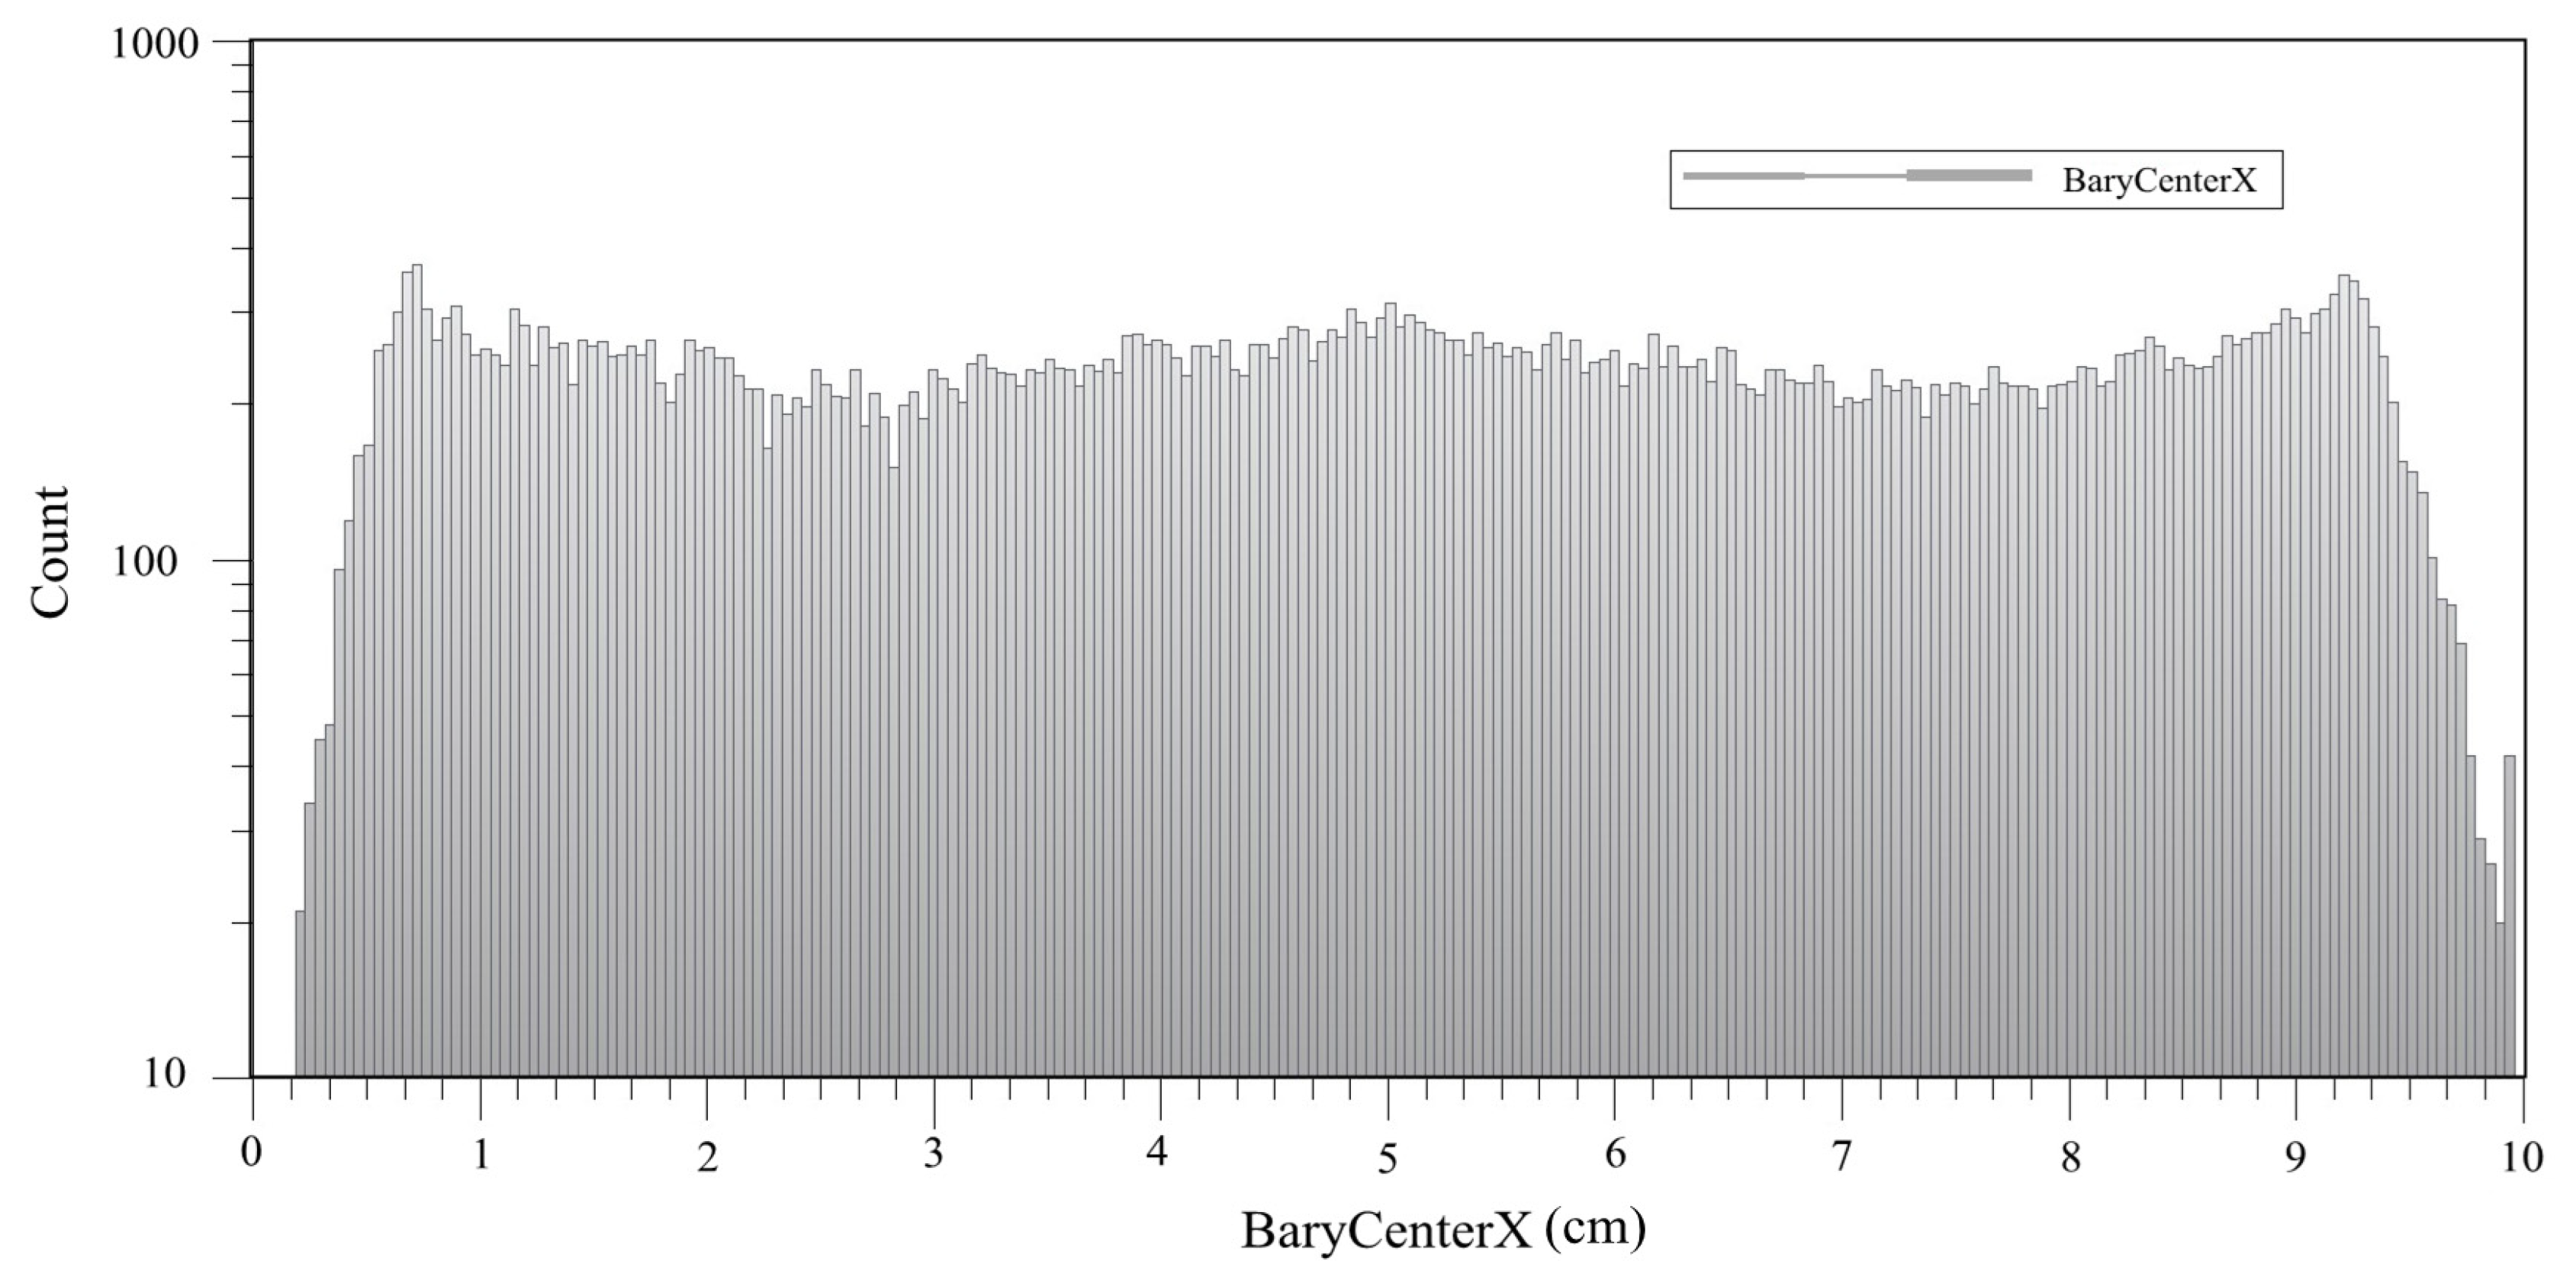
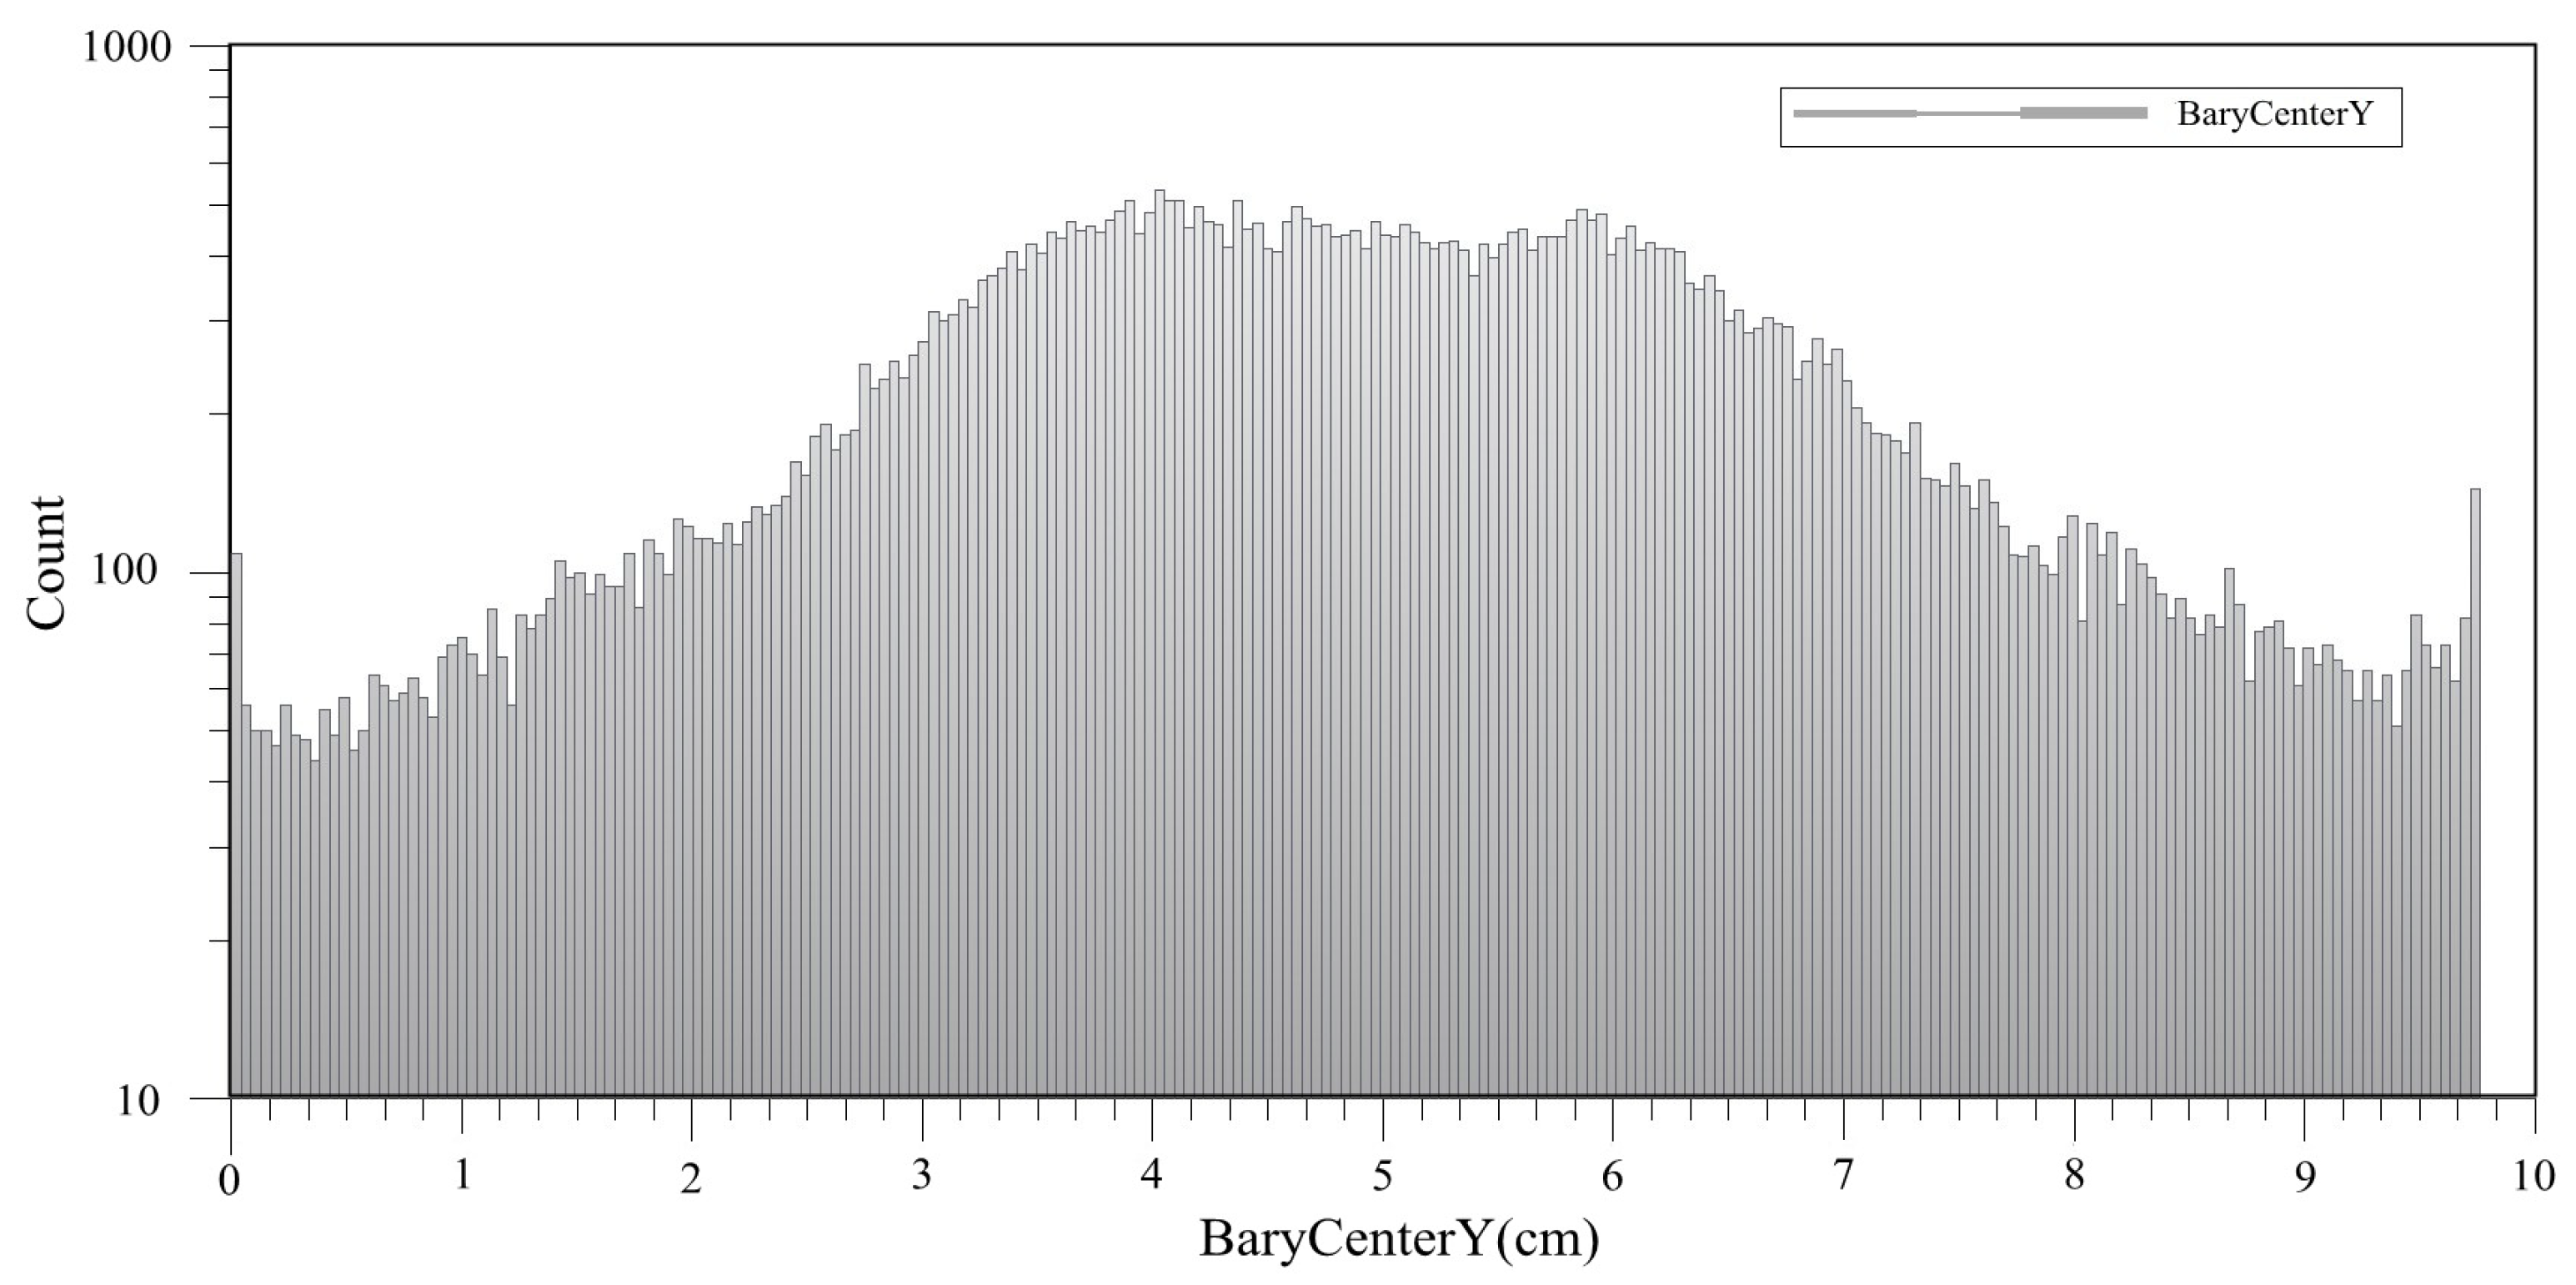
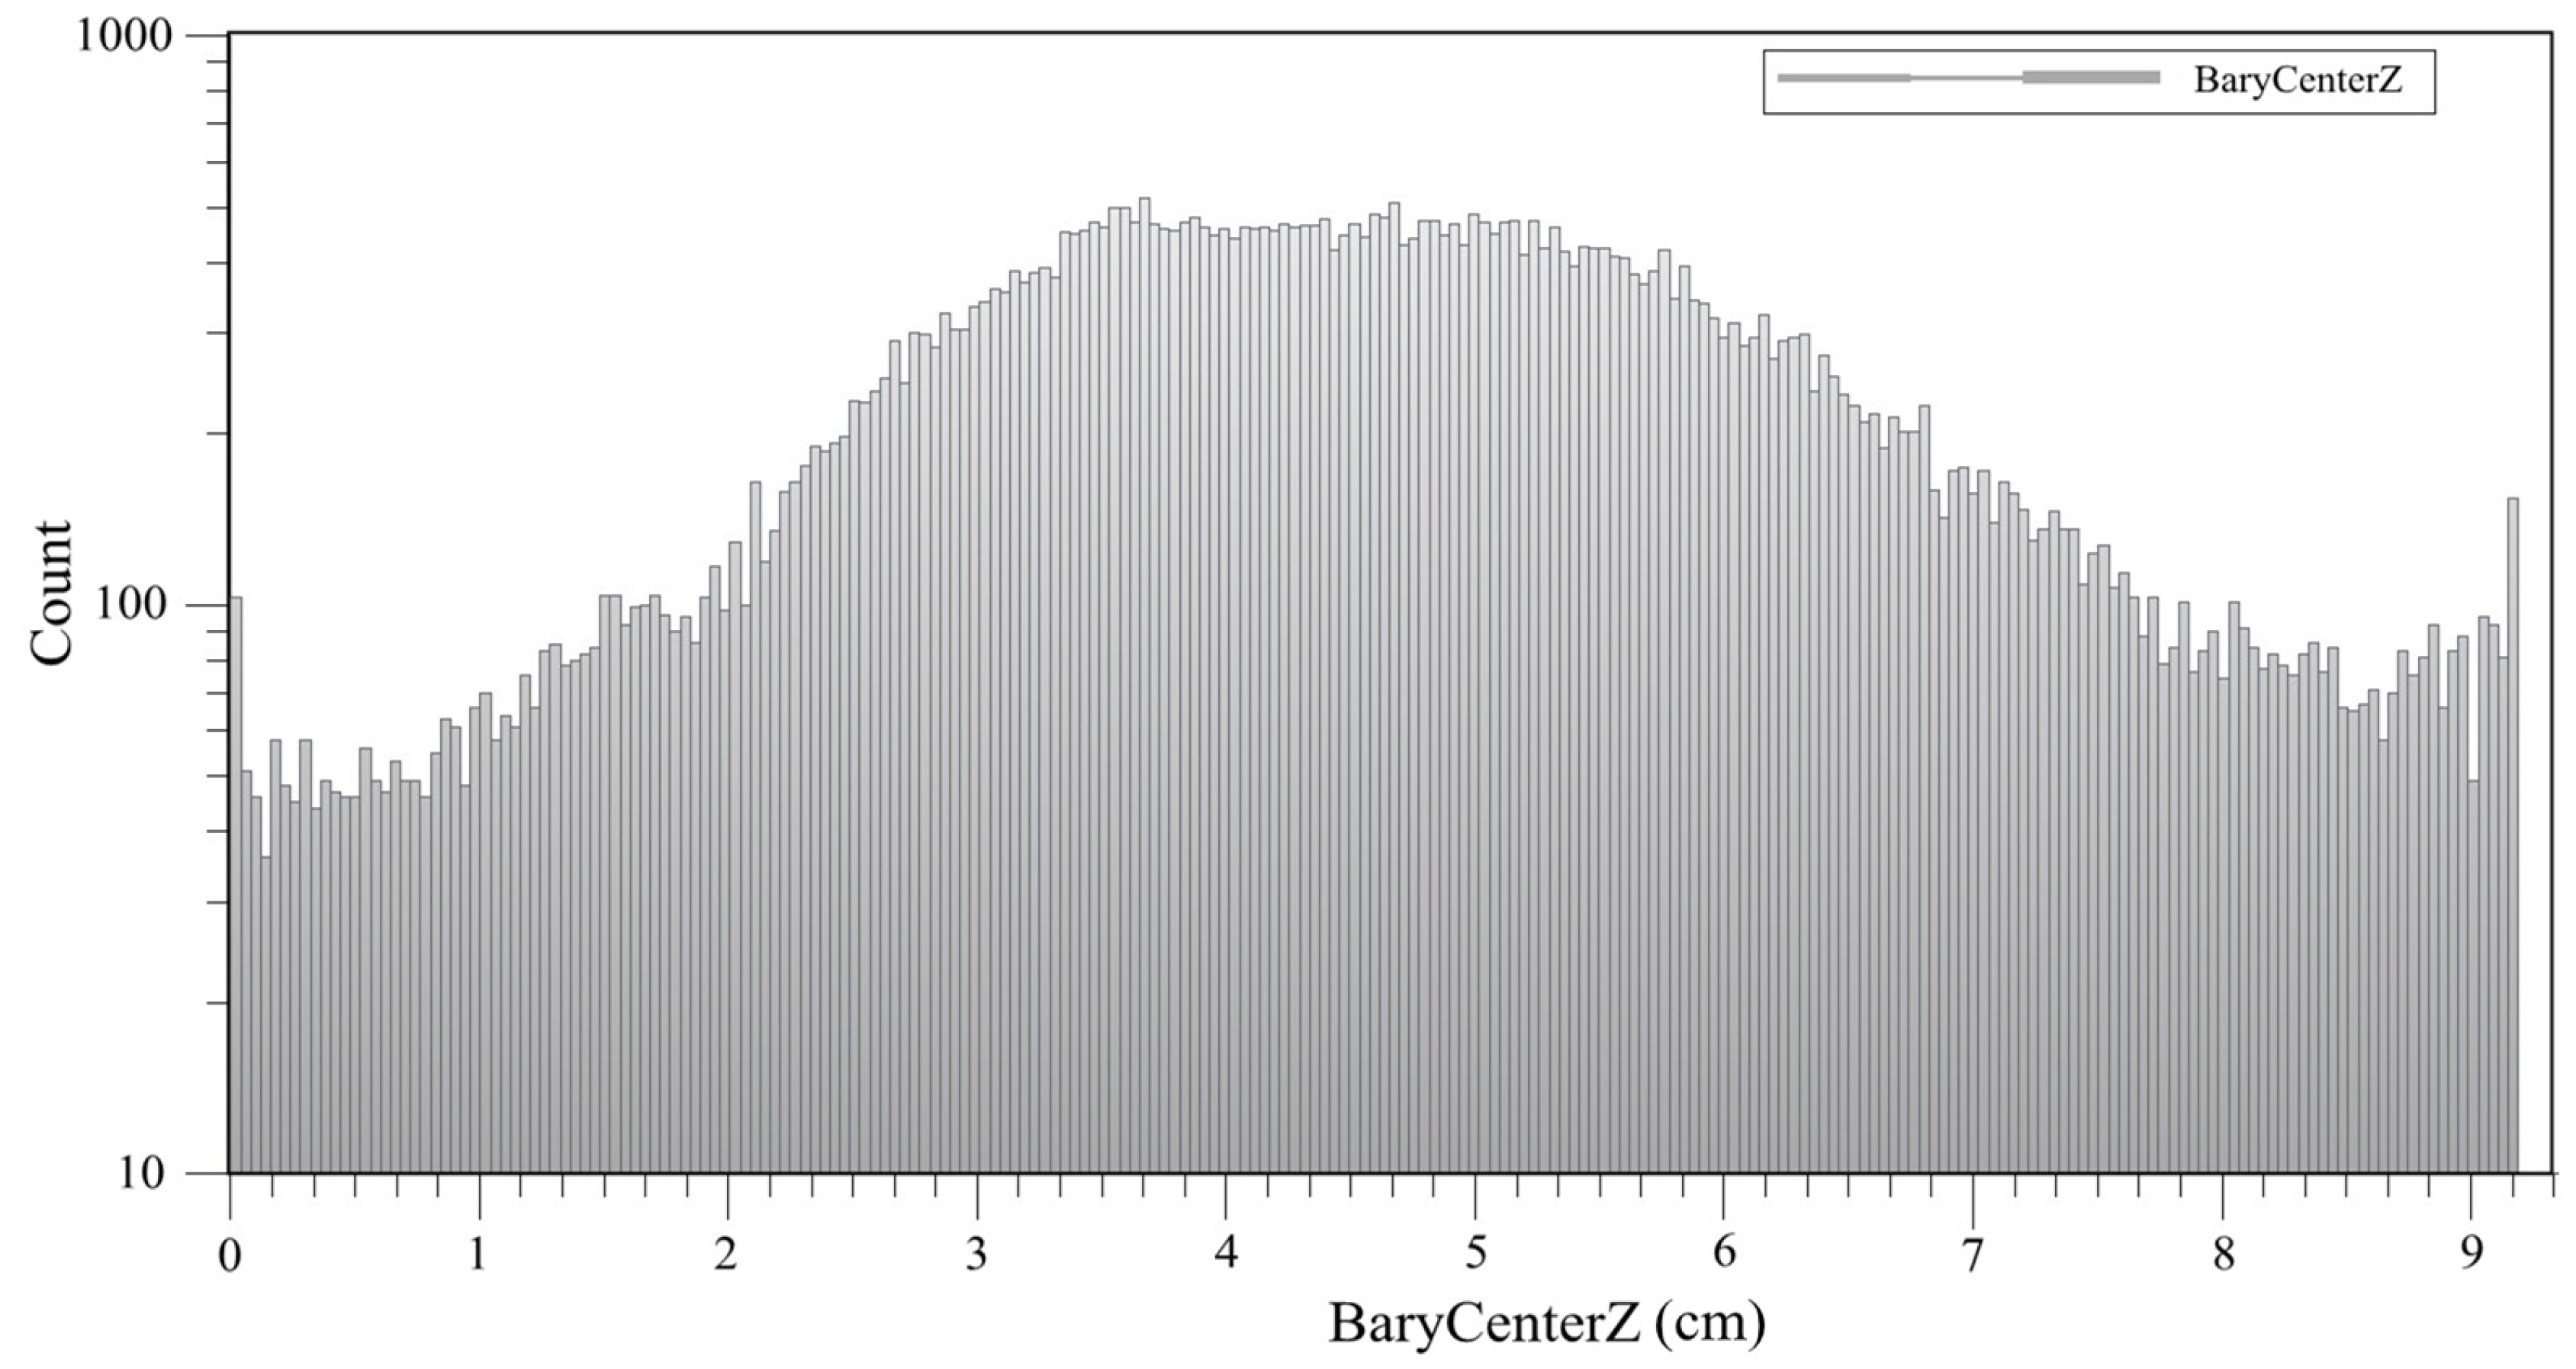
Through the reconstruction of the 3D structure, we could extract the coordinates of the center of gravity of each pore and conduct the statistics of the center of gravity of pores in different coordinate intervals in the X-direction (vertical), Y-direction, and Z-direction (horizontal), respectively, and set a statistical interval every 0.0456 cm in different coordinate axes. As shown in
Figure 8, it could be found that the number of pores in the same pore center of gravity coordinate interval in the X-direction was relatively uniformly distributed. From
Figure 9, it could be found that the number of pores in the Y-direction was normally distributed with different coordinate intervals; more than 95% of the pores were concentrated between 1.3 cm and 9.3 cm. From
Figure 10, the number of pores in the Z-direction were also normally distributed, with different coordinate intervals; 95% of the pores were concentrated between 1 and 8.9 cm.
4.3. Seepage Simulation and Calculation of Absolute Permeability Coefficient Tensor
4.3.1. Experimental Simulation of Absolute Permeability
In order to simulate the seepage process from the initial moment (a) to the arrival of the water flow at the loess surface (b) in
Figure 5, we simulated the seepage by observing the state of (b) in
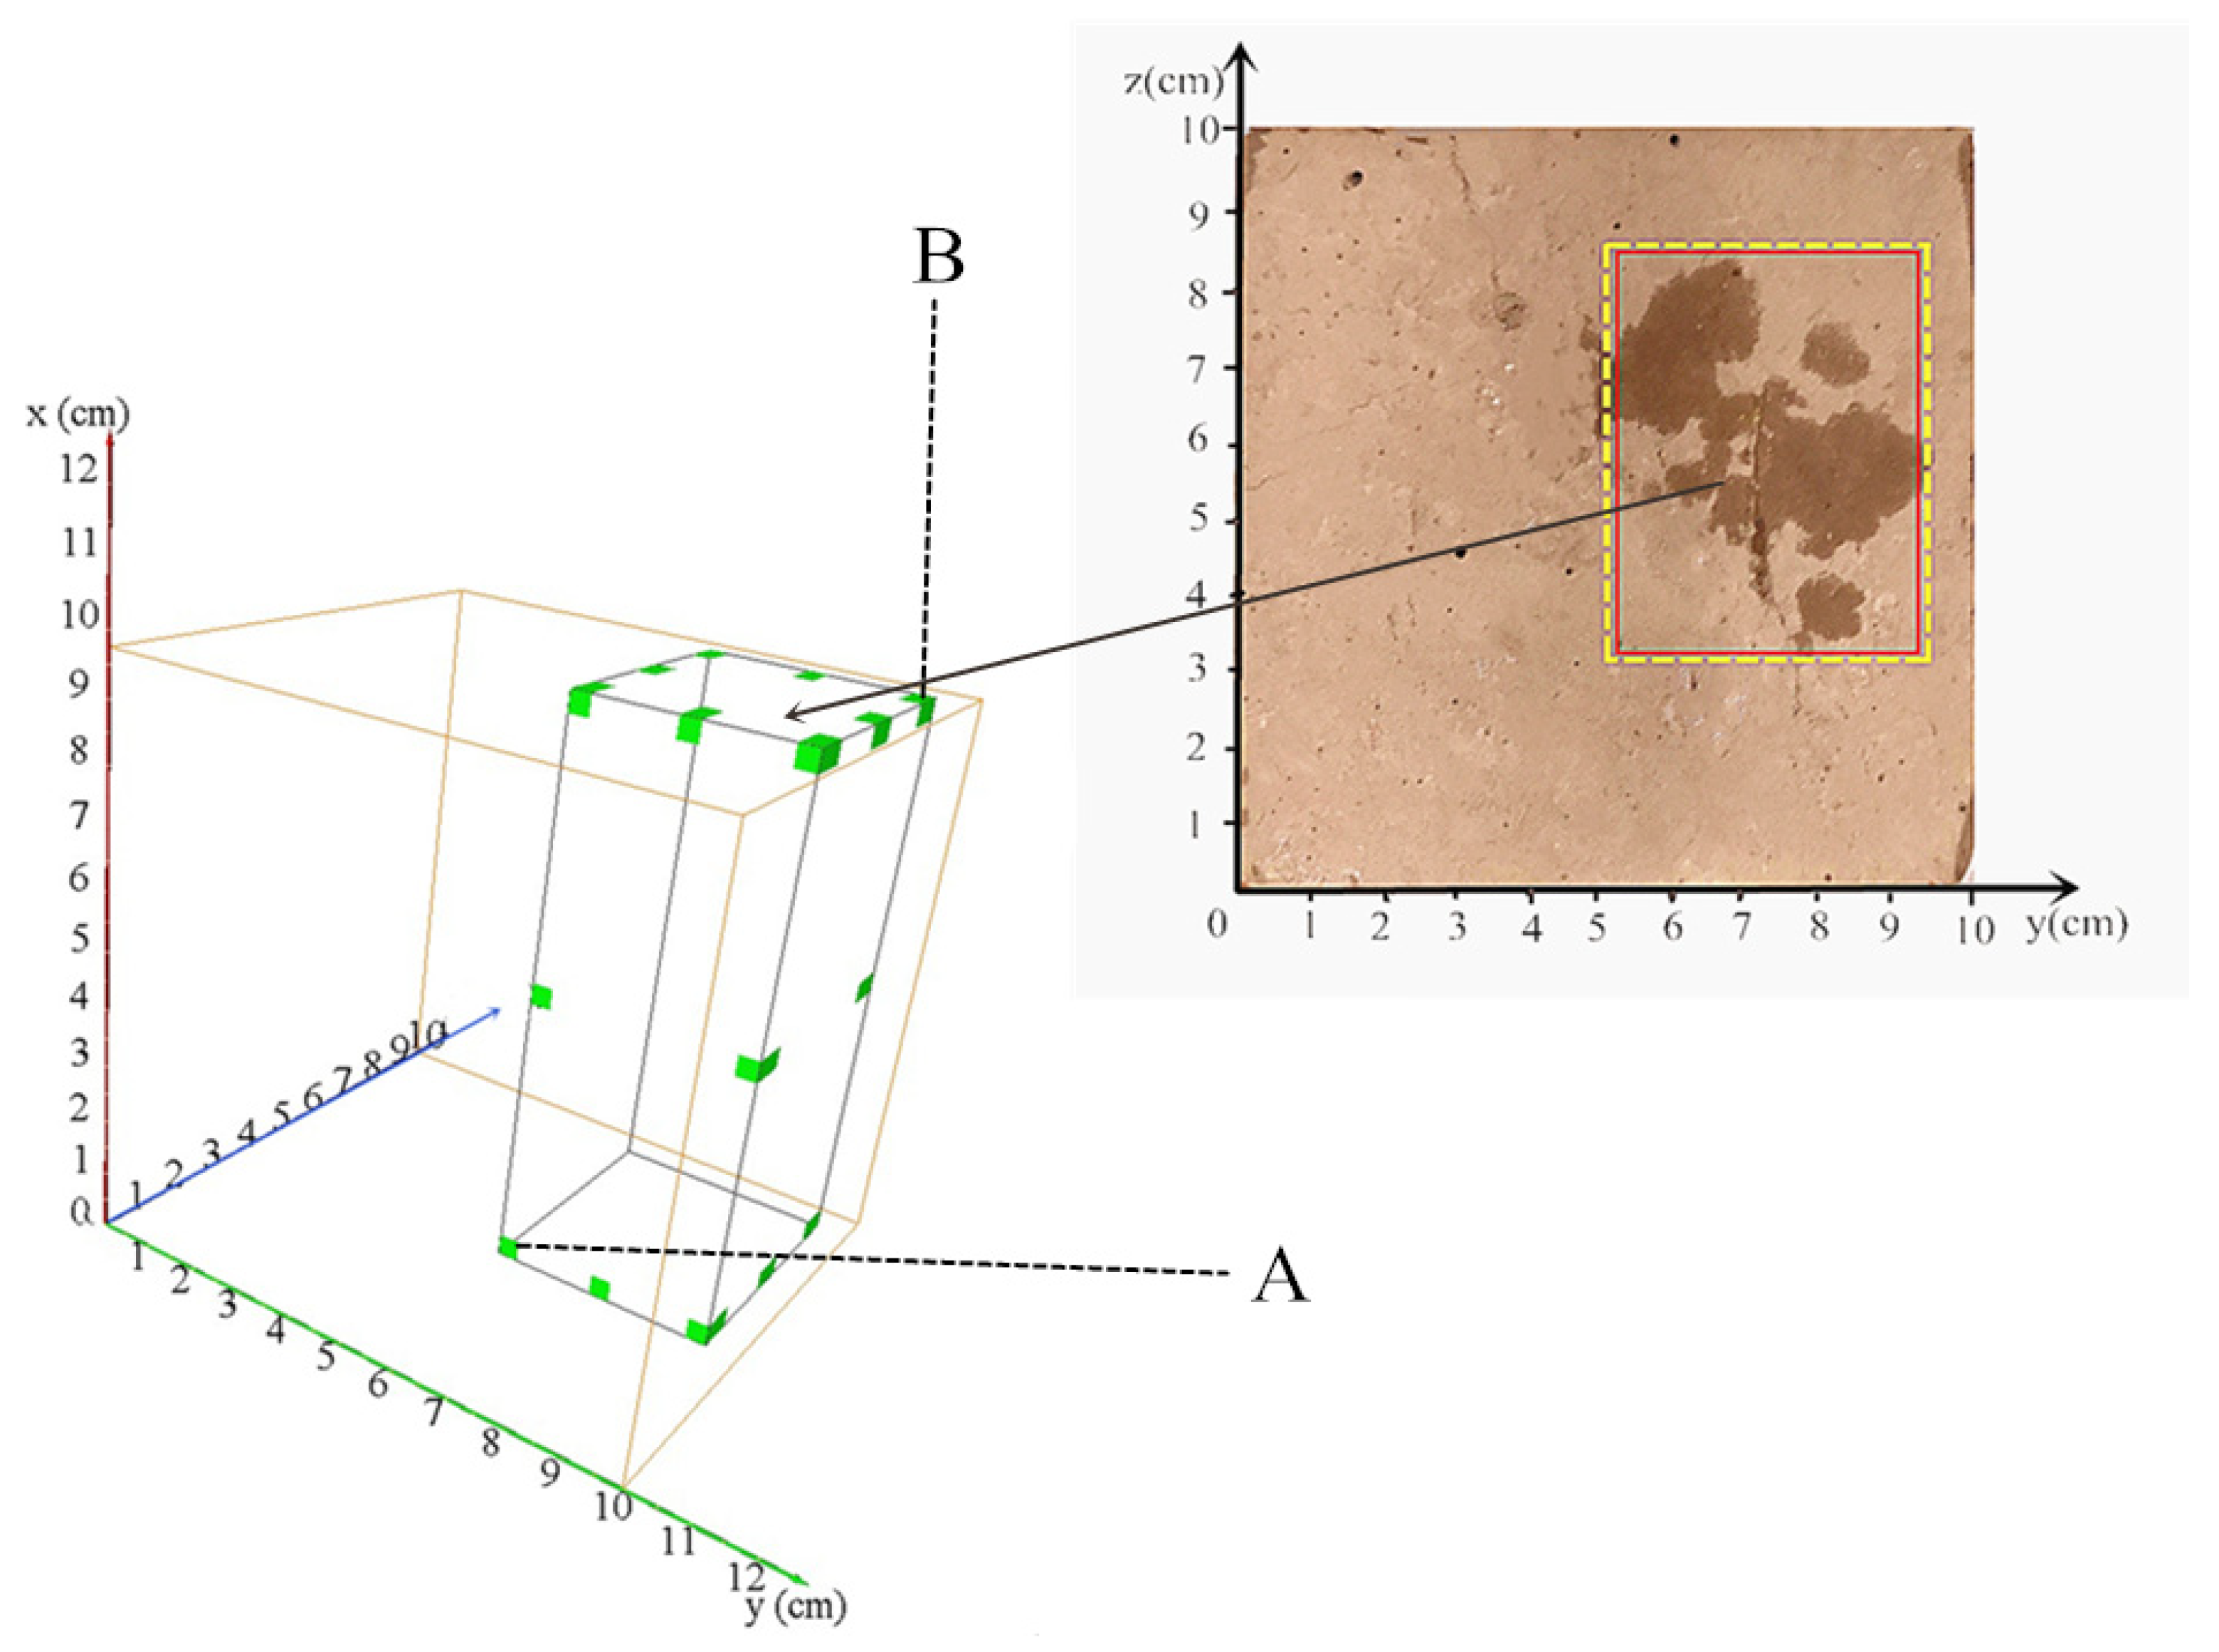
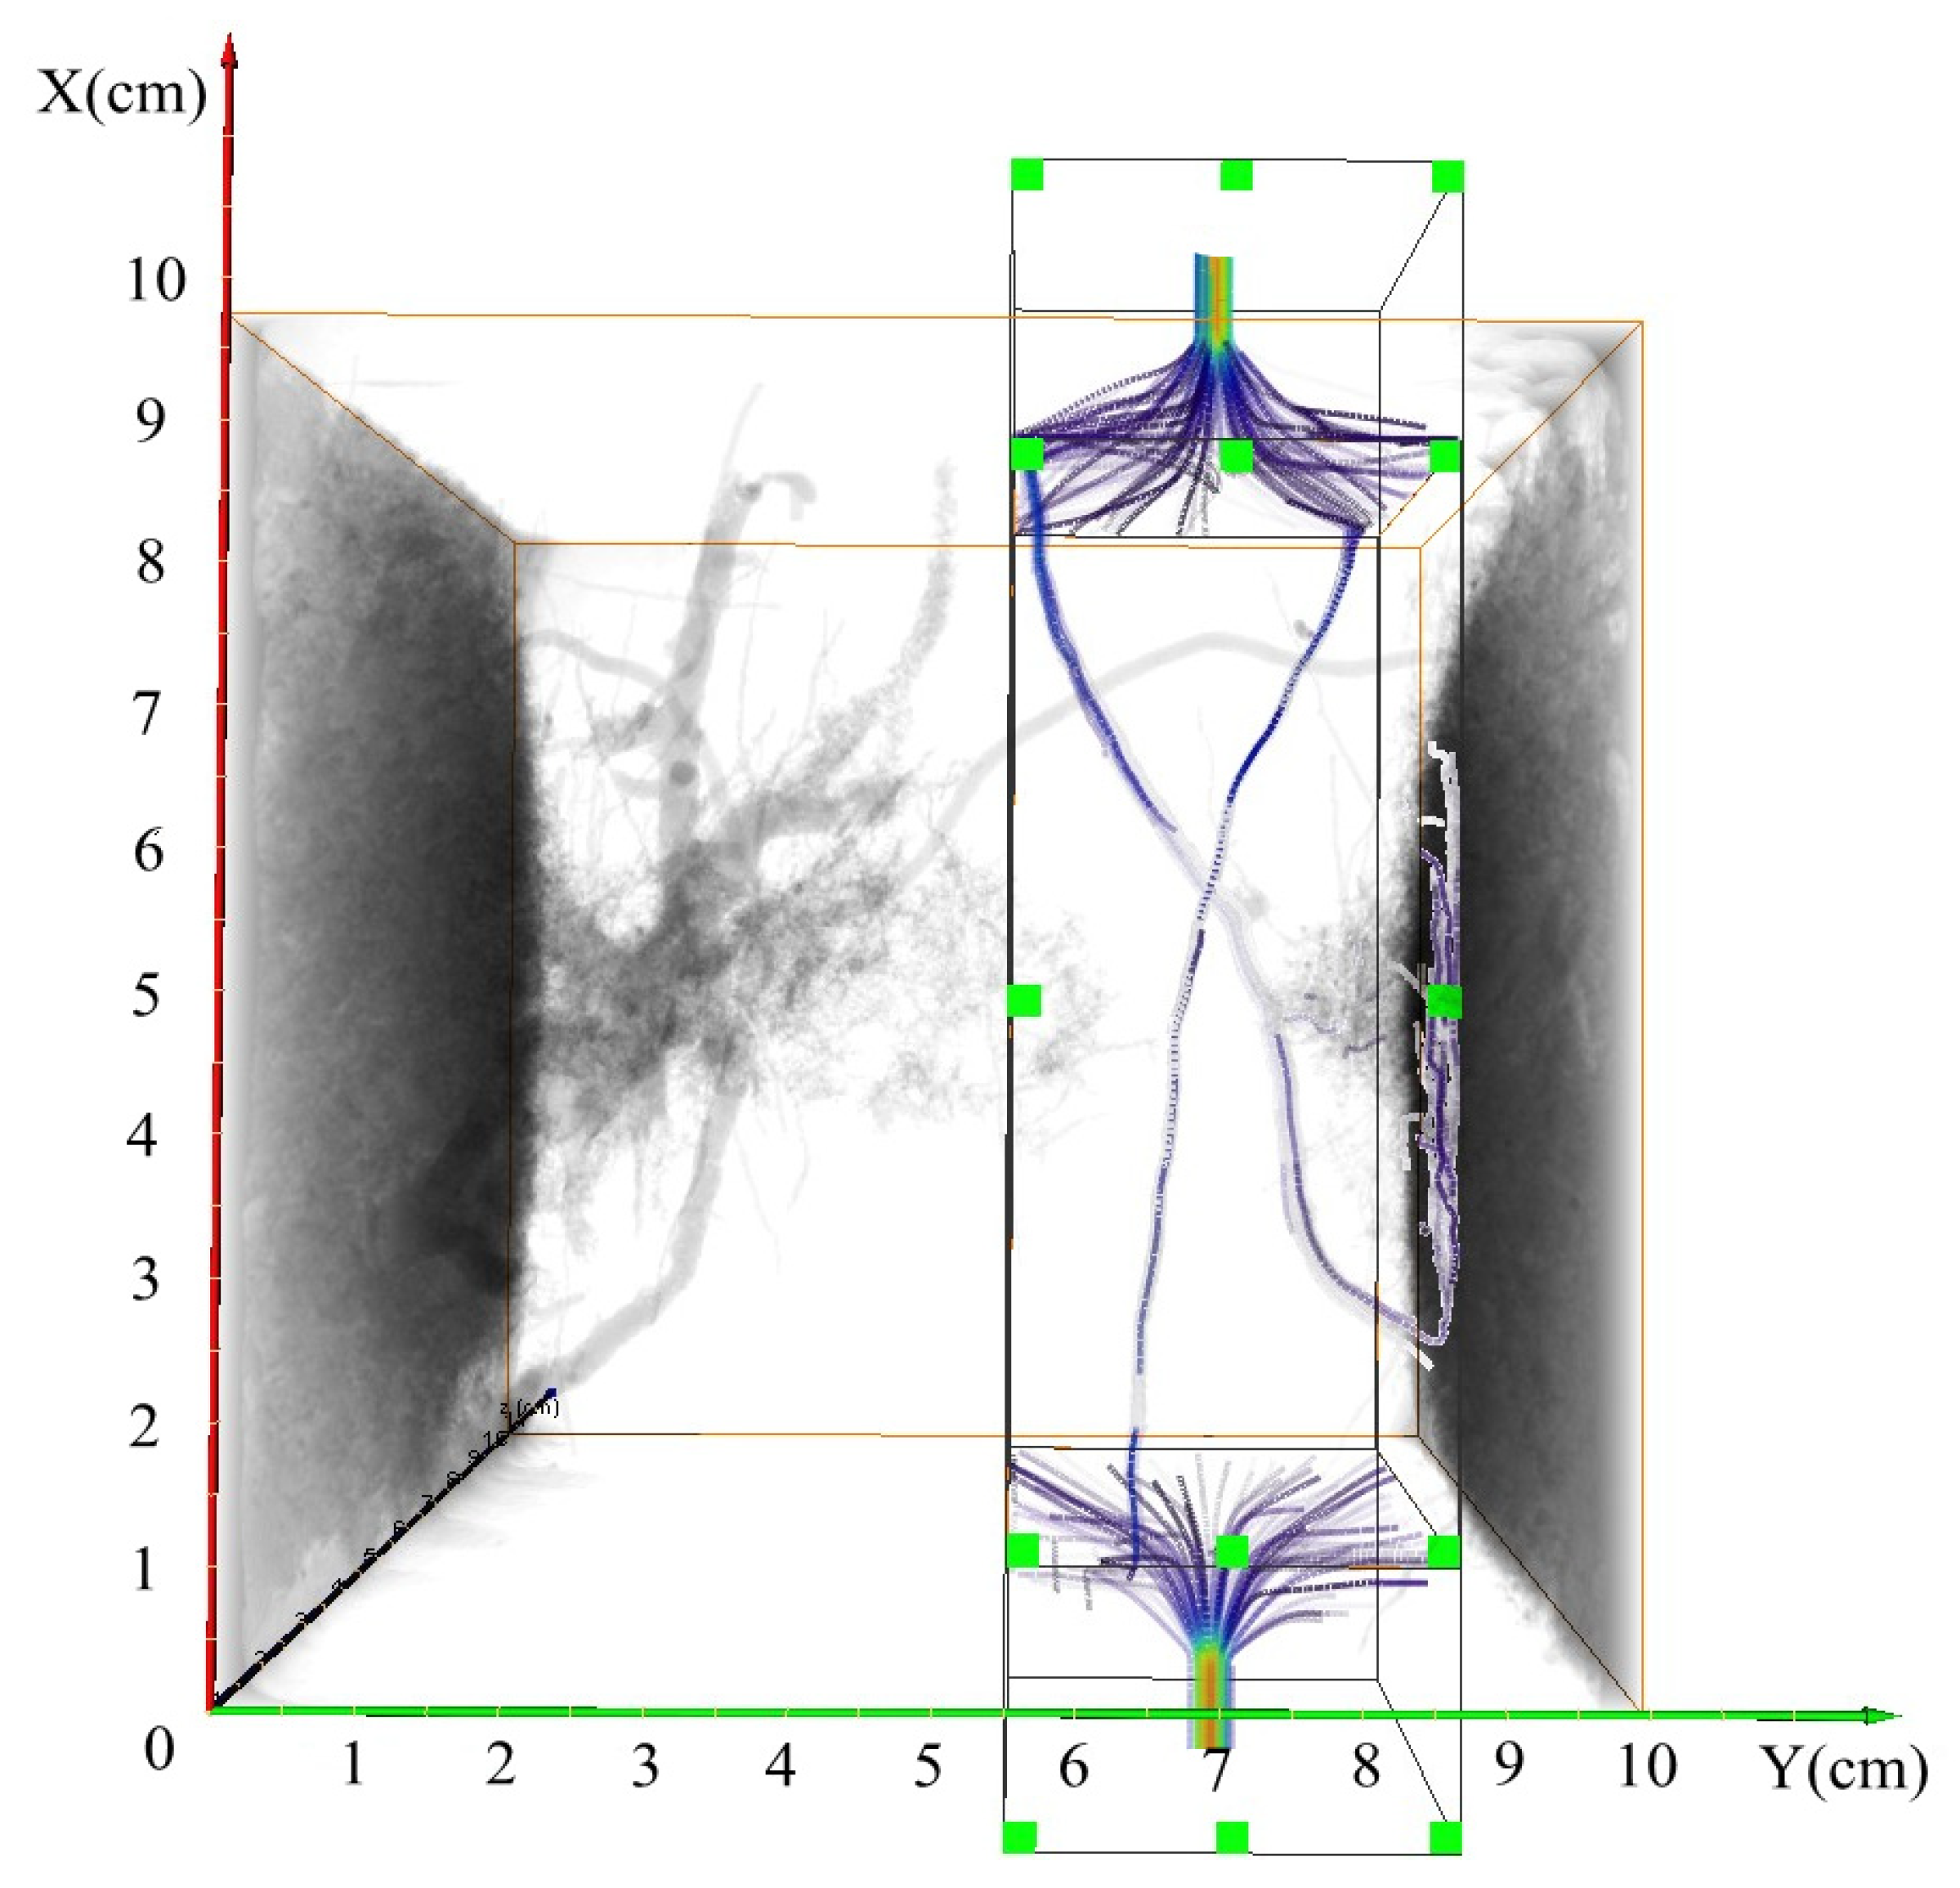
Figure 5 when the seepage process lasted 480 s. By combining the reconstructed 3D pore model, a rectangular computational unit with a length of 5.5 cm, a width of 4.1 cm, and a height of 10 cm was selected for the seepage simulation. As shown in
Figure 11, the coordinates of corner point A were (0,5.3,3.2); the coordinates of corner point B were (10,9.4,8.5).
After creating the seepage simulation area, the seepage simulation boundary was set, as shown in
Figure 12.
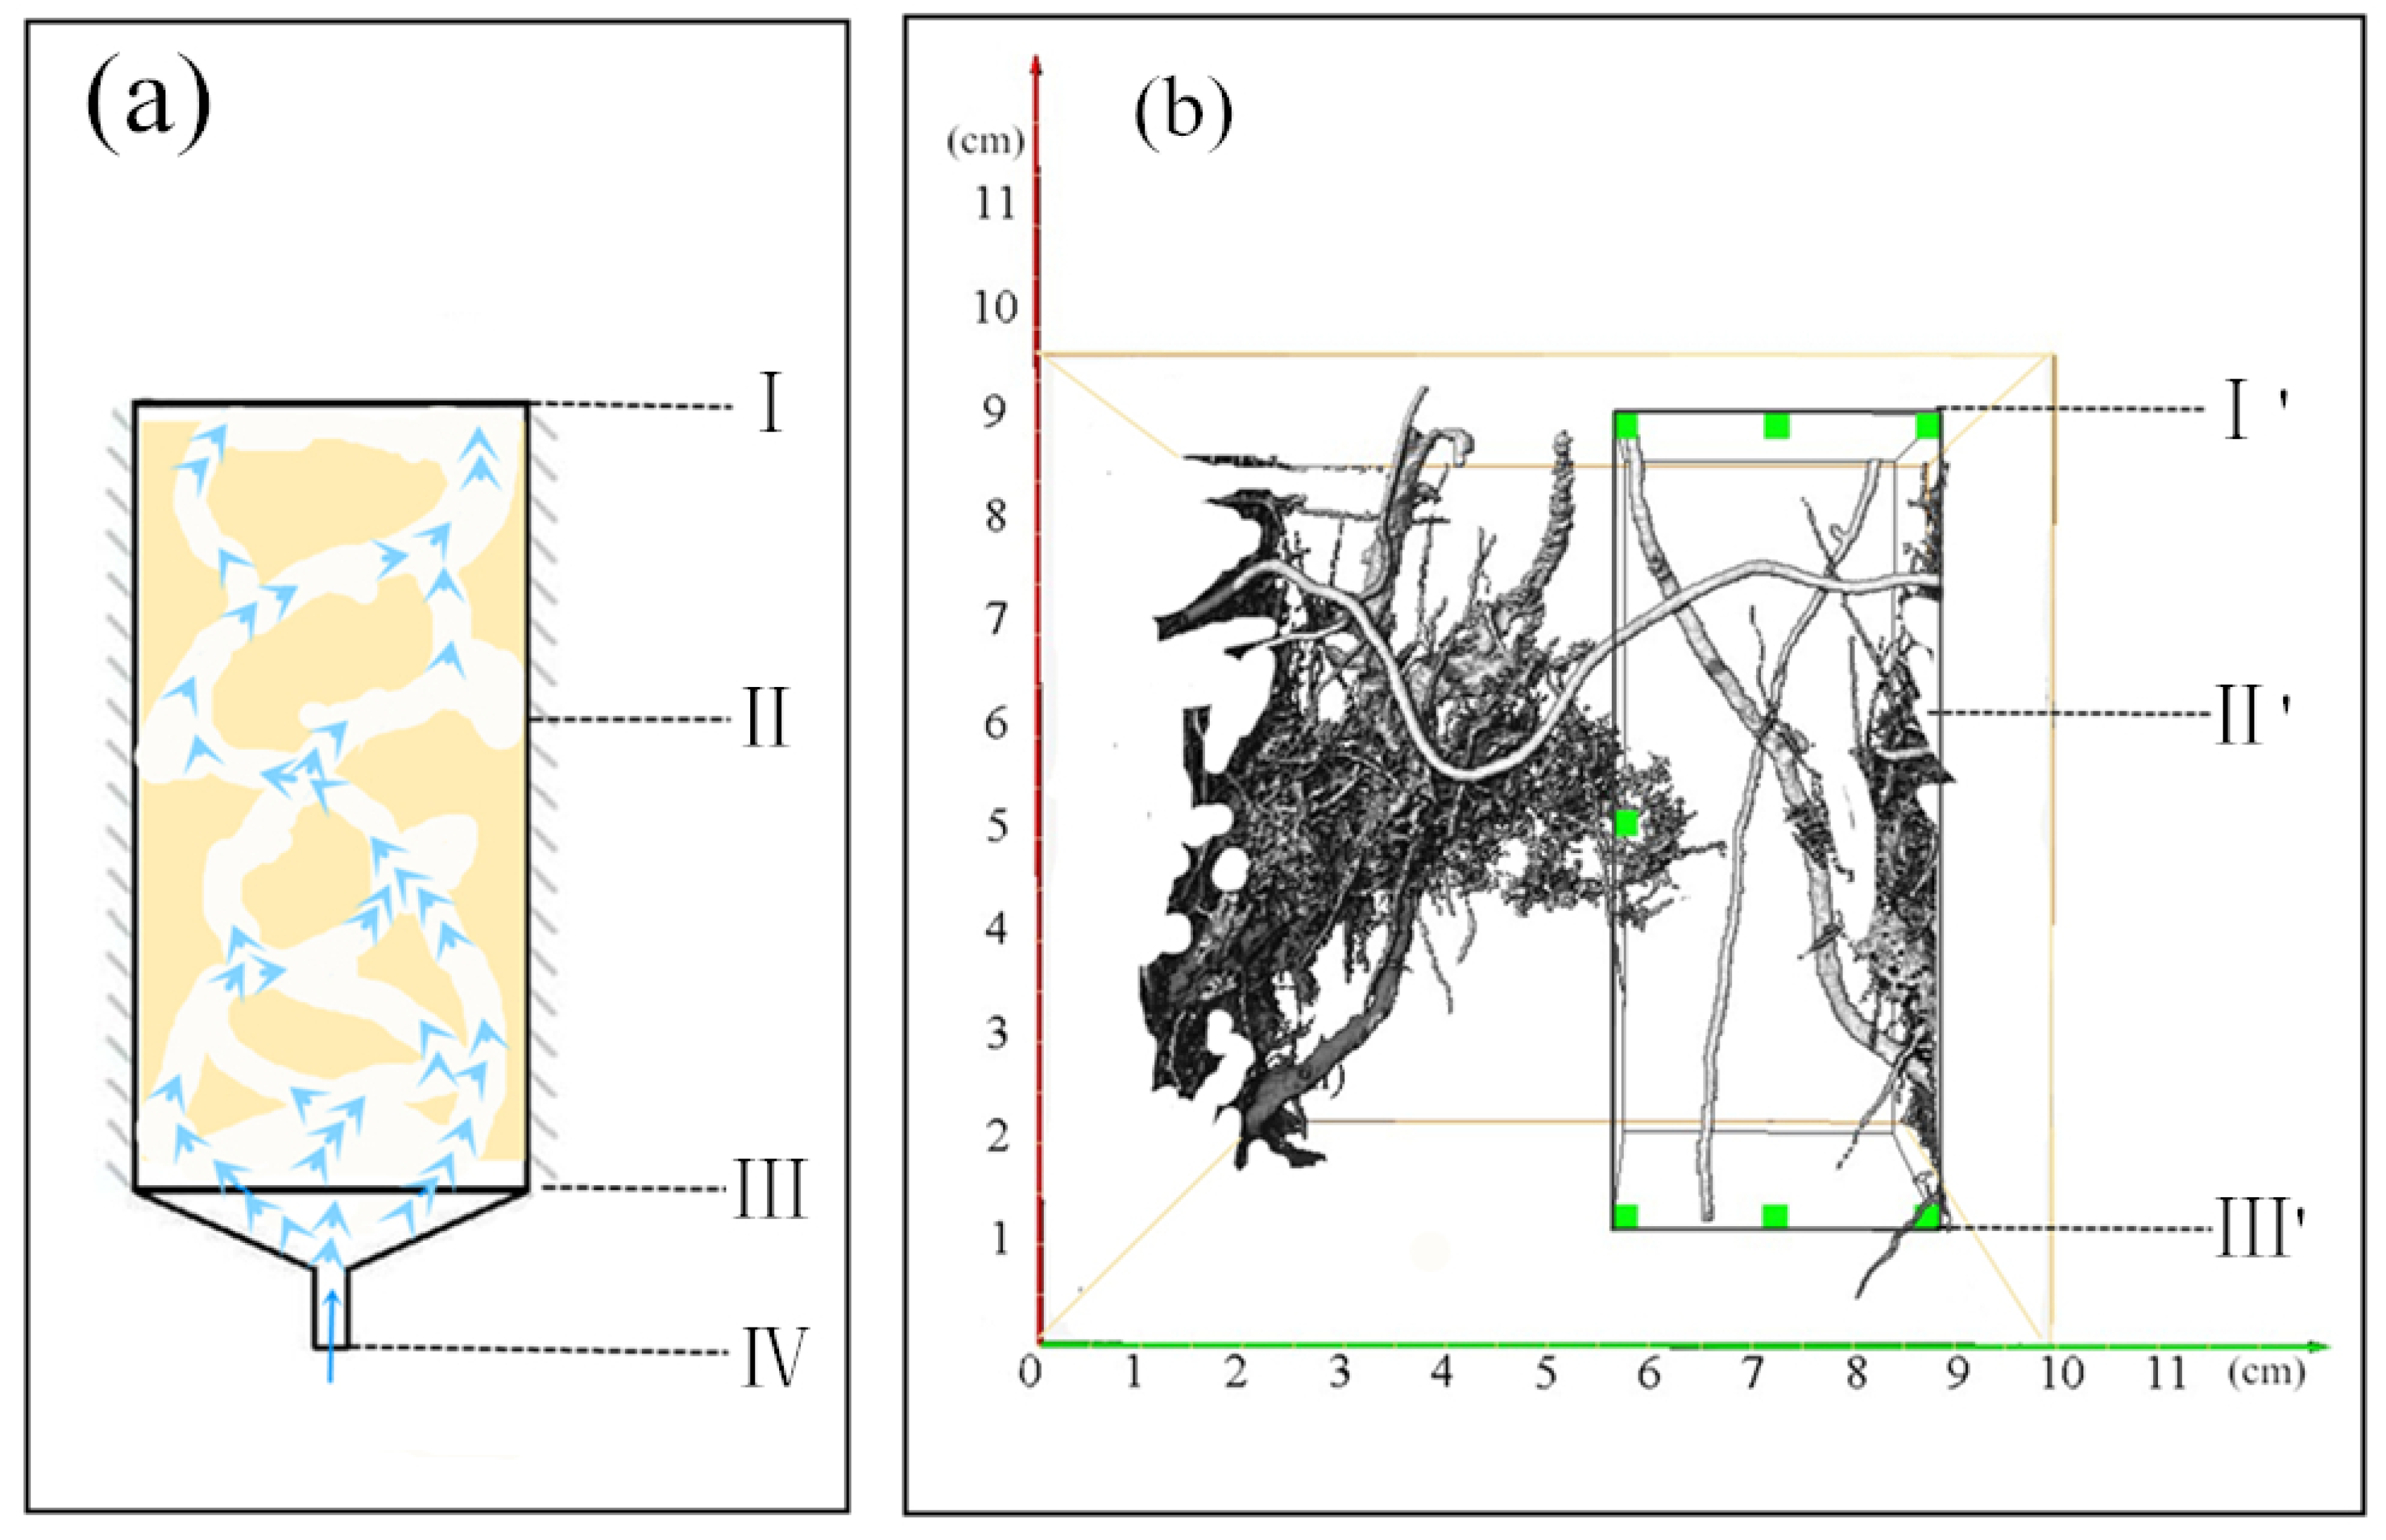
Figure 12a shows the two-dimensional schematic diagram of the seepage simulation, where the water entered from the bottom of the funnel Ⅳ and then entered the sample at the bottom interface Ⅲ of the specimen. Using the upward air discharge method, the water flowing in the specimen finally reached surface Ⅰ of the sample; the four face boundaries Ⅱ in the lateral direction of the seepage flow were all water barrier boundaries.
Figure 12b shows the 3D model of the 3D seepage boundary; the model boundaries I’, II’, and III’ correspond to I, II, and III in the 2D model
Figure 12a. A pixel-wide solid-phase plane was added to the surface of the boundary Ⅲ’ that was not perpendicular to the mainstream direction X during the seepage simulation setup, so that the selected sample area was allowed to be isolated from the outside world and no liquid flowed out from the system, thus setting the interface Ⅲ’ as a water-isolation boundary. The pressure head was set to 0 Pa at the top surface boundary I’ and 10,000 Pa at the bottom inlet boundary III’. The pressure head at interface III’ was quasi-static and the water flow was free to diffuse over the input surface III’ of the sample. The viscosity coefficient of water (fluid viscosity) was set to 0.1 Pa·s during the simulation. In order to make the model converge during the calculation, the maximum number of iterations was set to 100,000 and the convergence accuracy was set to 0.0001 μm
2.
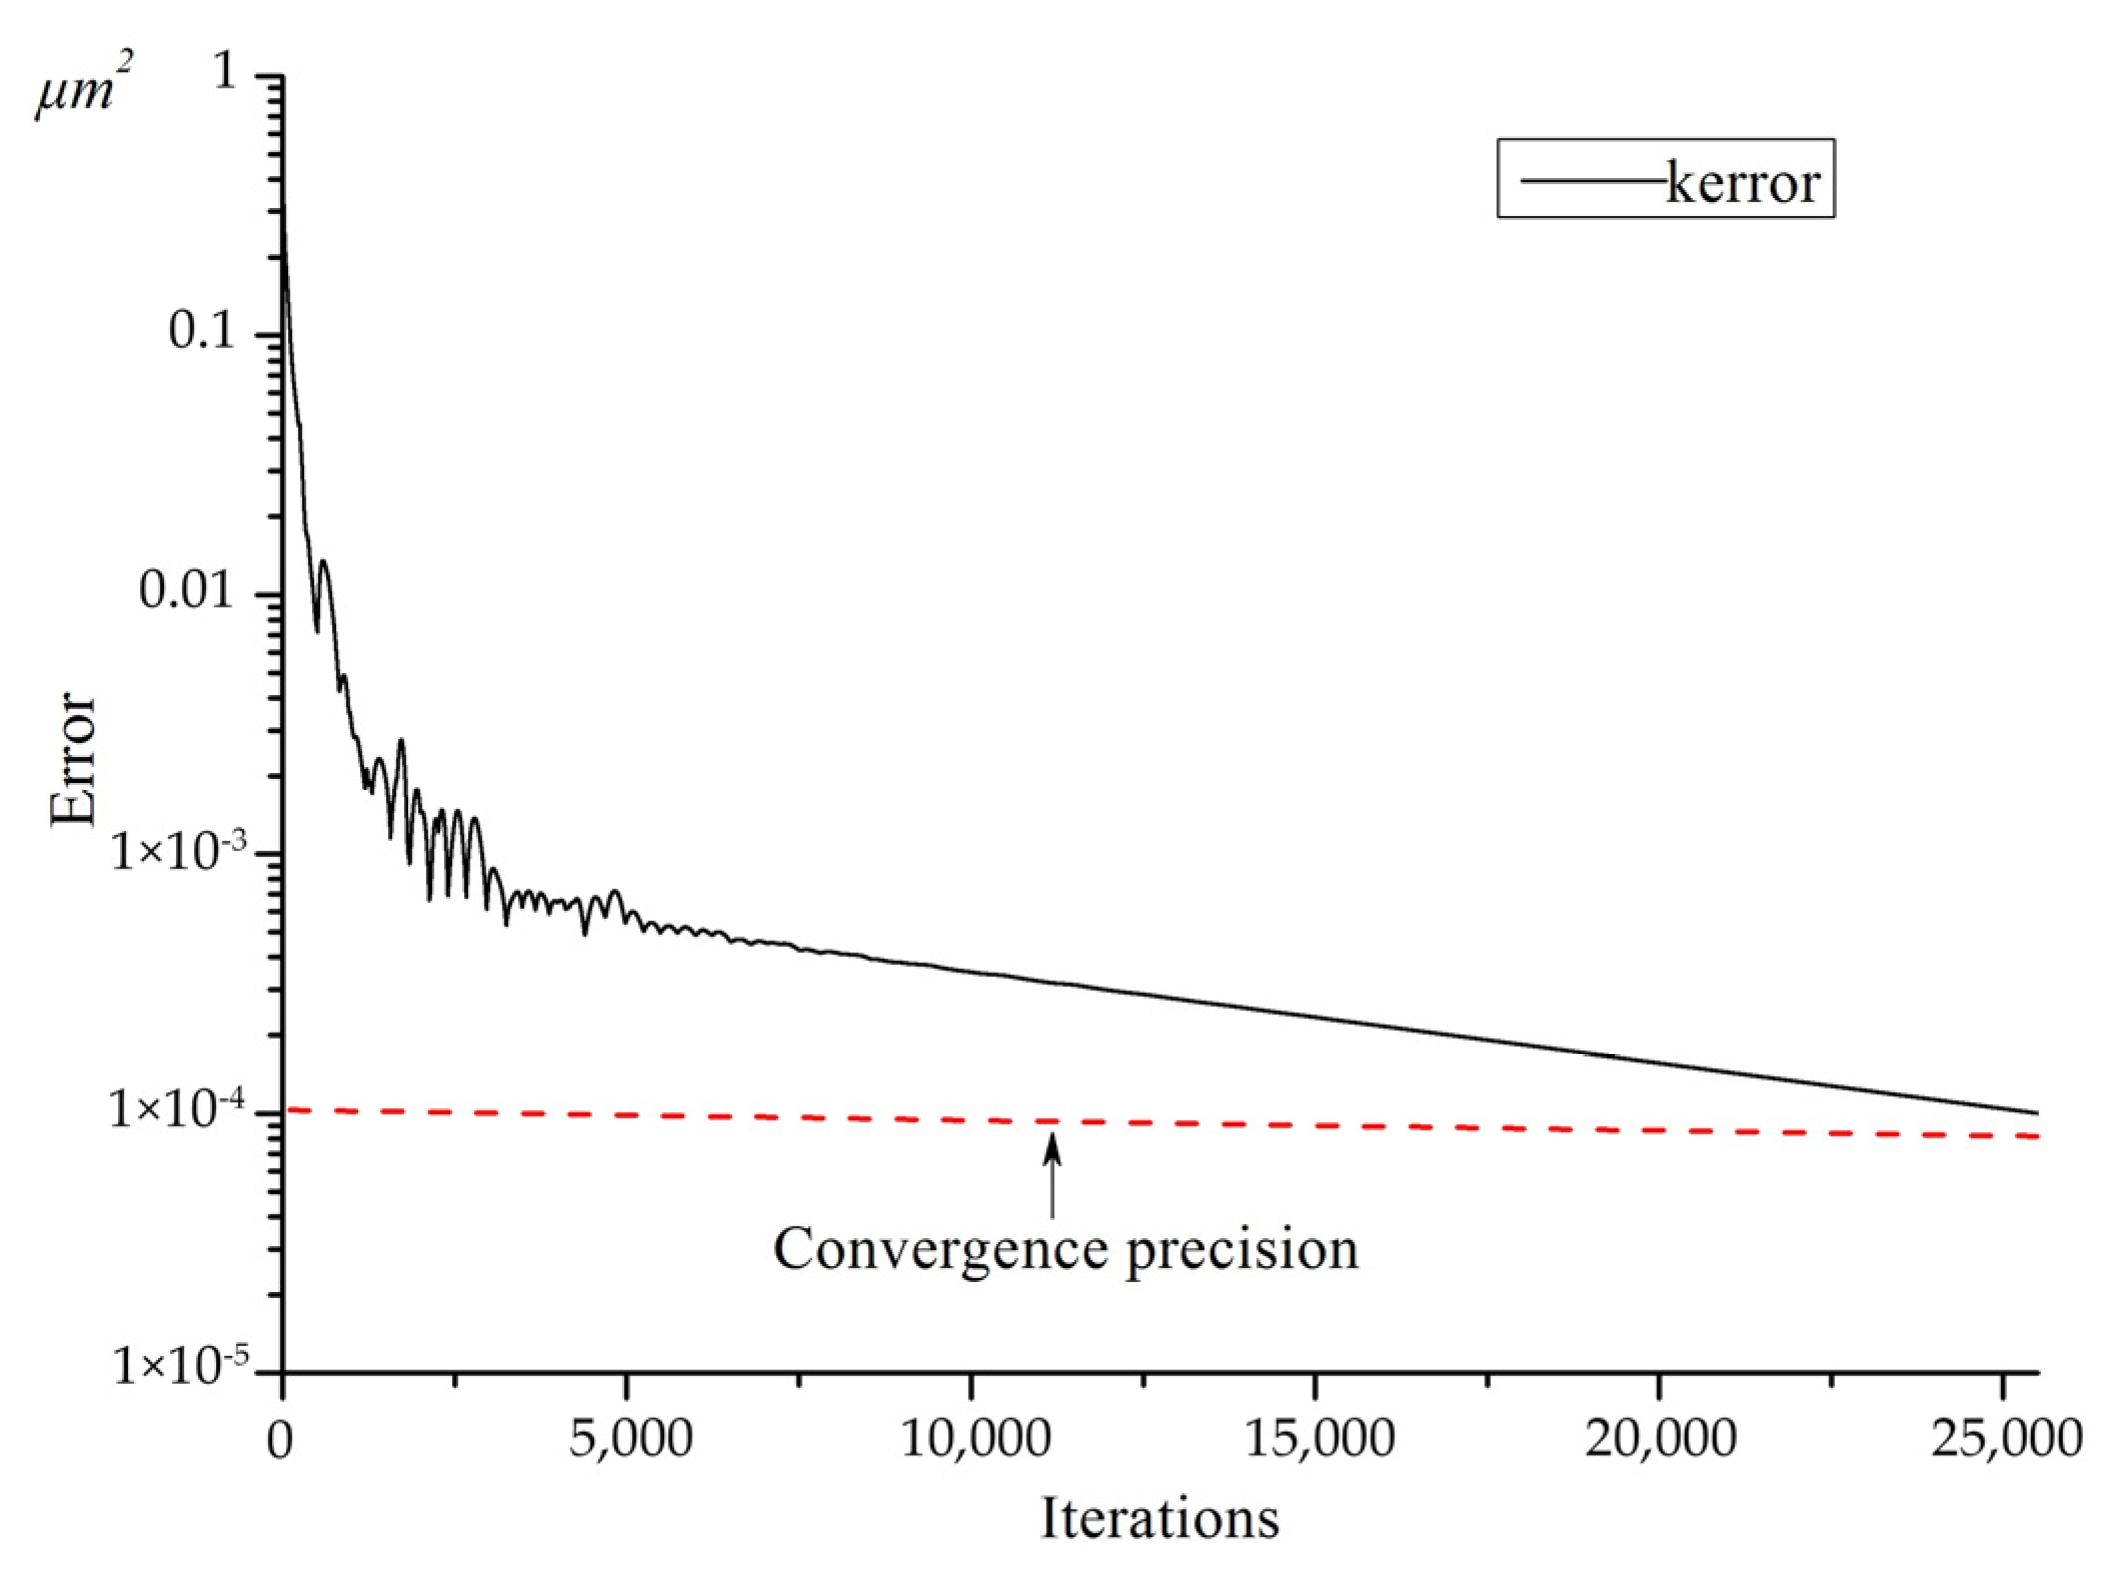
After the boundary conditions were set, the absolute permeability experiment simulation module in AVIZO software was run, as shown in
Figure 13. After 25,547 iterations to achieve iterative accuracy, the absolute permeability coefficient k of the loess in the simulated area was finally calculated to be 0.3482 μm
2. The results of the seepage simulation are shown in
Figure 14. The water flow entered from the seepage boundary set at the bottom and first passed through the connected pores in the loess sample in the vertical direction. Seepage in the horizontal direction occurred during the seepage process as the volume of water entering the sample increased. The seepage simulation process was highly consistent with the actual water infiltration process.
4.3.2. Absolute Permeability Tensor Calculation
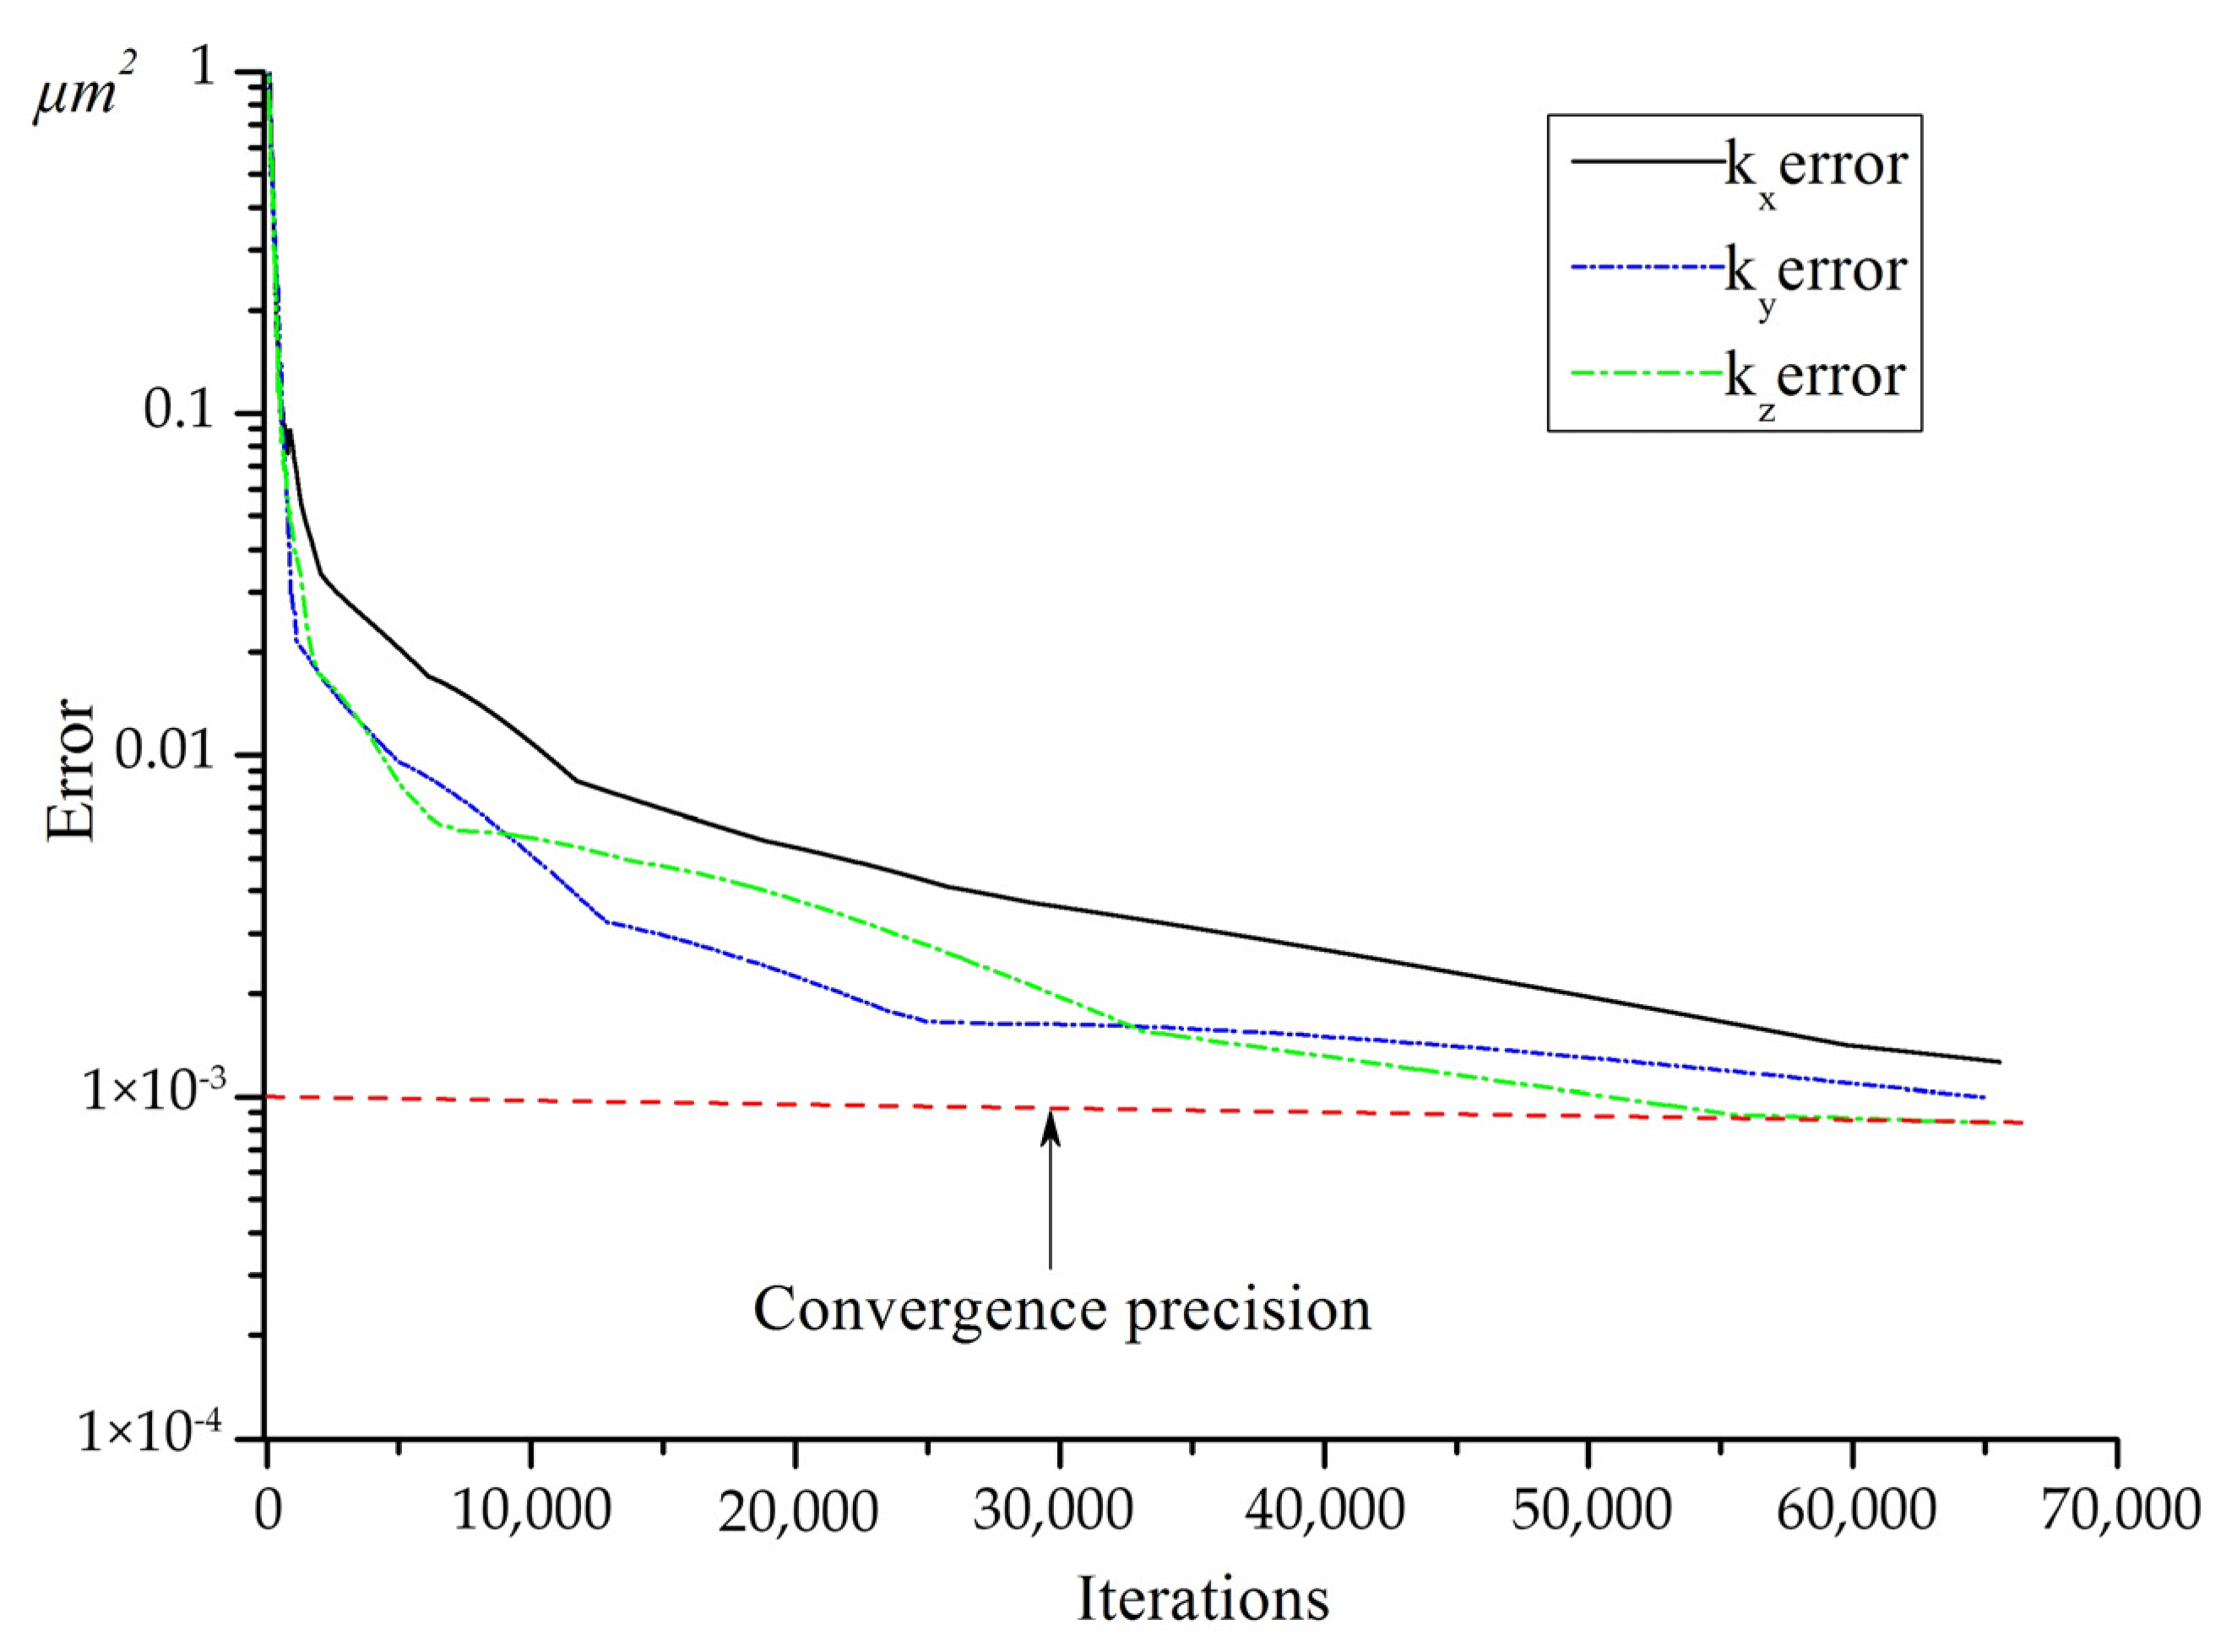
When calculating the absolute permeability coefficient tensor, the boundary conditions were set in the same way as those in the seepage simulation, except that periodic boundary conditions were imposed on the bottom inlet boundary Ⅲ’ and outlet boundary Ⅰ’. In order to make the model converge when calculating, the maximum number of iterations was set to 100,000 and the convergence accuracy was set to 0.001 μm
2. The absolute permeability tensor calculation module in AVIZO software was run, as shown in
Figure 15. After 65,540 iterations to finally reach the iteration accuracy, the vertical absolute permeability coefficient tensor of the loess in the simulated area was finally calculated, as shown in
Table 3. The absolute permeability coefficient of the Malan loess sample was 0.2848 μm
2 in the X-direction, 0.03156 μm
2 in the Y-direction, and 0.07378 μm
2 in the Z-direction. X-direction (vertical) absolute permeability coefficient was 9.02 times higher than the Y-direction (horizontal) absolute permeability coefficient and 3.86 times higher than the Z-direction (horizontal) absolute permeability coefficient. The absolute permeability coefficients along the Z-direction were on the same order of magnitude as those along the Y-direction.
After obtaining the value of absolute permeability k, the permeability coefficient
K of the loess sample can be calculated based on Equation (7), where
k is the absolute permeability (unit: μm
2),
is the density of water (unit: g/cm
3), and
is the dynamic viscosity of the liquid (unit Pa·s).
The X-direction (vertical) permeability coefficient of Malan loess sample was 2.791 × 10⁻⁴ cm/s, Y-direction (horizontal) permeability coefficient was 3.093 × 10⁻⁵ cm/s, and Z-direction (horizontal) permeability coefficient was 7.23 × 10⁻⁵ cm/s. The absolute permeability of Malan loess was calculated from 0.13 to 7.81 μm2 by the pore network model method by Xin Li et al. The permeability coefficients of Malan loess ranged from 1.28 × 10⁻⁴ cm/s to 7.65 × 10⁻³ cm/s. In this study, the absolute permeability coefficients and permeability coefficients of Malan loess samples were calculated within this interval using this method of volume averaging, which indicates that it is feasible to calculate the absolute permeability of Malan loess using the volume averaging method.
5. Discussion
This study mainly focused on the absolute permeability and simulation of seepage process of Malan loess by CT scan images combined with the volume average method. The results of seepage experiment and seepage simulation were compared and the results of permeability coefficient calculated by simulation were compared and analyzed with the results measured by the ring knife method.
In order to explore the pore morphology characteristics of the intact Malan loess, CT scanning technology was used in this study to scan the samples of intact Malan loess and to extract the pore morphology parameters of intact Malan loess [
9]. It was found that the vertical pores of Malan loess were strongly developed and the center of gravity was evenly distributed in the vertical pores through the distribution of center of gravity coordinates. In the lateral direction, the coordinate distribution was normal. This also proved that the vertical permeability coefficient of intact Malan loess was larger than the lateral permeability coefficient [
10,
11].
Zhang et al. measured the permeability coefficient of Malan loess in Jinya Township, Lanzhou, China using the ring knife method; the permeability coefficients ranged from 0.62 × 10
−4 cm/s to 1.67 × 10
−4 cm/s [
8,
31,
47]. The permeability coefficient in the vertical direction calculated by using the CT scan image of intact Malan loess combined with the volume averaging method was 2.791 × 10
−4 cm/s and the horizontal permeability coefficients were 3.093 × 10
−5 cm/s and 7.23 × 10
−5 cm/s, respectively, while the permeability coefficient of the soil samples around the samples measured with the ring knife sampling was 1.42 × 10
−4 cm/s, which was slightly smaller than that of the permeability coefficients calculated by the simulation, because the ring knife may smash into the loess during the sampling process, thus compacting the loess and resulting in the permeability coefficient to become smaller. Calculating the permeability coefficient of Malan loess by sampling using the method mentioned in this paper can effectively avoid the measurement error due to the disturbance of the loess during the sampling process.
In order to investigate the seepage process in the intact Malan loess, this study extracted the specific yield of the intact Malan loess using a homemade seepage device and observed the preferential conduction of water flow along the connected macropores on the surface of the intact Malan loess sample. This indicated that, given a certain head action, water flowed preferentially along the connected macropores in the intact Malan loess; then, the water filled the surrounding pores. This experimental method could also be used in the study of other experimental materials and could be used to study the seepage process of different porous media [
3,
48,
49].
During the study of the porous media seepage process, the physical model was generally generalized and the model accuracy was not high. The CT scan section of the intact Malan loess sample was extracted by computerized tomography. The 3D pore structure of the intact Malan loess was reconstructed and the 3D pore morphological parameters of the intact Malan loess were extracted, which provided the base model for the water flow simulation and made the original black box model into a bright box model [
9]. Comparing the seepage simulation model with the actual seepage experiment proved the reliability of the simulation model. The absolute permeability could be calculated by the seepage simulation and the absolute permeability tensor could be extracted, which provided a new idea for the calculation of absolute permeability. To perform the seepage simulation model with higher accuracy requires a higher accuracy CT scan of the sample to obtain a CT scan slice with higher resolution.
The results of this study provide a new calculation method for the absolute permeability of undisturbed Malan loess and verify the feasibility of this calculation method in order to provide scientific basis for geological disaster prevention, agricultural pollution, and water conservancy projects construction in loess areas. In engineering practice [
30], it is possible to obtain the permeability parameters of the intact Malan loess samples by directly CT-scanning the samples to obtain the grayscale slices of the samples instead of conducting permeability experiments. Moreover, this method avoids the disturbance of the sample in the process of sampling by the ring knife, thus improving the accuracy of the measurement results.
6. Conclusions
In this study, the internal pore structure of the loess sample from Malan, Lanzhou was obtained by CT scanning and percolation experiments were designed. By allowing water to percolate through the intact sample by the upward air discharge method, the specific yield of the loess was measured, which provided a basis for the extraction of the threshold delineation of the percolation-connected pore space of the loess. The seepage simulation, as well as the calculation of the permeability coefficient tensor, was performed by the absolute permeability experiment simulation module and absolute permeability tensor calculation module in AVIZO software using the volume averaging method in combination with the 3D reconstructed pore space. The absolute permeability coefficients calculated by comparing this method were consistent with the results of different studies. This provides a new and effective calculation method for the calculation of absolute permeability coefficients of loess as well as seepage simulation.
In the process of threshold partitioning for the 3D pore reconstruction of Malan loess in Lanzhou, the intact loess sample had a specific yield of 10.1%; the specific yield was used as a covariate to delineate the seepage-connected pore space. The threshold value of multi-thresholding was 170, by which the threshold partitioning could overcome the capillary force under the action of gravity and water could be screened out through the pore space and prepare for the case that the seepage simulation could be applied in Darcy’s law.
After reconstructing the three-dimensional pore structure of Malan loess, it was found that the number of pores in the same pore center of gravity coordinate interval in the vertical direction of Malan loess samples was distributed relatively evenly. In the horizontal direction, the number of pores was normally distributed, with different coordinate intervals. The results of this study provide a new calculation method for the absolute permeability of intact Malan loess and verify the feasibility of the calculation method, with a view to providing a scientific basis for the prevention and control of geologic hazards, agricultural pollution, and construction of water conservancy projects in loess areas. In engineering practice, it is possible to obtain the permeability parameters of the intact Malan loess samples by directly CT-scanning the samples to obtain the grayscale slices of the samples instead of conducting permeability experiments. Moreover, this method avoids the disturbance of the sample in the process of sampling by the ring knife, thus improving the accuracy of the measurement results.
Through the seepage simulation, it can be calculated that the absolute permeability of Malan loess sample in Lanzhou is 0.3482 μm2 and the absolute permeability coefficient in X-direction (vertical) of Malan loess sample is 9.02 times and 3.86 times of the absolute permeability coefficient in Y- and Z-directions (horizontal). This also indicates that the Malan loess has developed pore space in the vertical direction and has better connectivity. Using this method can effectively avoid the error caused by the disturbance of loess soil samples in the sampling process by the ring knife method; the calculated results are closer to the permeability coefficient of the soil samples in the natural state.
During the model calculation, it is easy to produce non-convergence due to the very large number of iterations of the model run. The selection of the convergence accuracy will greatly save the computation time when the accuracy of the computation requirement is guaranteed, so a reasonable selection of the value of the convergence accuracy will improve the computation efficiency. The present study mainly focuses on the feasibility of this calculation method in the study of seepage of intact Malan loess, which can be followed up by increasing the number of samples of intact Malan loess in the study area as well as comparative analyses and further studies on the permeability of Malan loess in different study areas.
Author Contributions
Conceptualization, Y.L. (Yangchun Lu) and Y.L. (Yudong Lu); methodology, Y.L. (Yangchun Lu); software, Y.L. (Yangchun Lu); validation, Y.L. (Yangchun Lu) and Y.L. (Yudong Lu); formal analysis, Y.L. (Yangchun Lu) and T.L.; investigation, Y.L. (Yangchun Lu), T.L., and X.Z.; resources, G.Z. and B.W.; data curation, Y.L. (Yangchun Lu) and X.Z.; writing—original draft preparation, Y.L. (Yangchun Lu); writing—review and editing, Y.L. (Yangchun Lu); visualization, Y.L. (Yangchun Lu); supervision, Y.L. (Yudong Lu). All authors have read and agreed to the published version of the manuscript.
Funding
This research was funded by the National Natural Science Foundation of China (Grant No. U2243204, 41630634, 42261144749 and 41877232), and the Natural Science Foundation of Hebei Province (Grant No.: E2021210092).
Data Availability Statement
Not applicable.
Acknowledgments
The editor and reviewers are highly appreciated for providing positive and constructive comments and suggestions concerning this manuscript.
Conflicts of Interest
The authors declare no conflict of interest. The funders had no role in the design of the study; in the collection, analyses, or interpretation of data; in the writing of the manuscript; or in the decision to publish the results.
References
- Li, X.A.; Hong, B.; Wang, L.; Li, L.; Sun, J. Microanisotropy and preferred orientation of grains and aggregates (POGA) of the Malan loess in Yan’an, China: A profile study. Bull. Eng. Geol. Environ. 2019, 79, 1893–1907. [Google Scholar] [CrossRef]
- Li, X.-A.; Wang, L.; Yan, Y.-l.; Hong, B.; Li, L.-C. Experimental study on the disintegration of loess in the Loess Plateau of China. Bull. Eng. Geol. Environ. 2018, 78, 4907–4918. [Google Scholar] [CrossRef]
- Li, Y.; Mo, P.; Wang, Y.; Zhang, T.; Zhang, H. Strength anisotropy of Malan loess and the implications for the formation of loess walls and columns. Catena 2020, 194, 104809. [Google Scholar] [CrossRef]
- Wei, T.; Fan, W.; Yuan, W.; Wei, Y.-N.; Yu, B. Three-dimensional pore network characterization of loess and paleosol stratigraphy from South Jingyang Plateau, China. Environ. Earth Sci. 2019, 78, 333. [Google Scholar] [CrossRef]
- Wei, Y.-N.; Fan, W.; Yu, B.; Deng, L.-S.; Wei, T. Characterization and evolution of three-dimensional microstructure of Malan loess. Catena 2020, 192, 104585. [Google Scholar] [CrossRef]
- Lu, Q.; Qiao, J.; Peng, J.; Liu, Z.; Liu, C.; Tian, L.; Zhao, J. A typical Earth fissure resulting from loess collapse on the loess plateau in the Weihe Basin, China. Eng. Geol. 2019, 259, 105189. [Google Scholar] [CrossRef]
- Yuan, K.; Ni, W.; Lü, X.; Zhu, M.; Wang, H.; Nie, Y. Mechanical properties and microstructure evolution of Malan loess. Quat. Int. 2022, 637, 74–84. [Google Scholar] [CrossRef]
- Zhang, X.; Lu, Y.; Li, X.; Lu, Y.; Sun, J.; Pan, W. Multilevel Collapsibility of Loess under Irrigation in Jinya Town, Gansu Province, China. Adv. Civ. Eng. 2019, 2019, 1–13. [Google Scholar] [CrossRef]
- Li, X.; Lu, Y.; Zhang, X.; Fan, W.; Lu, Y.; Pan, W. Quantification of macropores of Malan loess and the hydraulic significance on slope stability by X-ray computed tomography. Environ. Earth Sci. 2019, 78, 522. [Google Scholar] [CrossRef]
- Garcia Giménez, R.; Vigil de la Villa, R.; González Martín, J.A. Characterization of loess in central Spain: A microstructural study. Environ. Earth Sci. 2011, 65, 2125–2137. [Google Scholar] [CrossRef]
- Li, Y.; He, S.; Deng, X.; Xu, Y. Characterization of macropore structure of Malan loess in NW China based on 3D pipe models constructed by using computed tomography technology. J. Asian Earth Sci. 2018, 154, 271–279. [Google Scholar] [CrossRef]
- Zhou, J.Q.; Chen, Y.F.; Wang, L.; Cardenas, M.B. Universal Relationship Between Viscous and Inertial Permeability of Geologic Porous Media. Geophys. Res. Lett. 2019, 46, 1441–1448. [Google Scholar] [CrossRef]
- Battiato, I.; Ferrero, V.P.T.; O’ Malley, D.; Miller, C.T.; Takhar, P.S.; Valdés-Parada, F.J.; Wood, B.D. Theory and Applications of Macroscale Models in Porous Media. Transp. Porous Media 2019, 130, 5–76. [Google Scholar] [CrossRef]
- Blunt, M.J.; Bijeljic, B.; Dong, H.; Gharbi, O.; Iglauer, S.; Mostaghimi, P.; Paluszny, A.; Pentland, C. Pore-scale imaging and modelling. Adv. Water Resour. 2013, 51, 197–216. [Google Scholar] [CrossRef]
- Bu, S.S.; Yang, J.; Zhou, M.; Li, S.Y.; Wang, Q.W.; Guo, Z.X. On contact point modifications for forced convective heat transfer analysis in a structured packed bed of spheres. Nucl. Eng. Des. 2014, 270, 21–33. [Google Scholar] [CrossRef]
- Weigand, T.M.; Schultz, P.B.; Giffen, D.H.; Farthing, M.W.; Crockett, A.; Kelley, C.T.; Gray, W.G.; Miller, C.T. Modeling Nondilute Species Transport Using the Thermodynamically Constrained Averaging Theory. Water Resour. Res. 2018, 54, 6656–6682. [Google Scholar] [CrossRef]
- Wood, B.D.; Valdés-Parada, F.J. Volume averaging: Local and nonlocal closures using a Green’s function approach. Adv. Water Resour. 2013, 51, 139–167. [Google Scholar] [CrossRef]
- Yang, C.; Huang, R.; Lin, Y.; Qiu, T. Volume averaging theory (VAT) based modeling for longitudinal mass dispersion in structured porous medium with porous particles. Chem. Eng. Res. Des. 2020, 153, 582–591. [Google Scholar] [CrossRef]
- Carmignato, S.; Dewulf, W.; Leach, R. Applications of CT for Non-destructive Testing and Materials Characterization. In Industrial X-Ray Computed Tomography; Springer: Berlin/Heidelberg, Germany, 2018; pp. 267–331. [Google Scholar] [CrossRef]
- Ivanov, A.L.; Shein, E.V.; Skvortsova, E.B. Tomography of Soil Pores: From Morphological Characteristics to Structural–Functional Assessment of Pore Space. Eurasian Soil Sci. 2019, 52, 50–57. [Google Scholar] [CrossRef]
- Samant, P.; Trevisi, L.; Ji, X.; Xiang, L. X-ray induced acoustic computed tomography. Photoacoustics 2020, 19, 100177. [Google Scholar] [CrossRef]
- Shanti, N.O.; Chan, V.W.L.; Stock, S.R.; De Carlo, F.; Thornton, K.; Faber, K.T. X-ray micro-computed tomography and tortuosity calculations of percolating pore networks. Acta Mater. 2014, 71, 126–135. [Google Scholar] [CrossRef]
- Wang, Z.Y.; Xu, Q.; Ni, W. Study of undisturbed loess stress-strain relation during CT test. Rock Soil Mech. 2010, 31, 387–391+396. [Google Scholar]
- Li, X.; Zhang, D.L. Application of C T in Analysis of Structure of Com pacted Soil. Chin. Rock Soil Mech. 1999, 20, 62–66. [Google Scholar]
- Bird, M.B.; Butler, S.L.; Hawkes, C.D.; Kotzer, T. Numerical modeling of fluid and electrical currents through geometries based on synchrotron X-ray tomographic images of reservoir rocks using Avizo and COMSOL. Comput. Geosci. 2014, 73, 6–16. [Google Scholar] [CrossRef]
- Li, T.; Shao, M.A.; Jia, Y.; Jia, X.; Huang, L. Using the X-ray computed tomography method to predict the saturated hydraulic conductivity of the upper root zone in the Loess Plateau in China. Soil Sci. Soc. Am. J. 2018, 82, 1085–1092. [Google Scholar] [CrossRef]
- Chen, Y.; Hao, X.; Xue, D.; Li, Z.; Ma, X. Creep behavior and permeability evolution of coal pillar dam for underground water reservoir. Int. J. Coal Sci. Technol. 2023, 10, 11. [Google Scholar] [CrossRef]
- Liu, X.; Wei, J.; Wei, G.; Wu, C.; Liu, C.; Ni, X. Combined control of fluid adsorption capacity and initial permeability on coal permeability. Int. J. Coal Sci. Technol. 2022, 9, 85. [Google Scholar] [CrossRef]
- Wang, K.; Zhang, G.; Wang, Y.; Zhang, X.; Li, K.; Guo, W.; Du, F. A numerical investigation of hydraulic fracturing on coal seam permeability based on PFC-COMSOL coupling method. Int. J. Coal Sci. Technol. 2022, 9, 10. [Google Scholar] [CrossRef]
- Zou, G.; Zhang, Q.; Peng, S.; She, J.; Teng, D.; Jin, C.; Che, Y. Influence of geological factors on coal permeability in the Sihe coal mine. Int. J. Coal Sci. Technol. 2022, 9, 6. [Google Scholar] [CrossRef]
- Chen, S.; Ma, W.; Li, G. Study on the mesostructural evolution mechanism of compacted loess subjected to various weathering actions. Cold Reg. Sci. Technol. 2019, 167, 102846. [Google Scholar] [CrossRef]
- Huo, A.; Wang, X.; Zhao, Z.; Yang, L.; Zhong, F.; Zheng, C.; Gao, N. Risk Assessment of Heavy Metal Pollution in Farmland Soils at the Northern Foot of the Qinling Mountains, China. Int. J. Env. Res. Public Health 2022, 19, 14962. [Google Scholar] [CrossRef]
- Huo, A.; Yang, L.; Luo, P.; Cheng, Y.; Peng, J.; Nover, D. Influence of landfill and land use scenario on runoff, evapotranspiration, and sediment yield over the Chinese Loess Plateau. Ecol. Indic. 2021, 121, 107208. [Google Scholar] [CrossRef]
- Huo, A.; Zhao, Z.; Luo, P.; Zheng, C.; Peng, J.; Abuarab, M.E.L.S. Assessment of Spatial Heterogeneity of Soil Moisture in the Critical Zone of Gully Consolidation and Highland Protection. Water 2022, 14, 3674. [Google Scholar] [CrossRef]
- Chen, K.H.; Hwang, C.; Chang, L.C.; Tsai, J.P.; Yeh, T.C.J.; Cheng, C.C.; Ke, C.C.; Feng, W. Measuring Aquifer Specific Yields With Absolute Gravimetry: Result in the Choushui River Alluvial Fan and Mingchu Basin, Central Taiwan. Water Resour. Res. 2020, 56, e2020WR027261. [Google Scholar] [CrossRef]
- Malík, P.; Coplák, M.; Švasta, J.; Černák, R.; Bajtoš, P. Recharge, delayed groundwater-level rise and specific yield in the Triassic karst aquifer of the Kopa Mountain, in the Western Carpathians, Slovakia. Hydrogeol. J. 2020, 29, 499–518. [Google Scholar] [CrossRef]
- Pendiuk, J.E.; Guarracino, L.; Reich, M.; Brunini, C.; Güntner, A. Estimating the specific yield of the Pampeano aquifer, Argentina, using superconducting gravimeter data. Hydrogeol. J. 2020, 28, 2303–2313. [Google Scholar] [CrossRef]
- Azizmohammadi, S.; Matthäi, S.K. Is the permeability of naturally fractured rocks scale dependent? Water Resour. Res. 2017, 53, 8041–8063. [Google Scholar] [CrossRef]
- Hamzehpour, H.; Khazaei, M. Effective Permeability of Heterogeneous Fractured Porous Media. Transp. Porous Media 2016, 113, 329–344. [Google Scholar] [CrossRef]
- Sedaghat, M.; Azizmohammadi, S.; Matthäi, S.K. Does the symmetry of absolute permeability influence relative permeability tensors in naturally fractured rocks? J. Pet. Explor. Prod. Technol. 2019, 10, 455–466. [Google Scholar] [CrossRef]
- Szewczyk, R. Generalization of the Model of Magnetoelastic Effect: 3D Mechanical Stress Dependence of Magnetic Permeability Tensor in Soft Magnetic Materials. Materials 2020, 13, 4070. [Google Scholar] [CrossRef]
- Elliot, T.R.; Reynolds, W.D.; Heck, R.J. Use of existing pore models and X-ray computed tomography to predict saturated soil hydraulic conductivity. Geoderma 2010, 156, 133–142. [Google Scholar] [CrossRef]
- Hong, B.; Li, X.A.; Wang, L.; Li, L.; Xue, Q.; Meng, J. Using the Effective Void Ratio and Specific Surface Area in the Kozeny–Carman Equation to Predict the Hydraulic Conductivity of Loess. Water 2019, 12, 24. [Google Scholar] [CrossRef]
- Liu, P.; Zhang, X.; Zhang, M.; Yang, X. Effect of Admixture on the Hydraulic Conductivity of Compacted Loess: A Case Study. Adv. Civ. Eng. 2020, 2020, 1–12. [Google Scholar] [CrossRef]
- Brzeźniak, Z.; Dhariwal, G.; Le Gia, Q.T. Stochastic Navier–Stokes Equations on a Thin Spherical Domain. Appl. Math. Optim. 2020, 84, 1971–2035. [Google Scholar] [CrossRef]
- Bear, J. Dynamics of Fluids in Porous Media; Elsevier: Amsterdam, The Netherlands, 1972; Volume 7, pp. 174–175. [Google Scholar]
- Zhang, X.; Lu, Y.; Li, X.; Lu, Y.; Pan, W. Microscopic structure changes of Malan loess after humidification in South Jingyang Plateau, China. Environ. Earth Sci. 2019, 78, 287. [Google Scholar] [CrossRef]
- Hu, W.; Liu, G.; Zhang, X. A pore-scale model for simulating water flow in unsaturated soil. Microfluid. Nanofluid. 2018, 22, 71. [Google Scholar] [CrossRef]
- Wildenschild, D.; Sheppard, A.P. X-ray imaging and analysis techniques for quantifying pore-scale structure and processes in subsurface porous medium systems. Adv. Water Resour. 2013, 51, 217–246. [Google Scholar] [CrossRef]
Figure 1.
Location map of the sampling sites. (a) is the location of the sampling site study area in China; (b) is the location of the sampling site in the Malan loess distribution area on the Loess Plateau.; (c) is the location of the sampling site on the Malan loess profile in Jiuzhoutai, Lanzhou; (d) is the sampling point located at Jiuzhoutai, Lanzhou.
Figure 2.
(a) is the 308th section of loess samples along Z-direction scanned by CT; (b) is the three-dimensional model of loess samples calibrated and then sliced.
Figure 2.
(a) is the 308th section of loess samples along Z-direction scanned by CT; (b) is the three-dimensional model of loess samples calibrated and then sliced.
Figure 3.
Bilateral filtering process images.
Figure 3.
Bilateral filtering process images.
Figure 4.
Specific yield measuring apparatus.
Figure 4.
Specific yield measuring apparatus.
Figure 5.
(a) is the starting state of the surface of the intact Malan loess sample, (b) is the surface state of intact Malan loess sample when the seepage process lasts 480 s, (c) is the state of the surface of the loess sample at the beginning of 489 s, (d) is the state of the surface of the loess sample at the beginning of 498 s, (e) is the state at the beginning of 545 s, (f) is the state of the surface of the loess sample at the beginning of 680 s of seepage.
Figure 6.
(a) is the process of threshold selection; (b) after the threshold segmentation, slice 308 along the Z-direction.
Figure 6.
(a) is the process of threshold selection; (b) after the threshold segmentation, slice 308 along the Z-direction.
Figure 7.
Three-dimensional model of pore structure of sample.
Figure 7.
Three-dimensional model of pore structure of sample.
Figure 8.
Coordinates of the center of gravity in the X-direction.
Figure 8.
Coordinates of the center of gravity in the X-direction.
Figure 9.
Coordinates of the center of gravity in the Y-direction.
Figure 9.
Coordinates of the center of gravity in the Y-direction.
Figure 10.
Coordinates of the center of gravity in the Z-direction.
Figure 10.
Coordinates of the center of gravity in the Z-direction.
Figure 11.
Determination of seepage model boundary.
Figure 11.
Determination of seepage model boundary.
Figure 12.
Seepage simulation model. (a) is the two-dimensional schematic diagram of the seepage simulation. (b)is the 3D model of the 3D seepage boundary.
Figure 12.
Seepage simulation model. (a) is the two-dimensional schematic diagram of the seepage simulation. (b)is the 3D model of the 3D seepage boundary.
Figure 13.
Seepage iterative process.
Figure 13.
Seepage iterative process.
Figure 14.
Seepage simulation results process (The green box is the simulation area).
Figure 14.
Seepage simulation results process (The green box is the simulation area).
Figure 15.
Iterative accuracy of the permeability coefficient tensor.
Figure 15.
Iterative accuracy of the permeability coefficient tensor.
Table 1.
Basic physical parameters of intact Malan loess.
Table 1.
Basic physical parameters of intact Malan loess.
Dry Density
(g/cm3) | Void Ratio | Clay (%)
(d < 5 μm) | Silt (%)
(5 < d < 50 μm) | Sand (%)
(d > 50 μm) | Liquid Limit | Plastic Limit | Plastic
Index | Permeability Coefficient K (cm/s) |
|---|
| 1.213 | 1.18 | 22.52 | 65.70 | 8.55 | 28.21% | 15.2% | 11.83% | 1.42 × 10⁻⁴ |
Table 2.
Sample specific yield calculation table.
Table 2.
Sample specific yield calculation table.
| Project | V4 (mL) | V1 (mL) | V0 (mL) | μ |
|---|
| Value | 836 | 735 | 1000 | 10.1% |
Table 3.
Absolute permeability tensor.
Table 3.
Absolute permeability tensor.
| kx (μm2) | ky (μm2) | kz (μm2) | Eigen Value |
|---|
| 0.284803 | −0.030083 | −0.124343 | 0.346743 |
| −0.029247 | 0.031562 | 0.025184 | 0.034523 |
| −0.123694 | 0.28359 | 0.07378 | 0.008879 |
| Disclaimer/Publisher’s Note: The statements, opinions and data contained in all publications are solely those of the individual author(s) and contributor(s) and not of MDPI and/or the editor(s). MDPI and/or the editor(s) disclaim responsibility for any injury to people or property resulting from any ideas, methods, instructions or products referred to in the content. |
© 2023 by the authors. Licensee MDPI, Basel, Switzerland. This article is an open access article distributed under the terms and conditions of the Creative Commons Attribution (CC BY) license (https://creativecommons.org/licenses/by/4.0/).


