Article

Control of the Ionic Composition of Nanofiltration Membrane Permeate to Improve Product Water Quality in Drinking Water Supply Applications

Department of Water Supply, Moscow State University of Civil Engineering, 26, Yaroslaskoye Highway, 129337 Moscow, Russia
*
Author to whom correspondence should be addressed.
Water 2023, 15(16), 2970; https://doi.org/10.3390/w15162970
Submission received: 21 July 2023 / Revised: 15 August 2023 / Accepted: 16 August 2023 / Published: 18 August 2023
(This article belongs to the Special Issue Membranes in Water and Wastewater Treatment)

Abstract

:
Reverse osmosis is efficiently used for producing drinking water from groundwater sources containing dissolved impurities, including fluoride, ammonia, lithium, strontium, boron, arsenic, etc. The principal problems of utilizing reverse osmosis include scaling on membrane surfaces, concentrate discharges, and low permeate TDS that often require conditioning. The main goal of this work was to demonstrate the viability of a newly developed methodology that relies on low-rejection nanofiltration membranes to improve product water quality by increasing its TDS and calcium content, and its economic efficiency compared to conventionally used reverse osmosis. Disadvantages of employing reverse osmosis for the production of drinking water are attributed to the fact that several pollutants (including lithium, ammonia, and boron) are monovalent ions and, as such, are poorly rejected by membranes as compared to calcium, sodium, sulfate, and chloride ions. Thus, in cases in which lithium or ammonia are present in high concentrations, high rejection membranes are usually used that result in low TDS of the product water. This article presents the results of research aimed at developing a new approach to changing the ratio of monovalent and divalent ions in product water. The new method described in this paper relies on low rejection membranes in a two-stage application that enables us to reduce monovalent impurities and increase the concentration of calcium and TDS values in product water while leaving lithium concentration unchanged. This is achieved by applying a two-stage scheme with low-rejection membranes instead of the reverse osmosis stage. The two-stage treatment using nanofiltration membranes results in the same rejection of lithium and product water quality as reverse osmosis. However, the ratio value of calcium and lithium concentrations in the concentrate of nanofiltration membranes appears to be significantly higher compared with the ratio measured in the feed groundwater. This can be attributed to different rejections of these ions by membranes. Therefore, concentration (reduction of volume) of the feed water with nanofiltration membranes and further dilution of the concentrate with deionized water produce the same concentration of lithium and are associated with an increase of 2–4 times the concentration of calcium. Treatment of this water in the second nanofiltration membrane stage produces drinking-quality water with the required lithium content and increased calcium concentration. We focus on the real-world example of groundwater treatment in Yakutia, Russia, an area where lithium concentration exceeds drinking standards by 24 times. The paper presents a technique of ion separation and demonstrates experimental results that provide lithium removal while increasing the calcium concentration and TDS value. The resulting concentrations are 2–5 times lower than those obtained via conventional use of reverse osmosis membranes. A series of experiments were conducted to remove lithium from groundwater and demonstrate the efficiency of the newly developed method of ion separation. Experimental results of the concentration of obtained values of lithium, calcium, and TDS in permeate and concentrate flows at each membrane stage demonstrate that they provide separation of monovalent and divalent ions and increase product water TDS without increasing lithium. This experimental approach increases calcium and TDS values in product water by 2–4 times compared with the use of reverse osmosis membranes. Calculations of operational costs for different options (the use of reverse osmosis, two-stage nanofiltration, and ion separation in a two-stage approach) are presented. These results confirm the economic advantage of nanofiltration membrane applications to remove lithium as compared to the use of high-rejection reverse osmosis membranes. The increase in product water TDS facilitates the further reduction of concentrate flow rate and operational costs. The economic comparison involved the calculation of the required membrane area and number of membrane elements at each stage, calcium carbonate scaling rates, reagent consumption to prevent scaling, and amounts of concentrate discharged into the sewer. Experimentally obtained results confirmed the feasibility of increasing the calcium concentration and TDS values in product water by 2–5 times while leaving the lithium concentration at the same level. Design characteristics to calculate operational costs for conventional and new options are calculated and demonstrate a sufficient (30–40%) reduction of operational costs compared to conventional use of reverse osmosis. The reduction in reagent consumption is attributed to the utilization of low-rejection nanofiltration membranes that have lower scaling propensities compared with reverse osmosis membranes and a smaller payment for concentrate discharge. The developed approach to using two-stage nanofiltration instead of single-stage reverse osmosis provides multiple advantages that include improved product water quality, lower concentrate consumption, and lower reagent consumption that are attributable to the use of low-rejection membranes. Different case studies are planned to demonstrate the efficiency of the proposed techniques to reduce ammonia, fluoride, and boron in drinking water.

1. Introduction: Main Problems of the Use of RO to Achieve Drinking Quality

Reverse osmosis is widely used today to produce quality drinking water from groundwater [1,2] and surface water sources [3,4]. The territory of the city of Moscow has increased after territories called “New Moscow” have joined. A number of groundwater intakes in the New Moscow region contain above conventionally high concentrations of calcium and iron; excessive amounts of fluoride, ammonia, lithium, strontium; and even boron that exceed World Health Organization (WHO) standards. To remove these impurities and improve drinking water quality, reverse osmosis facilities are currently used [5,6,7]. Despite the high efficiency of reverse osmosis to remove dissolved ionic pollutants, the use of this method for drinking water production seems ineffective. One of the main reasons is that reverse osmosis membranes provide high rejection of both monovalent ions (such as chloride, bicarbonate, and fluoride) and divalent ions (such as sulfate, calcium, and strontium). In the majority of cases, we face the situation when concentrations of ammonia or lithium in groundwater exceed regulation values only by 20–30 percent. In these cases, usually reverse osmosis is used to reduce all substances and total TDS by 95–96 percent. To increase drinking water TDS, the product water (reverse osmosis permeate) is mixed with the feed water. The mixing ratio depends on how much the concentration of the pollutant exceeds the required concentration in drinking water [5,7,8]. This approach can be reasonable only when pollutant concentrations exceed the required values by no more than three to four times. When this ratio value is higher, there is no reason for mixing, as all water should pass through membranes to remove the pollutant. The use of reverse osmosis to produce drinking-quality water from groundwater intakes has certain disadvantages. First, we remove hardness by 96–99 percent and, in a number of cases, should provide water conditioning by adding calcium ions. Second, treatment of groundwater with high hardness limits the recovery value as calcium-sparingly soluble salts are deposited in membrane channels [9,10,11]. In drinking water applications of reverse osmosis facilities, their recovery values significantly affect the cost of the product as well as the amount of operational costs. Concentrate is usually discharged into the sewer, and this increases the total cost of the water produced by the membrane facility. Third, the use of reverse osmosis membranes has a risk of scale formation, and their operation requires increased costs and measures to prevent scale formation [12,13].
As mentioned, nanofiltration membranes provide efficient removal of monovalent pollutants [5,6,7,8], especially in cases where concentrations of these pollutants should be reduced by three times or less [9,10,11]. Application of nanofiltration membranes not only provides efficient removal of monovalent pollutants but also reduces operational costs [14,15]. Moreover, it was reported that the application of an additional nanofiltration stage at the exit from a reverse osmosis facility can easily increase the recovery and significantly reduce the total cost of the supplied product water [1,2,6,7]. These results are attributed to the low-scaling propensities of nanofiltration membrane modules. Table 1 shows the composition of groundwater from the well in Yakutia and the results of its treatment with different types of membranes [1,2].
There are a lot of cases where certain monovalent pollutant concentrations (like lithium) can exceed WHO standards by 20–24 times [12,13]. Table 1 shows the groundwater composition in Yakutia. The lithium concentration is 0.48 milligrams per liter. This means that the lithium concentration should be reduced by 24 times to reach drinking water standards. 
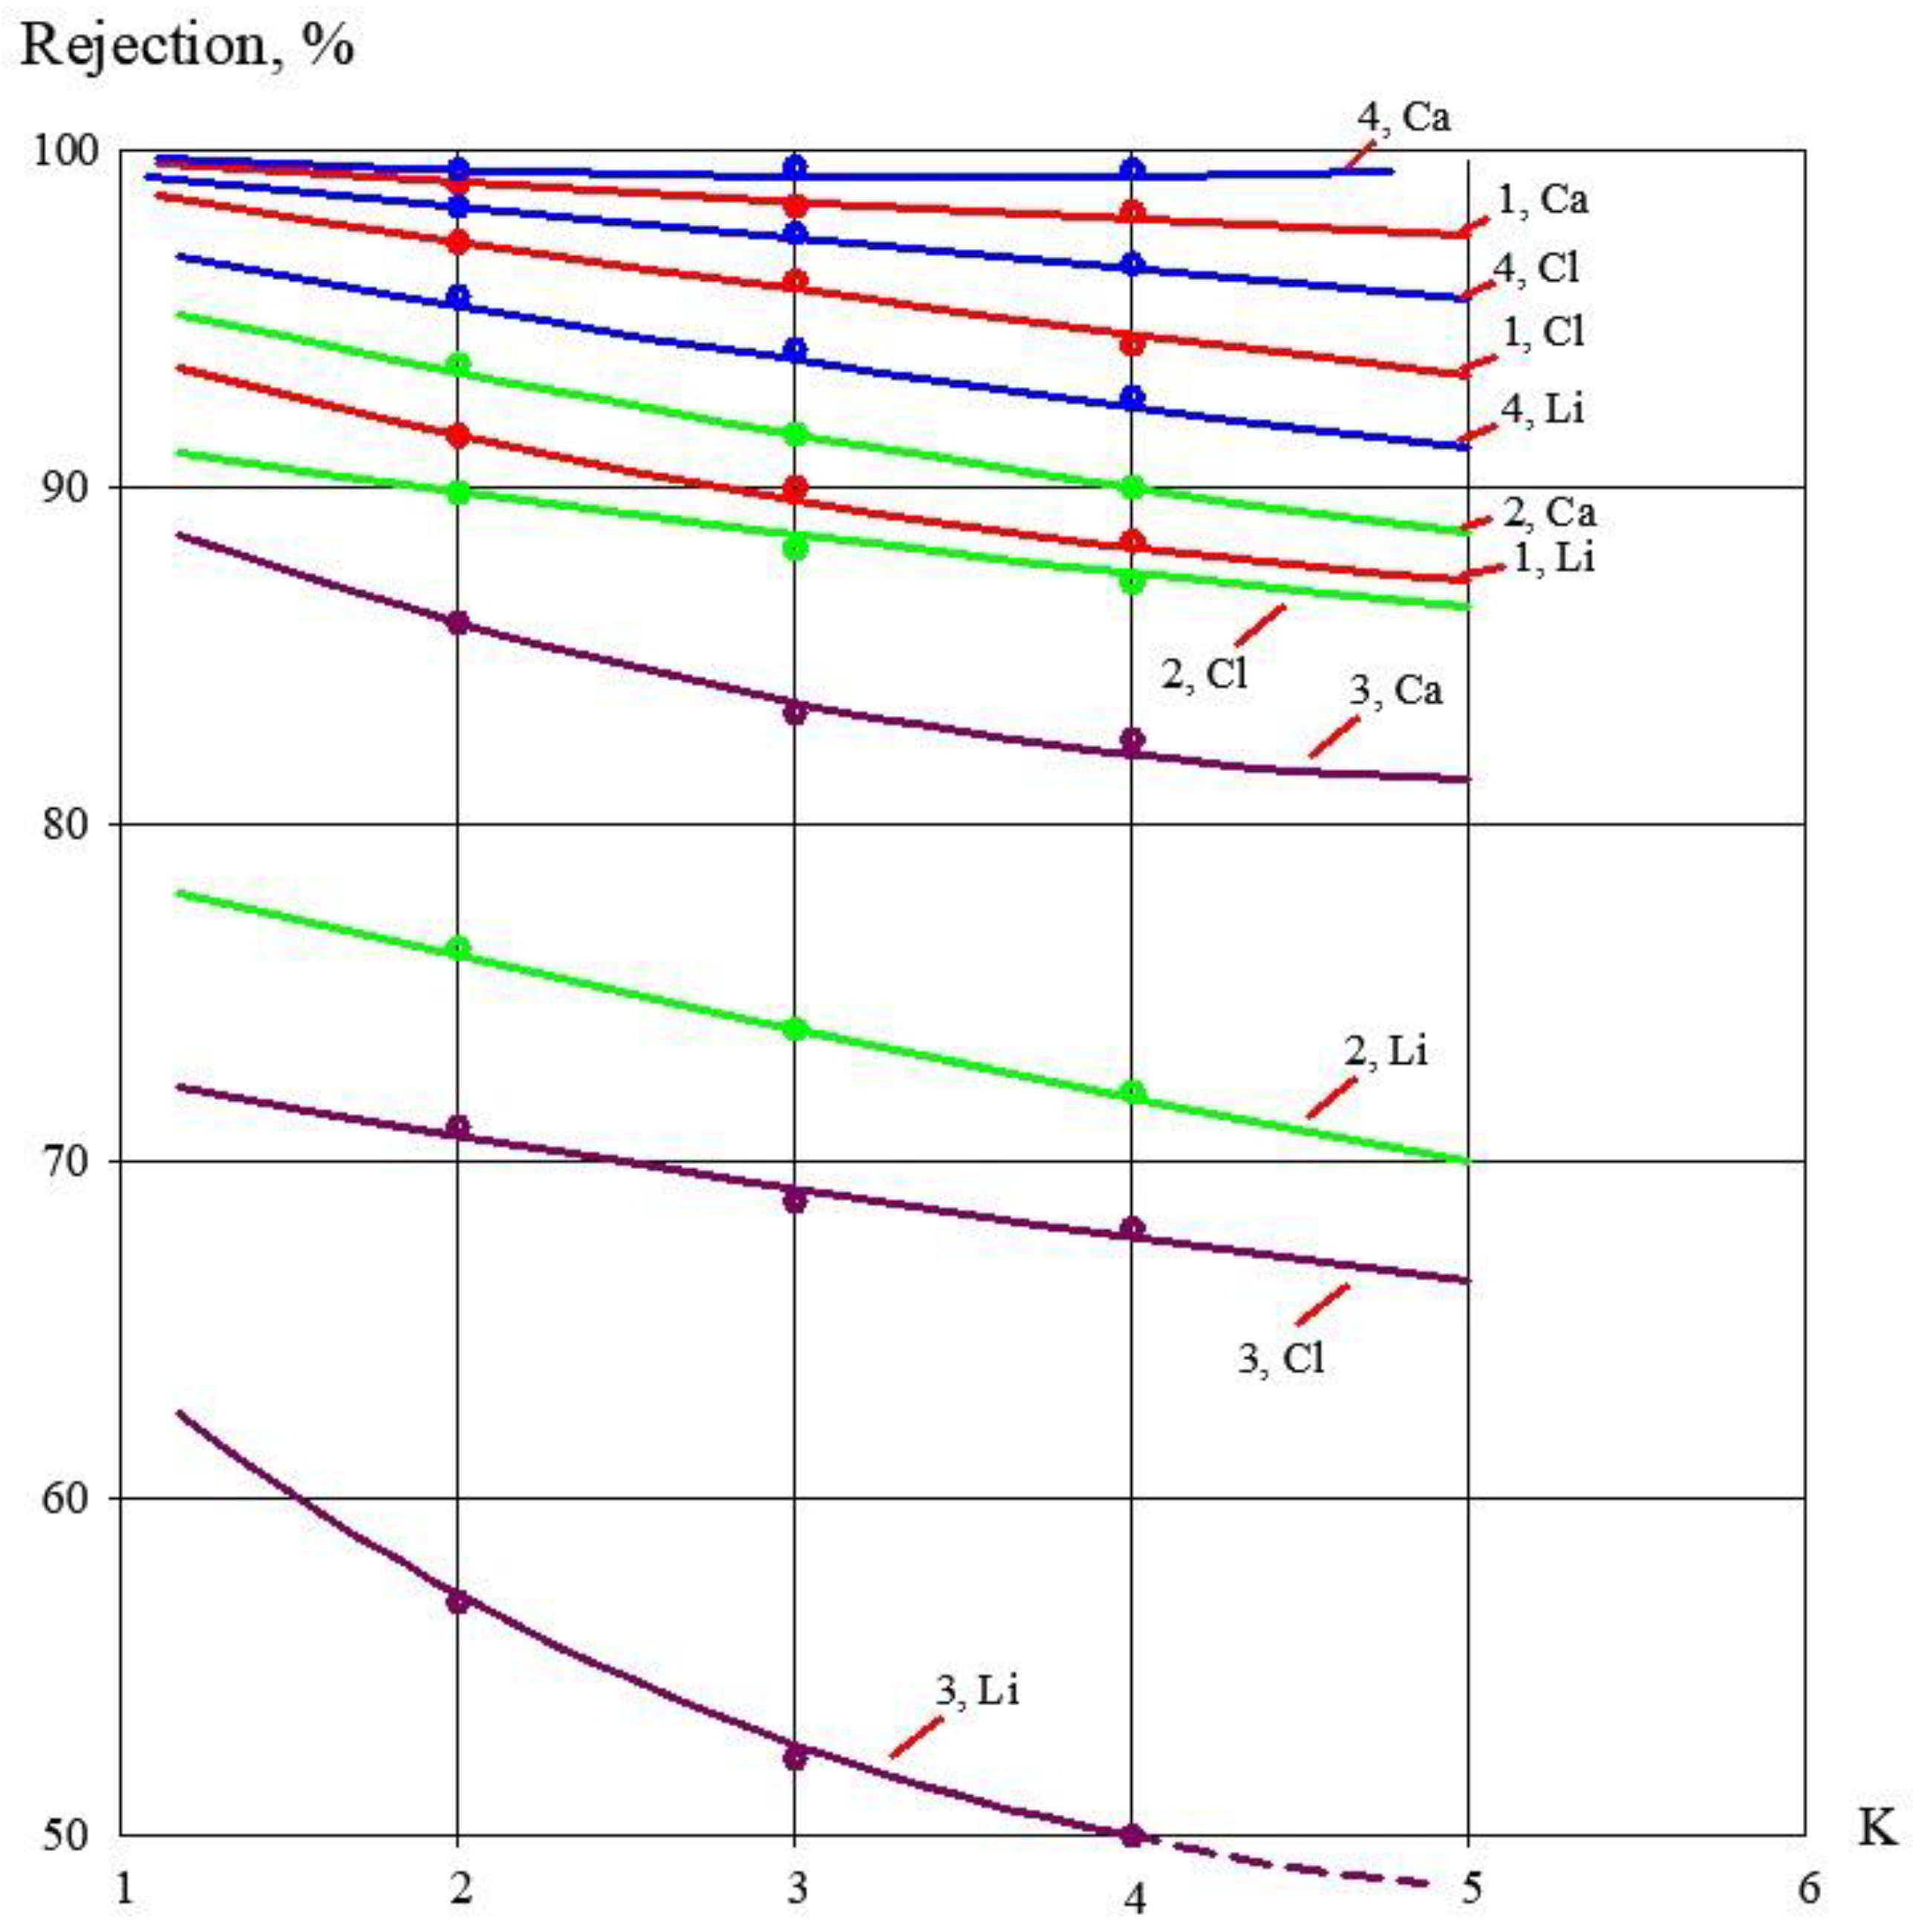
Table 1 shows the results of the treatment of groundwater using different membranes. Rejection values of different ions depending on the initial volume reduction coefficient K value, based on the already published results [14,15], are presented in Figure 1.
During experimental product conductance, we determined the relationships (dependencies) of concentrations of dissolved impurities on the value of the initial volume reduction coefficient K. The coefficient K value is the ratio of the feed water flow rate to the concentrate flow rate, Qf/Qc. This value also corresponds to the recovery that is defined as a ratio of permeate flow to feed water flow according to the equation:
Qp/Qf = 1 − 1/K
As can be seen, even the application of low-pressure BLN membranes does not guarantee efficient removal of lithium at pressures of 10–12 bars and a 70 recovery. High efficiency can be reached using BE high rejection medium pressure membranes. Meanwhile, the calcium concentration of the product water is less than 0.05 mg/L, and the TDS is about 5 ppm. These results are questionable as BE membranes require high pressure and therefore high power costs, and membrane product flux is significantly lower than that of BLN membranes. Additionally, we should mention high scaling rates and low recovery.
A lot of applications with RO are used to reject monovalent pollutants, such as ammonia and lithium [12,13]. Drinking water production also requires the reduction of monovalent ions in many cases [9,10,11]. Moreover, membranes are selected only owing to their ability to reject monovalent ions. As a result, when we reduce monovalent ions, we produce deionized water, which is not applicable for drinking. This article proposes a new approach to providing drinking water quality using the developed ion separation techniques based on different rejections of ions. This new technique is used together with other developed concentrate reduction techniques. Principles of concentrate reduction are based on the application of nanofiltration membranes [16,17,18] that are less susceptible to scaling [14,15]. Figure 2a shows a typical solution for groundwater treatment: using high rejection membranes with low values of recovery. This approach requires costs for chemicals and concentrate disposal [15,19,20].
All drawings presented in Figure 2 contain flow diagrams with flow and concentration values determined throughout the experiment test runs described below. To improve the situation, a reduction in concentration can be applied. Figure 2b demonstrates the concentrate reduction technique using a low rejection nanofiltration membrane on the second stage. The second-stage permeate is forwarded to the inlet of the first stage. This approach enables us to reduce concentrate flow by 5–10 times. This flow diagram provides a solution to the concentrate disposal problem. But the scaling problem and high operational costs to escape it are still not solved. Figure 2c demonstrates the solution to improving drinking water quality using low-pressure and low-rejection nanofiltration membranes. As discussed, the application of low rejection membranes reduces calcium carbonate scaling [15,19]. Nanofiltration membranes also provide higher flux at lower pressure values [21,22,23]. Thus, the use of the double-stage nanofiltration membranes provides the same quality of product water. Due to the high product flow rate, the double-stage scheme can use fewer membrane modules than the single-stage scheme. And the lower scaling propensities of nanofiltration membranes make this approach economically reasonable [20,24,25,26]. Concentrate flow reduction in this scheme is implemented using the additional nanofiltration stage to treat the first-stage concentrate. The second-stage concentrate is forwarded at the entrance to the first stage. The only concern is the low hardness and low TDS of the product water, which can require additional costs for conditioning. In the present article a new technique is studied: the possibility of increasing the TDS and hardness of product water using ion separation with nanofiltration membranes [1,15,27].
Figure 2a demonstrates a conventional approach to treating groundwater to reduce different dissolved impurities such as ammonia, strontium, fluoride, lithium, aluminum, titanium, nitrate, etc. Despite high rejection of impurities, this approach has two main, well-recognized disadvantages: scaling hazards and low recovery, which are attributed to high calcium content and an increase in scaling rate with an increase in recovery. There is another disadvantage of high rejection that is attributed to low TDS of product water, low hardness, and low fluoride: the lack of the physiologically necessary elements. The technological scheme shown in the Figure 2a is further named Option 1.
Figure 2b demonstrates the application of a new approach to reduce the concentrate of RO membrane facilities (Option 2). Concentrate is reduced due to the use of nanofiltration membranes with low salt rejection [2,27]. Low rejection of membranes ensures low scaling rates in nanofiltration membrane modules [2,15]. The permeate of the nanofiltration module does not correspond to drinking water quality requirements and, in its composition, approaches the feed water. Nanofiltration permeate is returned back to the inlet for the reverse osmosis membrane stage.
To avoid scaling problems and operational cost increases, we can use a double-stage membrane treatment scheme (Figure 2c). Two nanofiltration membrane stages are used to achieve the required lithium reduction (Table 1). The advantage of nanofiltration membrane applications is attributed to their lower scaling propensities compared to RO membranes. This enables us to exclude antiscalant dosing and reduce cleaning agent consumption [2].
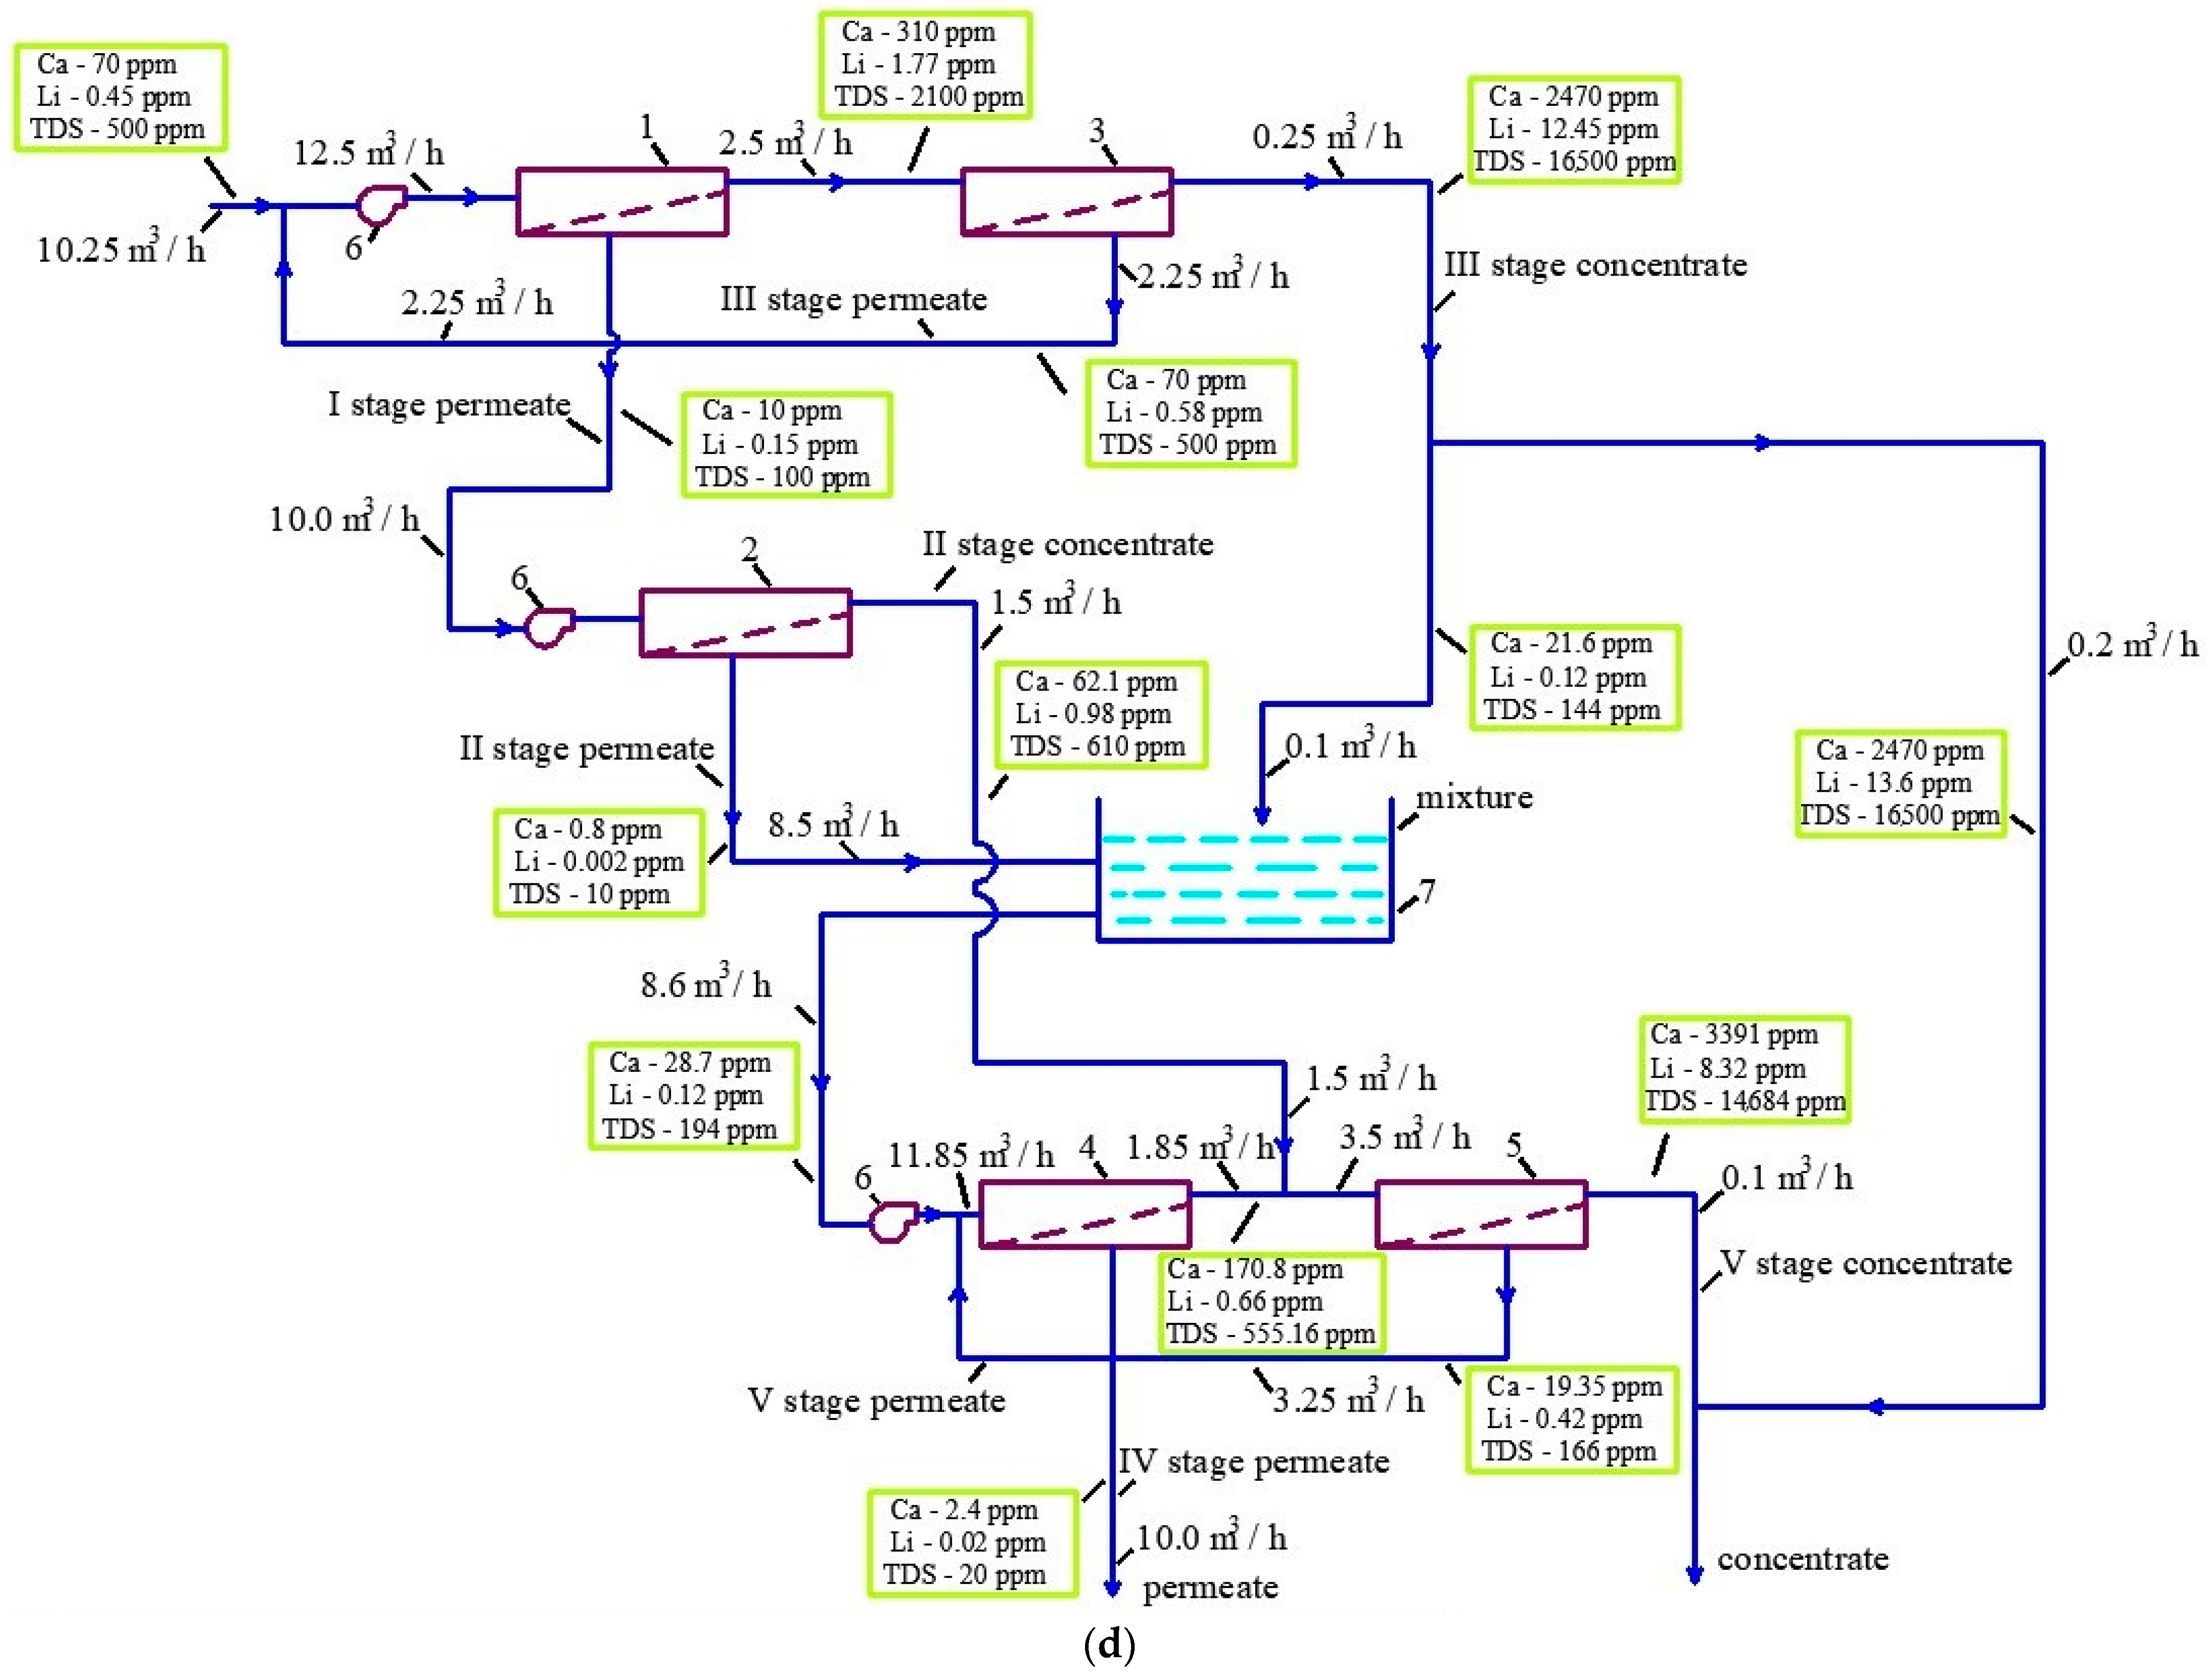
To overcome the disadvantage associated with low permeate TDS after lithium removal, a new method is developed that consists of the separation of monovalent and divalent ions. The first membrane stage uses membranes of the 70 NE model (Figure 2d) that reject only 66–70 percent of lithium or reduce lithium concentration by three times, as shown in Table 1. Thus, about 30–33 percent of lithium penetrates the product water of the first stage. This permeate enters the second stage, which is tailored by the 90 NE membrane that rejects 80–85 percent of lithium. Thus, the second membrane stage produces permeate with a lithium content reduced by 20–24 times as compared to the feed water. The second-stage permeate also has a low TDS value [2] and very low calcium content. To reduce concentrate flow, the third stage is furnished with 70 NE membranes, which are used after the first stage. As shown in Figure 2c,d, the third stage has high recovery and reduces concentrate flow by another five to eight times. As the 70 NE membrane has low rejection ability, the permeate of the third stage, by its quality, approaches the quality of the feed water (Figure 2d), and therefore it is directed to the entrance to the first stage and mixed with the feed water. Thus, we achieve high recovery values at the level of 0.96–0.97 during groundwater treatment. The use of nanofiltration membranes allows us to change the value of the ratio of monovalent and divalent ions in the concentrate depending on the recovery.
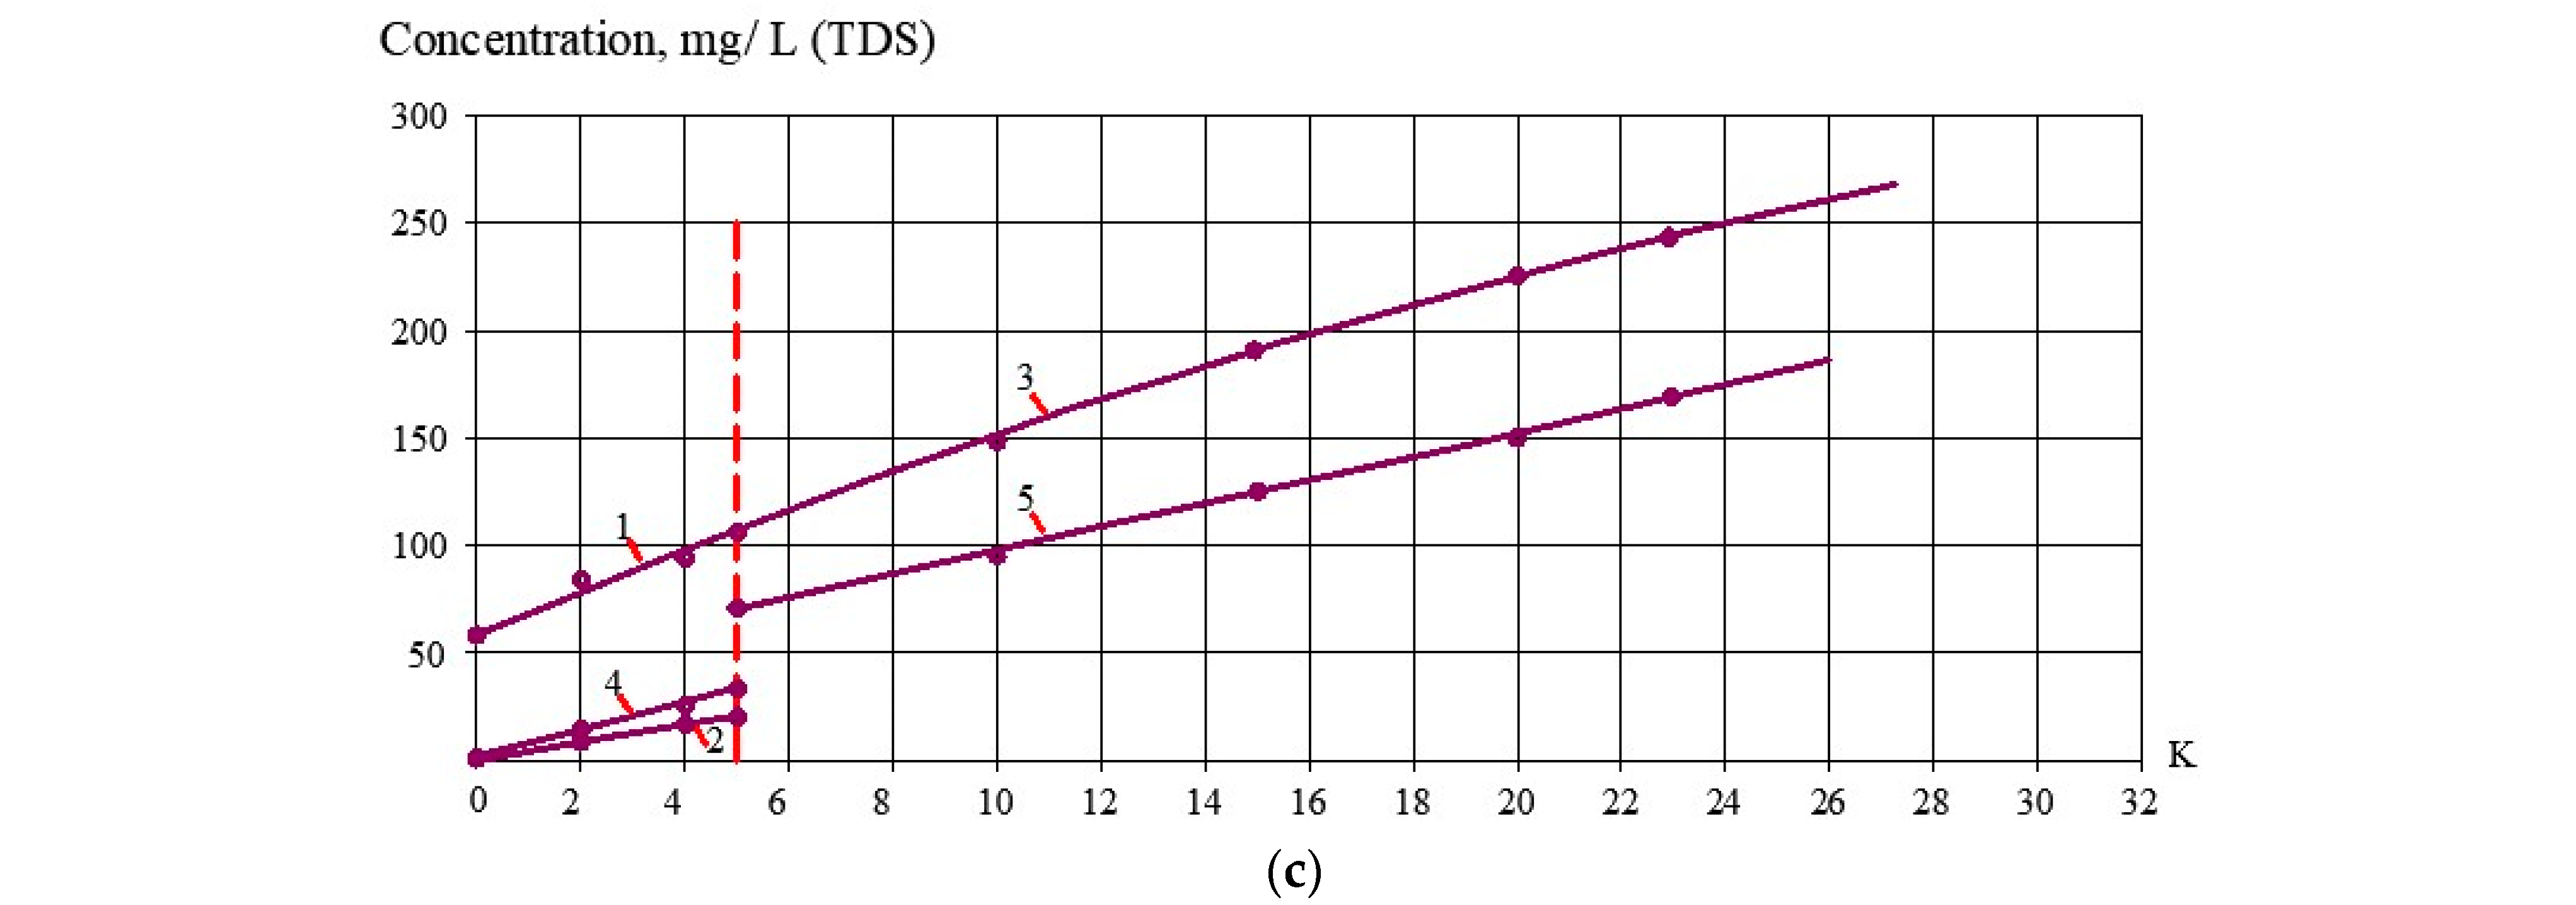
Figure 2d shows concentration values of calcium and lithium in permeate and concentrate at all stages of membrane treatment. Low-rejection nanofiltration membranes have larger pore sizes than reverse osmosis membranes and provide better rejection of divalent (large-sized) ions than smaller-sized monovalent ions (Table 1). Therefore, calcium ions penetrate less into the product water than lithium ions (Figure 2d). The third stage reduces the volume of concentrate that contains only 84–90 percent of the lithium that initially entered the first membrane stage. Therefore, calcium concentration in concentrate increases by a greater number of times than lithium concentration. Figure 2d shows concentration values of calcium, lithium, and TDS in permeate and concentrate predicted using material balance calculations based on the recoveries taken from Table 1 and Figure 1. As seen in Figure 2d, the calcium concentration in the third-stage concentrate increased by 36 times, while the lithium concentration only increased by 25 times. This effect we noticed formed the basis of our development to increase product water calcium content and TDS values, leaving lithium concentration at the same level. We can dilute the concentrate with distilled water and obtain a solution with the required lithium concentration value of 0.02 mg/L. This was achieved by dilution of the part of the third-stage concentrate by the second-stage permeate and further treatment of the mixture with nanofiltration. Considering that the second-stage permeate in its composition was similar to distilled water (Figure 2d), we mixed one volumetric part of the third-stage concentrate with 16 volumetric parts of the second-stage permeate. After dilution, the Alcuin concentration in the mixture increased by three times, and the TDS value increased by two times higher than in the first-stage permeate. This mixture was treated in the fourth stage using 90 NE nanofiltration membrane, and TDS as well as calcium concentration values increased in the fourth-stage permeate proportionally (Figure 2d).
To reduce the concentrate flow rate in all Options, a third stage is applied that uses low-rejection nanofiltration membranes. The permeate of this stage, by its quality, approaches the quality of the feed water and is forwarded to the inlet of the first stage (Options 2, 3, and 4). In options 3 and 4, the concentrate of the second stage is also concentrated by its ionic composition close to the feed water and is also mixed with the feed water at the entrance to stage 1 (Figure 2b,c). In Option 4, we did not direct the second-stage concentrate flow to the entrance of the scheme, as the main goal of this technological approach was to withdraw excessive lithium from the third-stage concentrate. The concentrate of the second stage is further mixed with the concentrate of the fourth stage and enters the fifth stage.

2. Experimental Procedure: Materials and Methods

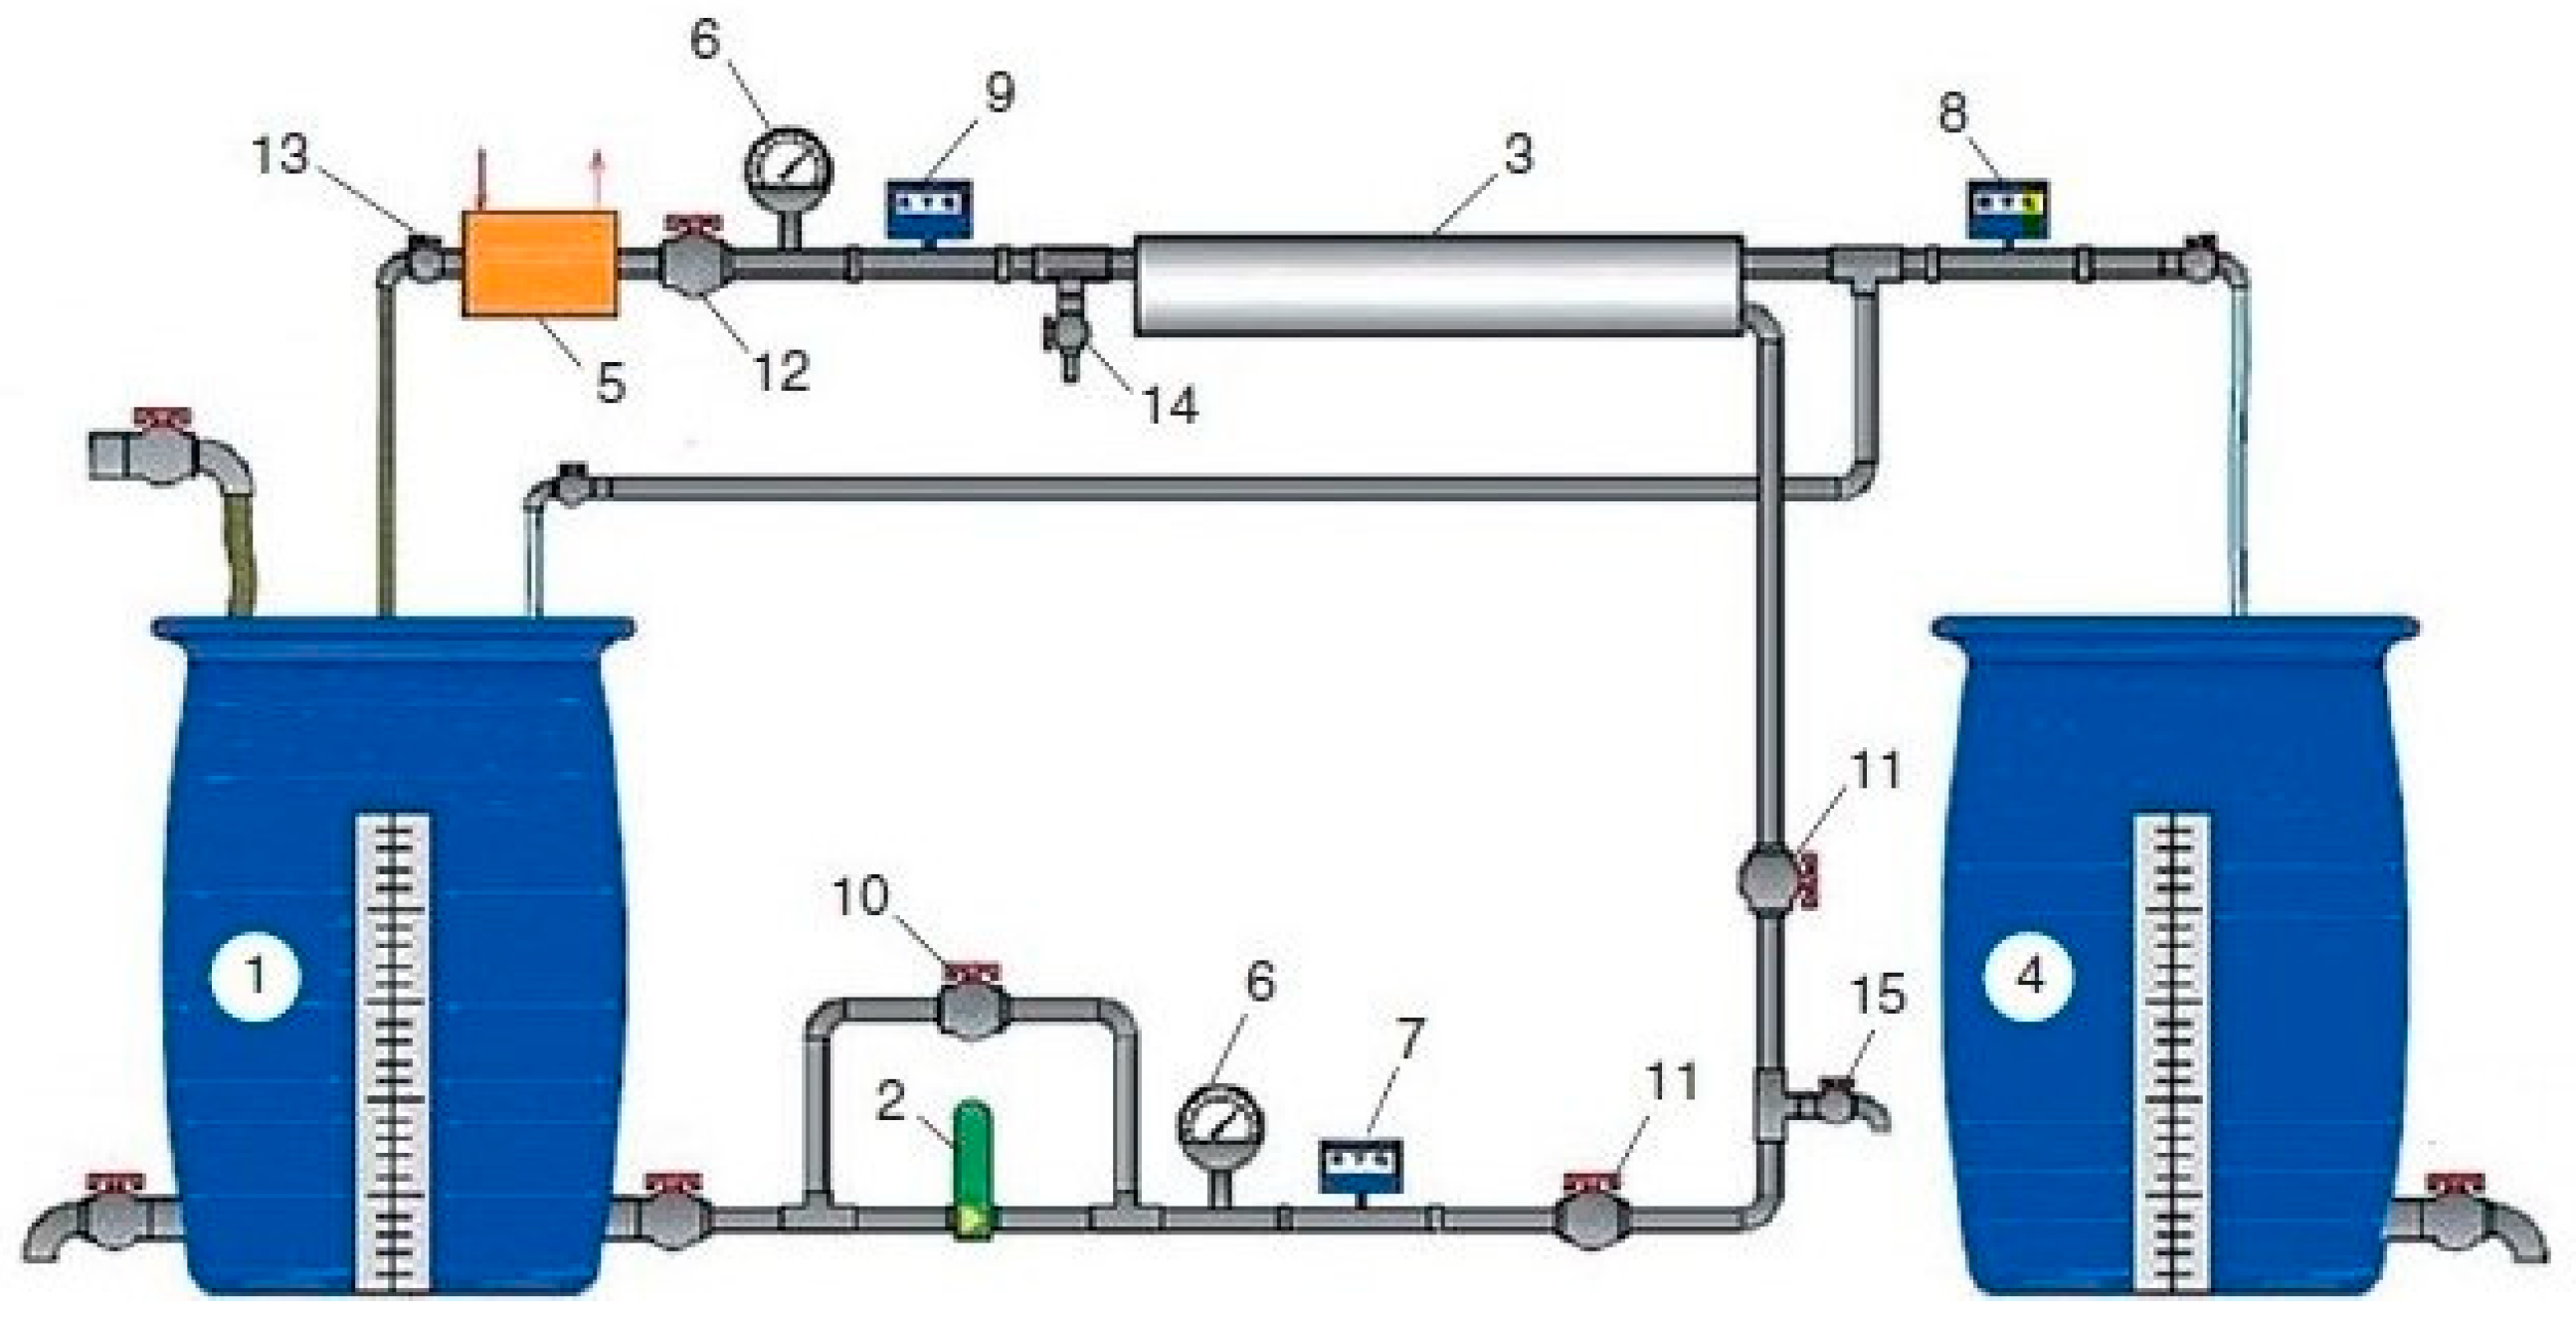
To perform the experiments, a 25 L sample was delivered. The experiment was aimed at obtaining the main technical parameters that correspond to the scheme shown in Figure 2d and the performance of test runs to reach the desired concentration ratio K values. Well water with the following composition was tested: calcium (ppm); alkalinity (ppm); lithium (ppm); chlorides (ppm); sulfate (ppm); TDS (ppm). The pH was 7.2.
A test unit flow diagram is shown in Figure 3. Nanofiltration membrane elements were tailored to 1812 standard with 70 NE and 90 NE membranes (developed by CSM Company, Seoul, Republic of Korea) and supplied by Raifil Company (Moscow, Russia). The test procedure consisted of the circulation of the feed water in the membrane module, the collection of permeate in a separate permeate tank, and the return of concentrate back to the feed water tank.
The volume of the feed water was 25 L. The experimental program consisted of five steps (stages):
  • In the first stage, feed water was treated using 90 NE membranes to achieve 80 percent recovery;
  • In the second stage, 90 NE concentrate was further treated with 70 NE membranes to reduce the concentrate value by 5–6 times to reach a concentrate volume of 1 L;
  • In the third stage, the collected first-stage permeate (18 L) was treated by 70 NE membranes to reach 80–85 percent recovery and the desired value of lithium concentration (0.02 mg/L);
Concentrations of calcium, lithium, and TDS in concentrate and permeate were evaluated throughout all test runs. The final stages of the experimental program included:
  • In the fourth stage, we mixed the second-stage permeate of 70 NE membranes with the third-stage concentrate obtained using 70 NE membranes in the second stage of the experiment and determined the concentration values of calcium and lithium as well as the TDS value;
  • In the fifth stage, the mixture was again treated by 70 NE membranes to produce a product of water and concentrate, achieving 80 percent recovery. Membrane spiral wound modules (models 1812-70 NE with nanofiltration membranes and 1812-BLN with reverse osmosis low pressure membranes) were supplied by Toray Advanced Materials Korea Inc. (the manufacturer of CSM Membrane Technologies, Seoul company CSM, Seoul, Republic of Korea). The membrane area in spiral wound elements was equal to 0.5 square meters.
Permeate and concentrate samples were withdrawn from tanks 1 and 2. Calcium, chloride, and lithium concentrations, as well as pH and TDS values, were determined. Calcium and magnesium concentrations were determined by titration. Sulfate ion concentrations were determined using the turbidimetric method. Sodium ion concentrations were evaluated using the atomic adsorption method. Lithium was determined by the atomic-emission analysis method using an atomic adsorption spectrophotometer operated in emission mode. Electric conductivity, TDS, and temperature values were determined using the electrical conductivity meter (model Cond.730, WNW “Inolab-Akvilon”, Moscow, Russia). pH values were determined using the laboratory pH meter HI 2215 (Hanna Instruments, Vohringen, Germany).
In experiments, the authors aimed to demonstrate the possibility of controlling product water quality and increase the TDS and calcium concentrations while leaving the lithium concentration at the same level. This method is described as Option 4 (Figure 2d). Experiments were performed to demonstrate the values of all parameters (permeate and concentrate) on each membrane stage. The volume of the water sample was 25 L. The chemical composition of the feed water is presented in Table 1. The main problem that prevents the use of water for drinking purposes is its high lithium content, which exceeds drinking quality standards by 24 times (Table 1). Treatment of natural water is performed using spiral wound elements of 1812 standard tailored with 70 NE and 90 NE membranes. Membrane 1812 measures 2 inches (4 cm in diameter and 30 cm in length). Membrane elements were loaded into pressure vessels. Each test run simulated the conditions of each membrane stage. Stage 1 (Figure 2d) used a membrane module with 90 NE membranes. The choice of the 90 NE membrane model is explained by the relatively high rejection value required to reduce lithium concentration by 6–8 times (Table 1), as the application of 70 NE membranes on both stages cannot ensure a reduction of lithium concentration by 24 times. In the first stage, the recovery value reached 0.8, which corresponds to the initial volume reduction coefficient K value of 5. In the test run, the initial volume of water sample in feed water tank 1 (Figure 3) was reduced by 5 times, from 25 to 5 L. The permeate volume produced by the module with 90 NE membranes (20 L) was collected in tank 4 (Figure 3). After that, the membrane module with 90 NE was disconnected, and then the module with 70 NE membrane was attached using thin 6 mm plastic tubes. The small size of the pressure vessel and use of 6 mm plastic tubes connected with John Guest fittings simplify the procedure of attaching tubes. The next test run simulated the third stage (Figure 2d) when the concentrate flow of the first stage was reduced by 5 times and the coefficient K value was reduced from 5 to 25. During this test run, the volume of concentrate in tank 1 (Figure 3) was reduced from 5 L to 1 L. The second-stage operation was experimentally demonstrated by the treatment of the collected permeate of the first stage using a 70 NE membrane. The volume of 20 L was reduced by 5 times, leaving 4 L of concentrate. According to Option 4 (Figure 2d), the second-stage permeate and the third-stage concentrate are mixed and treated in the fourth stage using a 70 NE membrane. At the fourth stage, the volume of the mixture equal to 17 L (16 L of the second-stage permeate plus one liter of the third-stage concentrate) was reduced by 5 times (K = 5). Permeate from the second stage (11.6 L) was collected in tank 4 (Figure 3). The fifth stage was performed to further reduce the fourth-stage concentrate left in tank 1 (Figure 3) after the test run using the same 70 NE membrane. Concentrate during the fifth stage of treatment was reduced by 12 times. Permeate from the fifth stage was collected in a separate tank.
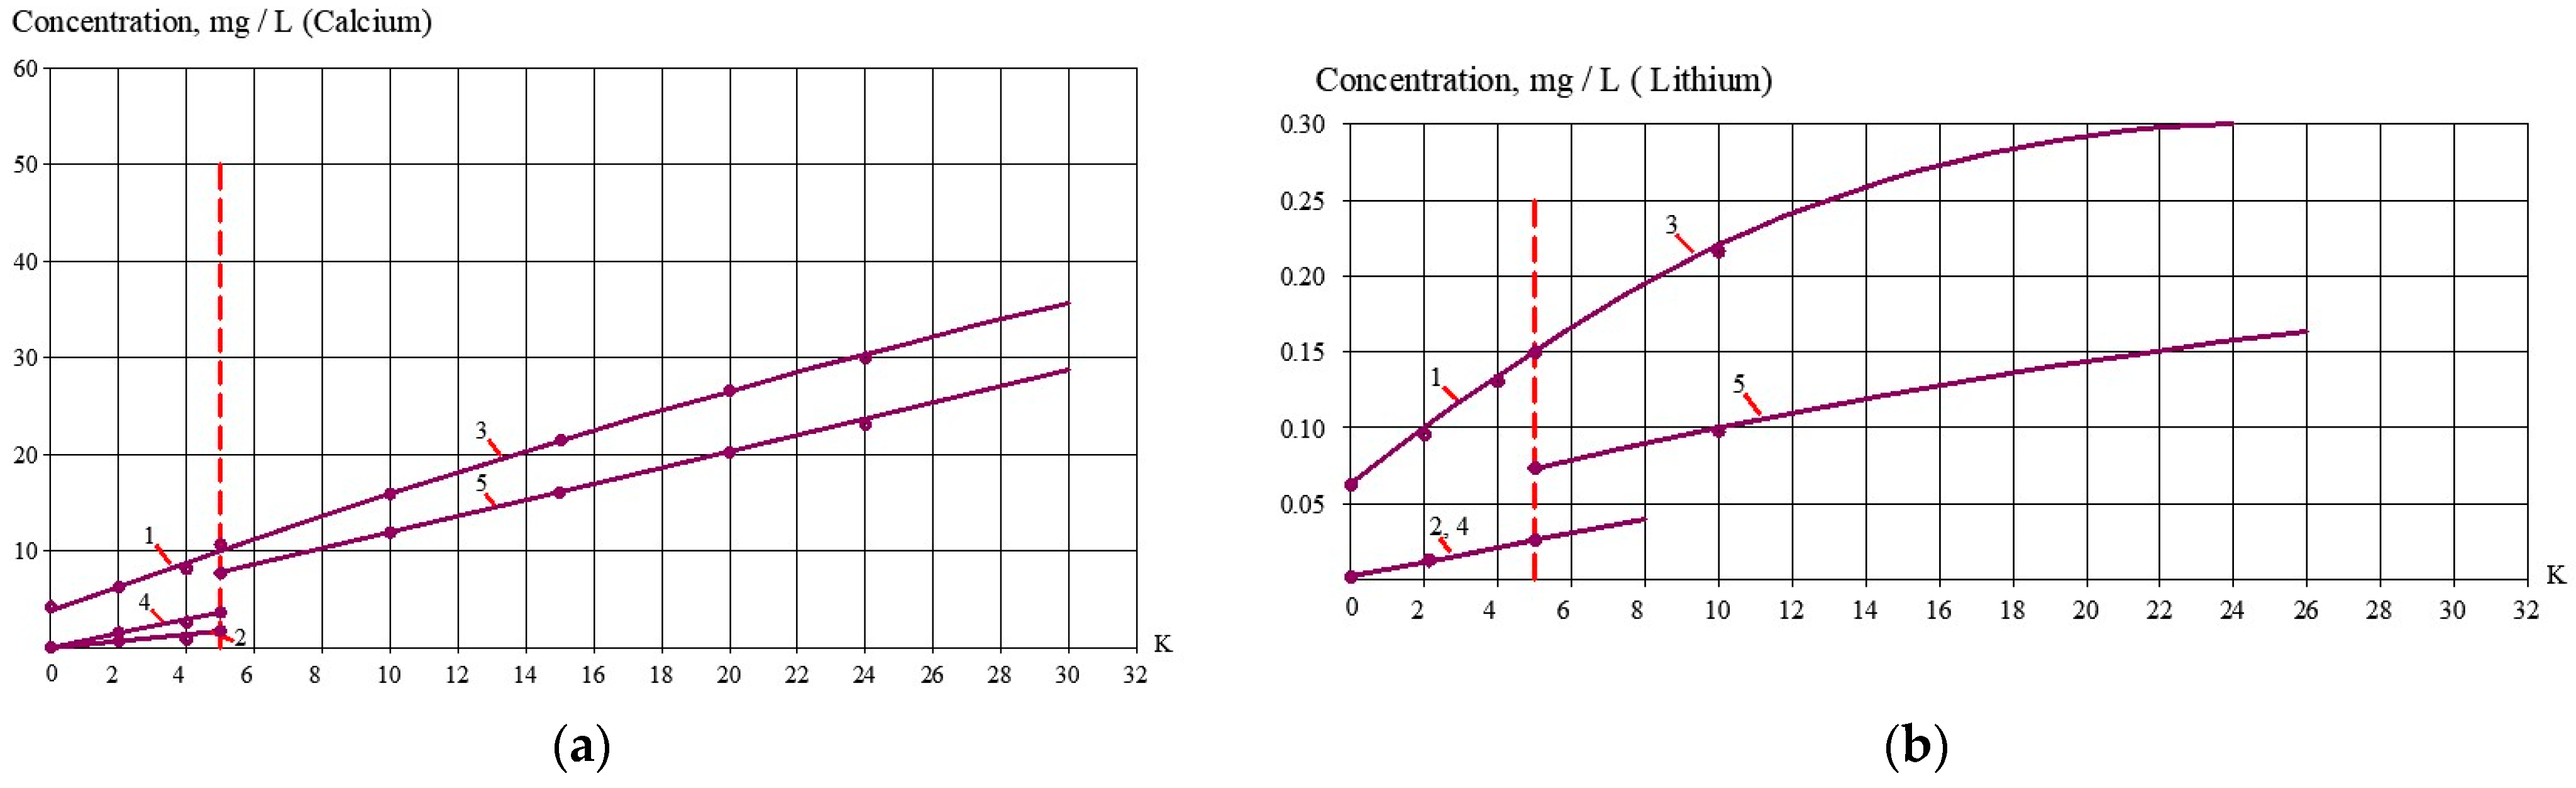
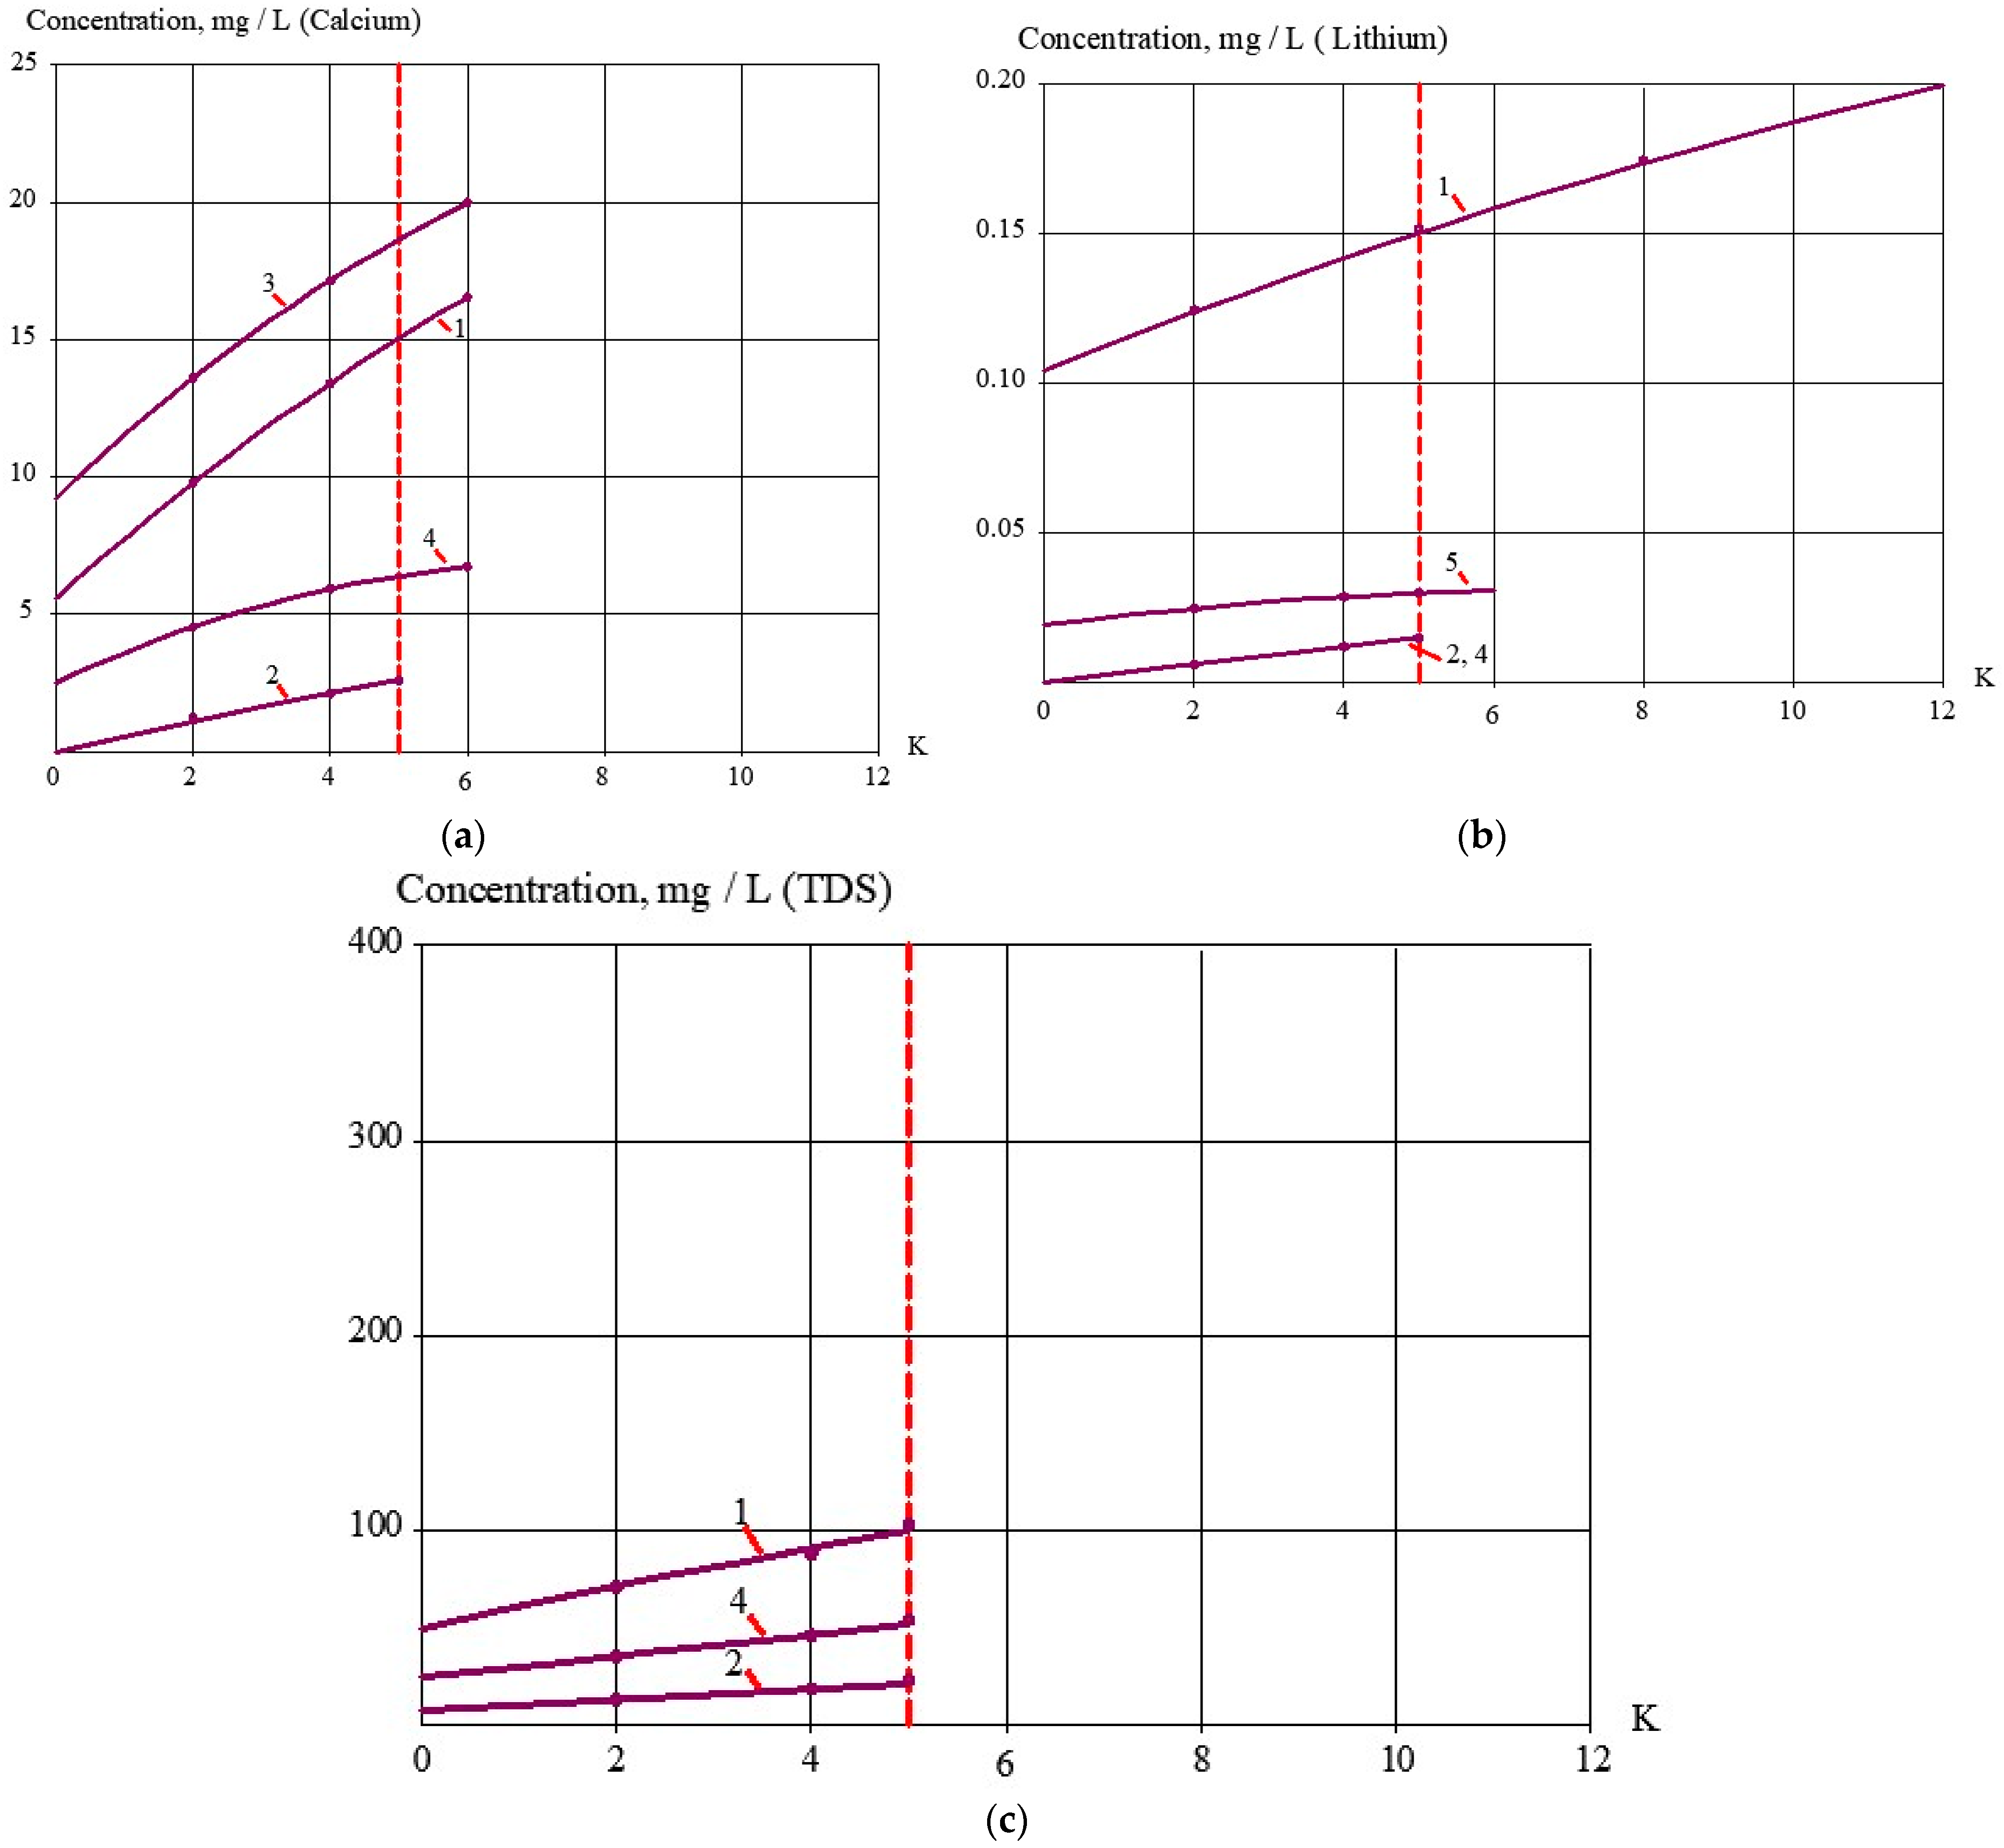
Figure 4 shows the dependencies of Ca, Li, and Cl concentrations in concentrate in the first stage and third stage as functions of K. Figure 5 shows the concentrations of these ions in the product on the second stage as dependencies on K. We used 70 NE membranes on the first stage and 90 NE membranes on the second stage. After we produced permeate in the second stage, we implemented mixing with the concentrate produced in the third stage. After mixing, we get water with a calcium concentration of ppm, a lithium concentration of ppm, and a TDS value of ppm. The results of the treatment of the mixture of the second-stage permeate with the third-stage concentrate are presented in 
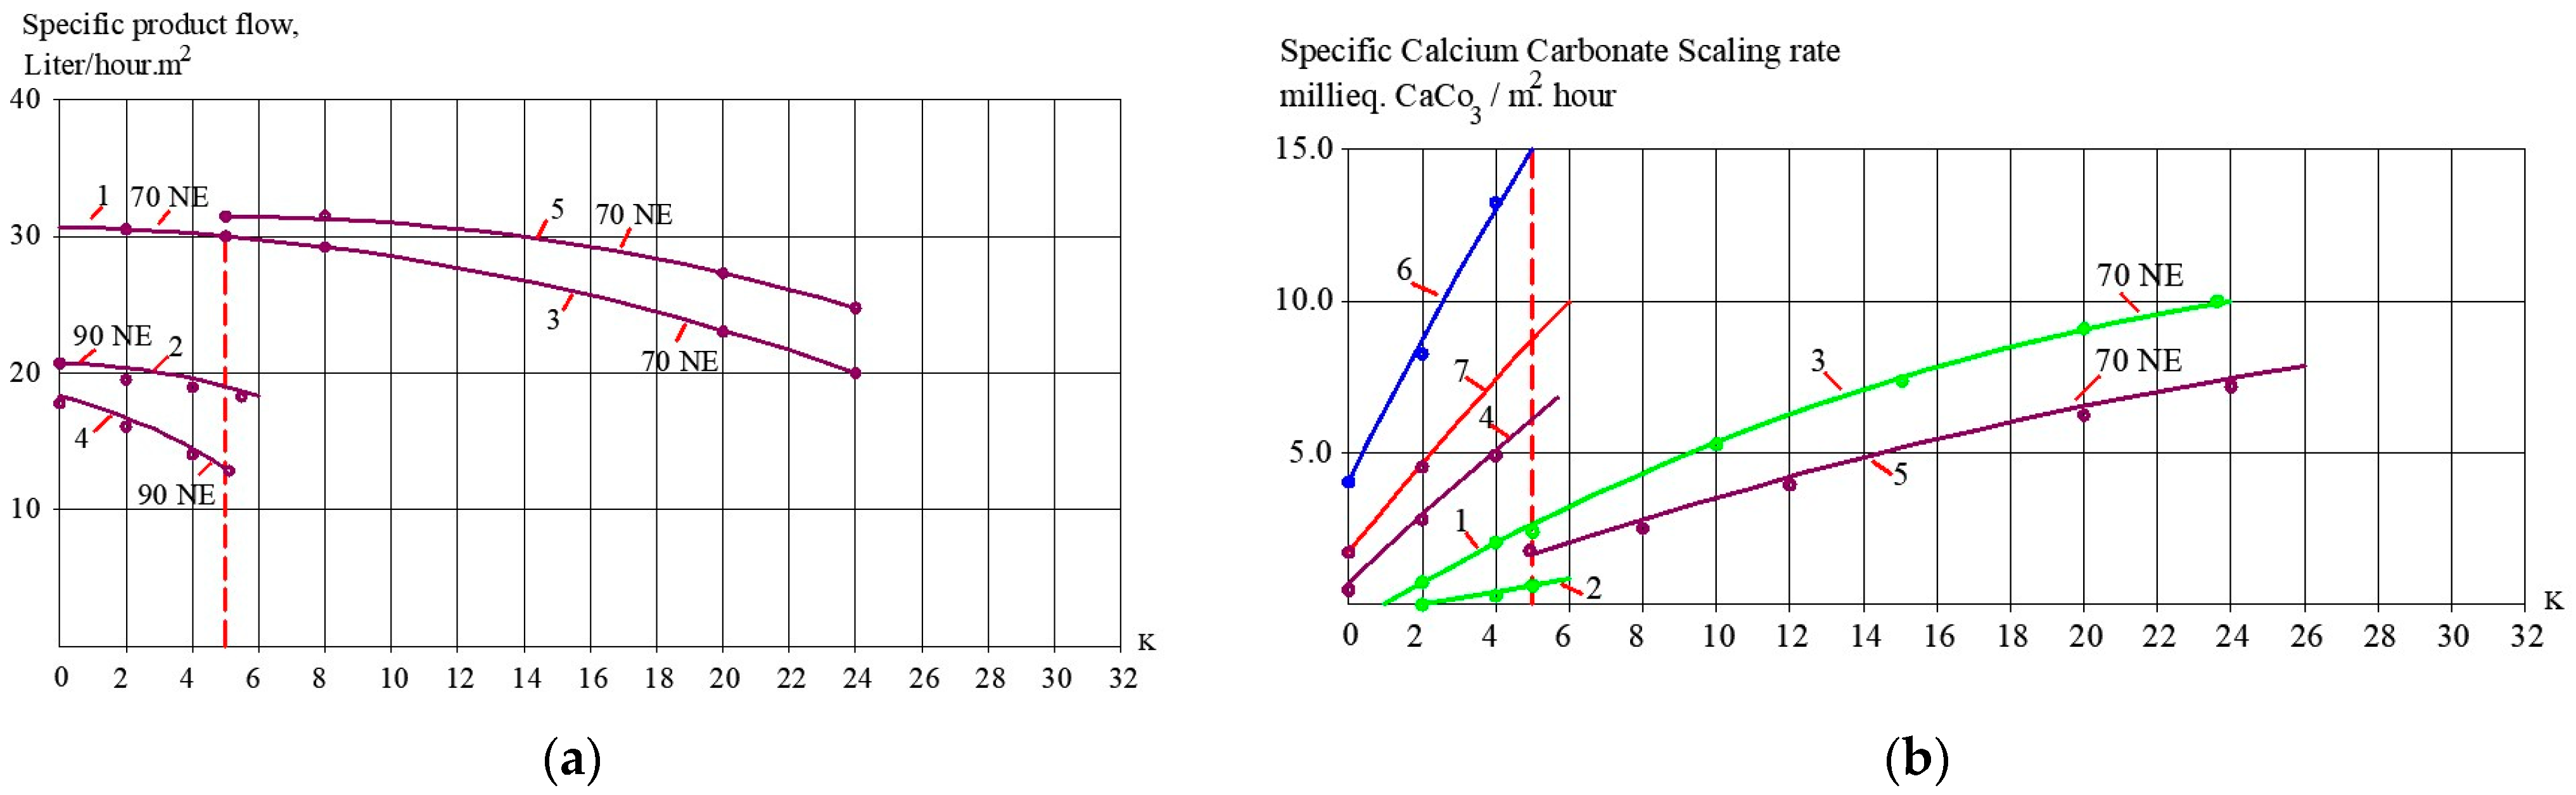
Figure 6. During the experiment, conductance and product flow rate were constantly measured to detect membrane flux reduction during the feed water concentration increase. Also, calcium concentrations were measured to calculate calcium carbonate growth rates in membrane modules during constant recovery increases. Results of membrane-specific product rate reduction and calcium carbonate scale increase with coefficient K value growth are demonstrated in Figure 7a,b. Calcium carbonate deposition rates were determined using mass balance techniques described earlier [2]. The techniques are based on the determination of derivatives of the function of the amount of deposited calcium over time.

3. Experimental Results

In our experiments, we determined the main technical characteristics of each membrane stage. At the first stage, we used 70 NE low-rejection membranes and reduced the initial volume by five times. The results of calcium, lithium, and TDS evaluation in concentrate and permeate are presented in Figure 4 and Figure 5. After we reached an initial volume reduction coefficient K value of 5, we reduced the concentrate volume by another five times during the next experimental simulation of the operation of the third stage. The same 70 NE membrane element was used, and the water volume in tank 1 (Figure 3) was reduced from 5 L to 1 L. Concentration values of calcium and lithium, as well as TDS values in the concentrate and permeate of the third stage, are presented in Figure 4 and Figure 5. It is noteworthy that the ratio of calcium and lithium concentrations in concentrate has increased compared with their ratio in the feed water. The calcium concentration increased by 14.5 times, and lithium concentration only increased by 10.1 times. This is due to different rejections of calcium and lithium ions by 70 NE membranes. In the second stage, we treated the first-stage permeate with a 90 NE membrane and reached the required level of lithium concentration in drinking water (0.02 mg/L). Due to higher membrane rejection of divalent ions, the concentration of calcium in the second-stage permeate was equal to 0.8 mg/L, and the concentration of lithium was equal to 0.02 mg/L. The increase in the ion ratio in the third stage concentrate we noticed suggested a solution to the problem of ionic composition control. The third-stage concentrate could be again diluted to produce feed water for stage 2, which contained the same amount of lithium and an increased amount of calcium. The second-stage permeate had a low TDS that is similar to distilled water’s TDS and could be used for dilution. To reduce the lithium concentration from 6 mg/L (in the third-stage concentrate) to 0.15 mg/L (in the first-stage permeate), we have to dilute the concentrate volume by 40 times: 6.0:0.15 = 40. This means that one part of the concentrate should be mixed with 39 parts of distilled water (or the second-stage permeate). As the second-stage permeate volume in our experiments was 16 L (20 L of the first stage permeate was reduced by five times on the second stage, having produced 16 L of the second-stage permeate), the volume of concentrate to be diluted was determined as 16:40 = 0.4 L. Thus, we took 400 mL of concentrate and added it to 16 L of the second-stage permeate. After mixing, the lithium concentration in the mixture was determined as follows: 6 mg/L multiplied by 0.4 L and divided by 16.4 L yields a lithium concentrate value of 0.14 mg/L. The concentration of calcium was determined in a similar way, and a value of 24.3 mg/L was obtained. Similarly, the TDS value in the mixture was determined, and a value of 219.5 mg/L was obtained. This obtained solution was treated in the fourth stage using a 70 NE membrane to produce drinking water. The volume of permeate was 12 L by the end of the test run, and the volume of concentrate was 3 L. At the fifth stage, the concentrate volume was treated with 70 NE and reduced by four times to reach a volume of 0.7 L, which is the minimum possible quantity for this experimental setup.
Figure 7a describes the reduction in product flow as a function of K. Figure 7b shows the results of scaling rate evaluation with and without the antiscalant addition.

4. Discussion

Treatment of feed water with nanofiltration membranes (Figure 4 and Figure 5) using two stages of concentrate reduction provides an increase in calcium ion concentration only by 40 times and a 50-fold increase in TDS value despite the 99% recovery.
The second-stage membrane quality provides a reduction of lithium of 27–30 times (96.5–96.7% rejection) to provide permeate quality similar to that achieved by the use of reverse osmosis BE membranes. The mixing of the second-stage permeate and third-stage concentrate provides water with higher TDS and calcium concentration values than the first-stage permeate (Scheme shown in Figure 2d).
Figure 6 shows the results of the mix-blend treatment with 70 NE membranes. As shown in Figure 6, the calcium concentration in permeate increased by six times as compared with the second-stage permeate, and the TDS value increased by five times. When the permeate flow value reached 1000 L per hour and concentrate flow value reached 10 L per hour (a 100 times reduction), the concentrate TDS value reached 50 g per liter, which is substantially lower than what Schemes 1–3 shown in Figure 2a–c can reach.
A comparison of water treatment schemes is performed, and the results are shown in Table 2. The main operational characteristics of the discussed technological schemes are determined using the data presented in Figure 7.
To provide an economical comparison of the technological schemes (Options), the authors evaluated the technical and operational parameters of the water treatment plant with a 10 cubic meter per hour capacity. The technical parameters were: number of membrane modules 8040 and membrane replacement costs; recovery; electric power consumption; reagent consumption (antiscalant and cleaning chemicals). Also, the required costs for water conditioning (lime addition to increase hardness) were accounted for, as were the costs to discharge concentrate into the sewer.
The required membrane surface area was evaluated using the average specific membrane product flow rate for each stage, assuming the permeate flow amount produced by each stage during one hour. For Options 3 and 4 (Figure 2c,d), the average specific flow rate was liters (Figure 7a) and the flow rate was 10 and 12 cubic meters per hour, respectively. Thus, the membrane area for Options 1 and 2 at the first stage was 650 square meters, and for Options 3 and 4, 280 square meters. Assuming the membrane area in an 8040 standard element is 40 square meters, the number of elements in Option 3 is 17 and in Option 4 23. A similar number of elements is required for stage 3 in Options 3 and 4 as well as for stage 2. The number of elements on stage 4 in Option 4 was calculated similarly to stage 2, assuming that feed water TDS is higher and membrane-specific product flow average value is lower (Figure 7, curve 4). As is shown in Table 2, the required number of 8040 membrane elements to achieve the required recovery equal to 0.95 is 17 for Option 3 and 23 for Option 4. In Option 2, this number is higher and equals 20.
The data presented in Table 2 confirms the efficiency of nanofiltration membranes application in a double-stage scheme to reduce lithium or another monovalent impurity from groundwater. The advantage is demonstrated by the calculation of annual operational costs for Options 1, 2, 3, and 4, shown in Figure 2. In our calculations, we accepted that the average price of an 8040 standard membrane element is 500 USD, cost of antiscalant and cleaning chemicals (EDTA) is 10,000 USD per ton, cost of lime is 500 USD per ton, cost of one kilowatt of energy is 0.05 USD, and cost of discharge of one cubic meter of concentrate into the sewer is 0.2 USD.
The application of RO membranes causes scaling problems that require antiscalant dosing and cleaning. RO requires a pressure of 16 bars. Nanofiltration membranes require 10–12 bars, thus requiring lower power costs. To evaluate the cleaning costs, we used the developed recommendations [2] based on the results of research [15]. Nanofiltration membranes of the 70 NE model exhibit low scaling rates, which allows operators to refrain from antiscalant dosing [2] and reduce their consumption of cleaning chemicals.
As can be seen in Table 2, the application of additional ion separation provides better product water quality. Also, a substantial reduction in operational costs can be achieved due to savings in power and reagent consumption (lime, antiscalant, and cleaning chemicals).

5. Conclusions

In many cases (such as the removal of poorly rejected monovalent pollutants like ammonia, fluoride, and lithium), the use of a reverse osmosis membrane to remove these impurities provides very low product water TDS. Also, this approach has other disadvantages, such as a high operational cost to prevent the formation of sparingly soluble salt deposition on membranes and, as a result, low recoveries that usually do not exceed 0.7–0.75. The new approach is developed and proposed to reduce scaling, increase recovery, and improve product water quality. A flow diagram of conventional and new processes is presented. The method is based on the use of nanofiltration membranes with low rejection characteristics. To achieve the required product quality, different membranes were used in two stages.
Calculations of operational costs included evaluation of antiscalant consumption costs, cleaning solution costs, power consumption costs, membrane replacement costs, and concentrate discharge. Results of the experiments are presented that demonstrate comparisons of scaling rate values in modules tailored with different membranes. Reverse osmosis membranes have higher scaling propensities and therefore generally do not enable us to achieve high recovery. Application of nanofiltration membranes for groundwater treatment provides higher recovery values due to lower scaling. For the same reason, application of nanofiltration in two stages can achieve the same rejection of lithium but with less danger of scale formation. The double-stage exhibits lower membrane replacement costs as nanofiltration membranes produce three times as much permeate as reverse osmosis membranes. The double-stage application also does not increase membrane costs but radically reduces costs for reagent consumption. The application of a new method of ion separation adds another membrane stage to the scheme but does not increase reagent consumption or concentrate discharge and demonstrates significantly lower operation costs than the use of reverse osmosis.

Author Contributions

Conceptualization, A.P. and D.S.; methodology, A.P.; software, D.S.; validation, A.P. and D.S.; formal analysis, A.P.; investigation, A.P.; resources, D.S.; data duration, A.P.; writing—original draft preparation, A.P.; writing—review and editing, D.S.; visualization, D.S.; supervision, D.S.; project administration, D.S.; funding acquisition, D.S. All authors have read and agreed to the published version of the manuscript.

Funding

This work was financially supported by the 2023 announced competition of fundamental and applied research conducted by scientific teams of the Moscow State Research University of Civil Engineering. Experimental tests were carried out using research equipment of the Head Regional Shared Research Facilities of the Moscow State Research University of Civil Engineering.

Institutional Review Board Statement

Not applicable.

Informed Consent Statement

Not applicable.

Data Availability Statement

The data are available in publications.

Acknowledgments

The authors would like to thank Natalya Motovilova for assistance in conducting chemical analysis.

Conflicts of Interest

The authors declare no conflict of interest.

References

  1. Suratt, W.B.; Andrews, D.R.; Pujals, V.J.; Richards, S. Design considerations for major membrane treatment facility for groundwater. Desalination 2000, 131, 37–46. [Google Scholar] [CrossRef]
  2. Spitsov, D.; Aung, H.Z.; Pervov, A. The Selection of Efficient Antiscalant for RO Facility, Control of Its Quality and Evaluation of the Economical Efficiency of Its Application. Membranes 2023, 13, 85. [Google Scholar] [CrossRef] [PubMed]
  3. Watson, B.; Hornburg, C. Low-energy membrane nanofiltration for removal of color, organics and hardness from drinking water supplies. Desalination 1989, 72, 11–22. [Google Scholar] [CrossRef]
  4. Lopes, C.N.; Petrus, J.C.C.; Riella, H.G. Color and COD retention by nanofiltration membranes. Desalination 2005, 172, 77–83. [Google Scholar] [CrossRef]
  5. Al-Qadami, E.H.H.; Ahsan, A.; Mustafa, Z.; Abdurrasheed, A.S.; Yusof, K.W.; Shah, S.M.H. Nanofiltration membrane technology and its applications in surface water treatment: A review. J. Desalin. Water Purif. 2020, 18, 3–9. Available online: http://ababilpub.com/download/jdwp18-2/ (accessed on 31 March 2020).
  6. Tian, J.; Zhao, X.; Gao, S.; Wang, X.; Zhang, R. Progress in Research and Application of Nanofiltration (NF) Technology for Brackish Water Treatment. Membranes 2021, 11, 662. [Google Scholar] [CrossRef]
  7. Guo, H.; Li, X.; Yang, W.; Yao, Z.; Mei, Y.; Peng, L.E.; Yang, Z.; Shao, S.; Tang, C.Y. Nanofiltration for drinking water treatment: A review. Front. Chem. Sci. Eng. 2021, 16, 681–698. [Google Scholar] [CrossRef]
  8. Li, S.; Wang, X.; Guo, Y.; Hu, J.; Lin, S.; Tu, Y.; Chen, L.; Ni, Y.; Huang, L. Recent advances on cellulose-based nanofiltration membranes and their applications in drinking water purification: A review. J. Clean. Prod. 2021, 333, 130171. [Google Scholar] [CrossRef]
  9. Jamaly, S.; Darwish, N.; Ahmed, I.; Hasan, S. A short review on reverse osmosis pretreatment technologies. Desalination 2014, 354, 30–38. [Google Scholar] [CrossRef]
  10. Goh, P.; Lau, W.; Othman, M.; Ismail, A. Membrane fouling in desalination and its mitigation strategies. Desalination 2018, 425, 130–155. [Google Scholar] [CrossRef]
  11. Jiang, S.-X.; Li, Y.-N.; Ladewig, B.P. A review of reverse osmosis membrane fouling and control strategies. Sci. Total Environ. 2017, 595, 567–583. [Google Scholar] [CrossRef] [PubMed]
  12. Mohammad, A.; Hilal, N.; Al-Zoubi, H.; Darwish, N. Prediction of permeate fluxes and rejections of highly concentrated salts in nanofiltration membranes. J. Membr. Sci. 2007, 289, 40–50. [Google Scholar] [CrossRef]
  13. Pervov, A.G. Removal of calcium carbonate from reverse osmosis plant concentrates containing inhibitory substances. Membr. Technol. 2017, 3, 192–205. [Google Scholar]
  14. Xu, W.; Liu, D.; He, L.; Zhao, Z. A Comprehensive Membrane Process for Preparing Lithium Carbonate from High Mg/Li Brine. Membranes 2020, 10, 371. [Google Scholar] [CrossRef] [PubMed]
  15. Li, X.; Mo, Y.; Qing, W.; Shao, S.; Tang, C.Y.; Li, J. Membrane-based technologies for lithium recovery from water lithium resources: A review. J. Membr. Sci. 2019, 591, 117317. [Google Scholar] [CrossRef]
  16. Hedayatipour, M.; Jaafarzadeh, N.; Ahmadmoazzam, M. Removal optimization of heavy metals from effluent of sludge dewatering process in oil and gas well drilling by nanofiltration. J. Environ. Manag. 2017, 203, 151–156. [Google Scholar] [CrossRef]
  17. Ahmed, S.F.; Mehejabin, F.; Momtahin, A.; Tasannum, N.; Faria, N.T.; Mofijur, M.; Hoang, A.T.; Vo, D.-V.N.; Mahlia, T. Strategies to improve membrane performance in wastewater treatment. Chemosphere 2022, 306, 135527. [Google Scholar] [CrossRef]
  18. Voutckov, N. Overview of seawater concentrate disposal alternatives. Desalination 2011, 273, 205–219. [Google Scholar] [CrossRef]
  19. Al-Ghamdi, A.A. Recycling of Reverse Osmosis (RO) Reject Streams in Brackish Water Desalination Plants Using Fixed Bed Column Softener. Energy Procedia 2017, 107, 205–211. [Google Scholar] [CrossRef]
  20. Najid, N.; Fellaou, S.; Kouzbour, S.; Gourich, B.; Ruiz-García, A. Energy and environmental issues of seawater reverse osmosis desalination considering boron rejection: A comprehensive review and a case study of exergy analysis. Process. Saf. Environ. Prot. 2021, 156, 373–390. [Google Scholar] [CrossRef]
  21. Koyuncu, I.; Yalcin, F.; Ozturk, I. Color removal of high strength paper and fermentation industry effluents with membrane technology. Water Sci. Technol. 1999, 40, 241–248. [Google Scholar] [CrossRef]
  22. Collivignarelli, M.C.; Abbà, A.; Miino, M.C.; Damiani, S. Treatments for color removal from wastewater: State of the art. J. Environ. Manag. 2019, 236, 727–745. [Google Scholar] [CrossRef] [PubMed]
  23. Zheng, Y.; Yu, S.; Shuai, S.; Zhou, Q.; Cheng, Q.; Liu, M.; Gao, C. Color removal and COD reduction of biologically treated textile effluent through submerged filtration using hollow fiber nanofiltration membrane. Desalination 2013, 314, 89–95. [Google Scholar] [CrossRef]
  24. Jafarinejad, S.; Esfahani, M.R. A Review on the Nanofiltration Process for Treating Wastewaters from the Petroleum Industry. Separations 2021, 8, 206. [Google Scholar] [CrossRef]
  25. Turek, M.; Mitko, K.; Piotrowski, K.; Dydo, P.; Laskowska, E.; Jakóbik-Kolon, A. Prospects for high water recovery membrane desalination. Desalination 2017, 401, 180–189. [Google Scholar] [CrossRef]
  26. Bunani, S.; ErenYörükoğlu Sert, G.; Yüksel, Ü.; MithatYüksel Kabay, N. Application of nanofiltration for reuse of municipal wastewater and quality analysis of product water. Desalination 2013, 315, 33–36. [Google Scholar] [CrossRef]
  27. Pervov, A.G.; Shirkova, T.N.; Tikhonov, V.A. Design of reverse osmosis and nanofiltration membrane facilities to treat landfill leachates and increase recoveries. Membr. Membr. Technol. 2020, 2, 296–309. [Google Scholar] [CrossRef]
Figure 1. Dependencies of rejection values of calcium, chloride, and lithium ions by different membranes on the initial volume reduction coefficient K value: 1—BLN membranes (low pressure reverse osmosis membranes); 2—90 NE membranes (nanofiltration membranes, total salt rejection is 90 %); 3—70 NE membranes (nanofiltration membranes, total salt rejection is 70%); 4—BE membranes (medium pressure reverse osmosis membranes).
Water 15 02970 g001
Figure 2. Flow diagrams to produce drinking water from the groundwater intake and techniques to reduce concentrate flow rate: (a) conventional approach using reverse osmosis membrane with high rejection; (b) application of reverse osmosis membranes to produce quality drinking water (on the first stage) and reduce concentrate flow using nanofiltration membrane (on the second stage); (c) production of quality drinking water using double-stage low-selection membranes (first and second stages) and reduction of concentrate flow using nanofiltration membrane (on the third stage); (d) improvement in the product water quality (increase in hardness and TDS) using developed ion separation techniques.
Water 15 02970 g002aWater 15 02970 g002b
Figure 3. Laboratory test unit flow diagram: 1—source water tank; 2—pump; 3—membrane element in the pressure vessel; 4—filtrate tank; 5—heat exchanger; 6—manometer; 7–9—flow meters; 10—bypass valve; 11—valve for adjusting the flow of source water; 12—valve for adjusting the working pressure and concentrate flow; 13—valve for adjusting the flow of cooling water; 14, 15—samplers.
Water 15 02970 g003
Figure 4. Dependencies of Calcium (a), Lithium (b) and Chloride (c) ion concentration values on K in concentrate of 90 NE and 70 NE nanofiltration membranes in the different stages of the water flow diagram (Figure 2d): 1—90 NE membranes in the first stage (producing drinking water); 2—70 NE membranes in the third stage used for concentrate flow reduction; 3—70 NE membranes in the second stage (for drinking water quality improvement and lithium reduction); 4, 5—70 NE membranes on the fourth stage. The red line separates processes of drinking water production and concentrate treatment at K = 5.
Water 15 02970 g004
Figure 5. Dependencies of Calcium (a), Lithium (b) and Chloride (c) ion concentration values on K in permeate of 90 NE and 70 NE nanofiltration membranes in different stages of the water flow diagram (Figure 2d): 1—90 NE membranes in the first stage; 2—70 NE membranes in the third stage; 3—70 NE membranes in the second stage); 4, 5—70 NE membranes on the fourth stage. The red line separates processes of drinking water production and concentrate treatment at K = 5.
Water 15 02970 g005aWater 15 02970 g005b
Figure 6. Dependencies of Calcium (a), Lithium (b) and Chloride (c) ion concentration values on K in permeate of 90 NE and 70 NE membranes on the different stages of the water flow diagram (Figure 2d): 1—in the first stage; 2—in the second stage; 3—in the fourth stage (after treatment of the mixture of the third-stage concentrate and second-stage permeate); 4, 5—70 NE membranes on the fourth stage. The red line separates processes of drinking water production and concentrate treatment at K = 5.
Water 15 02970 g006
Figure 7. Results of membrane performance observations during the test runs: (a) dependencies of specific product flow rate on K values; (b) dependencies of calcium carbonate scaling rates on K at different stages of membrane modules operation: 1—70 NE membranes, the first stage; 2—70 NE membranes, the second stage; 3—70 NE membranes, the third stage, with antiscalant addition; 4—90 NE membranes, the fourth stage, with antiscalant addition; 5—70NE membranes, the fifth stage, with antiscalant addition; 6—reverse osmosis BLN membranes, first stage, with antiscalant addition; 7—90NE membranes, fourth stage, without antiscalant addition.
Water 15 02970 g007
Table 1. Results of groundwater treatment in Yakutia (Russia) with different membranes.
NoCharacteristicsConcentration in Feed Well Water, ppmConcentration Values in Permeate
Membrane Type/K Value
BE/3BLN/490 NE/470 NE/5
1Ca2+700.230.54.610.8
2HCO33665.49.526.58.5
3SO42−340.51.22.35.4
4Cl560.61.26.012.1
5Li+0.480.0020.030.070.16
6F1.60.0150.030.140.53
7TDS52710.020.352.0164.0
8pH7.55.76.06.77.0
Table 2. Main operational characteristics of the 10 m3/h membrane facility and comparison of economical and technical parameters of different approaches to provide quality drinking water.
No.ParametersScheme 1
(Figure 2a)
Scheme 2
(Figure 2b)
Scheme 3
(Figure 2c)
Scheme 4
(Figure 2d)
1Number of membrane elements, membrane type/annual membrane replacement costs, (8040 type)/USD18 (BE)/180020 (BE, 70 NE)/200017 (70 NE)/170023 (70 NE)/2300
2Annual antiscalant consumption/annual antiscalant costs, kilograms/USD400/4000400/400080/80080/800
3Annual cleaning agents consumption/cleaning costs, kilograms/USD120/120050/50050/50050/500
4Total power of the pumps, KW10101112.5
5Total energy consumption (annual)/annual power costs: KW.H/USD70,000/350070,000/350077,000/385087,500/4375
6Concentrate discharge/discharge costs, m3/h/USD2.5/35000.25/3500.25/3500.25/350
7Total14,00013,50072008325
Disclaimer/Publisher’s Note: The statements, opinions and data contained in all publications are solely those of the individual author(s) and contributor(s) and not of MDPI and/or the editor(s). MDPI and/or the editor(s) disclaim responsibility for any injury to people or property resulting from any ideas, methods, instructions or products referred to in the content.

